Cities with the Highest Percentage of Households Without a Vehicle in Massachusetts
RELATED REPORTS & OPTIONS
Households without a Cars
Massachusetts
Compare Cities
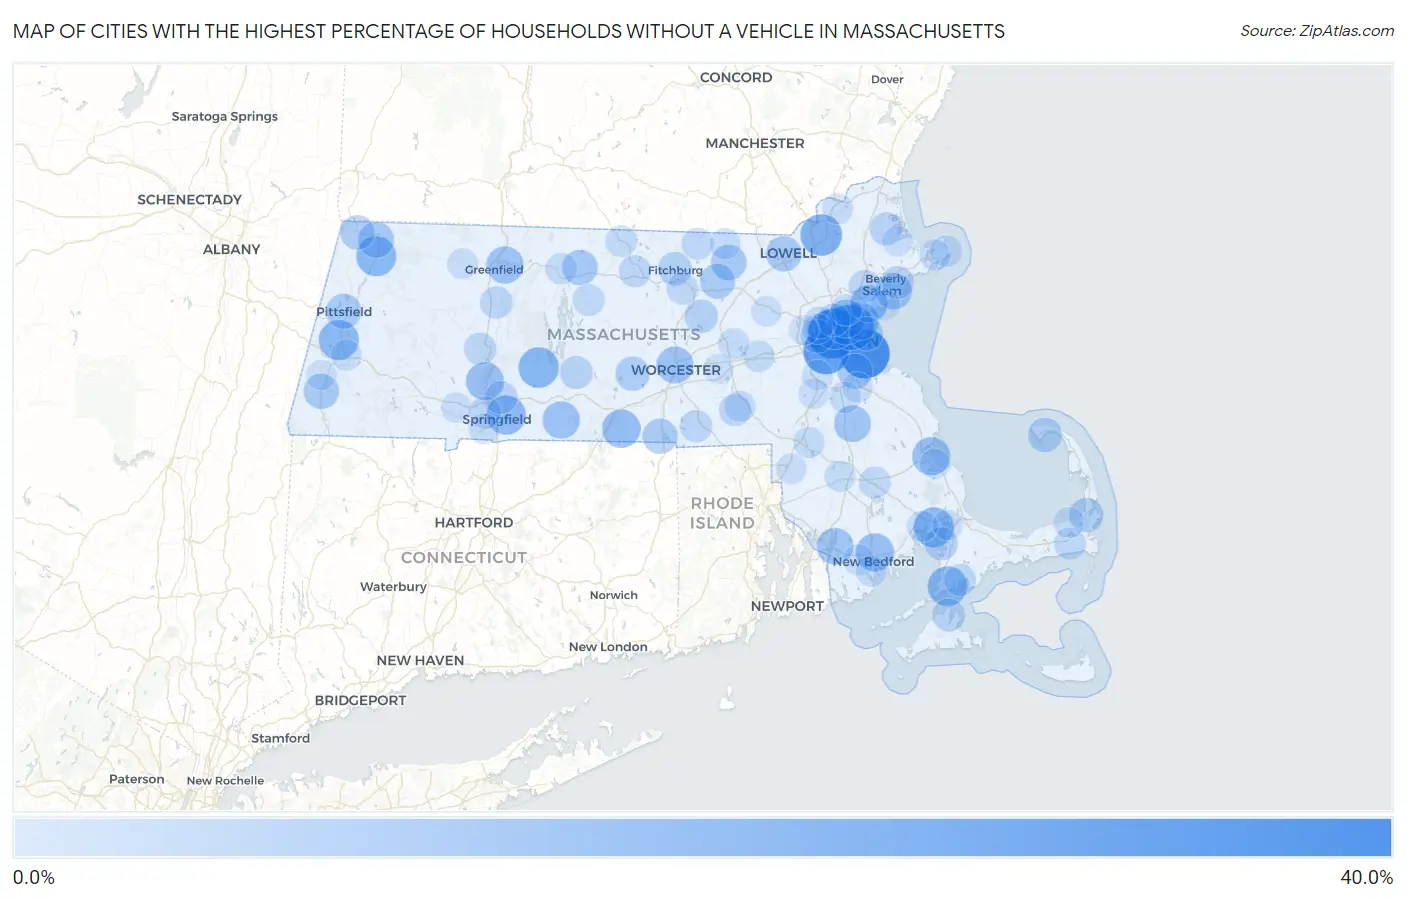
Map of Cities with the Highest Percentage of Households Without a Vehicle in Massachusetts
0.0%
40.0%
Cities with the Highest Percentage of Households Without a Vehicle in Massachusetts
| City | Housholds Without a Car | vs State | vs National | |
| 1. | Boston | 33.7% | 11.9%(+21.8)#1 | 8.3%(+25.4)#467 |
| 2. | Cambridge | 33.5% | 11.9%(+21.6)#2 | 8.3%(+25.2)#474 |
| 3. | Brookline | 28.7% | 11.9%(+16.8)#3 | 8.3%(+20.4)#647 |
| 4. | Chelsea | 28.3% | 11.9%(+16.4)#4 | 8.3%(+20.0)#663 |
| 5. | Lawrence | 22.8% | 11.9%(+10.9)#5 | 8.3%(+14.5)#1,022 |
| 6. | Somerville | 22.0% | 11.9%(+10.1)#6 | 8.3%(+13.7)#1,115 |
| 7. | Belchertown | 21.2% | 11.9%(+9.30)#7 | 8.3%(+12.9)#1,225 |
| 8. | Onset | 20.8% | 11.9%(+8.90)#8 | 8.3%(+12.5)#1,284 |
| 9. | Adams | 20.6% | 11.9%(+8.70)#9 | 8.3%(+12.3)#1,318 |
| 10. | Lenox | 20.6% | 11.9%(+8.70)#10 | 8.3%(+12.3)#1,321 |
| 11. | Falmouth | 20.2% | 11.9%(+8.30)#11 | 8.3%(+11.9)#1,369 |
| 12. | Everett | 19.9% | 11.9%(+8.00)#12 | 8.3%(+11.6)#1,422 |
| 13. | Springfield | 19.6% | 11.9%(+7.70)#13 | 8.3%(+11.3)#1,467 |
| 14. | Southbridge Town | 18.3% | 11.9%(+6.40)#14 | 8.3%(+10.00)#1,708 |
| 15. | New Bedford | 18.0% | 11.9%(+6.10)#15 | 8.3%(+9.70)#1,763 |
| 16. | North Plymouth | 18.0% | 11.9%(+6.10)#16 | 8.3%(+9.70)#1,770 |
| 17. | Holyoke | 17.9% | 11.9%(+6.00)#17 | 8.3%(+9.60)#1,787 |
| 18. | Revere | 17.7% | 11.9%(+5.80)#18 | 8.3%(+9.40)#1,842 |
| 19. | Malden | 17.6% | 11.9%(+5.70)#19 | 8.3%(+9.30)#1,860 |
| 20. | Lynn | 17.1% | 11.9%(+5.20)#20 | 8.3%(+8.80)#1,992 |
| 21. | Turners Falls | 17.0% | 11.9%(+5.10)#21 | 8.3%(+8.70)#2,018 |
| 22. | Monson Center | 17.0% | 11.9%(+5.10)#22 | 8.3%(+8.70)#2,023 |
| 23. | Worcester | 16.5% | 11.9%(+4.60)#23 | 8.3%(+8.20)#2,150 |
| 24. | Brockton | 16.3% | 11.9%(+4.40)#24 | 8.3%(+8.00)#2,213 |
| 25. | Fall River | 16.1% | 11.9%(+4.20)#25 | 8.3%(+7.80)#2,279 |
| 26. | Salem | 15.8% | 11.9%(+3.90)#26 | 8.3%(+7.50)#2,371 |
| 27. | North Adams | 15.0% | 11.9%(+3.10)#27 | 8.3%(+6.70)#2,674 |
| 28. | Groton | 14.7% | 11.9%(+2.80)#28 | 8.3%(+6.40)#2,802 |
| 29. | Lowell | 14.5% | 11.9%(+2.60)#29 | 8.3%(+6.20)#2,862 |
| 30. | Athol | 14.5% | 11.9%(+2.60)#30 | 8.3%(+6.20)#2,869 |
| 31. | Great Barrington | 14.3% | 11.9%(+2.40)#31 | 8.3%(+6.00)#2,982 |
| 32. | Quincy | 14.2% | 11.9%(+2.30)#32 | 8.3%(+5.90)#3,006 |
| 33. | Pittsfield | 14.1% | 11.9%(+2.20)#33 | 8.3%(+5.80)#3,046 |
| 34. | Devens | 14.0% | 11.9%(+2.10)#34 | 8.3%(+5.70)#3,112 |
| 35. | Amherst | 13.9% | 11.9%(+2.00)#35 | 8.3%(+5.60)#3,129 |
| 36. | Webster | 13.9% | 11.9%(+2.00)#36 | 8.3%(+5.60)#3,130 |
| 37. | Williamstown | 13.2% | 11.9%(+1.30)#37 | 8.3%(+4.90)#3,454 |
| 38. | Spencer | 13.0% | 11.9%(+1.10)#38 | 8.3%(+4.70)#3,541 |
| 39. | Provincetown | 13.0% | 11.9%(+1.10)#39 | 8.3%(+4.70)#3,547 |
| 40. | Orleans | 13.0% | 11.9%(+1.10)#40 | 8.3%(+4.70)#3,554 |
| 41. | Greenfield | 12.4% | 11.9%(+0.500)#41 | 8.3%(+4.10)#3,871 |
| 42. | Winthrop Town | 12.3% | 11.9%(+0.400)#42 | 8.3%(+4.00)#3,927 |
| 43. | Fitchburg | 12.2% | 11.9%(+0.300)#43 | 8.3%(+3.90)#3,985 |
| 44. | South Lancaster | 12.0% | 11.9%(+0.100)#44 | 8.3%(+3.70)#4,134 |
| 45. | Pocasset | 11.5% | 11.9%(-0.400)#45 | 8.3%(+3.20)#4,471 |
| 46. | Ware | 11.4% | 11.9%(-0.500)#46 | 8.3%(+3.10)#4,537 |
| 47. | Rowley | 11.4% | 11.9%(-0.500)#47 | 8.3%(+3.10)#4,546 |
| 48. | Watertown Town | 11.3% | 11.9%(-0.600)#48 | 8.3%(+3.00)#4,577 |
| 49. | Vineyard Haven | 11.2% | 11.9%(-0.700)#49 | 8.3%(+2.90)#4,660 |
| 50. | Beverly | 11.1% | 11.9%(-0.800)#50 | 8.3%(+2.80)#4,697 |
| 51. | Medford | 11.0% | 11.9%(-0.900)#51 | 8.3%(+2.70)#4,785 |
| 52. | Chicopee | 10.9% | 11.9%(-1.00)#52 | 8.3%(+2.60)#4,874 |
| 53. | Peabody | 10.7% | 11.9%(-1.20)#53 | 8.3%(+2.40)#5,039 |
| 54. | South Deerfield | 10.5% | 11.9%(-1.40)#54 | 8.3%(+2.20)#5,242 |
| 55. | Northampton | 10.3% | 11.9%(-1.60)#55 | 8.3%(+2.00)#5,369 |
| 56. | Hopedale | 10.3% | 11.9%(-1.60)#56 | 8.3%(+2.00)#5,390 |
| 57. | East Douglas | 10.2% | 11.9%(-1.70)#57 | 8.3%(+1.90)#5,503 |
| 58. | West Springfield Town | 10.1% | 11.9%(-1.80)#58 | 8.3%(+1.80)#5,563 |
| 59. | Gardner | 10.1% | 11.9%(-1.80)#59 | 8.3%(+1.80)#5,567 |
| 60. | East Falmouth | 10.0% | 11.9%(-1.90)#60 | 8.3%(+1.70)#5,658 |
| 61. | Harwich Center | 9.9% | 11.9%(-2.00)#61 | 8.3%(+1.60)#5,779 |
| 62. | Arlington | 9.8% | 11.9%(-2.10)#62 | 8.3%(+1.50)#5,813 |
| 63. | Leominster | 9.8% | 11.9%(-2.10)#63 | 8.3%(+1.50)#5,815 |
| 64. | Middleborough Center | 9.7% | 11.9%(-2.20)#64 | 8.3%(+1.40)#5,919 |
| 65. | Townsend | 9.7% | 11.9%(-2.20)#65 | 8.3%(+1.40)#5,961 |
| 66. | Petersham | 9.7% | 11.9%(-2.20)#66 | 8.3%(+1.40)#5,989 |
| 67. | Winchendon | 9.4% | 11.9%(-2.50)#67 | 8.3%(+1.10)#6,226 |
| 68. | Orange | 9.3% | 11.9%(-2.60)#68 | 8.3%(+1.00)#6,339 |
| 69. | Mansfield Center | 9.2% | 11.9%(-2.70)#69 | 8.3%(+0.900)#6,437 |
| 70. | Framingham | 9.1% | 11.9%(-2.80)#70 | 8.3%(+0.800)#6,516 |
| 71. | Rockport | 9.1% | 11.9%(-2.80)#71 | 8.3%(+0.800)#6,540 |
| 72. | Marlborough | 9.0% | 11.9%(-2.90)#72 | 8.3%(+0.700)#6,636 |
| 73. | Melrose | 9.0% | 11.9%(-2.90)#73 | 8.3%(+0.700)#6,640 |
| 74. | Milford | 9.0% | 11.9%(-2.90)#74 | 8.3%(+0.700)#6,642 |
| 75. | Randolph Town | 8.9% | 11.9%(-3.00)#75 | 8.3%(+0.600)#6,759 |
| 76. | Gloucester | 8.8% | 11.9%(-3.10)#76 | 8.3%(+0.500)#6,878 |
| 77. | Wareham Center | 8.7% | 11.9%(-3.20)#77 | 8.3%(+0.400)#7,038 |
| 78. | Pepperell | 8.7% | 11.9%(-3.20)#78 | 8.3%(+0.400)#7,041 |
| 79. | Taunton | 8.6% | 11.9%(-3.30)#79 | 8.3%(+0.300)#7,098 |
| 80. | Smith Mills | 8.6% | 11.9%(-3.30)#80 | 8.3%(+0.300)#7,137 |
| 81. | Haverhill | 8.5% | 11.9%(-3.40)#81 | 8.3%(+0.200)#7,219 |
| 82. | Bliss Corner | 8.5% | 11.9%(-3.40)#82 | 8.3%(+0.200)#7,246 |
| 83. | Brewster | 8.5% | 11.9%(-3.40)#83 | 8.3%(+0.200)#7,277 |
| 84. | Lee | 8.5% | 11.9%(-3.40)#84 | 8.3%(+0.200)#7,282 |
| 85. | Shelburne Falls | 8.4% | 11.9%(-3.50)#85 | 8.3%(+0.100)#7,399 |
| 86. | Agawam Town | 8.3% | 11.9%(-3.60)#86 | 8.3%(=0.000)#7,456 |
| 87. | Westfield | 8.1% | 11.9%(-3.80)#87 | 8.3%(-0.200)#7,714 |
| 88. | Norwood | 8.1% | 11.9%(-3.80)#88 | 8.3%(-0.200)#7,718 |
| 89. | Attleboro | 8.0% | 11.9%(-3.90)#89 | 8.3%(-0.300)#7,846 |
| 90. | Braintree Town | 8.0% | 11.9%(-3.90)#90 | 8.3%(-0.300)#7,848 |
| 91. | West Concord | 8.0% | 11.9%(-3.90)#91 | 8.3%(-0.300)#7,875 |
| 92. | Belmont | 7.8% | 11.9%(-4.10)#92 | 8.3%(-0.500)#8,107 |
| 93. | Dedham | 7.8% | 11.9%(-4.10)#93 | 8.3%(-0.500)#8,109 |
| 94. | Ipswich | 7.8% | 11.9%(-4.10)#94 | 8.3%(-0.500)#8,143 |
| 95. | Buzzards Bay | 7.8% | 11.9%(-4.10)#95 | 8.3%(-0.500)#8,155 |
| 96. | Waltham | 7.6% | 11.9%(-4.30)#96 | 8.3%(-0.700)#8,382 |
| 97. | Plymouth | 7.6% | 11.9%(-4.30)#97 | 8.3%(-0.700)#8,417 |
| 98. | Swampscott | 7.5% | 11.9%(-4.40)#98 | 8.3%(-0.800)#8,529 |
| 99. | Westborough | 7.5% | 11.9%(-4.40)#99 | 8.3%(-0.800)#8,552 |
| 100. | Housatonic | 7.5% | 11.9%(-4.40)#100 | 8.3%(-0.800)#8,599 |
Common Questions
What are the Top 10 Cities with the Highest Percentage of Households Without a Vehicle in Massachusetts?
Top 10 Cities with the Highest Percentage of Households Without a Vehicle in Massachusetts are:
#1
33.7%
#2
33.5%
#3
28.7%
#4
28.3%
#5
22.8%
#6
22.0%
#7
21.2%
#8
20.8%
#9
20.6%
#10
20.6%
What city has the Highest Percentage of Households Without a Vehicle in Massachusetts?
Boston has the Highest Percentage of Households Without a Vehicle in Massachusetts with 33.7%.
What is the Percentage of Households Without a Vehicle in the State of Massachusetts?
Percentage of Households Without a Vehicle in Massachusetts is 11.9%.
What is the Percentage of Households Without a Vehicle in the United States?
Percentage of Households Without a Vehicle in the United States is 8.3%.