Cities with the Highest Percentage of Central American Population in Virginia
RELATED REPORTS & OPTIONS
Central American
Virginia
Compare Cities
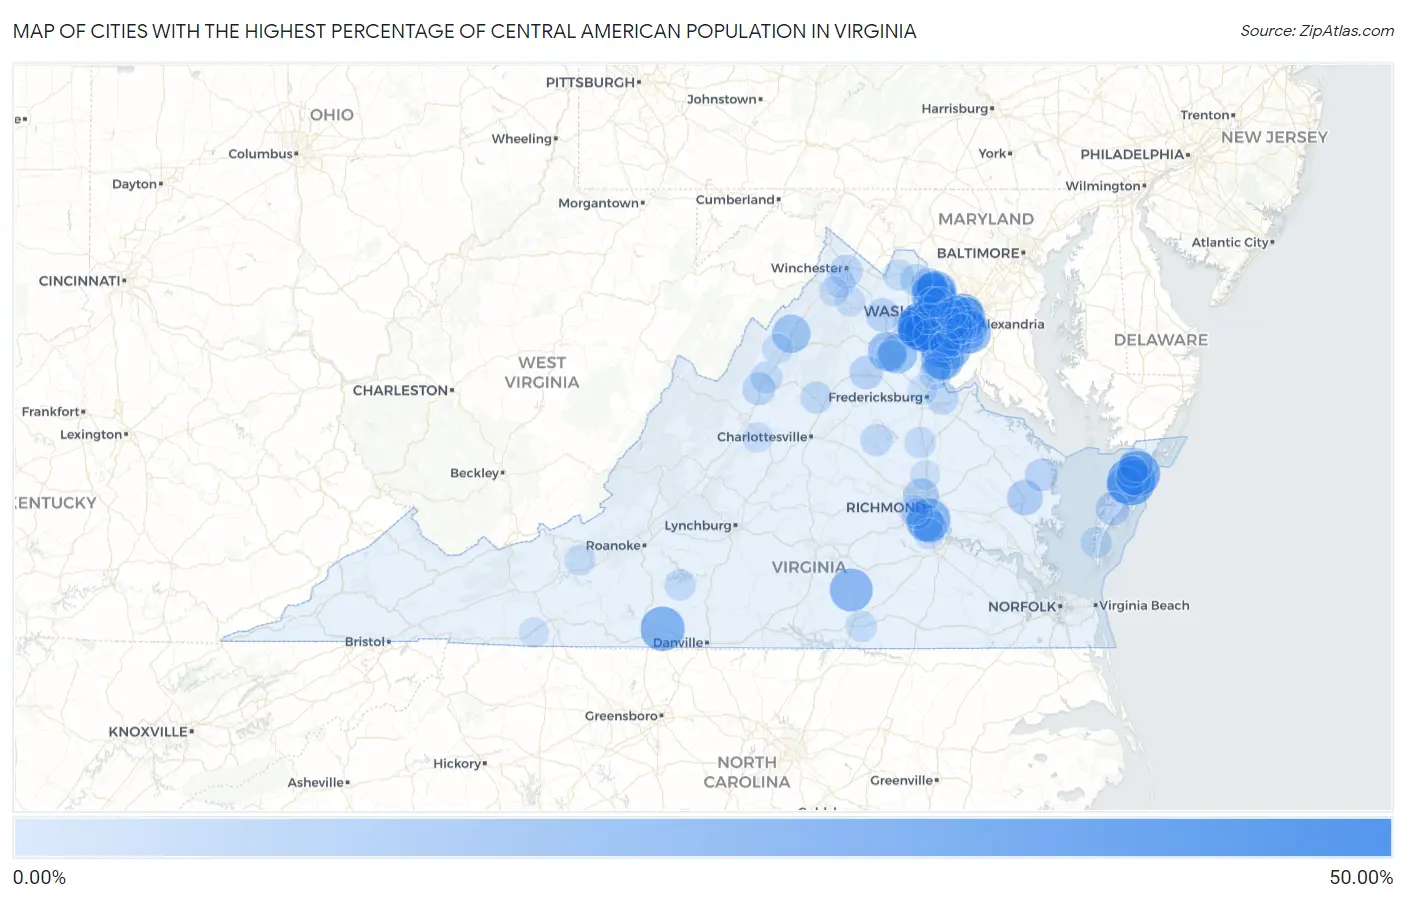
Map of Cities with the Highest Percentage of Central American Population in Virginia
0.00%
50.00%
Cities with the Highest Percentage of Central American Population in Virginia
| City | Central American | vs State | vs National | |
| 1. | Willis Wharf | 48.89% | 3.59%(+45.3)#1 | 1.81%(+47.1)#9 |
| 2. | Yorkshire | 37.61% | 3.59%(+34.0)#2 | 1.81%(+35.8)#29 |
| 3. | Sudley | 37.05% | 3.59%(+33.5)#3 | 1.81%(+35.2)#30 |
| 4. | Hutchison | 35.21% | 3.59%(+31.6)#4 | 1.81%(+33.4)#39 |
| 5. | Accomac | 35.17% | 3.59%(+31.6)#5 | 1.81%(+33.4)#40 |
| 6. | Loch Lomond | 33.73% | 3.59%(+30.1)#6 | 1.81%(+31.9)#45 |
| 7. | Woodlawn Cdp Fairfax County | 32.90% | 3.59%(+29.3)#7 | 1.81%(+31.1)#49 |
| 8. | Manassas Park | 30.69% | 3.59%(+27.1)#8 | 1.81%(+28.9)#57 |
| 9. | Metompkin | 30.33% | 3.59%(+26.7)#9 | 1.81%(+28.5)#61 |
| 10. | Bull Run | 30.29% | 3.59%(+26.7)#10 | 1.81%(+28.5)#63 |
| 11. | Sterling | 29.21% | 3.59%(+25.6)#11 | 1.81%(+27.4)#68 |
| 12. | Laurel Park | 28.99% | 3.59%(+25.4)#12 | 1.81%(+27.2)#69 |
| 13. | Bensley | 26.69% | 3.59%(+23.1)#13 | 1.81%(+24.9)#80 |
| 14. | Seven Corners | 26.36% | 3.59%(+22.8)#14 | 1.81%(+24.6)#81 |
| 15. | Kenbridge | 26.28% | 3.59%(+22.7)#15 | 1.81%(+24.5)#82 |
| 16. | Dumfries | 26.00% | 3.59%(+22.4)#16 | 1.81%(+24.2)#84 |
| 17. | Herndon | 25.91% | 3.59%(+22.3)#17 | 1.81%(+24.1)#85 |
| 18. | Hybla Valley | 24.77% | 3.59%(+21.2)#18 | 1.81%(+23.0)#99 |
| 19. | Woodbridge | 24.01% | 3.59%(+20.4)#19 | 1.81%(+22.2)#105 |
| 20. | Bailey S Crossroads | 22.80% | 3.59%(+19.2)#20 | 1.81%(+21.0)#113 |
| 21. | Sugarland Run | 22.30% | 3.59%(+18.7)#21 | 1.81%(+20.5)#116 |
| 22. | Dale City | 21.11% | 3.59%(+17.5)#22 | 1.81%(+19.3)#127 |
| 23. | Manassas | 20.15% | 3.59%(+16.6)#23 | 1.81%(+18.3)#138 |
| 24. | Opal | 19.84% | 3.59%(+16.3)#24 | 1.81%(+18.0)#144 |
| 25. | Midland | 19.76% | 3.59%(+16.2)#25 | 1.81%(+17.9)#145 |
| 26. | Mount Jackson | 18.49% | 3.59%(+14.9)#26 | 1.81%(+16.7)#178 |
| 27. | West Falls Church | 17.95% | 3.59%(+14.4)#27 | 1.81%(+16.1)#184 |
| 28. | Annandale | 17.76% | 3.59%(+14.2)#28 | 1.81%(+15.9)#186 |
| 29. | Groveton | 17.42% | 3.59%(+13.8)#29 | 1.81%(+15.6)#190 |
| 30. | Meadowbrook | 16.93% | 3.59%(+13.3)#30 | 1.81%(+15.1)#197 |
| 31. | Onley | 15.85% | 3.59%(+12.3)#31 | 1.81%(+14.0)#218 |
| 32. | Dulles Town Center | 14.94% | 3.59%(+11.3)#32 | 1.81%(+13.1)#246 |
| 33. | Triangle | 14.54% | 3.59%(+11.0)#33 | 1.81%(+12.7)#258 |
| 34. | University Center | 14.14% | 3.59%(+10.5)#34 | 1.81%(+12.3)#268 |
| 35. | Dumbarton | 14.00% | 3.59%(+10.4)#35 | 1.81%(+12.2)#272 |
| 36. | Saluda | 13.85% | 3.59%(+10.3)#36 | 1.81%(+12.0)#278 |
| 37. | Pastoria | 13.53% | 3.59%(+9.95)#37 | 1.81%(+11.7)#286 |
| 38. | Bloxom | 11.06% | 3.59%(+7.47)#38 | 1.81%(+9.24)#385 |
| 39. | Bellwood | 10.81% | 3.59%(+7.22)#39 | 1.81%(+8.99)#396 |
| 40. | Exmore | 10.67% | 3.59%(+7.08)#40 | 1.81%(+8.85)#404 |
| 41. | Culpeper | 10.56% | 3.59%(+6.98)#41 | 1.81%(+8.75)#406 |
| 42. | Newington | 10.44% | 3.59%(+6.85)#42 | 1.81%(+8.63)#416 |
| 43. | Marshall | 10.19% | 3.59%(+6.60)#43 | 1.81%(+8.37)#428 |
| 44. | Mount Crawford | 9.63% | 3.59%(+6.04)#44 | 1.81%(+7.81)#455 |
| 45. | Winchester | 9.62% | 3.59%(+6.03)#45 | 1.81%(+7.81)#458 |
| 46. | Mount Vernon | 9.09% | 3.59%(+5.50)#46 | 1.81%(+7.28)#498 |
| 47. | Lancaster | 9.09% | 3.59%(+5.50)#47 | 1.81%(+7.28)#499 |
| 48. | Chantilly | 8.98% | 3.59%(+5.39)#48 | 1.81%(+7.17)#506 |
| 49. | Lincolnia | 8.97% | 3.59%(+5.39)#49 | 1.81%(+7.16)#507 |
| 50. | Lorton | 8.72% | 3.59%(+5.13)#50 | 1.81%(+6.91)#523 |
| 51. | Alexandria | 8.43% | 3.59%(+4.84)#51 | 1.81%(+6.62)#548 |
| 52. | Countryside | 8.29% | 3.59%(+4.70)#52 | 1.81%(+6.48)#558 |
| 53. | Passapatanzy | 8.10% | 3.59%(+4.51)#53 | 1.81%(+6.29)#579 |
| 54. | Leesburg | 8.07% | 3.59%(+4.48)#54 | 1.81%(+6.26)#581 |
| 55. | Mineral | 7.98% | 3.59%(+4.39)#55 | 1.81%(+6.17)#590 |
| 56. | Huntington | 7.98% | 3.59%(+4.39)#56 | 1.81%(+6.17)#591 |
| 57. | Springfield | 7.93% | 3.59%(+4.34)#57 | 1.81%(+6.12)#596 |
| 58. | Aquia Harbour | 7.93% | 3.59%(+4.34)#58 | 1.81%(+6.12)#597 |
| 59. | Stanardsville | 7.93% | 3.59%(+4.34)#59 | 1.81%(+6.11)#599 |
| 60. | Idylwood | 7.93% | 3.59%(+4.34)#60 | 1.81%(+6.11)#600 |
| 61. | Harrisonburg | 7.82% | 3.59%(+4.23)#61 | 1.81%(+6.01)#611 |
| 62. | Bealeton | 7.77% | 3.59%(+4.18)#62 | 1.81%(+5.96)#616 |
| 63. | Occoquan | 7.74% | 3.59%(+4.15)#63 | 1.81%(+5.93)#623 |
| 64. | Lake Ridge | 7.35% | 3.59%(+3.76)#64 | 1.81%(+5.54)#676 |
| 65. | Lake Caroline | 7.09% | 3.59%(+3.50)#65 | 1.81%(+5.28)#705 |
| 66. | Brodnax | 6.85% | 3.59%(+3.26)#66 | 1.81%(+5.04)#744 |
| 67. | North Springfield | 6.77% | 3.59%(+3.18)#67 | 1.81%(+4.95)#759 |
| 68. | Penhook | 6.76% | 3.59%(+3.17)#68 | 1.81%(+4.95)#760 |
| 69. | Cheriton | 6.76% | 3.59%(+3.17)#69 | 1.81%(+4.95)#761 |
| 70. | Newington Forest | 6.74% | 3.59%(+3.16)#70 | 1.81%(+4.93)#764 |
| 71. | Rose Hill Cdp Fairfax County | 6.73% | 3.59%(+3.14)#71 | 1.81%(+4.91)#770 |
| 72. | Manchester | 6.53% | 3.59%(+2.94)#72 | 1.81%(+4.72)#801 |
| 73. | Purcellville | 6.36% | 3.59%(+2.77)#73 | 1.81%(+4.55)#825 |
| 74. | Belview | 6.27% | 3.59%(+2.68)#74 | 1.81%(+4.45)#843 |
| 75. | Kings Park | 6.20% | 3.59%(+2.61)#75 | 1.81%(+4.38)#854 |
| 76. | Parksley | 6.02% | 3.59%(+2.43)#76 | 1.81%(+4.21)#883 |
| 77. | Linton Hall | 6.00% | 3.59%(+2.41)#77 | 1.81%(+4.18)#885 |
| 78. | Arlington | 5.93% | 3.59%(+2.34)#78 | 1.81%(+4.12)#902 |
| 79. | Timberville | 5.87% | 3.59%(+2.28)#79 | 1.81%(+4.05)#917 |
| 80. | Chester | 5.85% | 3.59%(+2.26)#80 | 1.81%(+4.04)#922 |
| 81. | Buckhall | 5.73% | 3.59%(+2.14)#81 | 1.81%(+3.91)#950 |
| 82. | Shenandoah Shores | 5.71% | 3.59%(+2.12)#82 | 1.81%(+3.90)#957 |
| 83. | Centreville | 5.64% | 3.59%(+2.05)#83 | 1.81%(+3.82)#973 |
| 84. | Fairfax | 5.40% | 3.59%(+1.81)#84 | 1.81%(+3.58)#1,032 |
| 85. | Stephens City | 5.36% | 3.59%(+1.77)#85 | 1.81%(+3.55)#1,039 |
| 86. | Mcnair | 5.23% | 3.59%(+1.64)#86 | 1.81%(+3.42)#1,071 |
| 87. | Merrifield | 5.23% | 3.59%(+1.64)#87 | 1.81%(+3.41)#1,072 |
| 88. | Lyndhurst | 5.09% | 3.59%(+1.50)#88 | 1.81%(+3.27)#1,105 |
| 89. | Reston | 5.06% | 3.59%(+1.47)#89 | 1.81%(+3.25)#1,111 |
| 90. | Potomac Mills | 4.95% | 3.59%(+1.36)#90 | 1.81%(+3.13)#1,133 |
| 91. | Gainesville | 4.88% | 3.59%(+1.29)#91 | 1.81%(+3.07)#1,145 |
| 92. | Leesylvania | 4.82% | 3.59%(+1.24)#92 | 1.81%(+3.01)#1,160 |
| 93. | Middletown | 4.75% | 3.59%(+1.16)#93 | 1.81%(+2.94)#1,179 |
| 94. | Boswell S Corner | 4.69% | 3.59%(+1.10)#94 | 1.81%(+2.88)#1,196 |
| 95. | Franconia | 4.66% | 3.59%(+1.07)#95 | 1.81%(+2.85)#1,203 |
| 96. | Galax | 4.65% | 3.59%(+1.06)#96 | 1.81%(+2.84)#1,208 |
| 97. | Bon Air | 4.62% | 3.59%(+1.04)#97 | 1.81%(+2.81)#1,220 |
| 98. | Southern Gateway | 4.59% | 3.59%(+0.997)#98 | 1.81%(+2.77)#1,231 |
| 99. | Mcgaheysville | 4.51% | 3.59%(+0.922)#99 | 1.81%(+2.70)#1,251 |
| 100. | Ashland | 4.49% | 3.59%(+0.901)#100 | 1.81%(+2.68)#1,258 |
Common Questions
What are the Top 10 Cities with the Highest Percentage of Central American Population in Virginia?
Top 10 Cities with the Highest Percentage of Central American Population in Virginia are:
#1
37.61%
#2
37.05%
#3
35.17%
#4
33.73%
#5
30.69%
#6
30.33%
#7
30.29%
#8
29.21%
#9
28.99%
#10
26.69%
What city has the Highest Percentage of Central American Population in Virginia?
Yorkshire has the Highest Percentage of Central American Population in Virginia with 37.61%.
What is the Percentage of Central American Population in the State of Virginia?
Percentage of Central American Population in Virginia is 3.59%.
What is the Percentage of Central American Population in the United States?
Percentage of Central American Population in the United States is 1.81%.