La Puente, CA Map & Demographics
La Puente Map
La Puente Overview
$25,451
PER CAPITA INCOME
$81,870
AVG FAMILY INCOME
$77,702
AVG HOUSEHOLD INCOME
25.0%
WAGE / INCOME GAP [ % ]
75.0¢/ $1
WAGE / INCOME GAP [ $ ]
$11,546
FAMILY INCOME DEFICIT
0.39
INEQUALITY / GINI INDEX
37,835
TOTAL POPULATION
19,431
MALE POPULATION
18,404
FEMALE POPULATION
105.58
MALES / 100 FEMALES
94.71
FEMALES / 100 MALES
36.4
MEDIAN AGE
4.2
AVG FAMILY SIZE
3.9
AVG HOUSEHOLD SIZE
19,196
LABOR FORCE [ PEOPLE ]
63.2%
PERCENT IN LABOR FORCE
6.0%
UNEMPLOYMENT RATE
La Puente Area Codes
Income in La Puente
Income Overview in La Puente
Per Capita Income in La Puente is $25,451, while median incomes of families and households are $81,870 and $77,702 respectively.
| Characteristic | Number | Measure |
| Per Capita Income | 37,835 | $25,451 |
| Median Family Income | 8,321 | $81,870 |
| Mean Family Income | 8,321 | $96,935 |
| Median Household Income | 9,625 | $77,702 |
| Mean Household Income | 9,625 | $95,219 |
| Income Deficit | 8,321 | $11,546 |
| Wage / Income Gap (%) | 37,835 | 25.02% |
| Wage / Income Gap ($) | 37,835 | 74.98¢ per $1 |
| Gini / Inequality Index | 37,835 | 0.39 |
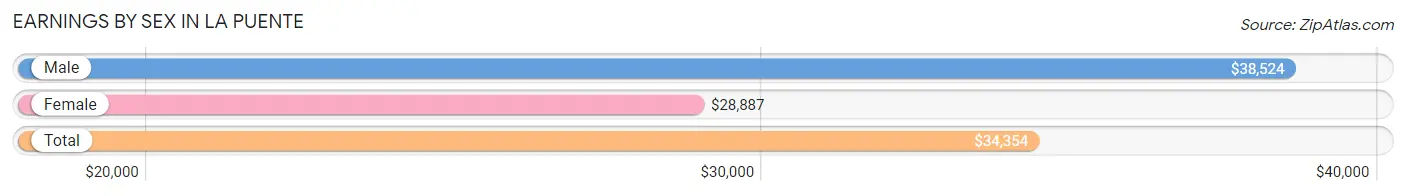
Earnings by Sex in La Puente
Average Earnings in La Puente are $34,354, $38,524 for men and $28,887 for women, a difference of 25.0%.
| Sex | Number | Average Earnings |
| Male | 10,980 (56.9%) | $38,524 |
| Female | 8,320 (43.1%) | $28,887 |
| Total | 19,300 (100.0%) | $34,354 |
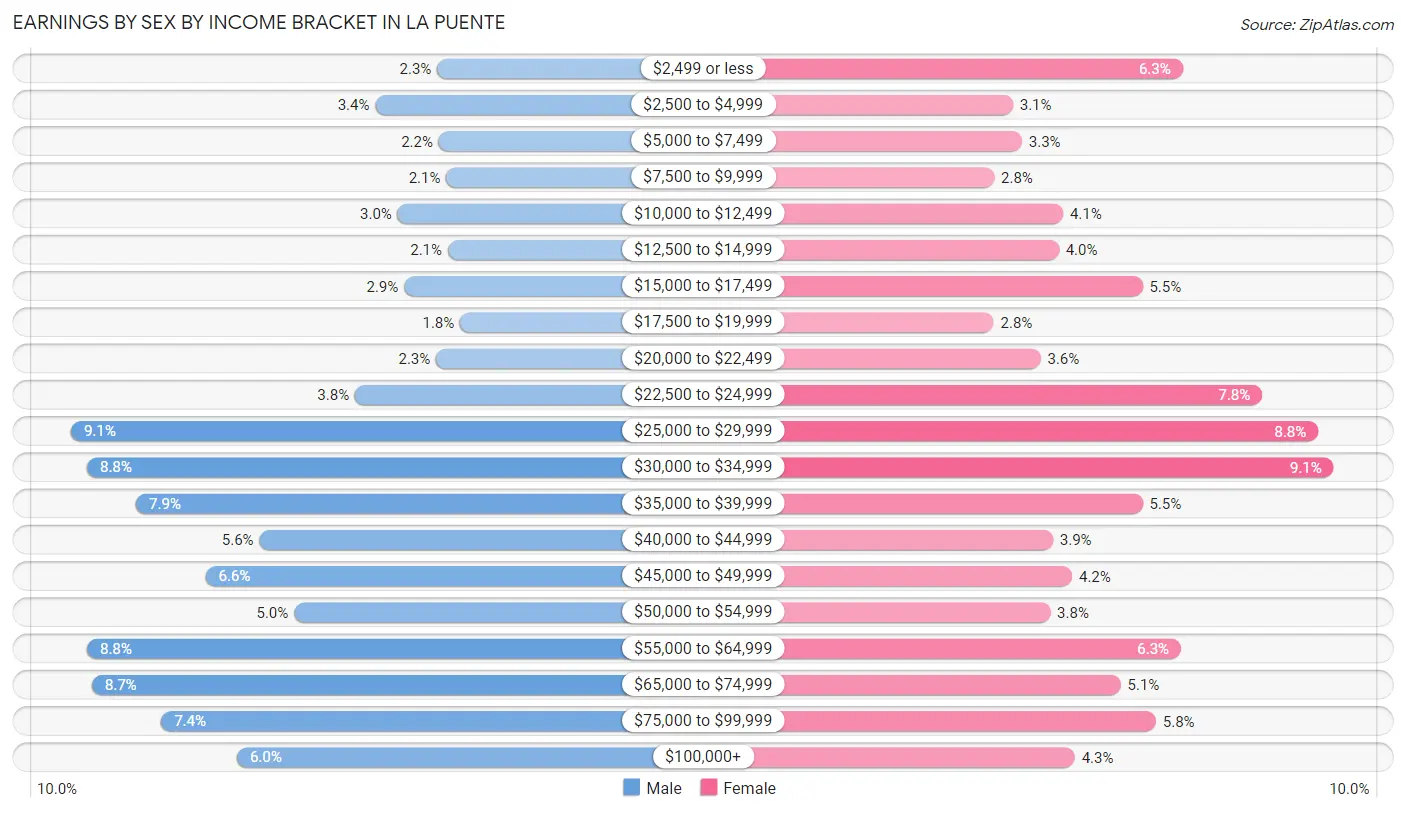
Earnings by Sex by Income Bracket in La Puente
The most common earnings brackets in La Puente are $25,000 to $29,999 for men (1,003 | 9.1%) and $30,000 to $34,999 for women (759 | 9.1%).
| Income | Male | Female |
| $2,499 or less | 249 (2.3%) | 523 (6.3%) |
| $2,500 to $4,999 | 377 (3.4%) | 259 (3.1%) |
| $5,000 to $7,499 | 246 (2.2%) | 273 (3.3%) |
| $7,500 to $9,999 | 231 (2.1%) | 230 (2.8%) |
| $10,000 to $12,499 | 330 (3.0%) | 337 (4.1%) |
| $12,500 to $14,999 | 227 (2.1%) | 330 (4.0%) |
| $15,000 to $17,499 | 317 (2.9%) | 461 (5.5%) |
| $17,500 to $19,999 | 202 (1.8%) | 229 (2.8%) |
| $20,000 to $22,499 | 251 (2.3%) | 302 (3.6%) |
| $22,500 to $24,999 | 418 (3.8%) | 647 (7.8%) |
| $25,000 to $29,999 | 1,003 (9.1%) | 735 (8.8%) |
| $30,000 to $34,999 | 969 (8.8%) | 759 (9.1%) |
| $35,000 to $39,999 | 869 (7.9%) | 461 (5.5%) |
| $40,000 to $44,999 | 615 (5.6%) | 321 (3.9%) |
| $45,000 to $49,999 | 726 (6.6%) | 351 (4.2%) |
| $50,000 to $54,999 | 543 (5.0%) | 317 (3.8%) |
| $55,000 to $64,999 | 969 (8.8%) | 521 (6.3%) |
| $65,000 to $74,999 | 960 (8.7%) | 427 (5.1%) |
| $75,000 to $99,999 | 817 (7.4%) | 482 (5.8%) |
| $100,000+ | 661 (6.0%) | 355 (4.3%) |
| Total | 10,980 (100.0%) | 8,320 (100.0%) |
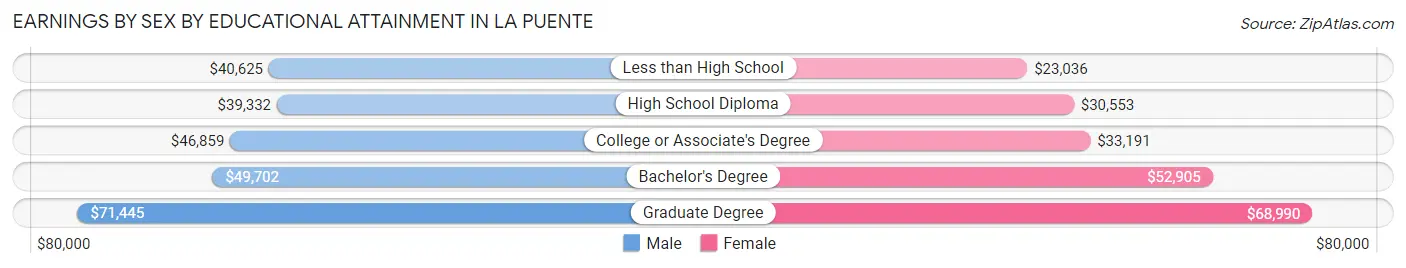
Earnings by Sex by Educational Attainment in La Puente
Average earnings in La Puente are $42,897 for men and $31,406 for women, a difference of 26.8%. Men with an educational attainment of graduate degree enjoy the highest average annual earnings of $71,445, while those with high school diploma education earn the least with $39,332. Women with an educational attainment of graduate degree earn the most with the average annual earnings of $68,990, while those with less than high school education have the smallest earnings of $23,036.
| Educational Attainment | Male Income | Female Income |
| Less than High School | $40,625 | $23,036 |
| High School Diploma | $39,332 | $30,553 |
| College or Associate's Degree | $46,859 | $33,191 |
| Bachelor's Degree | $49,702 | $52,905 |
| Graduate Degree | $71,445 | $68,990 |
| Total | $42,897 | $31,406 |
Family Income in La Puente
Family Income Brackets in La Puente
According to the La Puente family income data, there are 1,747 families falling into the $100,000 to $149,999 income range, which is the most common income bracket and makes up 21.0% of all families. Conversely, the $10,000 to $14,999 income bracket is the least frequent group with only 50 families (0.6%) belonging to this category.
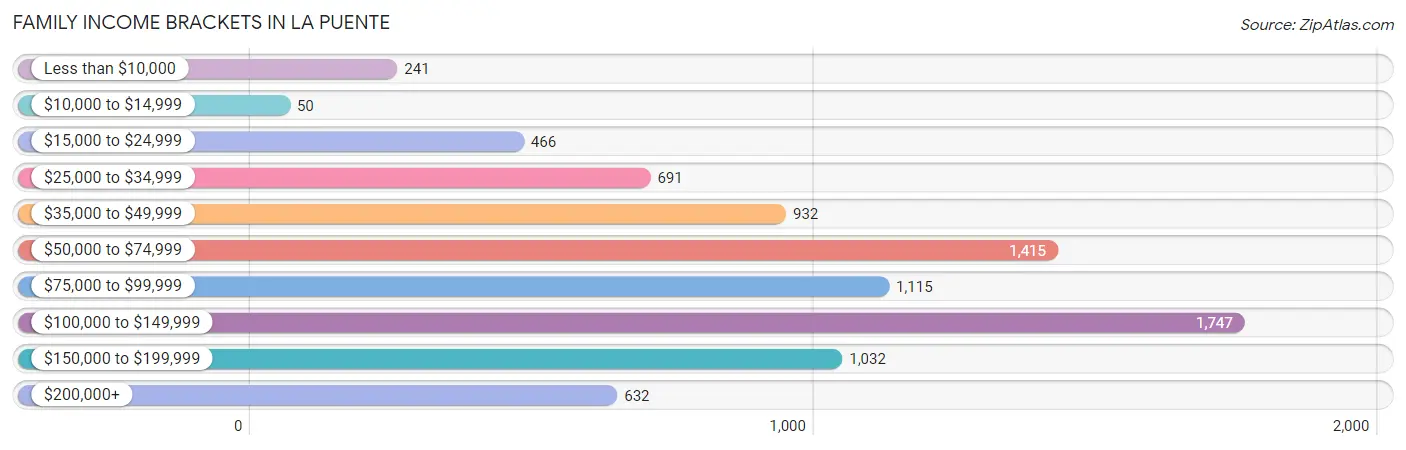
| Income Bracket | # Families | % Families |
| Less than $10,000 | 241 | 2.9% |
| $10,000 to $14,999 | 50 | 0.6% |
| $15,000 to $24,999 | 466 | 5.6% |
| $25,000 to $34,999 | 691 | 8.3% |
| $35,000 to $49,999 | 932 | 11.2% |
| $50,000 to $74,999 | 1,415 | 17.0% |
| $75,000 to $99,999 | 1,115 | 13.4% |
| $100,000 to $149,999 | 1,747 | 21.0% |
| $150,000 to $199,999 | 1,032 | 12.4% |
| $200,000+ | 632 | 7.6% |
Family Income by Famaliy Size in La Puente
7+ person families (423 | 5.1%) account for the highest median family income in La Puente with $166,042 per family, while 2-person families (1,849 | 22.2%) have the highest median income of $24,944 per family member.
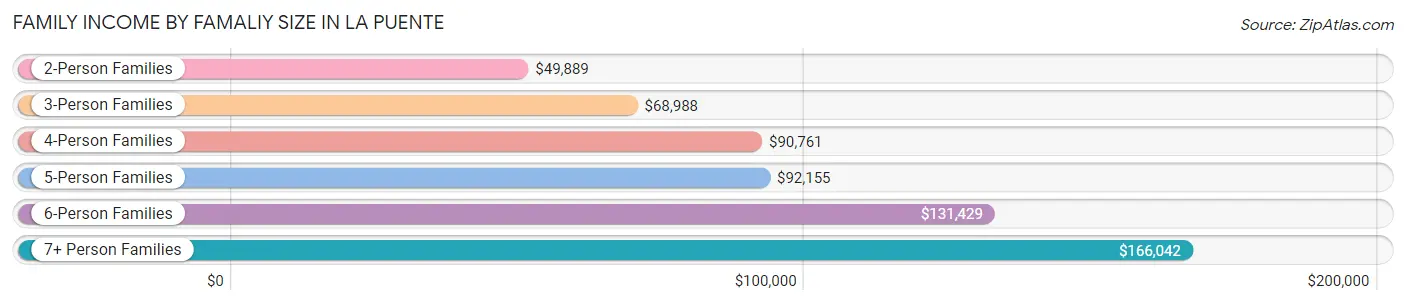
| Income Bracket | # Families | Median Income |
| 2-Person Families | 1,849 (22.2%) | $49,889 |
| 3-Person Families | 1,675 (20.1%) | $68,988 |
| 4-Person Families | 2,010 (24.2%) | $90,761 |
| 5-Person Families | 1,646 (19.8%) | $92,155 |
| 6-Person Families | 718 (8.6%) | $131,429 |
| 7+ Person Families | 423 (5.1%) | $166,042 |
| Total | 8,321 (100.0%) | $81,870 |
Family Income by Number of Earners in La Puente
The median family income in La Puente is $81,870, with families comprising 3+ earners (2,447) having the highest median family income of $148,691, while families with no earners (946) have the lowest median family income of $30,609, accounting for 29.4% and 11.4% of families, respectively.
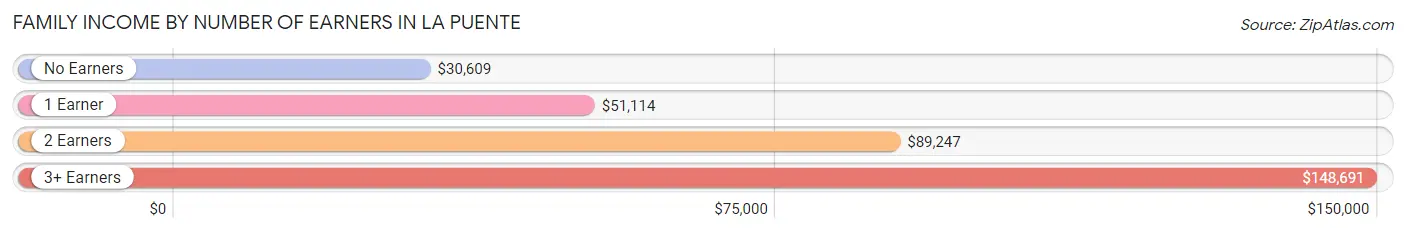
| Number of Earners | # Families | Median Income |
| No Earners | 946 (11.4%) | $30,609 |
| 1 Earner | 2,343 (28.2%) | $51,114 |
| 2 Earners | 2,585 (31.1%) | $89,247 |
| 3+ Earners | 2,447 (29.4%) | $148,691 |
| Total | 8,321 (100.0%) | $81,870 |
Household Income in La Puente
Household Income Brackets in La Puente
With 1,800 households falling in the category, the $100,000 to $149,999 income range is the most frequent in La Puente, accounting for 18.7% of all households. In contrast, only 183 households (1.9%) fall into the $10,000 to $14,999 income bracket, making it the least populous group.
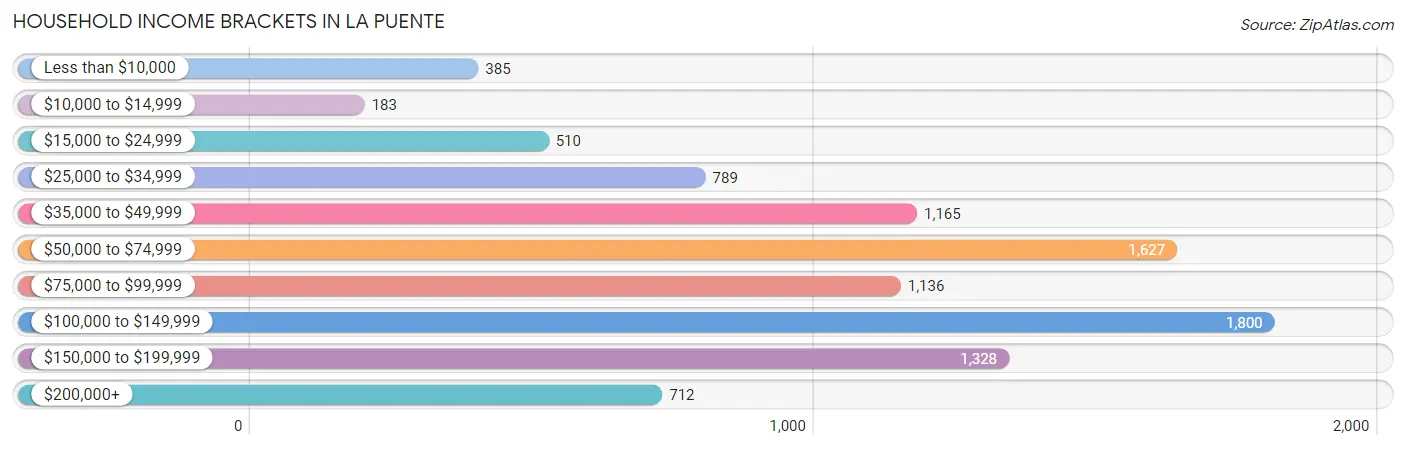
| Income Bracket | # Households | % Households |
| Less than $10,000 | 385 | 4.0% |
| $10,000 to $14,999 | 183 | 1.9% |
| $15,000 to $24,999 | 510 | 5.3% |
| $25,000 to $34,999 | 789 | 8.2% |
| $35,000 to $49,999 | 1,165 | 12.1% |
| $50,000 to $74,999 | 1,627 | 16.9% |
| $75,000 to $99,999 | 1,136 | 11.8% |
| $100,000 to $149,999 | 1,800 | 18.7% |
| $150,000 to $199,999 | 1,328 | 13.8% |
| $200,000+ | 712 | 7.4% |
Household Income by Householder Age in La Puente
The median household income in La Puente is $77,702, with the highest median household income of $88,219 found in the 45 to 64 years age bracket for the primary householder. A total of 4,381 households (45.5%) fall into this category. Meanwhile, the 15 to 24 years age bracket for the primary householder has the lowest median household income of $0, with 81 households (0.8%) in this group.
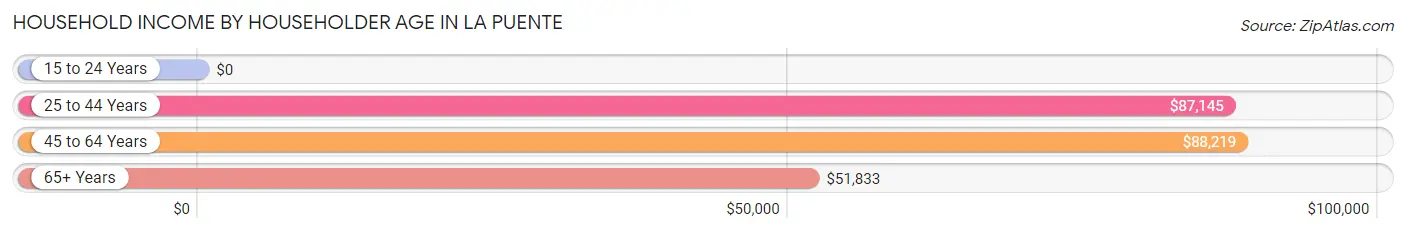
| Income Bracket | # Households | Median Income |
| 15 to 24 Years | 81 (0.8%) | $0 |
| 25 to 44 Years | 2,871 (29.8%) | $87,145 |
| 45 to 64 Years | 4,381 (45.5%) | $88,219 |
| 65+ Years | 2,292 (23.8%) | $51,833 |
| Total | 9,625 (100.0%) | $77,702 |
Poverty in La Puente
Income Below Poverty by Sex and Age in La Puente
With 7.9% poverty level for males and 11.4% for females among the residents of La Puente, 15 year old males and 65 to 74 year old females are the most vulnerable to poverty, with 62 males (20.7%) and 336 females (22.8%) in their respective age groups living below the poverty level.
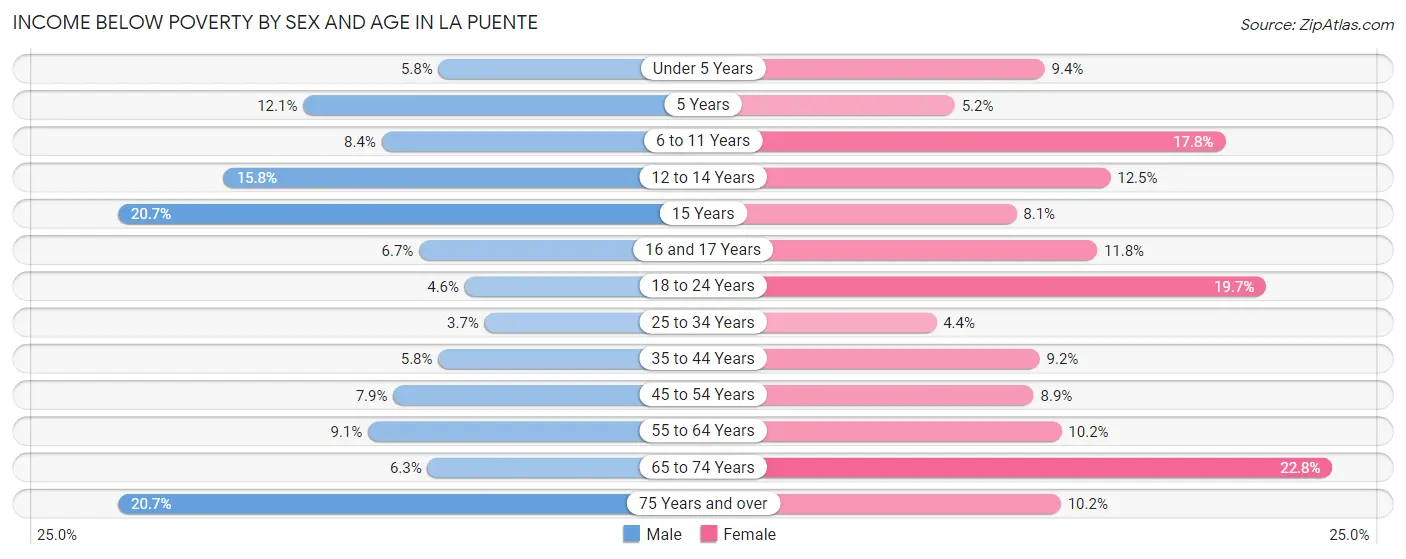
| Age Bracket | Male | Female |
| Under 5 Years | 42 (5.8%) | 89 (9.4%) |
| 5 Years | 28 (12.1%) | 11 (5.2%) |
| 6 to 11 Years | 127 (8.4%) | 248 (17.8%) |
| 12 to 14 Years | 159 (15.8%) | 86 (12.5%) |
| 15 Years | 62 (20.7%) | 26 (8.1%) |
| 16 and 17 Years | 35 (6.7%) | 49 (11.8%) |
| 18 to 24 Years | 104 (4.6%) | 327 (19.7%) |
| 25 to 34 Years | 122 (3.6%) | 118 (4.4%) |
| 35 to 44 Years | 119 (5.8%) | 196 (9.2%) |
| 45 to 54 Years | 227 (7.9%) | 270 (8.9%) |
| 55 to 64 Years | 216 (9.1%) | 227 (10.2%) |
| 65 to 74 Years | 72 (6.3%) | 336 (22.8%) |
| 75 Years and over | 207 (20.7%) | 115 (10.2%) |
| Total | 1,520 (7.9%) | 2,098 (11.4%) |
Income Above Poverty by Sex and Age in La Puente
According to the poverty statistics in La Puente, males aged 25 to 34 years and females aged 25 to 34 years are the age groups that are most secure financially, with 96.4% of males and 95.6% of females in these age groups living above the poverty line.
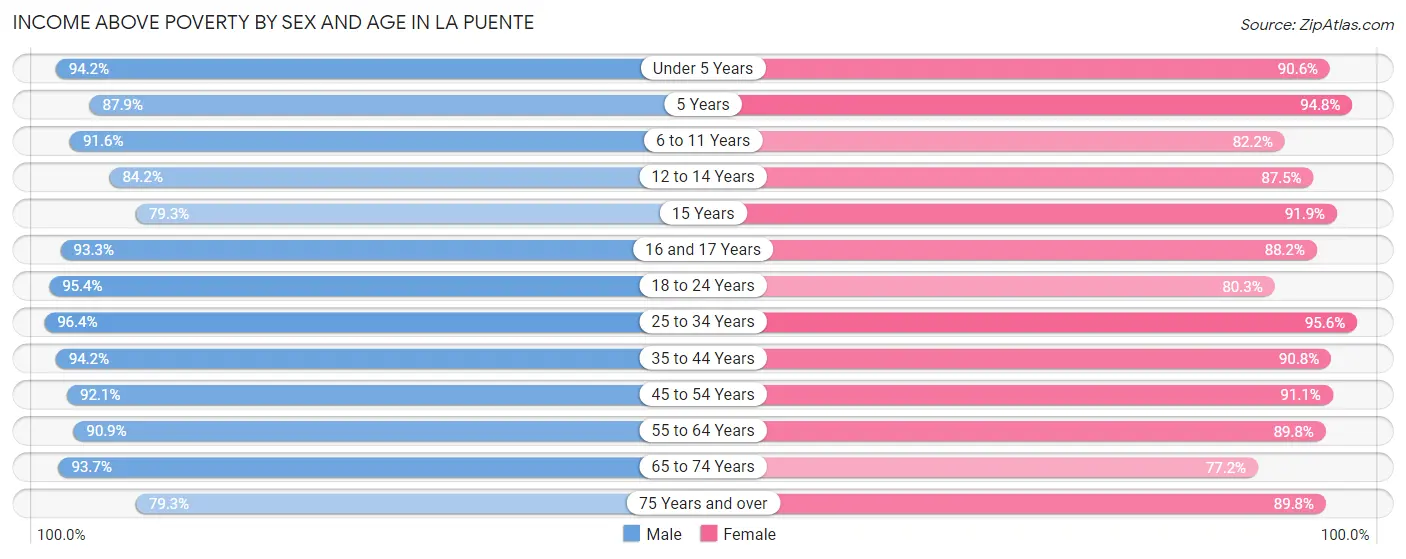
| Age Bracket | Male | Female |
| Under 5 Years | 683 (94.2%) | 857 (90.6%) |
| 5 Years | 204 (87.9%) | 199 (94.8%) |
| 6 to 11 Years | 1,379 (91.6%) | 1,146 (82.2%) |
| 12 to 14 Years | 850 (84.2%) | 604 (87.5%) |
| 15 Years | 238 (79.3%) | 295 (91.9%) |
| 16 and 17 Years | 488 (93.3%) | 365 (88.2%) |
| 18 to 24 Years | 2,172 (95.4%) | 1,334 (80.3%) |
| 25 to 34 Years | 3,219 (96.4%) | 2,577 (95.6%) |
| 35 to 44 Years | 1,934 (94.2%) | 1,938 (90.8%) |
| 45 to 54 Years | 2,651 (92.1%) | 2,763 (91.1%) |
| 55 to 64 Years | 2,169 (90.9%) | 2,000 (89.8%) |
| 65 to 74 Years | 1,071 (93.7%) | 1,140 (77.2%) |
| 75 Years and over | 795 (79.3%) | 1,017 (89.8%) |
| Total | 17,853 (92.1%) | 16,235 (88.6%) |
Income Below Poverty Among Married-Couple Families in La Puente
The poverty statistics for married-couple families in La Puente show that 6.7% or 351 of the total 5,269 families live below the poverty line. Families with 3 or 4 children have the highest poverty rate of 13.1%, comprising of 62 families. On the other hand, families with 5 or more children have the lowest poverty rate of 0.0%, which includes 0 families.
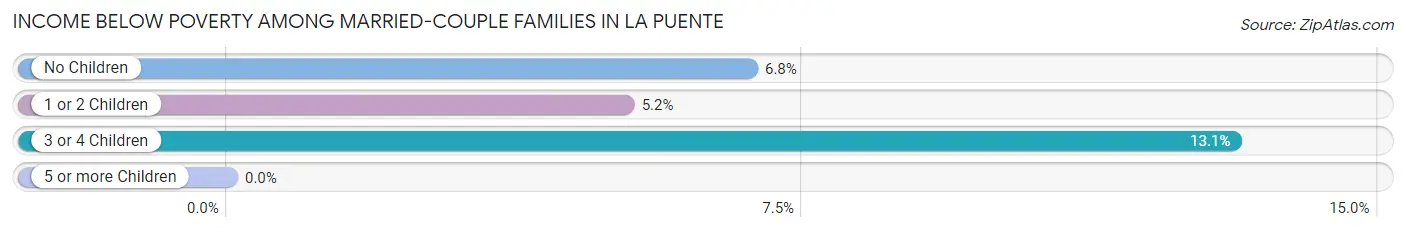
| Children | Above Poverty | Below Poverty |
| No Children | 2,430 (93.2%) | 177 (6.8%) |
| 1 or 2 Children | 2,050 (94.8%) | 112 (5.2%) |
| 3 or 4 Children | 411 (86.9%) | 62 (13.1%) |
| 5 or more Children | 27 (100.0%) | 0 (0.0%) |
| Total | 4,918 (93.3%) | 351 (6.7%) |
Income Below Poverty Among Single-Parent Households in La Puente
According to the poverty data in La Puente, 6.8% or 73 single-father households and 13.7% or 272 single-mother households are living below the poverty line. Among single-father households, those with 3 or 4 children have the highest poverty rate, with 26 households (15.2%) experiencing poverty. Likewise, among single-mother households, those with 3 or 4 children have the highest poverty rate, with 51 households (21.4%) falling below the poverty line.
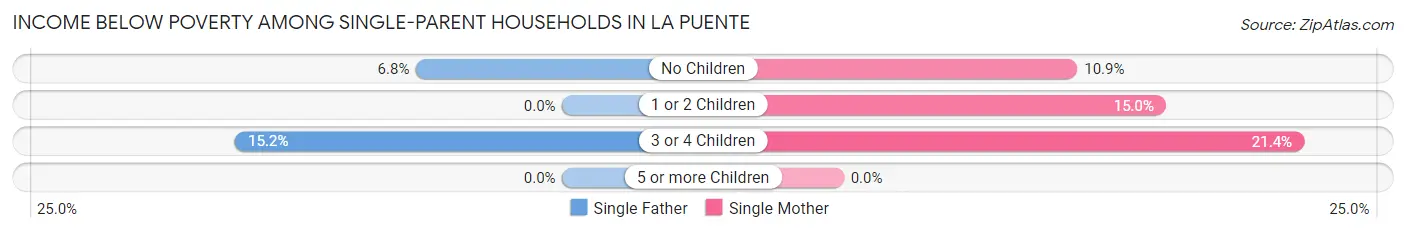
| Children | Single Father | Single Mother |
| No Children | 47 (6.8%) | 89 (10.9%) |
| 1 or 2 Children | 0 (0.0%) | 132 (15.0%) |
| 3 or 4 Children | 26 (15.2%) | 51 (21.4%) |
| 5 or more Children | 0 (0.0%) | 0 (0.0%) |
| Total | 73 (6.8%) | 272 (13.7%) |
Income Below Poverty Among Married-Couple vs Single-Parent Households in La Puente
The poverty data for La Puente shows that 351 of the married-couple family households (6.7%) and 345 of the single-parent households (11.3%) are living below the poverty level. Within the married-couple family households, those with 3 or 4 children have the highest poverty rate, with 62 households (13.1%) falling below the poverty line. Among the single-parent households, those with 3 or 4 children have the highest poverty rate, with 77 household (18.8%) living below poverty.
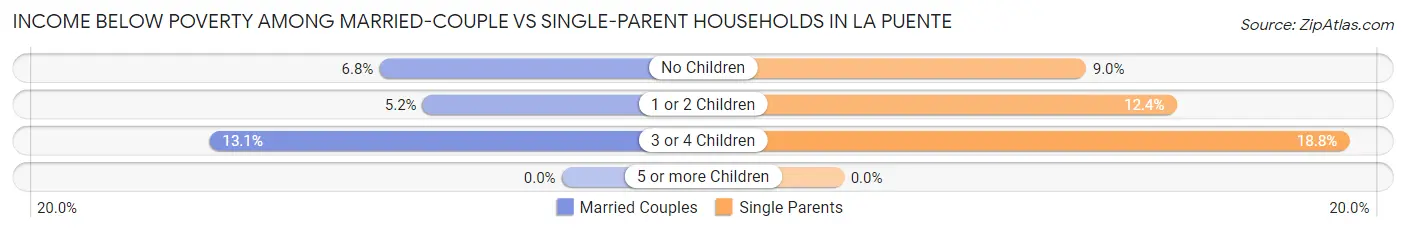
| Children | Married-Couple Families | Single-Parent Households |
| No Children | 177 (6.8%) | 136 (9.0%) |
| 1 or 2 Children | 112 (5.2%) | 132 (12.4%) |
| 3 or 4 Children | 62 (13.1%) | 77 (18.8%) |
| 5 or more Children | 0 (0.0%) | 0 (0.0%) |
| Total | 351 (6.7%) | 345 (11.3%) |
Race in La Puente
The most populous races in La Puente are Hispanic or Latino (30,675 | 81.1%), Some other Race (16,188 | 42.8%), and White / Caucasian (10,112 | 26.7%).
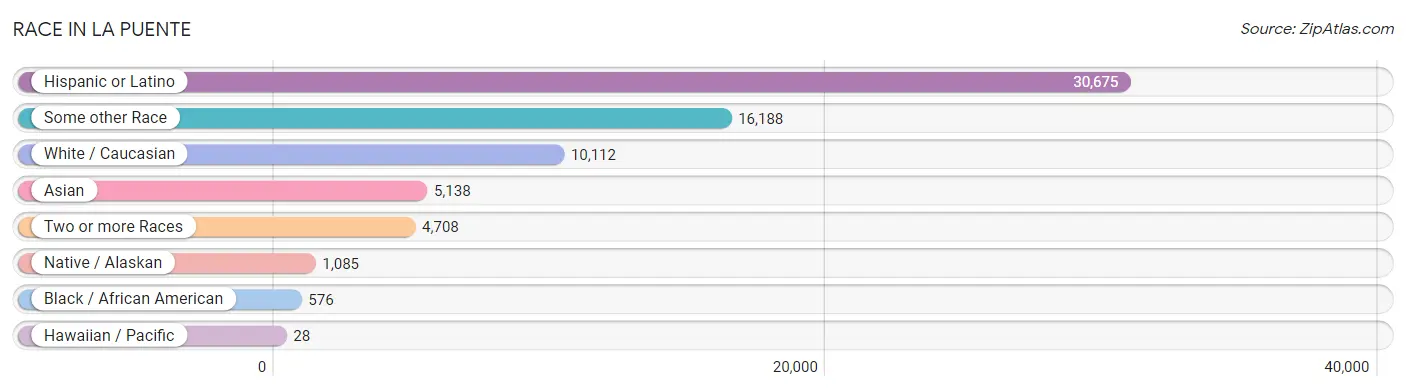
| Race | # Population | % Population |
| Asian | 5,138 | 13.6% |
| Black / African American | 576 | 1.5% |
| Hawaiian / Pacific | 28 | 0.1% |
| Hispanic or Latino | 30,675 | 81.1% |
| Native / Alaskan | 1,085 | 2.9% |
| White / Caucasian | 10,112 | 26.7% |
| Two or more Races | 4,708 | 12.4% |
| Some other Race | 16,188 | 42.8% |
| Total | 37,835 | 100.0% |
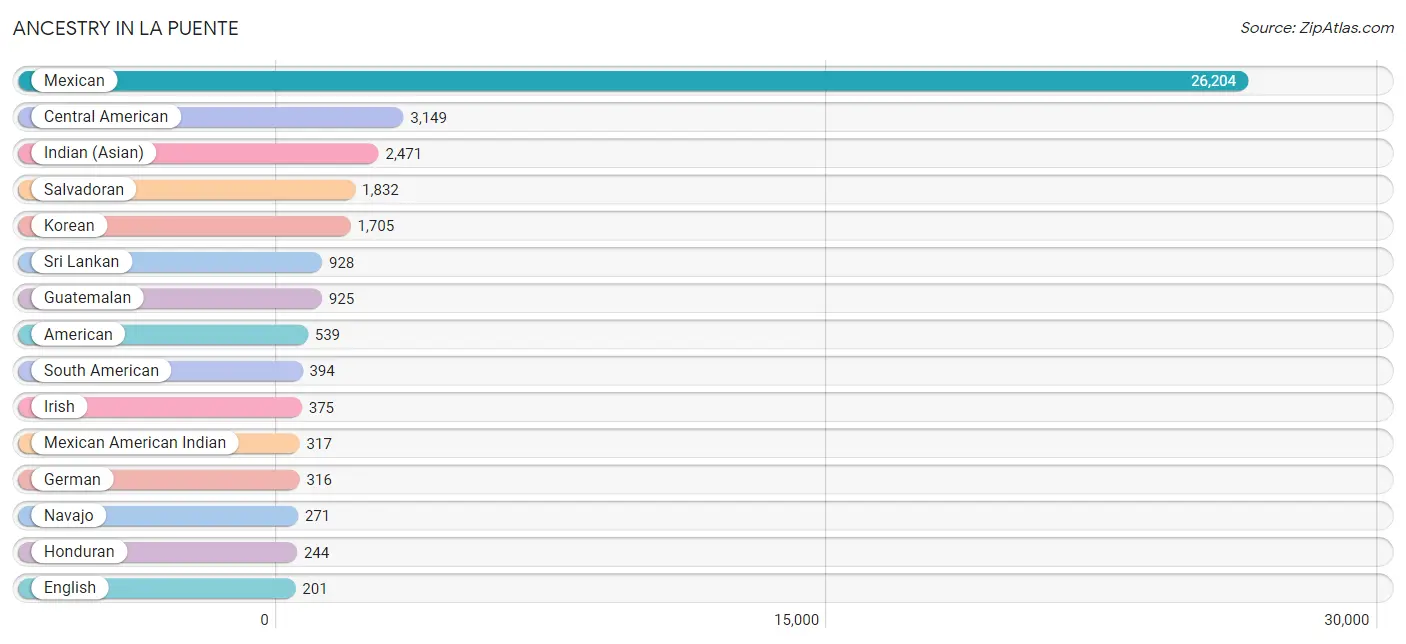
Ancestry in La Puente
The most populous ancestries reported in La Puente are Mexican (26,204 | 69.3%), Central American (3,149 | 8.3%), Indian (Asian) (2,471 | 6.5%), Salvadoran (1,832 | 4.8%), and Korean (1,705 | 4.5%), together accounting for 93.5% of all La Puente residents.
| Ancestry | # Population | % Population |
| American | 539 | 1.4% |
| Apache | 16 | 0.0% |
| Argentinean | 62 | 0.2% |
| Bangladeshi | 37 | 0.1% |
| Barbadian | 2 | 0.0% |
| Basque | 89 | 0.2% |
| Bhutanese | 47 | 0.1% |
| Blackfeet | 23 | 0.1% |
| British | 9 | 0.0% |
| Burmese | 145 | 0.4% |
| Central American | 3,149 | 8.3% |
| Central American Indian | 59 | 0.2% |
| Chilean | 77 | 0.2% |
| Colombian | 94 | 0.3% |
| Croatian | 12 | 0.0% |
| Danish | 15 | 0.0% |
| Dutch | 45 | 0.1% |
| Ecuadorian | 45 | 0.1% |
| English | 201 | 0.5% |
| European | 112 | 0.3% |
| Filipino | 38 | 0.1% |
| French | 55 | 0.2% |
| French Canadian | 9 | 0.0% |
| German | 316 | 0.8% |
| Guatemalan | 925 | 2.4% |
| Honduran | 244 | 0.6% |
| Hungarian | 16 | 0.0% |
| Indian (Asian) | 2,471 | 6.5% |
| Iranian | 8 | 0.0% |
| Irish | 375 | 1.0% |
| Italian | 118 | 0.3% |
| Japanese | 89 | 0.2% |
| Korean | 1,705 | 4.5% |
| Laotian | 44 | 0.1% |
| Mexican | 26,204 | 69.3% |
| Mexican American Indian | 317 | 0.8% |
| Native Hawaiian | 4 | 0.0% |
| Navajo | 271 | 0.7% |
| Nicaraguan | 134 | 0.4% |
| Nigerian | 109 | 0.3% |
| Norwegian | 5 | 0.0% |
| Pakistani | 23 | 0.1% |
| Panamanian | 14 | 0.0% |
| Peruvian | 14 | 0.0% |
| Portuguese | 22 | 0.1% |
| Puerto Rican | 118 | 0.3% |
| Salvadoran | 1,832 | 4.8% |
| Samoan | 24 | 0.1% |
| Scotch-Irish | 6 | 0.0% |
| Scottish | 16 | 0.0% |
| South American | 394 | 1.0% |
| South American Indian | 10 | 0.0% |
| Spaniard | 176 | 0.5% |
| Spanish | 43 | 0.1% |
| Sri Lankan | 928 | 2.5% |
| Subsaharan African | 109 | 0.3% |
| Thai | 54 | 0.1% |
| Ukrainian | 5 | 0.0% |
| Uruguayan | 92 | 0.2% |
| Venezuelan | 10 | 0.0% |
| Yaqui | 9 | 0.0% | View All 61 Rows |
Immigrants in La Puente
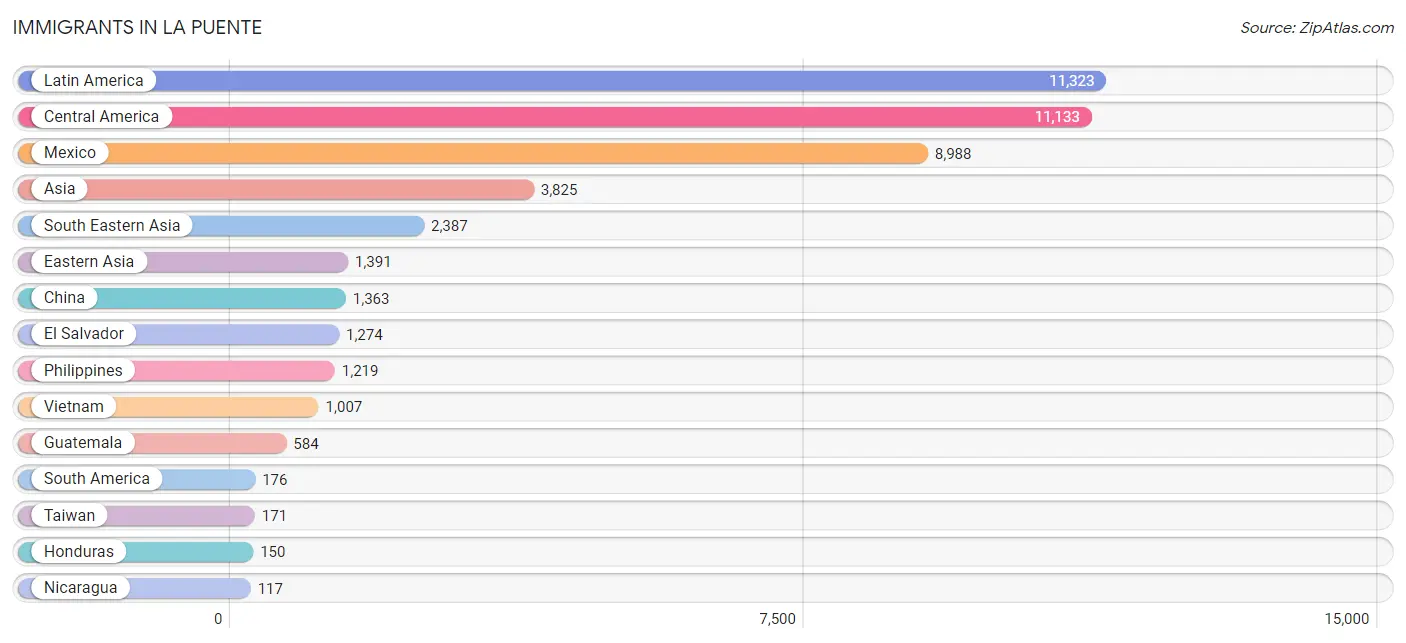
The most numerous immigrant groups reported in La Puente came from Latin America (11,323 | 29.9%), Central America (11,133 | 29.4%), Mexico (8,988 | 23.8%), Asia (3,825 | 10.1%), and South Eastern Asia (2,387 | 6.3%), together accounting for 99.5% of all La Puente residents.
| Immigration Origin | # Population | % Population |
| Africa | 33 | 0.1% |
| Argentina | 39 | 0.1% |
| Asia | 3,825 | 10.1% |
| Barbados | 2 | 0.0% |
| Brazil | 7 | 0.0% |
| Cambodia | 69 | 0.2% |
| Canada | 9 | 0.0% |
| Caribbean | 14 | 0.0% |
| Central America | 11,133 | 29.4% |
| Chile | 56 | 0.2% |
| China | 1,363 | 3.6% |
| Colombia | 25 | 0.1% |
| Eastern Asia | 1,391 | 3.7% |
| Eastern Europe | 5 | 0.0% |
| Ecuador | 25 | 0.1% |
| El Salvador | 1,274 | 3.4% |
| Europe | 47 | 0.1% |
| Fiji | 35 | 0.1% |
| France | 18 | 0.1% |
| Germany | 3 | 0.0% |
| Guatemala | 584 | 1.5% |
| Honduras | 150 | 0.4% |
| Hong Kong | 66 | 0.2% |
| India | 14 | 0.0% |
| Indonesia | 44 | 0.1% |
| Israel | 8 | 0.0% |
| Jamaica | 12 | 0.0% |
| Japan | 8 | 0.0% |
| Korea | 20 | 0.1% |
| Kuwait | 14 | 0.0% |
| Laos | 4 | 0.0% |
| Latin America | 11,323 | 29.9% |
| Malaysia | 21 | 0.1% |
| Mexico | 8,988 | 23.8% |
| Nicaragua | 117 | 0.3% |
| Nigeria | 33 | 0.1% |
| Oceania | 48 | 0.1% |
| Panama | 14 | 0.0% |
| Peru | 14 | 0.0% |
| Philippines | 1,219 | 3.2% |
| Russia | 5 | 0.0% |
| South America | 176 | 0.5% |
| South Central Asia | 14 | 0.0% |
| South Eastern Asia | 2,387 | 6.3% |
| Switzerland | 21 | 0.1% |
| Taiwan | 171 | 0.4% |
| Thailand | 23 | 0.1% |
| Venezuela | 10 | 0.0% |
| Vietnam | 1,007 | 2.7% |
| Western Africa | 33 | 0.1% |
| Western Asia | 33 | 0.1% |
| Western Europe | 42 | 0.1% | View All 52 Rows |
Sex and Age in La Puente
Sex and Age in La Puente
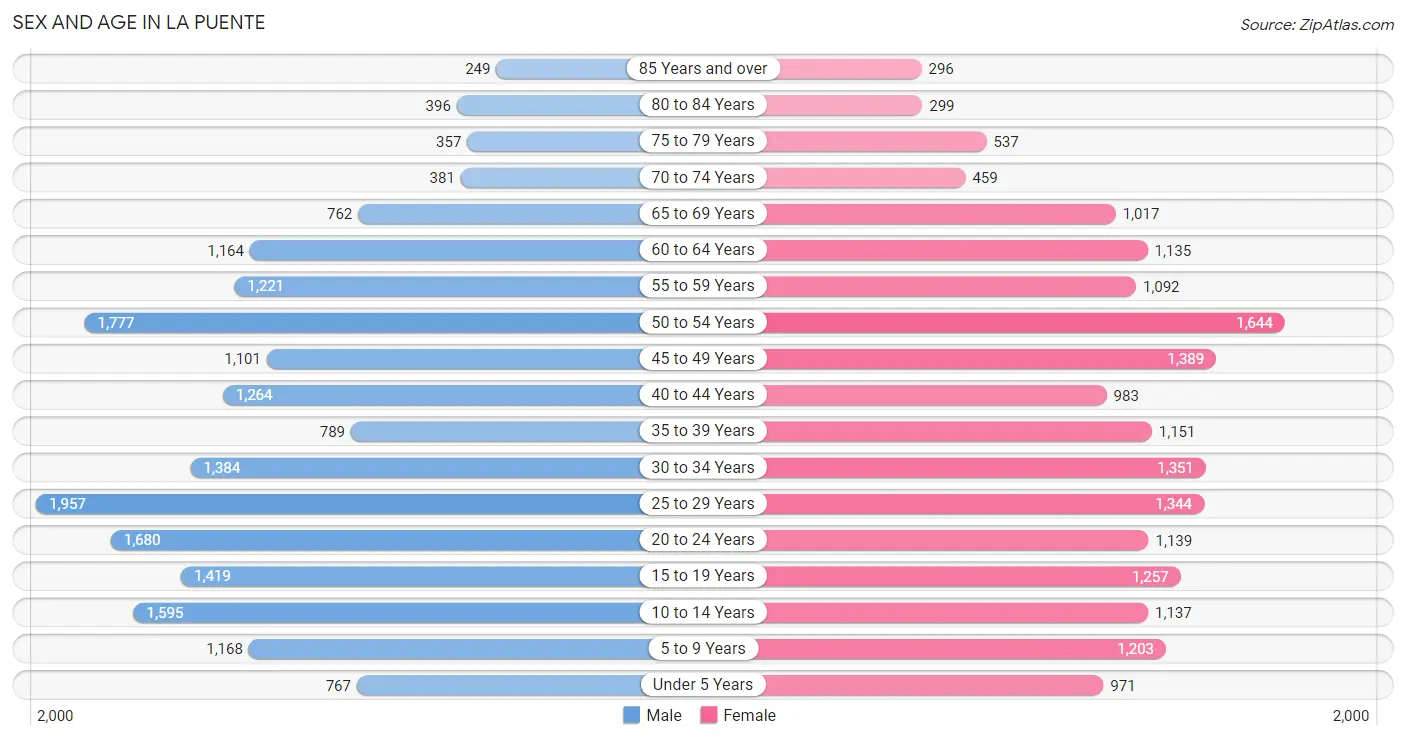
The most populous age groups in La Puente are 25 to 29 Years (1,957 | 10.1%) for men and 50 to 54 Years (1,644 | 8.9%) for women.
| Age Bracket | Male | Female |
| Under 5 Years | 767 (4.0%) | 971 (5.3%) |
| 5 to 9 Years | 1,168 (6.0%) | 1,203 (6.5%) |
| 10 to 14 Years | 1,595 (8.2%) | 1,137 (6.2%) |
| 15 to 19 Years | 1,419 (7.3%) | 1,257 (6.8%) |
| 20 to 24 Years | 1,680 (8.6%) | 1,139 (6.2%) |
| 25 to 29 Years | 1,957 (10.1%) | 1,344 (7.3%) |
| 30 to 34 Years | 1,384 (7.1%) | 1,351 (7.3%) |
| 35 to 39 Years | 789 (4.1%) | 1,151 (6.2%) |
| 40 to 44 Years | 1,264 (6.5%) | 983 (5.3%) |
| 45 to 49 Years | 1,101 (5.7%) | 1,389 (7.5%) |
| 50 to 54 Years | 1,777 (9.1%) | 1,644 (8.9%) |
| 55 to 59 Years | 1,221 (6.3%) | 1,092 (5.9%) |
| 60 to 64 Years | 1,164 (6.0%) | 1,135 (6.2%) |
| 65 to 69 Years | 762 (3.9%) | 1,017 (5.5%) |
| 70 to 74 Years | 381 (2.0%) | 459 (2.5%) |
| 75 to 79 Years | 357 (1.8%) | 537 (2.9%) |
| 80 to 84 Years | 396 (2.0%) | 299 (1.6%) |
| 85 Years and over | 249 (1.3%) | 296 (1.6%) |
| Total | 19,431 (100.0%) | 18,404 (100.0%) |
Families and Households in La Puente
Median Family Size in La Puente
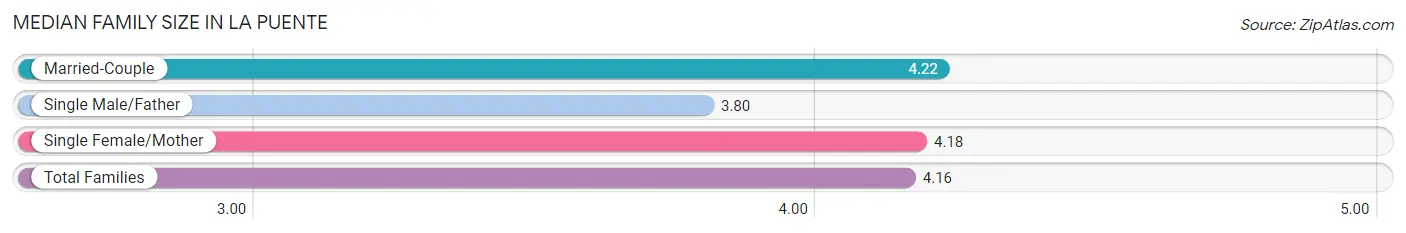
The median family size in La Puente is 4.16 persons per family, with married-couple families (5,269 | 63.3%) accounting for the largest median family size of 4.22 persons per family. On the other hand, single male/father families (1,071 | 12.9%) represent the smallest median family size with 3.80 persons per family.
| Family Type | # Families | Family Size |
| Married-Couple | 5,269 (63.3%) | 4.22 |
| Single Male/Father | 1,071 (12.9%) | 3.80 |
| Single Female/Mother | 1,981 (23.8%) | 4.18 |
| Total Families | 8,321 (100.0%) | 4.16 |
Median Household Size in La Puente
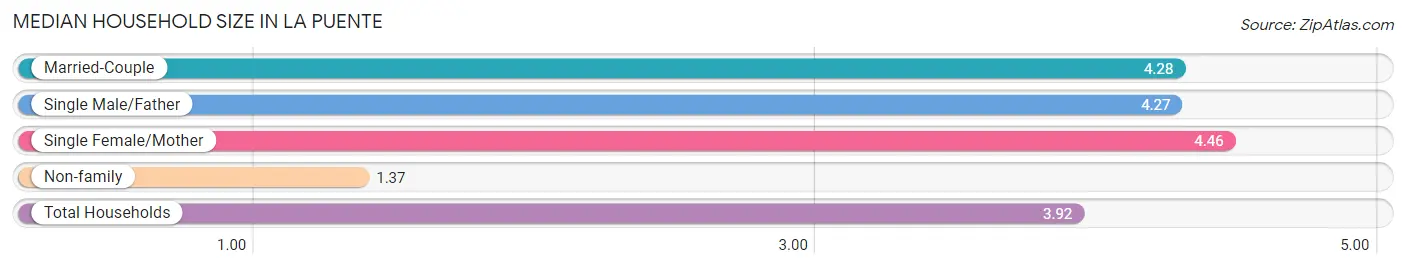
The median household size in La Puente is 3.92 persons per household, with single female/mother households (1,981 | 20.6%) accounting for the largest median household size of 4.46 persons per household. non-family households (1,304 | 13.6%) represent the smallest median household size with 1.37 persons per household.
| Household Type | # Households | Household Size |
| Married-Couple | 5,269 (54.7%) | 4.28 |
| Single Male/Father | 1,071 (11.1%) | 4.27 |
| Single Female/Mother | 1,981 (20.6%) | 4.46 |
| Non-family | 1,304 (13.6%) | 1.37 |
| Total Households | 9,625 (100.0%) | 3.92 |
Household Size by Marriage Status in La Puente
Out of a total of 9,625 households in La Puente, 8,321 (86.5%) are family households, while 1,304 (13.6%) are nonfamily households. The most numerous type of family households are 4-person households, comprising 1,856, and the most common type of nonfamily households are 1-person households, comprising 1,015.
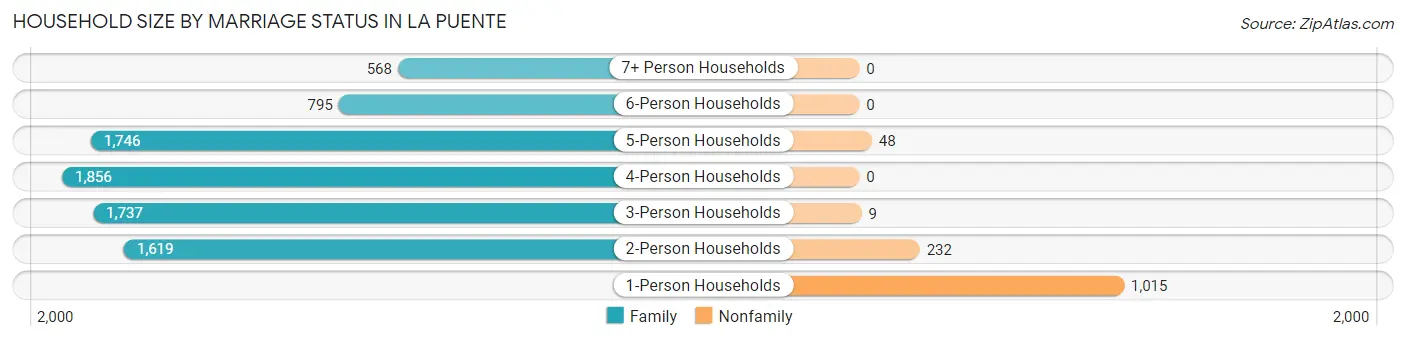
| Household Size | Family Households | Nonfamily Households |
| 1-Person Households | - | 1,015 (10.5%) |
| 2-Person Households | 1,619 (16.8%) | 232 (2.4%) |
| 3-Person Households | 1,737 (18.0%) | 9 (0.1%) |
| 4-Person Households | 1,856 (19.3%) | 0 (0.0%) |
| 5-Person Households | 1,746 (18.1%) | 48 (0.5%) |
| 6-Person Households | 795 (8.3%) | 0 (0.0%) |
| 7+ Person Households | 568 (5.9%) | 0 (0.0%) |
| Total | 8,321 (86.5%) | 1,304 (13.6%) |
Female Fertility in La Puente
Fertility by Age in La Puente
Average fertility rate in La Puente is 47.0 births per 1,000 women. Women in the age bracket of 20 to 34 years have the highest fertility rate with 68.0 births per 1,000 women. Women in the age bracket of 20 to 34 years acount for 61.4% of all women with births.
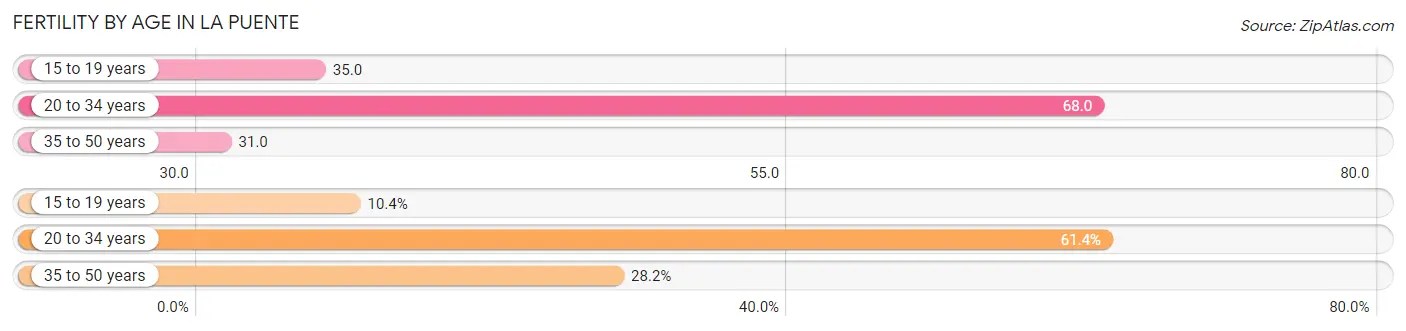
| Age Bracket | Women with Births | Births / 1,000 Women |
| 15 to 19 years | 44 (10.3%) | 35.0 |
| 20 to 34 years | 261 (61.4%) | 68.0 |
| 35 to 50 years | 120 (28.2%) | 31.0 |
| Total | 425 (100.0%) | 47.0 |
Fertility by Age by Marriage Status in La Puente
47.3% of women with births (425) in La Puente are married. The highest percentage of unmarried women with births falls into 15 to 19 years age bracket with 100.0% of them unmarried at the time of birth, while the lowest percentage of unmarried women with births belong to 35 to 50 years age bracket with 44.2% of them unmarried.
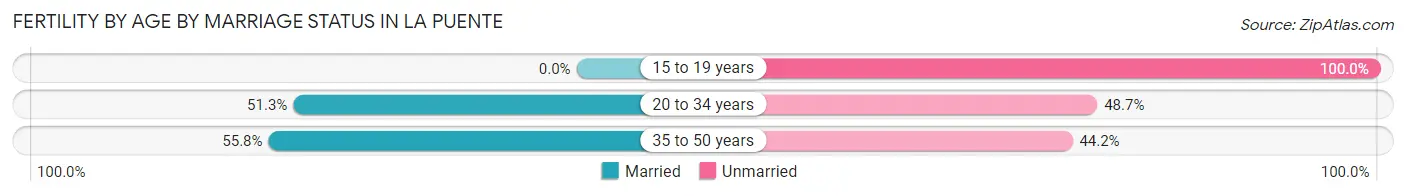
| Age Bracket | Married | Unmarried |
| 15 to 19 years | 0 (0.0%) | 44 (100.0%) |
| 20 to 34 years | 134 (51.3%) | 127 (48.7%) |
| 35 to 50 years | 67 (55.8%) | 53 (44.2%) |
| Total | 201 (47.3%) | 224 (52.7%) |
Fertility by Education in La Puente
Average fertility rate in La Puente is 47.0 births per 1,000 women. Women with the education attainment of college or associate's degree have the highest fertility rate of 67.0 births per 1,000 women, while women with the education attainment of less than high school have the lowest fertility at 18.0 births per 1,000 women. Women with the education attainment of college or associate's degree represent 42.1% of all women with births.
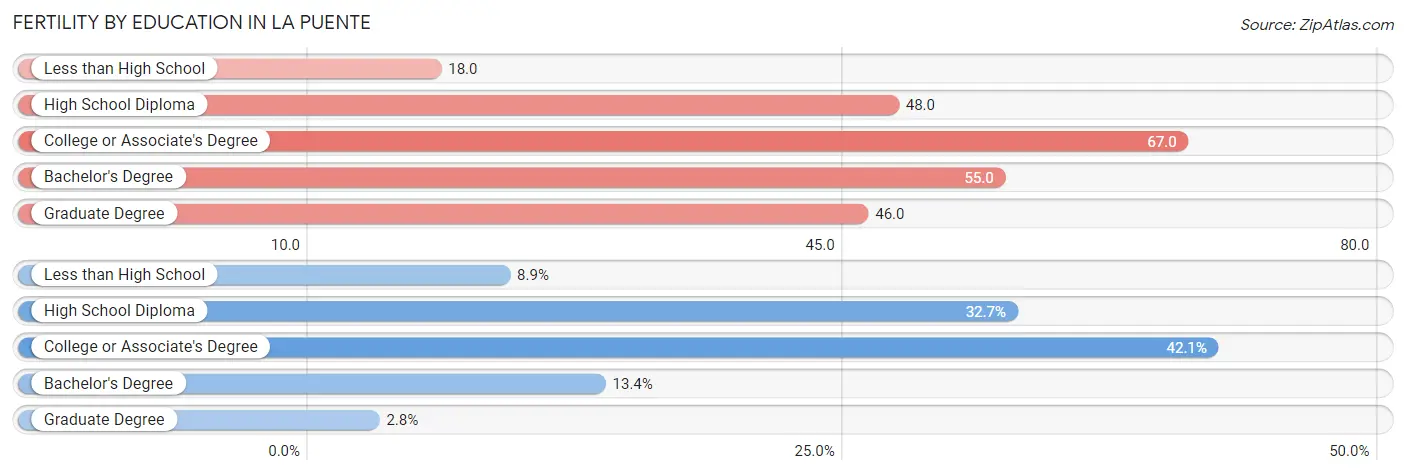
| Educational Attainment | Women with Births | Births / 1,000 Women |
| Less than High School | 38 (8.9%) | 18.0 |
| High School Diploma | 139 (32.7%) | 48.0 |
| College or Associate's Degree | 179 (42.1%) | 67.0 |
| Bachelor's Degree | 57 (13.4%) | 55.0 |
| Graduate Degree | 12 (2.8%) | 46.0 |
| Total | 425 (100.0%) | 47.0 |
Fertility by Education by Marriage Status in La Puente
52.7% of women with births in La Puente are unmarried. Women with the educational attainment of graduate degree are most likely to be married with 100.0% of them married at childbirth, while women with the educational attainment of less than high school are least likely to be married with 100.0% of them unmarried at childbirth.
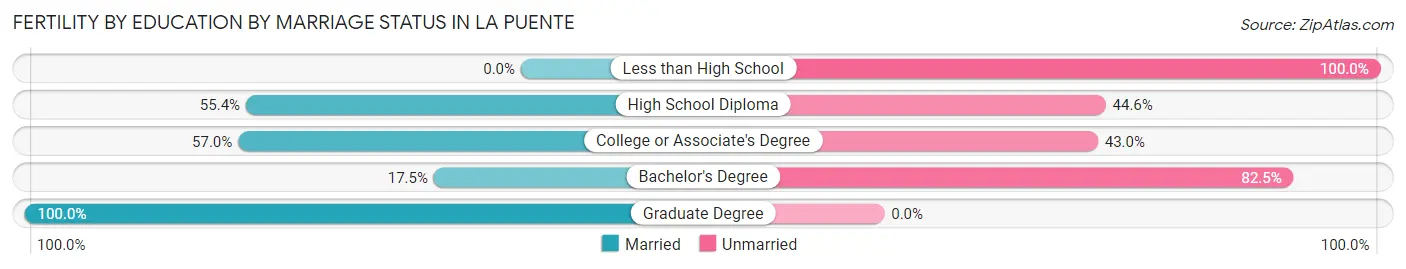
| Educational Attainment | Married | Unmarried |
| Less than High School | 0 (0.0%) | 38 (100.0%) |
| High School Diploma | 77 (55.4%) | 62 (44.6%) |
| College or Associate's Degree | 102 (57.0%) | 77 (43.0%) |
| Bachelor's Degree | 10 (17.5%) | 47 (82.5%) |
| Graduate Degree | 12 (100.0%) | 0 (0.0%) |
| Total | 201 (47.3%) | 224 (52.7%) |
Employment Characteristics in La Puente
Employment by Class of Employer in La Puente
Among the 17,404 employed individuals in La Puente, private company employees (12,577 | 72.3%), not-for-profit organizations (1,423 | 8.2%), and self-employed (not incorporated) (1,072 | 6.2%) make up the most common classes of employment.
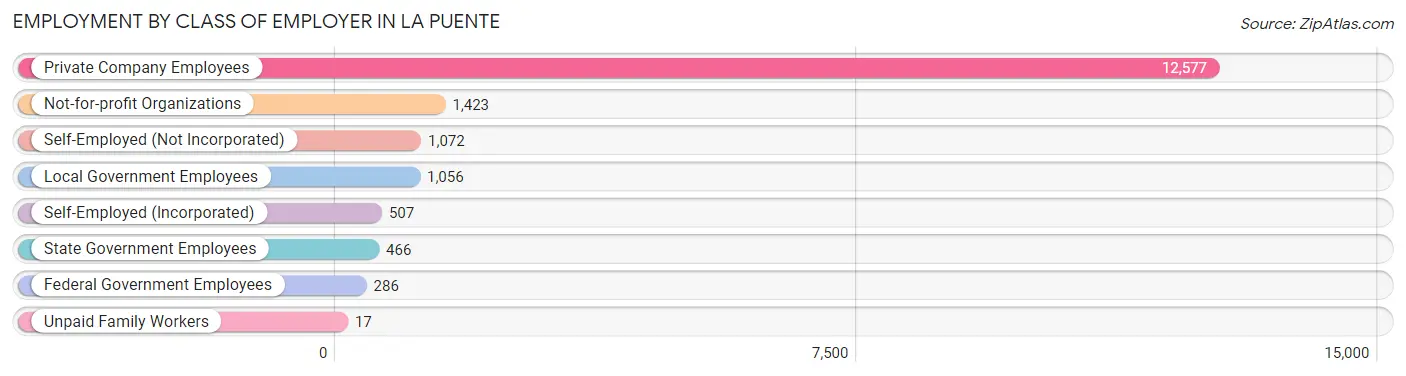
| Employer Class | # Employees | % Employees |
| Private Company Employees | 12,577 | 72.3% |
| Self-Employed (Incorporated) | 507 | 2.9% |
| Self-Employed (Not Incorporated) | 1,072 | 6.2% |
| Not-for-profit Organizations | 1,423 | 8.2% |
| Local Government Employees | 1,056 | 6.1% |
| State Government Employees | 466 | 2.7% |
| Federal Government Employees | 286 | 1.6% |
| Unpaid Family Workers | 17 | 0.1% |
| Total | 17,404 | 100.0% |
Employment Status by Age in La Puente
According to the labor force statistics for La Puente, out of the total population over 16 years of age (30,373), 63.2% or 19,196 individuals are in the labor force, with 6.0% or 1,152 of them unemployed. The age group with the highest labor force participation rate is 30 to 34 years, with 86.0% or 2,352 individuals in the labor force. Within the labor force, the 16 to 19 years age range has the highest percentage of unemployed individuals, with 21.0% or 137 of them being unemployed.
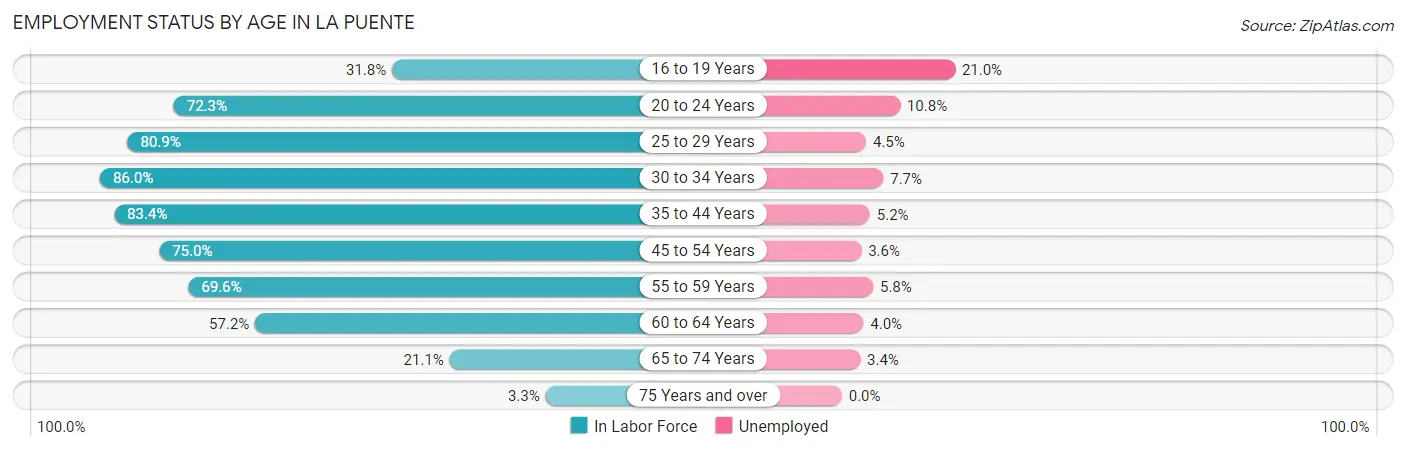
| Age Bracket | In Labor Force | Unemployed |
| 16 to 19 Years | 653 (31.8%) | 137 (21.0%) |
| 20 to 24 Years | 2,038 (72.3%) | 220 (10.8%) |
| 25 to 29 Years | 2,671 (80.9%) | 120 (4.5%) |
| 30 to 34 Years | 2,352 (86.0%) | 181 (7.7%) |
| 35 to 44 Years | 3,492 (83.4%) | 182 (5.2%) |
| 45 to 54 Years | 4,433 (75.0%) | 160 (3.6%) |
| 55 to 59 Years | 1,610 (69.6%) | 93 (5.8%) |
| 60 to 64 Years | 1,315 (57.2%) | 53 (4.0%) |
| 65 to 74 Years | 553 (21.1%) | 19 (3.4%) |
| 75 Years and over | 70 (3.3%) | 0 (0.0%) |
| Total | 19,196 (63.2%) | 1,152 (6.0%) |
Employment Status by Educational Attainment in La Puente
According to labor force statistics for La Puente, 76.5% of individuals (15,871) out of the total population between 25 and 64 years of age (20,746) are in the labor force, with 5.0% or 794 of them being unemployed. The group with the highest labor force participation rate are those with the educational attainment of bachelor's degree or higher, with 91.7% or 2,348 individuals in the labor force. Within the labor force, individuals with less than high school education have the highest percentage of unemployment, with 6.1% or 240 of them being unemployed.
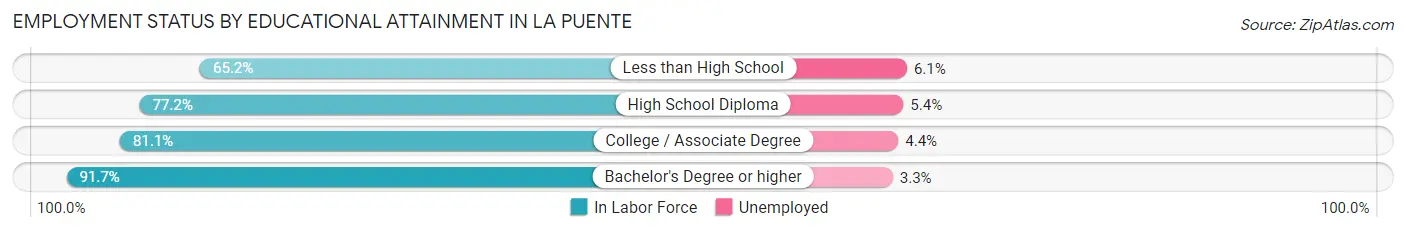
| Educational Attainment | In Labor Force | Unemployed |
| Less than High School | 3,930 (65.2%) | 368 (6.1%) |
| High School Diploma | 5,210 (77.2%) | 364 (5.4%) |
| College / Associate Degree | 4,388 (81.1%) | 238 (4.4%) |
| Bachelor's Degree or higher | 2,348 (91.7%) | 84 (3.3%) |
| Total | 15,871 (76.5%) | 1,037 (5.0%) |
Employment Occupations by Sex in La Puente
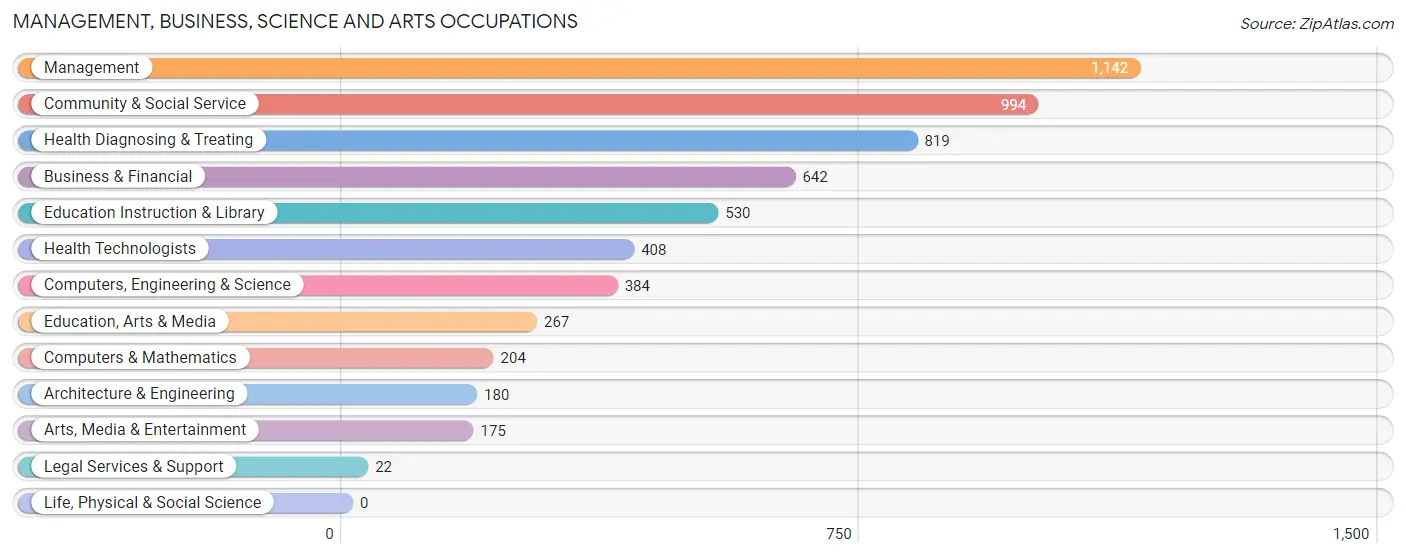
Management, Business, Science and Arts Occupations
The most common Management, Business, Science and Arts occupations in La Puente are Management (1,142 | 6.4%), Community & Social Service (994 | 5.5%), Health Diagnosing & Treating (819 | 4.5%), Business & Financial (642 | 3.6%), and Education Instruction & Library (530 | 2.9%).
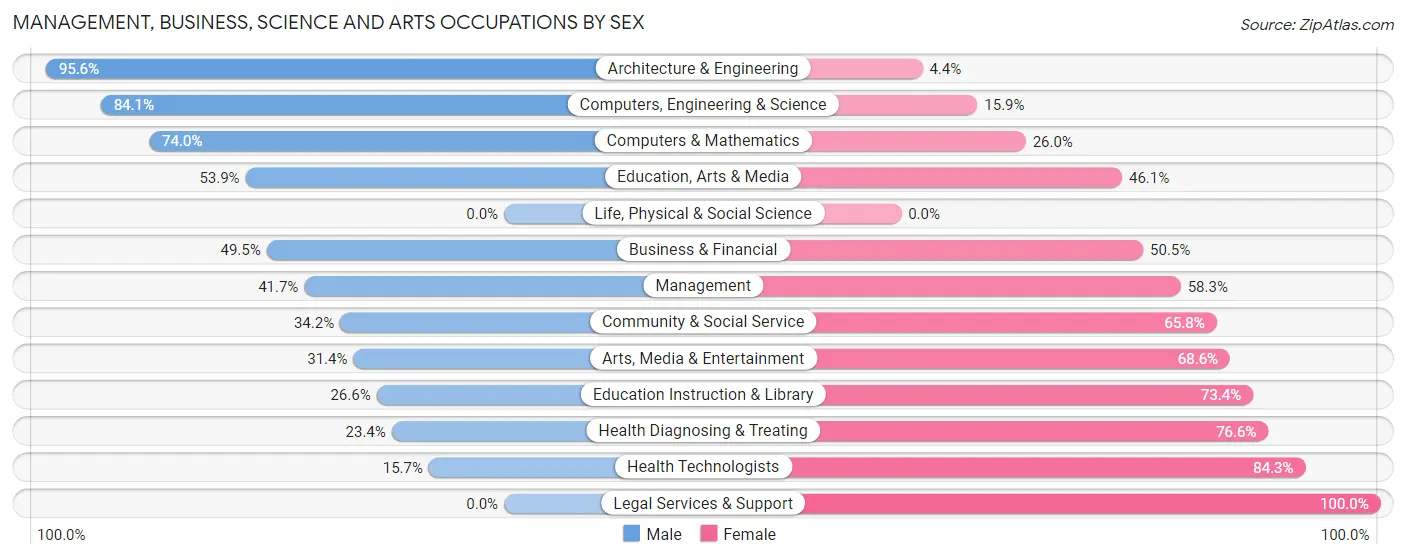
Management, Business, Science and Arts Occupations by Sex
Within the Management, Business, Science and Arts occupations in La Puente, the most male-oriented occupations are Architecture & Engineering (95.6%), Computers, Engineering & Science (84.1%), and Computers & Mathematics (74.0%), while the most female-oriented occupations are Legal Services & Support (100.0%), Health Technologists (84.3%), and Health Diagnosing & Treating (76.6%).
| Occupation | Male | Female |
| Management | 476 (41.7%) | 666 (58.3%) |
| Business & Financial | 318 (49.5%) | 324 (50.5%) |
| Computers, Engineering & Science | 323 (84.1%) | 61 (15.9%) |
| Computers & Mathematics | 151 (74.0%) | 53 (26.0%) |
| Architecture & Engineering | 172 (95.6%) | 8 (4.4%) |
| Life, Physical & Social Science | 0 (0.0%) | 0 (0.0%) |
| Community & Social Service | 340 (34.2%) | 654 (65.8%) |
| Education, Arts & Media | 144 (53.9%) | 123 (46.1%) |
| Legal Services & Support | 0 (0.0%) | 22 (100.0%) |
| Education Instruction & Library | 141 (26.6%) | 389 (73.4%) |
| Arts, Media & Entertainment | 55 (31.4%) | 120 (68.6%) |
| Health Diagnosing & Treating | 192 (23.4%) | 627 (76.6%) |
| Health Technologists | 64 (15.7%) | 344 (84.3%) |
| Total (Category) | 1,649 (41.4%) | 2,332 (58.6%) |
| Total (Overall) | 10,192 (56.7%) | 7,795 (43.3%) |
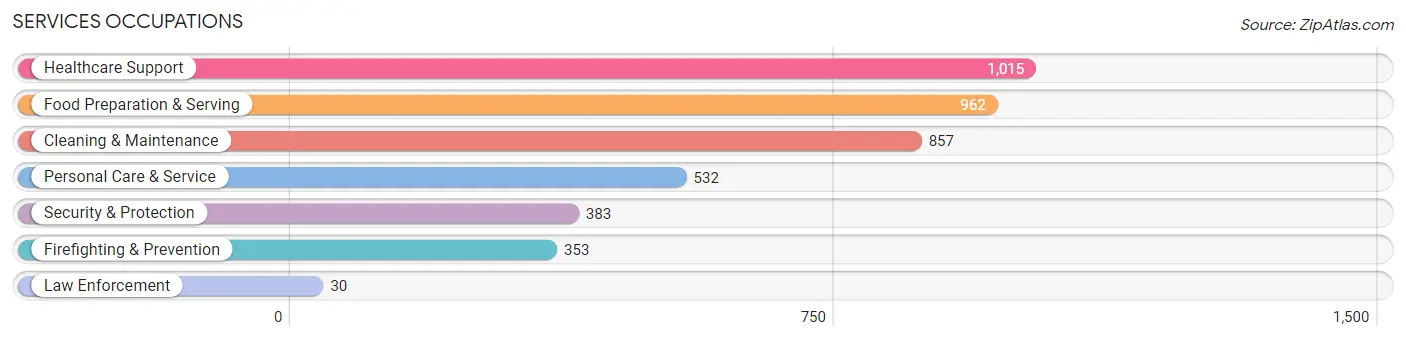
Services Occupations
The most common Services occupations in La Puente are Healthcare Support (1,015 | 5.6%), Food Preparation & Serving (962 | 5.3%), Cleaning & Maintenance (857 | 4.8%), Personal Care & Service (532 | 3.0%), and Security & Protection (383 | 2.1%).
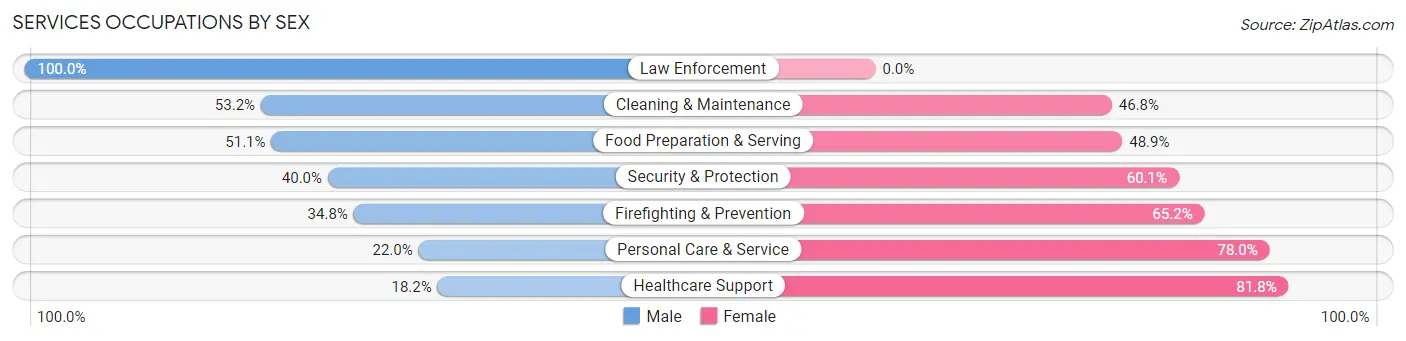
Services Occupations by Sex
Within the Services occupations in La Puente, the most male-oriented occupations are Law Enforcement (100.0%), Cleaning & Maintenance (53.2%), and Food Preparation & Serving (51.1%), while the most female-oriented occupations are Healthcare Support (81.8%), Personal Care & Service (78.0%), and Firefighting & Prevention (65.2%).
| Occupation | Male | Female |
| Healthcare Support | 185 (18.2%) | 830 (81.8%) |
| Security & Protection | 153 (40.0%) | 230 (60.1%) |
| Firefighting & Prevention | 123 (34.8%) | 230 (65.2%) |
| Law Enforcement | 30 (100.0%) | 0 (0.0%) |
| Food Preparation & Serving | 492 (51.1%) | 470 (48.9%) |
| Cleaning & Maintenance | 456 (53.2%) | 401 (46.8%) |
| Personal Care & Service | 117 (22.0%) | 415 (78.0%) |
| Total (Category) | 1,403 (37.4%) | 2,346 (62.6%) |
| Total (Overall) | 10,192 (56.7%) | 7,795 (43.3%) |
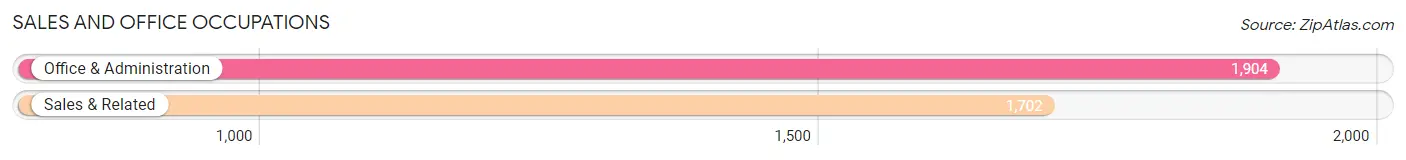
Sales and Office Occupations
The most common Sales and Office occupations in La Puente are Office & Administration (1,904 | 10.6%), and Sales & Related (1,702 | 9.5%).
Sales and Office Occupations by Sex
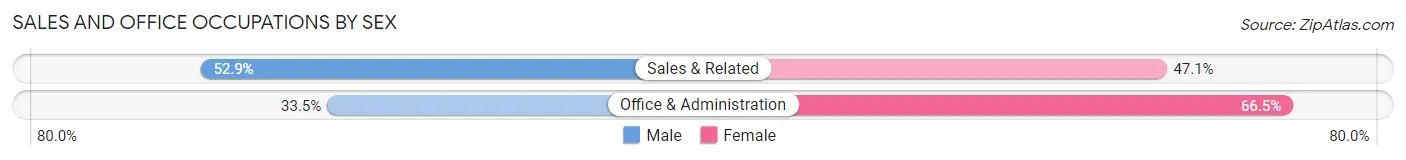
| Occupation | Male | Female |
| Sales & Related | 901 (52.9%) | 801 (47.1%) |
| Office & Administration | 637 (33.5%) | 1,267 (66.5%) |
| Total (Category) | 1,538 (42.6%) | 2,068 (57.4%) |
| Total (Overall) | 10,192 (56.7%) | 7,795 (43.3%) |
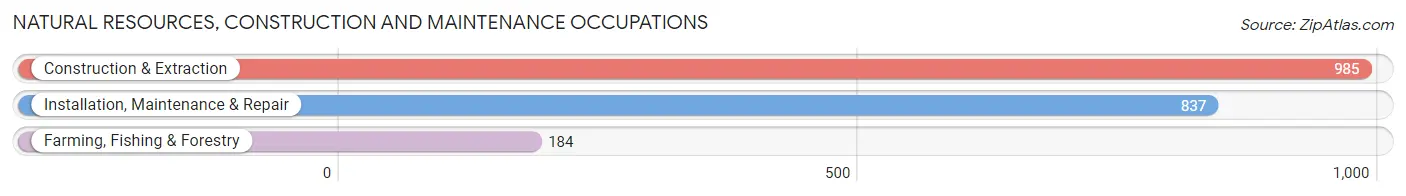
Natural Resources, Construction and Maintenance Occupations
The most common Natural Resources, Construction and Maintenance occupations in La Puente are Construction & Extraction (985 | 5.5%), Installation, Maintenance & Repair (837 | 4.6%), and Farming, Fishing & Forestry (184 | 1.0%).
Natural Resources, Construction and Maintenance Occupations by Sex
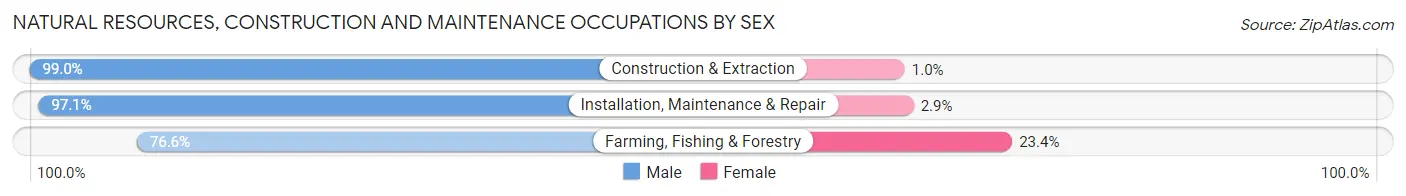
| Occupation | Male | Female |
| Farming, Fishing & Forestry | 141 (76.6%) | 43 (23.4%) |
| Construction & Extraction | 975 (99.0%) | 10 (1.0%) |
| Installation, Maintenance & Repair | 813 (97.1%) | 24 (2.9%) |
| Total (Category) | 1,929 (96.2%) | 77 (3.8%) |
| Total (Overall) | 10,192 (56.7%) | 7,795 (43.3%) |
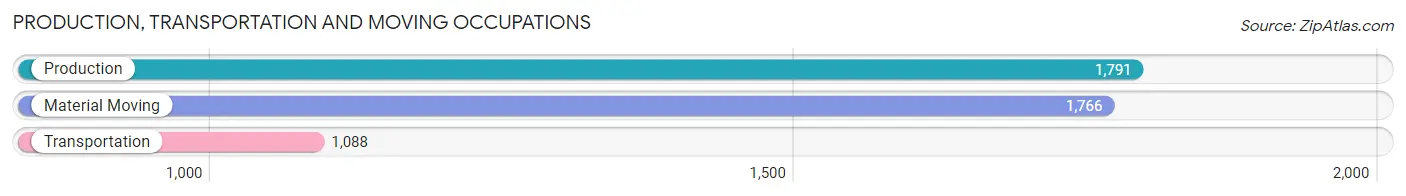
Production, Transportation and Moving Occupations
The most common Production, Transportation and Moving occupations in La Puente are Production (1,791 | 10.0%), Material Moving (1,766 | 9.8%), and Transportation (1,088 | 6.0%).
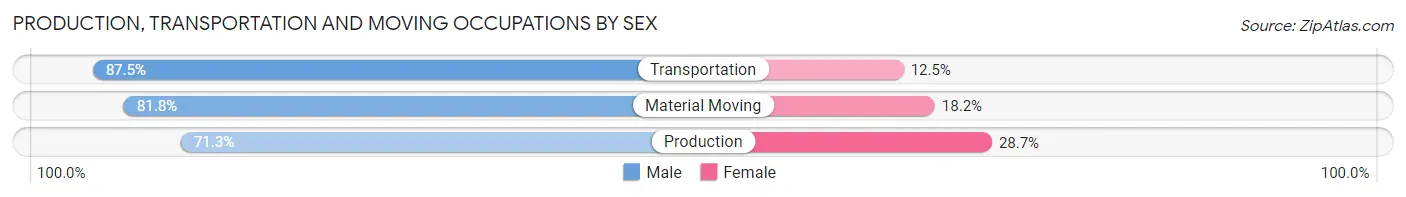
Production, Transportation and Moving Occupations by Sex
| Occupation | Male | Female |
| Production | 1,277 (71.3%) | 514 (28.7%) |
| Transportation | 952 (87.5%) | 136 (12.5%) |
| Material Moving | 1,444 (81.8%) | 322 (18.2%) |
| Total (Category) | 3,673 (79.1%) | 972 (20.9%) |
| Total (Overall) | 10,192 (56.7%) | 7,795 (43.3%) |
Employment Industries by Sex in La Puente
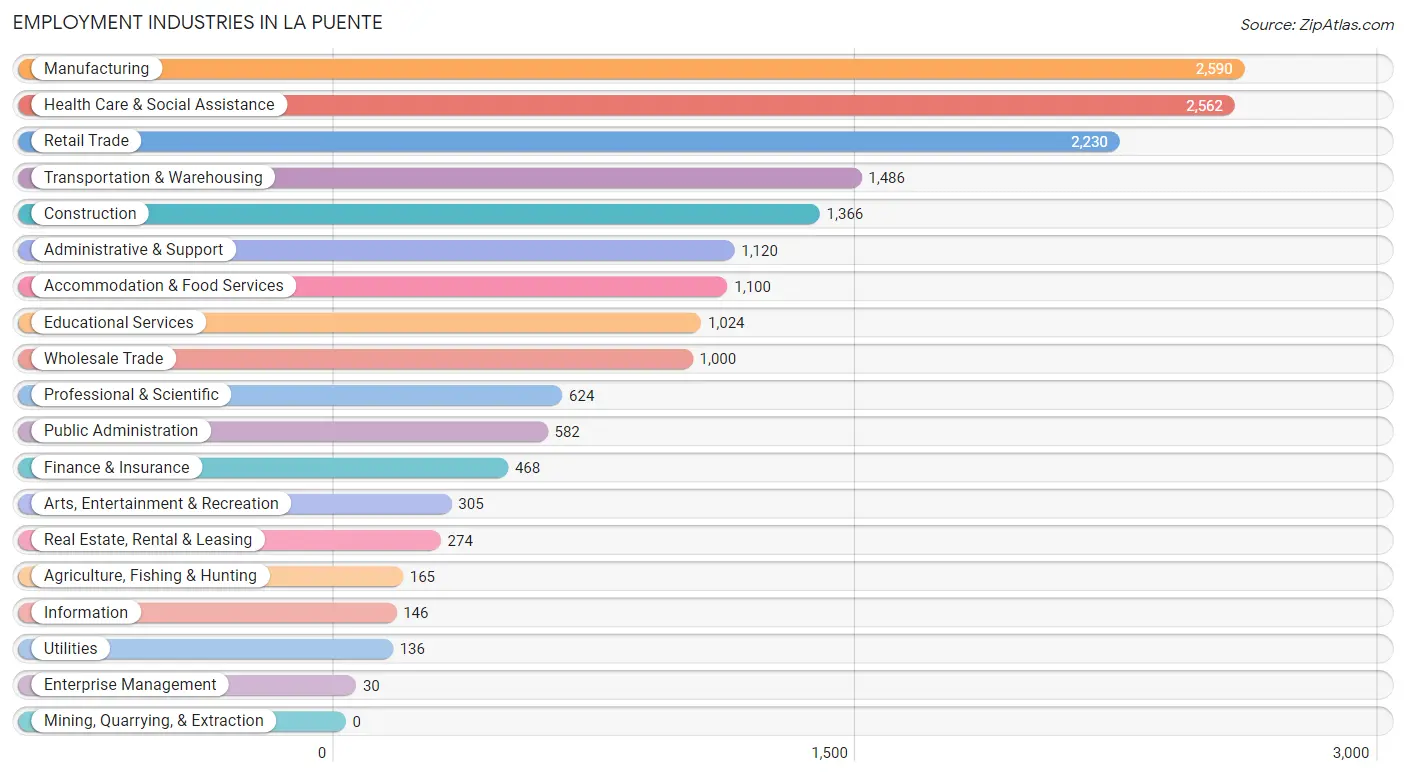
Employment Industries in La Puente
The major employment industries in La Puente include Manufacturing (2,590 | 14.4%), Health Care & Social Assistance (2,562 | 14.2%), Retail Trade (2,230 | 12.4%), Transportation & Warehousing (1,486 | 8.3%), and Construction (1,366 | 7.6%).
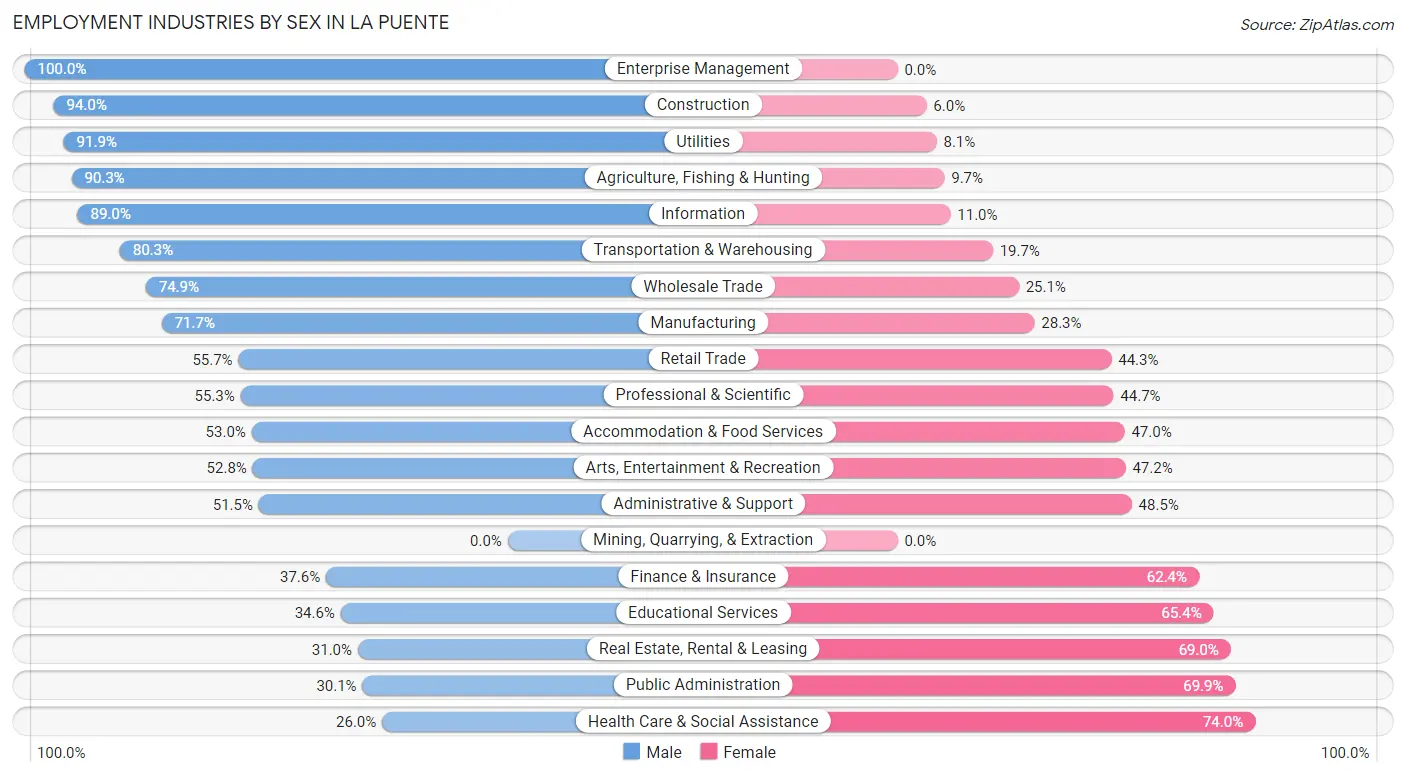
Employment Industries by Sex in La Puente
The La Puente industries that see more men than women are Enterprise Management (100.0%), Construction (94.0%), and Utilities (91.9%), whereas the industries that tend to have a higher number of women are Health Care & Social Assistance (74.0%), Public Administration (69.9%), and Real Estate, Rental & Leasing (69.0%).
| Industry | Male | Female |
| Agriculture, Fishing & Hunting | 149 (90.3%) | 16 (9.7%) |
| Mining, Quarrying, & Extraction | 0 (0.0%) | 0 (0.0%) |
| Construction | 1,284 (94.0%) | 82 (6.0%) |
| Manufacturing | 1,856 (71.7%) | 734 (28.3%) |
| Wholesale Trade | 749 (74.9%) | 251 (25.1%) |
| Retail Trade | 1,243 (55.7%) | 987 (44.3%) |
| Transportation & Warehousing | 1,193 (80.3%) | 293 (19.7%) |
| Utilities | 125 (91.9%) | 11 (8.1%) |
| Information | 130 (89.0%) | 16 (11.0%) |
| Finance & Insurance | 176 (37.6%) | 292 (62.4%) |
| Real Estate, Rental & Leasing | 85 (31.0%) | 189 (69.0%) |
| Professional & Scientific | 345 (55.3%) | 279 (44.7%) |
| Enterprise Management | 30 (100.0%) | 0 (0.0%) |
| Administrative & Support | 577 (51.5%) | 543 (48.5%) |
| Educational Services | 354 (34.6%) | 670 (65.4%) |
| Health Care & Social Assistance | 666 (26.0%) | 1,896 (74.0%) |
| Arts, Entertainment & Recreation | 161 (52.8%) | 144 (47.2%) |
| Accommodation & Food Services | 583 (53.0%) | 517 (47.0%) |
| Public Administration | 175 (30.1%) | 407 (69.9%) |
| Total | 10,192 (56.7%) | 7,795 (43.3%) |
Education in La Puente
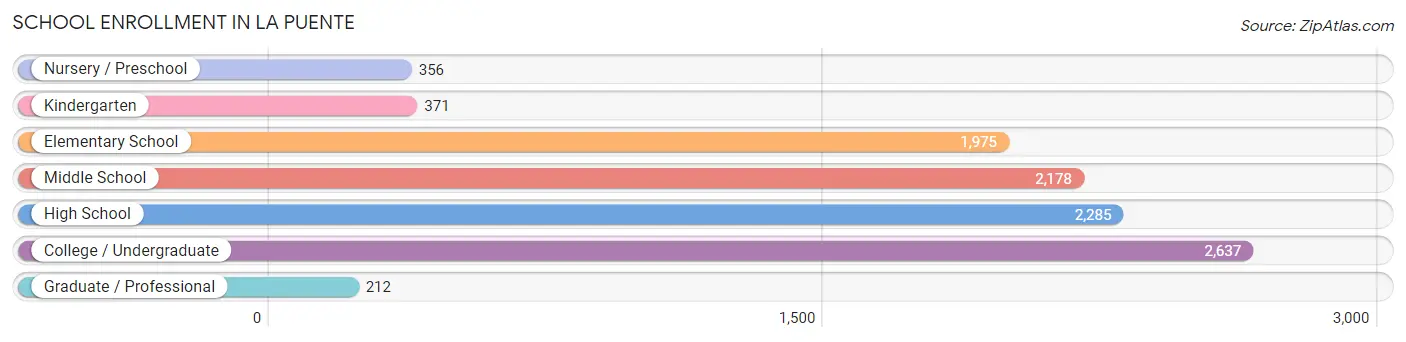
School Enrollment in La Puente
The most common levels of schooling among the 10,014 students in La Puente are college / undergraduate (2,637 | 26.3%), high school (2,285 | 22.8%), and middle school (2,178 | 21.7%).
| School Level | # Students | % Students |
| Nursery / Preschool | 356 | 3.6% |
| Kindergarten | 371 | 3.7% |
| Elementary School | 1,975 | 19.7% |
| Middle School | 2,178 | 21.7% |
| High School | 2,285 | 22.8% |
| College / Undergraduate | 2,637 | 26.3% |
| Graduate / Professional | 212 | 2.1% |
| Total | 10,014 | 100.0% |
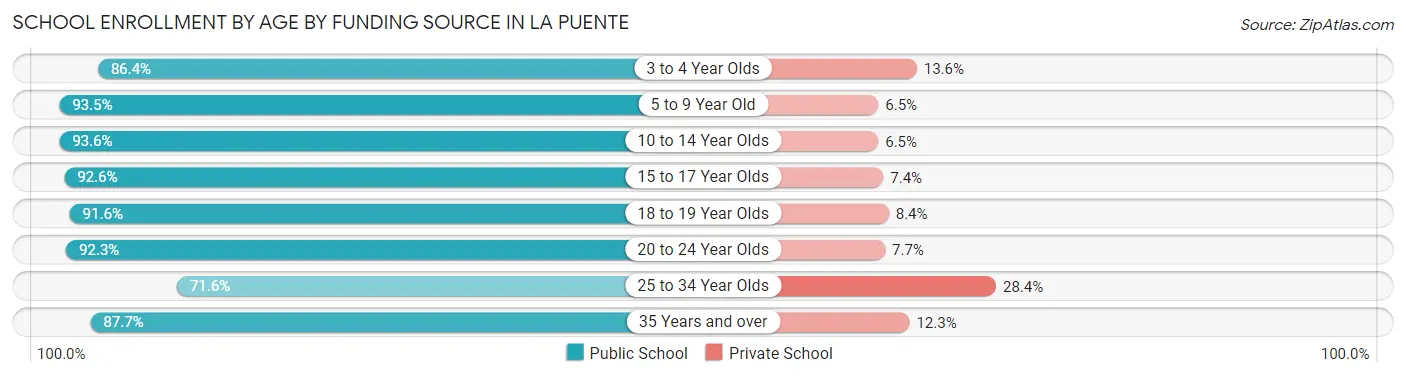
School Enrollment by Age by Funding Source in La Puente
Out of a total of 10,014 students who are enrolled in schools in La Puente, 911 (9.1%) attend a private institution, while the remaining 9,103 (90.9%) are enrolled in public schools. The age group of 25 to 34 year olds has the highest likelihood of being enrolled in private schools, with 233 (28.4% in the age bracket) enrolled. Conversely, the age group of 10 to 14 year olds has the lowest likelihood of being enrolled in a private school, with 2,525 (93.5% in the age bracket) attending a public institution.
| Age Bracket | Public School | Private School |
| 3 to 4 Year Olds | 203 (86.4%) | 32 (13.6%) |
| 5 to 9 Year Old | 2,085 (93.5%) | 144 (6.5%) |
| 10 to 14 Year Olds | 2,525 (93.5%) | 174 (6.5%) |
| 15 to 17 Year Olds | 1,404 (92.6%) | 112 (7.4%) |
| 18 to 19 Year Olds | 698 (91.6%) | 64 (8.4%) |
| 20 to 24 Year Olds | 1,233 (92.3%) | 103 (7.7%) |
| 25 to 34 Year Olds | 588 (71.6%) | 233 (28.4%) |
| 35 Years and over | 365 (87.7%) | 51 (12.3%) |
| Total | 9,103 (90.9%) | 911 (9.1%) |
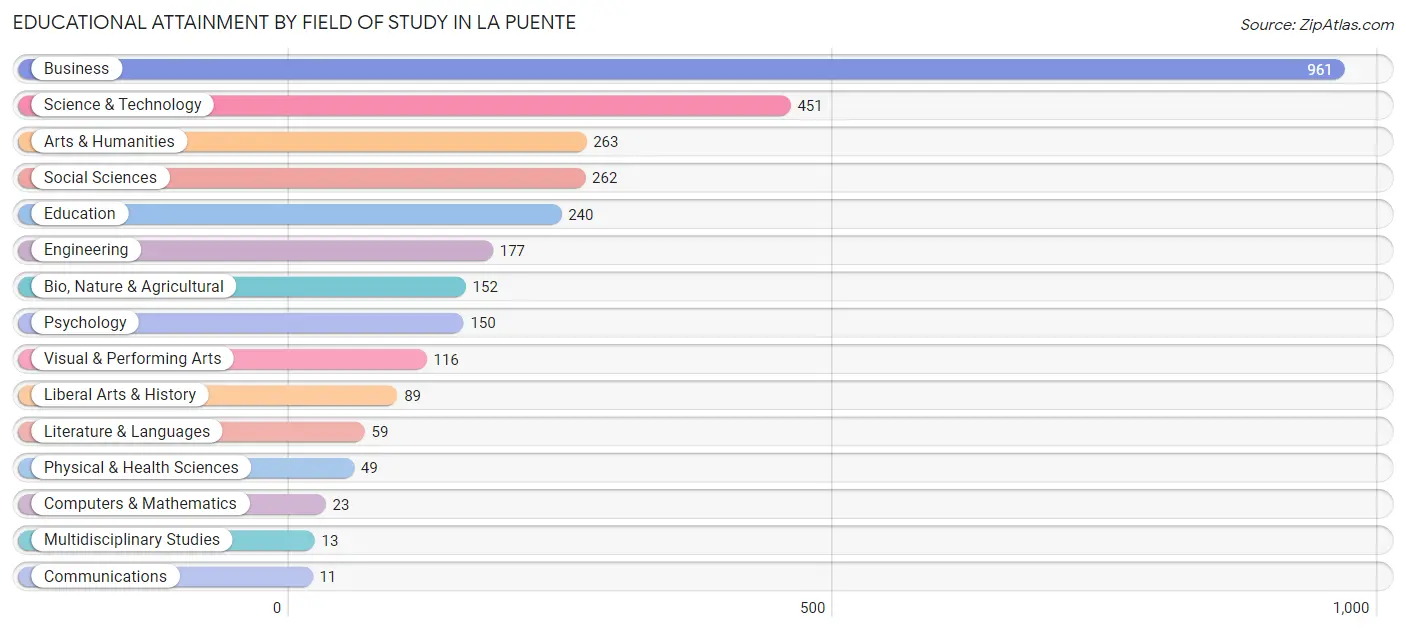
Educational Attainment by Field of Study in La Puente
Business (961 | 31.9%), science & technology (451 | 14.9%), arts & humanities (263 | 8.7%), social sciences (262 | 8.7%), and education (240 | 8.0%) are the most common fields of study among 3,016 individuals in La Puente who have obtained a bachelor's degree or higher.
| Field of Study | # Graduates | % Graduates |
| Computers & Mathematics | 23 | 0.8% |
| Bio, Nature & Agricultural | 152 | 5.0% |
| Physical & Health Sciences | 49 | 1.6% |
| Psychology | 150 | 5.0% |
| Social Sciences | 262 | 8.7% |
| Engineering | 177 | 5.9% |
| Multidisciplinary Studies | 13 | 0.4% |
| Science & Technology | 451 | 14.9% |
| Business | 961 | 31.9% |
| Education | 240 | 8.0% |
| Literature & Languages | 59 | 2.0% |
| Liberal Arts & History | 89 | 2.9% |
| Visual & Performing Arts | 116 | 3.8% |
| Communications | 11 | 0.4% |
| Arts & Humanities | 263 | 8.7% |
| Total | 3,016 | 100.0% |
Transportation & Commute in La Puente
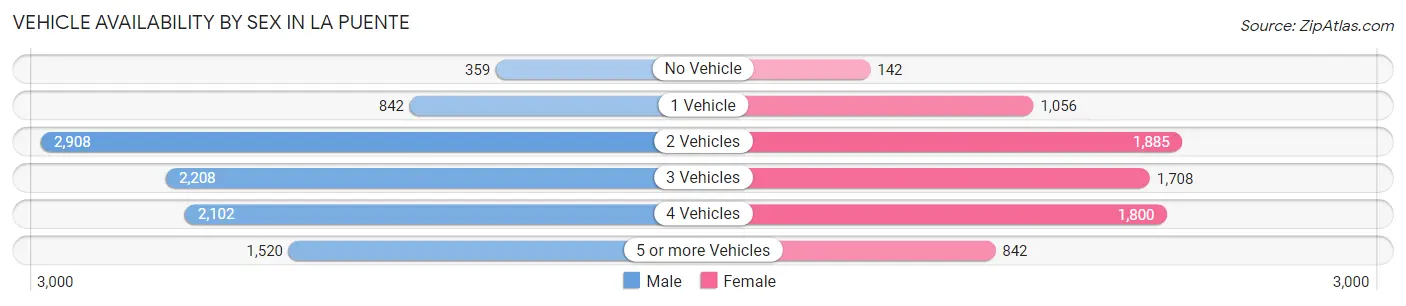
Vehicle Availability by Sex in La Puente
The most prevalent vehicle ownership categories in La Puente are males with 2 vehicles (2,908, accounting for 29.3%) and females with 2 vehicles (1,885, making up 39.1%).
| Vehicles Available | Male | Female |
| No Vehicle | 359 (3.6%) | 142 (1.9%) |
| 1 Vehicle | 842 (8.5%) | 1,056 (14.2%) |
| 2 Vehicles | 2,908 (29.3%) | 1,885 (25.4%) |
| 3 Vehicles | 2,208 (22.2%) | 1,708 (23.0%) |
| 4 Vehicles | 2,102 (21.1%) | 1,800 (24.2%) |
| 5 or more Vehicles | 1,520 (15.3%) | 842 (11.3%) |
| Total | 9,939 (100.0%) | 7,433 (100.0%) |
Commute Time in La Puente
The most frequently occuring commute durations in La Puente are 30 to 34 minutes (3,181 commuters, 19.1%), 15 to 19 minutes (2,227 commuters, 13.4%), and 20 to 24 minutes (2,102 commuters, 12.6%).
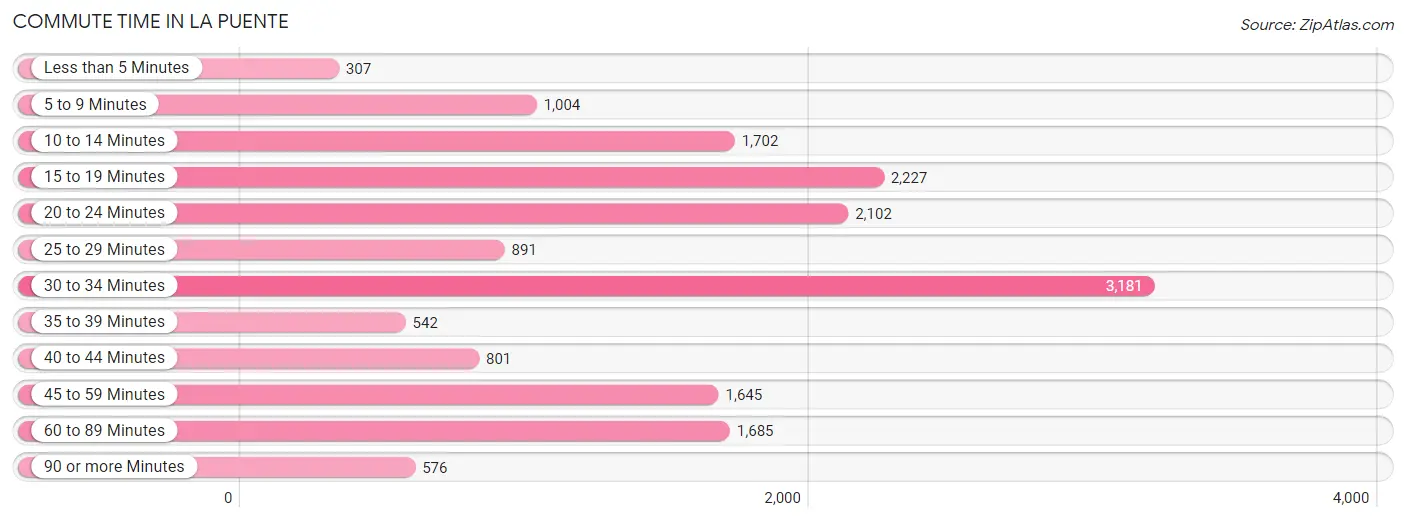
| Commute Time | # Commuters | % Commuters |
| Less than 5 Minutes | 307 | 1.8% |
| 5 to 9 Minutes | 1,004 | 6.0% |
| 10 to 14 Minutes | 1,702 | 10.2% |
| 15 to 19 Minutes | 2,227 | 13.4% |
| 20 to 24 Minutes | 2,102 | 12.6% |
| 25 to 29 Minutes | 891 | 5.3% |
| 30 to 34 Minutes | 3,181 | 19.1% |
| 35 to 39 Minutes | 542 | 3.3% |
| 40 to 44 Minutes | 801 | 4.8% |
| 45 to 59 Minutes | 1,645 | 9.9% |
| 60 to 89 Minutes | 1,685 | 10.1% |
| 90 or more Minutes | 576 | 3.5% |
Commute Time by Sex in La Puente
The most common commute times in La Puente are 30 to 34 minutes (1,825 commuters, 19.0%) for males and 30 to 34 minutes (1,356 commuters, 19.3%) for females.
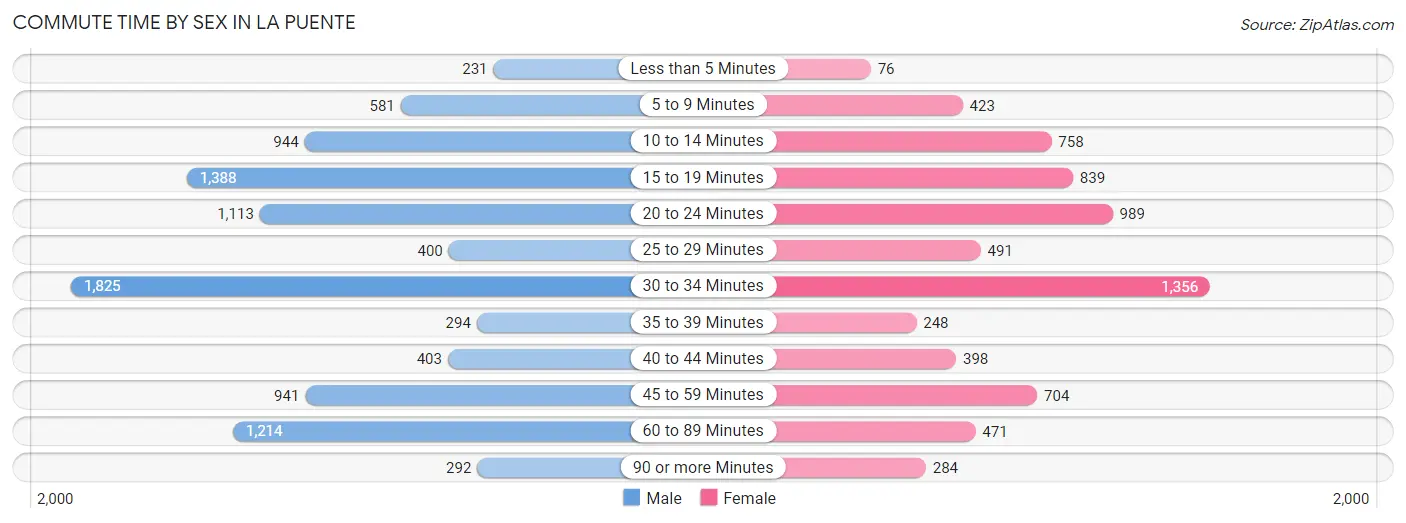
| Commute Time | Male | Female |
| Less than 5 Minutes | 231 (2.4%) | 76 (1.1%) |
| 5 to 9 Minutes | 581 (6.0%) | 423 (6.0%) |
| 10 to 14 Minutes | 944 (9.8%) | 758 (10.8%) |
| 15 to 19 Minutes | 1,388 (14.4%) | 839 (11.9%) |
| 20 to 24 Minutes | 1,113 (11.6%) | 989 (14.1%) |
| 25 to 29 Minutes | 400 (4.2%) | 491 (7.0%) |
| 30 to 34 Minutes | 1,825 (19.0%) | 1,356 (19.3%) |
| 35 to 39 Minutes | 294 (3.0%) | 248 (3.5%) |
| 40 to 44 Minutes | 403 (4.2%) | 398 (5.7%) |
| 45 to 59 Minutes | 941 (9.8%) | 704 (10.0%) |
| 60 to 89 Minutes | 1,214 (12.6%) | 471 (6.7%) |
| 90 or more Minutes | 292 (3.0%) | 284 (4.0%) |
Time of Departure to Work by Sex in La Puente
The most frequent times of departure to work in La Puente are 12:00 AM to 4:59 AM (1,644, 17.1%) for males and 7:00 AM to 7:29 AM (994, 14.1%) for females.
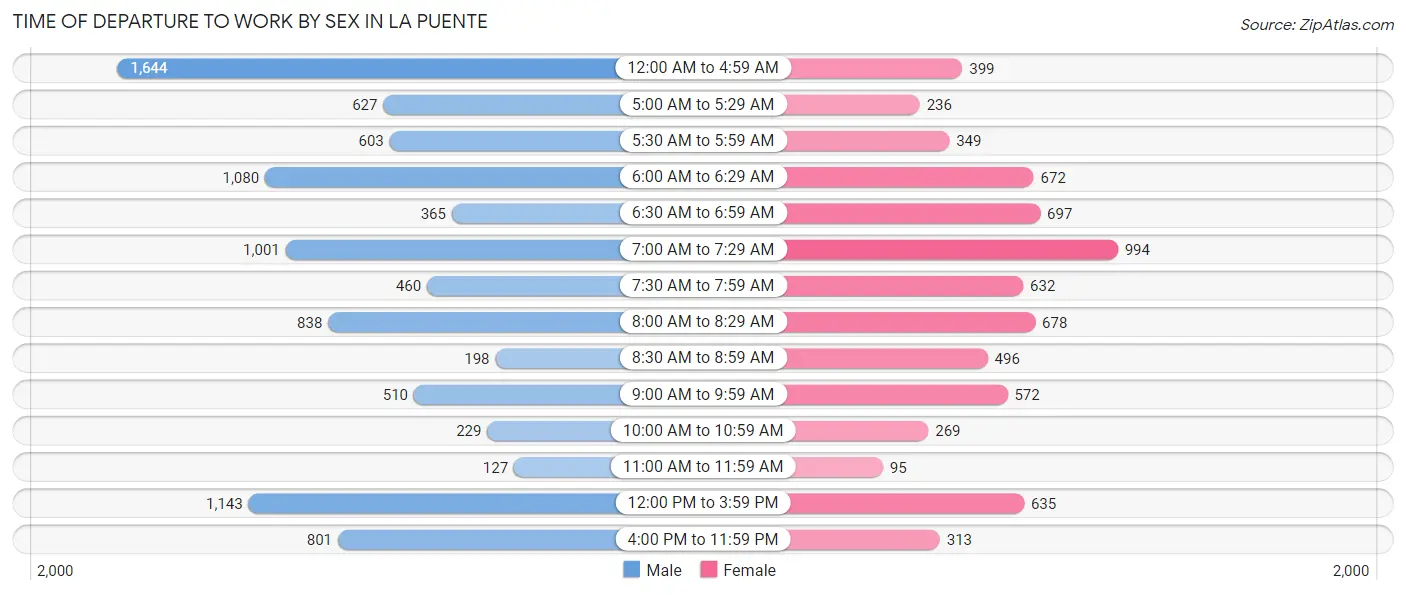
| Time of Departure | Male | Female |
| 12:00 AM to 4:59 AM | 1,644 (17.1%) | 399 (5.7%) |
| 5:00 AM to 5:29 AM | 627 (6.5%) | 236 (3.4%) |
| 5:30 AM to 5:59 AM | 603 (6.3%) | 349 (5.0%) |
| 6:00 AM to 6:29 AM | 1,080 (11.2%) | 672 (9.6%) |
| 6:30 AM to 6:59 AM | 365 (3.8%) | 697 (9.9%) |
| 7:00 AM to 7:29 AM | 1,001 (10.4%) | 994 (14.1%) |
| 7:30 AM to 7:59 AM | 460 (4.8%) | 632 (9.0%) |
| 8:00 AM to 8:29 AM | 838 (8.7%) | 678 (9.6%) |
| 8:30 AM to 8:59 AM | 198 (2.1%) | 496 (7.0%) |
| 9:00 AM to 9:59 AM | 510 (5.3%) | 572 (8.1%) |
| 10:00 AM to 10:59 AM | 229 (2.4%) | 269 (3.8%) |
| 11:00 AM to 11:59 AM | 127 (1.3%) | 95 (1.3%) |
| 12:00 PM to 3:59 PM | 1,143 (11.9%) | 635 (9.0%) |
| 4:00 PM to 11:59 PM | 801 (8.3%) | 313 (4.4%) |
| Total | 9,626 (100.0%) | 7,037 (100.0%) |
Housing Occupancy in La Puente
Occupancy by Ownership in La Puente
Of the total 9,625 dwellings in La Puente, owner-occupied units account for 5,799 (60.3%), while renter-occupied units make up 3,826 (39.8%).
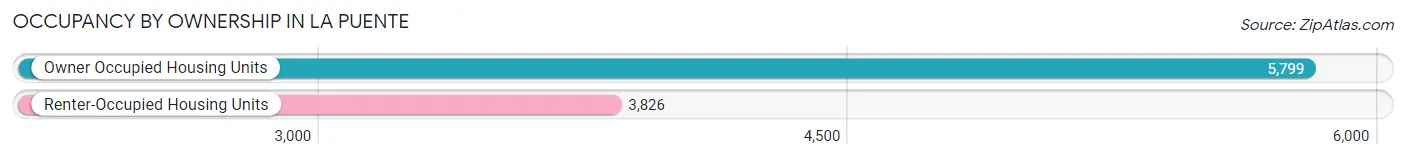
| Occupancy | # Housing Units | % Housing Units |
| Owner Occupied Housing Units | 5,799 | 60.3% |
| Renter-Occupied Housing Units | 3,826 | 39.8% |
| Total Occupied Housing Units | 9,625 | 100.0% |
Occupancy by Household Size in La Puente
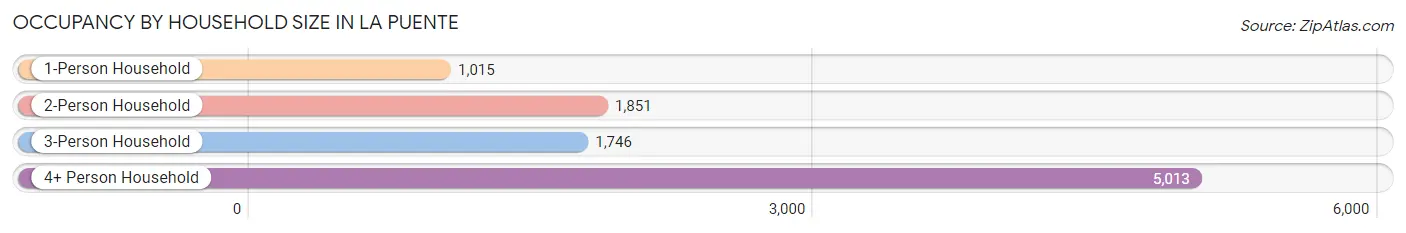
| Household Size | # Housing Units | % Housing Units |
| 1-Person Household | 1,015 | 10.5% |
| 2-Person Household | 1,851 | 19.2% |
| 3-Person Household | 1,746 | 18.1% |
| 4+ Person Household | 5,013 | 52.1% |
| Total Housing Units | 9,625 | 100.0% |
Occupancy by Ownership by Household Size in La Puente
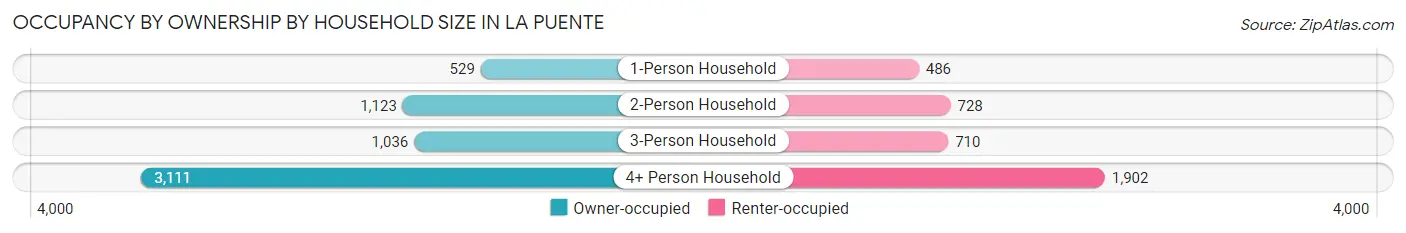
| Household Size | Owner-occupied | Renter-occupied |
| 1-Person Household | 529 (52.1%) | 486 (47.9%) |
| 2-Person Household | 1,123 (60.7%) | 728 (39.3%) |
| 3-Person Household | 1,036 (59.3%) | 710 (40.7%) |
| 4+ Person Household | 3,111 (62.1%) | 1,902 (37.9%) |
| Total Housing Units | 5,799 (60.3%) | 3,826 (39.8%) |
Occupancy by Educational Attainment in La Puente
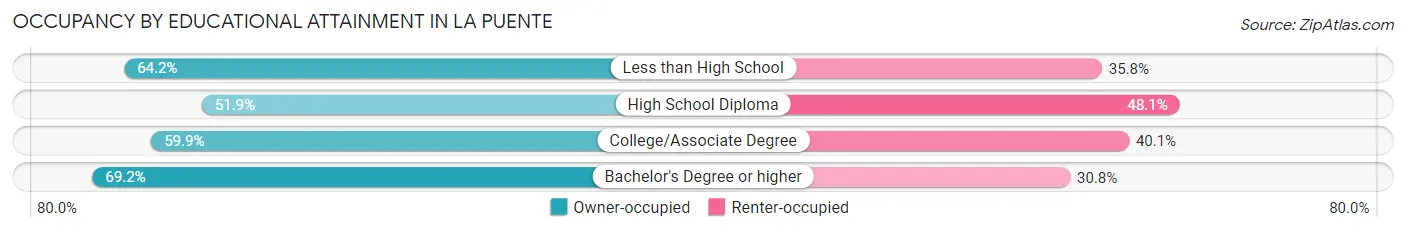
| Household Size | Owner-occupied | Renter-occupied |
| Less than High School | 2,028 (64.2%) | 1,131 (35.8%) |
| High School Diploma | 1,399 (51.9%) | 1,297 (48.1%) |
| College/Associate Degree | 1,530 (59.9%) | 1,024 (40.1%) |
| Bachelor's Degree or higher | 842 (69.2%) | 374 (30.8%) |
Occupancy by Age of Householder in La Puente
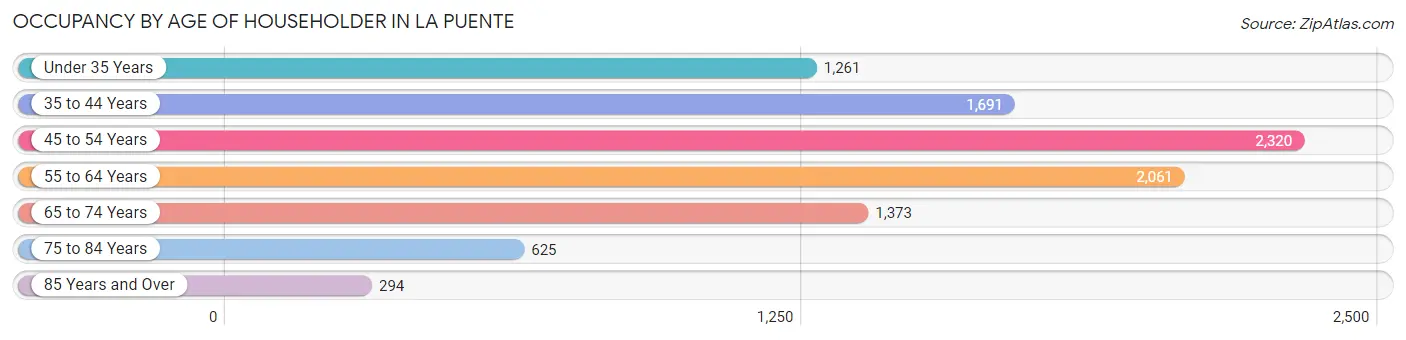
| Age Bracket | # Households | % Households |
| Under 35 Years | 1,261 | 13.1% |
| 35 to 44 Years | 1,691 | 17.6% |
| 45 to 54 Years | 2,320 | 24.1% |
| 55 to 64 Years | 2,061 | 21.4% |
| 65 to 74 Years | 1,373 | 14.3% |
| 75 to 84 Years | 625 | 6.5% |
| 85 Years and Over | 294 | 3.0% |
| Total | 9,625 | 100.0% |
Housing Finances in La Puente
Median Income by Occupancy in La Puente
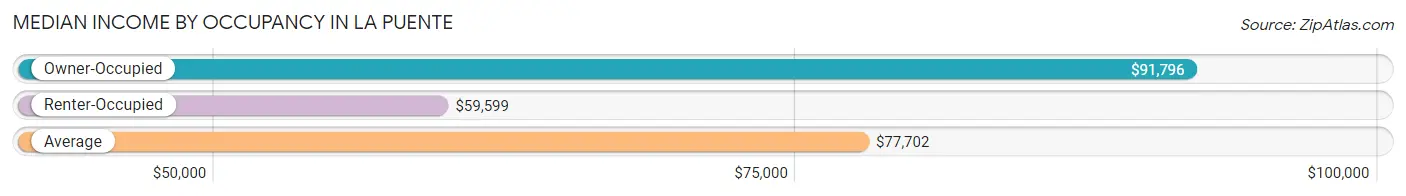
| Occupancy Type | # Households | Median Income |
| Owner-Occupied | 5,799 (60.3%) | $91,796 |
| Renter-Occupied | 3,826 (39.8%) | $59,599 |
| Average | 9,625 (100.0%) | $77,702 |
Occupancy by Householder Income Bracket in La Puente
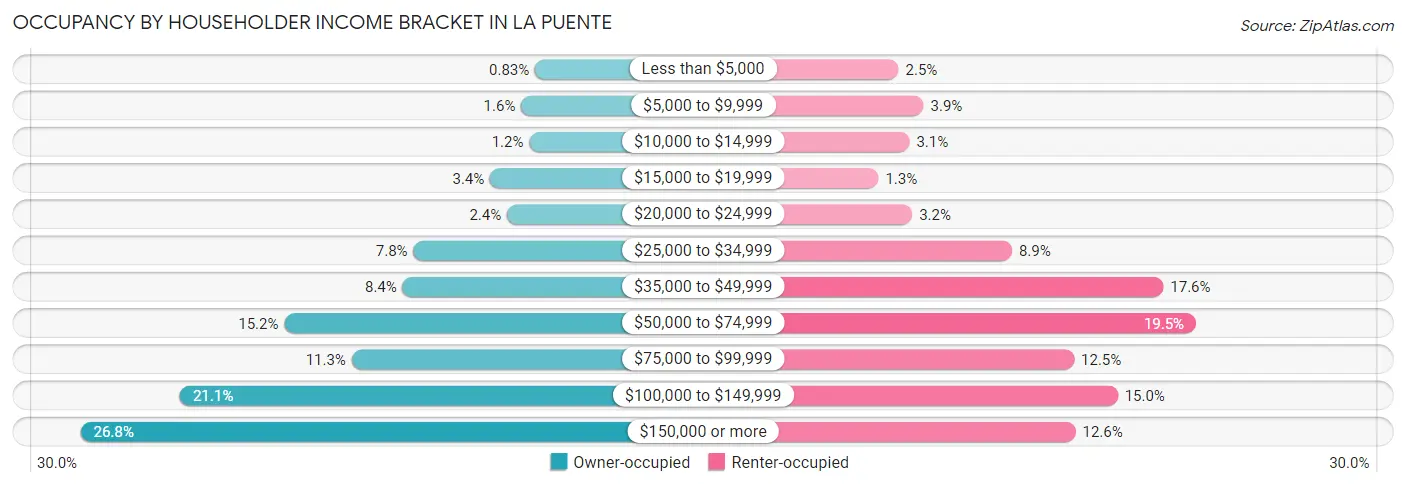
| Income Bracket | Owner-occupied | Renter-occupied |
| Less than $5,000 | 48 (0.8%) | 94 (2.5%) |
| $5,000 to $9,999 | 94 (1.6%) | 149 (3.9%) |
| $10,000 to $14,999 | 67 (1.2%) | 118 (3.1%) |
| $15,000 to $19,999 | 197 (3.4%) | 50 (1.3%) |
| $20,000 to $24,999 | 141 (2.4%) | 124 (3.2%) |
| $25,000 to $34,999 | 451 (7.8%) | 342 (8.9%) |
| $35,000 to $49,999 | 487 (8.4%) | 673 (17.6%) |
| $50,000 to $74,999 | 879 (15.2%) | 744 (19.5%) |
| $75,000 to $99,999 | 656 (11.3%) | 478 (12.5%) |
| $100,000 to $149,999 | 1,225 (21.1%) | 573 (15.0%) |
| $150,000 or more | 1,554 (26.8%) | 481 (12.6%) |
| Total | 5,799 (100.0%) | 3,826 (100.0%) |
Monthly Housing Cost Tiers in La Puente
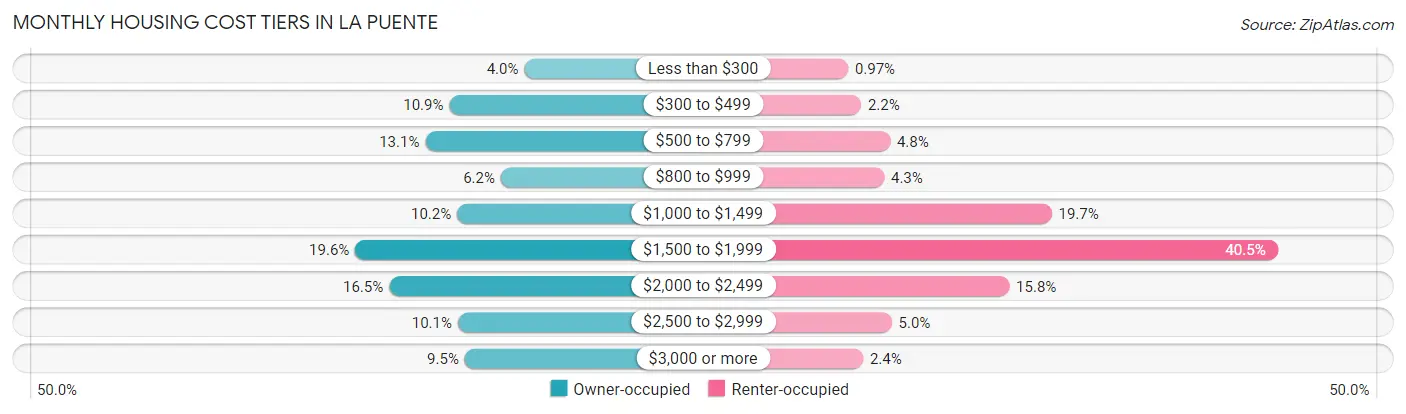
| Monthly Cost | Owner-occupied | Renter-occupied |
| Less than $300 | 232 (4.0%) | 37 (1.0%) |
| $300 to $499 | 632 (10.9%) | 83 (2.2%) |
| $500 to $799 | 761 (13.1%) | 185 (4.8%) |
| $800 to $999 | 357 (6.2%) | 164 (4.3%) |
| $1,000 to $1,499 | 591 (10.2%) | 754 (19.7%) |
| $1,500 to $1,999 | 1,135 (19.6%) | 1,550 (40.5%) |
| $2,000 to $2,499 | 954 (16.5%) | 605 (15.8%) |
| $2,500 to $2,999 | 587 (10.1%) | 191 (5.0%) |
| $3,000 or more | 550 (9.5%) | 90 (2.4%) |
| Total | 5,799 (100.0%) | 3,826 (100.0%) |
Physical Housing Characteristics in La Puente
Housing Structures in La Puente
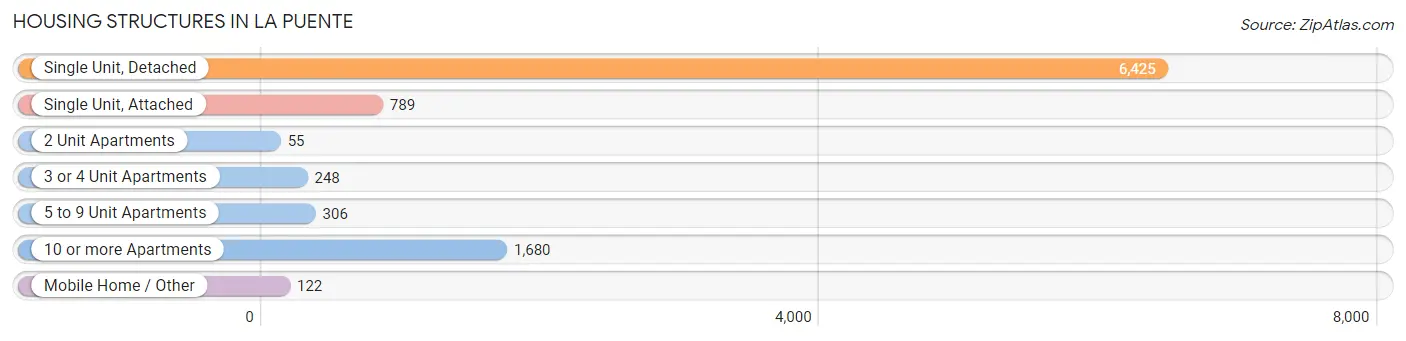
| Structure Type | # Housing Units | % Housing Units |
| Single Unit, Detached | 6,425 | 66.7% |
| Single Unit, Attached | 789 | 8.2% |
| 2 Unit Apartments | 55 | 0.6% |
| 3 or 4 Unit Apartments | 248 | 2.6% |
| 5 to 9 Unit Apartments | 306 | 3.2% |
| 10 or more Apartments | 1,680 | 17.4% |
| Mobile Home / Other | 122 | 1.3% |
| Total | 9,625 | 100.0% |
Housing Structures by Occupancy in La Puente
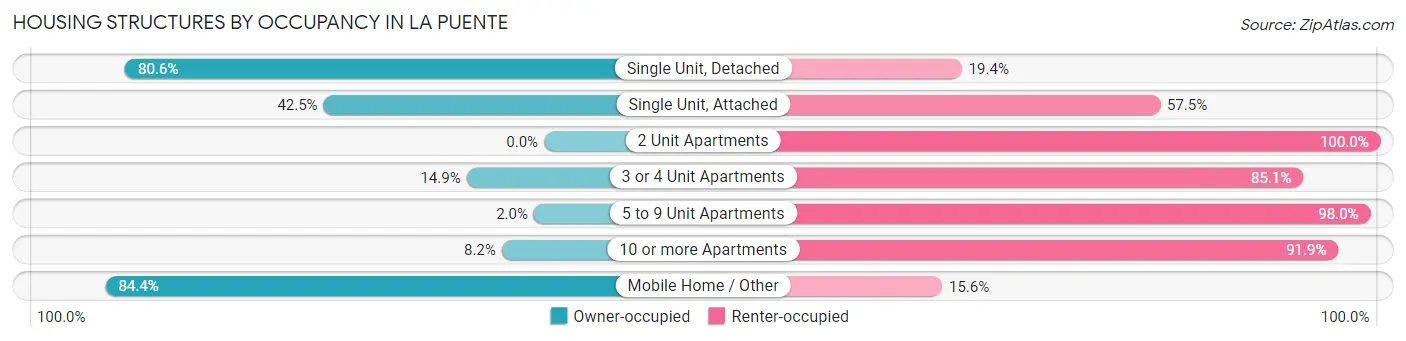
| Structure Type | Owner-occupied | Renter-occupied |
| Single Unit, Detached | 5,181 (80.6%) | 1,244 (19.4%) |
| Single Unit, Attached | 335 (42.5%) | 454 (57.5%) |
| 2 Unit Apartments | 0 (0.0%) | 55 (100.0%) |
| 3 or 4 Unit Apartments | 37 (14.9%) | 211 (85.1%) |
| 5 to 9 Unit Apartments | 6 (2.0%) | 300 (98.0%) |
| 10 or more Apartments | 137 (8.2%) | 1,543 (91.8%) |
| Mobile Home / Other | 103 (84.4%) | 19 (15.6%) |
| Total | 5,799 (60.3%) | 3,826 (39.8%) |
Housing Structures by Number of Rooms in La Puente
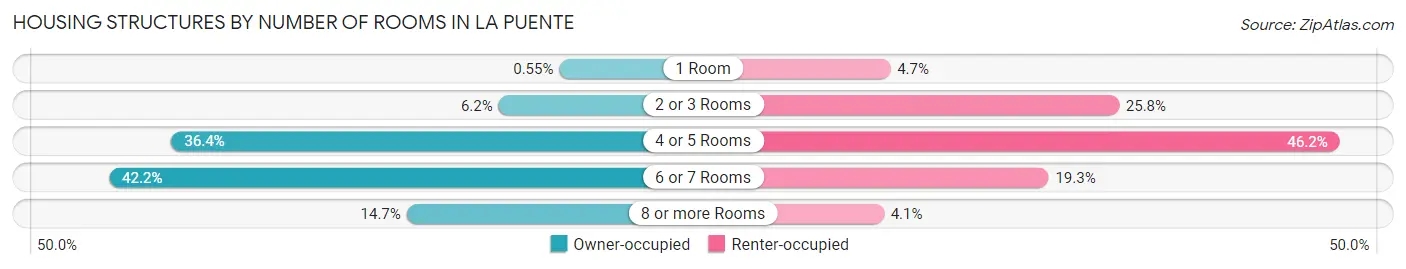
| Number of Rooms | Owner-occupied | Renter-occupied |
| 1 Room | 32 (0.5%) | 178 (4.6%) |
| 2 or 3 Rooms | 358 (6.2%) | 987 (25.8%) |
| 4 or 5 Rooms | 2,112 (36.4%) | 1,768 (46.2%) |
| 6 or 7 Rooms | 2,446 (42.2%) | 738 (19.3%) |
| 8 or more Rooms | 851 (14.7%) | 155 (4.1%) |
| Total | 5,799 (100.0%) | 3,826 (100.0%) |
Housing Structure by Heating Type in La Puente
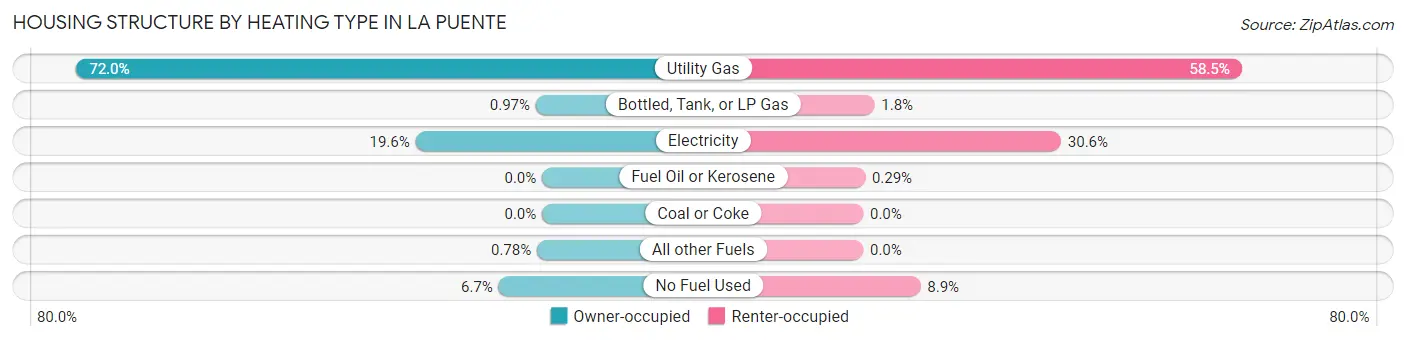
| Heating Type | Owner-occupied | Renter-occupied |
| Utility Gas | 4,175 (72.0%) | 2,239 (58.5%) |
| Bottled, Tank, or LP Gas | 56 (1.0%) | 67 (1.8%) |
| Electricity | 1,134 (19.6%) | 1,170 (30.6%) |
| Fuel Oil or Kerosene | 0 (0.0%) | 11 (0.3%) |
| Coal or Coke | 0 (0.0%) | 0 (0.0%) |
| All other Fuels | 45 (0.8%) | 0 (0.0%) |
| No Fuel Used | 389 (6.7%) | 339 (8.9%) |
| Total | 5,799 (100.0%) | 3,826 (100.0%) |
Household Vehicle Usage in La Puente
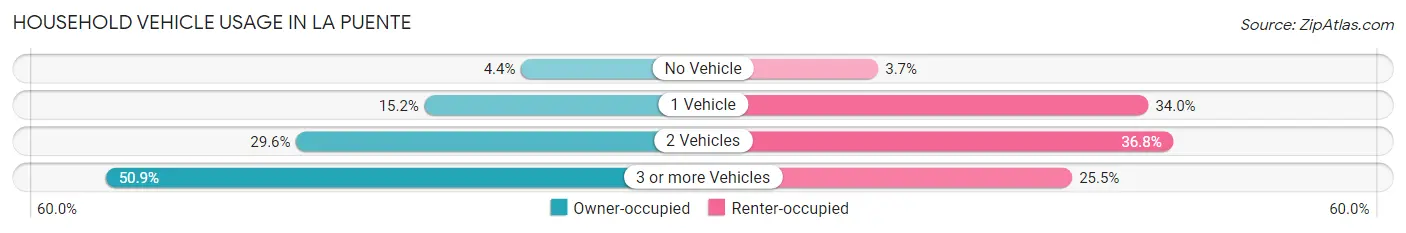
| Vehicles per Household | Owner-occupied | Renter-occupied |
| No Vehicle | 253 (4.4%) | 143 (3.7%) |
| 1 Vehicle | 880 (15.2%) | 1,301 (34.0%) |
| 2 Vehicles | 1,714 (29.6%) | 1,408 (36.8%) |
| 3 or more Vehicles | 2,952 (50.9%) | 974 (25.5%) |
| Total | 5,799 (100.0%) | 3,826 (100.0%) |
Real Estate & Mortgages in La Puente
Real Estate and Mortgage Overview in La Puente
| Characteristic | Without Mortgage | With Mortgage |
| Housing Units | 1,856 | 3,943 |
| Median Property Value | $551,600 | $566,400 |
| Median Household Income | $63,036 | $1,255 |
| Monthly Housing Costs | $526 | $545 |
| Real Estate Taxes | $2,392 | $60 |
Property Value by Mortgage Status in La Puente
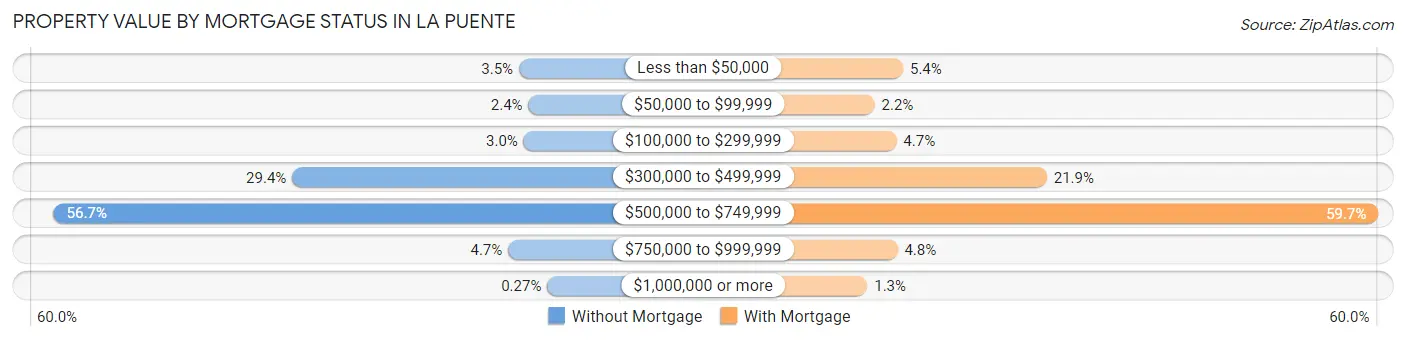
| Property Value | Without Mortgage | With Mortgage |
| Less than $50,000 | 65 (3.5%) | 214 (5.4%) |
| $50,000 to $99,999 | 45 (2.4%) | 86 (2.2%) |
| $100,000 to $299,999 | 55 (3.0%) | 184 (4.7%) |
| $300,000 to $499,999 | 546 (29.4%) | 862 (21.9%) |
| $500,000 to $749,999 | 1,052 (56.7%) | 2,355 (59.7%) |
| $750,000 to $999,999 | 88 (4.7%) | 189 (4.8%) |
| $1,000,000 or more | 5 (0.3%) | 53 (1.3%) |
| Total | 1,856 (100.0%) | 3,943 (100.0%) |
Household Income by Mortgage Status in La Puente
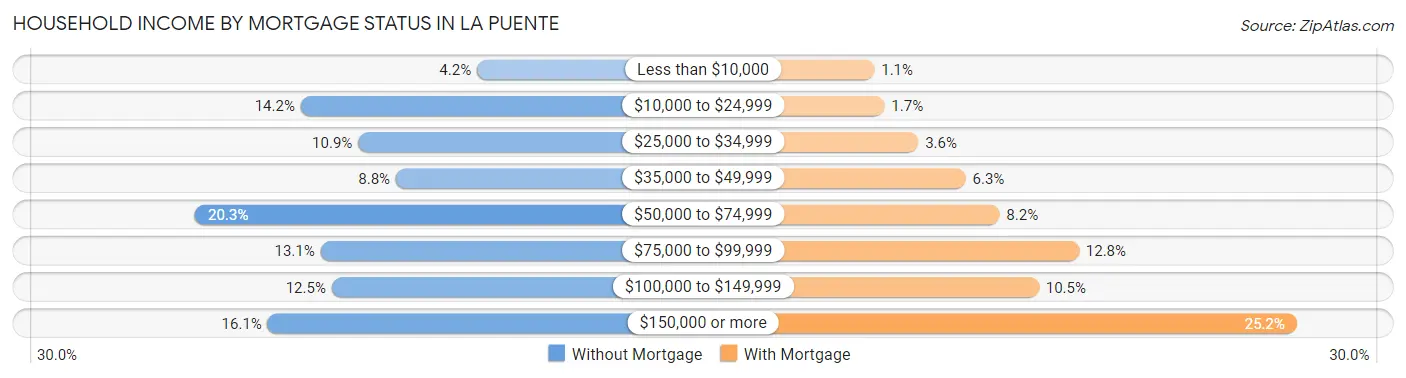
| Household Income | Without Mortgage | With Mortgage |
| Less than $10,000 | 77 (4.2%) | 42 (1.1%) |
| $10,000 to $24,999 | 264 (14.2%) | 65 (1.7%) |
| $25,000 to $34,999 | 203 (10.9%) | 141 (3.6%) |
| $35,000 to $49,999 | 163 (8.8%) | 248 (6.3%) |
| $50,000 to $74,999 | 376 (20.3%) | 324 (8.2%) |
| $75,000 to $99,999 | 243 (13.1%) | 503 (12.8%) |
| $100,000 to $149,999 | 231 (12.4%) | 413 (10.5%) |
| $150,000 or more | 299 (16.1%) | 994 (25.2%) |
| Total | 1,856 (100.0%) | 3,943 (100.0%) |
Property Value to Household Income Ratio in La Puente
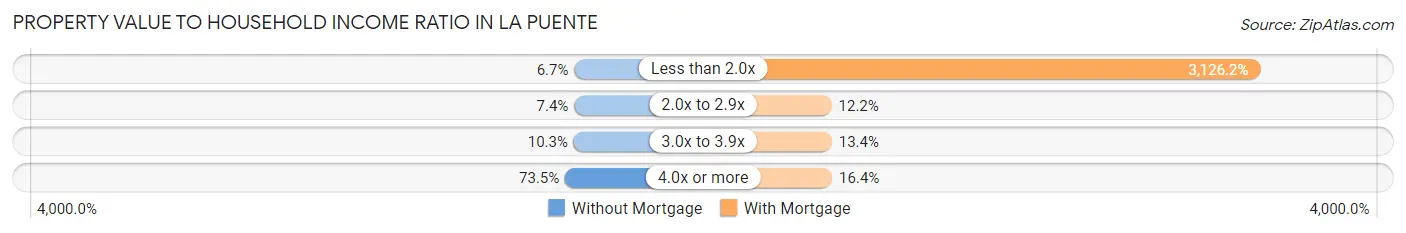
| Value-to-Income Ratio | Without Mortgage | With Mortgage |
| Less than 2.0x | 124 (6.7%) | 123,264 (3,126.2%) |
| 2.0x to 2.9x | 138 (7.4%) | 479 (12.1%) |
| 3.0x to 3.9x | 192 (10.3%) | 529 (13.4%) |
| 4.0x or more | 1,364 (73.5%) | 647 (16.4%) |
| Total | 1,856 (100.0%) | 3,943 (100.0%) |
Real Estate Taxes by Mortgage Status in La Puente
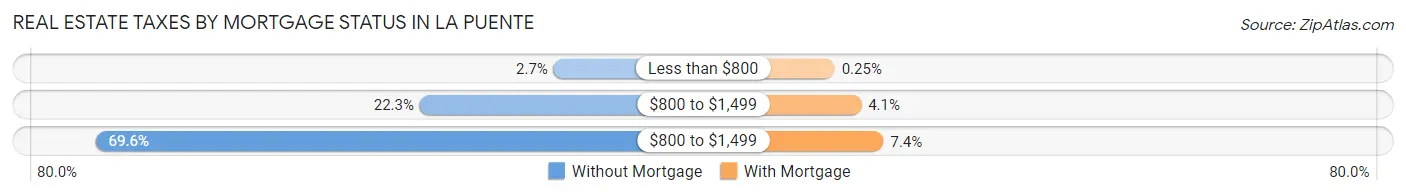
| Property Taxes | Without Mortgage | With Mortgage |
| Less than $800 | 50 (2.7%) | 10 (0.3%) |
| $800 to $1,499 | 413 (22.3%) | 162 (4.1%) |
| $800 to $1,499 | 1,292 (69.6%) | 291 (7.4%) |
| Total | 1,856 (100.0%) | 3,943 (100.0%) |
Health & Disability in La Puente
Health Insurance Coverage by Age in La Puente
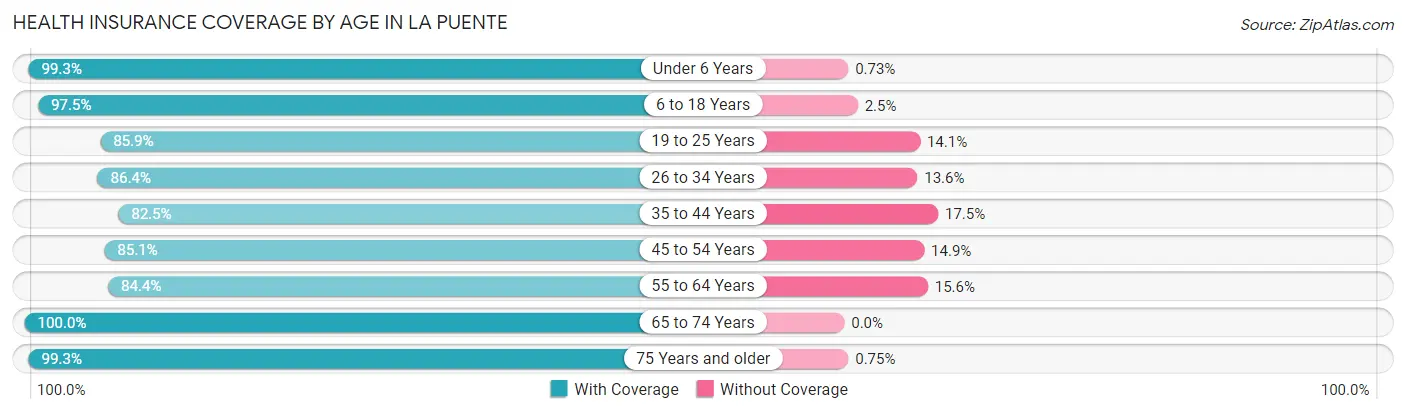
| Age Bracket | With Coverage | Without Coverage |
| Under 6 Years | 2,170 (99.3%) | 16 (0.7%) |
| 6 to 18 Years | 6,670 (97.5%) | 171 (2.5%) |
| 19 to 25 Years | 3,573 (85.9%) | 587 (14.1%) |
| 26 to 34 Years | 4,438 (86.4%) | 700 (13.6%) |
| 35 to 44 Years | 3,455 (82.5%) | 732 (17.5%) |
| 45 to 54 Years | 5,031 (85.1%) | 880 (14.9%) |
| 55 to 64 Years | 3,894 (84.4%) | 718 (15.6%) |
| 65 to 74 Years | 2,619 (100.0%) | 0 (0.0%) |
| 75 Years and older | 2,118 (99.3%) | 16 (0.7%) |
| Total | 33,968 (89.9%) | 3,820 (10.1%) |
Health Insurance Coverage by Citizenship Status in La Puente
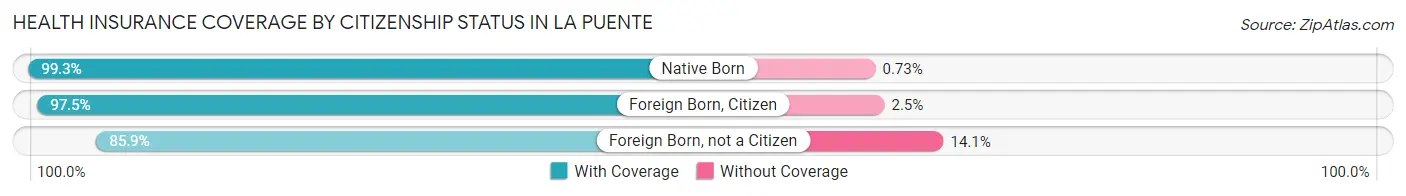
| Citizenship Status | With Coverage | Without Coverage |
| Native Born | 2,170 (99.3%) | 16 (0.7%) |
| Foreign Born, Citizen | 6,670 (97.5%) | 171 (2.5%) |
| Foreign Born, not a Citizen | 3,573 (85.9%) | 587 (14.1%) |
Health Insurance Coverage by Household Income in La Puente
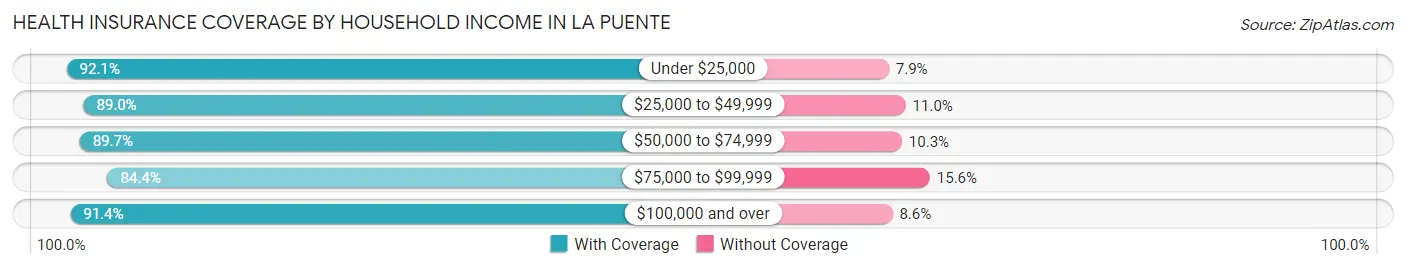
| Household Income | With Coverage | Without Coverage |
| Under $25,000 | 2,211 (92.1%) | 189 (7.9%) |
| $25,000 to $49,999 | 5,418 (89.0%) | 672 (11.0%) |
| $50,000 to $74,999 | 5,106 (89.7%) | 588 (10.3%) |
| $75,000 to $99,999 | 3,963 (84.4%) | 730 (15.6%) |
| $100,000 and over | 17,198 (91.4%) | 1,610 (8.6%) |
Public vs Private Health Insurance Coverage by Age in La Puente
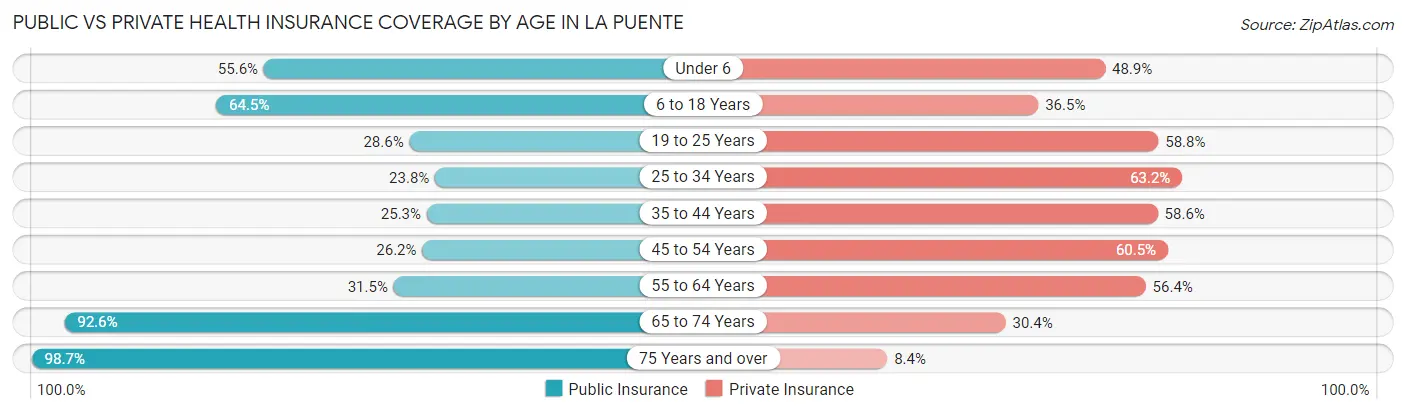
| Age Bracket | Public Insurance | Private Insurance |
| Under 6 | 1,215 (55.6%) | 1,068 (48.9%) |
| 6 to 18 Years | 4,410 (64.5%) | 2,494 (36.5%) |
| 19 to 25 Years | 1,188 (28.6%) | 2,444 (58.8%) |
| 25 to 34 Years | 1,223 (23.8%) | 3,246 (63.2%) |
| 35 to 44 Years | 1,061 (25.3%) | 2,455 (58.6%) |
| 45 to 54 Years | 1,547 (26.2%) | 3,578 (60.5%) |
| 55 to 64 Years | 1,452 (31.5%) | 2,601 (56.4%) |
| 65 to 74 Years | 2,426 (92.6%) | 796 (30.4%) |
| 75 Years and over | 2,106 (98.7%) | 180 (8.4%) |
| Total | 16,628 (44.0%) | 18,862 (49.9%) |
Disability Status by Sex by Age in La Puente
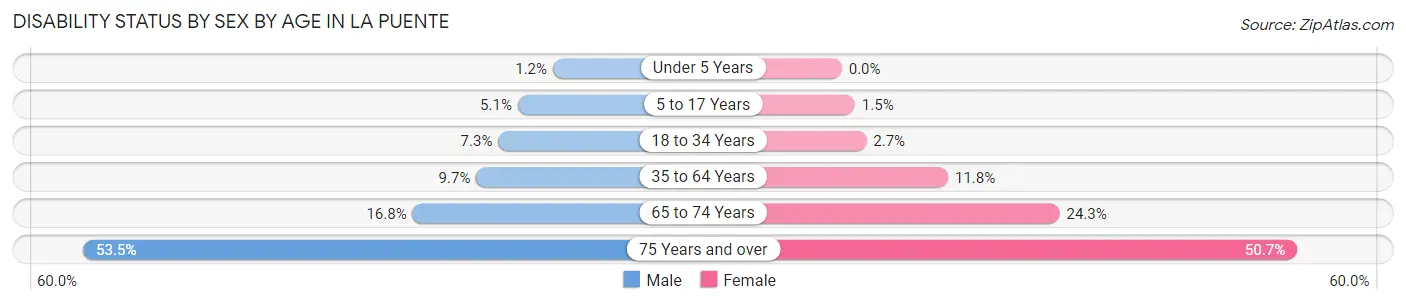
| Age Bracket | Male | Female |
| Under 5 Years | 9 (1.2%) | 0 (0.0%) |
| 5 to 17 Years | 182 (5.1%) | 45 (1.5%) |
| 18 to 34 Years | 404 (7.2%) | 119 (2.7%) |
| 35 to 64 Years | 710 (9.7%) | 875 (11.8%) |
| 65 to 74 Years | 192 (16.8%) | 358 (24.2%) |
| 75 Years and over | 536 (53.5%) | 574 (50.7%) |
Disability Class by Sex by Age in La Puente
Disability Class: Hearing Difficulty
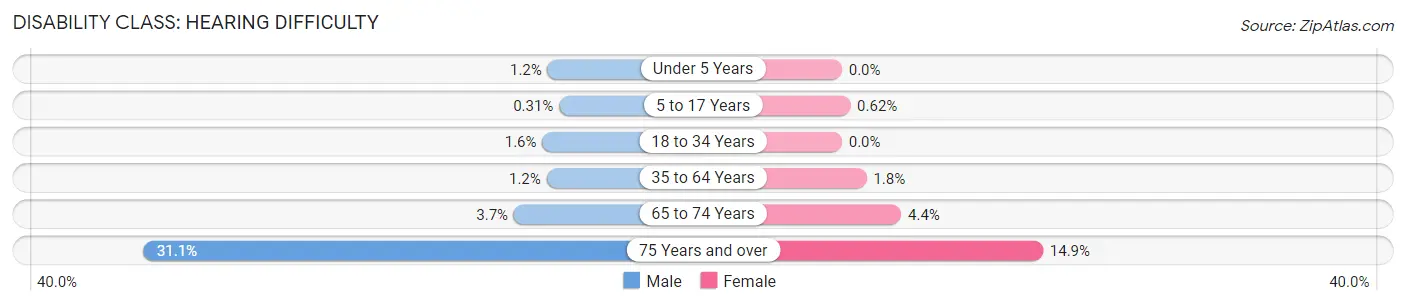
| Age Bracket | Male | Female |
| Under 5 Years | 9 (1.2%) | 0 (0.0%) |
| 5 to 17 Years | 11 (0.3%) | 19 (0.6%) |
| 18 to 34 Years | 87 (1.6%) | 0 (0.0%) |
| 35 to 64 Years | 91 (1.2%) | 135 (1.8%) |
| 65 to 74 Years | 42 (3.7%) | 65 (4.4%) |
| 75 Years and over | 312 (31.1%) | 169 (14.9%) |
Disability Class: Vision Difficulty
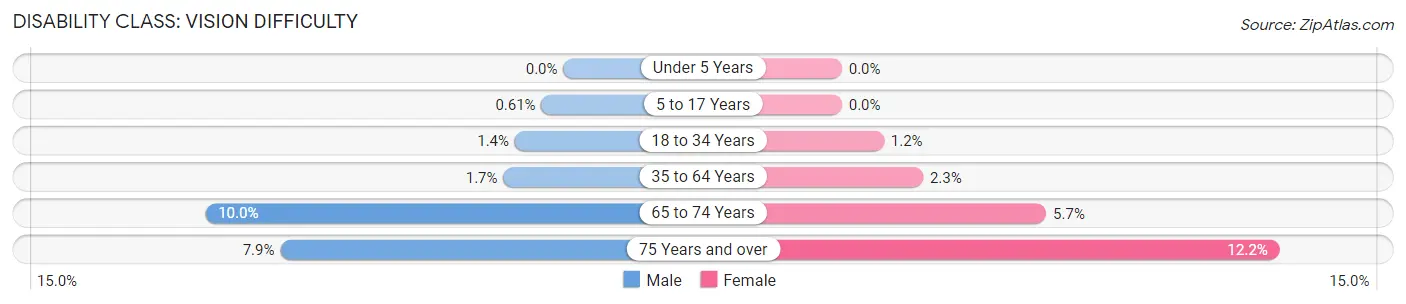
| Age Bracket | Male | Female |
| Under 5 Years | 0 (0.0%) | 0 (0.0%) |
| 5 to 17 Years | 22 (0.6%) | 0 (0.0%) |
| 18 to 34 Years | 75 (1.3%) | 51 (1.2%) |
| 35 to 64 Years | 122 (1.7%) | 167 (2.3%) |
| 65 to 74 Years | 114 (10.0%) | 84 (5.7%) |
| 75 Years and over | 79 (7.9%) | 138 (12.2%) |
Disability Class: Cognitive Difficulty
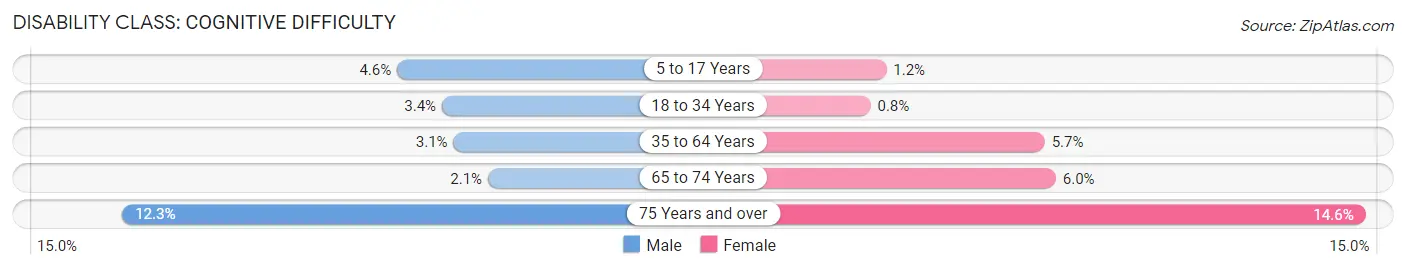
| Age Bracket | Male | Female |
| 5 to 17 Years | 166 (4.6%) | 38 (1.2%) |
| 18 to 34 Years | 188 (3.4%) | 35 (0.8%) |
| 35 to 64 Years | 224 (3.1%) | 418 (5.7%) |
| 65 to 74 Years | 24 (2.1%) | 88 (6.0%) |
| 75 Years and over | 123 (12.3%) | 165 (14.6%) |
Disability Class: Ambulatory Difficulty
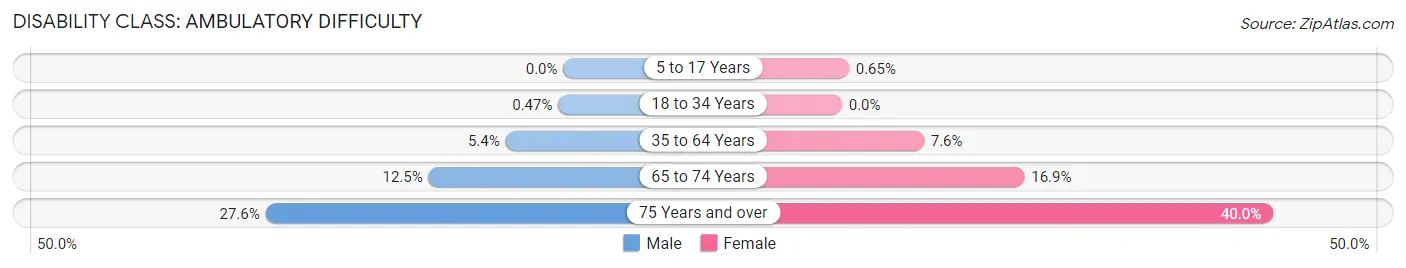
| Age Bracket | Male | Female |
| 5 to 17 Years | 0 (0.0%) | 20 (0.6%) |
| 18 to 34 Years | 26 (0.5%) | 0 (0.0%) |
| 35 to 64 Years | 392 (5.4%) | 563 (7.6%) |
| 65 to 74 Years | 143 (12.5%) | 250 (16.9%) |
| 75 Years and over | 277 (27.6%) | 453 (40.0%) |
Disability Class: Self-Care Difficulty
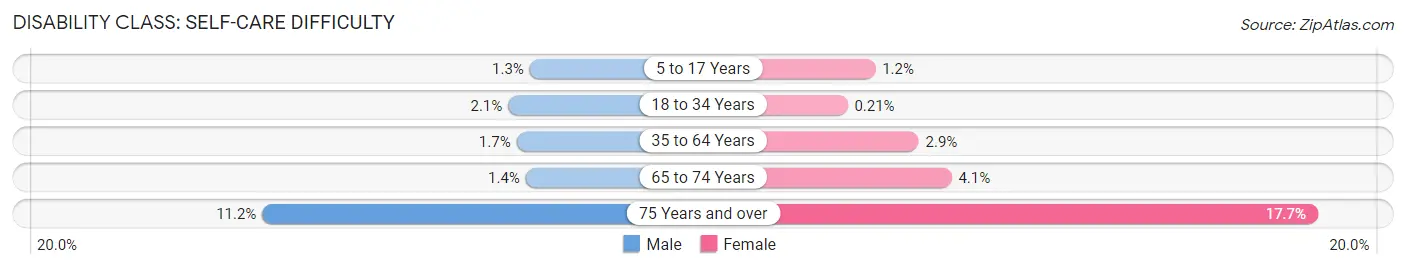
| Age Bracket | Male | Female |
| 5 to 17 Years | 45 (1.3%) | 38 (1.2%) |
| 18 to 34 Years | 114 (2.1%) | 9 (0.2%) |
| 35 to 64 Years | 127 (1.7%) | 211 (2.9%) |
| 65 to 74 Years | 16 (1.4%) | 60 (4.1%) |
| 75 Years and over | 112 (11.2%) | 200 (17.7%) |
Technology Access in La Puente
Computing Device Access in La Puente
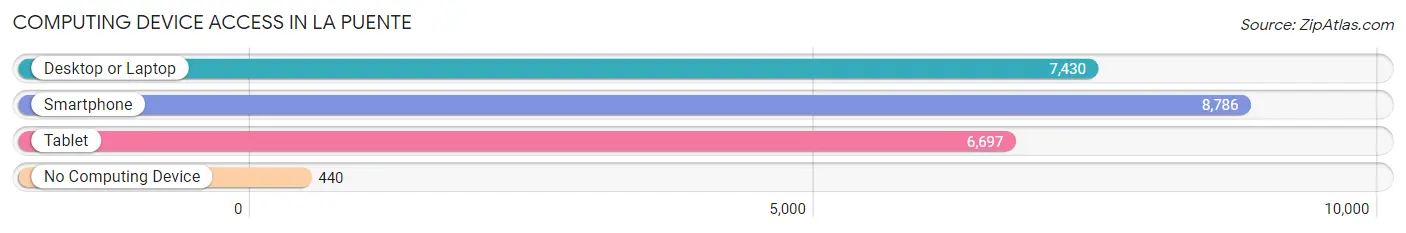
| Device Type | # Households | % Households |
| Desktop or Laptop | 7,430 | 77.2% |
| Smartphone | 8,786 | 91.3% |
| Tablet | 6,697 | 69.6% |
| No Computing Device | 440 | 4.6% |
| Total | 9,625 | 100.0% |
Internet Access in La Puente
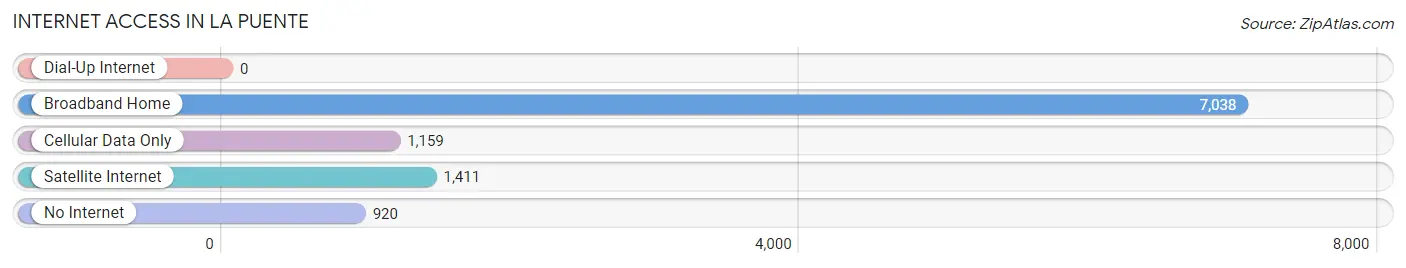
| Internet Type | # Households | % Households |
| Dial-Up Internet | 0 | 0.0% |
| Broadband Home | 7,038 | 73.1% |
| Cellular Data Only | 1,159 | 12.0% |
| Satellite Internet | 1,411 | 14.7% |
| No Internet | 920 | 9.6% |
| Total | 9,625 | 100.0% |
La Puente Summary
History
La Puente is a city located in Los Angeles County, California. It is situated in the San Gabriel Valley, approximately 20 miles east of downtown Los Angeles. The city was incorporated in 1956 and has a population of approximately 40,000 people.
The area that is now La Puente was originally inhabited by the Tongva Native American tribe. The first Europeans to settle in the area were Spanish missionaries, who established the Mission San Gabriel Arcangel in 1771. The mission was the first in the area and served as a base for the Spanish colonization of California.
In the late 19th century, the area was divided into large ranchos, which were used for cattle and sheep grazing. The area was also home to several citrus and walnut groves. In the early 20th century, the area began to be developed for residential use. The city of La Puente was officially incorporated in 1956.
Geography
La Puente is located in the San Gabriel Valley, approximately 20 miles east of downtown Los Angeles. The city is bordered by the cities of West Covina to the north, Industry to the east, Hacienda Heights to the south, and Valinda to the west.
The city has a total area of 5.2 square miles, of which 5.1 square miles is land and 0.1 square miles is water. The city is located at an elevation of approximately 500 feet above sea level.
The climate in La Puente is classified as a Mediterranean climate, with hot, dry summers and mild, wet winters. The average annual temperature is 68 degrees Fahrenheit, with an average high of 86 degrees in the summer and an average low of 50 degrees in the winter.
Economy
The economy of La Puente is largely based on retail and services. The city is home to several shopping centers, including the Puente Hills Mall, which is the largest shopping center in the San Gabriel Valley. The city is also home to several industrial parks, which provide employment opportunities in manufacturing and logistics.
The city is also home to several educational institutions, including La Puente High School, La Puente Valley Regional Occupational Program, and the La Puente Valley Adult Education Center.
Demographics
As of the 2010 census, the population of La Puente was 39,816. The racial makeup of the city was 57.3% White, 1.3% African American, 1.2% Native American, 11.2% Asian, 0.3% Pacific Islander, 25.2% from other races, and 4.5% from two or more races. Hispanic or Latino of any race were 64.2% of the population.
The median household income in La Puente was $50,945, and the median family income was $54,945. The per capita income for the city was $20,945. About 17.2% of families and 20.3% of the population were below the poverty line, including 28.2% of those under age 18 and 8.2% of those age 65 or over.
Common Questions
What is Per Capita Income in La Puente?
Per Capita income in La Puente is $25,451.
What is the Median Family Income in La Puente?
Median Family Income in La Puente is $81,870.
What is the Median Household income in La Puente?
Median Household Income in La Puente is $77,702.
What is Income or Wage Gap in La Puente?
Income or Wage Gap in La Puente is 25.0%.
Women in La Puente earn 75.0 cents for every dollar earned by a man.
What is Family Income Deficit in La Puente?
Family Income Deficit in La Puente is $11,546.
Families that are below poverty line in La Puente earn $11,546 less on average than the poverty threshold level.
What is Inequality or Gini Index in La Puente?
Inequality or Gini Index in La Puente is 0.39.
What is the Total Population of La Puente?
Total Population of La Puente is 37,835.
What is the Total Male Population of La Puente?
Total Male Population of La Puente is 19,431.
What is the Total Female Population of La Puente?
Total Female Population of La Puente is 18,404.
What is the Ratio of Males per 100 Females in La Puente?
There are 105.58 Males per 100 Females in La Puente.
What is the Ratio of Females per 100 Males in La Puente?
There are 94.71 Females per 100 Males in La Puente.
What is the Median Population Age in La Puente?
Median Population Age in La Puente is 36.4 Years.
What is the Average Family Size in La Puente
Average Family Size in La Puente is 4.2 People.
What is the Average Household Size in La Puente
Average Household Size in La Puente is 3.9 People.
How Large is the Labor Force in La Puente?
There are 19,196 People in the Labor Forcein in La Puente.
What is the Percentage of People in the Labor Force in La Puente?
63.2% of People are in the Labor Force in La Puente.
What is the Unemployment Rate in La Puente?
Unemployment Rate in La Puente is 6.0%.