Montclair, CA Map & Demographics
Montclair Map
Montclair Overview
$25,244
PER CAPITA INCOME
$77,195
AVG FAMILY INCOME
$72,789
AVG HOUSEHOLD INCOME
26.4%
WAGE / INCOME GAP [ % ]
73.6¢/ $1
WAGE / INCOME GAP [ $ ]
$10,622
FAMILY INCOME DEFICIT
0.41
INEQUALITY / GINI INDEX
37,842
TOTAL POPULATION
18,235
MALE POPULATION
19,607
FEMALE POPULATION
93.00
MALES / 100 FEMALES
107.52
FEMALES / 100 MALES
32.9
MEDIAN AGE
4.1
AVG FAMILY SIZE
3.7
AVG HOUSEHOLD SIZE
18,361
LABOR FORCE [ PEOPLE ]
62.1%
PERCENT IN LABOR FORCE
6.4%
UNEMPLOYMENT RATE
Montclair Zip Codes
Montclair Area Codes
Income in Montclair
Income Overview in Montclair
Per Capita Income in Montclair is $25,244, while median incomes of families and households are $77,195 and $72,789 respectively.
| Characteristic | Number | Measure |
| Per Capita Income | 37,842 | $25,244 |
| Median Family Income | 8,283 | $77,195 |
| Mean Family Income | 8,283 | $91,962 |
| Median Household Income | 10,137 | $72,789 |
| Mean Household Income | 10,137 | $89,270 |
| Income Deficit | 8,283 | $10,622 |
| Wage / Income Gap (%) | 37,842 | 26.44% |
| Wage / Income Gap ($) | 37,842 | 73.56¢ per $1 |
| Gini / Inequality Index | 37,842 | 0.41 |
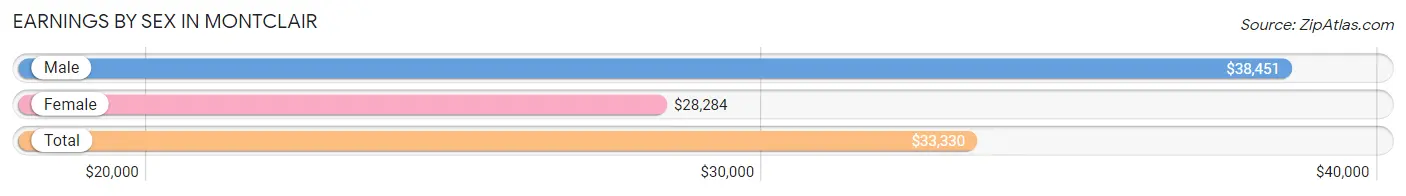
Earnings by Sex in Montclair
Average Earnings in Montclair are $33,330, $38,451 for men and $28,284 for women, a difference of 26.4%.
| Sex | Number | Average Earnings |
| Male | 9,834 (52.5%) | $38,451 |
| Female | 8,909 (47.5%) | $28,284 |
| Total | 18,743 (100.0%) | $33,330 |
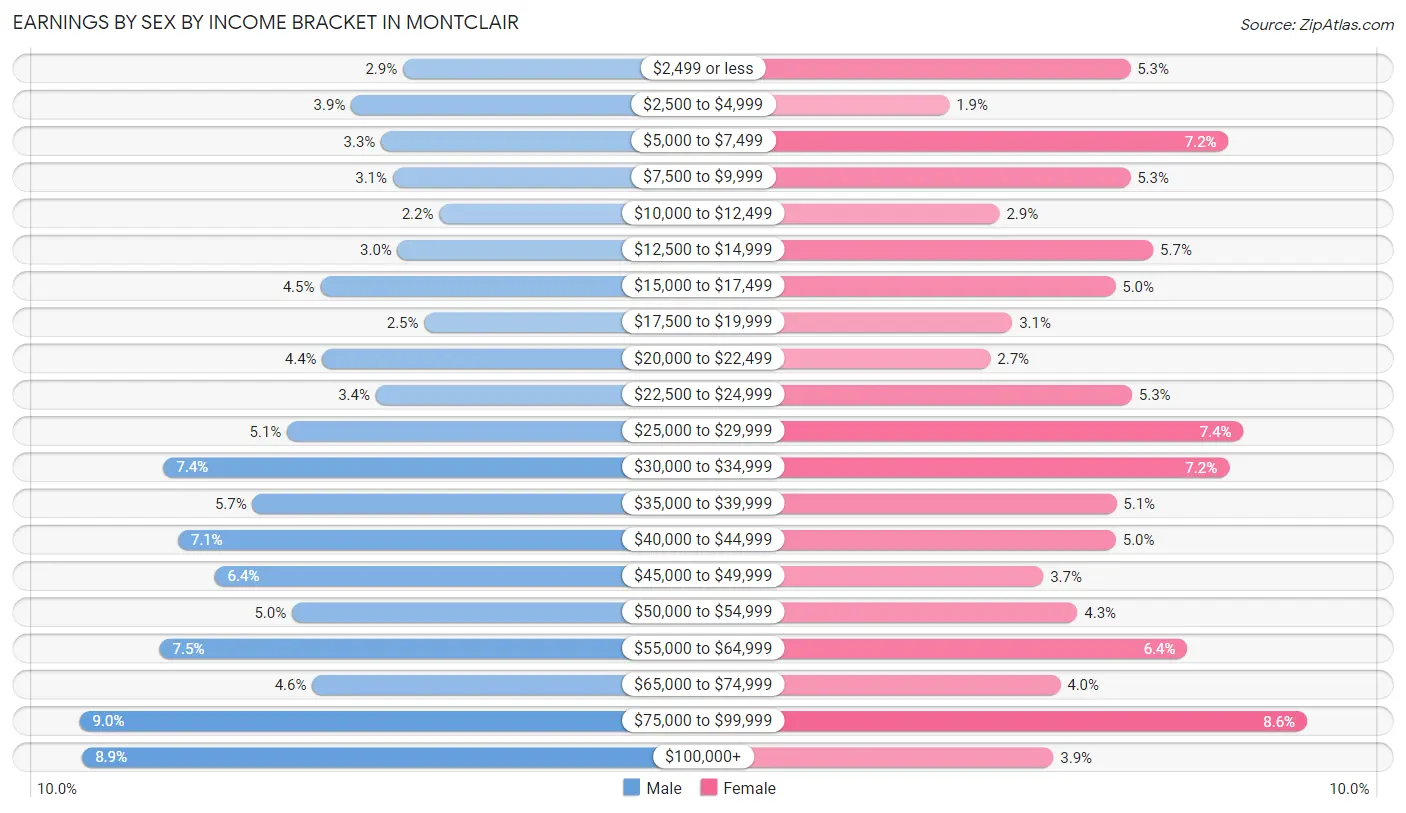
Earnings by Sex by Income Bracket in Montclair
The most common earnings brackets in Montclair are $75,000 to $99,999 for men (882 | 9.0%) and $75,000 to $99,999 for women (768 | 8.6%).
| Income | Male | Female |
| $2,499 or less | 286 (2.9%) | 473 (5.3%) |
| $2,500 to $4,999 | 382 (3.9%) | 171 (1.9%) |
| $5,000 to $7,499 | 326 (3.3%) | 637 (7.1%) |
| $7,500 to $9,999 | 305 (3.1%) | 473 (5.3%) |
| $10,000 to $12,499 | 219 (2.2%) | 255 (2.9%) |
| $12,500 to $14,999 | 296 (3.0%) | 511 (5.7%) |
| $15,000 to $17,499 | 439 (4.5%) | 448 (5.0%) |
| $17,500 to $19,999 | 247 (2.5%) | 276 (3.1%) |
| $20,000 to $22,499 | 435 (4.4%) | 240 (2.7%) |
| $22,500 to $24,999 | 336 (3.4%) | 476 (5.3%) |
| $25,000 to $29,999 | 500 (5.1%) | 662 (7.4%) |
| $30,000 to $34,999 | 728 (7.4%) | 638 (7.2%) |
| $35,000 to $39,999 | 563 (5.7%) | 450 (5.1%) |
| $40,000 to $44,999 | 701 (7.1%) | 449 (5.0%) |
| $45,000 to $49,999 | 633 (6.4%) | 328 (3.7%) |
| $50,000 to $54,999 | 491 (5.0%) | 385 (4.3%) |
| $55,000 to $64,999 | 735 (7.5%) | 568 (6.4%) |
| $65,000 to $74,999 | 453 (4.6%) | 356 (4.0%) |
| $75,000 to $99,999 | 882 (9.0%) | 768 (8.6%) |
| $100,000+ | 877 (8.9%) | 345 (3.9%) |
| Total | 9,834 (100.0%) | 8,909 (100.0%) |
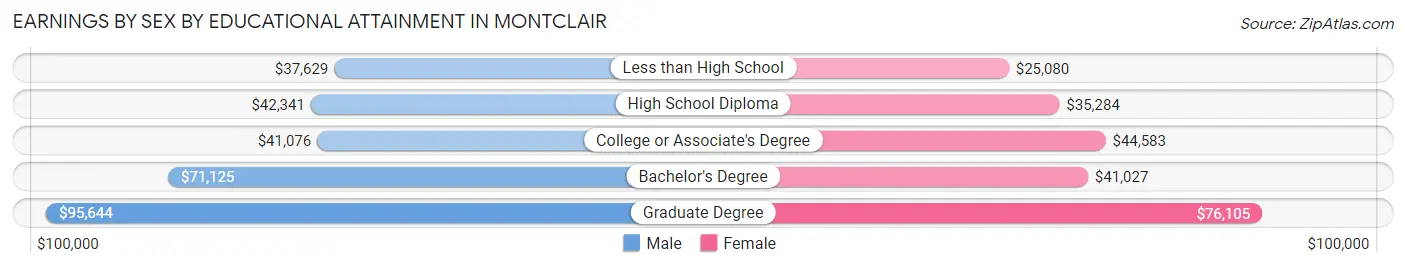
Earnings by Sex by Educational Attainment in Montclair
Average earnings in Montclair are $42,589 for men and $35,211 for women, a difference of 17.3%. Men with an educational attainment of graduate degree enjoy the highest average annual earnings of $95,644, while those with less than high school education earn the least with $37,629. Women with an educational attainment of graduate degree earn the most with the average annual earnings of $76,105, while those with less than high school education have the smallest earnings of $25,080.
| Educational Attainment | Male Income | Female Income |
| Less than High School | $37,629 | $25,080 |
| High School Diploma | $42,341 | $35,284 |
| College or Associate's Degree | $41,076 | $44,583 |
| Bachelor's Degree | $71,125 | $41,027 |
| Graduate Degree | $95,644 | $76,105 |
| Total | $42,589 | $35,211 |
Family Income in Montclair
Family Income Brackets in Montclair
According to the Montclair family income data, there are 1,474 families falling into the $50,000 to $74,999 income range, which is the most common income bracket and makes up 17.8% of all families. Conversely, the $10,000 to $14,999 income bracket is the least frequent group with only 133 families (1.6%) belonging to this category.
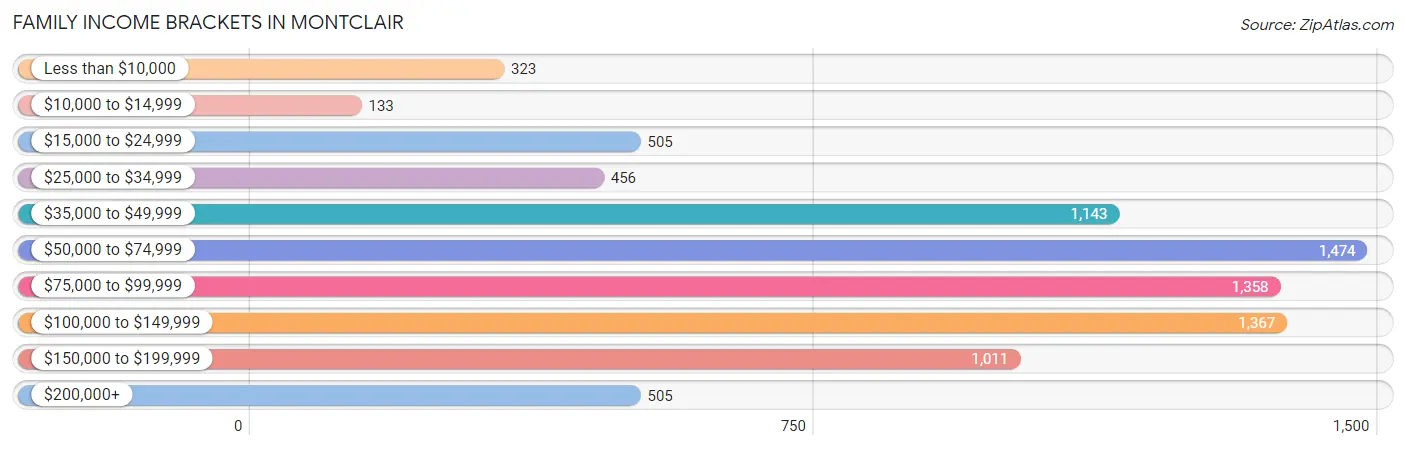
| Income Bracket | # Families | % Families |
| Less than $10,000 | 323 | 3.9% |
| $10,000 to $14,999 | 133 | 1.6% |
| $15,000 to $24,999 | 505 | 6.1% |
| $25,000 to $34,999 | 456 | 5.5% |
| $35,000 to $49,999 | 1,143 | 13.8% |
| $50,000 to $74,999 | 1,474 | 17.8% |
| $75,000 to $99,999 | 1,358 | 16.4% |
| $100,000 to $149,999 | 1,367 | 16.5% |
| $150,000 to $199,999 | 1,011 | 12.2% |
| $200,000+ | 505 | 6.1% |
Family Income by Famaliy Size in Montclair
6-person families (1,021 | 12.3%) account for the highest median family income in Montclair with $115,432 per family, while 2-person families (2,137 | 25.8%) have the highest median income of $33,539 per family member.
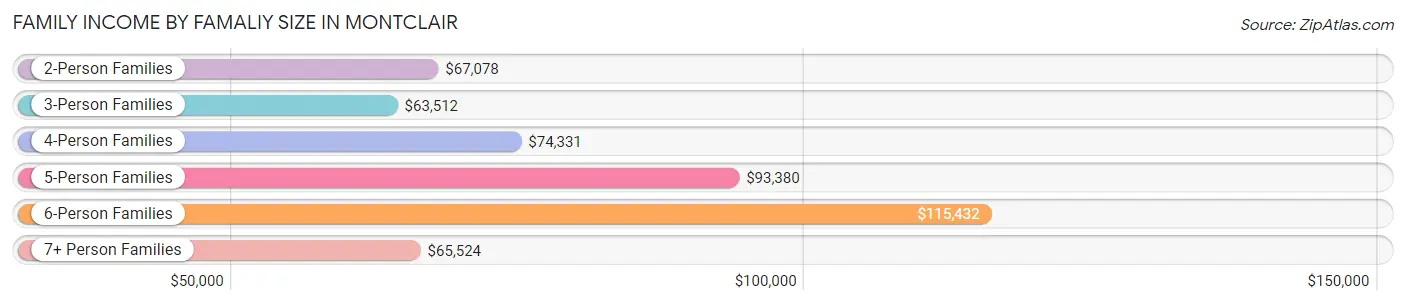
| Income Bracket | # Families | Median Income |
| 2-Person Families | 2,137 (25.8%) | $67,078 |
| 3-Person Families | 1,735 (20.9%) | $63,512 |
| 4-Person Families | 1,839 (22.2%) | $74,331 |
| 5-Person Families | 1,190 (14.4%) | $93,380 |
| 6-Person Families | 1,021 (12.3%) | $115,432 |
| 7+ Person Families | 361 (4.4%) | $65,524 |
| Total | 8,283 (100.0%) | $77,195 |
Family Income by Number of Earners in Montclair
The median family income in Montclair is $77,195, with families comprising 3+ earners (2,247) having the highest median family income of $126,044, while families with no earners (817) have the lowest median family income of $20,685, accounting for 27.1% and 9.9% of families, respectively.
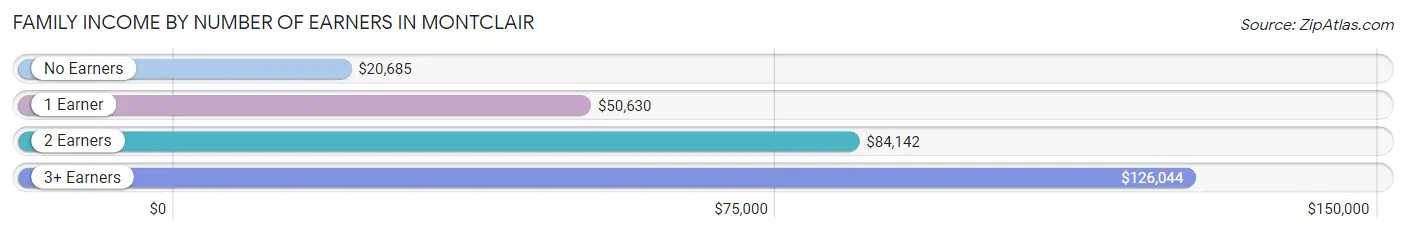
| Number of Earners | # Families | Median Income |
| No Earners | 817 (9.9%) | $20,685 |
| 1 Earner | 2,564 (30.9%) | $50,630 |
| 2 Earners | 2,655 (32.1%) | $84,142 |
| 3+ Earners | 2,247 (27.1%) | $126,044 |
| Total | 8,283 (100.0%) | $77,195 |
Household Income in Montclair
Household Income Brackets in Montclair
With 1,723 households falling in the category, the $50,000 to $74,999 income range is the most frequent in Montclair, accounting for 17.0% of all households. In contrast, only 355 households (3.5%) fall into the less than $10,000 income bracket, making it the least populous group.
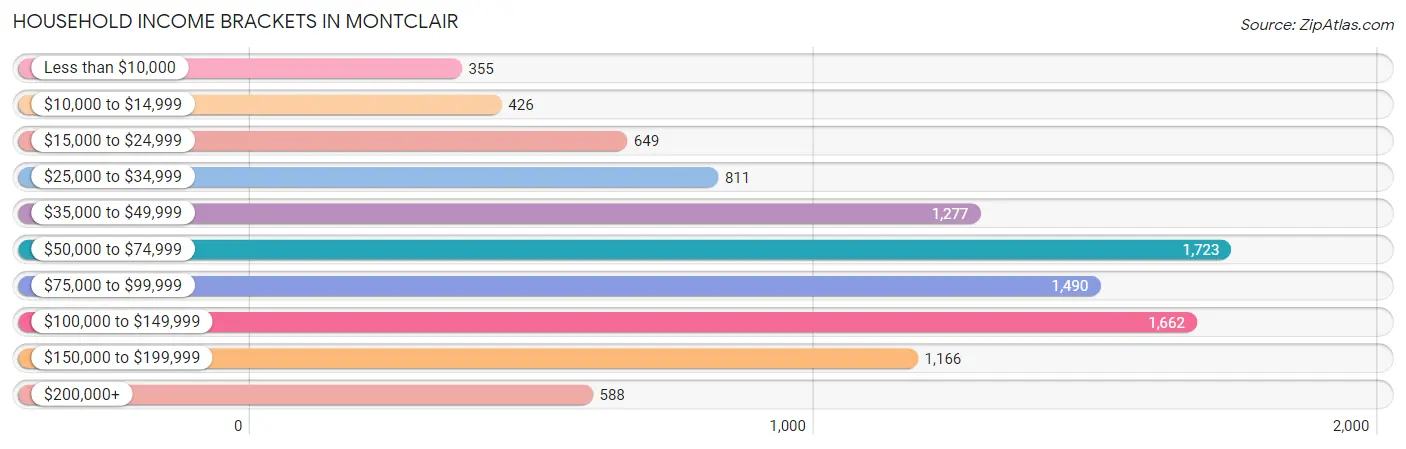
| Income Bracket | # Households | % Households |
| Less than $10,000 | 355 | 3.5% |
| $10,000 to $14,999 | 426 | 4.2% |
| $15,000 to $24,999 | 649 | 6.4% |
| $25,000 to $34,999 | 811 | 8.0% |
| $35,000 to $49,999 | 1,277 | 12.6% |
| $50,000 to $74,999 | 1,723 | 17.0% |
| $75,000 to $99,999 | 1,490 | 14.7% |
| $100,000 to $149,999 | 1,662 | 16.4% |
| $150,000 to $199,999 | 1,166 | 11.5% |
| $200,000+ | 588 | 5.8% |
Household Income by Householder Age in Montclair
The median household income in Montclair is $72,789, with the highest median household income of $83,599 found in the 45 to 64 years age bracket for the primary householder. A total of 4,120 households (40.6%) fall into this category. Meanwhile, the 65+ years age bracket for the primary householder has the lowest median household income of $52,984, with 2,165 households (21.4%) in this group.
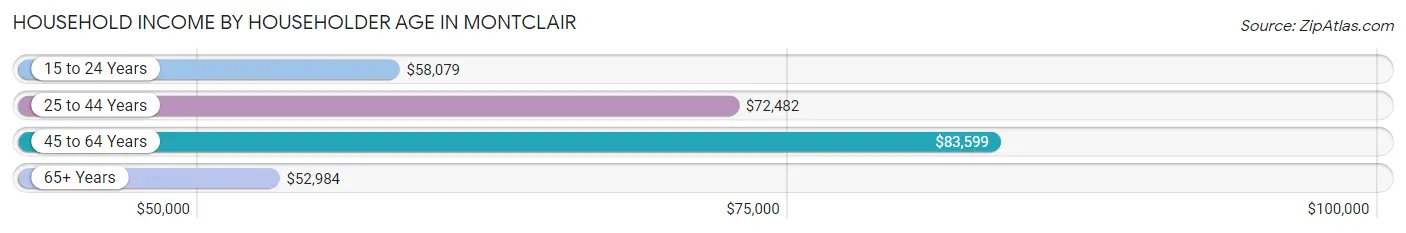
| Income Bracket | # Households | Median Income |
| 15 to 24 Years | 245 (2.4%) | $58,079 |
| 25 to 44 Years | 3,607 (35.6%) | $72,482 |
| 45 to 64 Years | 4,120 (40.6%) | $83,599 |
| 65+ Years | 2,165 (21.4%) | $52,984 |
| Total | 10,137 (100.0%) | $72,789 |
Poverty in Montclair
Income Below Poverty by Sex and Age in Montclair
With 15.7% poverty level for males and 14.3% for females among the residents of Montclair, 15 year old males and 15 year old females are the most vulnerable to poverty, with 93 males (35.9%) and 89 females (31.3%) in their respective age groups living below the poverty level.
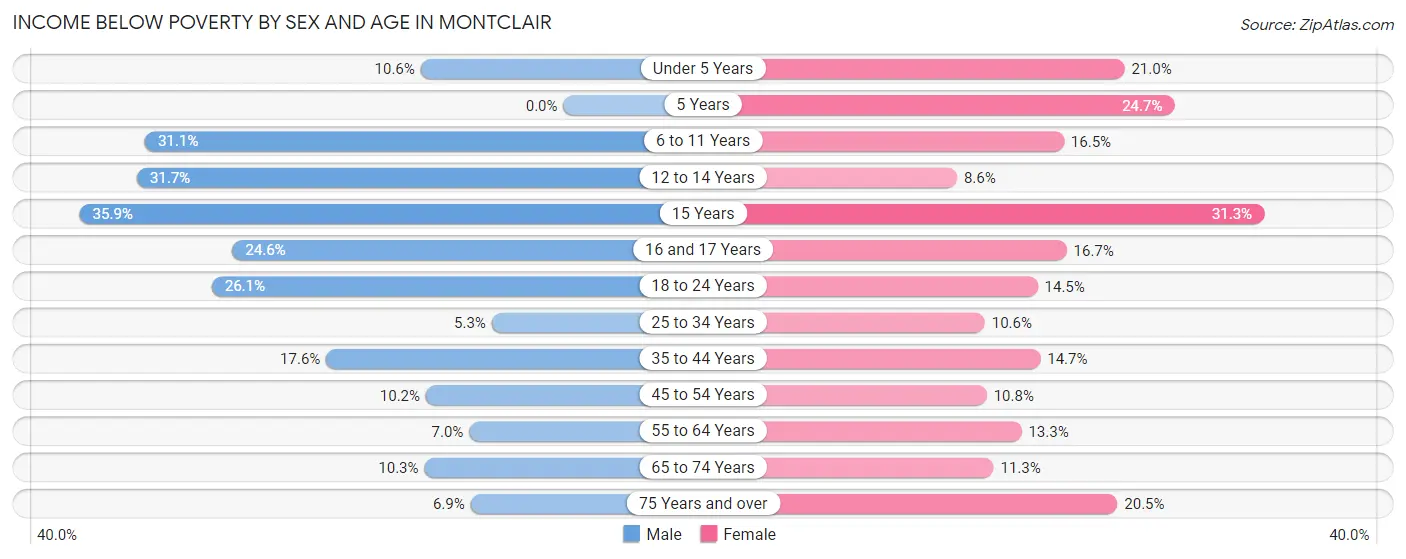
| Age Bracket | Male | Female |
| Under 5 Years | 103 (10.6%) | 287 (21.0%) |
| 5 Years | 0 (0.0%) | 58 (24.7%) |
| 6 to 11 Years | 415 (31.1%) | 235 (16.5%) |
| 12 to 14 Years | 373 (31.7%) | 81 (8.6%) |
| 15 Years | 93 (35.9%) | 89 (31.3%) |
| 16 and 17 Years | 143 (24.6%) | 123 (16.7%) |
| 18 to 24 Years | 621 (26.1%) | 312 (14.5%) |
| 25 to 34 Years | 171 (5.3%) | 306 (10.6%) |
| 35 to 44 Years | 393 (17.6%) | 373 (14.7%) |
| 45 to 54 Years | 233 (10.2%) | 259 (10.8%) |
| 55 to 64 Years | 127 (7.0%) | 279 (13.3%) |
| 65 to 74 Years | 115 (10.3%) | 140 (11.3%) |
| 75 Years and over | 41 (6.9%) | 224 (20.5%) |
| Total | 2,828 (15.7%) | 2,766 (14.3%) |
Income Above Poverty by Sex and Age in Montclair
According to the poverty statistics in Montclair, males aged 5 years and females aged 12 to 14 years are the age groups that are most secure financially, with 100.0% of males and 91.4% of females in these age groups living above the poverty line.
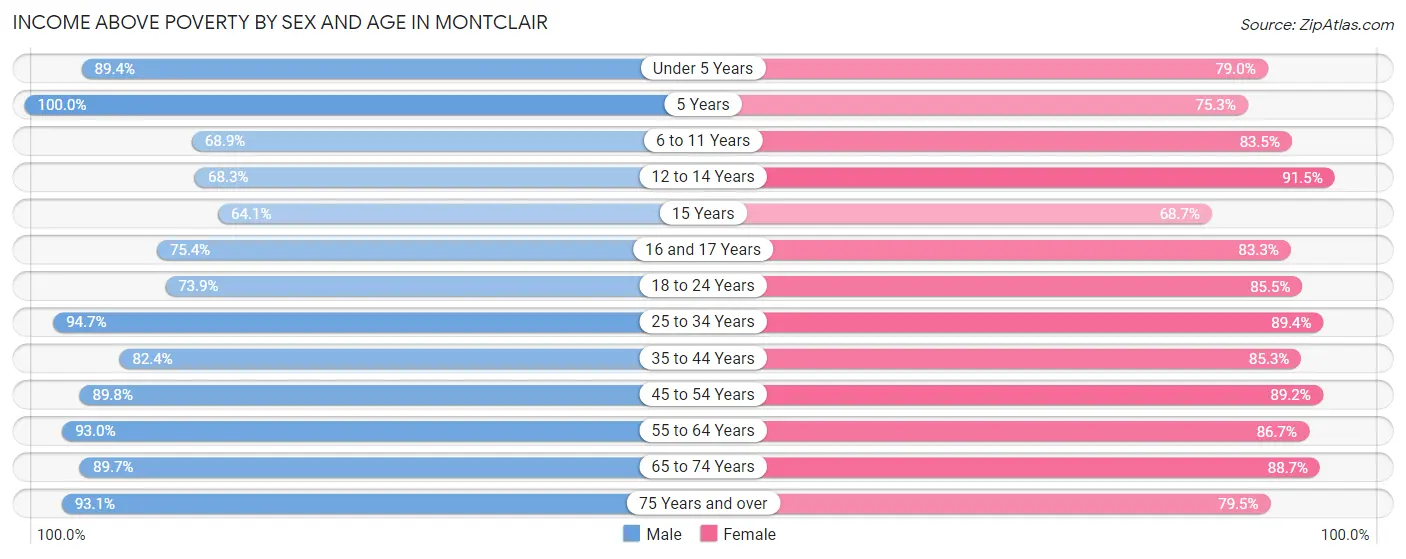
| Age Bracket | Male | Female |
| Under 5 Years | 869 (89.4%) | 1,080 (79.0%) |
| 5 Years | 105 (100.0%) | 177 (75.3%) |
| 6 to 11 Years | 921 (68.9%) | 1,190 (83.5%) |
| 12 to 14 Years | 805 (68.3%) | 866 (91.4%) |
| 15 Years | 166 (64.1%) | 195 (68.7%) |
| 16 and 17 Years | 439 (75.4%) | 614 (83.3%) |
| 18 to 24 Years | 1,758 (73.9%) | 1,834 (85.5%) |
| 25 to 34 Years | 3,046 (94.7%) | 2,575 (89.4%) |
| 35 to 44 Years | 1,839 (82.4%) | 2,158 (85.3%) |
| 45 to 54 Years | 2,049 (89.8%) | 2,147 (89.2%) |
| 55 to 64 Years | 1,691 (93.0%) | 1,812 (86.7%) |
| 65 to 74 Years | 999 (89.7%) | 1,102 (88.7%) |
| 75 Years and over | 554 (93.1%) | 871 (79.5%) |
| Total | 15,241 (84.4%) | 16,621 (85.7%) |
Income Below Poverty Among Married-Couple Families in Montclair
The poverty statistics for married-couple families in Montclair show that 4.0% or 200 of the total 5,041 families live below the poverty line. Families with 1 or 2 children have the highest poverty rate of 7.1%, comprising of 150 families. On the other hand, families with 3 or 4 children have the lowest poverty rate of 0.0%, which includes 0 families.
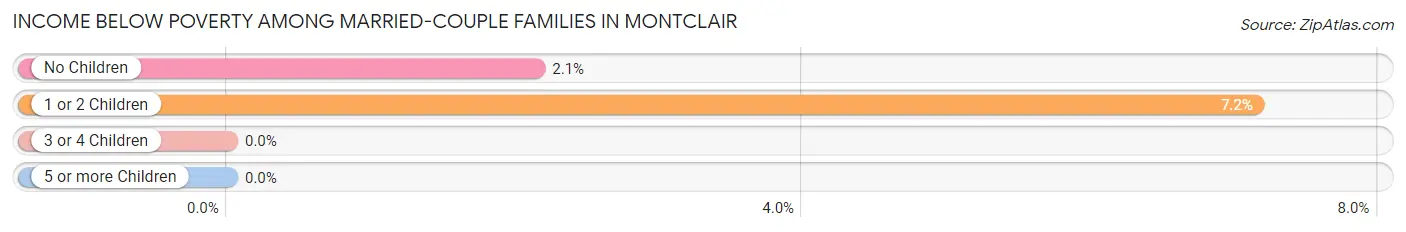
| Children | Above Poverty | Below Poverty |
| No Children | 2,290 (97.9%) | 50 (2.1%) |
| 1 or 2 Children | 1,948 (92.8%) | 150 (7.1%) |
| 3 or 4 Children | 538 (100.0%) | 0 (0.0%) |
| 5 or more Children | 65 (100.0%) | 0 (0.0%) |
| Total | 4,841 (96.0%) | 200 (4.0%) |
Income Below Poverty Among Single-Parent Households in Montclair
According to the poverty data in Montclair, 24.9% or 213 single-father households and 24.8% or 593 single-mother households are living below the poverty line. Among single-father households, those with 3 or 4 children have the highest poverty rate, with 70 households (46.7%) experiencing poverty. Likewise, among single-mother households, those with 5 or more children have the highest poverty rate, with 21 households (87.5%) falling below the poverty line.
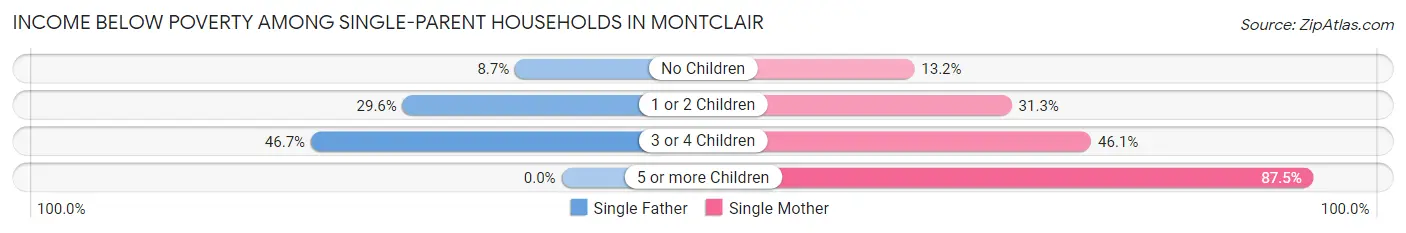
| Children | Single Father | Single Mother |
| No Children | 27 (8.6%) | 155 (13.2%) |
| 1 or 2 Children | 116 (29.6%) | 275 (31.3%) |
| 3 or 4 Children | 70 (46.7%) | 142 (46.1%) |
| 5 or more Children | 0 (0.0%) | 21 (87.5%) |
| Total | 213 (24.9%) | 593 (24.8%) |
Income Below Poverty Among Married-Couple vs Single-Parent Households in Montclair
The poverty data for Montclair shows that 200 of the married-couple family households (4.0%) and 806 of the single-parent households (24.9%) are living below the poverty level. Within the married-couple family households, those with 1 or 2 children have the highest poverty rate, with 150 households (7.1%) falling below the poverty line. Among the single-parent households, those with 5 or more children have the highest poverty rate, with 21 household (87.5%) living below poverty.
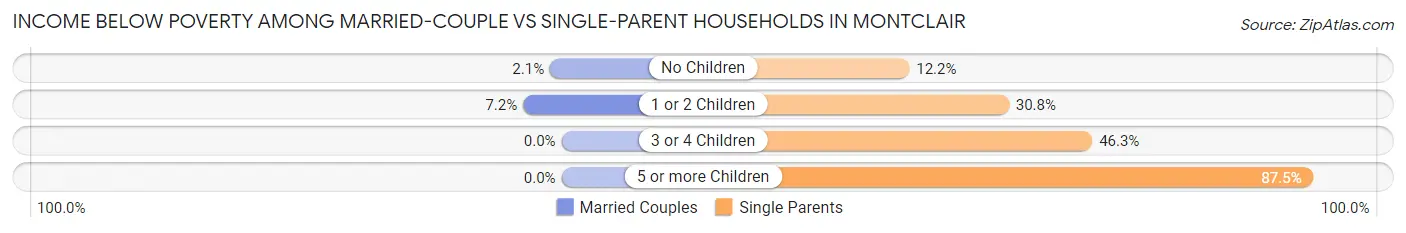
| Children | Married-Couple Families | Single-Parent Households |
| No Children | 50 (2.1%) | 182 (12.2%) |
| 1 or 2 Children | 150 (7.1%) | 391 (30.8%) |
| 3 or 4 Children | 0 (0.0%) | 212 (46.3%) |
| 5 or more Children | 0 (0.0%) | 21 (87.5%) |
| Total | 200 (4.0%) | 806 (24.9%) |
Race in Montclair
The most populous races in Montclair are Hispanic or Latino (26,954 | 71.2%), White / Caucasian (12,841 | 33.9%), and Some other Race (12,344 | 32.6%).
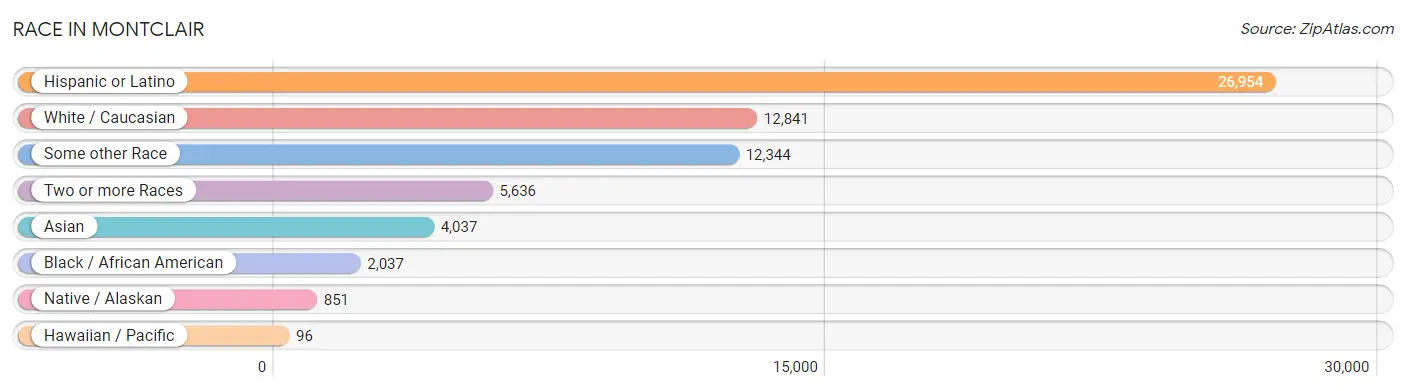
| Race | # Population | % Population |
| Asian | 4,037 | 10.7% |
| Black / African American | 2,037 | 5.4% |
| Hawaiian / Pacific | 96 | 0.3% |
| Hispanic or Latino | 26,954 | 71.2% |
| Native / Alaskan | 851 | 2.2% |
| White / Caucasian | 12,841 | 33.9% |
| Two or more Races | 5,636 | 14.9% |
| Some other Race | 12,344 | 32.6% |
| Total | 37,842 | 100.0% |
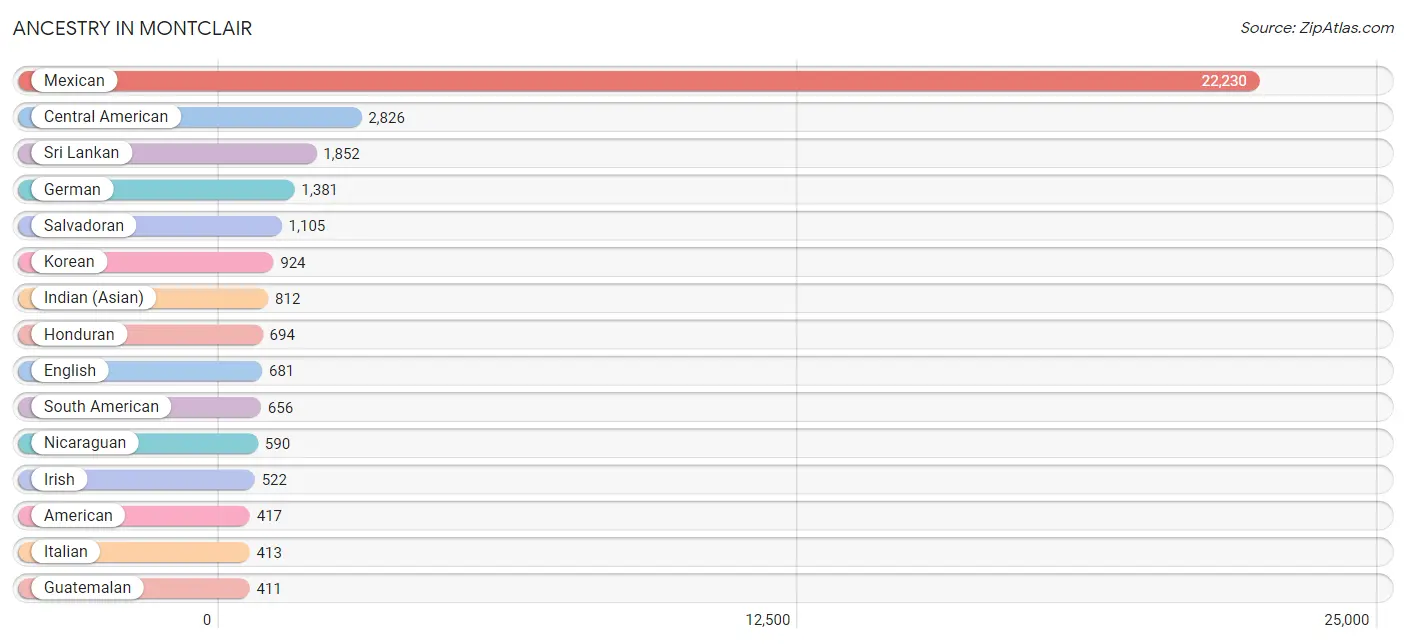
Ancestry in Montclair
The most populous ancestries reported in Montclair are Mexican (22,230 | 58.7%), Central American (2,826 | 7.5%), Sri Lankan (1,852 | 4.9%), German (1,381 | 3.6%), and Salvadoran (1,105 | 2.9%), together accounting for 77.7% of all Montclair residents.
| Ancestry | # Population | % Population |
| African | 156 | 0.4% |
| American | 417 | 1.1% |
| Apache | 30 | 0.1% |
| Arab | 167 | 0.4% |
| Arapaho | 3 | 0.0% |
| Argentinean | 33 | 0.1% |
| Armenian | 9 | 0.0% |
| Barbadian | 2 | 0.0% |
| Basque | 5 | 0.0% |
| Belgian | 11 | 0.0% |
| Belizean | 35 | 0.1% |
| Bhutanese | 50 | 0.1% |
| British | 18 | 0.1% |
| Burmese | 188 | 0.5% |
| Canadian | 60 | 0.2% |
| Central American | 2,826 | 7.5% |
| Central American Indian | 276 | 0.7% |
| Cherokee | 3 | 0.0% |
| Chilean | 11 | 0.0% |
| Chippewa | 16 | 0.0% |
| Choctaw | 110 | 0.3% |
| Colombian | 162 | 0.4% |
| Costa Rican | 26 | 0.1% |
| Cuban | 109 | 0.3% |
| Czech | 12 | 0.0% |
| Dutch | 47 | 0.1% |
| Ecuadorian | 313 | 0.8% |
| Egyptian | 77 | 0.2% |
| English | 681 | 1.8% |
| European | 174 | 0.5% |
| Filipino | 139 | 0.4% |
| Finnish | 7 | 0.0% |
| French | 143 | 0.4% |
| French Canadian | 59 | 0.2% |
| German | 1,381 | 3.6% |
| Greek | 24 | 0.1% |
| Guamanian / Chamorro | 32 | 0.1% |
| Guatemalan | 411 | 1.1% |
| Guyanese | 14 | 0.0% |
| Honduran | 694 | 1.8% |
| Hungarian | 30 | 0.1% |
| Indian (Asian) | 812 | 2.1% |
| Indonesian | 7 | 0.0% |
| Iranian | 23 | 0.1% |
| Irish | 522 | 1.4% |
| Italian | 413 | 1.1% |
| Jamaican | 27 | 0.1% |
| Japanese | 36 | 0.1% |
| Jordanian | 21 | 0.1% |
| Kenyan | 35 | 0.1% |
| Korean | 924 | 2.4% |
| Laotian | 124 | 0.3% |
| Latvian | 9 | 0.0% |
| Lebanese | 82 | 0.2% |
| Lithuanian | 16 | 0.0% |
| Lumbee | 3 | 0.0% |
| Luxembourger | 7 | 0.0% |
| Malaysian | 84 | 0.2% |
| Mexican | 22,230 | 58.7% |
| Mexican American Indian | 172 | 0.4% |
| Native Hawaiian | 57 | 0.2% |
| Nicaraguan | 590 | 1.6% |
| Nigerian | 75 | 0.2% |
| Norwegian | 132 | 0.4% |
| Pakistani | 41 | 0.1% |
| Peruvian | 137 | 0.4% |
| Polish | 72 | 0.2% |
| Portuguese | 3 | 0.0% |
| Pueblo | 5 | 0.0% |
| Puerto Rican | 360 | 0.9% |
| Romanian | 10 | 0.0% |
| Russian | 29 | 0.1% |
| Salvadoran | 1,105 | 2.9% |
| Samoan | 8 | 0.0% |
| Scandinavian | 12 | 0.0% |
| Scotch-Irish | 51 | 0.1% |
| Scottish | 54 | 0.1% |
| South African | 9 | 0.0% |
| South American | 656 | 1.7% |
| South American Indian | 25 | 0.1% |
| Spaniard | 126 | 0.3% |
| Spanish | 94 | 0.3% |
| Sri Lankan | 1,852 | 4.9% |
| Subsaharan African | 275 | 0.7% |
| Swedish | 72 | 0.2% |
| Swiss | 53 | 0.1% |
| Thai | 215 | 0.6% |
| Tongan | 33 | 0.1% |
| Ukrainian | 16 | 0.0% |
| Welsh | 104 | 0.3% | View All 90 Rows |
Immigrants in Montclair
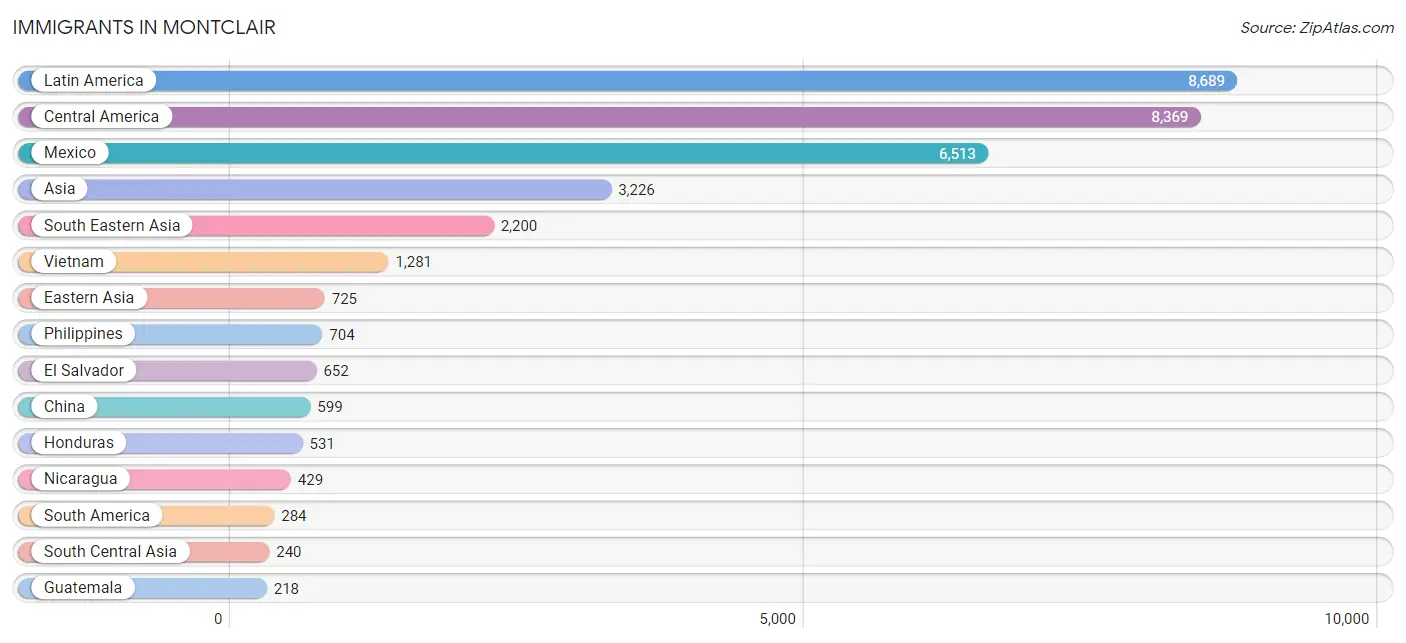
The most numerous immigrant groups reported in Montclair came from Latin America (8,689 | 23.0%), Central America (8,369 | 22.1%), Mexico (6,513 | 17.2%), Asia (3,226 | 8.5%), and South Eastern Asia (2,200 | 5.8%), together accounting for 76.6% of all Montclair residents.
| Immigration Origin | # Population | % Population |
| Africa | 131 | 0.4% |
| Asia | 3,226 | 8.5% |
| Barbados | 2 | 0.0% |
| Cambodia | 43 | 0.1% |
| Canada | 41 | 0.1% |
| Caribbean | 36 | 0.1% |
| Central America | 8,369 | 22.1% |
| China | 599 | 1.6% |
| Colombia | 113 | 0.3% |
| Costa Rica | 26 | 0.1% |
| Cuba | 34 | 0.1% |
| Eastern Africa | 35 | 0.1% |
| Eastern Asia | 725 | 1.9% |
| Ecuador | 68 | 0.2% |
| Egypt | 34 | 0.1% |
| El Salvador | 652 | 1.7% |
| England | 19 | 0.1% |
| Europe | 88 | 0.2% |
| Germany | 22 | 0.1% |
| Greece | 6 | 0.0% |
| Guatemala | 218 | 0.6% |
| Guyana | 14 | 0.0% |
| Honduras | 531 | 1.4% |
| Hong Kong | 39 | 0.1% |
| India | 126 | 0.3% |
| Indonesia | 75 | 0.2% |
| Iran | 32 | 0.1% |
| Italy | 41 | 0.1% |
| Jordan | 21 | 0.1% |
| Kenya | 35 | 0.1% |
| Korea | 126 | 0.3% |
| Laos | 44 | 0.1% |
| Latin America | 8,689 | 23.0% |
| Lebanon | 40 | 0.1% |
| Malaysia | 20 | 0.1% |
| Mexico | 6,513 | 17.2% |
| Nicaragua | 429 | 1.1% |
| Nigeria | 62 | 0.2% |
| Northern Africa | 34 | 0.1% |
| Northern Europe | 19 | 0.1% |
| Pakistan | 82 | 0.2% |
| Peru | 89 | 0.2% |
| Philippines | 704 | 1.9% |
| South America | 284 | 0.7% |
| South Central Asia | 240 | 0.6% |
| South Eastern Asia | 2,200 | 5.8% |
| Southern Europe | 47 | 0.1% |
| Taiwan | 142 | 0.4% |
| Thailand | 18 | 0.1% |
| Vietnam | 1,281 | 3.4% |
| Western Africa | 62 | 0.2% |
| Western Asia | 61 | 0.2% |
| Western Europe | 22 | 0.1% | View All 53 Rows |
Sex and Age in Montclair
Sex and Age in Montclair
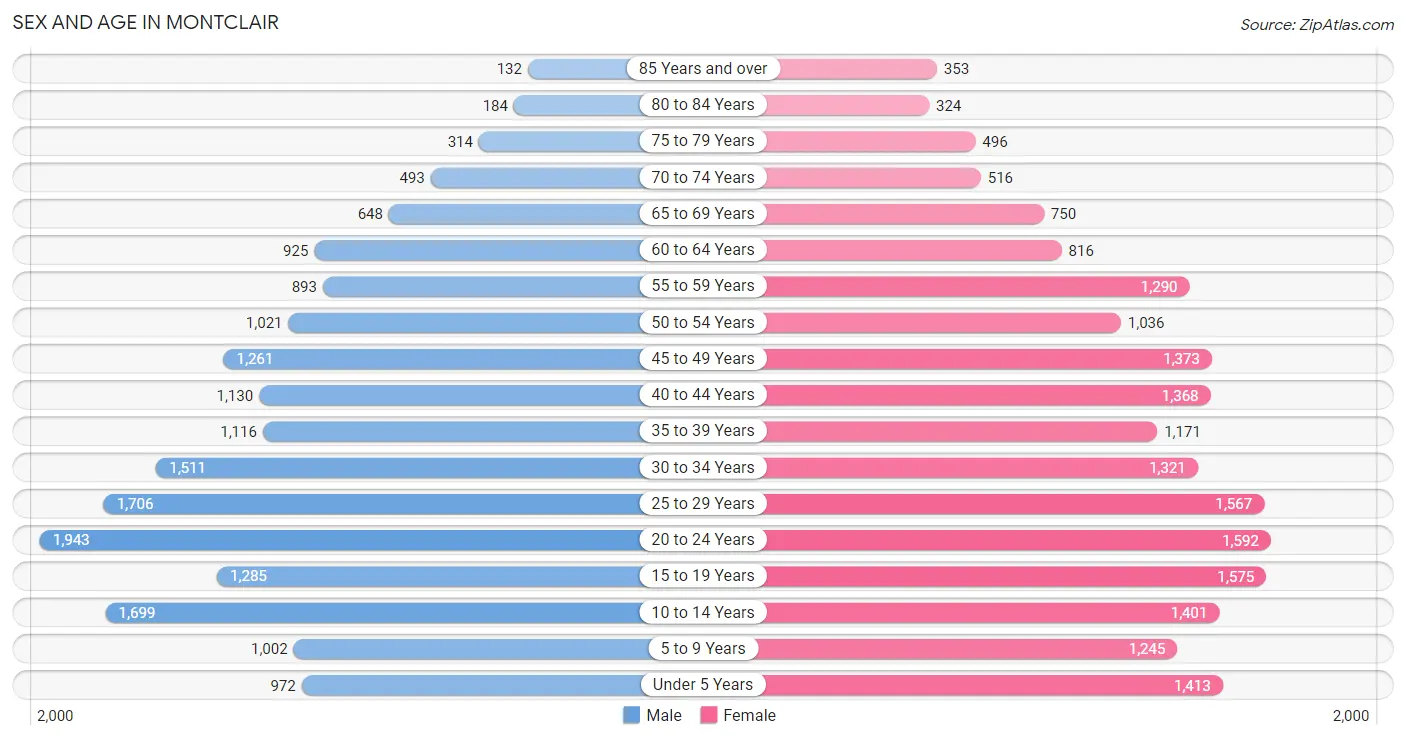
The most populous age groups in Montclair are 20 to 24 Years (1,943 | 10.7%) for men and 20 to 24 Years (1,592 | 8.1%) for women.
| Age Bracket | Male | Female |
| Under 5 Years | 972 (5.3%) | 1,413 (7.2%) |
| 5 to 9 Years | 1,002 (5.5%) | 1,245 (6.4%) |
| 10 to 14 Years | 1,699 (9.3%) | 1,401 (7.1%) |
| 15 to 19 Years | 1,285 (7.0%) | 1,575 (8.0%) |
| 20 to 24 Years | 1,943 (10.7%) | 1,592 (8.1%) |
| 25 to 29 Years | 1,706 (9.4%) | 1,567 (8.0%) |
| 30 to 34 Years | 1,511 (8.3%) | 1,321 (6.7%) |
| 35 to 39 Years | 1,116 (6.1%) | 1,171 (6.0%) |
| 40 to 44 Years | 1,130 (6.2%) | 1,368 (7.0%) |
| 45 to 49 Years | 1,261 (6.9%) | 1,373 (7.0%) |
| 50 to 54 Years | 1,021 (5.6%) | 1,036 (5.3%) |
| 55 to 59 Years | 893 (4.9%) | 1,290 (6.6%) |
| 60 to 64 Years | 925 (5.1%) | 816 (4.2%) |
| 65 to 69 Years | 648 (3.5%) | 750 (3.8%) |
| 70 to 74 Years | 493 (2.7%) | 516 (2.6%) |
| 75 to 79 Years | 314 (1.7%) | 496 (2.5%) |
| 80 to 84 Years | 184 (1.0%) | 324 (1.7%) |
| 85 Years and over | 132 (0.7%) | 353 (1.8%) |
| Total | 18,235 (100.0%) | 19,607 (100.0%) |
Families and Households in Montclair
Median Family Size in Montclair
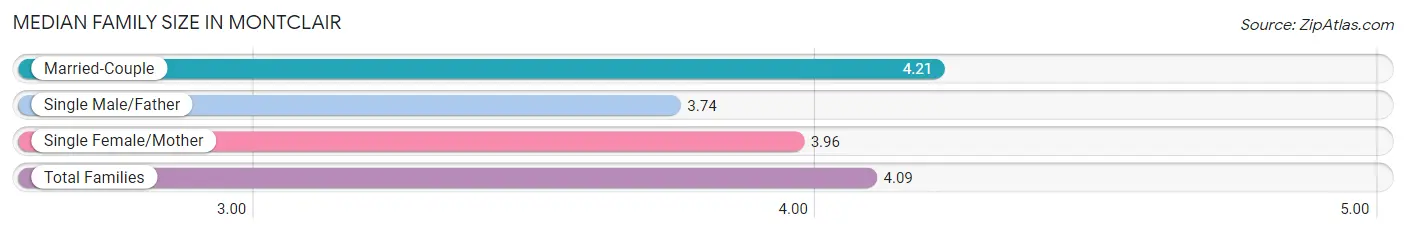
The median family size in Montclair is 4.09 persons per family, with married-couple families (5,041 | 60.9%) accounting for the largest median family size of 4.21 persons per family. On the other hand, single male/father families (854 | 10.3%) represent the smallest median family size with 3.74 persons per family.
| Family Type | # Families | Family Size |
| Married-Couple | 5,041 (60.9%) | 4.21 |
| Single Male/Father | 854 (10.3%) | 3.74 |
| Single Female/Mother | 2,388 (28.8%) | 3.96 |
| Total Families | 8,283 (100.0%) | 4.09 |
Median Household Size in Montclair
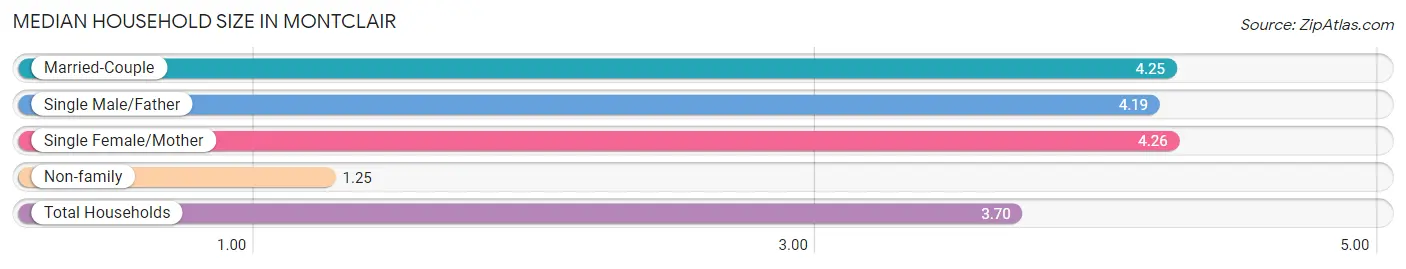
The median household size in Montclair is 3.70 persons per household, with single female/mother households (2,388 | 23.6%) accounting for the largest median household size of 4.26 persons per household. non-family households (1,854 | 18.3%) represent the smallest median household size with 1.25 persons per household.
| Household Type | # Households | Household Size |
| Married-Couple | 5,041 (49.7%) | 4.25 |
| Single Male/Father | 854 (8.4%) | 4.19 |
| Single Female/Mother | 2,388 (23.6%) | 4.26 |
| Non-family | 1,854 (18.3%) | 1.25 |
| Total Households | 10,137 (100.0%) | 3.70 |
Household Size by Marriage Status in Montclair
Out of a total of 10,137 households in Montclair, 8,283 (81.7%) are family households, while 1,854 (18.3%) are nonfamily households. The most numerous type of family households are 2-person households, comprising 1,965, and the most common type of nonfamily households are 1-person households, comprising 1,553.
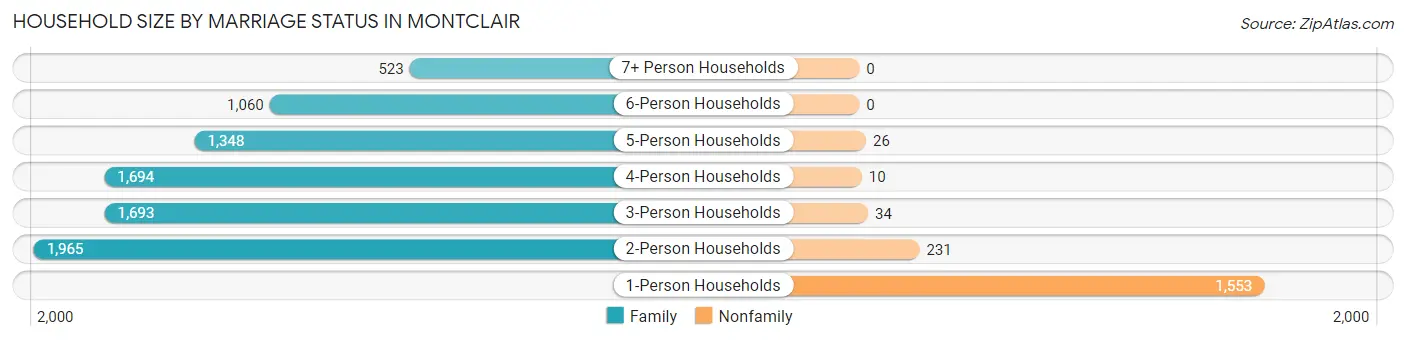
| Household Size | Family Households | Nonfamily Households |
| 1-Person Households | - | 1,553 (15.3%) |
| 2-Person Households | 1,965 (19.4%) | 231 (2.3%) |
| 3-Person Households | 1,693 (16.7%) | 34 (0.3%) |
| 4-Person Households | 1,694 (16.7%) | 10 (0.1%) |
| 5-Person Households | 1,348 (13.3%) | 26 (0.3%) |
| 6-Person Households | 1,060 (10.5%) | 0 (0.0%) |
| 7+ Person Households | 523 (5.2%) | 0 (0.0%) |
| Total | 8,283 (81.7%) | 1,854 (18.3%) |
Female Fertility in Montclair
Fertility by Age in Montclair
Average fertility rate in Montclair is 53.0 births per 1,000 women. Women in the age bracket of 20 to 34 years have the highest fertility rate with 73.0 births per 1,000 women. Women in the age bracket of 20 to 34 years acount for 59.9% of all women with births.
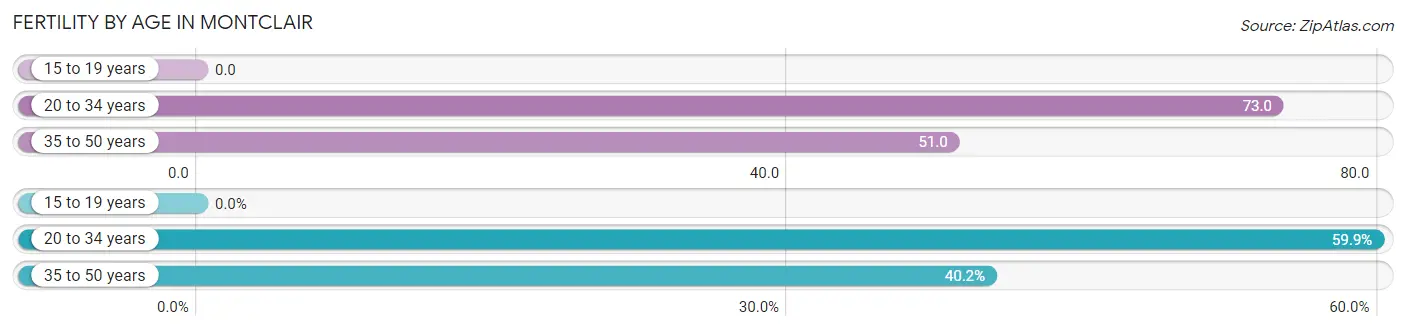
| Age Bracket | Women with Births | Births / 1,000 Women |
| 15 to 19 years | 0 (0.0%) | 0.0 |
| 20 to 34 years | 328 (59.9%) | 73.0 |
| 35 to 50 years | 220 (40.2%) | 51.0 |
| Total | 548 (100.0%) | 53.0 |
Fertility by Age by Marriage Status in Montclair
75.4% of women with births (548) in Montclair are married. The highest percentage of unmarried women with births falls into 20 to 34 years age bracket with 30.2% of them unmarried at the time of birth, while the lowest percentage of unmarried women with births belong to 35 to 50 years age bracket with 16.4% of them unmarried.
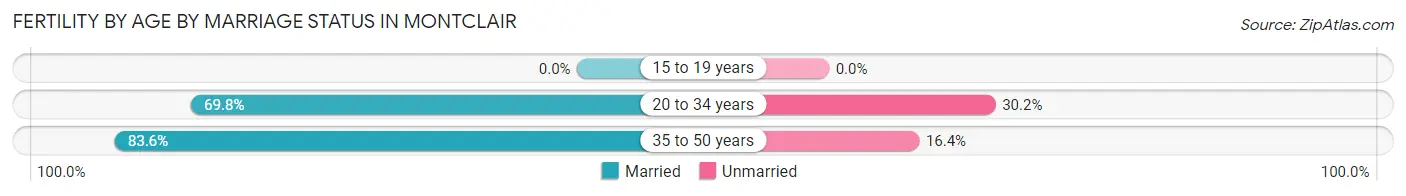
| Age Bracket | Married | Unmarried |
| 15 to 19 years | 0 (0.0%) | 0 (0.0%) |
| 20 to 34 years | 229 (69.8%) | 99 (30.2%) |
| 35 to 50 years | 184 (83.6%) | 36 (16.4%) |
| Total | 413 (75.4%) | 135 (24.6%) |
Fertility by Education in Montclair
Average fertility rate in Montclair is 53.0 births per 1,000 women. Women with the education attainment of bachelor's degree have the highest fertility rate of 117.0 births per 1,000 women, while women with the education attainment of less than high school have the lowest fertility at 23.0 births per 1,000 women. Women with the education attainment of college or associate's degree represent 33.0% of all women with births.
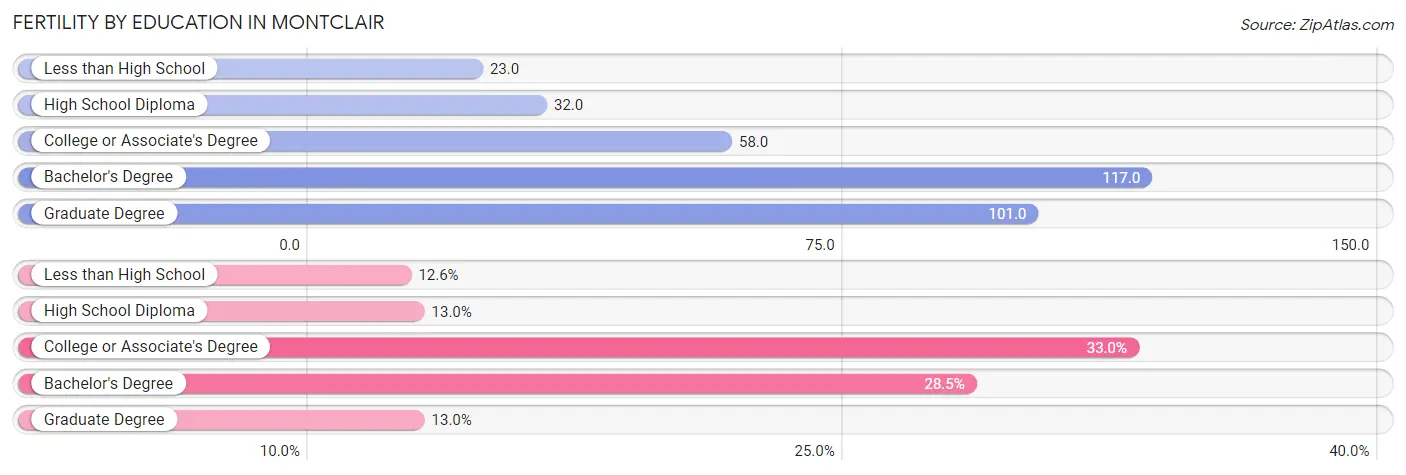
| Educational Attainment | Women with Births | Births / 1,000 Women |
| Less than High School | 69 (12.6%) | 23.0 |
| High School Diploma | 71 (13.0%) | 32.0 |
| College or Associate's Degree | 181 (33.0%) | 58.0 |
| Bachelor's Degree | 156 (28.5%) | 117.0 |
| Graduate Degree | 71 (13.0%) | 101.0 |
| Total | 548 (100.0%) | 53.0 |
Fertility by Education by Marriage Status in Montclair
24.6% of women with births in Montclair are unmarried. Women with the educational attainment of less than high school are most likely to be married with 100.0% of them married at childbirth, while women with the educational attainment of high school diploma are least likely to be married with 64.8% of them unmarried at childbirth.
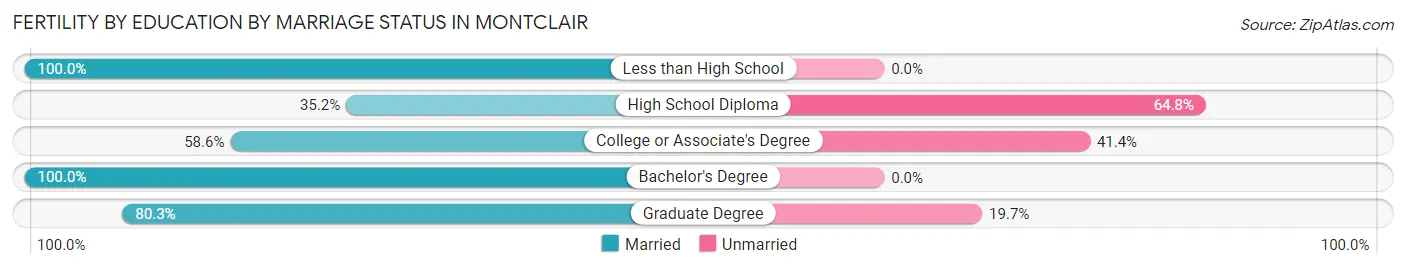
| Educational Attainment | Married | Unmarried |
| Less than High School | 69 (100.0%) | 0 (0.0%) |
| High School Diploma | 25 (35.2%) | 46 (64.8%) |
| College or Associate's Degree | 106 (58.6%) | 75 (41.4%) |
| Bachelor's Degree | 156 (100.0%) | 0 (0.0%) |
| Graduate Degree | 57 (80.3%) | 14 (19.7%) |
| Total | 413 (75.4%) | 135 (24.6%) |
Employment Characteristics in Montclair
Employment by Class of Employer in Montclair
Among the 16,686 employed individuals in Montclair, private company employees (11,753 | 70.4%), self-employed (not incorporated) (1,276 | 7.6%), and not-for-profit organizations (1,127 | 6.8%) make up the most common classes of employment.
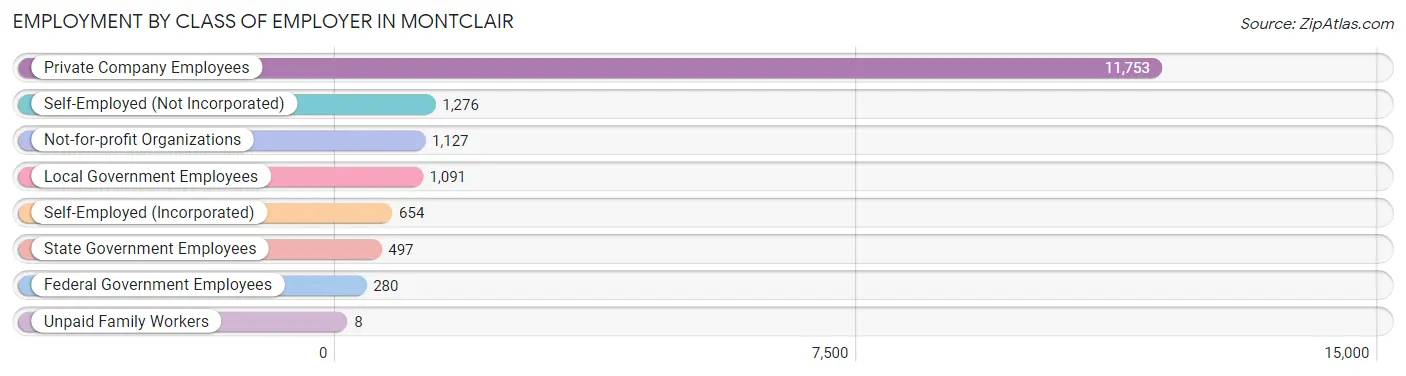
| Employer Class | # Employees | % Employees |
| Private Company Employees | 11,753 | 70.4% |
| Self-Employed (Incorporated) | 654 | 3.9% |
| Self-Employed (Not Incorporated) | 1,276 | 7.6% |
| Not-for-profit Organizations | 1,127 | 6.8% |
| Local Government Employees | 1,091 | 6.5% |
| State Government Employees | 497 | 3.0% |
| Federal Government Employees | 280 | 1.7% |
| Unpaid Family Workers | 8 | 0.1% |
| Total | 16,686 | 100.0% |
Employment Status by Age in Montclair
According to the labor force statistics for Montclair, out of the total population over 16 years of age (29,567), 62.1% or 18,361 individuals are in the labor force, with 6.4% or 1,175 of them unemployed. The age group with the highest labor force participation rate is 25 to 29 years, with 83.4% or 2,730 individuals in the labor force. Within the labor force, the 20 to 24 years age range has the highest percentage of unemployed individuals, with 8.2% or 194 of them being unemployed.
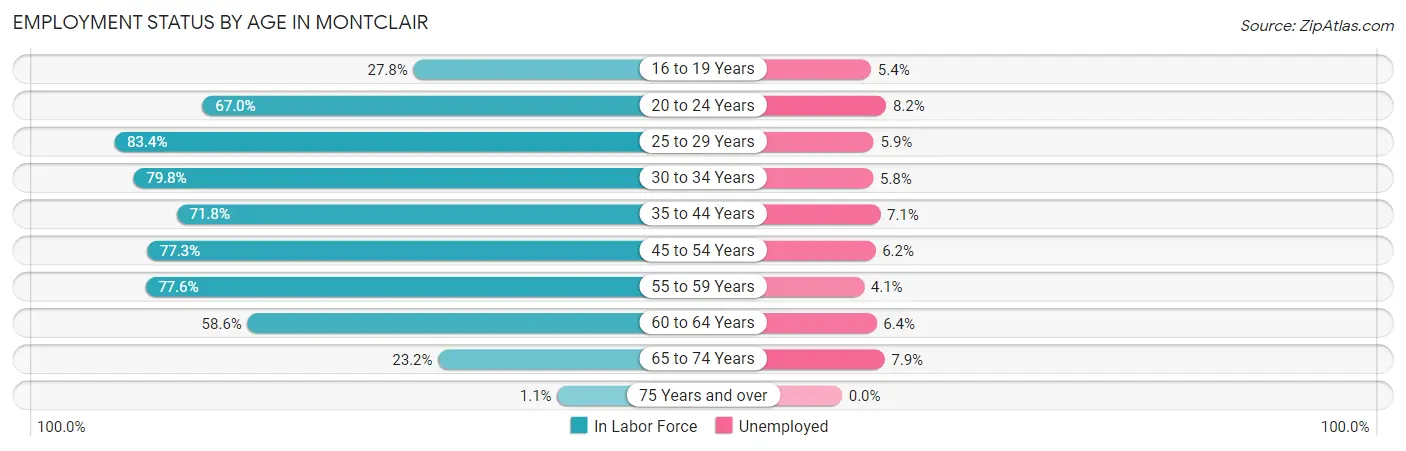
| Age Bracket | In Labor Force | Unemployed |
| 16 to 19 Years | 644 (27.8%) | 35 (5.4%) |
| 20 to 24 Years | 2,368 (67.0%) | 194 (8.2%) |
| 25 to 29 Years | 2,730 (83.4%) | 161 (5.9%) |
| 30 to 34 Years | 2,260 (79.8%) | 131 (5.8%) |
| 35 to 44 Years | 3,436 (71.8%) | 244 (7.1%) |
| 45 to 54 Years | 3,626 (77.3%) | 225 (6.2%) |
| 55 to 59 Years | 1,694 (77.6%) | 69 (4.1%) |
| 60 to 64 Years | 1,020 (58.6%) | 65 (6.4%) |
| 65 to 74 Years | 558 (23.2%) | 44 (7.9%) |
| 75 Years and over | 20 (1.1%) | 0 (0.0%) |
| Total | 18,361 (62.1%) | 1,175 (6.4%) |
Employment Status by Educational Attainment in Montclair
According to labor force statistics for Montclair, 75.7% of individuals (14,765) out of the total population between 25 and 64 years of age (19,505) are in the labor force, with 6.1% or 901 of them being unemployed. The group with the highest labor force participation rate are those with the educational attainment of bachelor's degree or higher, with 85.4% or 3,323 individuals in the labor force. Within the labor force, individuals with bachelor's degree or higher education have the highest percentage of unemployment, with 9.1% or 302 of them being unemployed.
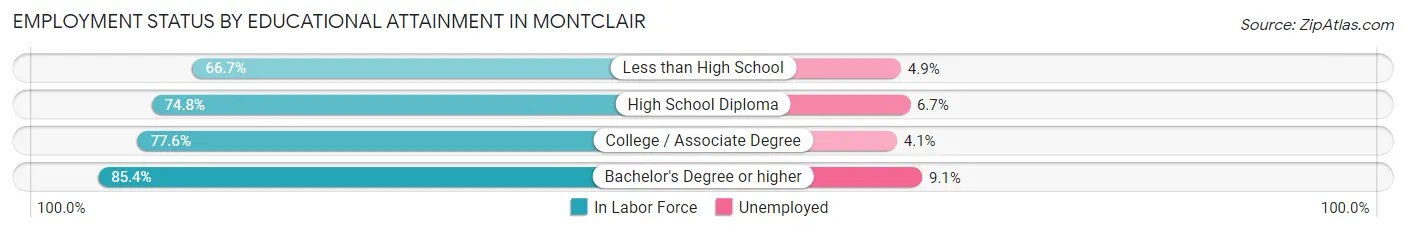
| Educational Attainment | In Labor Force | Unemployed |
| Less than High School | 3,310 (66.7%) | 243 (4.9%) |
| High School Diploma | 3,643 (74.8%) | 326 (6.7%) |
| College / Associate Degree | 4,487 (77.6%) | 237 (4.1%) |
| Bachelor's Degree or higher | 3,323 (85.4%) | 354 (9.1%) |
| Total | 14,765 (75.7%) | 1,190 (6.1%) |
Employment Occupations by Sex in Montclair
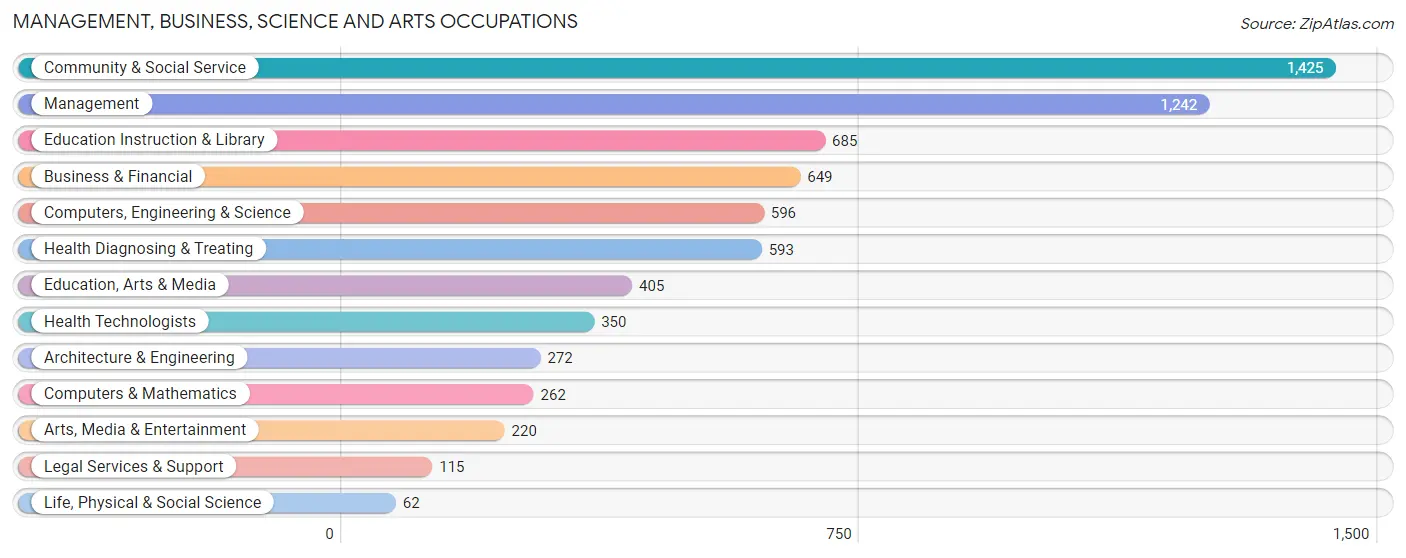
Management, Business, Science and Arts Occupations
The most common Management, Business, Science and Arts occupations in Montclair are Community & Social Service (1,425 | 8.3%), Management (1,242 | 7.3%), Education Instruction & Library (685 | 4.0%), Business & Financial (649 | 3.8%), and Computers, Engineering & Science (596 | 3.5%).
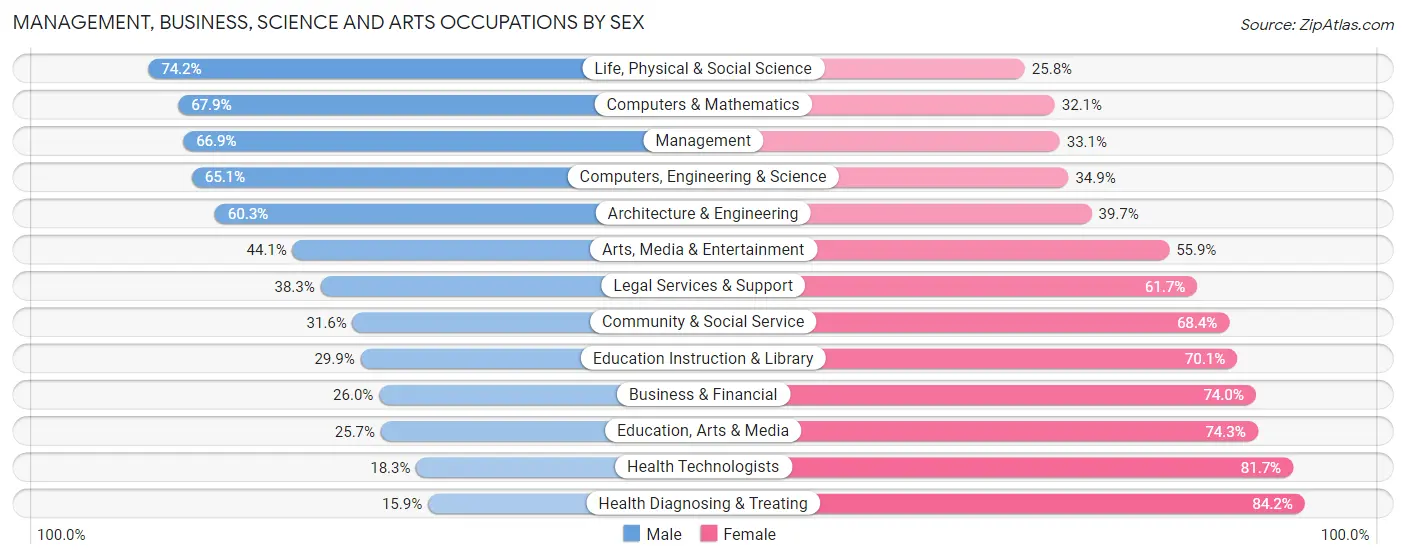
Management, Business, Science and Arts Occupations by Sex
Within the Management, Business, Science and Arts occupations in Montclair, the most male-oriented occupations are Life, Physical & Social Science (74.2%), Computers & Mathematics (67.9%), and Management (66.9%), while the most female-oriented occupations are Health Diagnosing & Treating (84.2%), Health Technologists (81.7%), and Education, Arts & Media (74.3%).
| Occupation | Male | Female |
| Management | 831 (66.9%) | 411 (33.1%) |
| Business & Financial | 169 (26.0%) | 480 (74.0%) |
| Computers, Engineering & Science | 388 (65.1%) | 208 (34.9%) |
| Computers & Mathematics | 178 (67.9%) | 84 (32.1%) |
| Architecture & Engineering | 164 (60.3%) | 108 (39.7%) |
| Life, Physical & Social Science | 46 (74.2%) | 16 (25.8%) |
| Community & Social Service | 450 (31.6%) | 975 (68.4%) |
| Education, Arts & Media | 104 (25.7%) | 301 (74.3%) |
| Legal Services & Support | 44 (38.3%) | 71 (61.7%) |
| Education Instruction & Library | 205 (29.9%) | 480 (70.1%) |
| Arts, Media & Entertainment | 97 (44.1%) | 123 (55.9%) |
| Health Diagnosing & Treating | 94 (15.9%) | 499 (84.2%) |
| Health Technologists | 64 (18.3%) | 286 (81.7%) |
| Total (Category) | 1,932 (42.9%) | 2,573 (57.1%) |
| Total (Overall) | 8,879 (51.9%) | 8,229 (48.1%) |
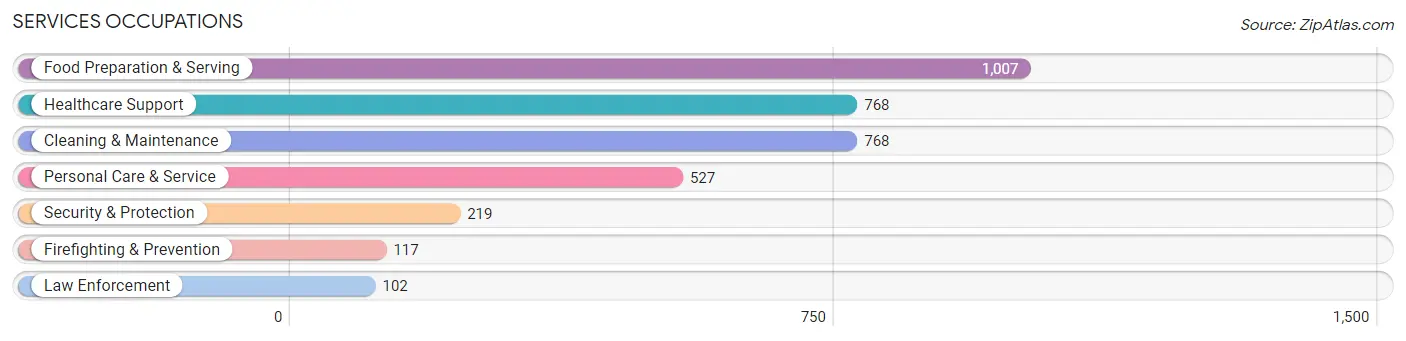
Services Occupations
The most common Services occupations in Montclair are Food Preparation & Serving (1,007 | 5.9%), Healthcare Support (768 | 4.5%), Cleaning & Maintenance (768 | 4.5%), Personal Care & Service (527 | 3.1%), and Security & Protection (219 | 1.3%).
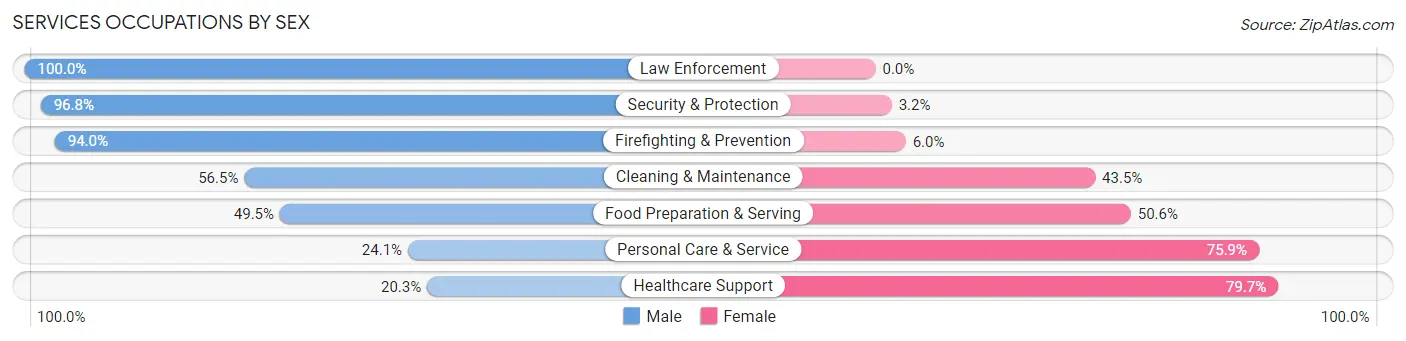
Services Occupations by Sex
Within the Services occupations in Montclair, the most male-oriented occupations are Law Enforcement (100.0%), Security & Protection (96.8%), and Firefighting & Prevention (94.0%), while the most female-oriented occupations are Healthcare Support (79.7%), Personal Care & Service (75.9%), and Food Preparation & Serving (50.5%).
| Occupation | Male | Female |
| Healthcare Support | 156 (20.3%) | 612 (79.7%) |
| Security & Protection | 212 (96.8%) | 7 (3.2%) |
| Firefighting & Prevention | 110 (94.0%) | 7 (6.0%) |
| Law Enforcement | 102 (100.0%) | 0 (0.0%) |
| Food Preparation & Serving | 498 (49.4%) | 509 (50.5%) |
| Cleaning & Maintenance | 434 (56.5%) | 334 (43.5%) |
| Personal Care & Service | 127 (24.1%) | 400 (75.9%) |
| Total (Category) | 1,427 (43.4%) | 1,862 (56.6%) |
| Total (Overall) | 8,879 (51.9%) | 8,229 (48.1%) |
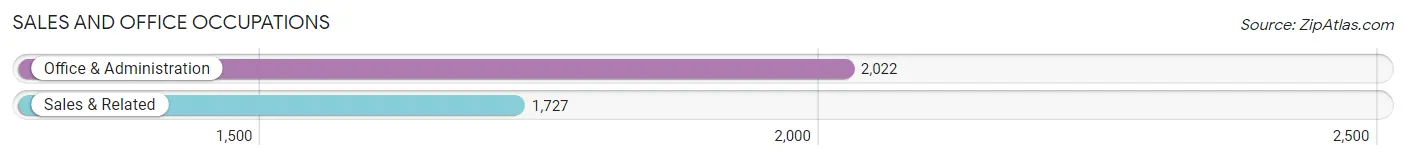
Sales and Office Occupations
The most common Sales and Office occupations in Montclair are Office & Administration (2,022 | 11.8%), and Sales & Related (1,727 | 10.1%).
Sales and Office Occupations by Sex
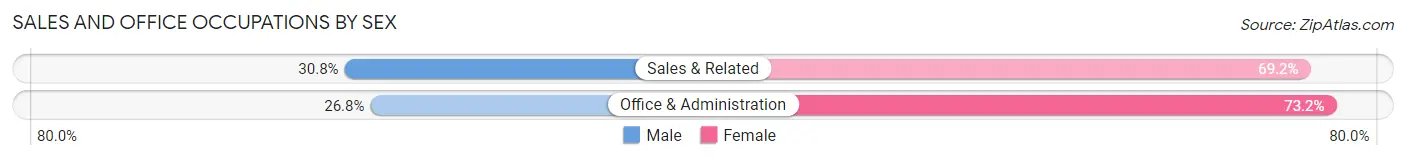
| Occupation | Male | Female |
| Sales & Related | 532 (30.8%) | 1,195 (69.2%) |
| Office & Administration | 542 (26.8%) | 1,480 (73.2%) |
| Total (Category) | 1,074 (28.6%) | 2,675 (71.4%) |
| Total (Overall) | 8,879 (51.9%) | 8,229 (48.1%) |
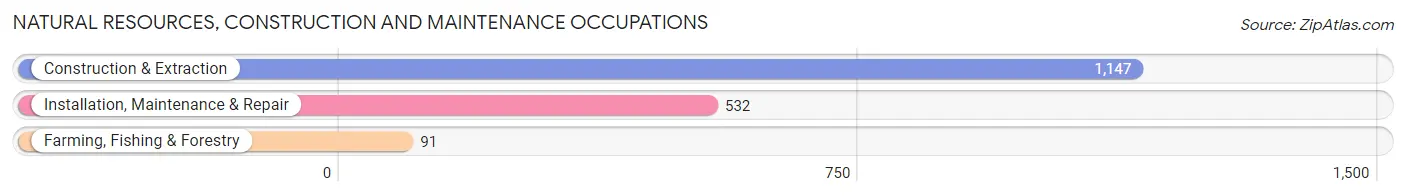
Natural Resources, Construction and Maintenance Occupations
The most common Natural Resources, Construction and Maintenance occupations in Montclair are Construction & Extraction (1,147 | 6.7%), Installation, Maintenance & Repair (532 | 3.1%), and Farming, Fishing & Forestry (91 | 0.5%).
Natural Resources, Construction and Maintenance Occupations by Sex
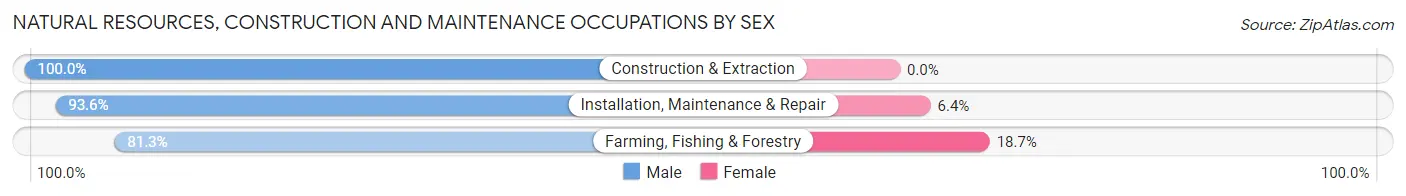
| Occupation | Male | Female |
| Farming, Fishing & Forestry | 74 (81.3%) | 17 (18.7%) |
| Construction & Extraction | 1,147 (100.0%) | 0 (0.0%) |
| Installation, Maintenance & Repair | 498 (93.6%) | 34 (6.4%) |
| Total (Category) | 1,719 (97.1%) | 51 (2.9%) |
| Total (Overall) | 8,879 (51.9%) | 8,229 (48.1%) |
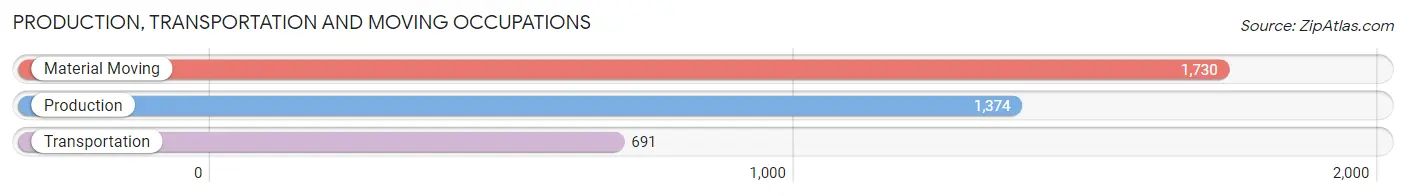
Production, Transportation and Moving Occupations
The most common Production, Transportation and Moving occupations in Montclair are Material Moving (1,730 | 10.1%), Production (1,374 | 8.0%), and Transportation (691 | 4.0%).
Production, Transportation and Moving Occupations by Sex
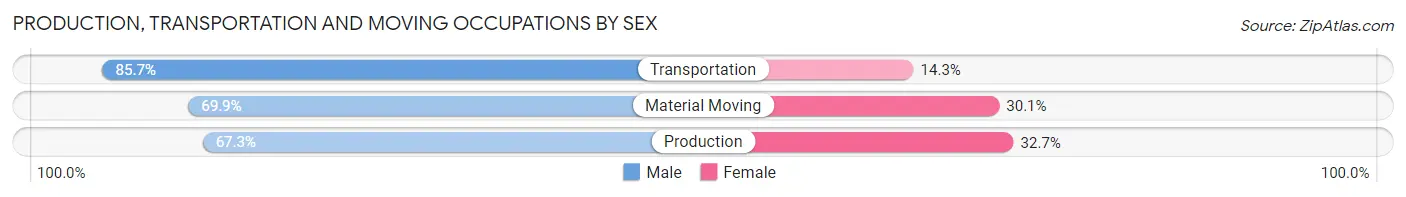
| Occupation | Male | Female |
| Production | 925 (67.3%) | 449 (32.7%) |
| Transportation | 592 (85.7%) | 99 (14.3%) |
| Material Moving | 1,210 (69.9%) | 520 (30.1%) |
| Total (Category) | 2,727 (71.9%) | 1,068 (28.1%) |
| Total (Overall) | 8,879 (51.9%) | 8,229 (48.1%) |
Employment Industries by Sex in Montclair
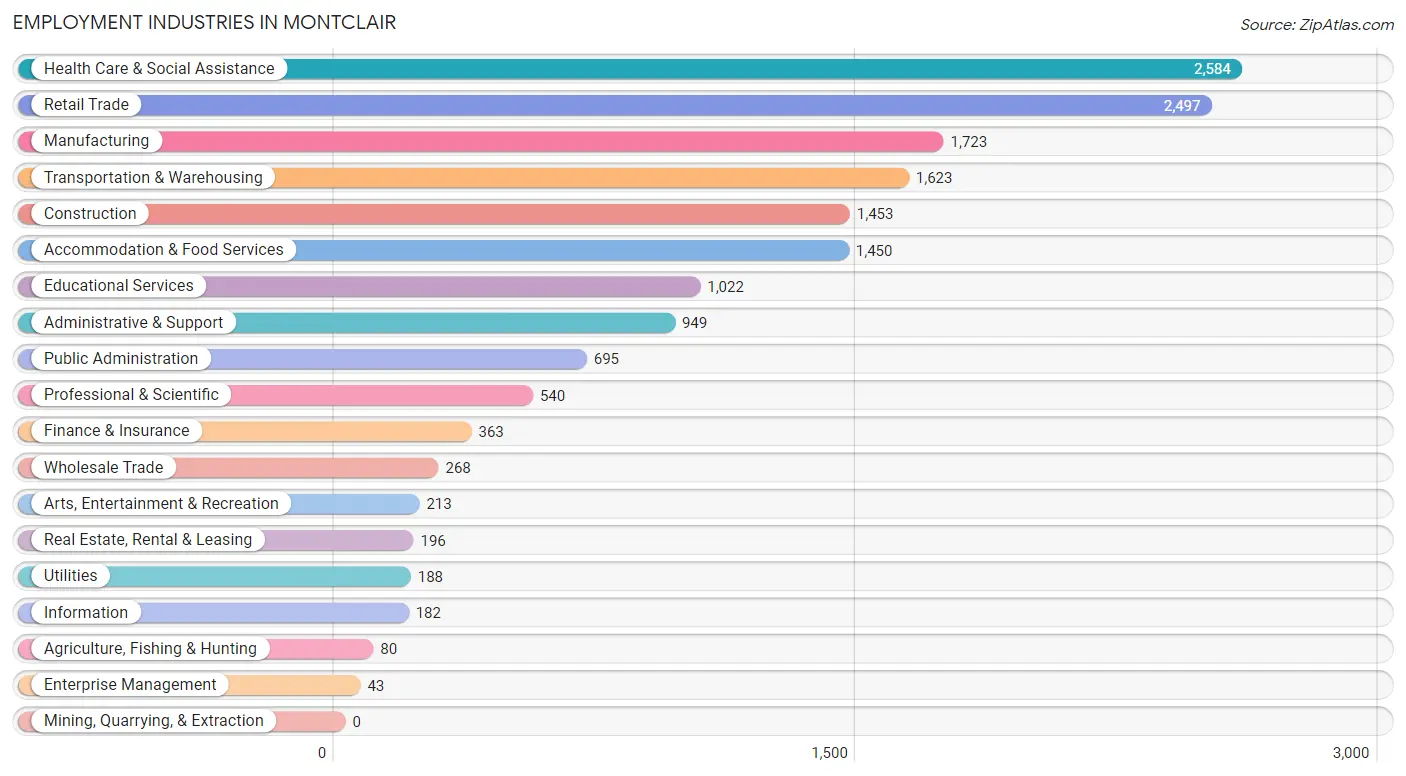
Employment Industries in Montclair
The major employment industries in Montclair include Health Care & Social Assistance (2,584 | 15.1%), Retail Trade (2,497 | 14.6%), Manufacturing (1,723 | 10.1%), Transportation & Warehousing (1,623 | 9.5%), and Construction (1,453 | 8.5%).
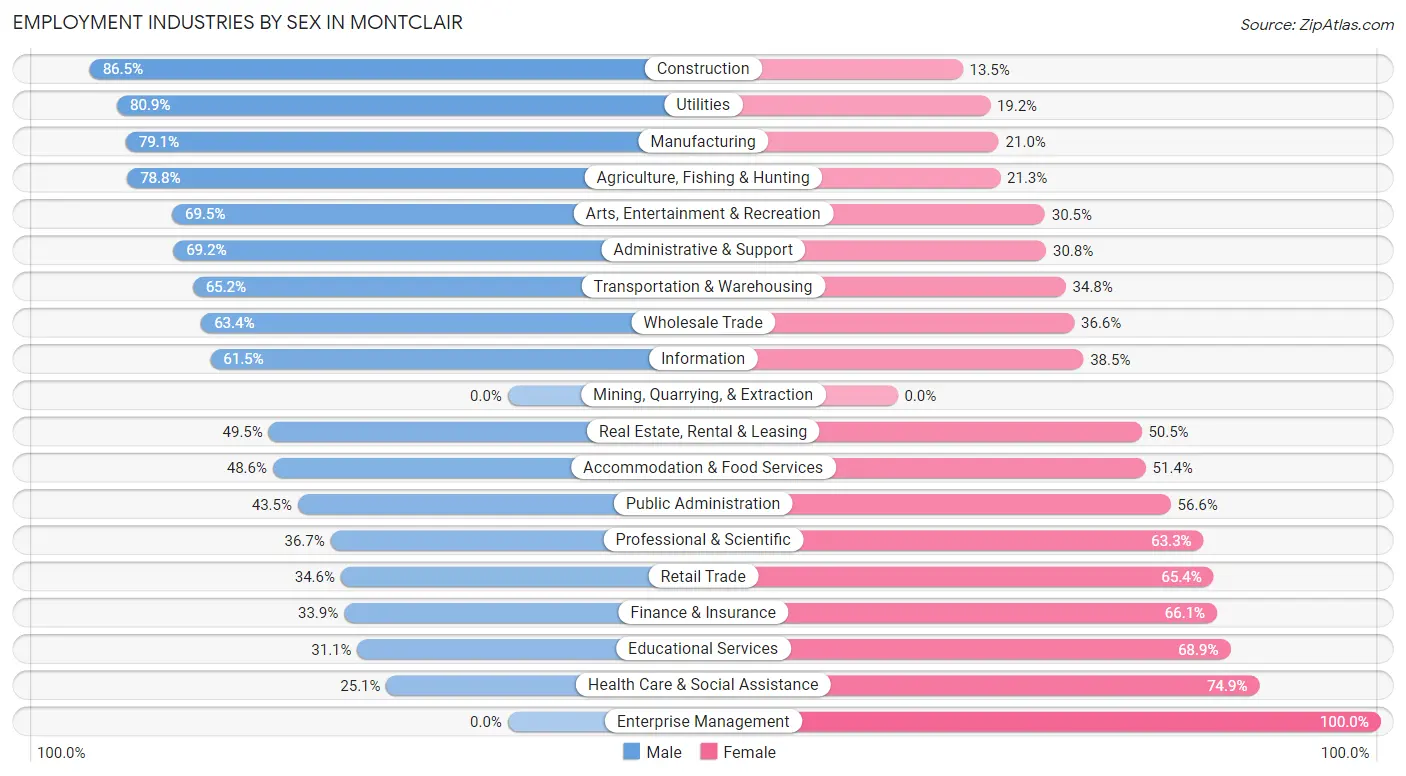
Employment Industries by Sex in Montclair
The Montclair industries that see more men than women are Construction (86.5%), Utilities (80.8%), and Manufacturing (79.0%), whereas the industries that tend to have a higher number of women are Enterprise Management (100.0%), Health Care & Social Assistance (74.9%), and Educational Services (68.9%).
| Industry | Male | Female |
| Agriculture, Fishing & Hunting | 63 (78.7%) | 17 (21.2%) |
| Mining, Quarrying, & Extraction | 0 (0.0%) | 0 (0.0%) |
| Construction | 1,257 (86.5%) | 196 (13.5%) |
| Manufacturing | 1,362 (79.0%) | 361 (20.9%) |
| Wholesale Trade | 170 (63.4%) | 98 (36.6%) |
| Retail Trade | 863 (34.6%) | 1,634 (65.4%) |
| Transportation & Warehousing | 1,058 (65.2%) | 565 (34.8%) |
| Utilities | 152 (80.8%) | 36 (19.2%) |
| Information | 112 (61.5%) | 70 (38.5%) |
| Finance & Insurance | 123 (33.9%) | 240 (66.1%) |
| Real Estate, Rental & Leasing | 97 (49.5%) | 99 (50.5%) |
| Professional & Scientific | 198 (36.7%) | 342 (63.3%) |
| Enterprise Management | 0 (0.0%) | 43 (100.0%) |
| Administrative & Support | 657 (69.2%) | 292 (30.8%) |
| Educational Services | 318 (31.1%) | 704 (68.9%) |
| Health Care & Social Assistance | 649 (25.1%) | 1,935 (74.9%) |
| Arts, Entertainment & Recreation | 148 (69.5%) | 65 (30.5%) |
| Accommodation & Food Services | 705 (48.6%) | 745 (51.4%) |
| Public Administration | 302 (43.4%) | 393 (56.6%) |
| Total | 8,879 (51.9%) | 8,229 (48.1%) |
Education in Montclair
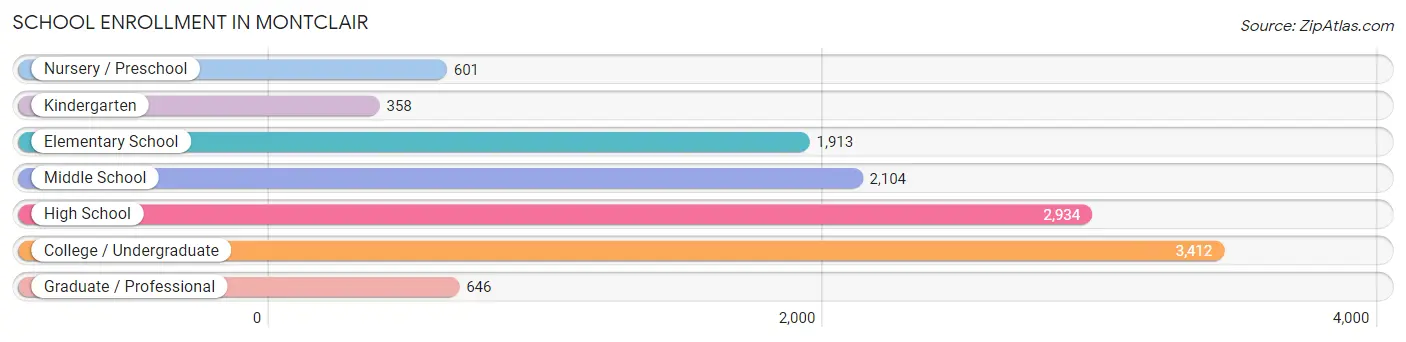
School Enrollment in Montclair
The most common levels of schooling among the 11,968 students in Montclair are college / undergraduate (3,412 | 28.5%), high school (2,934 | 24.5%), and middle school (2,104 | 17.6%).
| School Level | # Students | % Students |
| Nursery / Preschool | 601 | 5.0% |
| Kindergarten | 358 | 3.0% |
| Elementary School | 1,913 | 16.0% |
| Middle School | 2,104 | 17.6% |
| High School | 2,934 | 24.5% |
| College / Undergraduate | 3,412 | 28.5% |
| Graduate / Professional | 646 | 5.4% |
| Total | 11,968 | 100.0% |
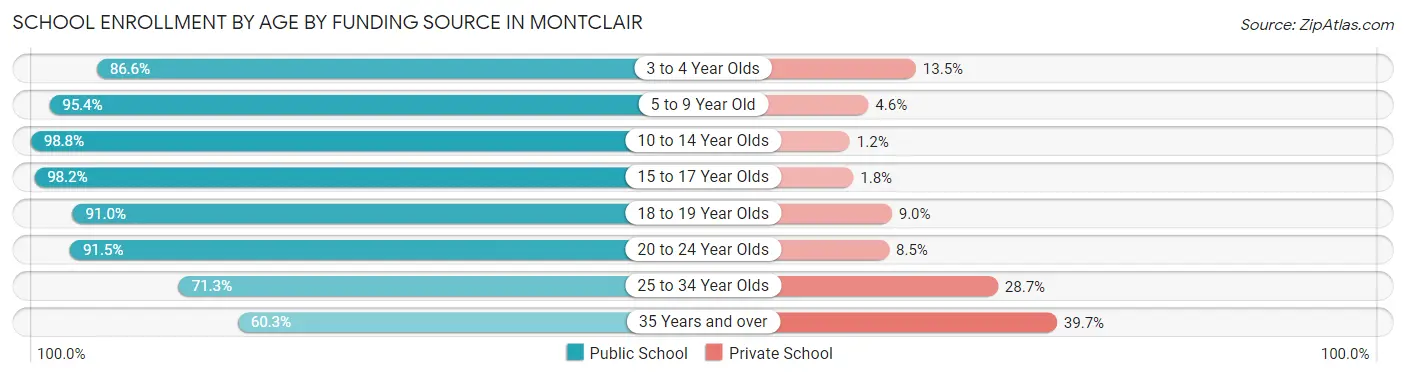
School Enrollment by Age by Funding Source in Montclair
Out of a total of 11,968 students who are enrolled in schools in Montclair, 1,065 (8.9%) attend a private institution, while the remaining 10,903 (91.1%) are enrolled in public schools. The age group of 35 years and over has the highest likelihood of being enrolled in private schools, with 309 (39.7% in the age bracket) enrolled. Conversely, the age group of 10 to 14 year olds has the lowest likelihood of being enrolled in a private school, with 2,974 (98.8% in the age bracket) attending a public institution.
| Age Bracket | Public School | Private School |
| 3 to 4 Year Olds | 386 (86.6%) | 60 (13.5%) |
| 5 to 9 Year Old | 2,050 (95.4%) | 99 (4.6%) |
| 10 to 14 Year Olds | 2,974 (98.8%) | 35 (1.2%) |
| 15 to 17 Year Olds | 1,796 (98.2%) | 33 (1.8%) |
| 18 to 19 Year Olds | 721 (91.0%) | 71 (9.0%) |
| 20 to 24 Year Olds | 1,752 (91.5%) | 162 (8.5%) |
| 25 to 34 Year Olds | 749 (71.3%) | 302 (28.7%) |
| 35 Years and over | 469 (60.3%) | 309 (39.7%) |
| Total | 10,903 (91.1%) | 1,065 (8.9%) |
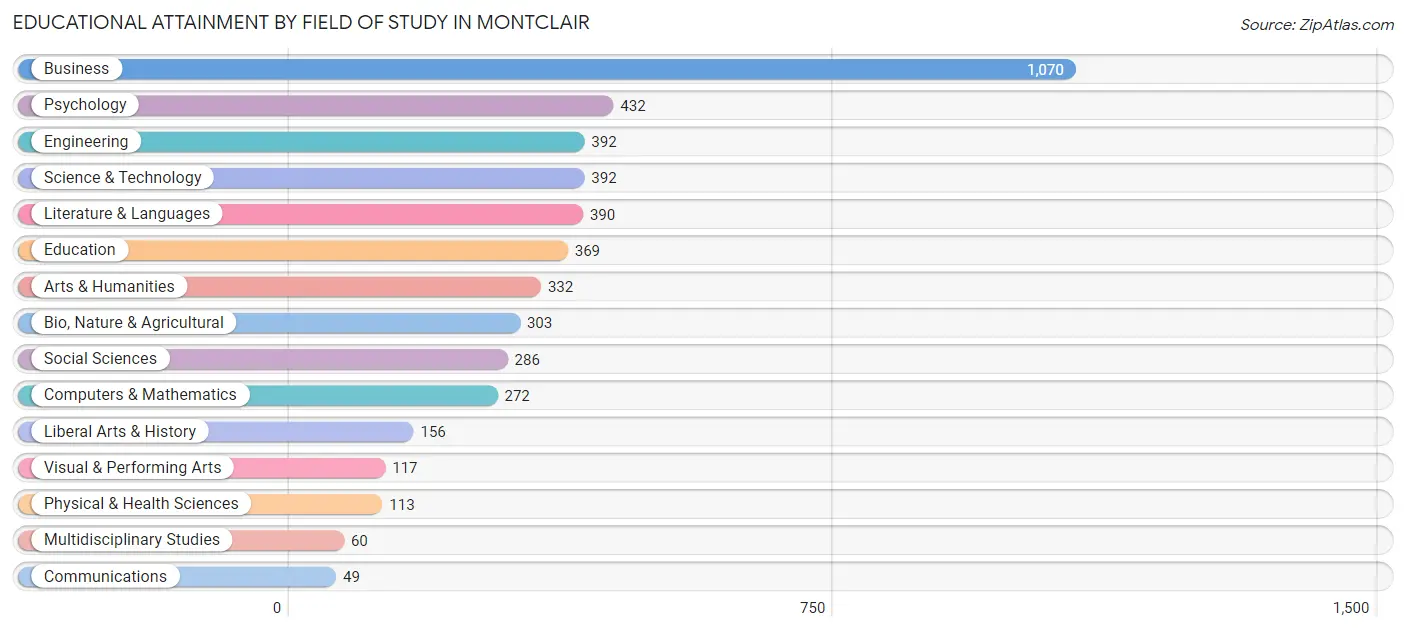
Educational Attainment by Field of Study in Montclair
Business (1,070 | 22.6%), psychology (432 | 9.1%), engineering (392 | 8.3%), science & technology (392 | 8.3%), and literature & languages (390 | 8.2%) are the most common fields of study among 4,733 individuals in Montclair who have obtained a bachelor's degree or higher.
| Field of Study | # Graduates | % Graduates |
| Computers & Mathematics | 272 | 5.8% |
| Bio, Nature & Agricultural | 303 | 6.4% |
| Physical & Health Sciences | 113 | 2.4% |
| Psychology | 432 | 9.1% |
| Social Sciences | 286 | 6.0% |
| Engineering | 392 | 8.3% |
| Multidisciplinary Studies | 60 | 1.3% |
| Science & Technology | 392 | 8.3% |
| Business | 1,070 | 22.6% |
| Education | 369 | 7.8% |
| Literature & Languages | 390 | 8.2% |
| Liberal Arts & History | 156 | 3.3% |
| Visual & Performing Arts | 117 | 2.5% |
| Communications | 49 | 1.0% |
| Arts & Humanities | 332 | 7.0% |
| Total | 4,733 | 100.0% |
Transportation & Commute in Montclair
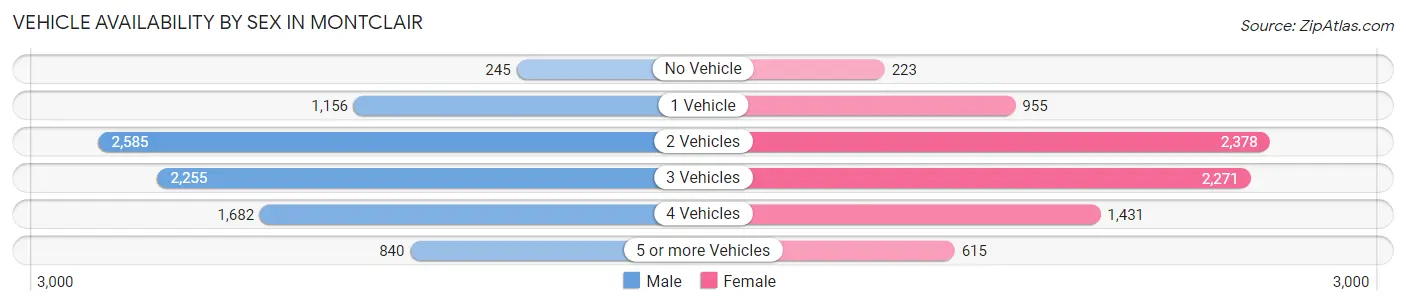
Vehicle Availability by Sex in Montclair
The most prevalent vehicle ownership categories in Montclair are males with 2 vehicles (2,585, accounting for 29.5%) and females with 2 vehicles (2,378, making up 32.8%).
| Vehicles Available | Male | Female |
| No Vehicle | 245 (2.8%) | 223 (2.8%) |
| 1 Vehicle | 1,156 (13.2%) | 955 (12.1%) |
| 2 Vehicles | 2,585 (29.5%) | 2,378 (30.2%) |
| 3 Vehicles | 2,255 (25.7%) | 2,271 (28.8%) |
| 4 Vehicles | 1,682 (19.2%) | 1,431 (18.2%) |
| 5 or more Vehicles | 840 (9.6%) | 615 (7.8%) |
| Total | 8,763 (100.0%) | 7,873 (100.0%) |
Commute Time in Montclair
The most frequently occuring commute durations in Montclair are 20 to 24 minutes (2,698 commuters, 17.1%), 15 to 19 minutes (2,655 commuters, 16.8%), and 30 to 34 minutes (1,871 commuters, 11.8%).
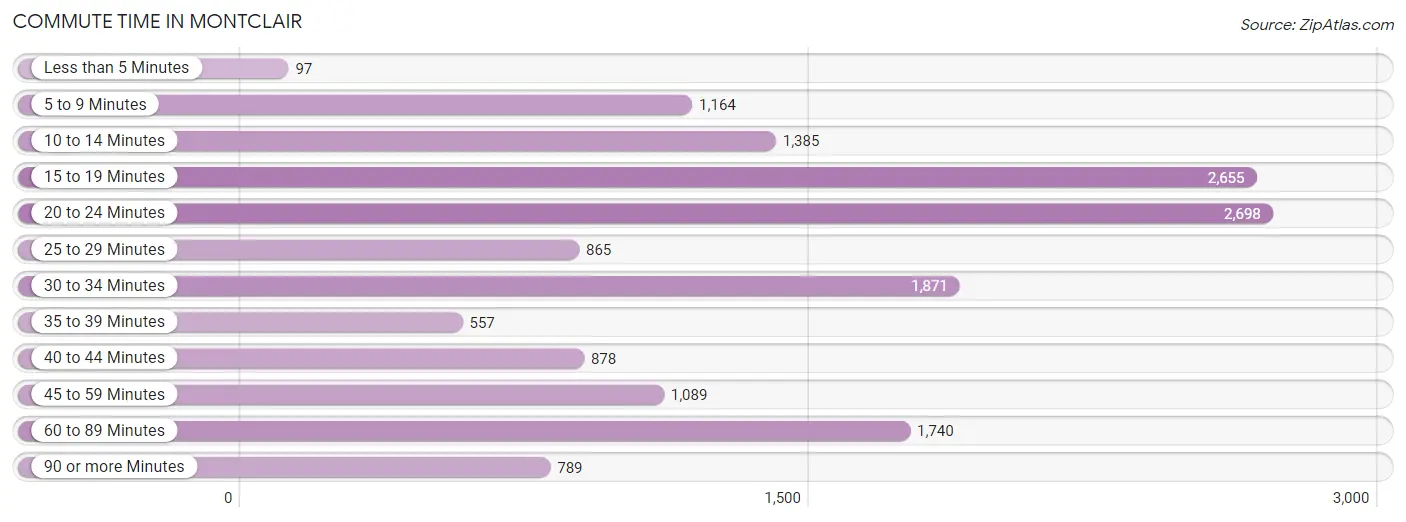
| Commute Time | # Commuters | % Commuters |
| Less than 5 Minutes | 97 | 0.6% |
| 5 to 9 Minutes | 1,164 | 7.4% |
| 10 to 14 Minutes | 1,385 | 8.8% |
| 15 to 19 Minutes | 2,655 | 16.8% |
| 20 to 24 Minutes | 2,698 | 17.1% |
| 25 to 29 Minutes | 865 | 5.5% |
| 30 to 34 Minutes | 1,871 | 11.8% |
| 35 to 39 Minutes | 557 | 3.5% |
| 40 to 44 Minutes | 878 | 5.6% |
| 45 to 59 Minutes | 1,089 | 6.9% |
| 60 to 89 Minutes | 1,740 | 11.0% |
| 90 or more Minutes | 789 | 5.0% |
Commute Time by Sex in Montclair
The most common commute times in Montclair are 20 to 24 minutes (1,730 commuters, 20.6%) for males and 15 to 19 minutes (1,664 commuters, 22.5%) for females.
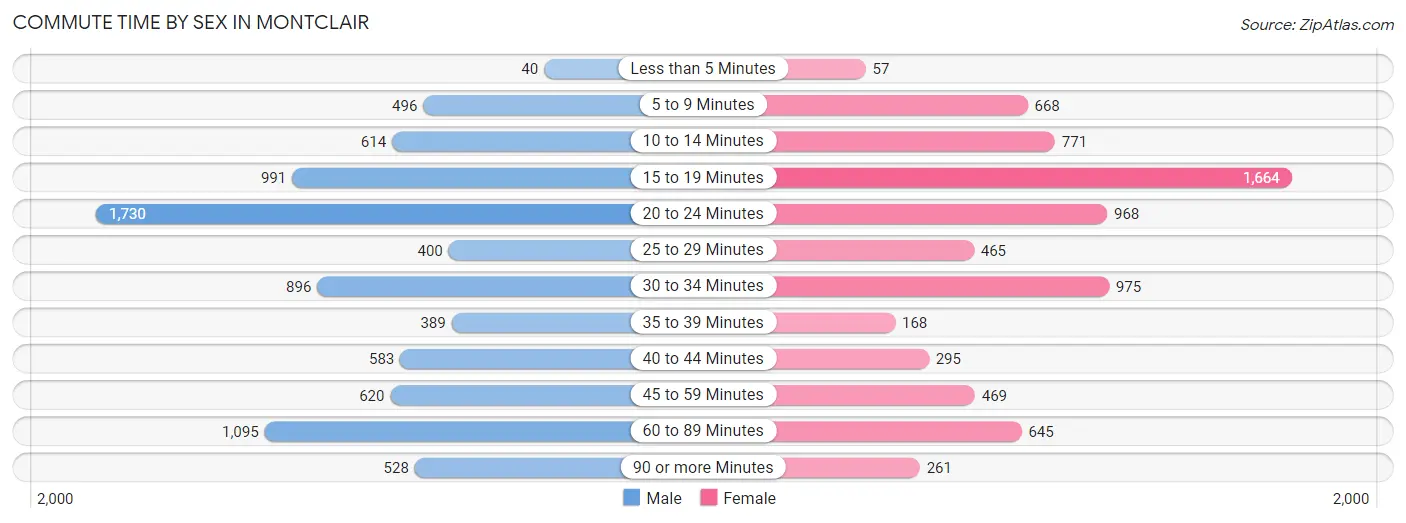
| Commute Time | Male | Female |
| Less than 5 Minutes | 40 (0.5%) | 57 (0.8%) |
| 5 to 9 Minutes | 496 (5.9%) | 668 (9.0%) |
| 10 to 14 Minutes | 614 (7.3%) | 771 (10.4%) |
| 15 to 19 Minutes | 991 (11.8%) | 1,664 (22.5%) |
| 20 to 24 Minutes | 1,730 (20.6%) | 968 (13.1%) |
| 25 to 29 Minutes | 400 (4.8%) | 465 (6.3%) |
| 30 to 34 Minutes | 896 (10.7%) | 975 (13.2%) |
| 35 to 39 Minutes | 389 (4.6%) | 168 (2.3%) |
| 40 to 44 Minutes | 583 (7.0%) | 295 (4.0%) |
| 45 to 59 Minutes | 620 (7.4%) | 469 (6.3%) |
| 60 to 89 Minutes | 1,095 (13.1%) | 645 (8.7%) |
| 90 or more Minutes | 528 (6.3%) | 261 (3.5%) |
Time of Departure to Work by Sex in Montclair
The most frequent times of departure to work in Montclair are 12:00 AM to 4:59 AM (1,234, 14.7%) for males and 7:00 AM to 7:29 AM (1,014, 13.7%) for females.
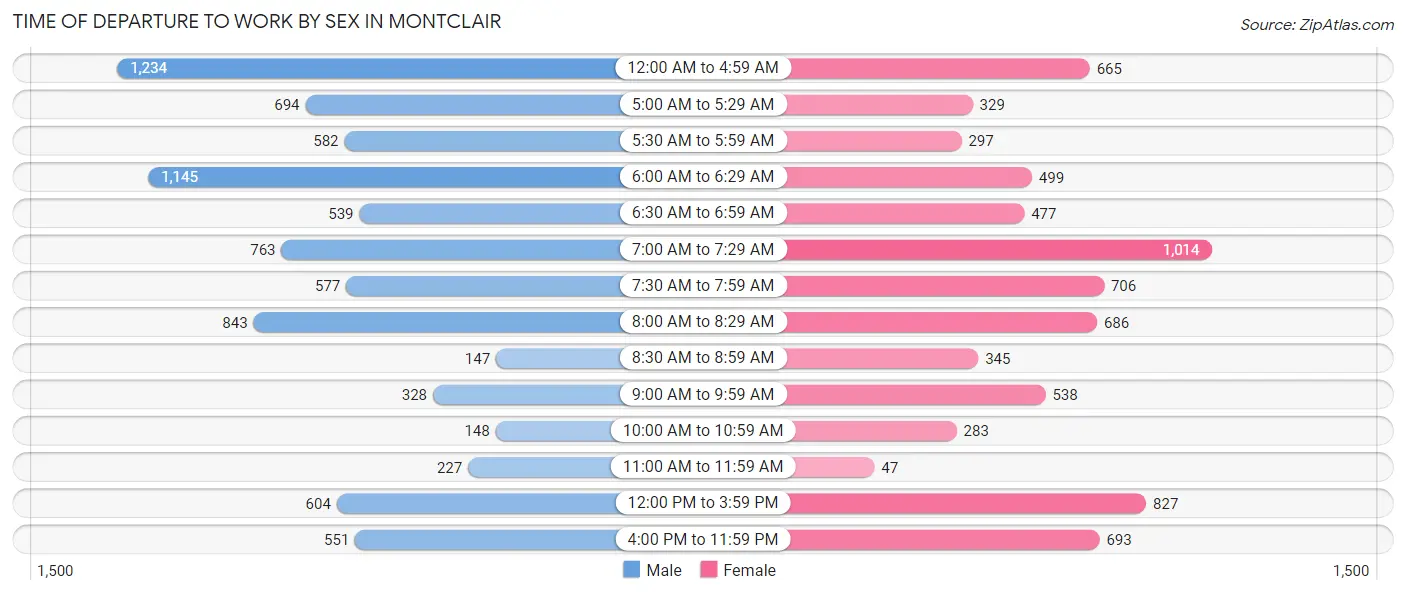
| Time of Departure | Male | Female |
| 12:00 AM to 4:59 AM | 1,234 (14.7%) | 665 (9.0%) |
| 5:00 AM to 5:29 AM | 694 (8.3%) | 329 (4.4%) |
| 5:30 AM to 5:59 AM | 582 (6.9%) | 297 (4.0%) |
| 6:00 AM to 6:29 AM | 1,145 (13.7%) | 499 (6.7%) |
| 6:30 AM to 6:59 AM | 539 (6.4%) | 477 (6.4%) |
| 7:00 AM to 7:29 AM | 763 (9.1%) | 1,014 (13.7%) |
| 7:30 AM to 7:59 AM | 577 (6.9%) | 706 (9.5%) |
| 8:00 AM to 8:29 AM | 843 (10.1%) | 686 (9.3%) |
| 8:30 AM to 8:59 AM | 147 (1.8%) | 345 (4.7%) |
| 9:00 AM to 9:59 AM | 328 (3.9%) | 538 (7.3%) |
| 10:00 AM to 10:59 AM | 148 (1.8%) | 283 (3.8%) |
| 11:00 AM to 11:59 AM | 227 (2.7%) | 47 (0.6%) |
| 12:00 PM to 3:59 PM | 604 (7.2%) | 827 (11.2%) |
| 4:00 PM to 11:59 PM | 551 (6.6%) | 693 (9.4%) |
| Total | 8,382 (100.0%) | 7,406 (100.0%) |
Housing Occupancy in Montclair
Occupancy by Ownership in Montclair
Of the total 10,137 dwellings in Montclair, owner-occupied units account for 5,504 (54.3%), while renter-occupied units make up 4,633 (45.7%).
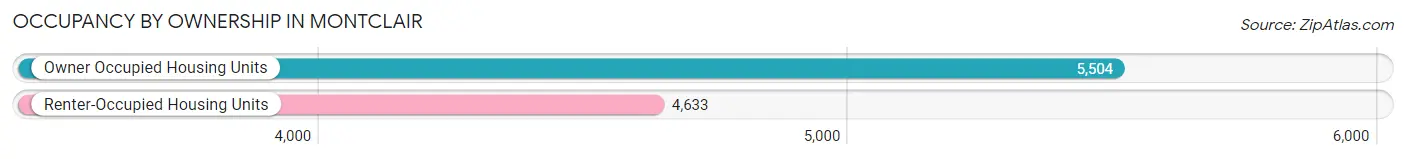
| Occupancy | # Housing Units | % Housing Units |
| Owner Occupied Housing Units | 5,504 | 54.3% |
| Renter-Occupied Housing Units | 4,633 | 45.7% |
| Total Occupied Housing Units | 10,137 | 100.0% |
Occupancy by Household Size in Montclair
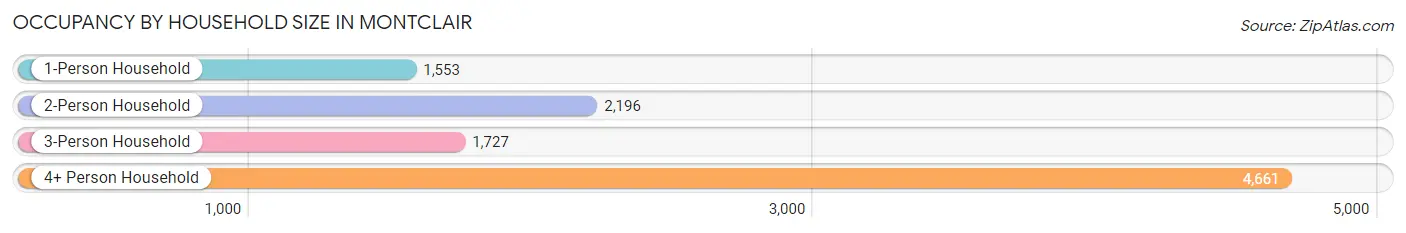
| Household Size | # Housing Units | % Housing Units |
| 1-Person Household | 1,553 | 15.3% |
| 2-Person Household | 2,196 | 21.7% |
| 3-Person Household | 1,727 | 17.0% |
| 4+ Person Household | 4,661 | 46.0% |
| Total Housing Units | 10,137 | 100.0% |
Occupancy by Ownership by Household Size in Montclair
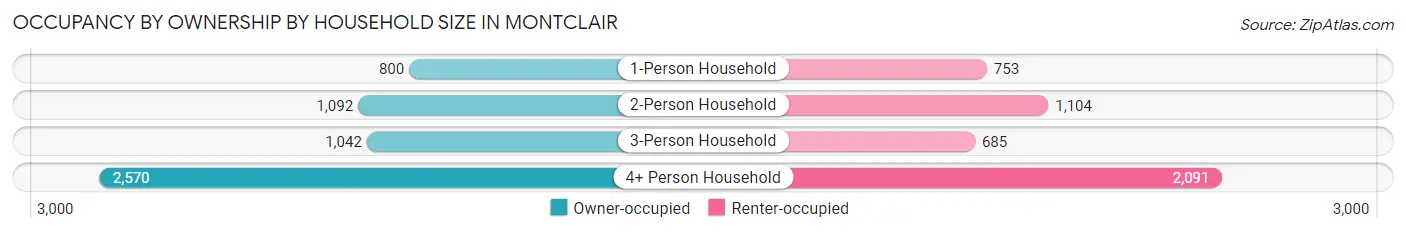
| Household Size | Owner-occupied | Renter-occupied |
| 1-Person Household | 800 (51.5%) | 753 (48.5%) |
| 2-Person Household | 1,092 (49.7%) | 1,104 (50.3%) |
| 3-Person Household | 1,042 (60.3%) | 685 (39.7%) |
| 4+ Person Household | 2,570 (55.1%) | 2,091 (44.9%) |
| Total Housing Units | 5,504 (54.3%) | 4,633 (45.7%) |
Occupancy by Educational Attainment in Montclair
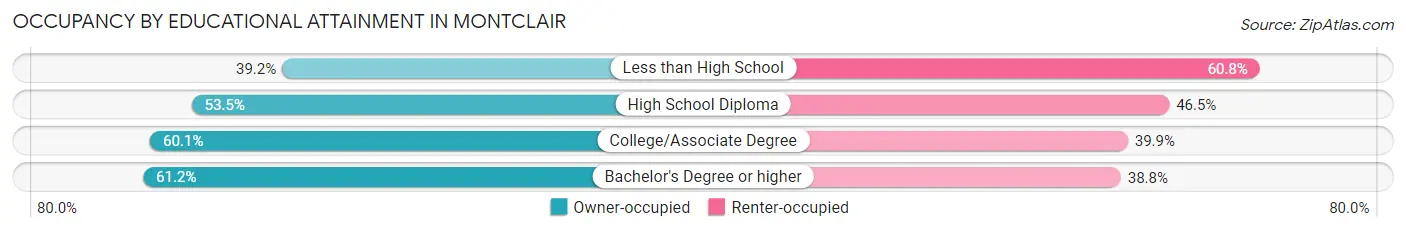
| Household Size | Owner-occupied | Renter-occupied |
| Less than High School | 890 (39.2%) | 1,382 (60.8%) |
| High School Diploma | 1,124 (53.5%) | 976 (46.5%) |
| College/Associate Degree | 2,064 (60.1%) | 1,371 (39.9%) |
| Bachelor's Degree or higher | 1,426 (61.2%) | 904 (38.8%) |
Occupancy by Age of Householder in Montclair
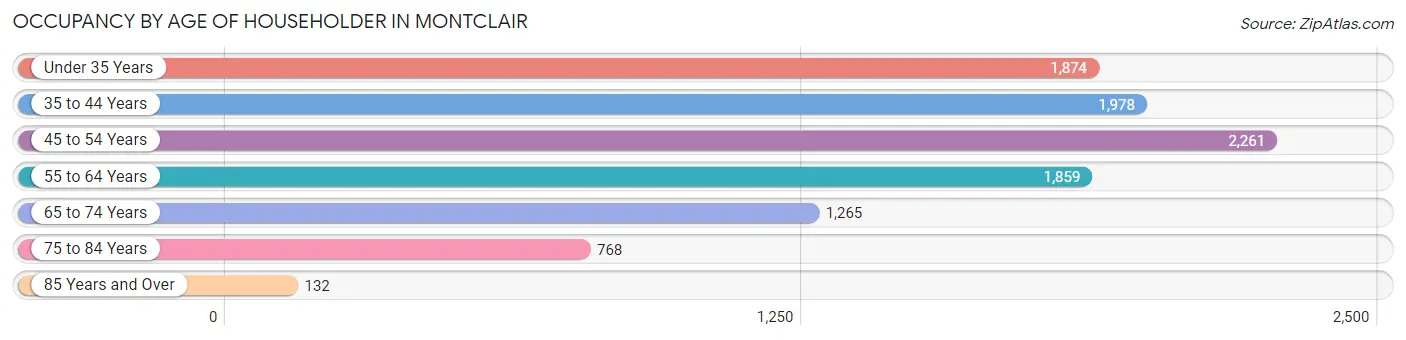
| Age Bracket | # Households | % Households |
| Under 35 Years | 1,874 | 18.5% |
| 35 to 44 Years | 1,978 | 19.5% |
| 45 to 54 Years | 2,261 | 22.3% |
| 55 to 64 Years | 1,859 | 18.3% |
| 65 to 74 Years | 1,265 | 12.5% |
| 75 to 84 Years | 768 | 7.6% |
| 85 Years and Over | 132 | 1.3% |
| Total | 10,137 | 100.0% |
Housing Finances in Montclair
Median Income by Occupancy in Montclair
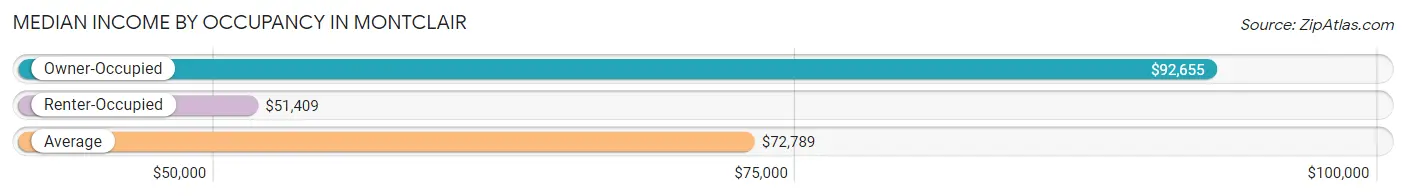
| Occupancy Type | # Households | Median Income |
| Owner-Occupied | 5,504 (54.3%) | $92,655 |
| Renter-Occupied | 4,633 (45.7%) | $51,409 |
| Average | 10,137 (100.0%) | $72,789 |
Occupancy by Householder Income Bracket in Montclair
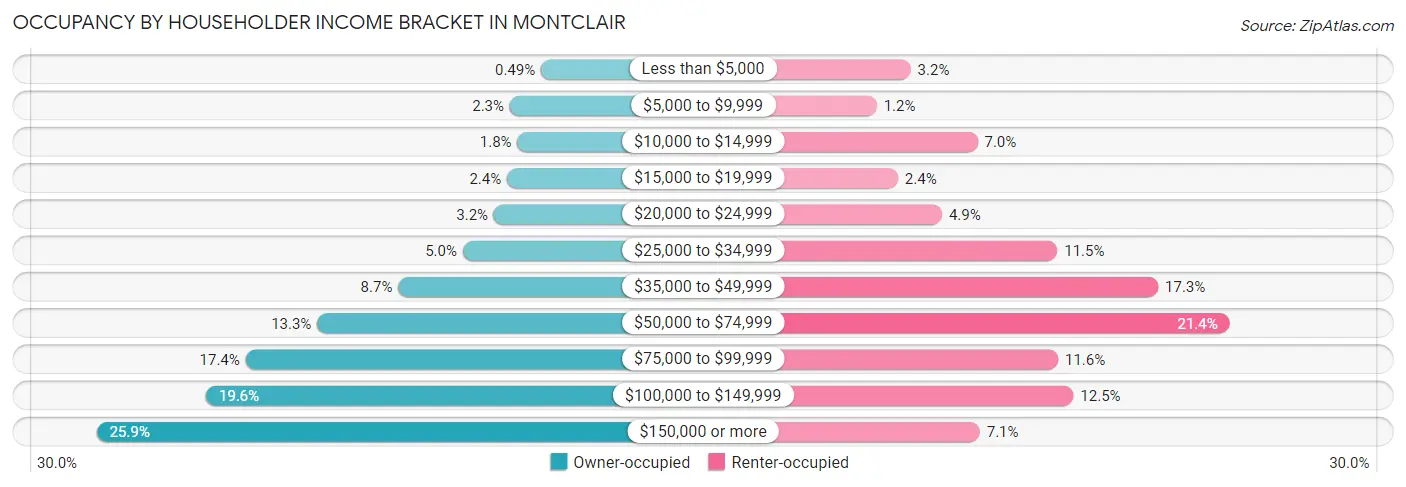
| Income Bracket | Owner-occupied | Renter-occupied |
| Less than $5,000 | 27 (0.5%) | 146 (3.2%) |
| $5,000 to $9,999 | 125 (2.3%) | 56 (1.2%) |
| $10,000 to $14,999 | 101 (1.8%) | 323 (7.0%) |
| $15,000 to $19,999 | 134 (2.4%) | 112 (2.4%) |
| $20,000 to $24,999 | 175 (3.2%) | 229 (4.9%) |
| $25,000 to $34,999 | 273 (5.0%) | 534 (11.5%) |
| $35,000 to $49,999 | 476 (8.6%) | 801 (17.3%) |
| $50,000 to $74,999 | 731 (13.3%) | 990 (21.4%) |
| $75,000 to $99,999 | 956 (17.4%) | 536 (11.6%) |
| $100,000 to $149,999 | 1,081 (19.6%) | 577 (12.4%) |
| $150,000 or more | 1,425 (25.9%) | 329 (7.1%) |
| Total | 5,504 (100.0%) | 4,633 (100.0%) |
Monthly Housing Cost Tiers in Montclair
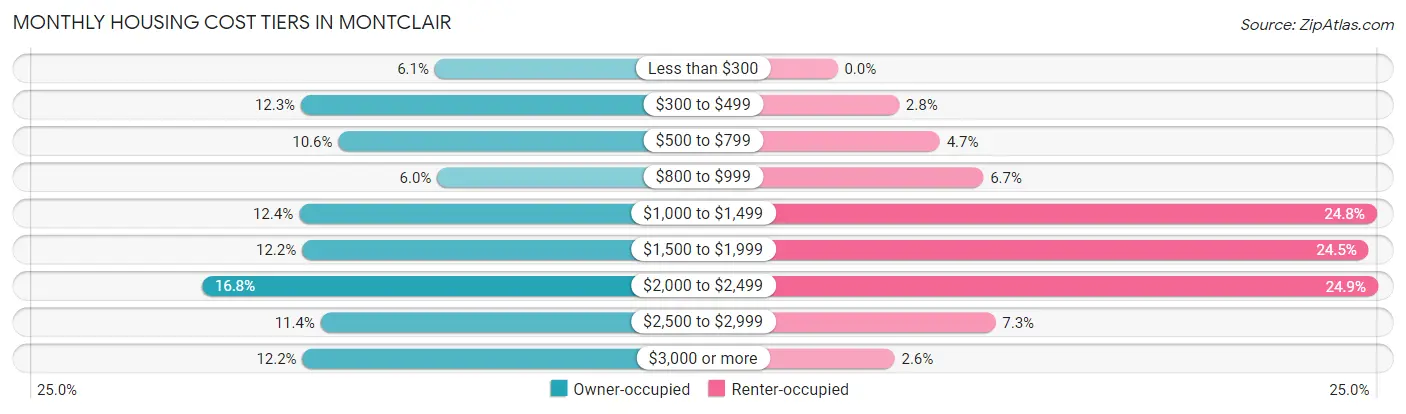
| Monthly Cost | Owner-occupied | Renter-occupied |
| Less than $300 | 337 (6.1%) | 0 (0.0%) |
| $300 to $499 | 676 (12.3%) | 131 (2.8%) |
| $500 to $799 | 581 (10.6%) | 218 (4.7%) |
| $800 to $999 | 331 (6.0%) | 311 (6.7%) |
| $1,000 to $1,499 | 681 (12.4%) | 1,150 (24.8%) |
| $1,500 to $1,999 | 673 (12.2%) | 1,133 (24.4%) |
| $2,000 to $2,499 | 927 (16.8%) | 1,152 (24.9%) |
| $2,500 to $2,999 | 626 (11.4%) | 337 (7.3%) |
| $3,000 or more | 672 (12.2%) | 122 (2.6%) |
| Total | 5,504 (100.0%) | 4,633 (100.0%) |
Physical Housing Characteristics in Montclair
Housing Structures in Montclair
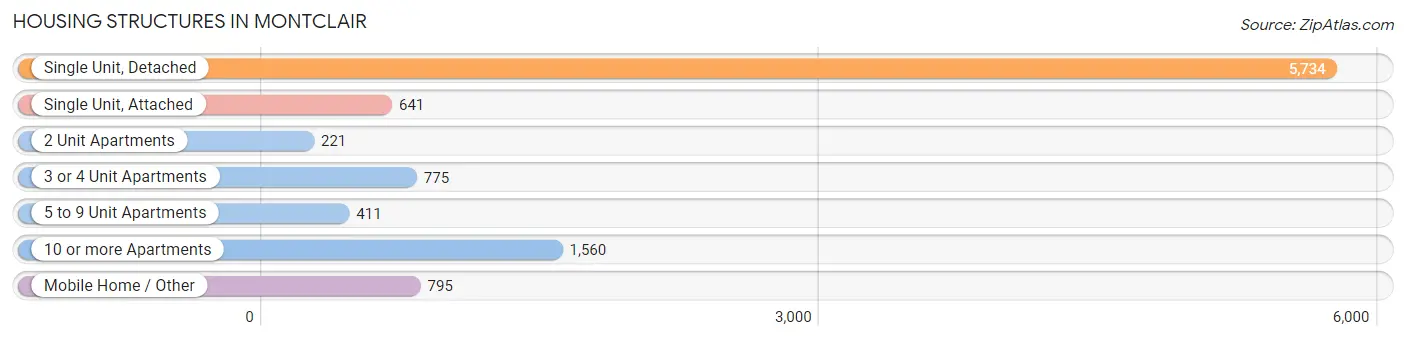
| Structure Type | # Housing Units | % Housing Units |
| Single Unit, Detached | 5,734 | 56.6% |
| Single Unit, Attached | 641 | 6.3% |
| 2 Unit Apartments | 221 | 2.2% |
| 3 or 4 Unit Apartments | 775 | 7.6% |
| 5 to 9 Unit Apartments | 411 | 4.1% |
| 10 or more Apartments | 1,560 | 15.4% |
| Mobile Home / Other | 795 | 7.8% |
| Total | 10,137 | 100.0% |
Housing Structures by Occupancy in Montclair
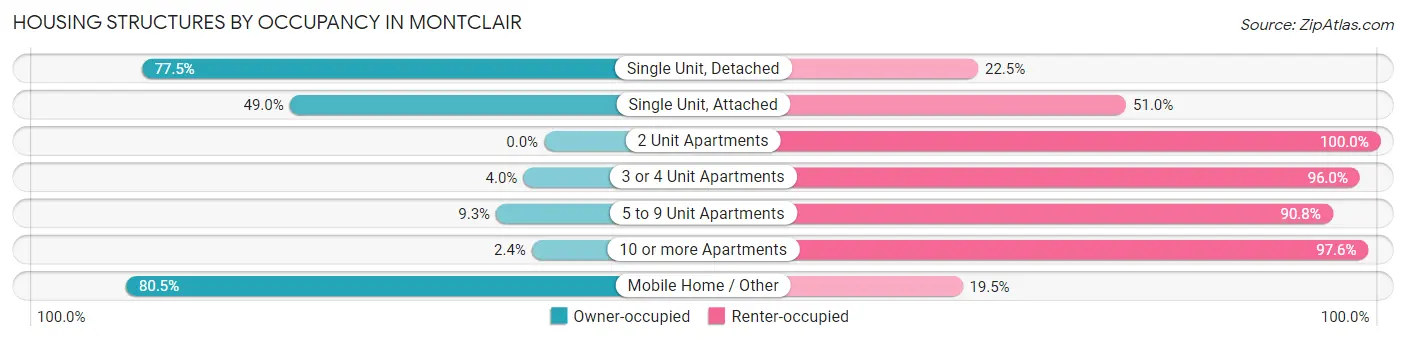
| Structure Type | Owner-occupied | Renter-occupied |
| Single Unit, Detached | 4,444 (77.5%) | 1,290 (22.5%) |
| Single Unit, Attached | 314 (49.0%) | 327 (51.0%) |
| 2 Unit Apartments | 0 (0.0%) | 221 (100.0%) |
| 3 or 4 Unit Apartments | 31 (4.0%) | 744 (96.0%) |
| 5 to 9 Unit Apartments | 38 (9.2%) | 373 (90.7%) |
| 10 or more Apartments | 37 (2.4%) | 1,523 (97.6%) |
| Mobile Home / Other | 640 (80.5%) | 155 (19.5%) |
| Total | 5,504 (54.3%) | 4,633 (45.7%) |
Housing Structures by Number of Rooms in Montclair
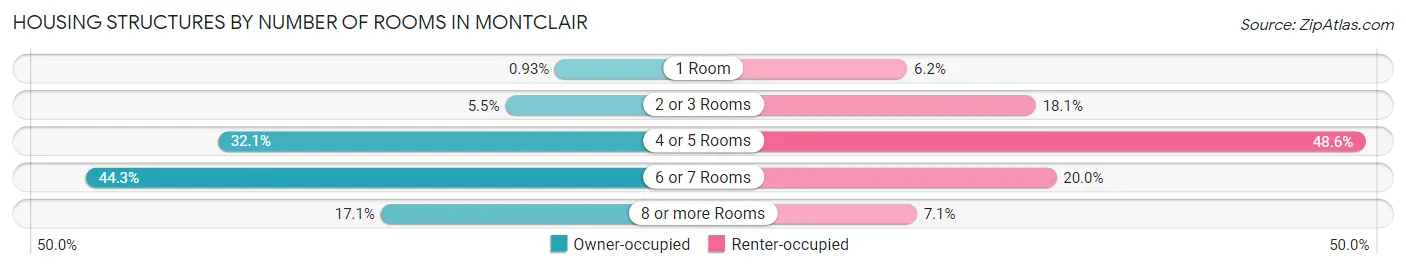
| Number of Rooms | Owner-occupied | Renter-occupied |
| 1 Room | 51 (0.9%) | 288 (6.2%) |
| 2 or 3 Rooms | 305 (5.5%) | 839 (18.1%) |
| 4 or 5 Rooms | 1,769 (32.1%) | 2,250 (48.6%) |
| 6 or 7 Rooms | 2,440 (44.3%) | 927 (20.0%) |
| 8 or more Rooms | 939 (17.1%) | 329 (7.1%) |
| Total | 5,504 (100.0%) | 4,633 (100.0%) |
Housing Structure by Heating Type in Montclair
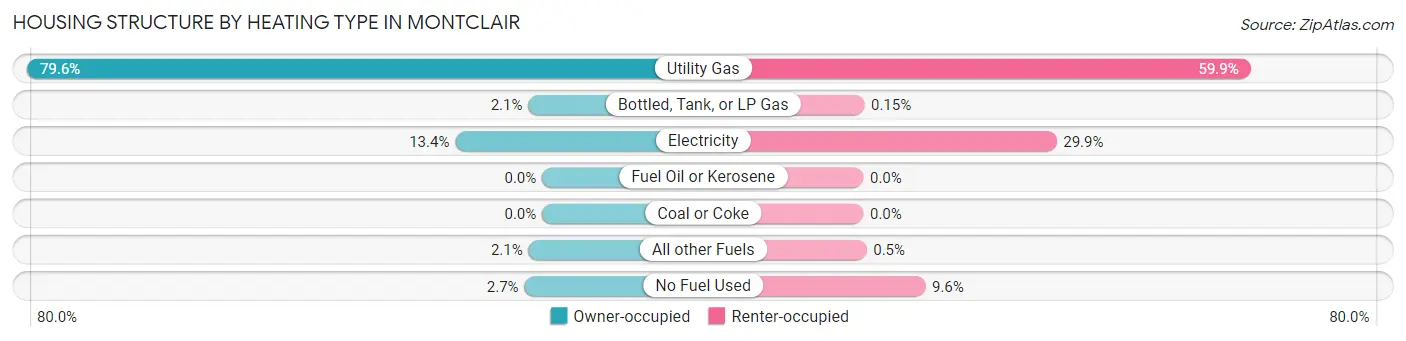
| Heating Type | Owner-occupied | Renter-occupied |
| Utility Gas | 4,383 (79.6%) | 2,775 (59.9%) |
| Bottled, Tank, or LP Gas | 117 (2.1%) | 7 (0.2%) |
| Electricity | 739 (13.4%) | 1,384 (29.9%) |
| Fuel Oil or Kerosene | 0 (0.0%) | 0 (0.0%) |
| Coal or Coke | 0 (0.0%) | 0 (0.0%) |
| All other Fuels | 115 (2.1%) | 23 (0.5%) |
| No Fuel Used | 150 (2.7%) | 444 (9.6%) |
| Total | 5,504 (100.0%) | 4,633 (100.0%) |
Household Vehicle Usage in Montclair
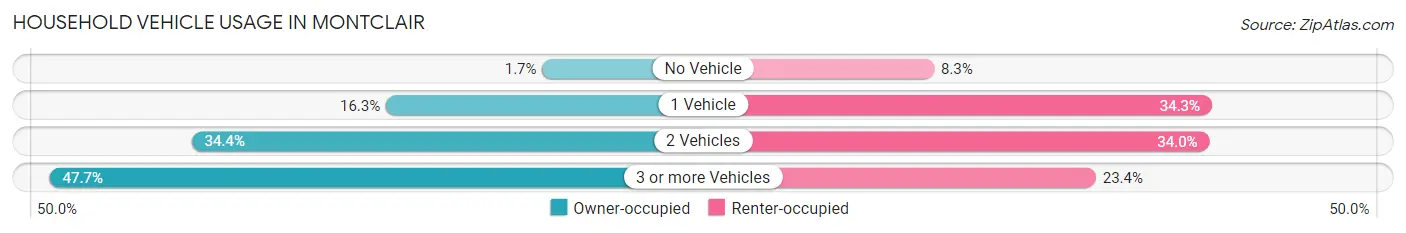
| Vehicles per Household | Owner-occupied | Renter-occupied |
| No Vehicle | 92 (1.7%) | 385 (8.3%) |
| 1 Vehicle | 895 (16.3%) | 1,587 (34.3%) |
| 2 Vehicles | 1,894 (34.4%) | 1,576 (34.0%) |
| 3 or more Vehicles | 2,623 (47.7%) | 1,085 (23.4%) |
| Total | 5,504 (100.0%) | 4,633 (100.0%) |
Real Estate & Mortgages in Montclair
Real Estate and Mortgage Overview in Montclair
| Characteristic | Without Mortgage | With Mortgage |
| Housing Units | 1,782 | 3,722 |
| Median Property Value | $426,200 | $515,900 |
| Median Household Income | $69,352 | $1,038 |
| Monthly Housing Costs | $474 | $672 |
| Real Estate Taxes | $1,658 | $105 |
Property Value by Mortgage Status in Montclair
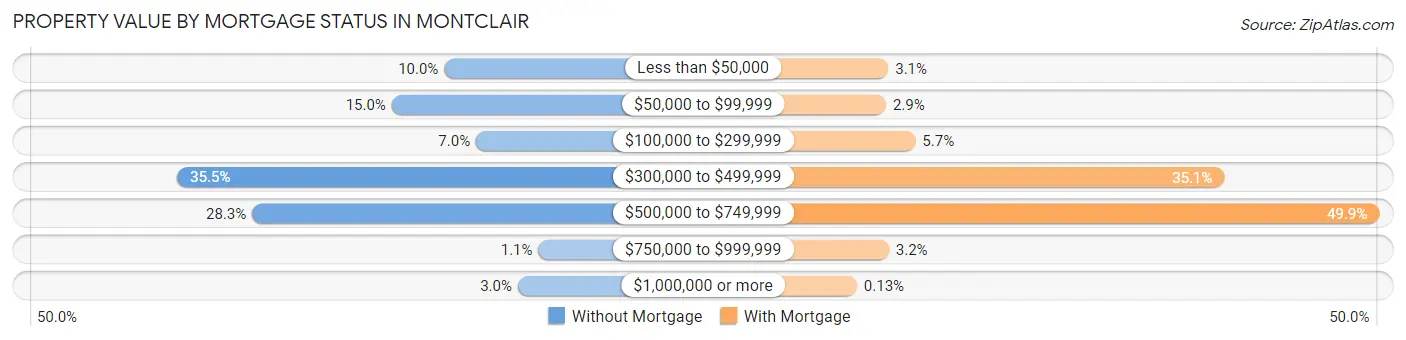
| Property Value | Without Mortgage | With Mortgage |
| Less than $50,000 | 179 (10.0%) | 116 (3.1%) |
| $50,000 to $99,999 | 268 (15.0%) | 108 (2.9%) |
| $100,000 to $299,999 | 125 (7.0%) | 212 (5.7%) |
| $300,000 to $499,999 | 632 (35.5%) | 1,307 (35.1%) |
| $500,000 to $749,999 | 505 (28.3%) | 1,856 (49.9%) |
| $750,000 to $999,999 | 19 (1.1%) | 118 (3.2%) |
| $1,000,000 or more | 54 (3.0%) | 5 (0.1%) |
| Total | 1,782 (100.0%) | 3,722 (100.0%) |
Household Income by Mortgage Status in Montclair
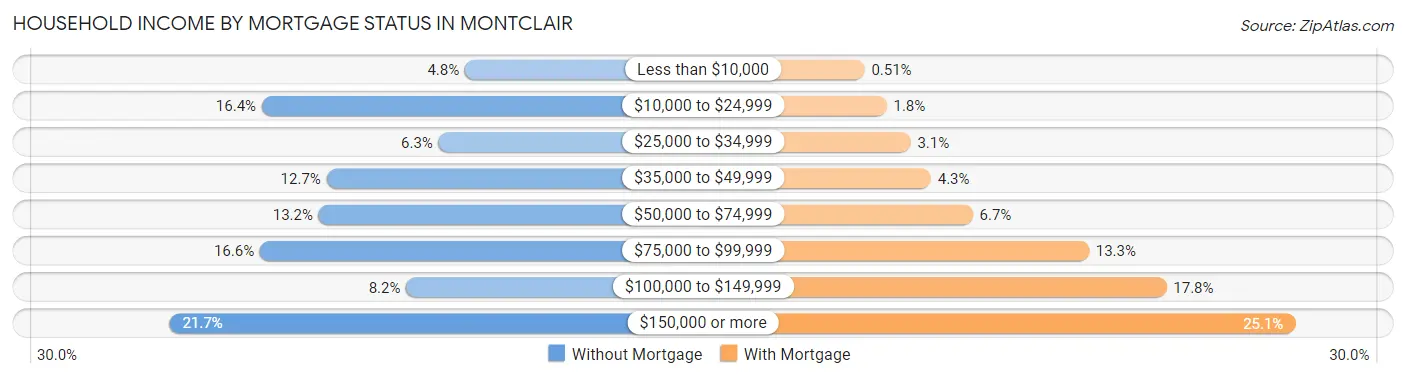
| Household Income | Without Mortgage | With Mortgage |
| Less than $10,000 | 86 (4.8%) | 19 (0.5%) |
| $10,000 to $24,999 | 293 (16.4%) | 66 (1.8%) |
| $25,000 to $34,999 | 113 (6.3%) | 117 (3.1%) |
| $35,000 to $49,999 | 227 (12.7%) | 160 (4.3%) |
| $50,000 to $74,999 | 235 (13.2%) | 249 (6.7%) |
| $75,000 to $99,999 | 295 (16.6%) | 496 (13.3%) |
| $100,000 to $149,999 | 146 (8.2%) | 661 (17.8%) |
| $150,000 or more | 387 (21.7%) | 935 (25.1%) |
| Total | 1,782 (100.0%) | 3,722 (100.0%) |
Property Value to Household Income Ratio in Montclair
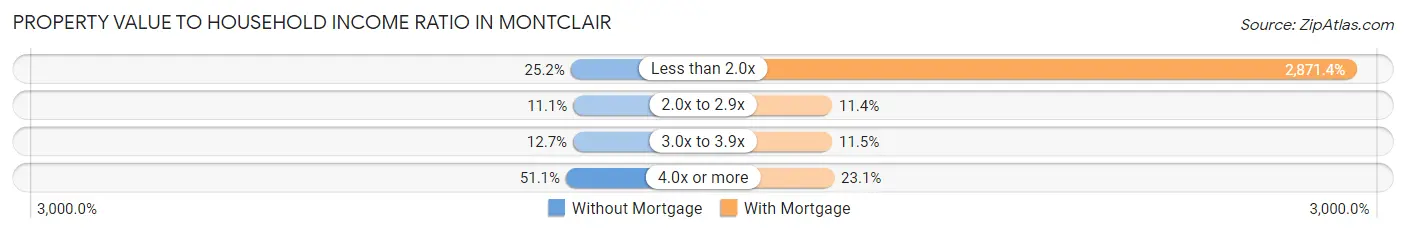
| Value-to-Income Ratio | Without Mortgage | With Mortgage |
| Less than 2.0x | 449 (25.2%) | 106,875 (2,871.4%) |
| 2.0x to 2.9x | 197 (11.1%) | 425 (11.4%) |
| 3.0x to 3.9x | 226 (12.7%) | 428 (11.5%) |
| 4.0x or more | 910 (51.1%) | 859 (23.1%) |
| Total | 1,782 (100.0%) | 3,722 (100.0%) |
Real Estate Taxes by Mortgage Status in Montclair
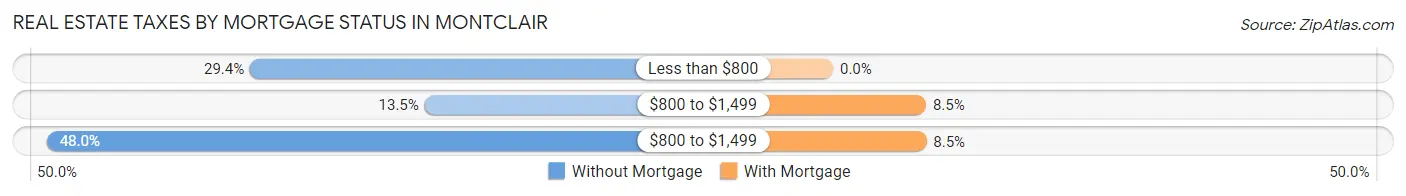
| Property Taxes | Without Mortgage | With Mortgage |
| Less than $800 | 524 (29.4%) | 0 (0.0%) |
| $800 to $1,499 | 240 (13.5%) | 316 (8.5%) |
| $800 to $1,499 | 855 (48.0%) | 317 (8.5%) |
| Total | 1,782 (100.0%) | 3,722 (100.0%) |
Health & Disability in Montclair
Health Insurance Coverage by Age in Montclair
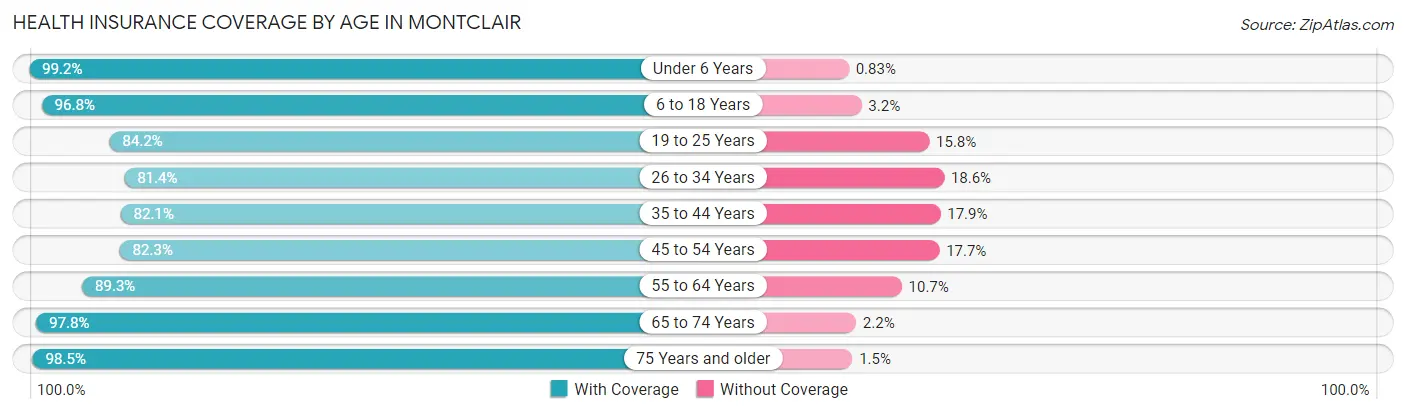
| Age Bracket | With Coverage | Without Coverage |
| Under 6 Years | 2,743 (99.2%) | 23 (0.8%) |
| 6 to 18 Years | 7,049 (96.8%) | 232 (3.2%) |
| 19 to 25 Years | 3,873 (84.2%) | 728 (15.8%) |
| 26 to 34 Years | 4,480 (81.4%) | 1,022 (18.6%) |
| 35 to 44 Years | 3,899 (82.1%) | 850 (17.9%) |
| 45 to 54 Years | 3,858 (82.3%) | 830 (17.7%) |
| 55 to 64 Years | 3,491 (89.3%) | 418 (10.7%) |
| 65 to 74 Years | 2,305 (97.8%) | 51 (2.2%) |
| 75 Years and older | 1,665 (98.5%) | 25 (1.5%) |
| Total | 33,363 (88.9%) | 4,179 (11.1%) |
Health Insurance Coverage by Citizenship Status in Montclair
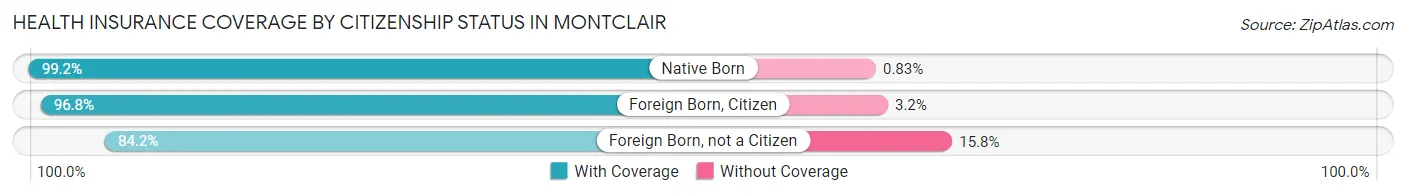
| Citizenship Status | With Coverage | Without Coverage |
| Native Born | 2,743 (99.2%) | 23 (0.8%) |
| Foreign Born, Citizen | 7,049 (96.8%) | 232 (3.2%) |
| Foreign Born, not a Citizen | 3,873 (84.2%) | 728 (15.8%) |
Health Insurance Coverage by Household Income in Montclair
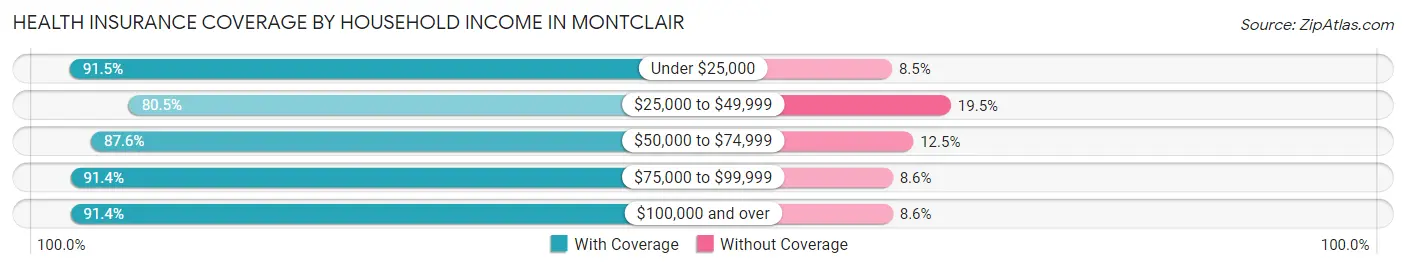
| Household Income | With Coverage | Without Coverage |
| Under $25,000 | 3,772 (91.5%) | 349 (8.5%) |
| $25,000 to $49,999 | 5,331 (80.5%) | 1,292 (19.5%) |
| $50,000 to $74,999 | 5,571 (87.5%) | 792 (12.4%) |
| $75,000 to $99,999 | 4,944 (91.4%) | 465 (8.6%) |
| $100,000 and over | 13,583 (91.4%) | 1,281 (8.6%) |
Public vs Private Health Insurance Coverage by Age in Montclair
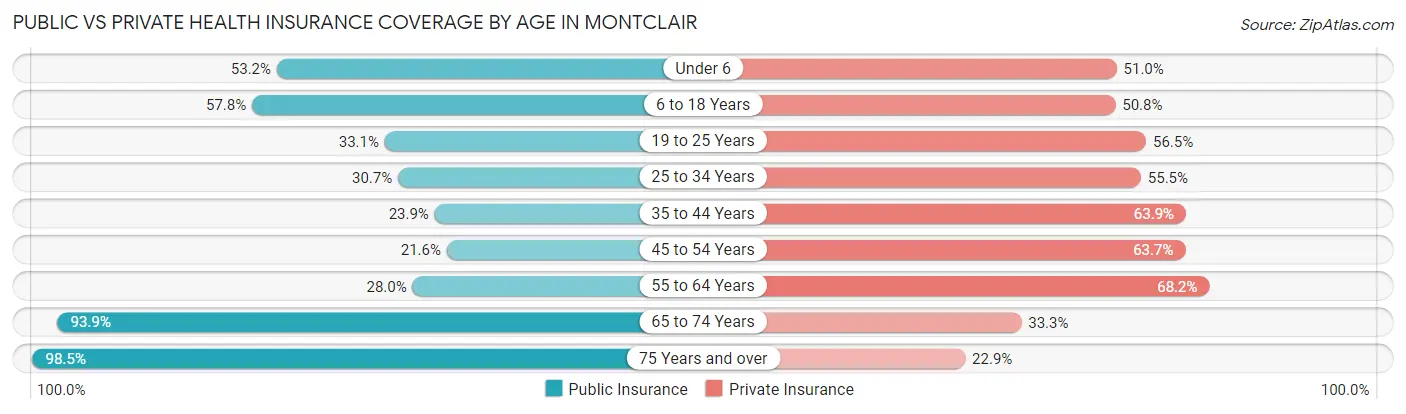
| Age Bracket | Public Insurance | Private Insurance |
| Under 6 | 1,471 (53.2%) | 1,411 (51.0%) |
| 6 to 18 Years | 4,208 (57.8%) | 3,696 (50.8%) |
| 19 to 25 Years | 1,525 (33.1%) | 2,598 (56.5%) |
| 25 to 34 Years | 1,688 (30.7%) | 3,054 (55.5%) |
| 35 to 44 Years | 1,134 (23.9%) | 3,033 (63.9%) |
| 45 to 54 Years | 1,014 (21.6%) | 2,988 (63.7%) |
| 55 to 64 Years | 1,094 (28.0%) | 2,666 (68.2%) |
| 65 to 74 Years | 2,212 (93.9%) | 785 (33.3%) |
| 75 Years and over | 1,665 (98.5%) | 387 (22.9%) |
| Total | 16,011 (42.6%) | 20,618 (54.9%) |
Disability Status by Sex by Age in Montclair
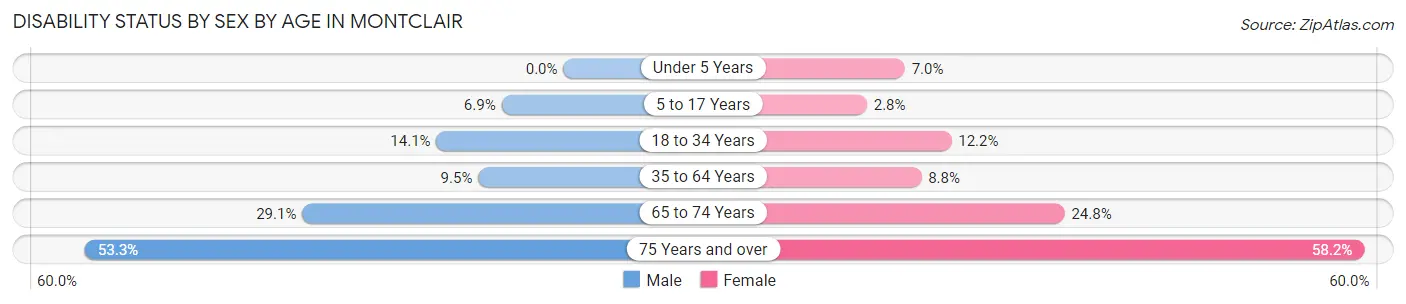
| Age Bracket | Male | Female |
| Under 5 Years | 0 (0.0%) | 99 (7.0%) |
| 5 to 17 Years | 244 (6.9%) | 102 (2.8%) |
| 18 to 34 Years | 782 (14.1%) | 613 (12.2%) |
| 35 to 64 Years | 599 (9.5%) | 621 (8.8%) |
| 65 to 74 Years | 324 (29.1%) | 308 (24.8%) |
| 75 Years and over | 317 (53.3%) | 637 (58.2%) |
Disability Class by Sex by Age in Montclair
Disability Class: Hearing Difficulty
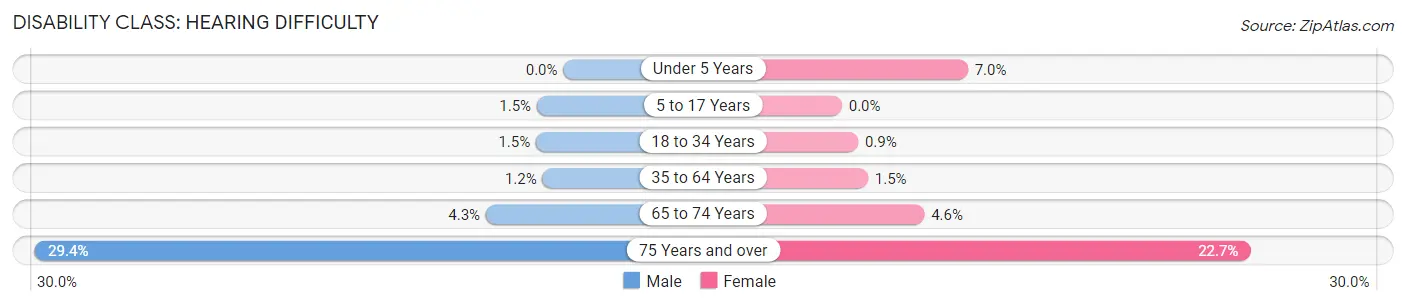
| Age Bracket | Male | Female |
| Under 5 Years | 0 (0.0%) | 99 (7.0%) |
| 5 to 17 Years | 52 (1.5%) | 0 (0.0%) |
| 18 to 34 Years | 84 (1.5%) | 45 (0.9%) |
| 35 to 64 Years | 73 (1.2%) | 102 (1.5%) |
| 65 to 74 Years | 48 (4.3%) | 57 (4.6%) |
| 75 Years and over | 175 (29.4%) | 249 (22.7%) |
Disability Class: Vision Difficulty
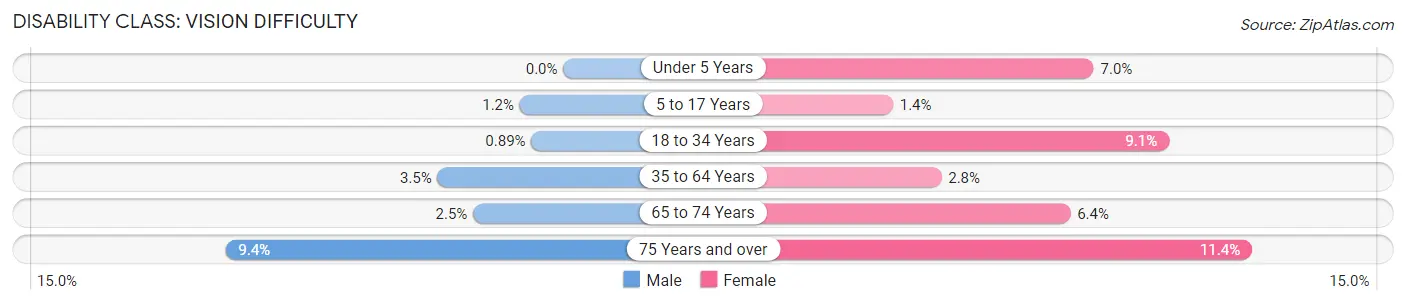
| Age Bracket | Male | Female |
| Under 5 Years | 0 (0.0%) | 99 (7.0%) |
| 5 to 17 Years | 43 (1.2%) | 52 (1.4%) |
| 18 to 34 Years | 49 (0.9%) | 458 (9.1%) |
| 35 to 64 Years | 221 (3.5%) | 195 (2.8%) |
| 65 to 74 Years | 28 (2.5%) | 79 (6.4%) |
| 75 Years and over | 56 (9.4%) | 125 (11.4%) |
Disability Class: Cognitive Difficulty
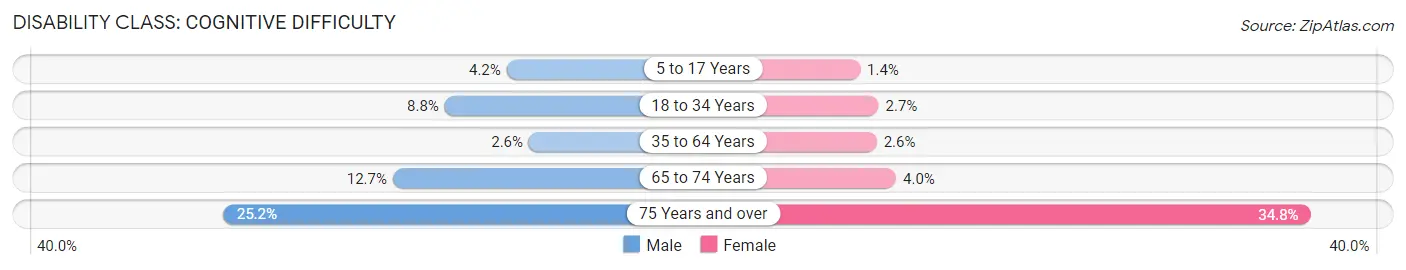
| Age Bracket | Male | Female |
| 5 to 17 Years | 149 (4.2%) | 50 (1.4%) |
| 18 to 34 Years | 487 (8.8%) | 137 (2.7%) |
| 35 to 64 Years | 162 (2.6%) | 182 (2.6%) |
| 65 to 74 Years | 141 (12.7%) | 50 (4.0%) |
| 75 Years and over | 150 (25.2%) | 381 (34.8%) |
Disability Class: Ambulatory Difficulty
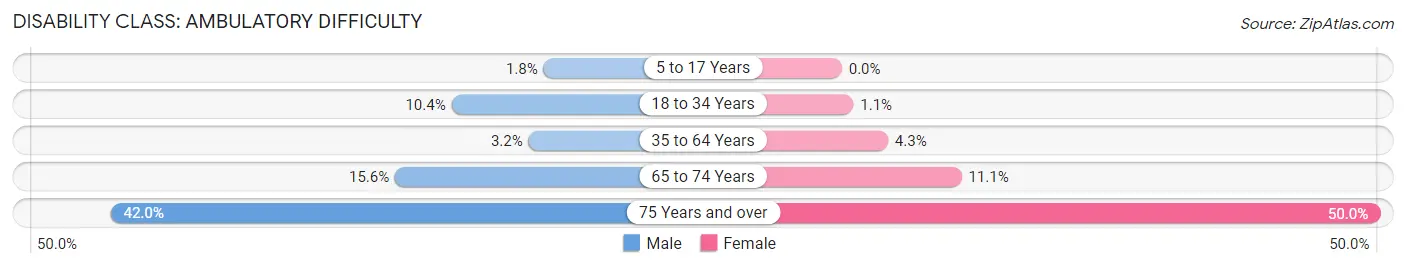
| Age Bracket | Male | Female |
| 5 to 17 Years | 65 (1.8%) | 0 (0.0%) |
| 18 to 34 Years | 574 (10.4%) | 54 (1.1%) |
| 35 to 64 Years | 204 (3.2%) | 301 (4.3%) |
| 65 to 74 Years | 174 (15.6%) | 138 (11.1%) |
| 75 Years and over | 250 (42.0%) | 547 (49.9%) |
Disability Class: Self-Care Difficulty
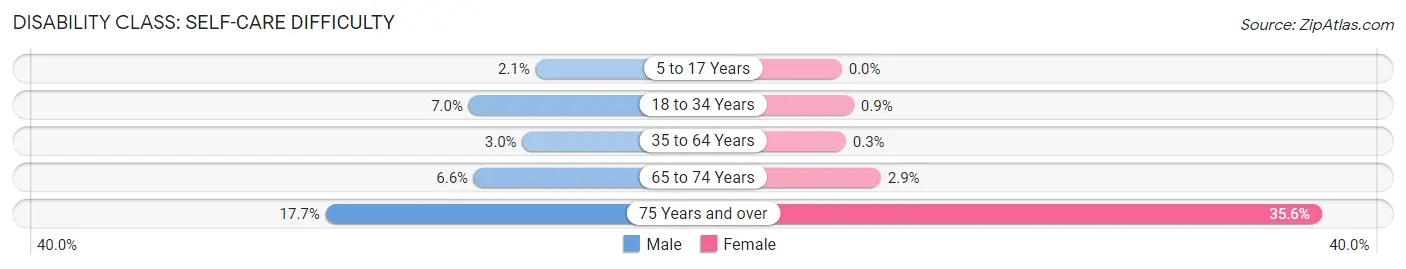
| Age Bracket | Male | Female |
| 5 to 17 Years | 73 (2.1%) | 0 (0.0%) |
| 18 to 34 Years | 388 (7.0%) | 45 (0.9%) |
| 35 to 64 Years | 192 (3.0%) | 21 (0.3%) |
| 65 to 74 Years | 74 (6.6%) | 36 (2.9%) |
| 75 Years and over | 105 (17.6%) | 390 (35.6%) |
Technology Access in Montclair
Computing Device Access in Montclair
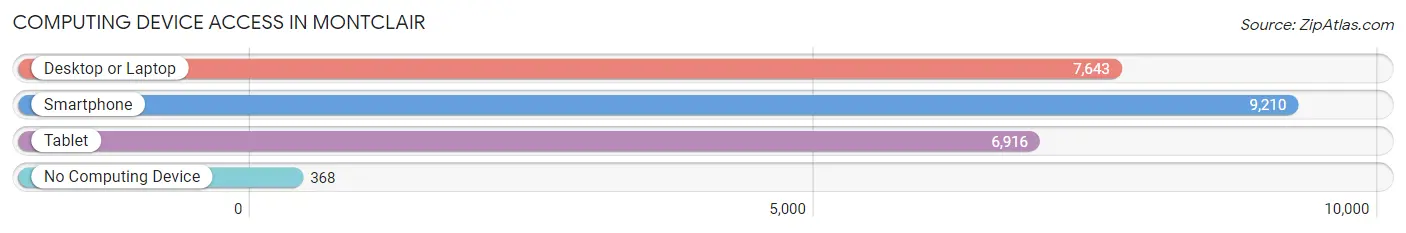
| Device Type | # Households | % Households |
| Desktop or Laptop | 7,643 | 75.4% |
| Smartphone | 9,210 | 90.9% |
| Tablet | 6,916 | 68.2% |
| No Computing Device | 368 | 3.6% |
| Total | 10,137 | 100.0% |
Internet Access in Montclair
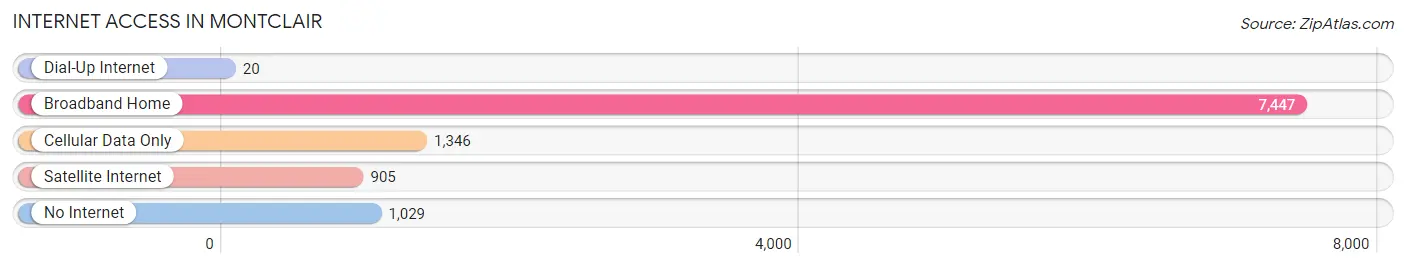
| Internet Type | # Households | % Households |
| Dial-Up Internet | 20 | 0.2% |
| Broadband Home | 7,447 | 73.5% |
| Cellular Data Only | 1,346 | 13.3% |
| Satellite Internet | 905 | 8.9% |
| No Internet | 1,029 | 10.2% |
| Total | 10,137 | 100.0% |
Montclair Summary
Montclair is a census-designated place located in San Bernardino County, California. It is located in the foothills of the San Gabriel Mountains, about 10 miles east of downtown Los Angeles. The population was 36,664 at the 2010 census, up from 33,023 at the 2000 census.
History
Montclair was founded in 1887 by a group of settlers from the Midwest. The settlers were attracted to the area by the abundance of water and the mild climate. The town was originally called Monte Vista, but the name was changed to Montclair in 1895.
The town grew rapidly in the early 20th century, and by the 1920s it had become a popular resort destination. The town was incorporated in 1956, and it has since become a bedroom community for Los Angeles.
Geography
Montclair is located at 34°7′25″N 117°37′17″W (34.123611, -117.621389). According to the United States Census Bureau, the CDP has a total area of 4.2 square miles (10.9 km2), all of it land.
Economy
Montclair is a primarily residential community, and the majority of its residents are employed in the service sector. The town is home to several large employers, including the Montclair Plaza Mall, the Montclair Hospital Medical Center, and the Montclair Unified School District.
Demographics
As of the 2010 census, there were 36,664 people, 11,945 households, and 8,845 families residing in the CDP. The population density was 8,717.3 people per square mile (3,370.2/km2). There were 12,717 housing units at an average density of 3,039.2 per square mile (1,174.3/km2). The racial makeup of the CDP was 57.2% White (41.2% Non-Hispanic White), 4.2% African American, 1.2% Native American, 11.2% Asian, 0.3% Pacific Islander, 24.2% from other races, and 2.7% from two or more races. Hispanic or Latino of any race were 44.2% of the population.
The median income for a household in the CDP was $50,945, and the median income for a family was $58,945. Males had a median income of $41,945 versus $31,945 for females. The per capita income for the CDP was $21,945. About 8.2% of families and 10.2% of the population were below the poverty line, including 14.2% of those under age 18 and 6.2% of those age 65 or over.
Common Questions
What is Per Capita Income in Montclair?
Per Capita income in Montclair is $25,244.
What is the Median Family Income in Montclair?
Median Family Income in Montclair is $77,195.
What is the Median Household income in Montclair?
Median Household Income in Montclair is $72,789.
What is Income or Wage Gap in Montclair?
Income or Wage Gap in Montclair is 26.4%.
Women in Montclair earn 73.6 cents for every dollar earned by a man.
What is Family Income Deficit in Montclair?
Family Income Deficit in Montclair is $10,622.
Families that are below poverty line in Montclair earn $10,622 less on average than the poverty threshold level.
What is Inequality or Gini Index in Montclair?
Inequality or Gini Index in Montclair is 0.41.
What is the Total Population of Montclair?
Total Population of Montclair is 37,842.
What is the Total Male Population of Montclair?
Total Male Population of Montclair is 18,235.
What is the Total Female Population of Montclair?
Total Female Population of Montclair is 19,607.
What is the Ratio of Males per 100 Females in Montclair?
There are 93.00 Males per 100 Females in Montclair.
What is the Ratio of Females per 100 Males in Montclair?
There are 107.52 Females per 100 Males in Montclair.
What is the Median Population Age in Montclair?
Median Population Age in Montclair is 32.9 Years.
What is the Average Family Size in Montclair
Average Family Size in Montclair is 4.1 People.
What is the Average Household Size in Montclair
Average Household Size in Montclair is 3.7 People.
How Large is the Labor Force in Montclair?
There are 18,361 People in the Labor Forcein in Montclair.
What is the Percentage of People in the Labor Force in Montclair?
62.1% of People are in the Labor Force in Montclair.
What is the Unemployment Rate in Montclair?
Unemployment Rate in Montclair is 6.4%.