Lennox, CA Map & Demographics
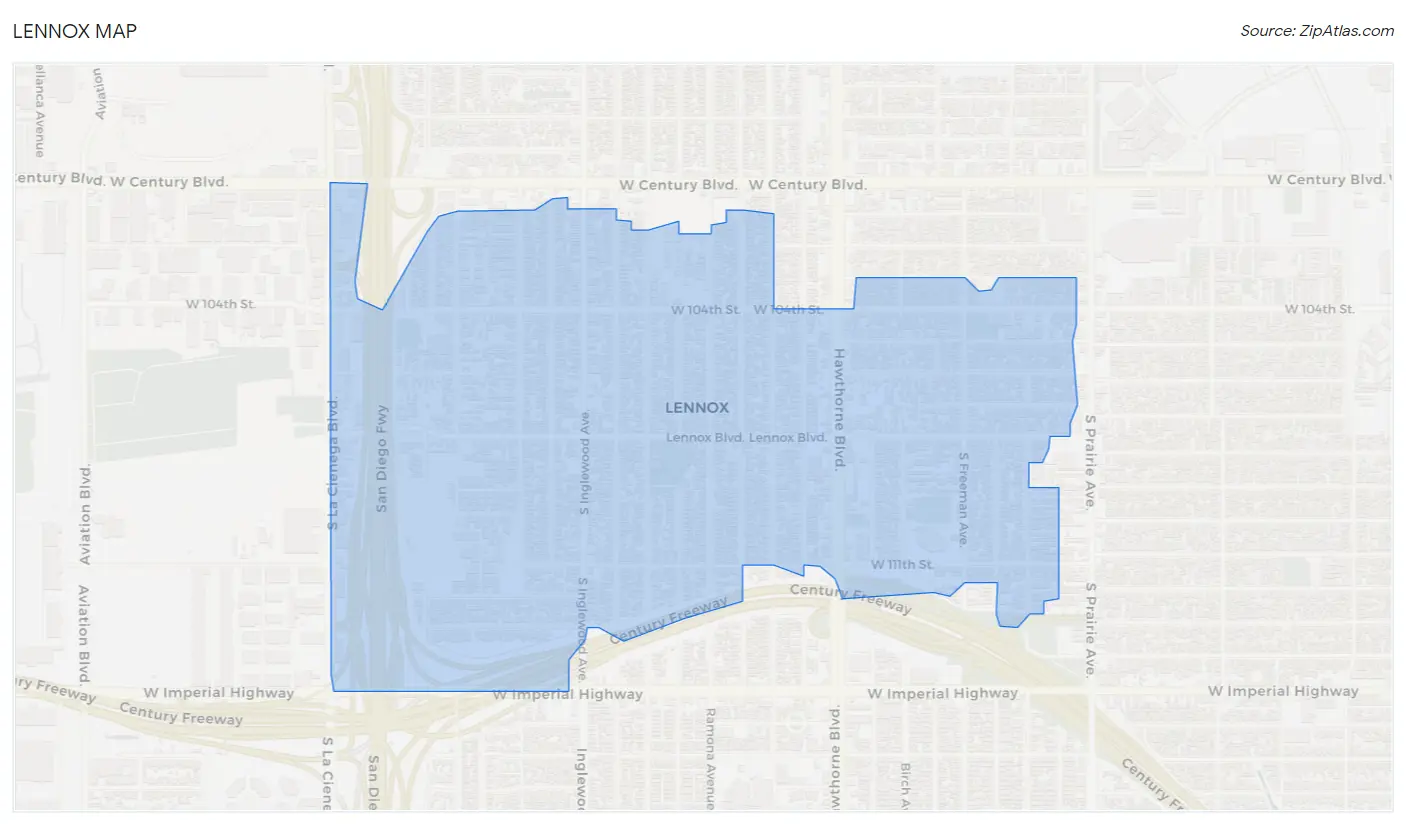
Lennox Map
Lennox Overview
$21,006
PER CAPITA INCOME
$62,455
AVG FAMILY INCOME
$54,611
AVG HOUSEHOLD INCOME
17.4%
WAGE / INCOME GAP [ % ]
82.6¢/ $1
WAGE / INCOME GAP [ $ ]
$12,616
FAMILY INCOME DEFICIT
0.41
INEQUALITY / GINI INDEX
20,687
TOTAL POPULATION
11,025
MALE POPULATION
9,662
FEMALE POPULATION
114.11
MALES / 100 FEMALES
87.64
FEMALES / 100 MALES
33.4
MEDIAN AGE
4.0
AVG FAMILY SIZE
3.7
AVG HOUSEHOLD SIZE
11,500
LABOR FORCE [ PEOPLE ]
71.7%
PERCENT IN LABOR FORCE
6.6%
UNEMPLOYMENT RATE
Income in Lennox
Income Overview in Lennox
Per Capita Income in Lennox is $21,006, while median incomes of families and households are $62,455 and $54,611 respectively.
| Characteristic | Number | Measure |
| Per Capita Income | 20,687 | $21,006 |
| Median Family Income | 4,543 | $62,455 |
| Mean Family Income | 4,543 | $75,156 |
| Median Household Income | 5,651 | $54,611 |
| Mean Household Income | 5,651 | $71,959 |
| Income Deficit | 4,543 | $12,616 |
| Wage / Income Gap (%) | 20,687 | 17.36% |
| Wage / Income Gap ($) | 20,687 | 82.64¢ per $1 |
| Gini / Inequality Index | 20,687 | 0.41 |
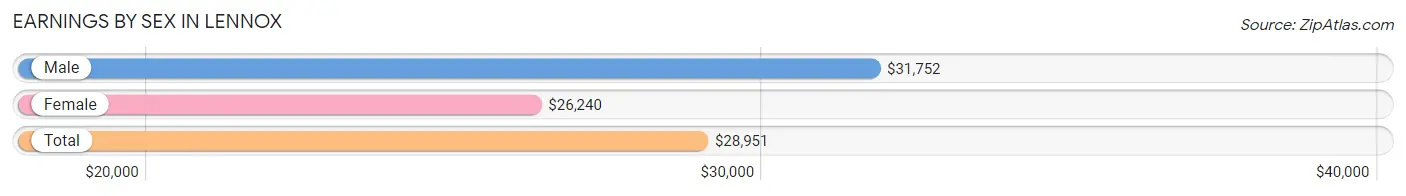
Earnings by Sex in Lennox
Average Earnings in Lennox are $28,951, $31,752 for men and $26,240 for women, a difference of 17.4%.
| Sex | Number | Average Earnings |
| Male | 6,641 (58.7%) | $31,752 |
| Female | 4,667 (41.3%) | $26,240 |
| Total | 11,308 (100.0%) | $28,951 |
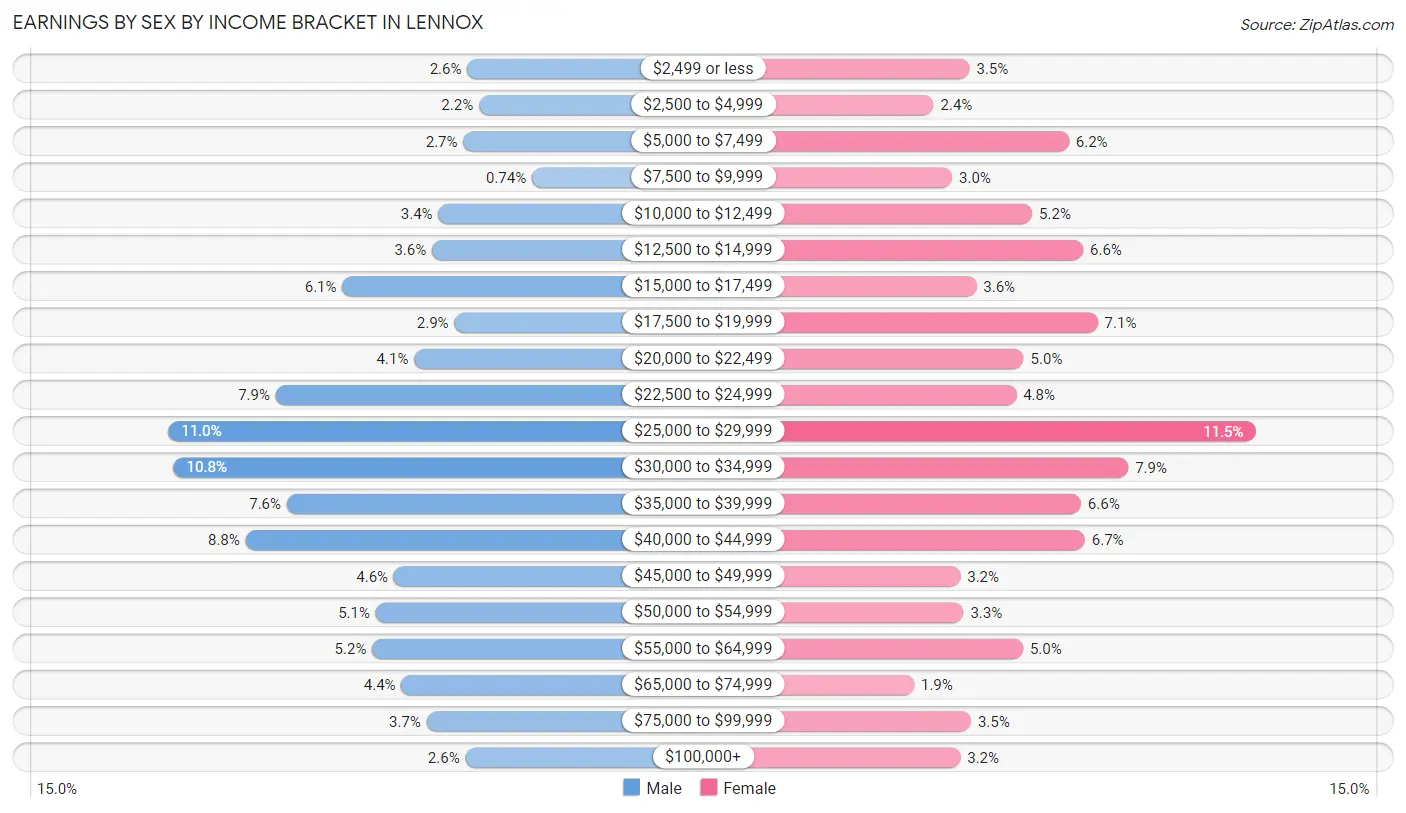
Earnings by Sex by Income Bracket in Lennox
The most common earnings brackets in Lennox are $25,000 to $29,999 for men (728 | 11.0%) and $25,000 to $29,999 for women (536 | 11.5%).
| Income | Male | Female |
| $2,499 or less | 170 (2.6%) | 161 (3.5%) |
| $2,500 to $4,999 | 148 (2.2%) | 114 (2.4%) |
| $5,000 to $7,499 | 177 (2.7%) | 291 (6.2%) |
| $7,500 to $9,999 | 49 (0.7%) | 138 (3.0%) |
| $10,000 to $12,499 | 224 (3.4%) | 243 (5.2%) |
| $12,500 to $14,999 | 236 (3.5%) | 310 (6.6%) |
| $15,000 to $17,499 | 403 (6.1%) | 170 (3.6%) |
| $17,500 to $19,999 | 194 (2.9%) | 329 (7.0%) |
| $20,000 to $22,499 | 269 (4.1%) | 232 (5.0%) |
| $22,500 to $24,999 | 527 (7.9%) | 222 (4.8%) |
| $25,000 to $29,999 | 728 (11.0%) | 536 (11.5%) |
| $30,000 to $34,999 | 718 (10.8%) | 369 (7.9%) |
| $35,000 to $39,999 | 507 (7.6%) | 307 (6.6%) |
| $40,000 to $44,999 | 584 (8.8%) | 312 (6.7%) |
| $45,000 to $49,999 | 307 (4.6%) | 149 (3.2%) |
| $50,000 to $54,999 | 341 (5.1%) | 153 (3.3%) |
| $55,000 to $64,999 | 347 (5.2%) | 231 (5.0%) |
| $65,000 to $74,999 | 293 (4.4%) | 88 (1.9%) |
| $75,000 to $99,999 | 246 (3.7%) | 163 (3.5%) |
| $100,000+ | 173 (2.6%) | 149 (3.2%) |
| Total | 6,641 (100.0%) | 4,667 (100.0%) |
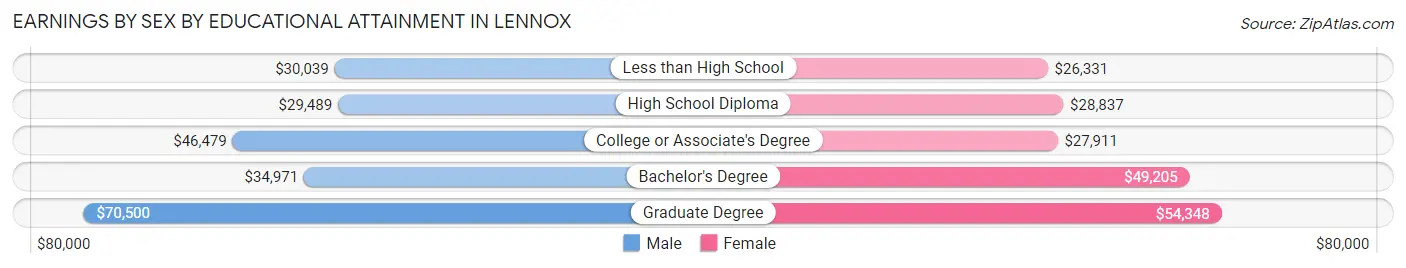
Earnings by Sex by Educational Attainment in Lennox
Average earnings in Lennox are $32,990 for men and $29,225 for women, a difference of 11.4%. Men with an educational attainment of graduate degree enjoy the highest average annual earnings of $70,500, while those with high school diploma education earn the least with $29,489. Women with an educational attainment of graduate degree earn the most with the average annual earnings of $54,348, while those with less than high school education have the smallest earnings of $26,331.
| Educational Attainment | Male Income | Female Income |
| Less than High School | $30,039 | $26,331 |
| High School Diploma | $29,489 | $28,837 |
| College or Associate's Degree | $46,479 | $27,911 |
| Bachelor's Degree | $34,971 | $49,205 |
| Graduate Degree | $70,500 | $54,348 |
| Total | $32,990 | $29,225 |
Family Income in Lennox
Family Income Brackets in Lennox
According to the Lennox family income data, there are 836 families falling into the $50,000 to $74,999 income range, which is the most common income bracket and makes up 18.4% of all families. Conversely, the $10,000 to $14,999 income bracket is the least frequent group with only 114 families (2.5%) belonging to this category.
| Income Bracket | # Families | % Families |
| Less than $10,000 | 200 | 4.4% |
| $10,000 to $14,999 | 114 | 2.5% |
| $15,000 to $24,999 | 409 | 9.0% |
| $25,000 to $34,999 | 536 | 11.8% |
| $35,000 to $49,999 | 668 | 14.7% |
| $50,000 to $74,999 | 836 | 18.4% |
| $75,000 to $99,999 | 504 | 11.1% |
| $100,000 to $149,999 | 827 | 18.2% |
| $150,000 to $199,999 | 263 | 5.8% |
| $200,000+ | 186 | 4.1% |
Family Income by Famaliy Size in Lennox
7+ person families (154 | 3.4%) account for the highest median family income in Lennox with $122,000 per family, while 3-person families (1,183 | 26.0%) have the highest median income of $21,940 per family member.
| Income Bracket | # Families | Median Income |
| 2-Person Families | 941 (20.7%) | $43,319 |
| 3-Person Families | 1,183 (26.0%) | $65,819 |
| 4-Person Families | 1,091 (24.0%) | $70,021 |
| 5-Person Families | 818 (18.0%) | $68,377 |
| 6-Person Families | 356 (7.8%) | $72,245 |
| 7+ Person Families | 154 (3.4%) | $122,000 |
| Total | 4,543 (100.0%) | $62,455 |
Family Income by Number of Earners in Lennox
| Number of Earners | # Families | Median Income |
| No Earners | 279 (6.1%) | $0 |
| 1 Earner | 1,424 (31.3%) | $33,642 |
| 2 Earners | 1,631 (35.9%) | $68,832 |
| 3+ Earners | 1,209 (26.6%) | $108,984 |
| Total | 4,543 (100.0%) | $62,455 |
Household Income in Lennox
Household Income Brackets in Lennox
With 983 households falling in the category, the $50,000 to $74,999 income range is the most frequent in Lennox, accounting for 17.4% of all households. In contrast, only 186 households (3.3%) fall into the $10,000 to $14,999 income bracket, making it the least populous group.
| Income Bracket | # Households | % Households |
| Less than $10,000 | 249 | 4.4% |
| $10,000 to $14,999 | 186 | 3.3% |
| $15,000 to $24,999 | 480 | 8.5% |
| $25,000 to $34,999 | 825 | 14.6% |
| $35,000 to $49,999 | 865 | 15.3% |
| $50,000 to $74,999 | 983 | 17.4% |
| $75,000 to $99,999 | 627 | 11.1% |
| $100,000 to $149,999 | 899 | 15.9% |
| $150,000 to $199,999 | 300 | 5.3% |
| $200,000+ | 237 | 4.2% |
Household Income by Householder Age in Lennox
The median household income in Lennox is $54,611, with the highest median household income of $65,915 found in the 45 to 64 years age bracket for the primary householder. A total of 2,695 households (47.7%) fall into this category. Meanwhile, the 15 to 24 years age bracket for the primary householder has the lowest median household income of $0, with 131 households (2.3%) in this group.
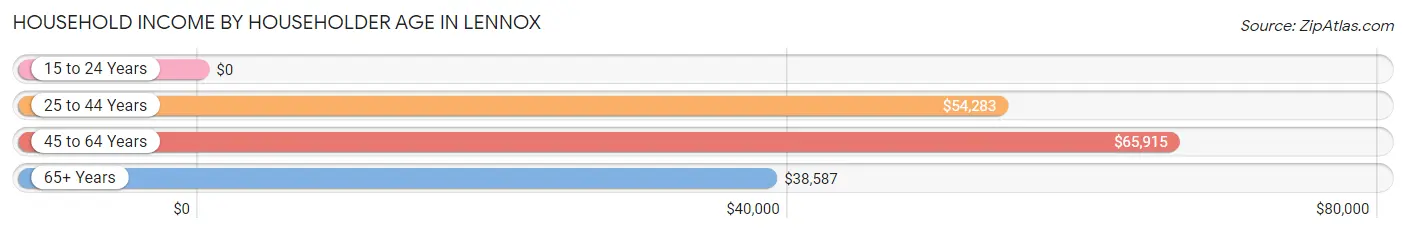
| Income Bracket | # Households | Median Income |
| 15 to 24 Years | 131 (2.3%) | $0 |
| 25 to 44 Years | 1,877 (33.2%) | $54,283 |
| 45 to 64 Years | 2,695 (47.7%) | $65,915 |
| 65+ Years | 948 (16.8%) | $38,587 |
| Total | 5,651 (100.0%) | $54,611 |
Poverty in Lennox
Income Below Poverty by Sex and Age in Lennox
With 13.1% poverty level for males and 19.1% for females among the residents of Lennox, 12 to 14 year old males and under 5 year old females are the most vulnerable to poverty, with 159 males (31.2%) and 278 females (42.5%) in their respective age groups living below the poverty level.
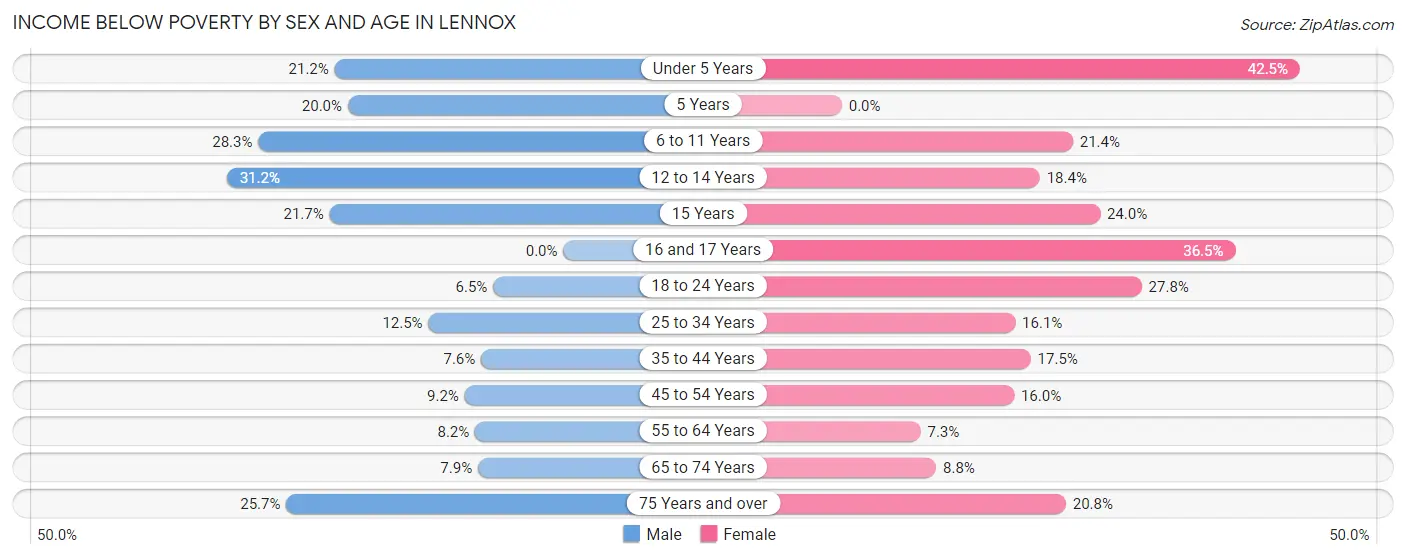
| Age Bracket | Male | Female |
| Under 5 Years | 114 (21.2%) | 278 (42.5%) |
| 5 Years | 21 (20.0%) | 0 (0.0%) |
| 6 to 11 Years | 357 (28.3%) | 179 (21.4%) |
| 12 to 14 Years | 159 (31.2%) | 61 (18.4%) |
| 15 Years | 46 (21.7%) | 46 (24.0%) |
| 16 and 17 Years | 0 (0.0%) | 84 (36.5%) |
| 18 to 24 Years | 79 (6.5%) | 280 (27.8%) |
| 25 to 34 Years | 219 (12.5%) | 284 (16.1%) |
| 35 to 44 Years | 122 (7.6%) | 179 (17.5%) |
| 45 to 54 Years | 103 (9.2%) | 238 (16.0%) |
| 55 to 64 Years | 138 (8.2%) | 79 (7.3%) |
| 65 to 74 Years | 56 (7.9%) | 60 (8.7%) |
| 75 Years and over | 27 (25.7%) | 74 (20.8%) |
| Total | 1,441 (13.1%) | 1,842 (19.1%) |
Income Above Poverty by Sex and Age in Lennox
According to the poverty statistics in Lennox, males aged 16 and 17 years and females aged 5 years are the age groups that are most secure financially, with 100.0% of males and 100.0% of females in these age groups living above the poverty line.
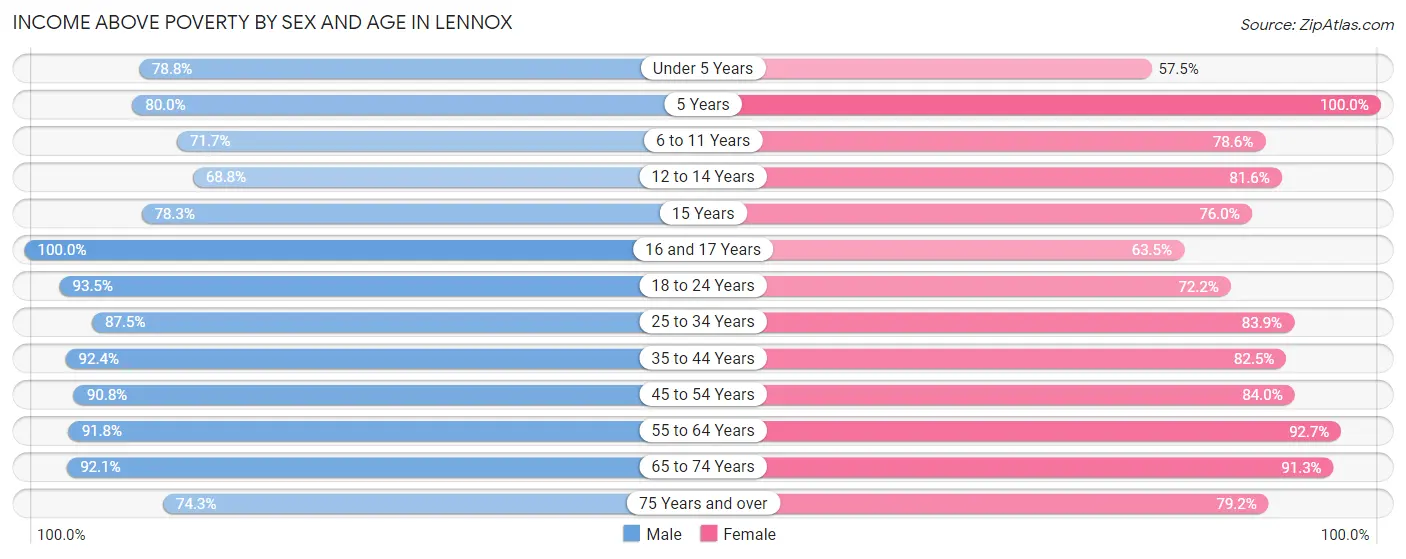
| Age Bracket | Male | Female |
| Under 5 Years | 423 (78.8%) | 376 (57.5%) |
| 5 Years | 84 (80.0%) | 11 (100.0%) |
| 6 to 11 Years | 904 (71.7%) | 656 (78.6%) |
| 12 to 14 Years | 350 (68.8%) | 271 (81.6%) |
| 15 Years | 166 (78.3%) | 146 (76.0%) |
| 16 and 17 Years | 219 (100.0%) | 146 (63.5%) |
| 18 to 24 Years | 1,135 (93.5%) | 726 (72.2%) |
| 25 to 34 Years | 1,530 (87.5%) | 1,481 (83.9%) |
| 35 to 44 Years | 1,477 (92.4%) | 842 (82.5%) |
| 45 to 54 Years | 1,021 (90.8%) | 1,251 (84.0%) |
| 55 to 64 Years | 1,546 (91.8%) | 1,002 (92.7%) |
| 65 to 74 Years | 651 (92.1%) | 626 (91.2%) |
| 75 Years and over | 78 (74.3%) | 282 (79.2%) |
| Total | 9,584 (86.9%) | 7,816 (80.9%) |
Income Below Poverty Among Married-Couple Families in Lennox
The poverty statistics for married-couple families in Lennox show that 9.4% or 269 of the total 2,861 families live below the poverty line. Families with 3 or 4 children have the highest poverty rate of 31.7%, comprising of 119 families. On the other hand, families with 5 or more children have the lowest poverty rate of 0.0%, which includes 0 families.
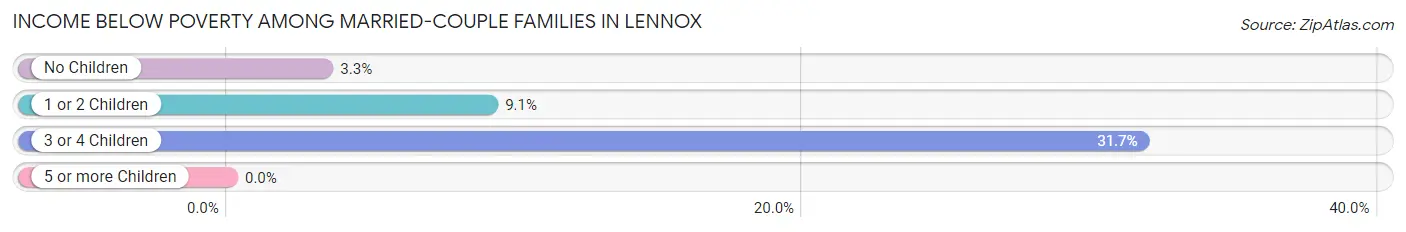
| Children | Above Poverty | Below Poverty |
| No Children | 1,223 (96.7%) | 42 (3.3%) |
| 1 or 2 Children | 1,084 (90.9%) | 108 (9.1%) |
| 3 or 4 Children | 256 (68.3%) | 119 (31.7%) |
| 5 or more Children | 29 (100.0%) | 0 (0.0%) |
| Total | 2,592 (90.6%) | 269 (9.4%) |
Income Below Poverty Among Single-Parent Households in Lennox
According to the poverty data in Lennox, 13.4% or 77 single-father households and 28.4% or 315 single-mother households are living below the poverty line. Among single-father households, those with 1 or 2 children have the highest poverty rate, with 69 households (19.6%) experiencing poverty. Likewise, among single-mother households, those with 5 or more children have the highest poverty rate, with 25 households (100.0%) falling below the poverty line.
| Children | Single Father | Single Mother |
| No Children | 8 (3.6%) | 31 (6.9%) |
| 1 or 2 Children | 69 (19.6%) | 205 (41.1%) |
| 3 or 4 Children | 0 (0.0%) | 54 (40.0%) |
| 5 or more Children | 0 (0.0%) | 25 (100.0%) |
| Total | 77 (13.4%) | 315 (28.4%) |
Income Below Poverty Among Married-Couple vs Single-Parent Households in Lennox
The poverty data for Lennox shows that 269 of the married-couple family households (9.4%) and 392 of the single-parent households (23.3%) are living below the poverty level. Within the married-couple family households, those with 3 or 4 children have the highest poverty rate, with 119 households (31.7%) falling below the poverty line. Among the single-parent households, those with 5 or more children have the highest poverty rate, with 25 household (100.0%) living below poverty.
| Children | Married-Couple Families | Single-Parent Households |
| No Children | 42 (3.3%) | 39 (5.8%) |
| 1 or 2 Children | 108 (9.1%) | 274 (32.2%) |
| 3 or 4 Children | 119 (31.7%) | 54 (40.0%) |
| 5 or more Children | 0 (0.0%) | 25 (100.0%) |
| Total | 269 (9.4%) | 392 (23.3%) |
Race in Lennox
The most populous races in Lennox are Hispanic or Latino (18,120 | 87.6%), Some other Race (8,588 | 41.5%), and White / Caucasian (5,570 | 26.9%).
| Race | # Population | % Population |
| Asian | 559 | 2.7% |
| Black / African American | 830 | 4.0% |
| Hawaiian / Pacific | 487 | 2.4% |
| Hispanic or Latino | 18,120 | 87.6% |
| Native / Alaskan | 326 | 1.6% |
| White / Caucasian | 5,570 | 26.9% |
| Two or more Races | 4,327 | 20.9% |
| Some other Race | 8,588 | 41.5% |
| Total | 20,687 | 100.0% |
Ancestry in Lennox
The most populous ancestries reported in Lennox are Mexican (13,969 | 67.5%), Central American (3,550 | 17.2%), Guatemalan (1,526 | 7.4%), American (1,322 | 6.4%), and Salvadoran (1,258 | 6.1%), together accounting for 104.5% of all Lennox residents.
| Ancestry | # Population | % Population |
| African | 22 | 0.1% |
| American | 1,322 | 6.4% |
| Arab | 14 | 0.1% |
| Argentinean | 9 | 0.0% |
| Austrian | 27 | 0.1% |
| Basque | 4 | 0.0% |
| Belizean | 13 | 0.1% |
| Bhutanese | 6 | 0.0% |
| Brazilian | 83 | 0.4% |
| Burmese | 41 | 0.2% |
| Central American | 3,550 | 17.2% |
| Central American Indian | 103 | 0.5% |
| Colombian | 9 | 0.0% |
| Cuban | 116 | 0.6% |
| Czech | 5 | 0.0% |
| Danish | 4 | 0.0% |
| Dutch | 19 | 0.1% |
| Eastern European | 6 | 0.0% |
| Ecuadorian | 20 | 0.1% |
| English | 31 | 0.2% |
| European | 10 | 0.1% |
| French | 14 | 0.1% |
| German | 159 | 0.8% |
| Guatemalan | 1,526 | 7.4% |
| Honduran | 404 | 1.9% |
| Indian (Asian) | 204 | 1.0% |
| Irish | 32 | 0.2% |
| Italian | 102 | 0.5% |
| Korean | 384 | 1.9% |
| Laotian | 21 | 0.1% |
| Lebanese | 14 | 0.1% |
| Mexican | 13,969 | 67.5% |
| Mexican American Indian | 369 | 1.8% |
| Nicaraguan | 316 | 1.5% |
| Panamanian | 46 | 0.2% |
| Peruvian | 23 | 0.1% |
| Portuguese | 17 | 0.1% |
| Russian | 27 | 0.1% |
| Salvadoran | 1,258 | 6.1% |
| Samoan | 183 | 0.9% |
| Scotch-Irish | 10 | 0.1% |
| Scottish | 12 | 0.1% |
| South American | 61 | 0.3% |
| South American Indian | 61 | 0.3% |
| Spaniard | 14 | 0.1% |
| Spanish | 33 | 0.2% |
| Sri Lankan | 1 | 0.0% |
| Subsaharan African | 22 | 0.1% |
| Swedish | 4 | 0.0% |
| Thai | 32 | 0.2% |
| Tongan | 304 | 1.5% | View All 51 Rows |
Immigrants in Lennox
The most numerous immigrant groups reported in Lennox came from Latin America (9,148 | 44.2%), Central America (8,999 | 43.5%), Mexico (6,906 | 33.4%), Guatemala (912 | 4.4%), and El Salvador (719 | 3.5%), together accounting for 129.0% of all Lennox residents.
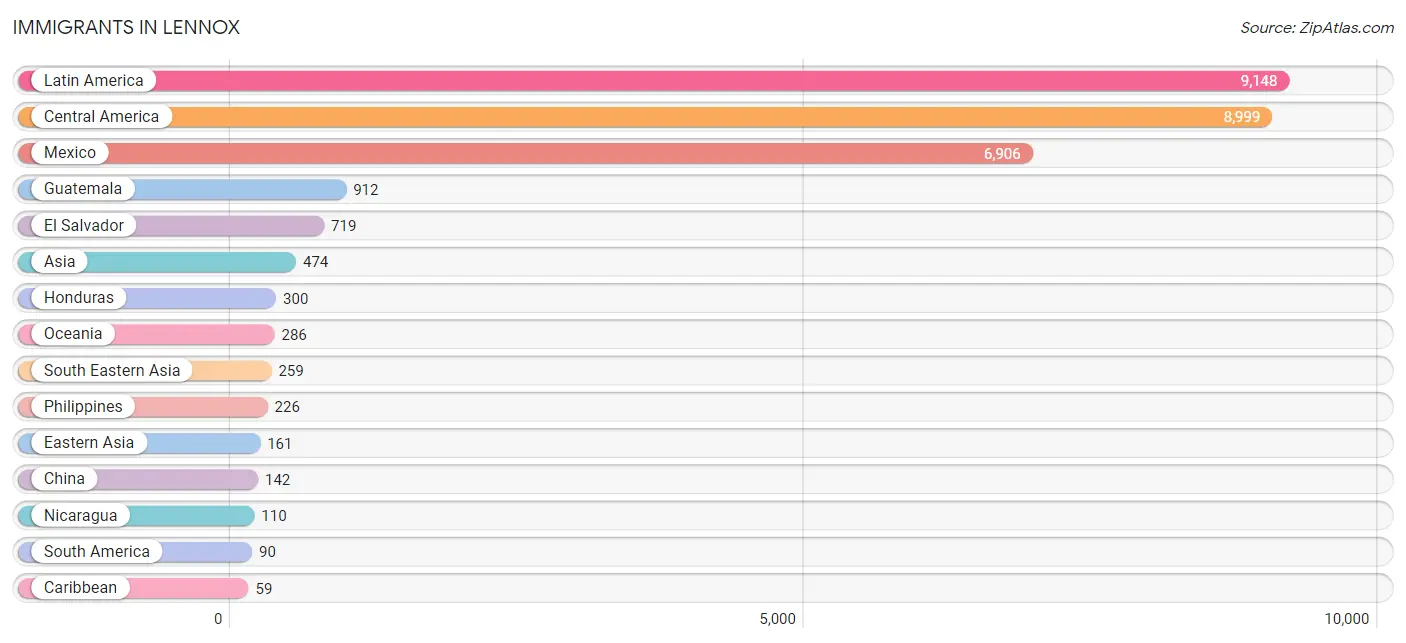
| Immigration Origin | # Population | % Population |
| Asia | 474 | 2.3% |
| Belize | 6 | 0.0% |
| Brazil | 58 | 0.3% |
| Caribbean | 59 | 0.3% |
| Central America | 8,999 | 43.5% |
| China | 142 | 0.7% |
| Colombia | 9 | 0.0% |
| Cuba | 59 | 0.3% |
| Eastern Asia | 161 | 0.8% |
| El Salvador | 719 | 3.5% |
| England | 8 | 0.0% |
| Europe | 28 | 0.1% |
| Guatemala | 912 | 4.4% |
| Honduras | 300 | 1.5% |
| India | 32 | 0.2% |
| Indonesia | 32 | 0.2% |
| Korea | 19 | 0.1% |
| Latin America | 9,148 | 44.2% |
| Mexico | 6,906 | 33.4% |
| Netherlands | 20 | 0.1% |
| Nicaragua | 110 | 0.5% |
| Northern Europe | 8 | 0.0% |
| Oceania | 286 | 1.4% |
| Pakistan | 13 | 0.1% |
| Panama | 46 | 0.2% |
| Peru | 23 | 0.1% |
| Philippines | 226 | 1.1% |
| South America | 90 | 0.4% |
| South Central Asia | 54 | 0.3% |
| South Eastern Asia | 259 | 1.3% |
| Sri Lanka | 9 | 0.0% |
| Taiwan | 9 | 0.0% |
| Vietnam | 1 | 0.0% |
| Western Europe | 20 | 0.1% | View All 34 Rows |
Sex and Age in Lennox
Sex and Age in Lennox
The most populous age groups in Lennox are 55 to 59 Years (1,036 | 9.4%) for men and 25 to 29 Years (1,060 | 11.0%) for women.
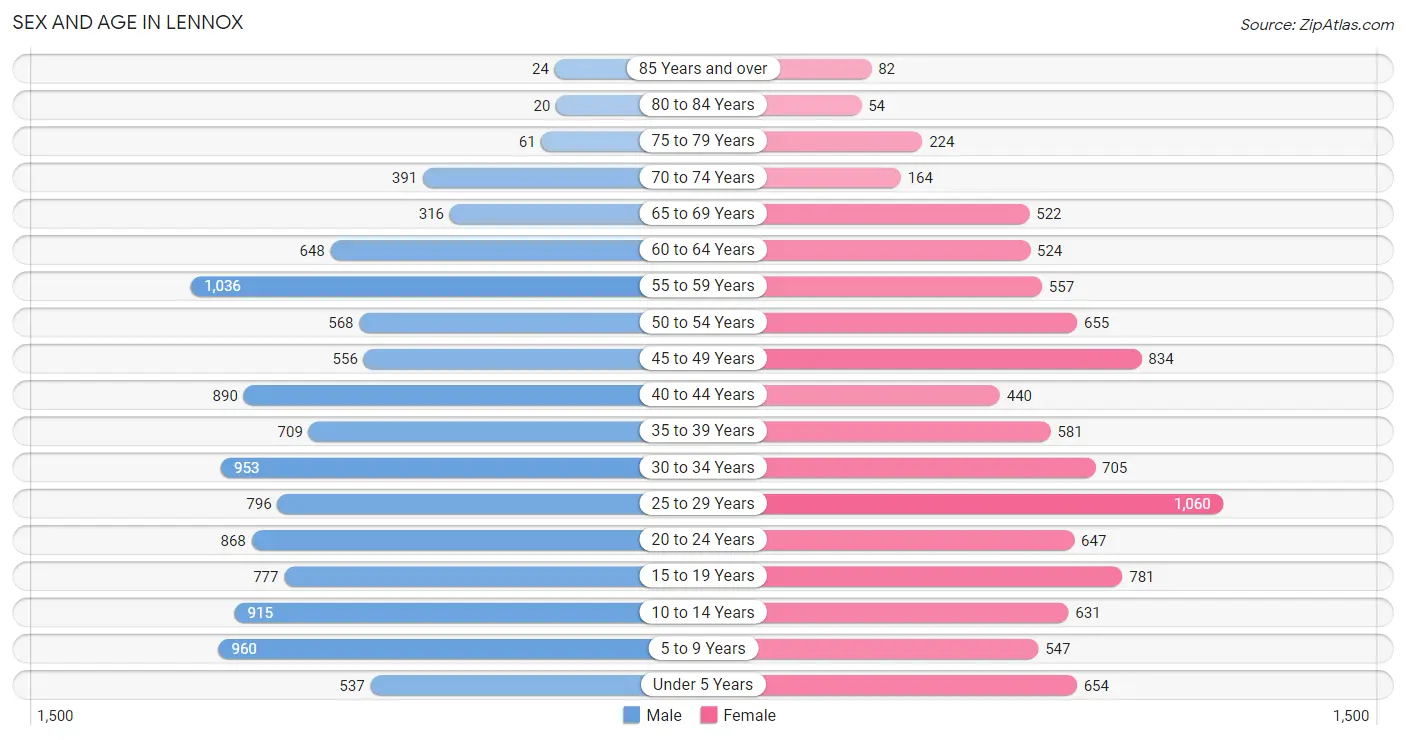
| Age Bracket | Male | Female |
| Under 5 Years | 537 (4.9%) | 654 (6.8%) |
| 5 to 9 Years | 960 (8.7%) | 547 (5.7%) |
| 10 to 14 Years | 915 (8.3%) | 631 (6.5%) |
| 15 to 19 Years | 777 (7.0%) | 781 (8.1%) |
| 20 to 24 Years | 868 (7.9%) | 647 (6.7%) |
| 25 to 29 Years | 796 (7.2%) | 1,060 (11.0%) |
| 30 to 34 Years | 953 (8.6%) | 705 (7.3%) |
| 35 to 39 Years | 709 (6.4%) | 581 (6.0%) |
| 40 to 44 Years | 890 (8.1%) | 440 (4.5%) |
| 45 to 49 Years | 556 (5.0%) | 834 (8.6%) |
| 50 to 54 Years | 568 (5.1%) | 655 (6.8%) |
| 55 to 59 Years | 1,036 (9.4%) | 557 (5.8%) |
| 60 to 64 Years | 648 (5.9%) | 524 (5.4%) |
| 65 to 69 Years | 316 (2.9%) | 522 (5.4%) |
| 70 to 74 Years | 391 (3.5%) | 164 (1.7%) |
| 75 to 79 Years | 61 (0.5%) | 224 (2.3%) |
| 80 to 84 Years | 20 (0.2%) | 54 (0.6%) |
| 85 Years and over | 24 (0.2%) | 82 (0.9%) |
| Total | 11,025 (100.0%) | 9,662 (100.0%) |
Families and Households in Lennox
Median Family Size in Lennox
The median family size in Lennox is 4.05 persons per family, with married-couple families (2,861 | 63.0%) accounting for the largest median family size of 4.3 persons per family. On the other hand, single male/father families (573 | 12.6%) represent the smallest median family size with 3.08 persons per family.
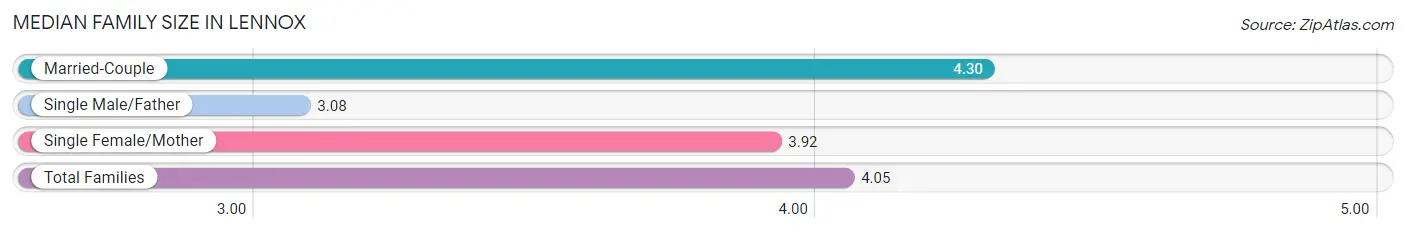
| Family Type | # Families | Family Size |
| Married-Couple | 2,861 (63.0%) | 4.30 |
| Single Male/Father | 573 (12.6%) | 3.08 |
| Single Female/Mother | 1,109 (24.4%) | 3.92 |
| Total Families | 4,543 (100.0%) | 4.05 |
Median Household Size in Lennox
The median household size in Lennox is 3.66 persons per household, with married-couple households (2,861 | 50.6%) accounting for the largest median household size of 4.38 persons per household. non-family households (1,108 | 19.6%) represent the smallest median household size with 1.37 persons per household.
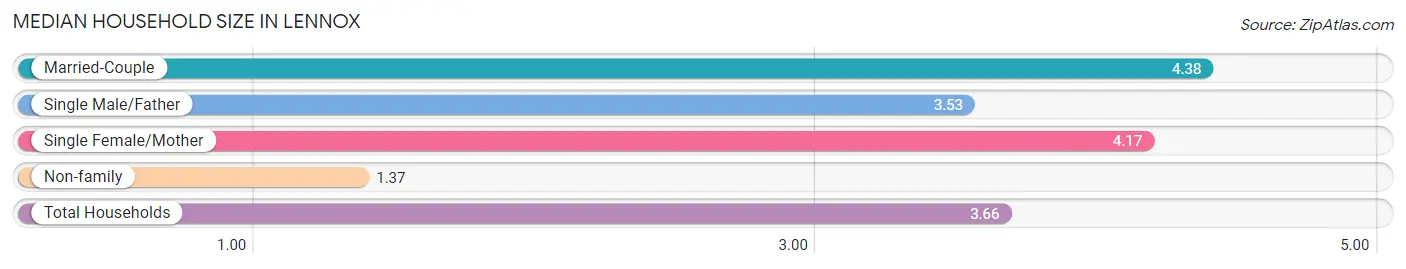
| Household Type | # Households | Household Size |
| Married-Couple | 2,861 (50.6%) | 4.38 |
| Single Male/Father | 573 (10.1%) | 3.53 |
| Single Female/Mother | 1,109 (19.6%) | 4.17 |
| Non-family | 1,108 (19.6%) | 1.37 |
| Total Households | 5,651 (100.0%) | 3.66 |
Household Size by Marriage Status in Lennox
Out of a total of 5,651 households in Lennox, 4,543 (80.4%) are family households, while 1,108 (19.6%) are nonfamily households. The most numerous type of family households are 4-person households, comprising 1,262, and the most common type of nonfamily households are 1-person households, comprising 840.
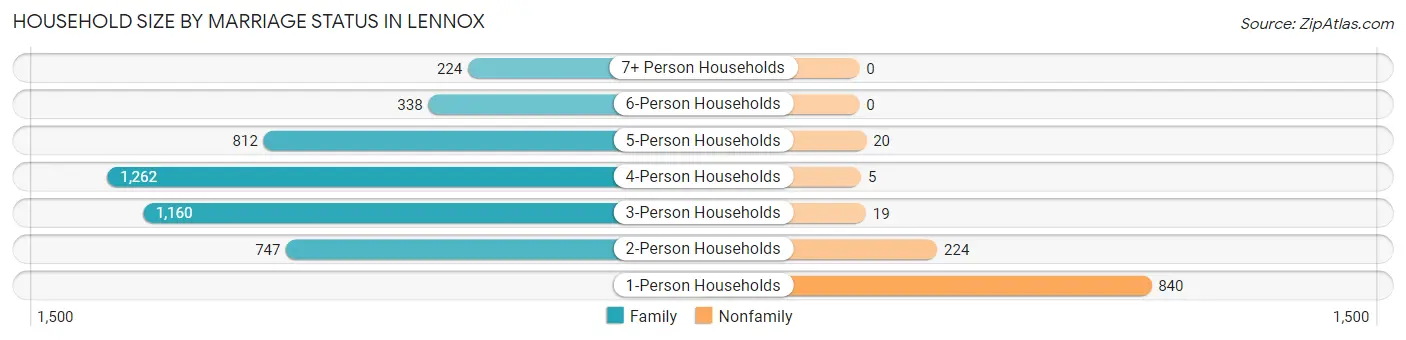
| Household Size | Family Households | Nonfamily Households |
| 1-Person Households | - | 840 (14.9%) |
| 2-Person Households | 747 (13.2%) | 224 (4.0%) |
| 3-Person Households | 1,160 (20.5%) | 19 (0.3%) |
| 4-Person Households | 1,262 (22.3%) | 5 (0.1%) |
| 5-Person Households | 812 (14.4%) | 20 (0.4%) |
| 6-Person Households | 338 (6.0%) | 0 (0.0%) |
| 7+ Person Households | 224 (4.0%) | 0 (0.0%) |
| Total | 4,543 (80.4%) | 1,108 (19.6%) |
Female Fertility in Lennox
Fertility by Age in Lennox
Average fertility rate in Lennox is 64.0 births per 1,000 women. Women in the age bracket of 20 to 34 years have the highest fertility rate with 109.0 births per 1,000 women. Women in the age bracket of 20 to 34 years acount for 80.2% of all women with births.
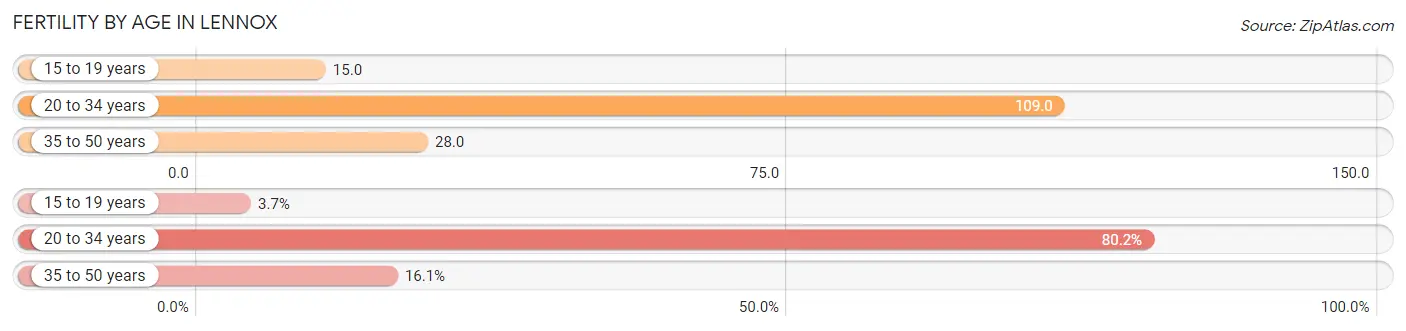
| Age Bracket | Women with Births | Births / 1,000 Women |
| 15 to 19 years | 12 (3.6%) | 15.0 |
| 20 to 34 years | 264 (80.2%) | 109.0 |
| 35 to 50 years | 53 (16.1%) | 28.0 |
| Total | 329 (100.0%) | 64.0 |
Fertility by Age by Marriage Status in Lennox
53.2% of women with births (329) in Lennox are married. The highest percentage of unmarried women with births falls into 15 to 19 years age bracket with 100.0% of them unmarried at the time of birth, while the lowest percentage of unmarried women with births belong to 35 to 50 years age bracket with 39.6% of them unmarried.
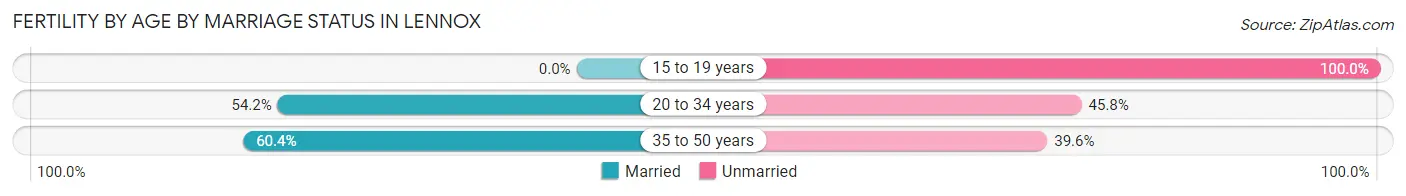
| Age Bracket | Married | Unmarried |
| 15 to 19 years | 0 (0.0%) | 12 (100.0%) |
| 20 to 34 years | 143 (54.2%) | 121 (45.8%) |
| 35 to 50 years | 32 (60.4%) | 21 (39.6%) |
| Total | 175 (53.2%) | 154 (46.8%) |
Fertility by Education in Lennox
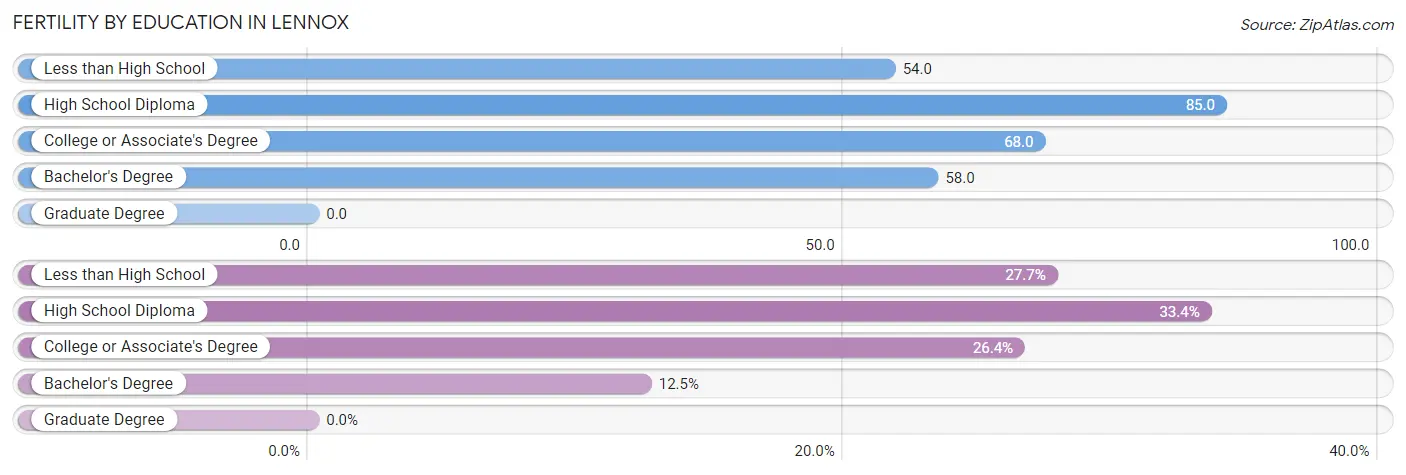
| Educational Attainment | Women with Births | Births / 1,000 Women |
| Less than High School | 91 (27.7%) | 54.0 |
| High School Diploma | 110 (33.4%) | 85.0 |
| College or Associate's Degree | 87 (26.4%) | 68.0 |
| Bachelor's Degree | 41 (12.5%) | 58.0 |
| Graduate Degree | 0 (0.0%) | 0.0 |
| Total | 329 (100.0%) | 64.0 |
Fertility by Education by Marriage Status in Lennox
46.8% of women with births in Lennox are unmarried. Women with the educational attainment of bachelor's degree are most likely to be married with 100.0% of them married at childbirth, while women with the educational attainment of high school diploma are least likely to be married with 67.3% of them unmarried at childbirth.
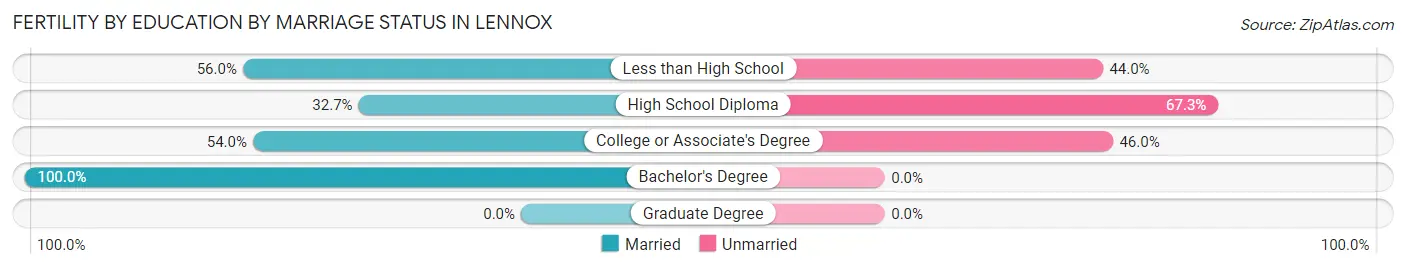
| Educational Attainment | Married | Unmarried |
| Less than High School | 51 (56.0%) | 40 (44.0%) |
| High School Diploma | 36 (32.7%) | 74 (67.3%) |
| College or Associate's Degree | 47 (54.0%) | 40 (46.0%) |
| Bachelor's Degree | 41 (100.0%) | 0 (0.0%) |
| Graduate Degree | 0 (0.0%) | 0 (0.0%) |
| Total | 175 (53.2%) | 154 (46.8%) |
Employment Characteristics in Lennox
Employment by Class of Employer in Lennox
Among the 10,184 employed individuals in Lennox, private company employees (7,479 | 73.4%), self-employed (not incorporated) (1,277 | 12.5%), and local government employees (507 | 5.0%) make up the most common classes of employment.
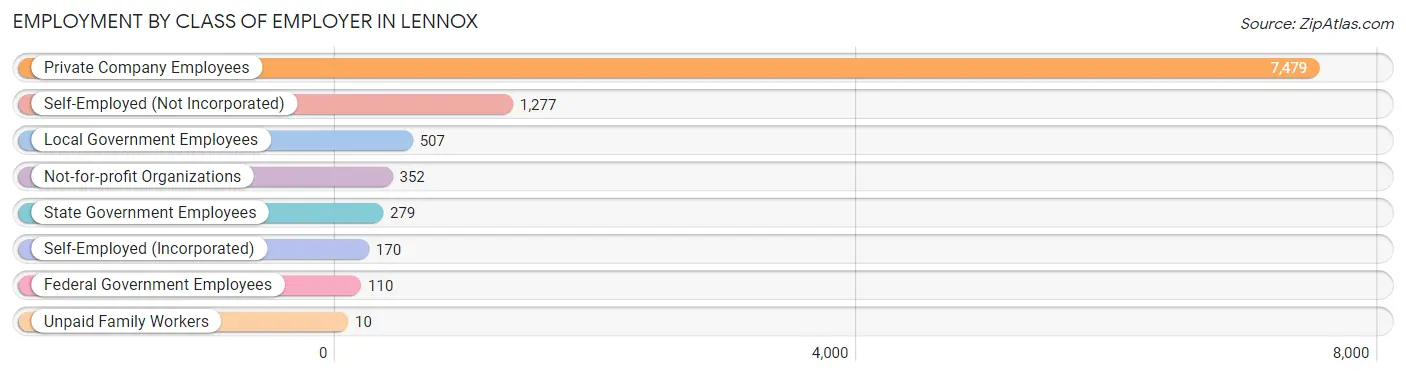
| Employer Class | # Employees | % Employees |
| Private Company Employees | 7,479 | 73.4% |
| Self-Employed (Incorporated) | 170 | 1.7% |
| Self-Employed (Not Incorporated) | 1,277 | 12.5% |
| Not-for-profit Organizations | 352 | 3.5% |
| Local Government Employees | 507 | 5.0% |
| State Government Employees | 279 | 2.7% |
| Federal Government Employees | 110 | 1.1% |
| Unpaid Family Workers | 10 | 0.1% |
| Total | 10,184 | 100.0% |
Employment Status by Age in Lennox
According to the labor force statistics for Lennox, out of the total population over 16 years of age (16,039), 71.7% or 11,500 individuals are in the labor force, with 6.6% or 759 of them unemployed. The age group with the highest labor force participation rate is 30 to 34 years, with 92.9% or 1,540 individuals in the labor force. Within the labor force, the 16 to 19 years age range has the highest percentage of unemployed individuals, with 11.8% or 65 of them being unemployed.
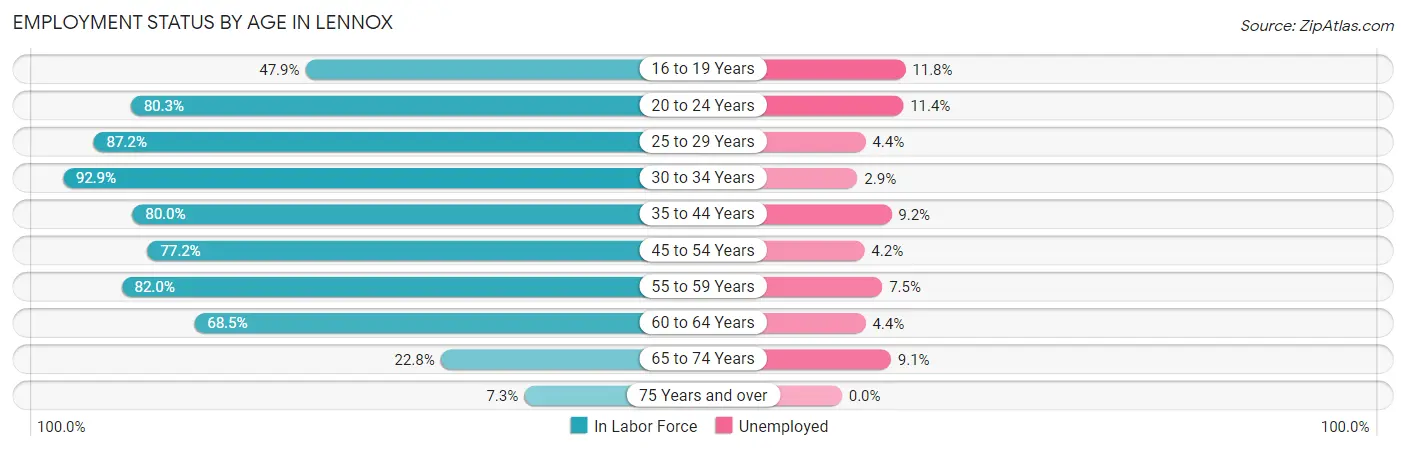
| Age Bracket | In Labor Force | Unemployed |
| 16 to 19 Years | 553 (47.9%) | 65 (11.8%) |
| 20 to 24 Years | 1,217 (80.3%) | 139 (11.4%) |
| 25 to 29 Years | 1,618 (87.2%) | 71 (4.4%) |
| 30 to 34 Years | 1,540 (92.9%) | 45 (2.9%) |
| 35 to 44 Years | 2,096 (80.0%) | 193 (9.2%) |
| 45 to 54 Years | 2,017 (77.2%) | 85 (4.2%) |
| 55 to 59 Years | 1,306 (82.0%) | 98 (7.5%) |
| 60 to 64 Years | 803 (68.5%) | 35 (4.4%) |
| 65 to 74 Years | 318 (22.8%) | 29 (9.1%) |
| 75 Years and over | 34 (7.3%) | 0 (0.0%) |
| Total | 11,500 (71.7%) | 759 (6.6%) |
Employment Status by Educational Attainment in Lennox
According to labor force statistics for Lennox, 81.5% of individuals (9,382) out of the total population between 25 and 64 years of age (11,512) are in the labor force, with 5.6% or 525 of them being unemployed. The group with the highest labor force participation rate are those with the educational attainment of bachelor's degree or higher, with 88.7% or 1,329 individuals in the labor force. Within the labor force, individuals with high school diploma education have the highest percentage of unemployment, with 7.6% or 184 of them being unemployed.
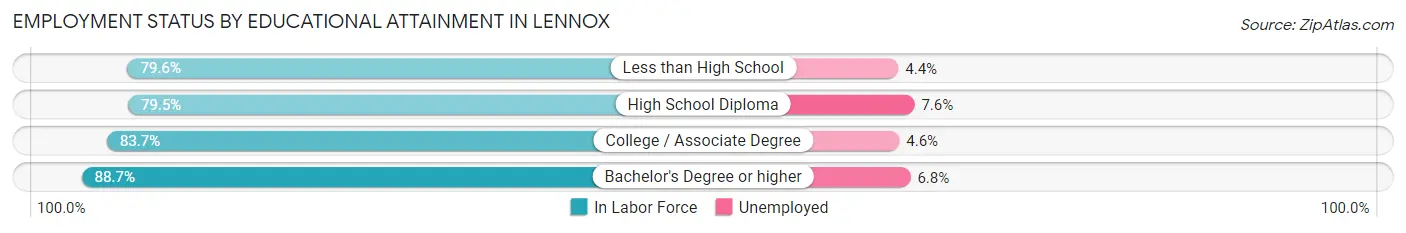
| Educational Attainment | In Labor Force | Unemployed |
| Less than High School | 3,873 (79.6%) | 214 (4.4%) |
| High School Diploma | 2,417 (79.5%) | 231 (7.6%) |
| College / Associate Degree | 1,764 (83.7%) | 97 (4.6%) |
| Bachelor's Degree or higher | 1,329 (88.7%) | 102 (6.8%) |
| Total | 9,382 (81.5%) | 645 (5.6%) |
Employment Occupations by Sex in Lennox
Management, Business, Science and Arts Occupations
The most common Management, Business, Science and Arts occupations in Lennox are Community & Social Service (613 | 5.7%), Management (493 | 4.6%), Education Instruction & Library (267 | 2.5%), Business & Financial (201 | 1.9%), and Education, Arts & Media (180 | 1.7%).
Management, Business, Science and Arts Occupations by Sex
Within the Management, Business, Science and Arts occupations in Lennox, the most male-oriented occupations are Arts, Media & Entertainment (66.9%), Computers & Mathematics (66.0%), and Computers, Engineering & Science (64.2%), while the most female-oriented occupations are Legal Services & Support (100.0%), Education Instruction & Library (100.0%), and Health Technologists (100.0%).
| Occupation | Male | Female |
| Management | 205 (41.6%) | 288 (58.4%) |
| Business & Financial | 48 (23.9%) | 153 (76.1%) |
| Computers, Engineering & Science | 97 (64.2%) | 54 (35.8%) |
| Computers & Mathematics | 62 (66.0%) | 32 (34.0%) |
| Architecture & Engineering | 35 (61.4%) | 22 (38.6%) |
| Life, Physical & Social Science | 0 (0.0%) | 0 (0.0%) |
| Community & Social Service | 147 (24.0%) | 466 (76.0%) |
| Education, Arts & Media | 58 (32.2%) | 122 (67.8%) |
| Legal Services & Support | 0 (0.0%) | 33 (100.0%) |
| Education Instruction & Library | 0 (0.0%) | 267 (100.0%) |
| Arts, Media & Entertainment | 89 (66.9%) | 44 (33.1%) |
| Health Diagnosing & Treating | 18 (39.1%) | 28 (60.9%) |
| Health Technologists | 0 (0.0%) | 16 (100.0%) |
| Total (Category) | 515 (34.2%) | 989 (65.8%) |
| Total (Overall) | 6,270 (58.4%) | 4,463 (41.6%) |
Services Occupations
The most common Services occupations in Lennox are Cleaning & Maintenance (1,308 | 12.2%), Food Preparation & Serving (1,152 | 10.7%), Healthcare Support (332 | 3.1%), Personal Care & Service (296 | 2.8%), and Security & Protection (245 | 2.3%).
Services Occupations by Sex
Within the Services occupations in Lennox, the most male-oriented occupations are Food Preparation & Serving (63.7%), Cleaning & Maintenance (62.6%), and Security & Protection (61.6%), while the most female-oriented occupations are Healthcare Support (75.6%), Personal Care & Service (42.6%), and Security & Protection (38.4%).
| Occupation | Male | Female |
| Healthcare Support | 81 (24.4%) | 251 (75.6%) |
| Security & Protection | 151 (61.6%) | 94 (38.4%) |
| Firefighting & Prevention | 151 (61.6%) | 94 (38.4%) |
| Law Enforcement | 0 (0.0%) | 0 (0.0%) |
| Food Preparation & Serving | 734 (63.7%) | 418 (36.3%) |
| Cleaning & Maintenance | 819 (62.6%) | 489 (37.4%) |
| Personal Care & Service | 170 (57.4%) | 126 (42.6%) |
| Total (Category) | 1,955 (58.7%) | 1,378 (41.3%) |
| Total (Overall) | 6,270 (58.4%) | 4,463 (41.6%) |
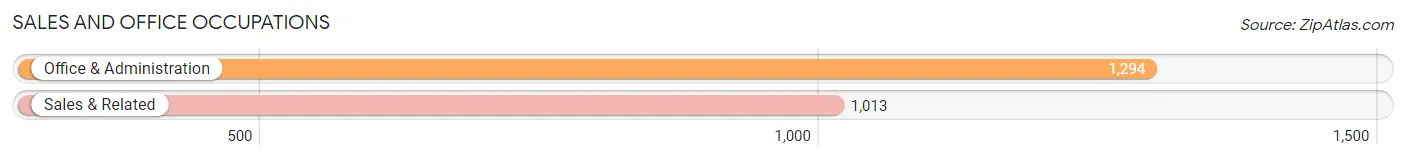
Sales and Office Occupations
The most common Sales and Office occupations in Lennox are Office & Administration (1,294 | 12.1%), and Sales & Related (1,013 | 9.4%).
Sales and Office Occupations by Sex
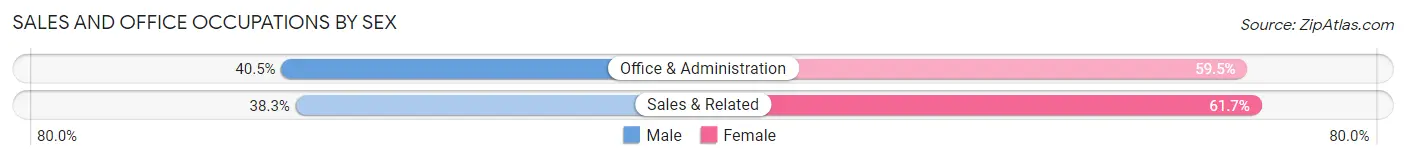
| Occupation | Male | Female |
| Sales & Related | 388 (38.3%) | 625 (61.7%) |
| Office & Administration | 524 (40.5%) | 770 (59.5%) |
| Total (Category) | 912 (39.5%) | 1,395 (60.5%) |
| Total (Overall) | 6,270 (58.4%) | 4,463 (41.6%) |
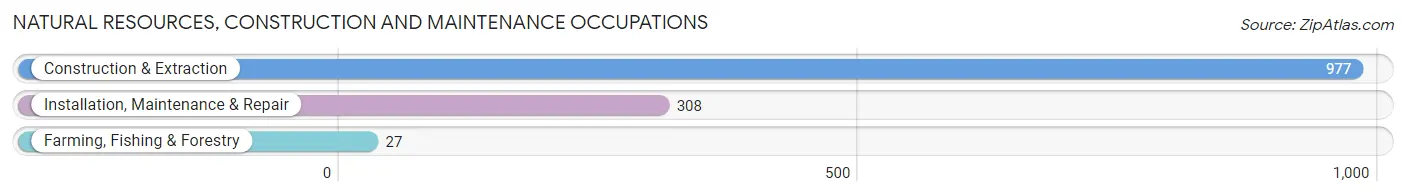
Natural Resources, Construction and Maintenance Occupations
The most common Natural Resources, Construction and Maintenance occupations in Lennox are Construction & Extraction (977 | 9.1%), Installation, Maintenance & Repair (308 | 2.9%), and Farming, Fishing & Forestry (27 | 0.3%).
Natural Resources, Construction and Maintenance Occupations by Sex
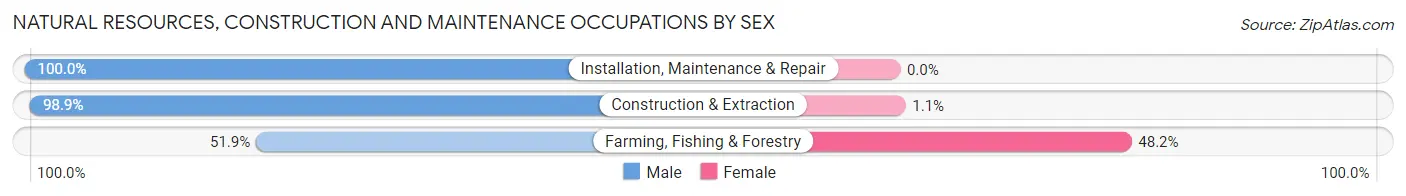
| Occupation | Male | Female |
| Farming, Fishing & Forestry | 14 (51.8%) | 13 (48.1%) |
| Construction & Extraction | 966 (98.9%) | 11 (1.1%) |
| Installation, Maintenance & Repair | 308 (100.0%) | 0 (0.0%) |
| Total (Category) | 1,288 (98.2%) | 24 (1.8%) |
| Total (Overall) | 6,270 (58.4%) | 4,463 (41.6%) |
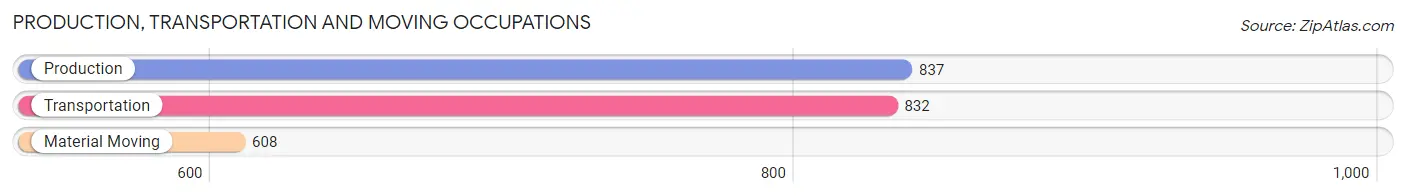
Production, Transportation and Moving Occupations
The most common Production, Transportation and Moving occupations in Lennox are Production (837 | 7.8%), Transportation (832 | 7.7%), and Material Moving (608 | 5.7%).
Production, Transportation and Moving Occupations by Sex
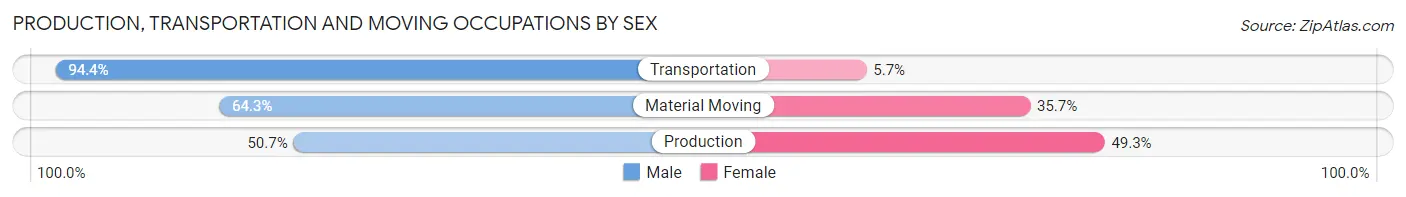
| Occupation | Male | Female |
| Production | 424 (50.7%) | 413 (49.3%) |
| Transportation | 785 (94.4%) | 47 (5.7%) |
| Material Moving | 391 (64.3%) | 217 (35.7%) |
| Total (Category) | 1,600 (70.3%) | 677 (29.7%) |
| Total (Overall) | 6,270 (58.4%) | 4,463 (41.6%) |
Employment Industries by Sex in Lennox
Employment Industries in Lennox
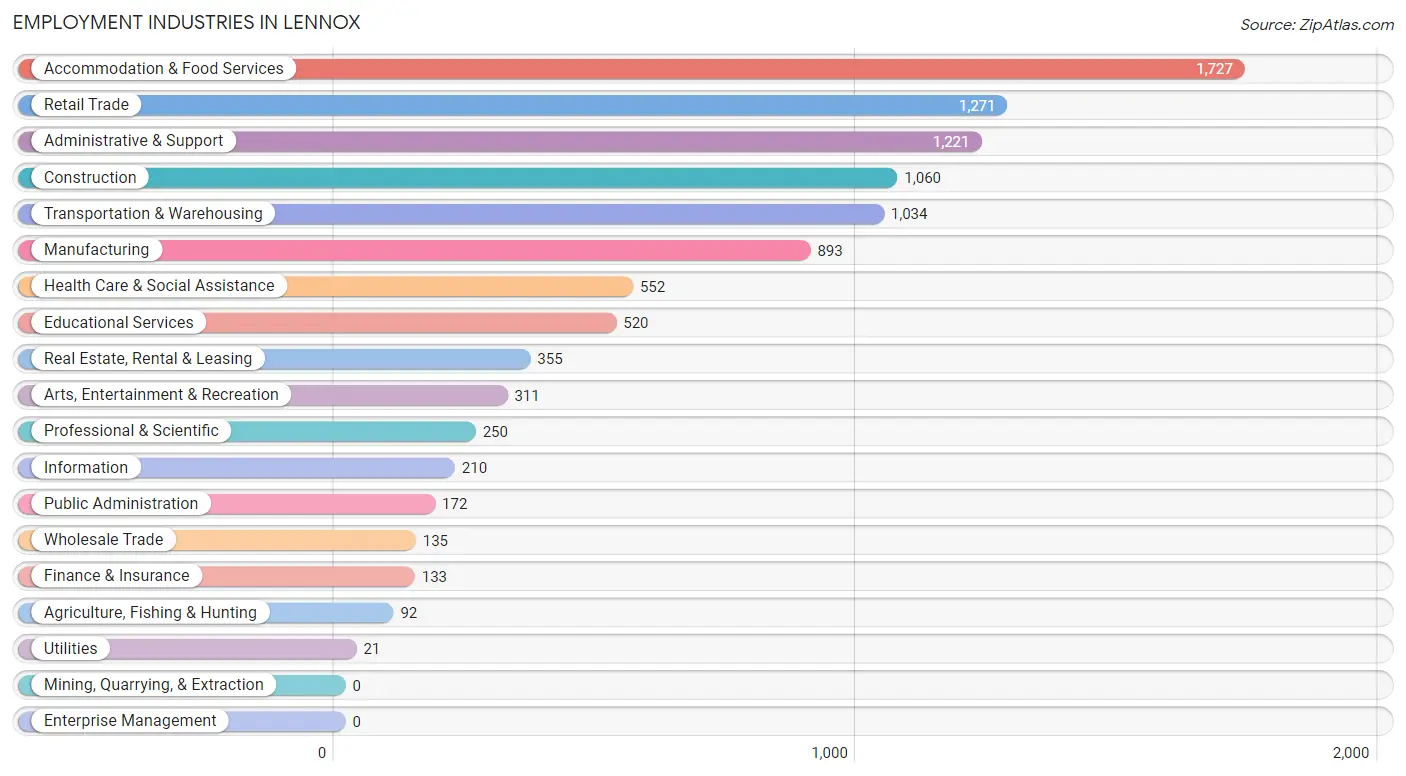
The major employment industries in Lennox include Accommodation & Food Services (1,727 | 16.1%), Retail Trade (1,271 | 11.8%), Administrative & Support (1,221 | 11.4%), Construction (1,060 | 9.9%), and Transportation & Warehousing (1,034 | 9.6%).
Employment Industries by Sex in Lennox
The Lennox industries that see more men than women are Construction (100.0%), Utilities (100.0%), and Transportation & Warehousing (82.9%), whereas the industries that tend to have a higher number of women are Professional & Scientific (86.0%), Educational Services (81.1%), and Health Care & Social Assistance (70.3%).
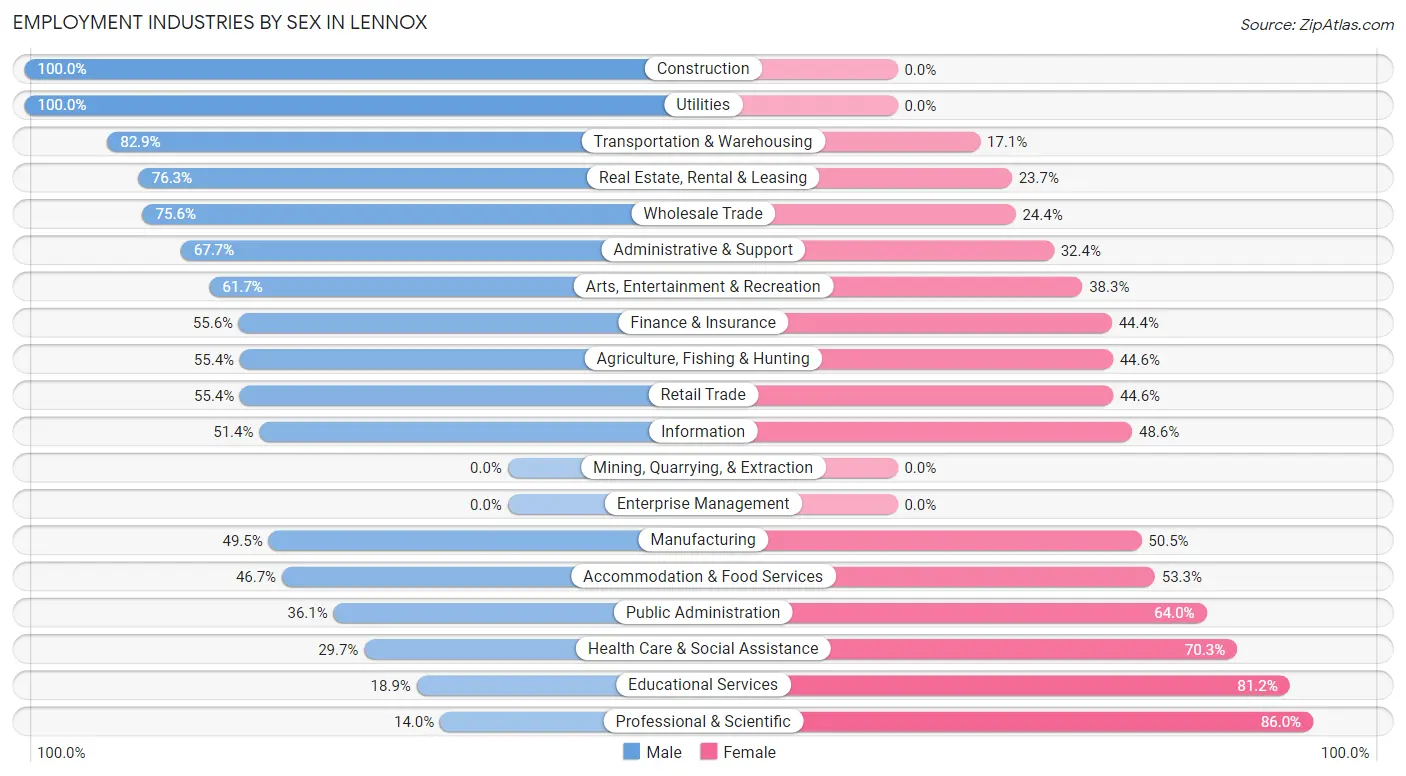
| Industry | Male | Female |
| Agriculture, Fishing & Hunting | 51 (55.4%) | 41 (44.6%) |
| Mining, Quarrying, & Extraction | 0 (0.0%) | 0 (0.0%) |
| Construction | 1,060 (100.0%) | 0 (0.0%) |
| Manufacturing | 442 (49.5%) | 451 (50.5%) |
| Wholesale Trade | 102 (75.6%) | 33 (24.4%) |
| Retail Trade | 704 (55.4%) | 567 (44.6%) |
| Transportation & Warehousing | 857 (82.9%) | 177 (17.1%) |
| Utilities | 21 (100.0%) | 0 (0.0%) |
| Information | 108 (51.4%) | 102 (48.6%) |
| Finance & Insurance | 74 (55.6%) | 59 (44.4%) |
| Real Estate, Rental & Leasing | 271 (76.3%) | 84 (23.7%) |
| Professional & Scientific | 35 (14.0%) | 215 (86.0%) |
| Enterprise Management | 0 (0.0%) | 0 (0.0%) |
| Administrative & Support | 826 (67.6%) | 395 (32.4%) |
| Educational Services | 98 (18.9%) | 422 (81.1%) |
| Health Care & Social Assistance | 164 (29.7%) | 388 (70.3%) |
| Arts, Entertainment & Recreation | 192 (61.7%) | 119 (38.3%) |
| Accommodation & Food Services | 807 (46.7%) | 920 (53.3%) |
| Public Administration | 62 (36.0%) | 110 (63.9%) |
| Total | 6,270 (58.4%) | 4,463 (41.6%) |
Education in Lennox
School Enrollment in Lennox
The most common levels of schooling among the 5,434 students in Lennox are elementary school (1,250 | 23.0%), high school (1,247 | 23.0%), and middle school (1,214 | 22.3%).
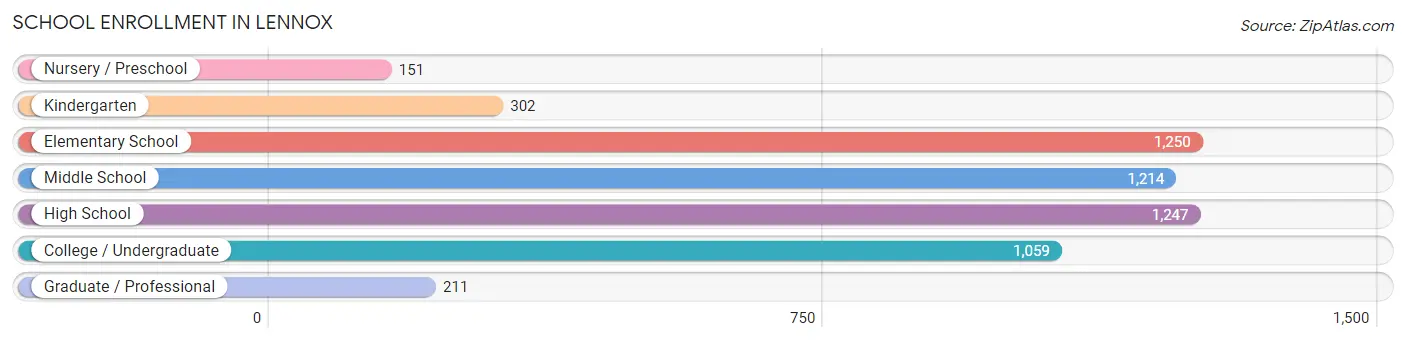
| School Level | # Students | % Students |
| Nursery / Preschool | 151 | 2.8% |
| Kindergarten | 302 | 5.6% |
| Elementary School | 1,250 | 23.0% |
| Middle School | 1,214 | 22.3% |
| High School | 1,247 | 23.0% |
| College / Undergraduate | 1,059 | 19.5% |
| Graduate / Professional | 211 | 3.9% |
| Total | 5,434 | 100.0% |
School Enrollment by Age by Funding Source in Lennox
Out of a total of 5,434 students who are enrolled in schools in Lennox, 505 (9.3%) attend a private institution, while the remaining 4,929 (90.7%) are enrolled in public schools. The age group of 25 to 34 year olds has the highest likelihood of being enrolled in private schools, with 103 (25.3% in the age bracket) enrolled. Conversely, the age group of 3 to 4 year olds has the lowest likelihood of being enrolled in a private school, with 127 (100.0% in the age bracket) attending a public institution.
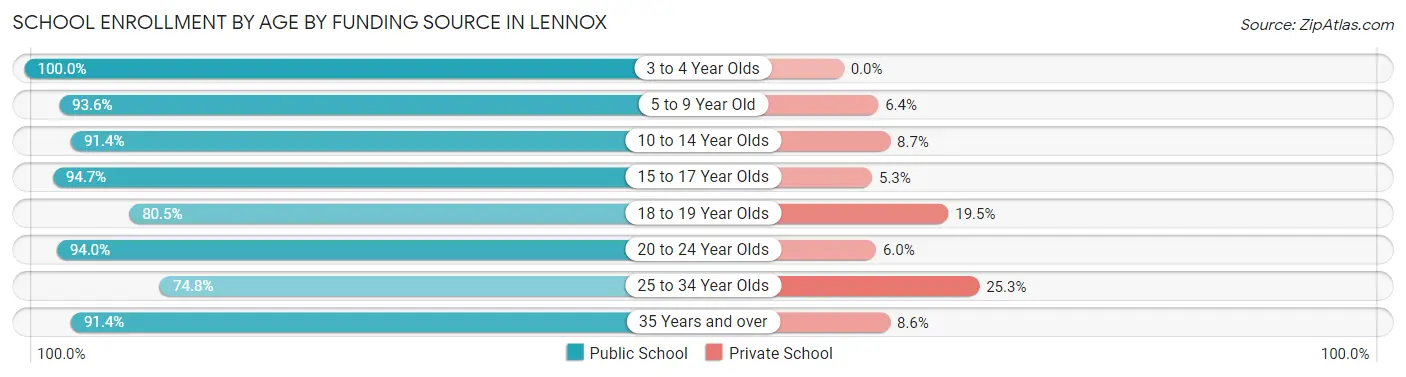
| Age Bracket | Public School | Private School |
| 3 to 4 Year Olds | 127 (100.0%) | 0 (0.0%) |
| 5 to 9 Year Old | 1,366 (93.6%) | 94 (6.4%) |
| 10 to 14 Year Olds | 1,373 (91.3%) | 130 (8.6%) |
| 15 to 17 Year Olds | 808 (94.7%) | 45 (5.3%) |
| 18 to 19 Year Olds | 380 (80.5%) | 92 (19.5%) |
| 20 to 24 Year Olds | 422 (94.0%) | 27 (6.0%) |
| 25 to 34 Year Olds | 305 (74.8%) | 103 (25.3%) |
| 35 Years and over | 148 (91.4%) | 14 (8.6%) |
| Total | 4,929 (90.7%) | 505 (9.3%) |
Educational Attainment by Field of Study in Lennox
Business (360 | 21.8%), social sciences (171 | 10.3%), engineering (164 | 9.9%), arts & humanities (160 | 9.7%), and education (144 | 8.7%) are the most common fields of study among 1,654 individuals in Lennox who have obtained a bachelor's degree or higher.
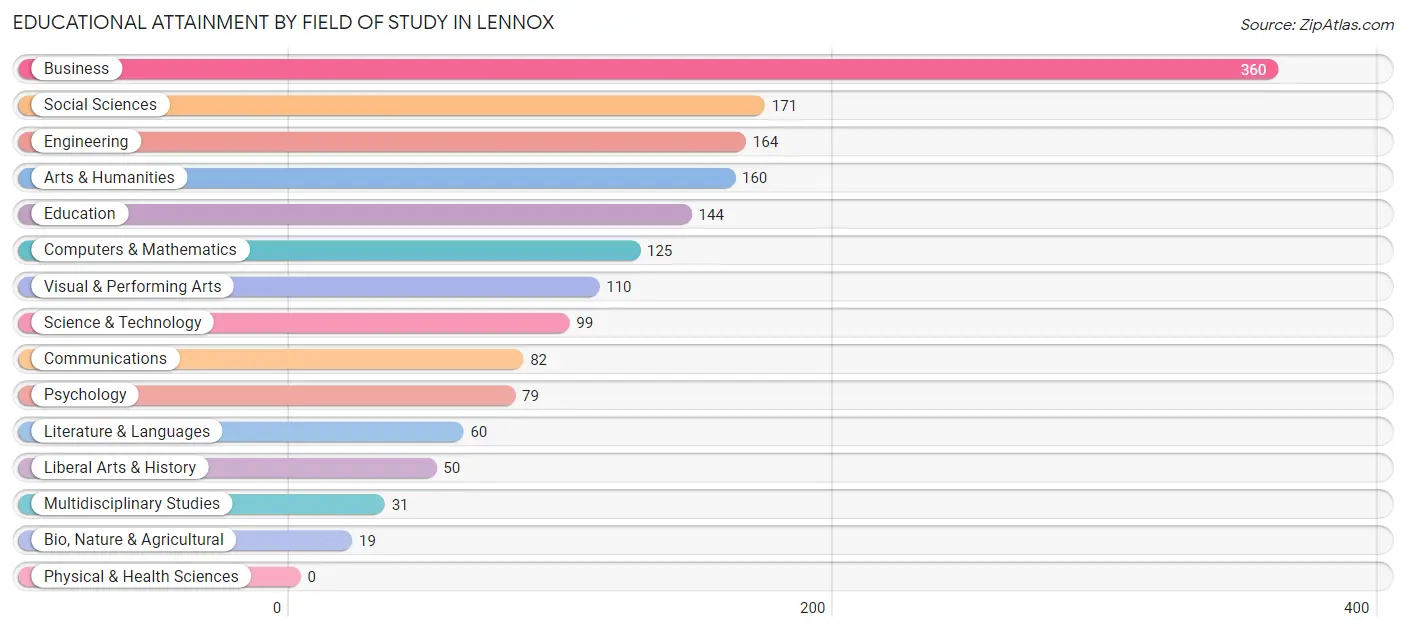
| Field of Study | # Graduates | % Graduates |
| Computers & Mathematics | 125 | 7.6% |
| Bio, Nature & Agricultural | 19 | 1.1% |
| Physical & Health Sciences | 0 | 0.0% |
| Psychology | 79 | 4.8% |
| Social Sciences | 171 | 10.3% |
| Engineering | 164 | 9.9% |
| Multidisciplinary Studies | 31 | 1.9% |
| Science & Technology | 99 | 6.0% |
| Business | 360 | 21.8% |
| Education | 144 | 8.7% |
| Literature & Languages | 60 | 3.6% |
| Liberal Arts & History | 50 | 3.0% |
| Visual & Performing Arts | 110 | 6.7% |
| Communications | 82 | 5.0% |
| Arts & Humanities | 160 | 9.7% |
| Total | 1,654 | 100.0% |
Transportation & Commute in Lennox
Vehicle Availability by Sex in Lennox
The most prevalent vehicle ownership categories in Lennox are males with 2 vehicles (1,696, accounting for 28.9%) and females with 2 vehicles (1,177, making up 39.4%).
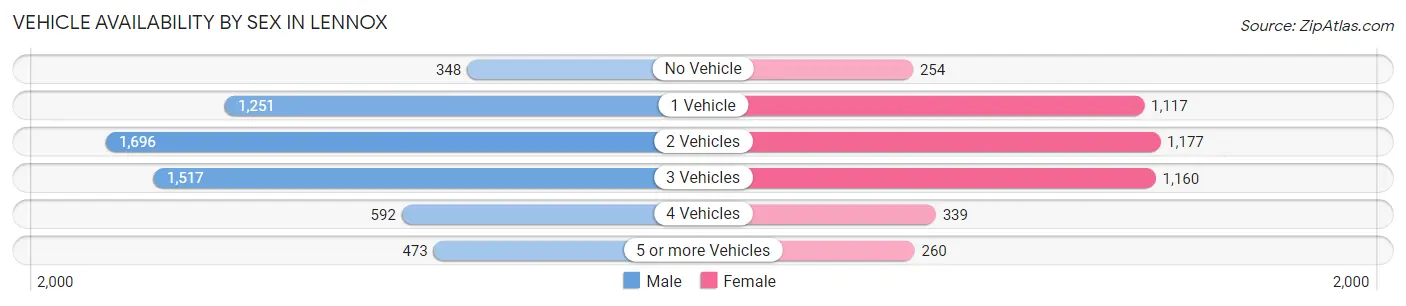
| Vehicles Available | Male | Female |
| No Vehicle | 348 (5.9%) | 254 (5.9%) |
| 1 Vehicle | 1,251 (21.3%) | 1,117 (25.9%) |
| 2 Vehicles | 1,696 (28.9%) | 1,177 (27.3%) |
| 3 Vehicles | 1,517 (25.8%) | 1,160 (26.9%) |
| 4 Vehicles | 592 (10.1%) | 339 (7.9%) |
| 5 or more Vehicles | 473 (8.1%) | 260 (6.0%) |
| Total | 5,877 (100.0%) | 4,307 (100.0%) |
Commute Time in Lennox
The most frequently occuring commute durations in Lennox are 15 to 19 minutes (1,538 commuters, 15.8%), 30 to 34 minutes (1,420 commuters, 14.6%), and 20 to 24 minutes (1,265 commuters, 13.0%).
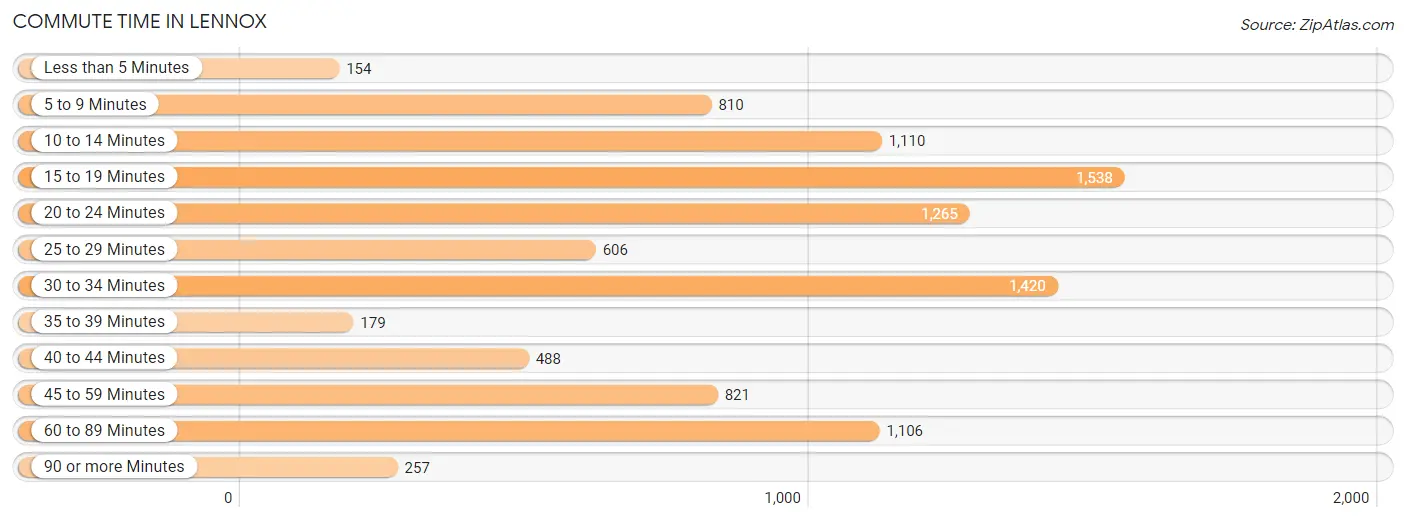
| Commute Time | # Commuters | % Commuters |
| Less than 5 Minutes | 154 | 1.6% |
| 5 to 9 Minutes | 810 | 8.3% |
| 10 to 14 Minutes | 1,110 | 11.4% |
| 15 to 19 Minutes | 1,538 | 15.8% |
| 20 to 24 Minutes | 1,265 | 13.0% |
| 25 to 29 Minutes | 606 | 6.2% |
| 30 to 34 Minutes | 1,420 | 14.6% |
| 35 to 39 Minutes | 179 | 1.8% |
| 40 to 44 Minutes | 488 | 5.0% |
| 45 to 59 Minutes | 821 | 8.4% |
| 60 to 89 Minutes | 1,106 | 11.3% |
| 90 or more Minutes | 257 | 2.6% |
Commute Time by Sex in Lennox
The most common commute times in Lennox are 30 to 34 minutes (1,009 commuters, 17.6%) for males and 15 to 19 minutes (872 commuters, 21.6%) for females.
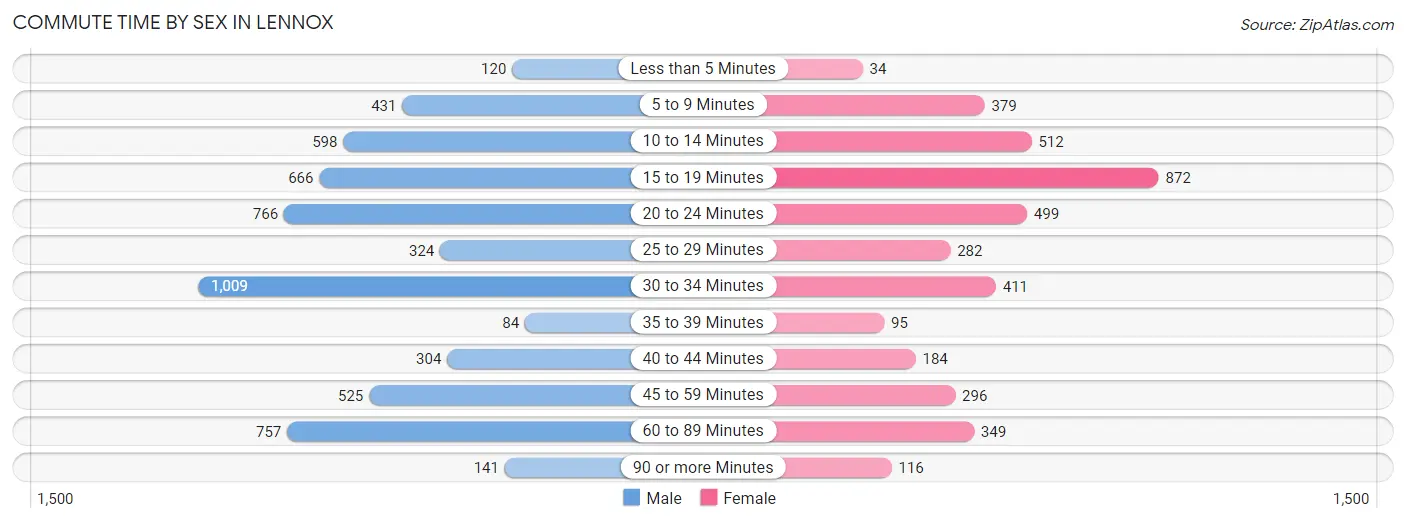
| Commute Time | Male | Female |
| Less than 5 Minutes | 120 (2.1%) | 34 (0.8%) |
| 5 to 9 Minutes | 431 (7.5%) | 379 (9.4%) |
| 10 to 14 Minutes | 598 (10.4%) | 512 (12.7%) |
| 15 to 19 Minutes | 666 (11.6%) | 872 (21.6%) |
| 20 to 24 Minutes | 766 (13.4%) | 499 (12.4%) |
| 25 to 29 Minutes | 324 (5.7%) | 282 (7.0%) |
| 30 to 34 Minutes | 1,009 (17.6%) | 411 (10.2%) |
| 35 to 39 Minutes | 84 (1.5%) | 95 (2.4%) |
| 40 to 44 Minutes | 304 (5.3%) | 184 (4.6%) |
| 45 to 59 Minutes | 525 (9.2%) | 296 (7.3%) |
| 60 to 89 Minutes | 757 (13.2%) | 349 (8.7%) |
| 90 or more Minutes | 141 (2.5%) | 116 (2.9%) |
Time of Departure to Work by Sex in Lennox
The most frequent times of departure to work in Lennox are 12:00 PM to 3:59 PM (787, 13.8%) for males and 12:00 PM to 3:59 PM (565, 14.0%) for females.
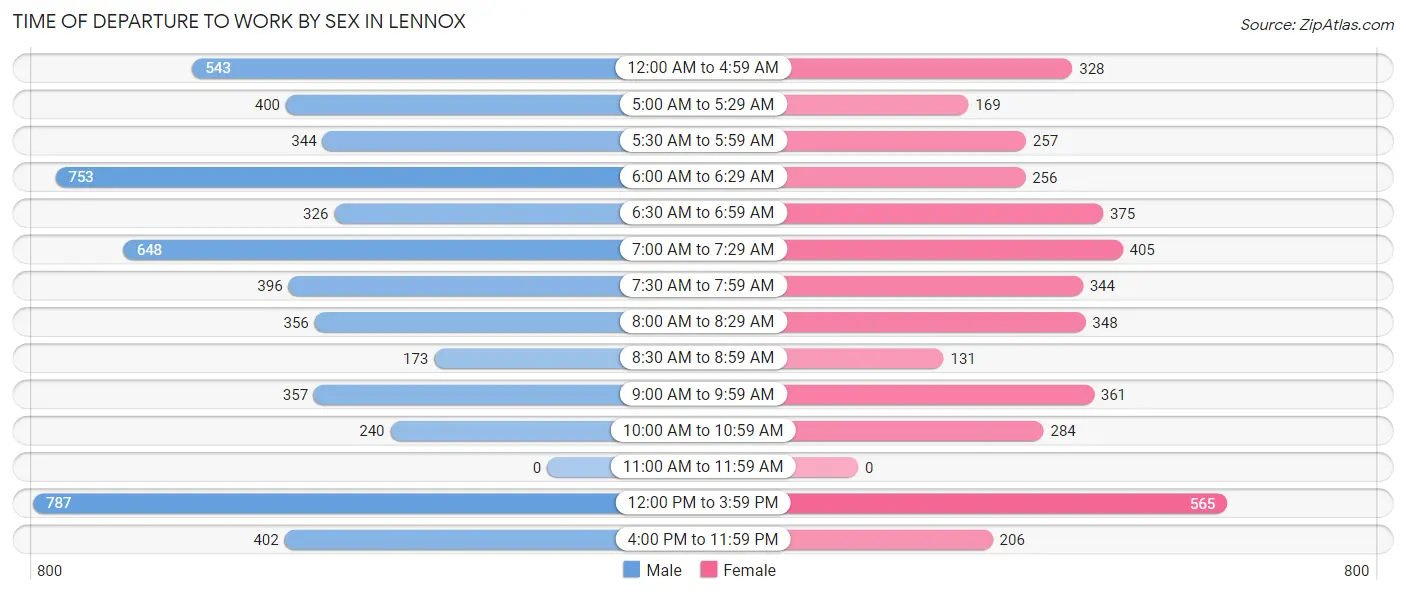
| Time of Departure | Male | Female |
| 12:00 AM to 4:59 AM | 543 (9.5%) | 328 (8.1%) |
| 5:00 AM to 5:29 AM | 400 (7.0%) | 169 (4.2%) |
| 5:30 AM to 5:59 AM | 344 (6.0%) | 257 (6.4%) |
| 6:00 AM to 6:29 AM | 753 (13.2%) | 256 (6.4%) |
| 6:30 AM to 6:59 AM | 326 (5.7%) | 375 (9.3%) |
| 7:00 AM to 7:29 AM | 648 (11.3%) | 405 (10.1%) |
| 7:30 AM to 7:59 AM | 396 (6.9%) | 344 (8.5%) |
| 8:00 AM to 8:29 AM | 356 (6.2%) | 348 (8.6%) |
| 8:30 AM to 8:59 AM | 173 (3.0%) | 131 (3.3%) |
| 9:00 AM to 9:59 AM | 357 (6.2%) | 361 (9.0%) |
| 10:00 AM to 10:59 AM | 240 (4.2%) | 284 (7.0%) |
| 11:00 AM to 11:59 AM | 0 (0.0%) | 0 (0.0%) |
| 12:00 PM to 3:59 PM | 787 (13.8%) | 565 (14.0%) |
| 4:00 PM to 11:59 PM | 402 (7.0%) | 206 (5.1%) |
| Total | 5,725 (100.0%) | 4,029 (100.0%) |
Housing Occupancy in Lennox
Occupancy by Ownership in Lennox
Of the total 5,651 dwellings in Lennox, owner-occupied units account for 1,541 (27.3%), while renter-occupied units make up 4,110 (72.7%).
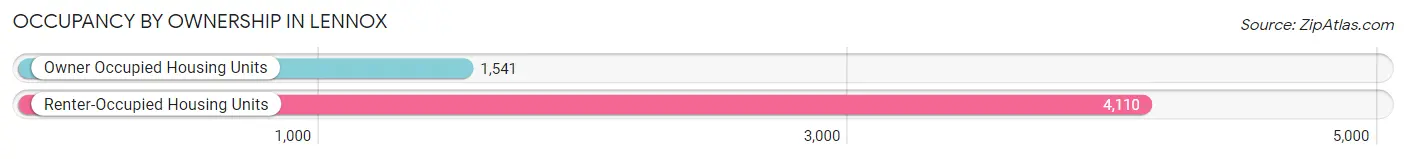
| Occupancy | # Housing Units | % Housing Units |
| Owner Occupied Housing Units | 1,541 | 27.3% |
| Renter-Occupied Housing Units | 4,110 | 72.7% |
| Total Occupied Housing Units | 5,651 | 100.0% |
Occupancy by Household Size in Lennox
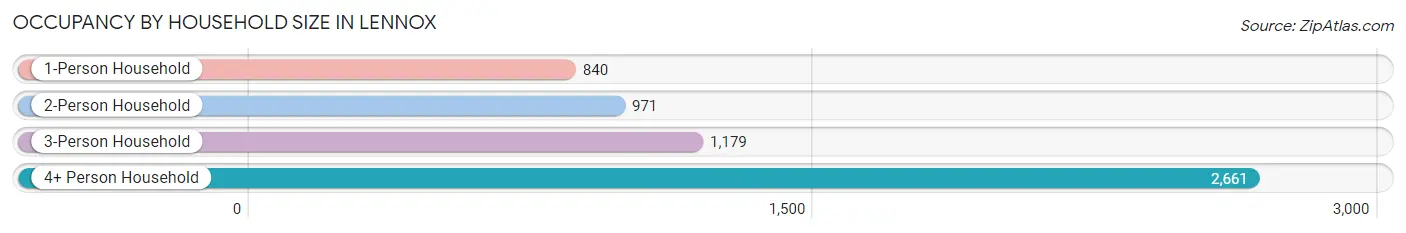
| Household Size | # Housing Units | % Housing Units |
| 1-Person Household | 840 | 14.9% |
| 2-Person Household | 971 | 17.2% |
| 3-Person Household | 1,179 | 20.9% |
| 4+ Person Household | 2,661 | 47.1% |
| Total Housing Units | 5,651 | 100.0% |
Occupancy by Ownership by Household Size in Lennox
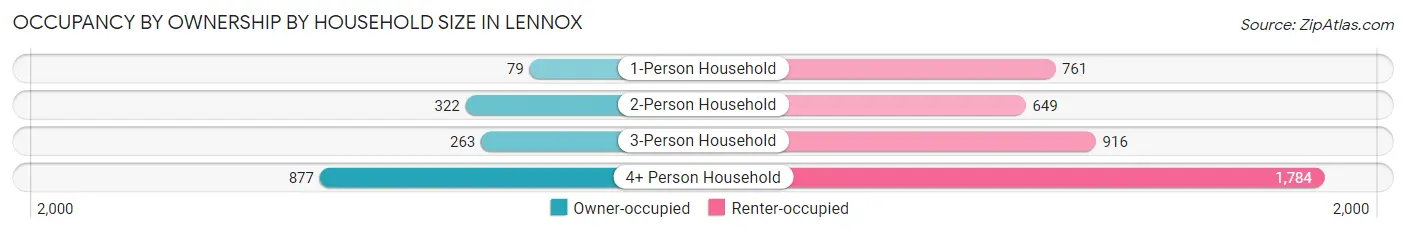
| Household Size | Owner-occupied | Renter-occupied |
| 1-Person Household | 79 (9.4%) | 761 (90.6%) |
| 2-Person Household | 322 (33.2%) | 649 (66.8%) |
| 3-Person Household | 263 (22.3%) | 916 (77.7%) |
| 4+ Person Household | 877 (33.0%) | 1,784 (67.0%) |
| Total Housing Units | 1,541 (27.3%) | 4,110 (72.7%) |
Occupancy by Educational Attainment in Lennox
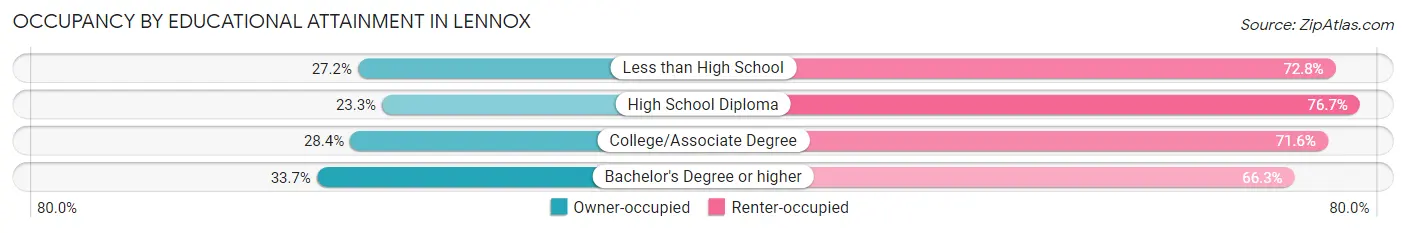
| Household Size | Owner-occupied | Renter-occupied |
| Less than High School | 747 (27.2%) | 2,003 (72.8%) |
| High School Diploma | 281 (23.3%) | 924 (76.7%) |
| College/Associate Degree | 312 (28.4%) | 787 (71.6%) |
| Bachelor's Degree or higher | 201 (33.7%) | 396 (66.3%) |
Occupancy by Age of Householder in Lennox
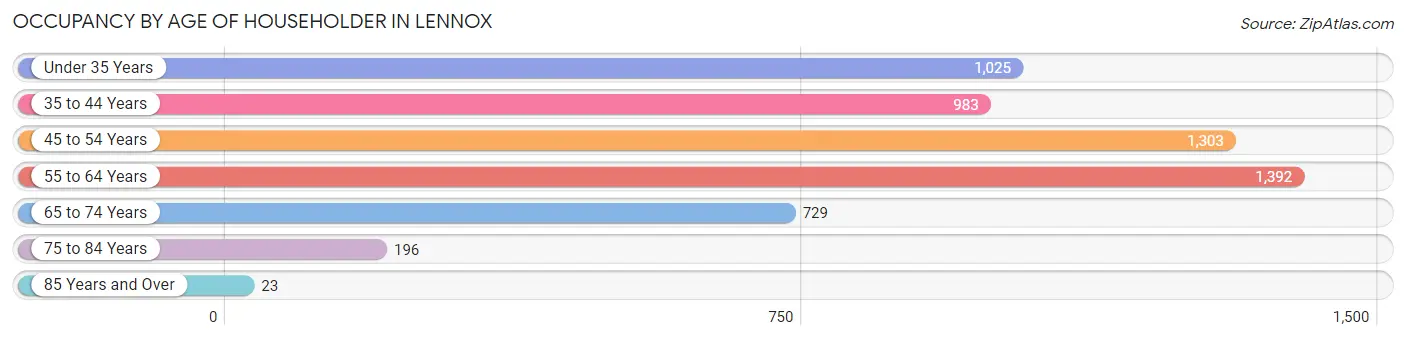
| Age Bracket | # Households | % Households |
| Under 35 Years | 1,025 | 18.1% |
| 35 to 44 Years | 983 | 17.4% |
| 45 to 54 Years | 1,303 | 23.1% |
| 55 to 64 Years | 1,392 | 24.6% |
| 65 to 74 Years | 729 | 12.9% |
| 75 to 84 Years | 196 | 3.5% |
| 85 Years and Over | 23 | 0.4% |
| Total | 5,651 | 100.0% |
Housing Finances in Lennox
Median Income by Occupancy in Lennox
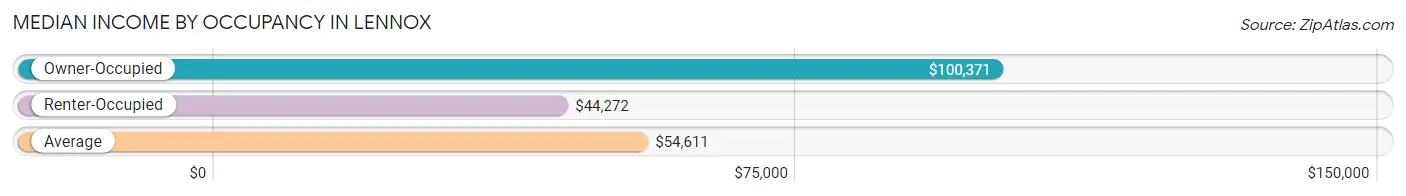
| Occupancy Type | # Households | Median Income |
| Owner-Occupied | 1,541 (27.3%) | $100,371 |
| Renter-Occupied | 4,110 (72.7%) | $44,272 |
| Average | 5,651 (100.0%) | $54,611 |
Occupancy by Householder Income Bracket in Lennox
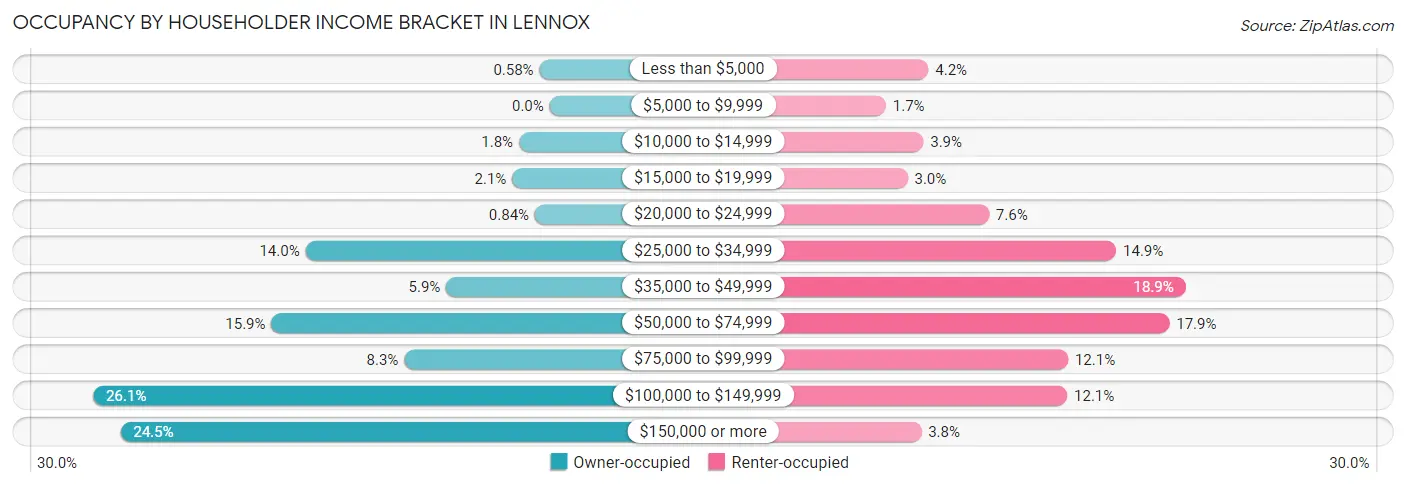
| Income Bracket | Owner-occupied | Renter-occupied |
| Less than $5,000 | 9 (0.6%) | 171 (4.2%) |
| $5,000 to $9,999 | 0 (0.0%) | 71 (1.7%) |
| $10,000 to $14,999 | 27 (1.8%) | 159 (3.9%) |
| $15,000 to $19,999 | 33 (2.1%) | 122 (3.0%) |
| $20,000 to $24,999 | 13 (0.8%) | 313 (7.6%) |
| $25,000 to $34,999 | 215 (14.0%) | 612 (14.9%) |
| $35,000 to $49,999 | 91 (5.9%) | 775 (18.9%) |
| $50,000 to $74,999 | 245 (15.9%) | 737 (17.9%) |
| $75,000 to $99,999 | 128 (8.3%) | 499 (12.1%) |
| $100,000 to $149,999 | 402 (26.1%) | 497 (12.1%) |
| $150,000 or more | 378 (24.5%) | 154 (3.7%) |
| Total | 1,541 (100.0%) | 4,110 (100.0%) |
Monthly Housing Cost Tiers in Lennox
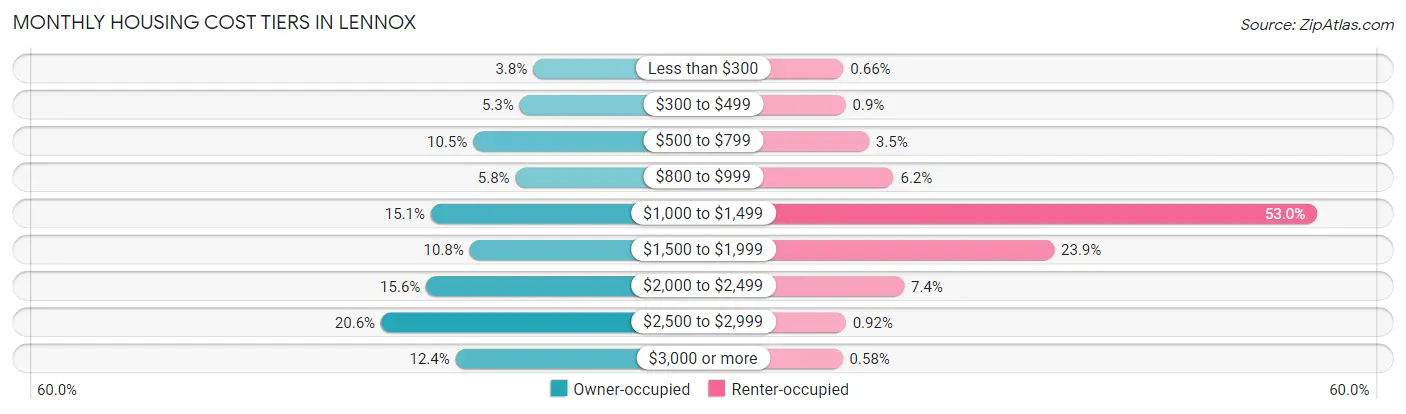
| Monthly Cost | Owner-occupied | Renter-occupied |
| Less than $300 | 59 (3.8%) | 27 (0.7%) |
| $300 to $499 | 82 (5.3%) | 37 (0.9%) |
| $500 to $799 | 161 (10.4%) | 143 (3.5%) |
| $800 to $999 | 89 (5.8%) | 255 (6.2%) |
| $1,000 to $1,499 | 233 (15.1%) | 2,178 (53.0%) |
| $1,500 to $1,999 | 167 (10.8%) | 984 (23.9%) |
| $2,000 to $2,499 | 241 (15.6%) | 303 (7.4%) |
| $2,500 to $2,999 | 318 (20.6%) | 38 (0.9%) |
| $3,000 or more | 191 (12.4%) | 24 (0.6%) |
| Total | 1,541 (100.0%) | 4,110 (100.0%) |
Physical Housing Characteristics in Lennox
Housing Structures in Lennox
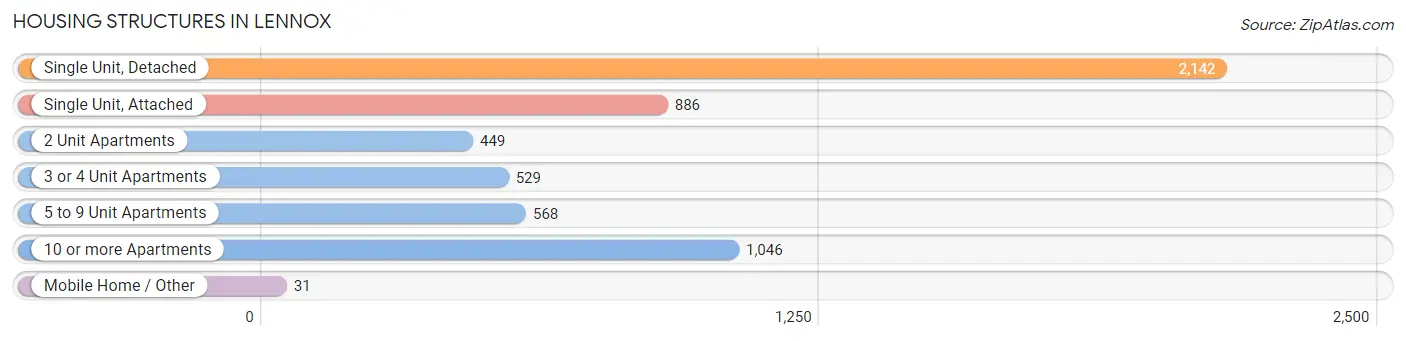
| Structure Type | # Housing Units | % Housing Units |
| Single Unit, Detached | 2,142 | 37.9% |
| Single Unit, Attached | 886 | 15.7% |
| 2 Unit Apartments | 449 | 8.0% |
| 3 or 4 Unit Apartments | 529 | 9.4% |
| 5 to 9 Unit Apartments | 568 | 10.1% |
| 10 or more Apartments | 1,046 | 18.5% |
| Mobile Home / Other | 31 | 0.5% |
| Total | 5,651 | 100.0% |
Housing Structures by Occupancy in Lennox
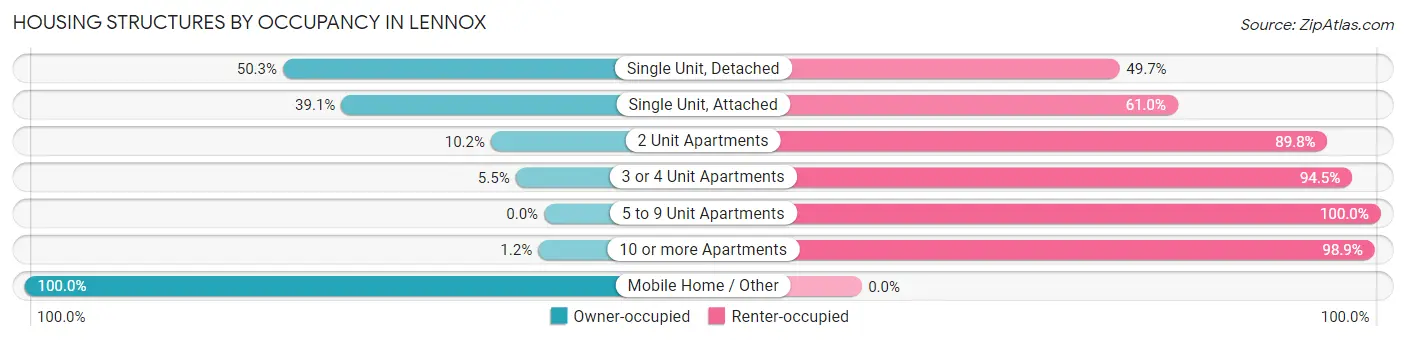
| Structure Type | Owner-occupied | Renter-occupied |
| Single Unit, Detached | 1,077 (50.3%) | 1,065 (49.7%) |
| Single Unit, Attached | 346 (39.1%) | 540 (61.0%) |
| 2 Unit Apartments | 46 (10.2%) | 403 (89.8%) |
| 3 or 4 Unit Apartments | 29 (5.5%) | 500 (94.5%) |
| 5 to 9 Unit Apartments | 0 (0.0%) | 568 (100.0%) |
| 10 or more Apartments | 12 (1.1%) | 1,034 (98.9%) |
| Mobile Home / Other | 31 (100.0%) | 0 (0.0%) |
| Total | 1,541 (27.3%) | 4,110 (72.7%) |
Housing Structures by Number of Rooms in Lennox
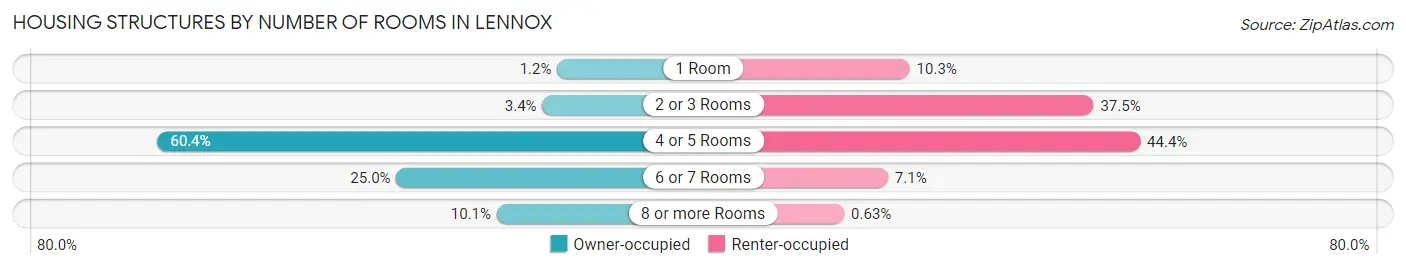
| Number of Rooms | Owner-occupied | Renter-occupied |
| 1 Room | 18 (1.2%) | 424 (10.3%) |
| 2 or 3 Rooms | 52 (3.4%) | 1,542 (37.5%) |
| 4 or 5 Rooms | 930 (60.4%) | 1,826 (44.4%) |
| 6 or 7 Rooms | 385 (25.0%) | 292 (7.1%) |
| 8 or more Rooms | 156 (10.1%) | 26 (0.6%) |
| Total | 1,541 (100.0%) | 4,110 (100.0%) |
Housing Structure by Heating Type in Lennox
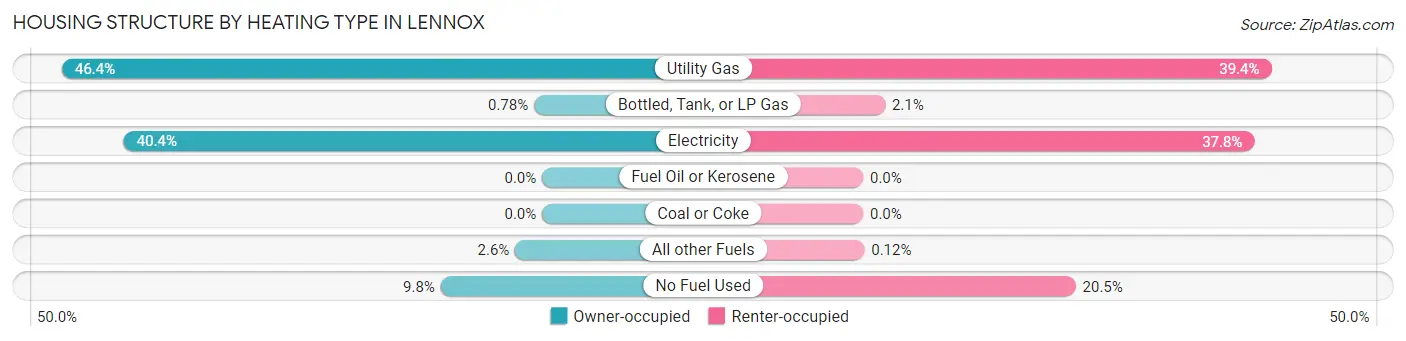
| Heating Type | Owner-occupied | Renter-occupied |
| Utility Gas | 715 (46.4%) | 1,621 (39.4%) |
| Bottled, Tank, or LP Gas | 12 (0.8%) | 87 (2.1%) |
| Electricity | 623 (40.4%) | 1,553 (37.8%) |
| Fuel Oil or Kerosene | 0 (0.0%) | 0 (0.0%) |
| Coal or Coke | 0 (0.0%) | 0 (0.0%) |
| All other Fuels | 40 (2.6%) | 5 (0.1%) |
| No Fuel Used | 151 (9.8%) | 844 (20.5%) |
| Total | 1,541 (100.0%) | 4,110 (100.0%) |
Household Vehicle Usage in Lennox
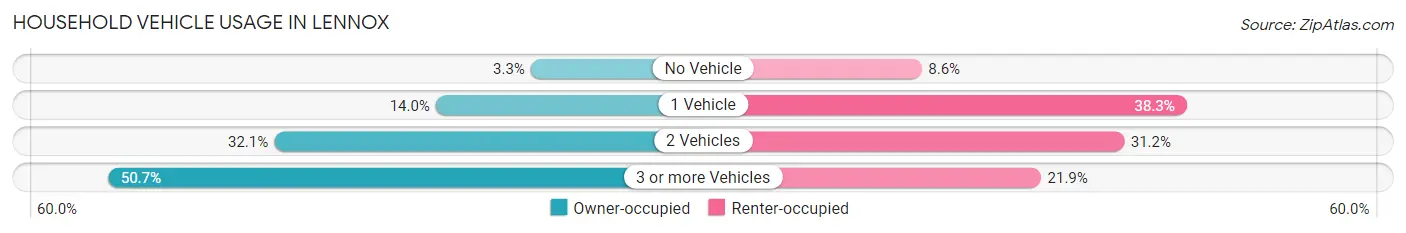
| Vehicles per Household | Owner-occupied | Renter-occupied |
| No Vehicle | 51 (3.3%) | 352 (8.6%) |
| 1 Vehicle | 215 (14.0%) | 1,573 (38.3%) |
| 2 Vehicles | 494 (32.1%) | 1,284 (31.2%) |
| 3 or more Vehicles | 781 (50.7%) | 901 (21.9%) |
| Total | 1,541 (100.0%) | 4,110 (100.0%) |
Real Estate & Mortgages in Lennox
Real Estate and Mortgage Overview in Lennox
| Characteristic | Without Mortgage | With Mortgage |
| Housing Units | 395 | 1,146 |
| Median Property Value | $644,400 | $661,100 |
| Median Household Income | $104,531 | $293 |
| Monthly Housing Costs | $582 | $191 |
| Real Estate Taxes | $3,653 | $106 |
Property Value by Mortgage Status in Lennox
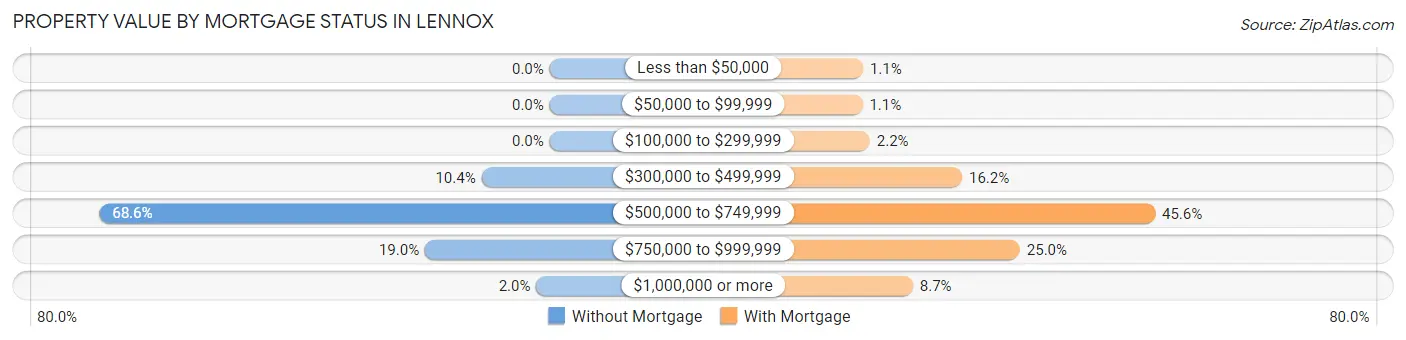
| Property Value | Without Mortgage | With Mortgage |
| Less than $50,000 | 0 (0.0%) | 13 (1.1%) |
| $50,000 to $99,999 | 0 (0.0%) | 12 (1.1%) |
| $100,000 to $299,999 | 0 (0.0%) | 25 (2.2%) |
| $300,000 to $499,999 | 41 (10.4%) | 186 (16.2%) |
| $500,000 to $749,999 | 271 (68.6%) | 523 (45.6%) |
| $750,000 to $999,999 | 75 (19.0%) | 287 (25.0%) |
| $1,000,000 or more | 8 (2.0%) | 100 (8.7%) |
| Total | 395 (100.0%) | 1,146 (100.0%) |
Household Income by Mortgage Status in Lennox
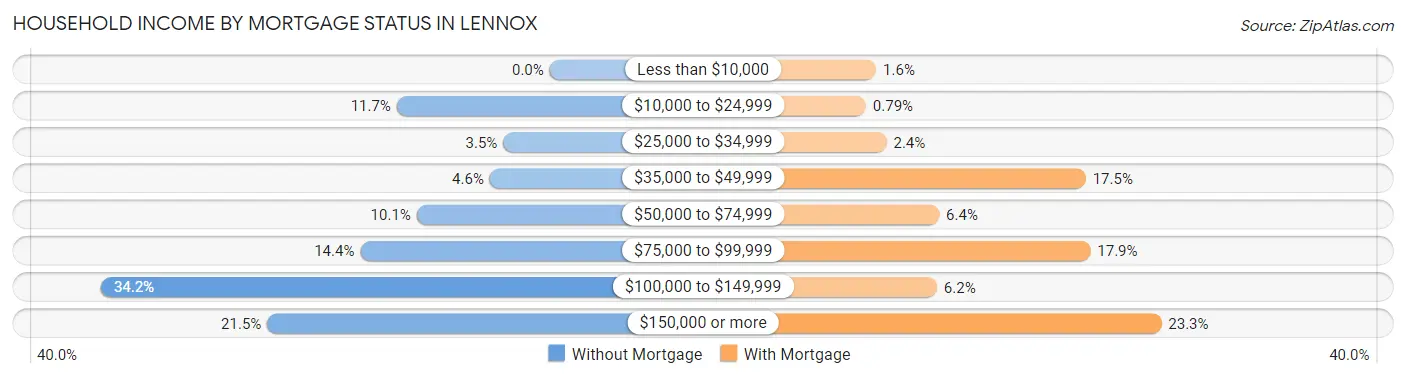
| Household Income | Without Mortgage | With Mortgage |
| Less than $10,000 | 0 (0.0%) | 18 (1.6%) |
| $10,000 to $24,999 | 46 (11.7%) | 9 (0.8%) |
| $25,000 to $34,999 | 14 (3.5%) | 27 (2.4%) |
| $35,000 to $49,999 | 18 (4.6%) | 201 (17.5%) |
| $50,000 to $74,999 | 40 (10.1%) | 73 (6.4%) |
| $75,000 to $99,999 | 57 (14.4%) | 205 (17.9%) |
| $100,000 to $149,999 | 135 (34.2%) | 71 (6.2%) |
| $150,000 or more | 85 (21.5%) | 267 (23.3%) |
| Total | 395 (100.0%) | 1,146 (100.0%) |
Property Value to Household Income Ratio in Lennox
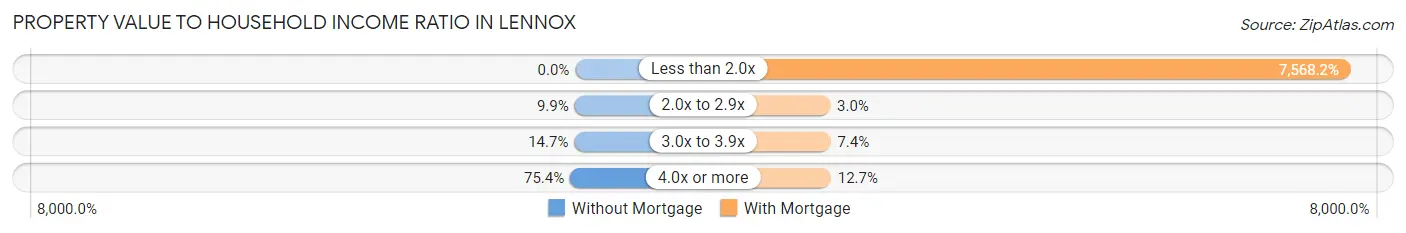
| Value-to-Income Ratio | Without Mortgage | With Mortgage |
| Less than 2.0x | 0 (0.0%) | 86,731 (7,568.1%) |
| 2.0x to 2.9x | 39 (9.9%) | 34 (3.0%) |
| 3.0x to 3.9x | 58 (14.7%) | 85 (7.4%) |
| 4.0x or more | 298 (75.4%) | 146 (12.7%) |
| Total | 395 (100.0%) | 1,146 (100.0%) |
Real Estate Taxes by Mortgage Status in Lennox
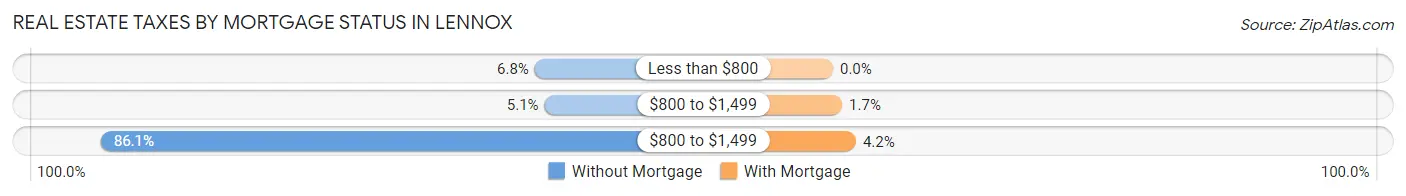
| Property Taxes | Without Mortgage | With Mortgage |
| Less than $800 | 27 (6.8%) | 0 (0.0%) |
| $800 to $1,499 | 20 (5.1%) | 19 (1.7%) |
| $800 to $1,499 | 340 (86.1%) | 48 (4.2%) |
| Total | 395 (100.0%) | 1,146 (100.0%) |
Health & Disability in Lennox
Health Insurance Coverage by Age in Lennox
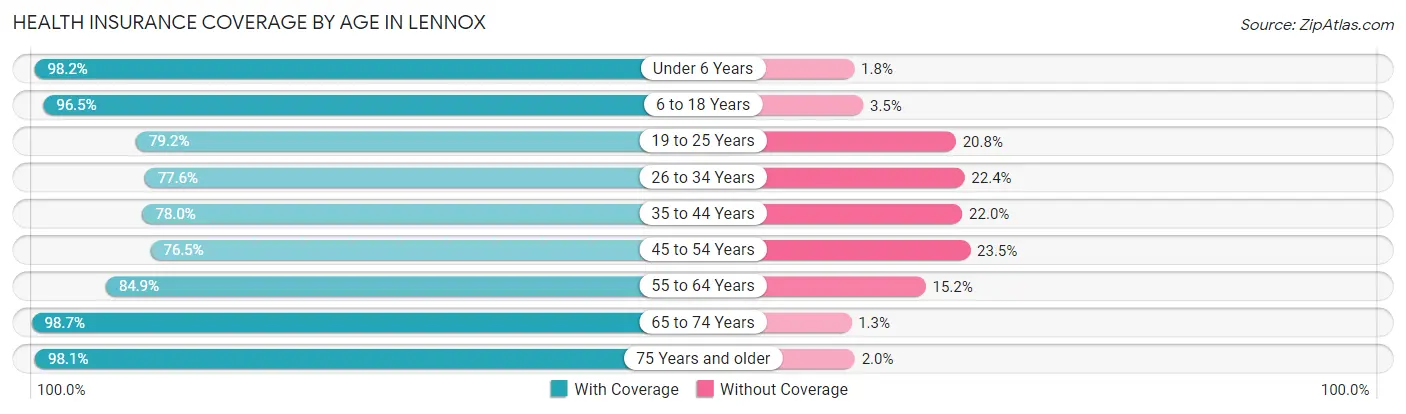
| Age Bracket | With Coverage | Without Coverage |
| Under 6 Years | 1,283 (98.2%) | 24 (1.8%) |
| 6 to 18 Years | 3,983 (96.5%) | 144 (3.5%) |
| 19 to 25 Years | 1,838 (79.2%) | 482 (20.8%) |
| 26 to 34 Years | 2,380 (77.6%) | 687 (22.4%) |
| 35 to 44 Years | 2,044 (78.0%) | 576 (22.0%) |
| 45 to 54 Years | 2,000 (76.5%) | 613 (23.5%) |
| 55 to 64 Years | 2,346 (84.9%) | 419 (15.1%) |
| 65 to 74 Years | 1,375 (98.7%) | 18 (1.3%) |
| 75 Years and older | 452 (98.1%) | 9 (1.9%) |
| Total | 17,701 (85.6%) | 2,972 (14.4%) |
Health Insurance Coverage by Citizenship Status in Lennox
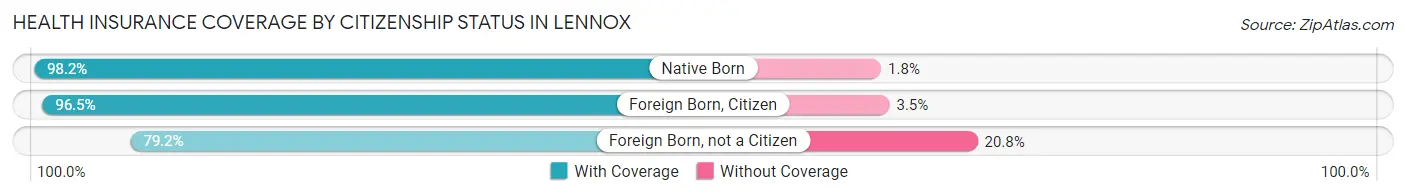
| Citizenship Status | With Coverage | Without Coverage |
| Native Born | 1,283 (98.2%) | 24 (1.8%) |
| Foreign Born, Citizen | 3,983 (96.5%) | 144 (3.5%) |
| Foreign Born, not a Citizen | 1,838 (79.2%) | 482 (20.8%) |
Health Insurance Coverage by Household Income in Lennox
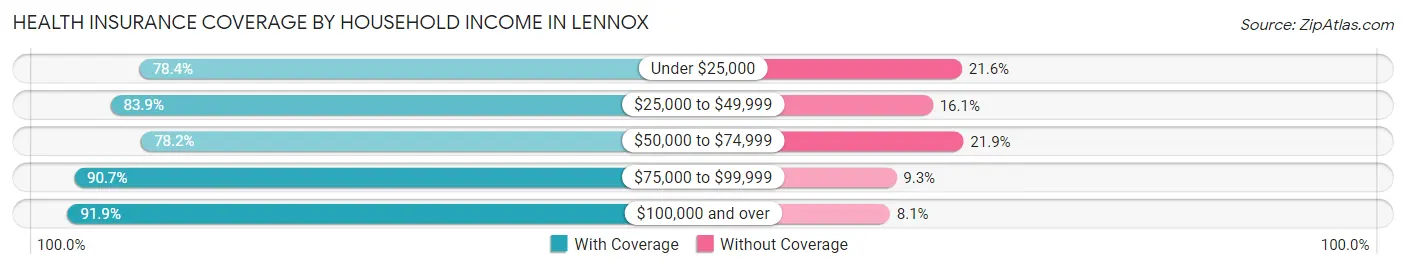
| Household Income | With Coverage | Without Coverage |
| Under $25,000 | 2,167 (78.4%) | 596 (21.6%) |
| $25,000 to $49,999 | 4,064 (83.9%) | 780 (16.1%) |
| $50,000 to $74,999 | 2,908 (78.1%) | 813 (21.8%) |
| $75,000 to $99,999 | 2,229 (90.7%) | 228 (9.3%) |
| $100,000 and over | 6,329 (91.9%) | 555 (8.1%) |
Public vs Private Health Insurance Coverage by Age in Lennox
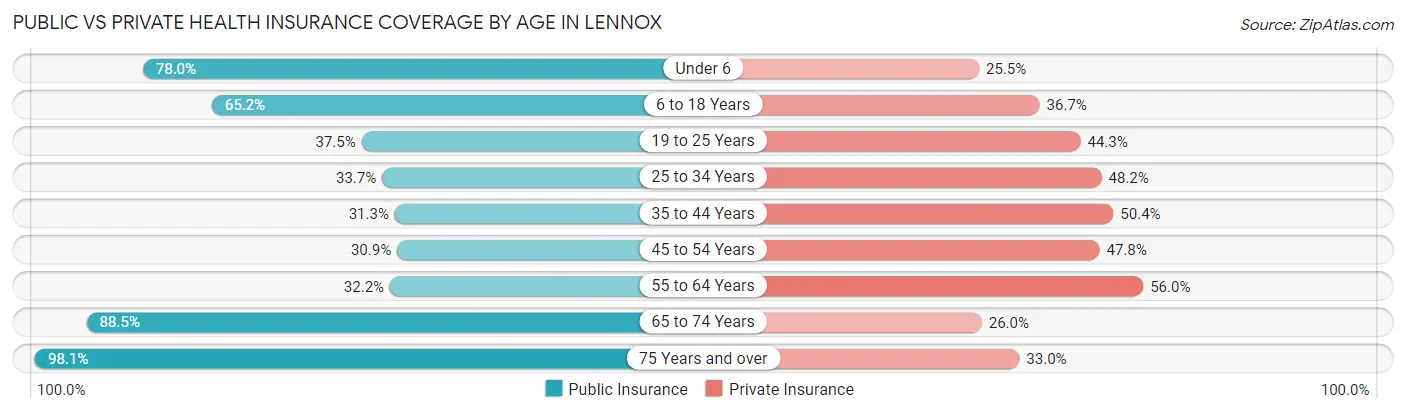
| Age Bracket | Public Insurance | Private Insurance |
| Under 6 | 1,020 (78.0%) | 333 (25.5%) |
| 6 to 18 Years | 2,692 (65.2%) | 1,516 (36.7%) |
| 19 to 25 Years | 869 (37.5%) | 1,028 (44.3%) |
| 25 to 34 Years | 1,032 (33.7%) | 1,479 (48.2%) |
| 35 to 44 Years | 820 (31.3%) | 1,321 (50.4%) |
| 45 to 54 Years | 807 (30.9%) | 1,250 (47.8%) |
| 55 to 64 Years | 890 (32.2%) | 1,547 (55.9%) |
| 65 to 74 Years | 1,233 (88.5%) | 362 (26.0%) |
| 75 Years and over | 452 (98.1%) | 152 (33.0%) |
| Total | 9,815 (47.5%) | 8,988 (43.5%) |
Disability Status by Sex by Age in Lennox
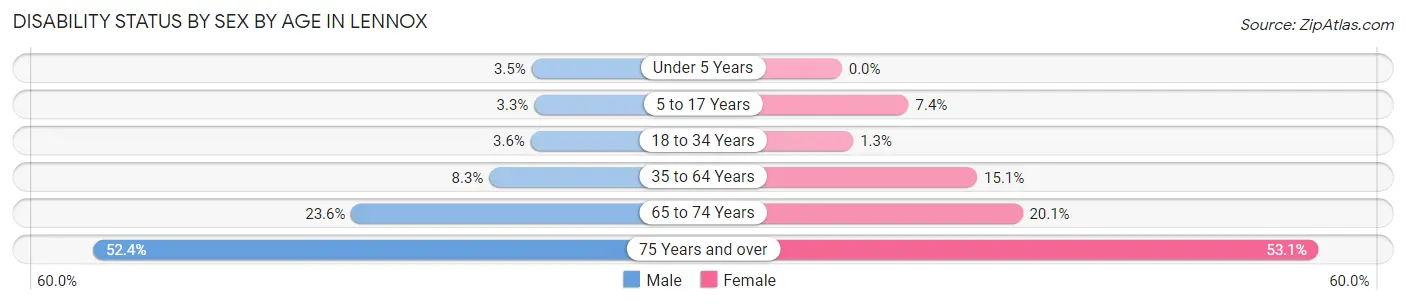
| Age Bracket | Male | Female |
| Under 5 Years | 19 (3.5%) | 0 (0.0%) |
| 5 to 17 Years | 75 (3.3%) | 119 (7.4%) |
| 18 to 34 Years | 108 (3.6%) | 35 (1.3%) |
| 35 to 64 Years | 364 (8.3%) | 541 (15.1%) |
| 65 to 74 Years | 167 (23.6%) | 138 (20.1%) |
| 75 Years and over | 55 (52.4%) | 189 (53.1%) |
Disability Class by Sex by Age in Lennox
Disability Class: Hearing Difficulty
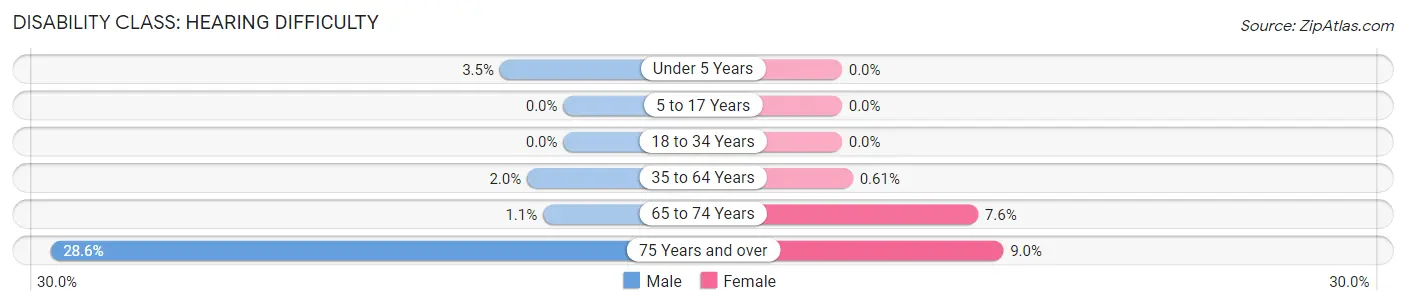
| Age Bracket | Male | Female |
| Under 5 Years | 19 (3.5%) | 0 (0.0%) |
| 5 to 17 Years | 0 (0.0%) | 0 (0.0%) |
| 18 to 34 Years | 0 (0.0%) | 0 (0.0%) |
| 35 to 64 Years | 89 (2.0%) | 22 (0.6%) |
| 65 to 74 Years | 8 (1.1%) | 52 (7.6%) |
| 75 Years and over | 30 (28.6%) | 32 (9.0%) |
Disability Class: Vision Difficulty
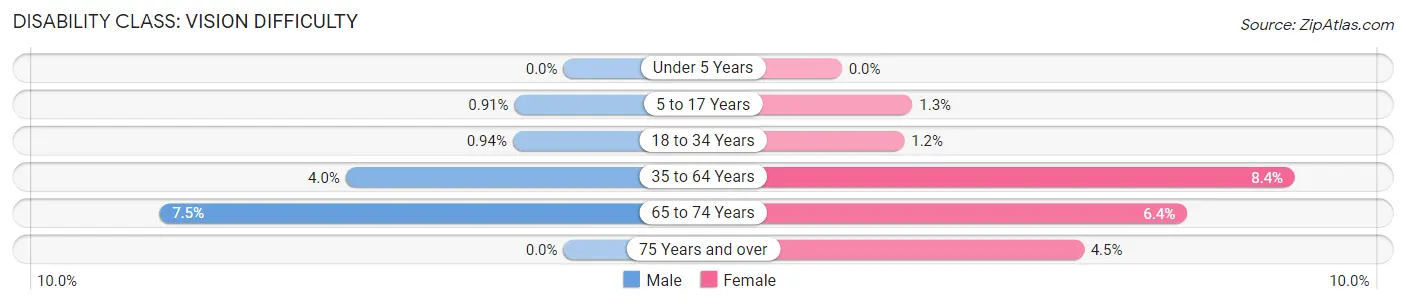
| Age Bracket | Male | Female |
| Under 5 Years | 0 (0.0%) | 0 (0.0%) |
| 5 to 17 Years | 21 (0.9%) | 21 (1.3%) |
| 18 to 34 Years | 28 (0.9%) | 32 (1.2%) |
| 35 to 64 Years | 178 (4.0%) | 302 (8.4%) |
| 65 to 74 Years | 53 (7.5%) | 44 (6.4%) |
| 75 Years and over | 0 (0.0%) | 16 (4.5%) |
Disability Class: Cognitive Difficulty
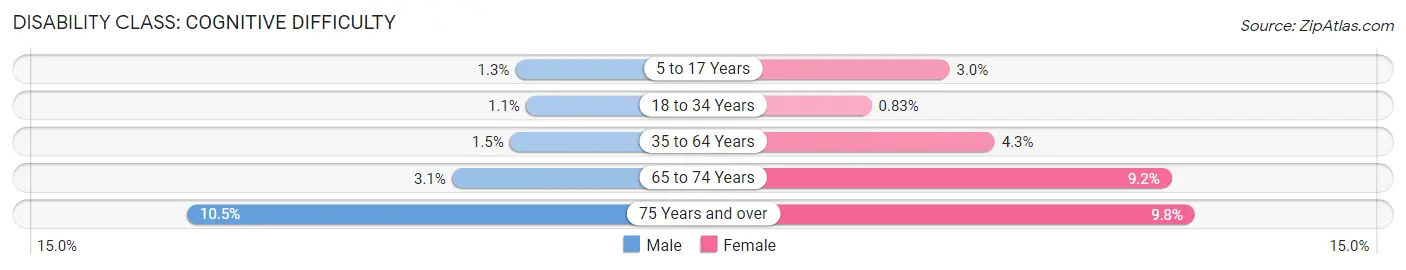
| Age Bracket | Male | Female |
| 5 to 17 Years | 31 (1.3%) | 48 (3.0%) |
| 18 to 34 Years | 31 (1.1%) | 23 (0.8%) |
| 35 to 64 Years | 66 (1.5%) | 153 (4.3%) |
| 65 to 74 Years | 22 (3.1%) | 63 (9.2%) |
| 75 Years and over | 11 (10.5%) | 35 (9.8%) |
Disability Class: Ambulatory Difficulty
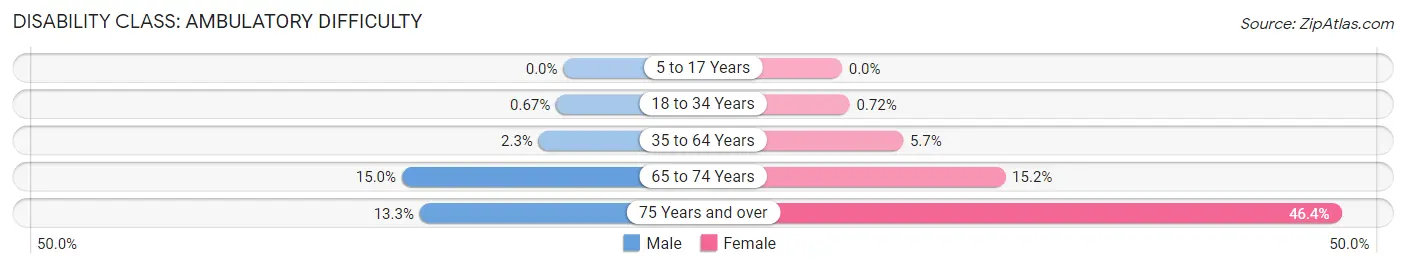
| Age Bracket | Male | Female |
| 5 to 17 Years | 0 (0.0%) | 0 (0.0%) |
| 18 to 34 Years | 20 (0.7%) | 20 (0.7%) |
| 35 to 64 Years | 101 (2.3%) | 204 (5.7%) |
| 65 to 74 Years | 106 (15.0%) | 104 (15.2%) |
| 75 Years and over | 14 (13.3%) | 165 (46.4%) |
Disability Class: Self-Care Difficulty
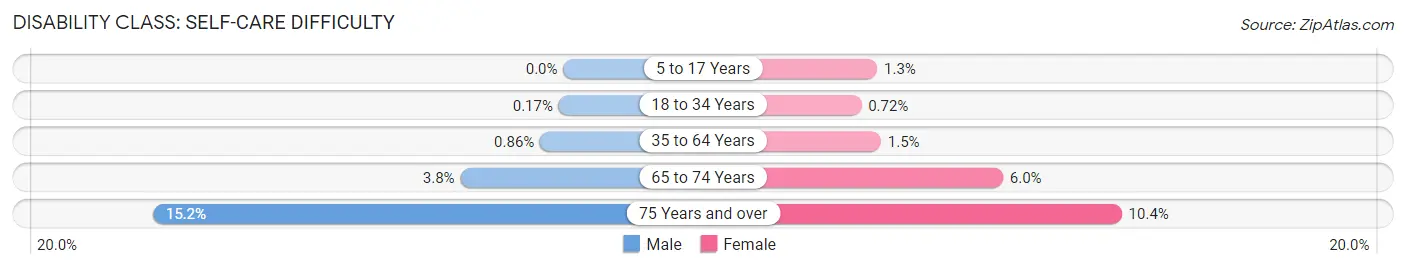
| Age Bracket | Male | Female |
| 5 to 17 Years | 0 (0.0%) | 21 (1.3%) |
| 18 to 34 Years | 5 (0.2%) | 20 (0.7%) |
| 35 to 64 Years | 38 (0.9%) | 52 (1.5%) |
| 65 to 74 Years | 27 (3.8%) | 41 (6.0%) |
| 75 Years and over | 16 (15.2%) | 37 (10.4%) |
Technology Access in Lennox
Computing Device Access in Lennox
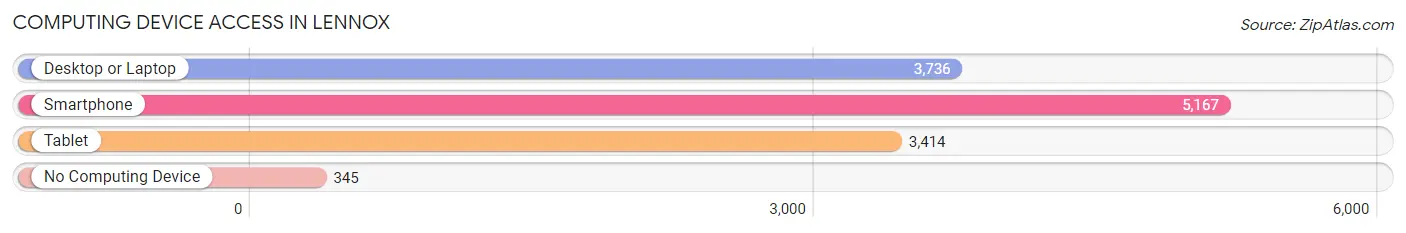
| Device Type | # Households | % Households |
| Desktop or Laptop | 3,736 | 66.1% |
| Smartphone | 5,167 | 91.4% |
| Tablet | 3,414 | 60.4% |
| No Computing Device | 345 | 6.1% |
| Total | 5,651 | 100.0% |
Internet Access in Lennox
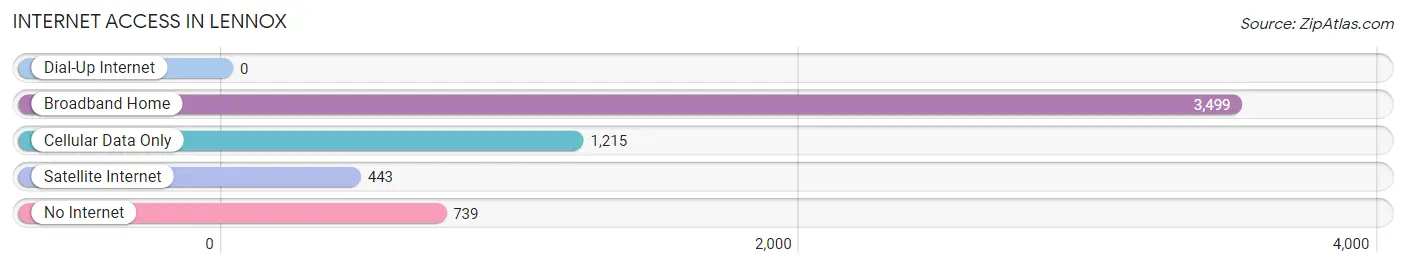
| Internet Type | # Households | % Households |
| Dial-Up Internet | 0 | 0.0% |
| Broadband Home | 3,499 | 61.9% |
| Cellular Data Only | 1,215 | 21.5% |
| Satellite Internet | 443 | 7.8% |
| No Internet | 739 | 13.1% |
| Total | 5,651 | 100.0% |
Lennox Summary
Lennox is a census-designated place (CDP) located in Los Angeles County, California. It is located in the South Bay region of the Greater Los Angeles Area, and is bordered by Inglewood to the north, Hawthorne to the east, and Del Aire to the south. The population of Lennox was 22,753 at the 2010 census.
History
The area now known as Lennox was originally inhabited by the Tongva Native American tribe. The first European settlers arrived in the area in the late 19th century, and the area was eventually annexed by the City of Los Angeles in 1922. The area was named after a local landowner, Charles Lennox, who owned a large ranch in the area.
Geography
Lennox is located at 33°54'25"N 118°20'45"W (33.906890, -118.345845). According to the United States Census Bureau, the CDP has a total area of 1.7 square miles (4.4 km2), all of it land.
Economy
Lennox is primarily a residential community, with a few small businesses located in the area. The largest employer in the area is the Lennox School District, which employs over 1,000 people. Other major employers include the Lennox Public Library, the Lennox Chamber of Commerce, and the Lennox Community Center.
Demographics
As of the 2010 census, there were 22,753 people, 7,845 households, and 5,845 families residing in the CDP. The population density was 13,541.3 people per square mile (5,219.2/km2). There were 8,541 housing units at an average density of 5,039.2 per square mile (1,945.3/km2). The racial makeup of the CDP was 44.2% White, 11.2% African American, 0.7% Native American, 11.2% Asian, 0.2% Pacific Islander, 28.2% from other races, and 4.3% from two or more races. Hispanic or Latino of any race were 57.2% of the population.
There were 7,845 households, out of which 37.2% had children under the age of 18 living with them, 46.2% were married couples living together, 17.7% had a female householder with no husband present, and 28.2% were non-families. 21.2% of all households were made up of individuals, and 6.7% had someone living alone who was 65 years of age or older. The average household size was 2.90 and the average family size was 3.41.
In the CDP, the population was spread out, with 28.2% under the age of 18, 10.2% from 18 to 24, 30.2% from 25 to 44, 21.2% from 45 to 64, and 10.2% who were 65 years of age or older. The median age was 33 years. For every 100 females, there were 95.2 males. For every 100 females age 18 and over, there were 91.7 males.
The median income for a household in the CDP was $41,945, and the median income for a family was $45,945. Males had a median income of $31,945 versus $27,945 for females. The per capita income for the CDP was $17,945. About 11.2% of families and 13.2% of the population were below the poverty line, including 17.2% of those under age 18 and 8.2% of those age 65 or over.
Common Questions
What is Per Capita Income in Lennox?
Per Capita income in Lennox is $21,006.
What is the Median Family Income in Lennox?
Median Family Income in Lennox is $62,455.
What is the Median Household income in Lennox?
Median Household Income in Lennox is $54,611.
What is Income or Wage Gap in Lennox?
Income or Wage Gap in Lennox is 17.4%.
Women in Lennox earn 82.6 cents for every dollar earned by a man.
What is Family Income Deficit in Lennox?
Family Income Deficit in Lennox is $12,616.
Families that are below poverty line in Lennox earn $12,616 less on average than the poverty threshold level.
What is Inequality or Gini Index in Lennox?
Inequality or Gini Index in Lennox is 0.41.
What is the Total Population of Lennox?
Total Population of Lennox is 20,687.
What is the Total Male Population of Lennox?
Total Male Population of Lennox is 11,025.
What is the Total Female Population of Lennox?
Total Female Population of Lennox is 9,662.
What is the Ratio of Males per 100 Females in Lennox?
There are 114.11 Males per 100 Females in Lennox.
What is the Ratio of Females per 100 Males in Lennox?
There are 87.64 Females per 100 Males in Lennox.
What is the Median Population Age in Lennox?
Median Population Age in Lennox is 33.4 Years.
What is the Average Family Size in Lennox
Average Family Size in Lennox is 4.0 People.
What is the Average Household Size in Lennox
Average Household Size in Lennox is 3.7 People.
How Large is the Labor Force in Lennox?
There are 11,500 People in the Labor Forcein in Lennox.
What is the Percentage of People in the Labor Force in Lennox?
71.7% of People are in the Labor Force in Lennox.
What is the Unemployment Rate in Lennox?
Unemployment Rate in Lennox is 6.6%.