Inglewood, CA Map & Demographics
Inglewood Map
Inglewood Overview
$30,559
PER CAPITA INCOME
$72,786
AVG FAMILY INCOME
$67,563
AVG HOUSEHOLD INCOME
12.7%
WAGE / INCOME GAP [ % ]
87.3¢/ $1
WAGE / INCOME GAP [ $ ]
$11,099
FAMILY INCOME DEFICIT
0.44
INEQUALITY / GINI INDEX
106,806
TOTAL POPULATION
52,512
MALE POPULATION
54,294
FEMALE POPULATION
96.72
MALES / 100 FEMALES
103.39
FEMALES / 100 MALES
37.3
MEDIAN AGE
3.6
AVG FAMILY SIZE
2.9
AVG HOUSEHOLD SIZE
58,348
LABOR FORCE [ PEOPLE ]
67.4%
PERCENT IN LABOR FORCE
8.2%
UNEMPLOYMENT RATE
Income in Inglewood
Income Overview in Inglewood
Per Capita Income in Inglewood is $30,559, while median incomes of families and households are $72,786 and $67,563 respectively.
| Characteristic | Number | Measure |
| Per Capita Income | 106,806 | $30,559 |
| Median Family Income | 24,024 | $72,786 |
| Mean Family Income | 24,024 | $91,943 |
| Median Household Income | 35,773 | $67,563 |
| Mean Household Income | 35,773 | $85,768 |
| Income Deficit | 24,024 | $11,099 |
| Wage / Income Gap (%) | 106,806 | 12.68% |
| Wage / Income Gap ($) | 106,806 | 87.32¢ per $1 |
| Gini / Inequality Index | 106,806 | 0.44 |
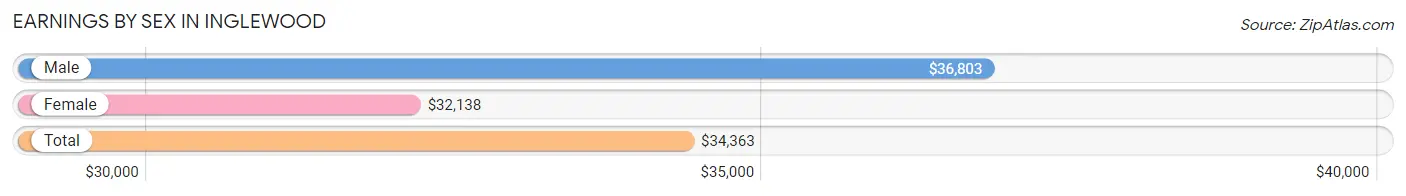
Earnings by Sex in Inglewood
Average Earnings in Inglewood are $34,363, $36,803 for men and $32,138 for women, a difference of 12.7%.
| Sex | Number | Average Earnings |
| Male | 29,978 (51.0%) | $36,803 |
| Female | 28,808 (49.0%) | $32,138 |
| Total | 58,786 (100.0%) | $34,363 |
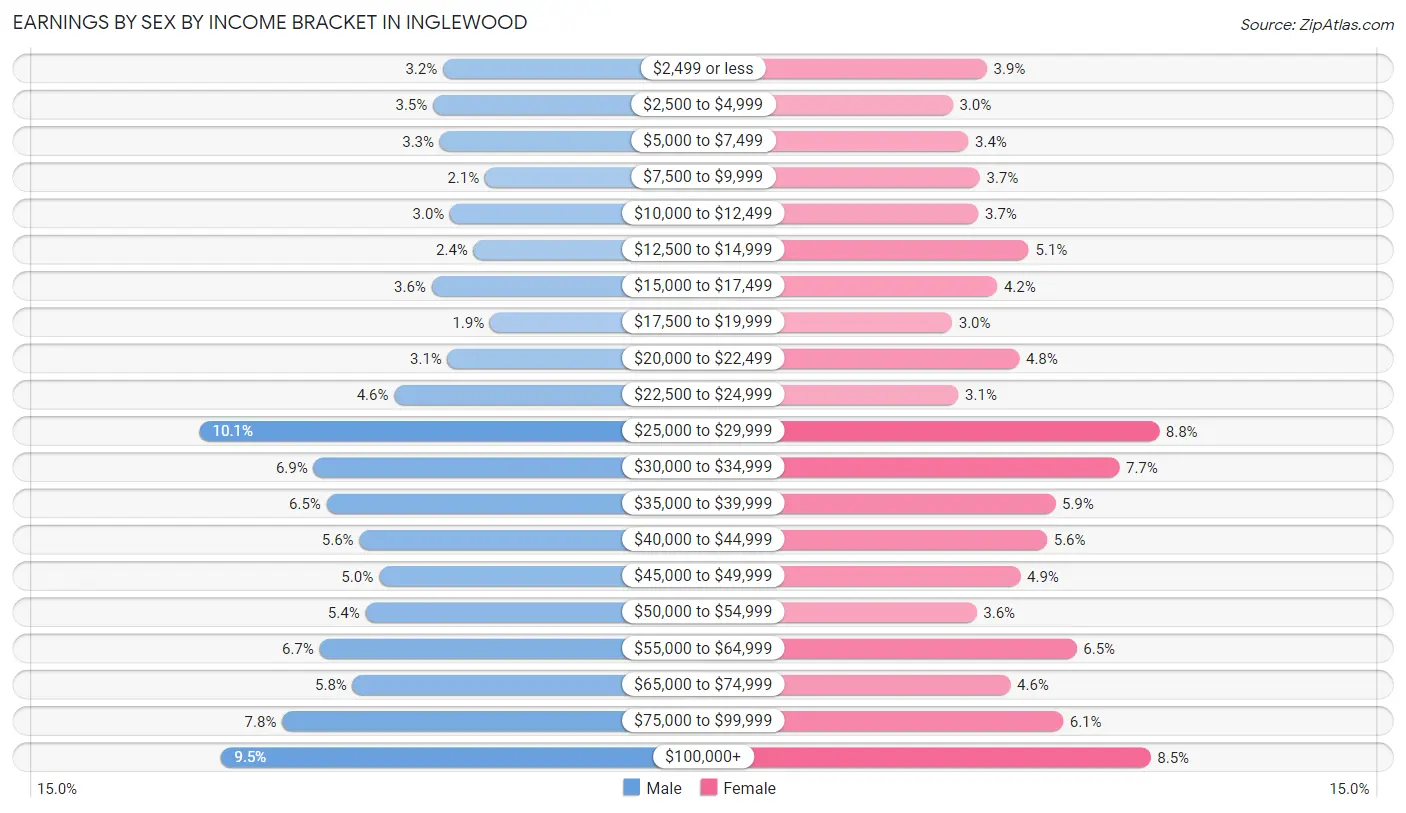
Earnings by Sex by Income Bracket in Inglewood
The most common earnings brackets in Inglewood are $25,000 to $29,999 for men (3,021 | 10.1%) and $25,000 to $29,999 for women (2,527 | 8.8%).
| Income | Male | Female |
| $2,499 or less | 970 (3.2%) | 1,131 (3.9%) |
| $2,500 to $4,999 | 1,054 (3.5%) | 857 (3.0%) |
| $5,000 to $7,499 | 998 (3.3%) | 981 (3.4%) |
| $7,500 to $9,999 | 619 (2.1%) | 1,075 (3.7%) |
| $10,000 to $12,499 | 911 (3.0%) | 1,062 (3.7%) |
| $12,500 to $14,999 | 713 (2.4%) | 1,472 (5.1%) |
| $15,000 to $17,499 | 1,068 (3.6%) | 1,215 (4.2%) |
| $17,500 to $19,999 | 575 (1.9%) | 850 (2.9%) |
| $20,000 to $22,499 | 933 (3.1%) | 1,393 (4.8%) |
| $22,500 to $24,999 | 1,381 (4.6%) | 901 (3.1%) |
| $25,000 to $29,999 | 3,021 (10.1%) | 2,527 (8.8%) |
| $30,000 to $34,999 | 2,063 (6.9%) | 2,203 (7.6%) |
| $35,000 to $39,999 | 1,953 (6.5%) | 1,685 (5.9%) |
| $40,000 to $44,999 | 1,676 (5.6%) | 1,619 (5.6%) |
| $45,000 to $49,999 | 1,510 (5.0%) | 1,402 (4.9%) |
| $50,000 to $54,999 | 1,624 (5.4%) | 1,050 (3.6%) |
| $55,000 to $64,999 | 2,012 (6.7%) | 1,859 (6.5%) |
| $65,000 to $74,999 | 1,732 (5.8%) | 1,321 (4.6%) |
| $75,000 to $99,999 | 2,325 (7.8%) | 1,748 (6.1%) |
| $100,000+ | 2,840 (9.5%) | 2,457 (8.5%) |
| Total | 29,978 (100.0%) | 28,808 (100.0%) |
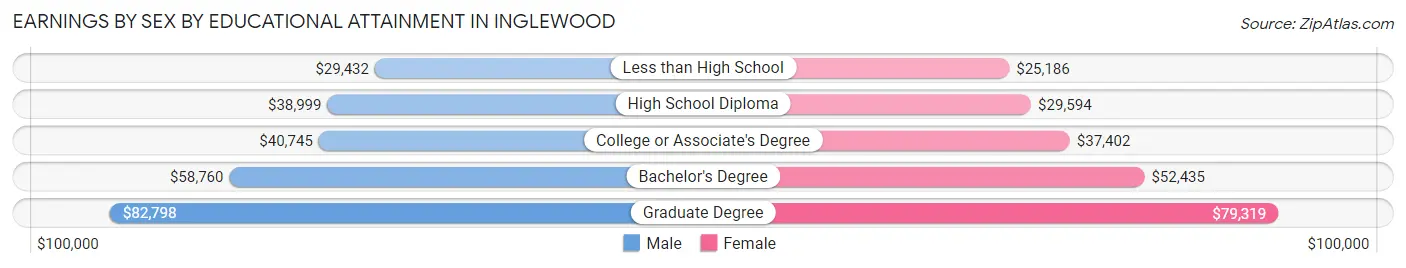
Earnings by Sex by Educational Attainment in Inglewood
Average earnings in Inglewood are $40,155 for men and $35,805 for women, a difference of 10.8%. Men with an educational attainment of graduate degree enjoy the highest average annual earnings of $82,798, while those with less than high school education earn the least with $29,432. Women with an educational attainment of graduate degree earn the most with the average annual earnings of $79,319, while those with less than high school education have the smallest earnings of $25,186.
| Educational Attainment | Male Income | Female Income |
| Less than High School | $29,432 | $25,186 |
| High School Diploma | $38,999 | $29,594 |
| College or Associate's Degree | $40,745 | $37,402 |
| Bachelor's Degree | $58,760 | $52,435 |
| Graduate Degree | $82,798 | $79,319 |
| Total | $40,155 | $35,805 |
Family Income in Inglewood
Family Income Brackets in Inglewood
According to the Inglewood family income data, there are 4,685 families falling into the $50,000 to $74,999 income range, which is the most common income bracket and makes up 19.5% of all families. Conversely, the $10,000 to $14,999 income bracket is the least frequent group with only 529 families (2.2%) belonging to this category.
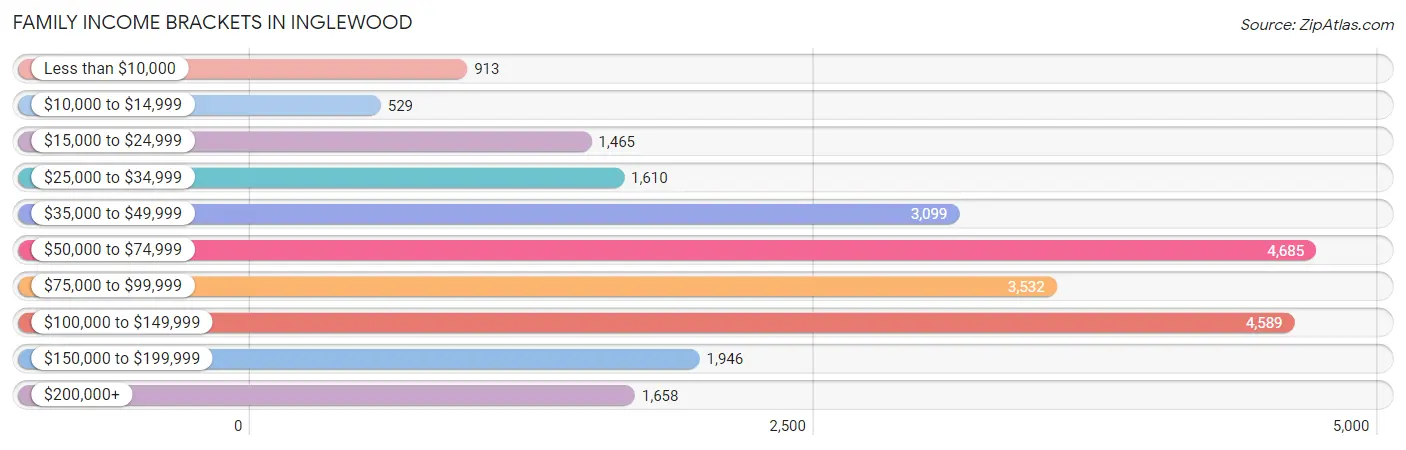
| Income Bracket | # Families | % Families |
| Less than $10,000 | 913 | 3.8% |
| $10,000 to $14,999 | 529 | 2.2% |
| $15,000 to $24,999 | 1,465 | 6.1% |
| $25,000 to $34,999 | 1,610 | 6.7% |
| $35,000 to $49,999 | 3,099 | 12.9% |
| $50,000 to $74,999 | 4,685 | 19.5% |
| $75,000 to $99,999 | 3,532 | 14.7% |
| $100,000 to $149,999 | 4,589 | 19.1% |
| $150,000 to $199,999 | 1,946 | 8.1% |
| $200,000+ | 1,658 | 6.9% |
Family Income by Famaliy Size in Inglewood
7+ person families (904 | 3.8%) account for the highest median family income in Inglewood with $134,198 per family, while 2-person families (8,796 | 36.6%) have the highest median income of $30,000 per family member.
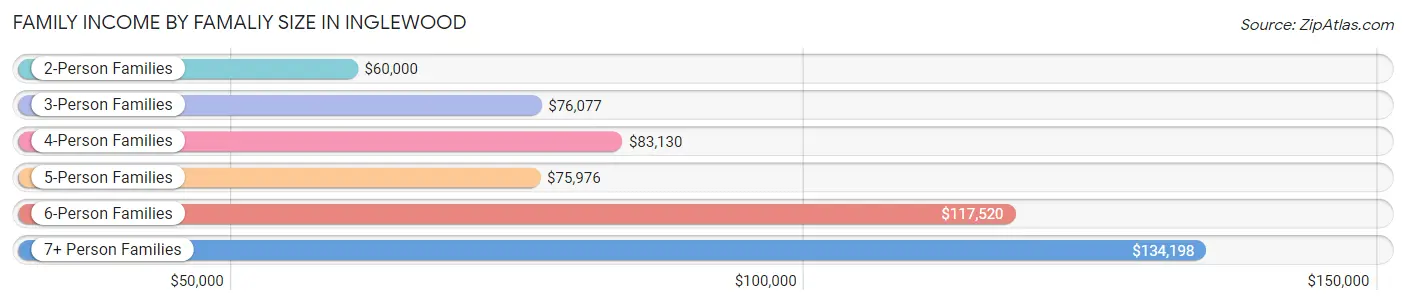
| Income Bracket | # Families | Median Income |
| 2-Person Families | 8,796 (36.6%) | $60,000 |
| 3-Person Families | 5,863 (24.4%) | $76,077 |
| 4-Person Families | 4,914 (20.4%) | $83,130 |
| 5-Person Families | 2,458 (10.2%) | $75,976 |
| 6-Person Families | 1,089 (4.5%) | $117,520 |
| 7+ Person Families | 904 (3.8%) | $134,198 |
| Total | 24,024 (100.0%) | $72,786 |
Family Income by Number of Earners in Inglewood
The median family income in Inglewood is $72,786, with families comprising 3+ earners (4,489) having the highest median family income of $130,542, while families with no earners (1,954) have the lowest median family income of $23,226, accounting for 18.7% and 8.1% of families, respectively.
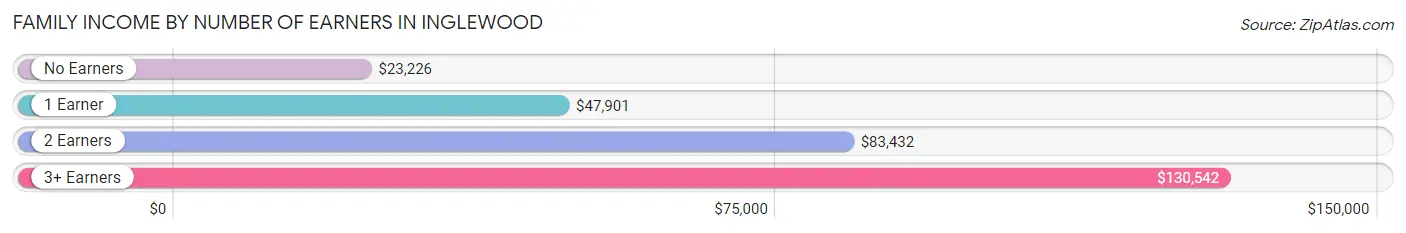
| Number of Earners | # Families | Median Income |
| No Earners | 1,954 (8.1%) | $23,226 |
| 1 Earner | 7,863 (32.7%) | $47,901 |
| 2 Earners | 9,718 (40.5%) | $83,432 |
| 3+ Earners | 4,489 (18.7%) | $130,542 |
| Total | 24,024 (100.0%) | $72,786 |
Household Income in Inglewood
Household Income Brackets in Inglewood
With 6,439 households falling in the category, the $50,000 to $74,999 income range is the most frequent in Inglewood, accounting for 18.0% of all households. In contrast, only 1,395 households (3.9%) fall into the $10,000 to $14,999 income bracket, making it the least populous group.
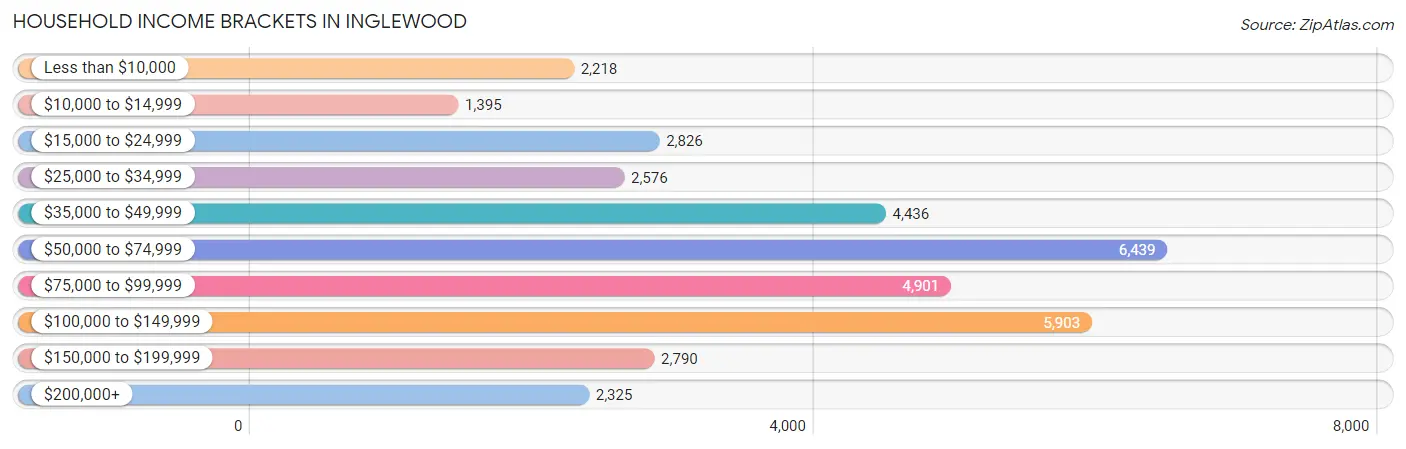
| Income Bracket | # Households | % Households |
| Less than $10,000 | 2,218 | 6.2% |
| $10,000 to $14,999 | 1,395 | 3.9% |
| $15,000 to $24,999 | 2,826 | 7.9% |
| $25,000 to $34,999 | 2,576 | 7.2% |
| $35,000 to $49,999 | 4,436 | 12.4% |
| $50,000 to $74,999 | 6,439 | 18.0% |
| $75,000 to $99,999 | 4,901 | 13.7% |
| $100,000 to $149,999 | 5,903 | 16.5% |
| $150,000 to $199,999 | 2,790 | 7.8% |
| $200,000+ | 2,325 | 6.5% |
Household Income by Householder Age in Inglewood
The median household income in Inglewood is $67,563, with the highest median household income of $73,160 found in the 45 to 64 years age bracket for the primary householder. A total of 15,143 households (42.3%) fall into this category. Meanwhile, the 65+ years age bracket for the primary householder has the lowest median household income of $47,692, with 8,020 households (22.4%) in this group.
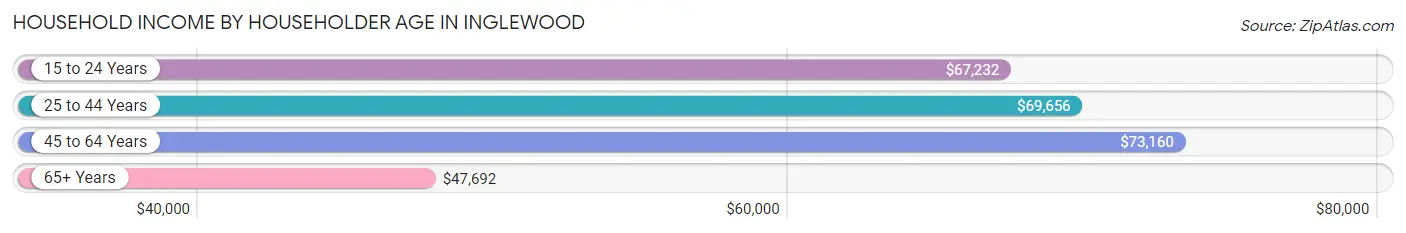
| Income Bracket | # Households | Median Income |
| 15 to 24 Years | 1,433 (4.0%) | $67,232 |
| 25 to 44 Years | 11,177 (31.2%) | $69,656 |
| 45 to 64 Years | 15,143 (42.3%) | $73,160 |
| 65+ Years | 8,020 (22.4%) | $47,692 |
| Total | 35,773 (100.0%) | $67,563 |
Poverty in Inglewood
Income Below Poverty by Sex and Age in Inglewood
With 16.0% poverty level for males and 14.8% for females among the residents of Inglewood, 15 year old males and 5 year old females are the most vulnerable to poverty, with 328 males (40.1%) and 187 females (26.3%) in their respective age groups living below the poverty level.
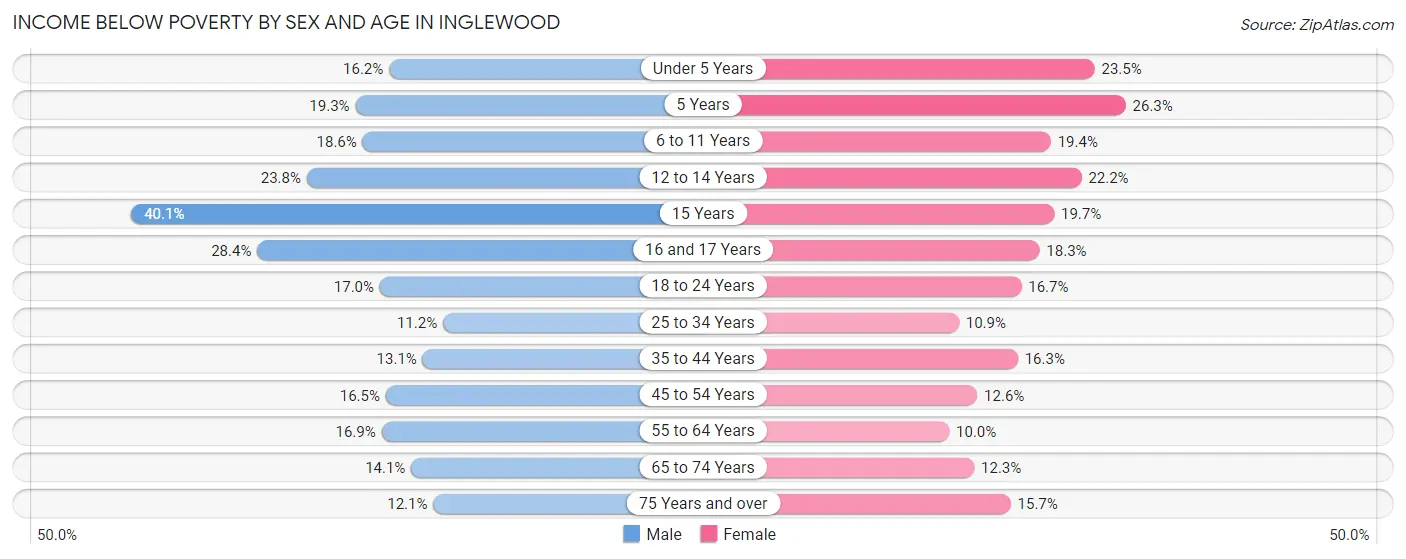
| Age Bracket | Male | Female |
| Under 5 Years | 488 (16.2%) | 661 (23.5%) |
| 5 Years | 138 (19.3%) | 187 (26.3%) |
| 6 to 11 Years | 666 (18.6%) | 726 (19.4%) |
| 12 to 14 Years | 411 (23.8%) | 463 (22.2%) |
| 15 Years | 328 (40.1%) | 117 (19.7%) |
| 16 and 17 Years | 398 (28.4%) | 199 (18.3%) |
| 18 to 24 Years | 822 (17.0%) | 873 (16.7%) |
| 25 to 34 Years | 986 (11.2%) | 881 (10.9%) |
| 35 to 44 Years | 944 (13.1%) | 1,196 (16.3%) |
| 45 to 54 Years | 1,210 (16.5%) | 958 (12.6%) |
| 55 to 64 Years | 1,149 (16.9%) | 669 (10.0%) |
| 65 to 74 Years | 499 (14.1%) | 556 (12.3%) |
| 75 Years and over | 269 (12.1%) | 518 (15.7%) |
| Total | 8,308 (16.0%) | 8,004 (14.8%) |
Income Above Poverty by Sex and Age in Inglewood
According to the poverty statistics in Inglewood, males aged 25 to 34 years and females aged 55 to 64 years are the age groups that are most secure financially, with 88.8% of males and 90.0% of females in these age groups living above the poverty line.
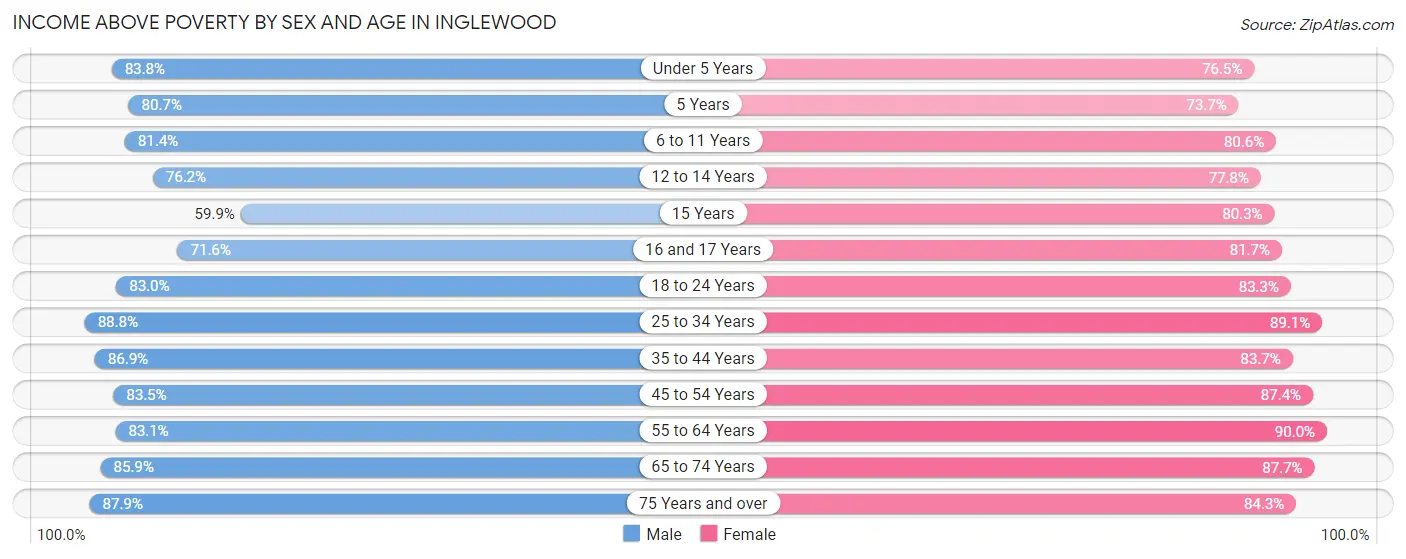
| Age Bracket | Male | Female |
| Under 5 Years | 2,530 (83.8%) | 2,157 (76.5%) |
| 5 Years | 577 (80.7%) | 523 (73.7%) |
| 6 to 11 Years | 2,908 (81.4%) | 3,018 (80.6%) |
| 12 to 14 Years | 1,315 (76.2%) | 1,619 (77.8%) |
| 15 Years | 490 (59.9%) | 477 (80.3%) |
| 16 and 17 Years | 1,003 (71.6%) | 886 (81.7%) |
| 18 to 24 Years | 4,006 (83.0%) | 4,366 (83.3%) |
| 25 to 34 Years | 7,841 (88.8%) | 7,230 (89.1%) |
| 35 to 44 Years | 6,284 (86.9%) | 6,127 (83.7%) |
| 45 to 54 Years | 6,134 (83.5%) | 6,672 (87.4%) |
| 55 to 64 Years | 5,663 (83.1%) | 6,045 (90.0%) |
| 65 to 74 Years | 3,035 (85.9%) | 3,972 (87.7%) |
| 75 Years and over | 1,959 (87.9%) | 2,788 (84.3%) |
| Total | 43,745 (84.0%) | 45,880 (85.2%) |
Income Below Poverty Among Married-Couple Families in Inglewood
The poverty statistics for married-couple families in Inglewood show that 9.2% or 1,160 of the total 12,556 families live below the poverty line. Families with 5 or more children have the highest poverty rate of 41.6%, comprising of 32 families. On the other hand, families with no children have the lowest poverty rate of 5.9%, which includes 393 families.
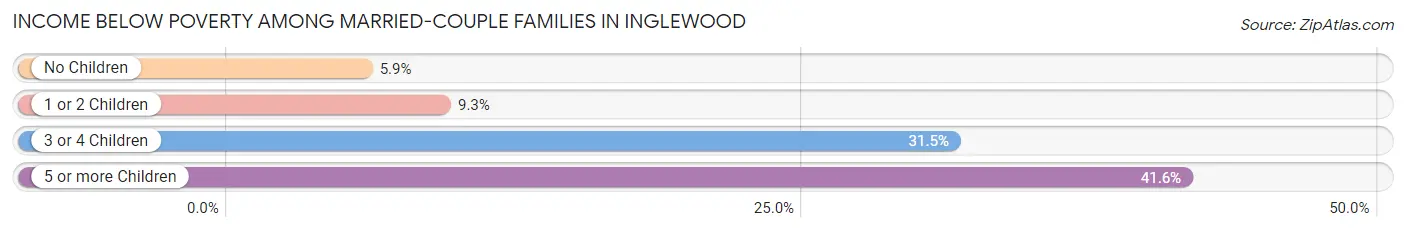
| Children | Above Poverty | Below Poverty |
| No Children | 6,317 (94.1%) | 393 (5.9%) |
| 1 or 2 Children | 4,415 (90.7%) | 451 (9.3%) |
| 3 or 4 Children | 619 (68.5%) | 284 (31.5%) |
| 5 or more Children | 45 (58.4%) | 32 (41.6%) |
| Total | 11,396 (90.8%) | 1,160 (9.2%) |
Income Below Poverty Among Single-Parent Households in Inglewood
According to the poverty data in Inglewood, 15.5% or 493 single-father households and 14.4% or 1,196 single-mother households are living below the poverty line. Among single-father households, those with 1 or 2 children have the highest poverty rate, with 339 households (36.4%) experiencing poverty. Likewise, among single-mother households, those with 3 or 4 children have the highest poverty rate, with 236 households (36.1%) falling below the poverty line.
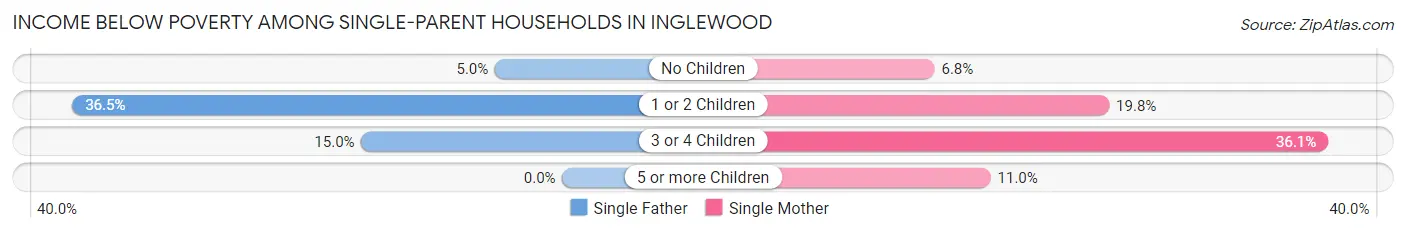
| Children | Single Father | Single Mother |
| No Children | 92 (5.0%) | 277 (6.8%) |
| 1 or 2 Children | 339 (36.4%) | 660 (19.8%) |
| 3 or 4 Children | 62 (15.0%) | 236 (36.1%) |
| 5 or more Children | 0 (0.0%) | 23 (11.0%) |
| Total | 493 (15.5%) | 1,196 (14.4%) |
Income Below Poverty Among Married-Couple vs Single-Parent Households in Inglewood
The poverty data for Inglewood shows that 1,160 of the married-couple family households (9.2%) and 1,689 of the single-parent households (14.7%) are living below the poverty level. Within the married-couple family households, those with 5 or more children have the highest poverty rate, with 32 households (41.6%) falling below the poverty line. Among the single-parent households, those with 3 or 4 children have the highest poverty rate, with 298 household (27.9%) living below poverty.
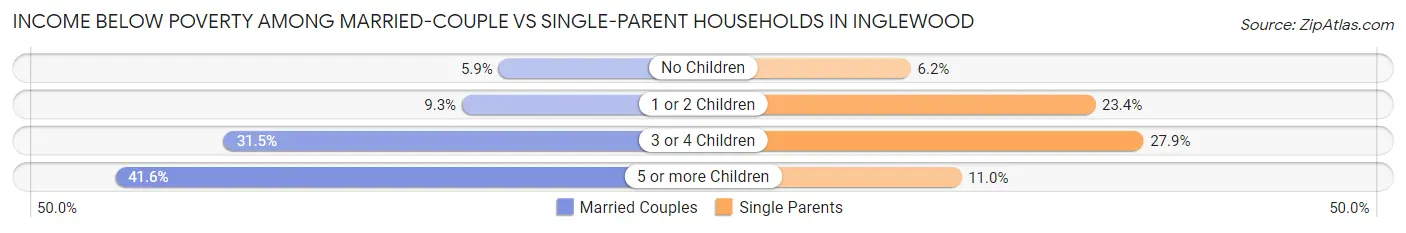
| Children | Married-Couple Families | Single-Parent Households |
| No Children | 393 (5.9%) | 369 (6.2%) |
| 1 or 2 Children | 451 (9.3%) | 999 (23.4%) |
| 3 or 4 Children | 284 (31.5%) | 298 (27.9%) |
| 5 or more Children | 32 (41.6%) | 23 (11.0%) |
| Total | 1,160 (9.2%) | 1,689 (14.7%) |
Race in Inglewood
The most populous races in Inglewood are Hispanic or Latino (52,639 | 49.3%), Black / African American (42,225 | 39.5%), and Some other Race (27,244 | 25.5%).
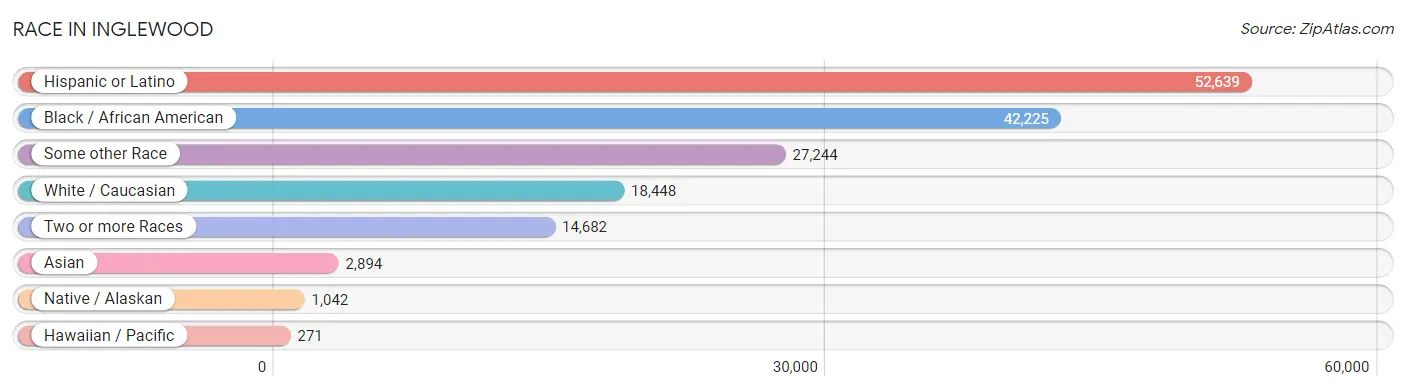
| Race | # Population | % Population |
| Asian | 2,894 | 2.7% |
| Black / African American | 42,225 | 39.5% |
| Hawaiian / Pacific | 271 | 0.3% |
| Hispanic or Latino | 52,639 | 49.3% |
| Native / Alaskan | 1,042 | 1.0% |
| White / Caucasian | 18,448 | 17.3% |
| Two or more Races | 14,682 | 13.8% |
| Some other Race | 27,244 | 25.5% |
| Total | 106,806 | 100.0% |
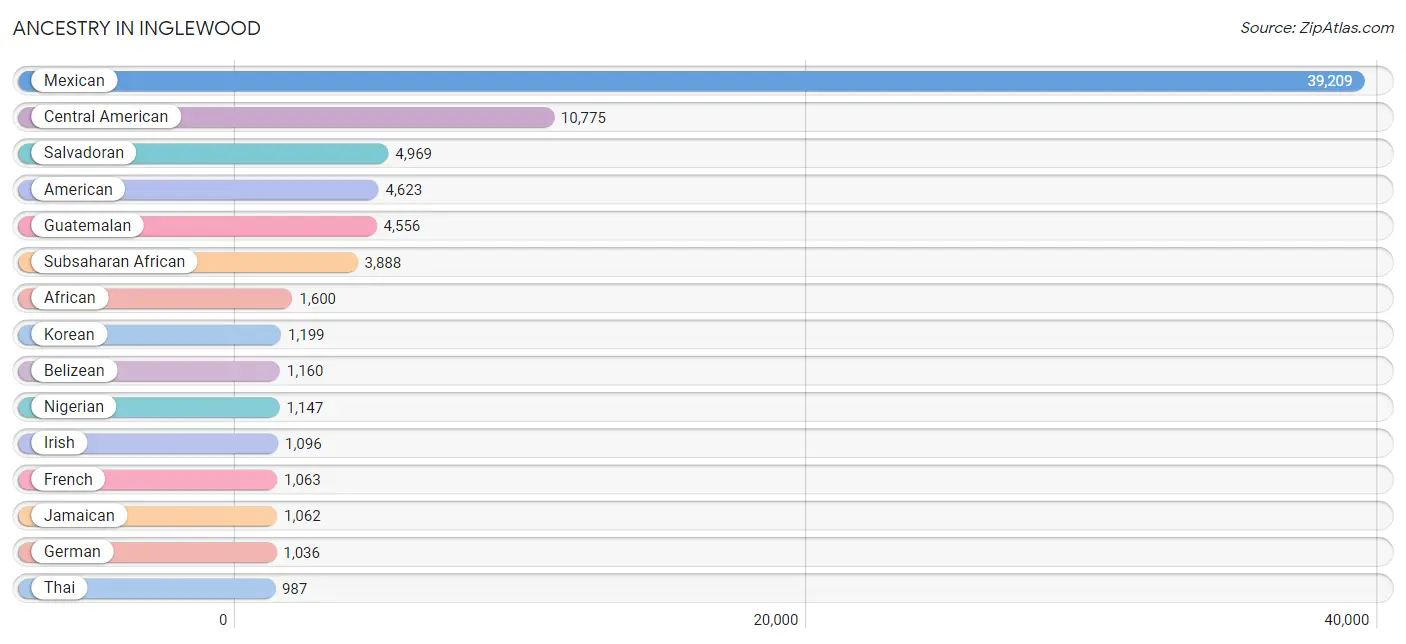
Ancestry in Inglewood
The most populous ancestries reported in Inglewood are Mexican (39,209 | 36.7%), Central American (10,775 | 10.1%), Salvadoran (4,969 | 4.6%), American (4,623 | 4.3%), and Guatemalan (4,556 | 4.3%), together accounting for 60.0% of all Inglewood residents.
| Ancestry | # Population | % Population |
| African | 1,600 | 1.5% |
| Alsatian | 4 | 0.0% |
| American | 4,623 | 4.3% |
| Apache | 49 | 0.1% |
| Arab | 667 | 0.6% |
| Argentinean | 17 | 0.0% |
| Armenian | 22 | 0.0% |
| Austrian | 6 | 0.0% |
| Bahamian | 14 | 0.0% |
| Basque | 19 | 0.0% |
| Belizean | 1,160 | 1.1% |
| Bhutanese | 714 | 0.7% |
| Blackfeet | 130 | 0.1% |
| Bolivian | 10 | 0.0% |
| Brazilian | 156 | 0.2% |
| British | 134 | 0.1% |
| British West Indian | 131 | 0.1% |
| Bulgarian | 16 | 0.0% |
| Burmese | 109 | 0.1% |
| Cajun | 8 | 0.0% |
| Canadian | 65 | 0.1% |
| Celtic | 13 | 0.0% |
| Central American | 10,775 | 10.1% |
| Central American Indian | 101 | 0.1% |
| Cherokee | 470 | 0.4% |
| Chilean | 44 | 0.0% |
| Choctaw | 9 | 0.0% |
| Colombian | 252 | 0.2% |
| Costa Rican | 109 | 0.1% |
| Creek | 75 | 0.1% |
| Croatian | 63 | 0.1% |
| Crow | 6 | 0.0% |
| Cuban | 273 | 0.3% |
| Czech | 90 | 0.1% |
| Czechoslovakian | 28 | 0.0% |
| Danish | 15 | 0.0% |
| Dominican | 77 | 0.1% |
| Dutch | 81 | 0.1% |
| Eastern European | 30 | 0.0% |
| Ecuadorian | 117 | 0.1% |
| Egyptian | 117 | 0.1% |
| English | 718 | 0.7% |
| Ethiopian | 801 | 0.7% |
| European | 363 | 0.3% |
| Filipino | 36 | 0.0% |
| French | 1,063 | 1.0% |
| French American Indian | 222 | 0.2% |
| French Canadian | 58 | 0.1% |
| German | 1,036 | 1.0% |
| Ghanaian | 122 | 0.1% |
| Greek | 5 | 0.0% |
| Guamanian / Chamorro | 9 | 0.0% |
| Guatemalan | 4,556 | 4.3% |
| Guyanese | 165 | 0.2% |
| Haitian | 465 | 0.4% |
| Honduran | 625 | 0.6% |
| Hungarian | 76 | 0.1% |
| Indian (Asian) | 322 | 0.3% |
| Indonesian | 63 | 0.1% |
| Inupiat | 20 | 0.0% |
| Iranian | 48 | 0.0% |
| Irish | 1,096 | 1.0% |
| Israeli | 38 | 0.0% |
| Italian | 608 | 0.6% |
| Jamaican | 1,062 | 1.0% |
| Japanese | 27 | 0.0% |
| Kenyan | 23 | 0.0% |
| Korean | 1,199 | 1.1% |
| Laotian | 9 | 0.0% |
| Latvian | 39 | 0.0% |
| Lebanese | 98 | 0.1% |
| Macedonian | 16 | 0.0% |
| Mexican | 39,209 | 36.7% |
| Mexican American Indian | 705 | 0.7% |
| Moroccan | 369 | 0.4% |
| Native Hawaiian | 93 | 0.1% |
| Navajo | 112 | 0.1% |
| Nicaraguan | 311 | 0.3% |
| Nigerian | 1,147 | 1.1% |
| Norwegian | 131 | 0.1% |
| Pakistani | 56 | 0.1% |
| Panamanian | 197 | 0.2% |
| Paraguayan | 3 | 0.0% |
| Peruvian | 199 | 0.2% |
| Polish | 156 | 0.2% |
| Portuguese | 137 | 0.1% |
| Pueblo | 64 | 0.1% |
| Puerto Rican | 283 | 0.3% |
| Romanian | 14 | 0.0% |
| Russian | 66 | 0.1% |
| Salvadoran | 4,969 | 4.6% |
| Samoan | 136 | 0.1% |
| Scandinavian | 6 | 0.0% |
| Scotch-Irish | 137 | 0.1% |
| Scottish | 374 | 0.4% |
| Seminole | 19 | 0.0% |
| Sioux | 35 | 0.0% |
| South African | 14 | 0.0% |
| South American | 844 | 0.8% |
| South American Indian | 24 | 0.0% |
| Spaniard | 180 | 0.2% |
| Spanish | 39 | 0.0% |
| Spanish American | 9 | 0.0% |
| Sri Lankan | 184 | 0.2% |
| Subsaharan African | 3,888 | 3.6% |
| Swedish | 241 | 0.2% |
| Syrian | 31 | 0.0% |
| Thai | 987 | 0.9% |
| Trinidadian and Tobagonian | 112 | 0.1% |
| Turkish | 6 | 0.0% |
| U.S. Virgin Islander | 51 | 0.1% |
| Ugandan | 32 | 0.0% |
| Ukrainian | 35 | 0.0% |
| Venezuelan | 178 | 0.2% |
| Vietnamese | 187 | 0.2% |
| Welsh | 79 | 0.1% |
| West Indian | 125 | 0.1% | View All 117 Rows |
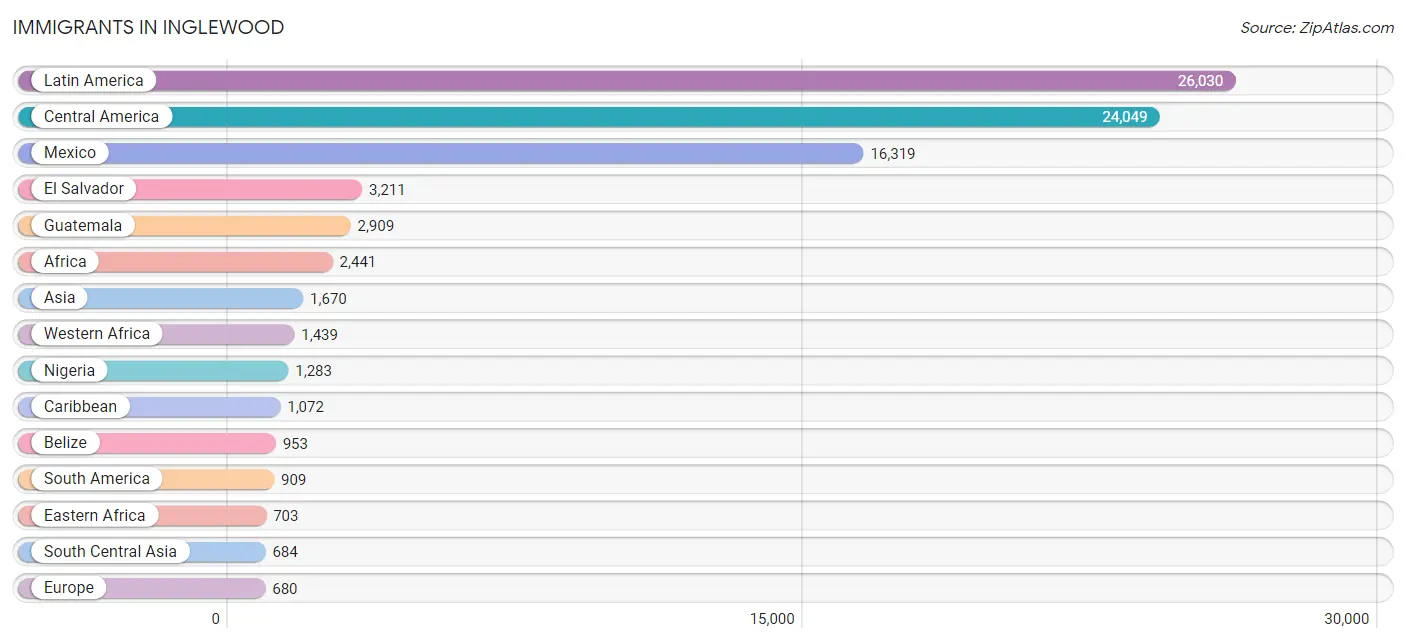
Immigrants in Inglewood
The most numerous immigrant groups reported in Inglewood came from Latin America (26,030 | 24.4%), Central America (24,049 | 22.5%), Mexico (16,319 | 15.3%), El Salvador (3,211 | 3.0%), and Guatemala (2,909 | 2.7%), together accounting for 67.9% of all Inglewood residents.
| Immigration Origin | # Population | % Population |
| Africa | 2,441 | 2.3% |
| Asia | 1,670 | 1.6% |
| Bangladesh | 118 | 0.1% |
| Belize | 953 | 0.9% |
| Bolivia | 1 | 0.0% |
| Brazil | 95 | 0.1% |
| Cambodia | 27 | 0.0% |
| Cameroon | 67 | 0.1% |
| Canada | 161 | 0.2% |
| Caribbean | 1,072 | 1.0% |
| Central America | 24,049 | 22.5% |
| Chile | 6 | 0.0% |
| China | 74 | 0.1% |
| Colombia | 297 | 0.3% |
| Costa Rica | 40 | 0.0% |
| Cuba | 116 | 0.1% |
| Czechoslovakia | 13 | 0.0% |
| Dominican Republic | 49 | 0.1% |
| Eastern Africa | 703 | 0.7% |
| Eastern Asia | 278 | 0.3% |
| Eastern Europe | 99 | 0.1% |
| Ecuador | 98 | 0.1% |
| Egypt | 59 | 0.1% |
| El Salvador | 3,211 | 3.0% |
| England | 13 | 0.0% |
| Eritrea | 22 | 0.0% |
| Ethiopia | 520 | 0.5% |
| Europe | 680 | 0.6% |
| Fiji | 188 | 0.2% |
| France | 282 | 0.3% |
| Germany | 29 | 0.0% |
| Ghana | 96 | 0.1% |
| Guatemala | 2,909 | 2.7% |
| Guyana | 122 | 0.1% |
| Haiti | 341 | 0.3% |
| Honduras | 403 | 0.4% |
| Hong Kong | 13 | 0.0% |
| Hungary | 35 | 0.0% |
| India | 419 | 0.4% |
| Indonesia | 9 | 0.0% |
| Iran | 26 | 0.0% |
| Ireland | 1 | 0.0% |
| Israel | 1 | 0.0% |
| Italy | 79 | 0.1% |
| Jamaica | 401 | 0.4% |
| Japan | 103 | 0.1% |
| Kenya | 16 | 0.0% |
| Korea | 101 | 0.1% |
| Latin America | 26,030 | 24.4% |
| Latvia | 37 | 0.0% |
| Lebanon | 65 | 0.1% |
| Mexico | 16,319 | 15.3% |
| Middle Africa | 87 | 0.1% |
| Morocco | 76 | 0.1% |
| Nicaragua | 145 | 0.1% |
| Nigeria | 1,283 | 1.2% |
| Northern Africa | 179 | 0.2% |
| Northern Europe | 92 | 0.1% |
| Oceania | 263 | 0.3% |
| Pakistan | 44 | 0.0% |
| Panama | 69 | 0.1% |
| Peru | 124 | 0.1% |
| Philippines | 409 | 0.4% |
| Russia | 10 | 0.0% |
| Scotland | 6 | 0.0% |
| Sierra Leone | 19 | 0.0% |
| Somalia | 18 | 0.0% |
| South Africa | 33 | 0.0% |
| South America | 909 | 0.9% |
| South Central Asia | 684 | 0.6% |
| South Eastern Asia | 635 | 0.6% |
| Southern Europe | 168 | 0.2% |
| Spain | 89 | 0.1% |
| Sri Lanka | 77 | 0.1% |
| Sudan | 10 | 0.0% |
| Switzerland | 10 | 0.0% |
| Syria | 1 | 0.0% |
| Taiwan | 25 | 0.0% |
| Thailand | 46 | 0.0% |
| Trinidad and Tobago | 81 | 0.1% |
| Turkey | 6 | 0.0% |
| Uganda | 127 | 0.1% |
| Ukraine | 3 | 0.0% |
| Venezuela | 163 | 0.2% |
| Vietnam | 104 | 0.1% |
| Western Africa | 1,439 | 1.3% |
| Western Asia | 73 | 0.1% |
| Western Europe | 321 | 0.3% |
| Zaire | 20 | 0.0% | View All 89 Rows |
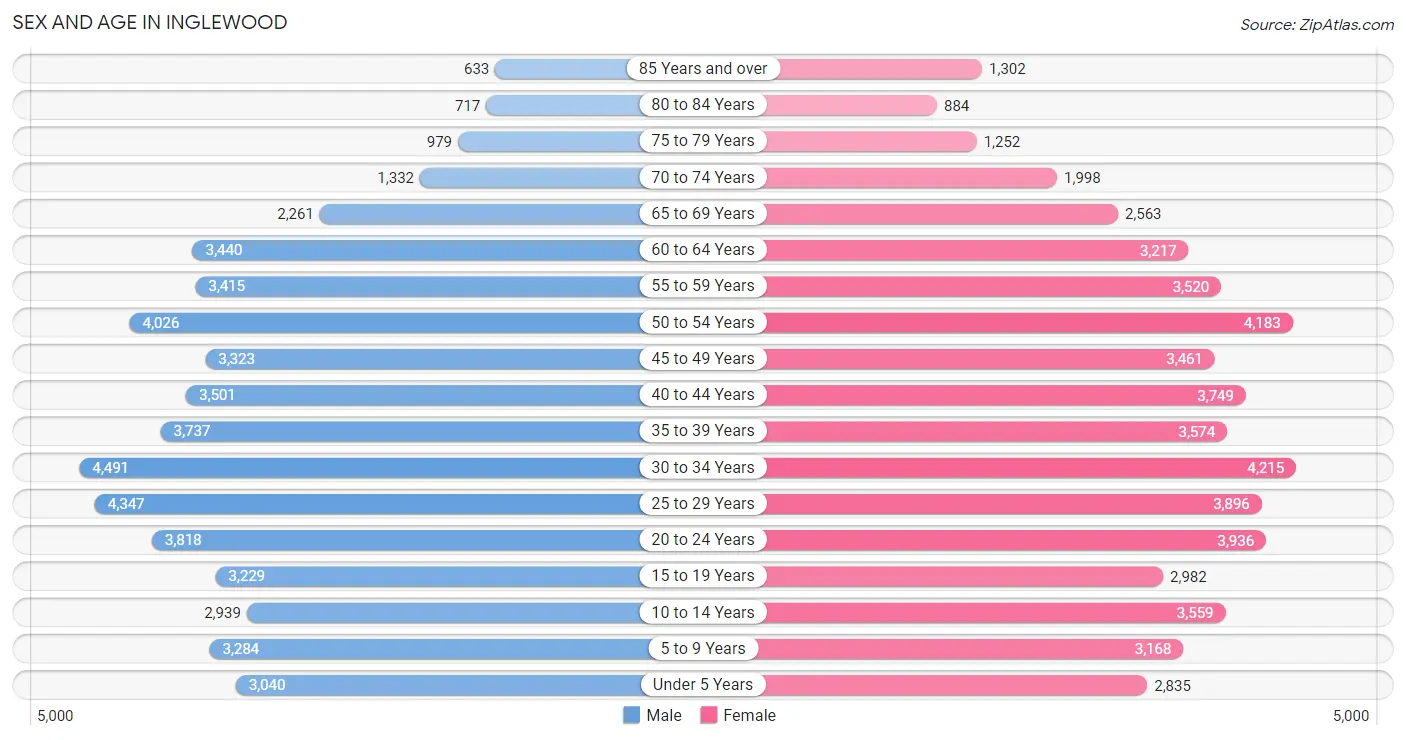
Sex and Age in Inglewood
Sex and Age in Inglewood
The most populous age groups in Inglewood are 30 to 34 Years (4,491 | 8.6%) for men and 30 to 34 Years (4,215 | 7.8%) for women.
| Age Bracket | Male | Female |
| Under 5 Years | 3,040 (5.8%) | 2,835 (5.2%) |
| 5 to 9 Years | 3,284 (6.2%) | 3,168 (5.8%) |
| 10 to 14 Years | 2,939 (5.6%) | 3,559 (6.6%) |
| 15 to 19 Years | 3,229 (6.1%) | 2,982 (5.5%) |
| 20 to 24 Years | 3,818 (7.3%) | 3,936 (7.2%) |
| 25 to 29 Years | 4,347 (8.3%) | 3,896 (7.2%) |
| 30 to 34 Years | 4,491 (8.6%) | 4,215 (7.8%) |
| 35 to 39 Years | 3,737 (7.1%) | 3,574 (6.6%) |
| 40 to 44 Years | 3,501 (6.7%) | 3,749 (6.9%) |
| 45 to 49 Years | 3,323 (6.3%) | 3,461 (6.4%) |
| 50 to 54 Years | 4,026 (7.7%) | 4,183 (7.7%) |
| 55 to 59 Years | 3,415 (6.5%) | 3,520 (6.5%) |
| 60 to 64 Years | 3,440 (6.6%) | 3,217 (5.9%) |
| 65 to 69 Years | 2,261 (4.3%) | 2,563 (4.7%) |
| 70 to 74 Years | 1,332 (2.5%) | 1,998 (3.7%) |
| 75 to 79 Years | 979 (1.9%) | 1,252 (2.3%) |
| 80 to 84 Years | 717 (1.4%) | 884 (1.6%) |
| 85 Years and over | 633 (1.2%) | 1,302 (2.4%) |
| Total | 52,512 (100.0%) | 54,294 (100.0%) |
Families and Households in Inglewood
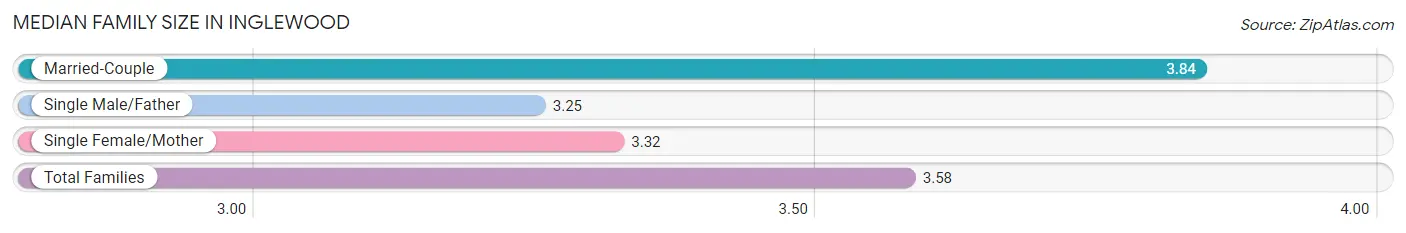
Median Family Size in Inglewood
The median family size in Inglewood is 3.58 persons per family, with married-couple families (12,556 | 52.3%) accounting for the largest median family size of 3.84 persons per family. On the other hand, single male/father families (3,177 | 13.2%) represent the smallest median family size with 3.25 persons per family.
| Family Type | # Families | Family Size |
| Married-Couple | 12,556 (52.3%) | 3.84 |
| Single Male/Father | 3,177 (13.2%) | 3.25 |
| Single Female/Mother | 8,291 (34.5%) | 3.32 |
| Total Families | 24,024 (100.0%) | 3.58 |
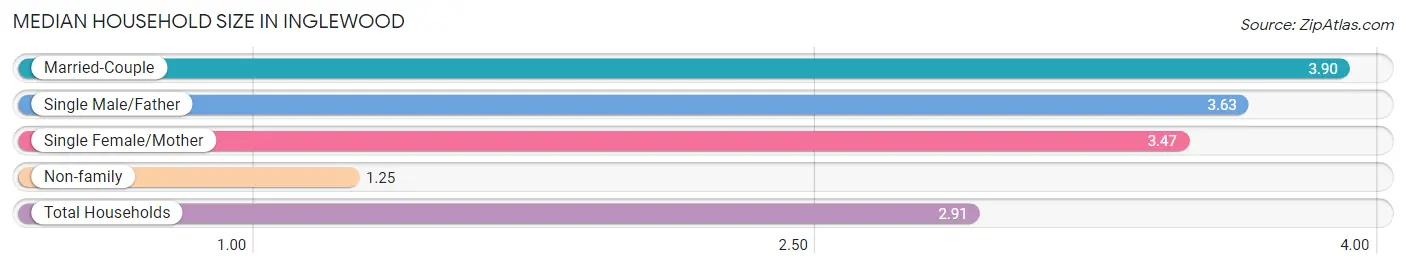
Median Household Size in Inglewood
The median household size in Inglewood is 2.91 persons per household, with married-couple households (12,556 | 35.1%) accounting for the largest median household size of 3.9 persons per household. non-family households (11,749 | 32.8%) represent the smallest median household size with 1.25 persons per household.
| Household Type | # Households | Household Size |
| Married-Couple | 12,556 (35.1%) | 3.90 |
| Single Male/Father | 3,177 (8.9%) | 3.63 |
| Single Female/Mother | 8,291 (23.2%) | 3.47 |
| Non-family | 11,749 (32.8%) | 1.25 |
| Total Households | 35,773 (100.0%) | 2.91 |
Household Size by Marriage Status in Inglewood
Out of a total of 35,773 households in Inglewood, 24,024 (67.2%) are family households, while 11,749 (32.8%) are nonfamily households. The most numerous type of family households are 2-person households, comprising 7,580, and the most common type of nonfamily households are 1-person households, comprising 9,729.
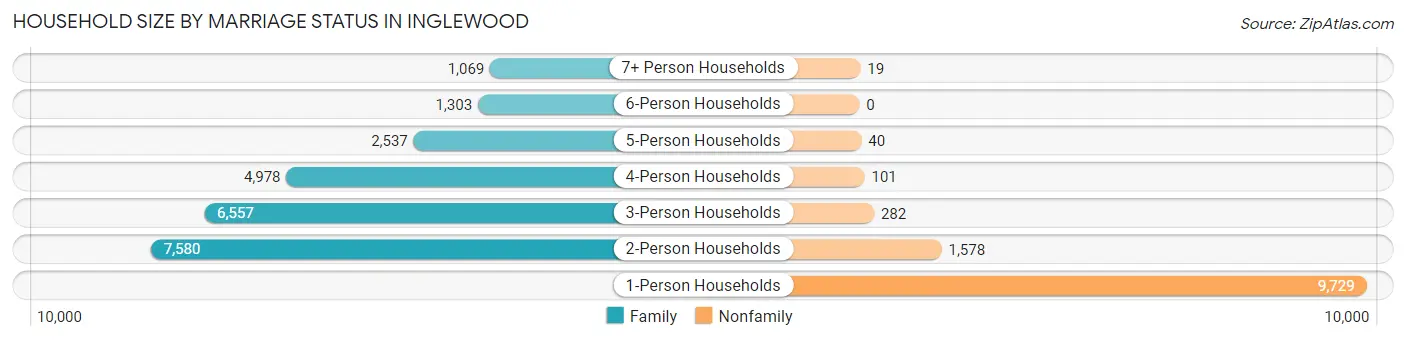
| Household Size | Family Households | Nonfamily Households |
| 1-Person Households | - | 9,729 (27.2%) |
| 2-Person Households | 7,580 (21.2%) | 1,578 (4.4%) |
| 3-Person Households | 6,557 (18.3%) | 282 (0.8%) |
| 4-Person Households | 4,978 (13.9%) | 101 (0.3%) |
| 5-Person Households | 2,537 (7.1%) | 40 (0.1%) |
| 6-Person Households | 1,303 (3.6%) | 0 (0.0%) |
| 7+ Person Households | 1,069 (3.0%) | 19 (0.1%) |
| Total | 24,024 (67.2%) | 11,749 (32.8%) |
Female Fertility in Inglewood
Fertility by Age in Inglewood
Average fertility rate in Inglewood is 52.0 births per 1,000 women. Women in the age bracket of 20 to 34 years have the highest fertility rate with 62.0 births per 1,000 women. Women in the age bracket of 20 to 34 years acount for 53.7% of all women with births.
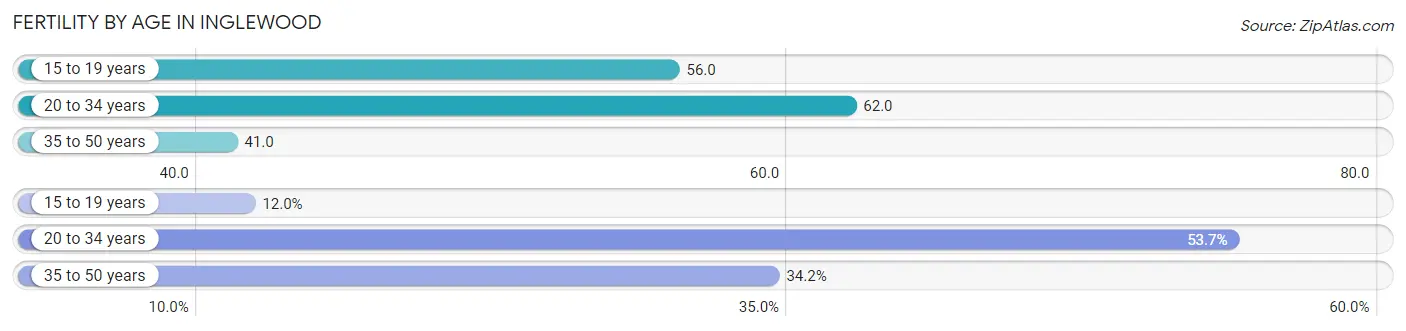
| Age Bracket | Women with Births | Births / 1,000 Women |
| 15 to 19 years | 167 (12.0%) | 56.0 |
| 20 to 34 years | 747 (53.7%) | 62.0 |
| 35 to 50 years | 476 (34.2%) | 41.0 |
| Total | 1,390 (100.0%) | 52.0 |
Fertility by Age by Marriage Status in Inglewood
52.8% of women with births (1,390) in Inglewood are married. The highest percentage of unmarried women with births falls into 15 to 19 years age bracket with 100.0% of them unmarried at the time of birth, while the lowest percentage of unmarried women with births belong to 35 to 50 years age bracket with 36.3% of them unmarried.
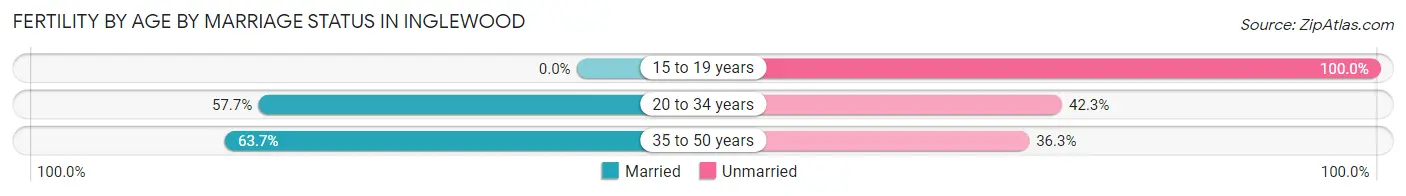
| Age Bracket | Married | Unmarried |
| 15 to 19 years | 0 (0.0%) | 167 (100.0%) |
| 20 to 34 years | 431 (57.7%) | 316 (42.3%) |
| 35 to 50 years | 303 (63.7%) | 173 (36.3%) |
| Total | 734 (52.8%) | 656 (47.2%) |
Fertility by Education in Inglewood
Average fertility rate in Inglewood is 52.0 births per 1,000 women. Women with the education attainment of high school diploma have the highest fertility rate of 80.0 births per 1,000 women, while women with the education attainment of college or associate's degree have the lowest fertility at 33.0 births per 1,000 women. Women with the education attainment of high school diploma represent 33.2% of all women with births.
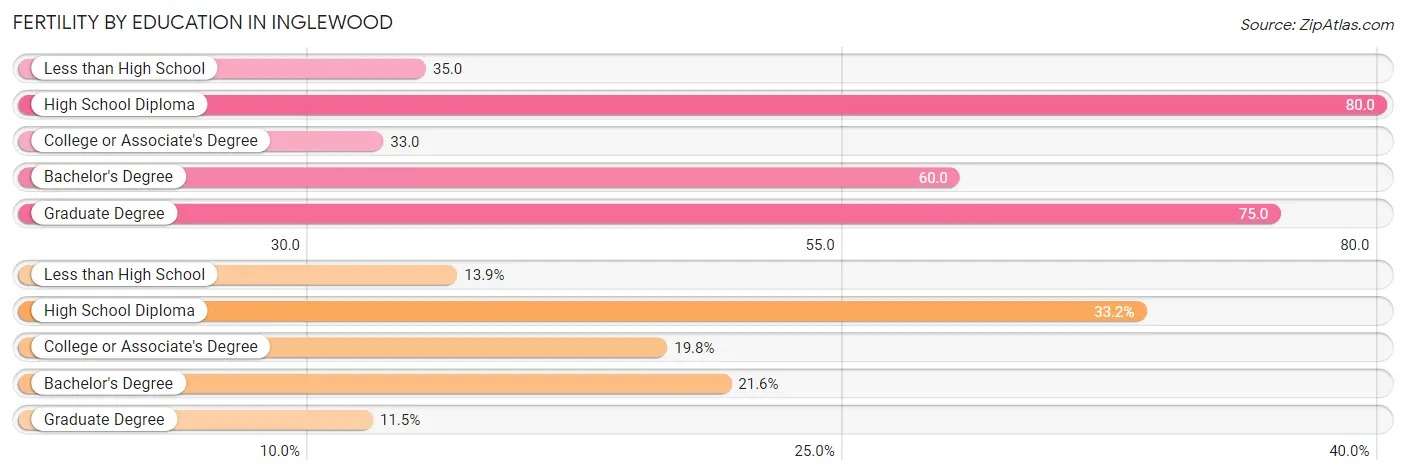
| Educational Attainment | Women with Births | Births / 1,000 Women |
| Less than High School | 193 (13.9%) | 35.0 |
| High School Diploma | 462 (33.2%) | 80.0 |
| College or Associate's Degree | 275 (19.8%) | 33.0 |
| Bachelor's Degree | 300 (21.6%) | 60.0 |
| Graduate Degree | 160 (11.5%) | 75.0 |
| Total | 1,390 (100.0%) | 52.0 |
Fertility by Education by Marriage Status in Inglewood
47.2% of women with births in Inglewood are unmarried. Women with the educational attainment of graduate degree are most likely to be married with 90.6% of them married at childbirth, while women with the educational attainment of high school diploma are least likely to be married with 67.5% of them unmarried at childbirth.
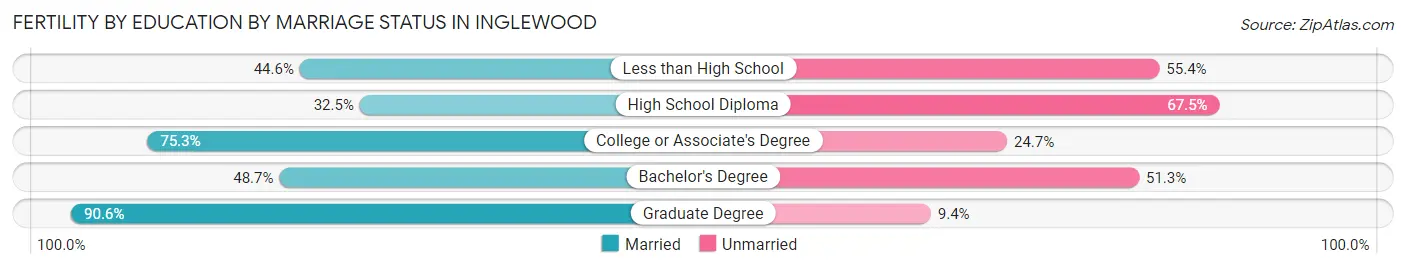
| Educational Attainment | Married | Unmarried |
| Less than High School | 86 (44.6%) | 107 (55.4%) |
| High School Diploma | 150 (32.5%) | 312 (67.5%) |
| College or Associate's Degree | 207 (75.3%) | 68 (24.7%) |
| Bachelor's Degree | 146 (48.7%) | 154 (51.3%) |
| Graduate Degree | 145 (90.6%) | 15 (9.4%) |
| Total | 734 (52.8%) | 656 (47.2%) |
Employment Characteristics in Inglewood
Employment by Class of Employer in Inglewood
Among the 51,666 employed individuals in Inglewood, private company employees (33,429 | 64.7%), local government employees (5,361 | 10.4%), and self-employed (not incorporated) (4,217 | 8.2%) make up the most common classes of employment.
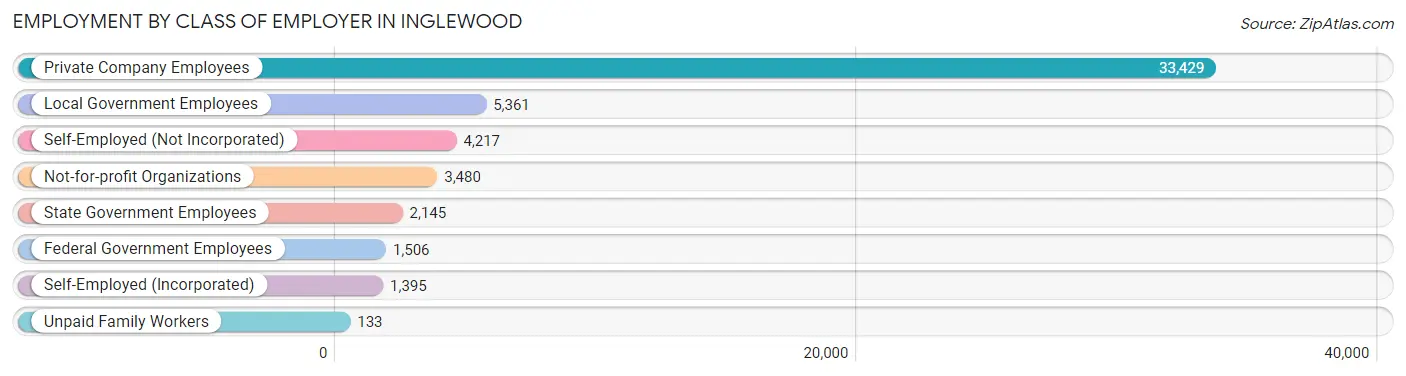
| Employer Class | # Employees | % Employees |
| Private Company Employees | 33,429 | 64.7% |
| Self-Employed (Incorporated) | 1,395 | 2.7% |
| Self-Employed (Not Incorporated) | 4,217 | 8.2% |
| Not-for-profit Organizations | 3,480 | 6.7% |
| Local Government Employees | 5,361 | 10.4% |
| State Government Employees | 2,145 | 4.2% |
| Federal Government Employees | 1,506 | 2.9% |
| Unpaid Family Workers | 133 | 0.3% |
| Total | 51,666 | 100.0% |
Employment Status by Age in Inglewood
According to the labor force statistics for Inglewood, out of the total population over 16 years of age (86,569), 67.4% or 58,348 individuals are in the labor force, with 8.2% or 4,785 of them unemployed. The age group with the highest labor force participation rate is 25 to 29 years, with 87.6% or 7,221 individuals in the labor force. Within the labor force, the 16 to 19 years age range has the highest percentage of unemployed individuals, with 25.7% or 385 of them being unemployed.
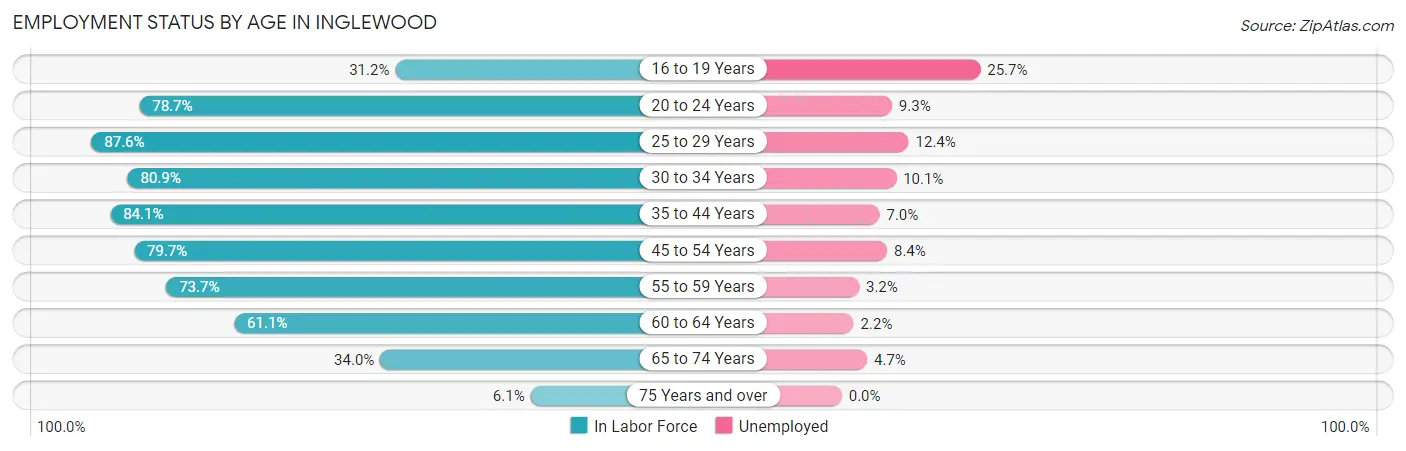
| Age Bracket | In Labor Force | Unemployed |
| 16 to 19 Years | 1,497 (31.2%) | 385 (25.7%) |
| 20 to 24 Years | 6,102 (78.7%) | 567 (9.3%) |
| 25 to 29 Years | 7,221 (87.6%) | 895 (12.4%) |
| 30 to 34 Years | 7,043 (80.9%) | 711 (10.1%) |
| 35 to 44 Years | 12,246 (84.1%) | 857 (7.0%) |
| 45 to 54 Years | 11,949 (79.7%) | 1,004 (8.4%) |
| 55 to 59 Years | 5,111 (73.7%) | 164 (3.2%) |
| 60 to 64 Years | 4,067 (61.1%) | 89 (2.2%) |
| 65 to 74 Years | 2,772 (34.0%) | 130 (4.7%) |
| 75 Years and over | 352 (6.1%) | 0 (0.0%) |
| Total | 58,348 (67.4%) | 4,785 (8.2%) |
Employment Status by Educational Attainment in Inglewood
According to labor force statistics for Inglewood, 79.3% of individuals (47,655) out of the total population between 25 and 64 years of age (60,095) are in the labor force, with 7.8% or 3,717 of them being unemployed. The group with the highest labor force participation rate are those with the educational attainment of bachelor's degree or higher, with 86.2% or 12,338 individuals in the labor force. Within the labor force, individuals with college / associate degree education have the highest percentage of unemployment, with 10.0% or 1,552 of them being unemployed.
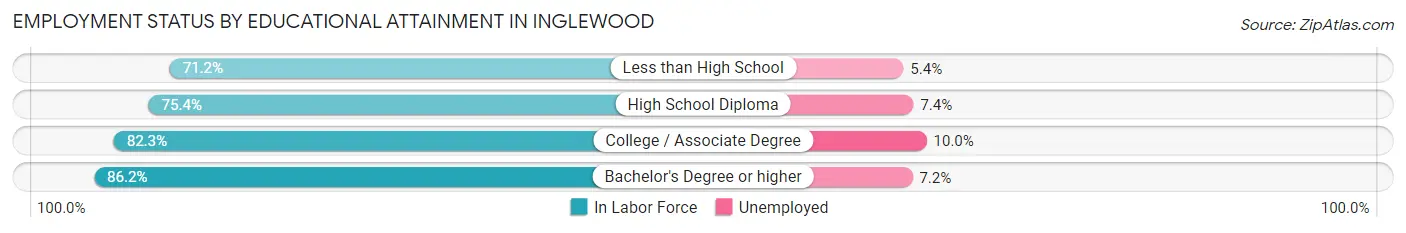
| Educational Attainment | In Labor Force | Unemployed |
| Less than High School | 8,888 (71.2%) | 674 (5.4%) |
| High School Diploma | 10,893 (75.4%) | 1,069 (7.4%) |
| College / Associate Degree | 15,515 (82.3%) | 1,885 (10.0%) |
| Bachelor's Degree or higher | 12,338 (86.2%) | 1,031 (7.2%) |
| Total | 47,655 (79.3%) | 4,687 (7.8%) |
Employment Occupations by Sex in Inglewood
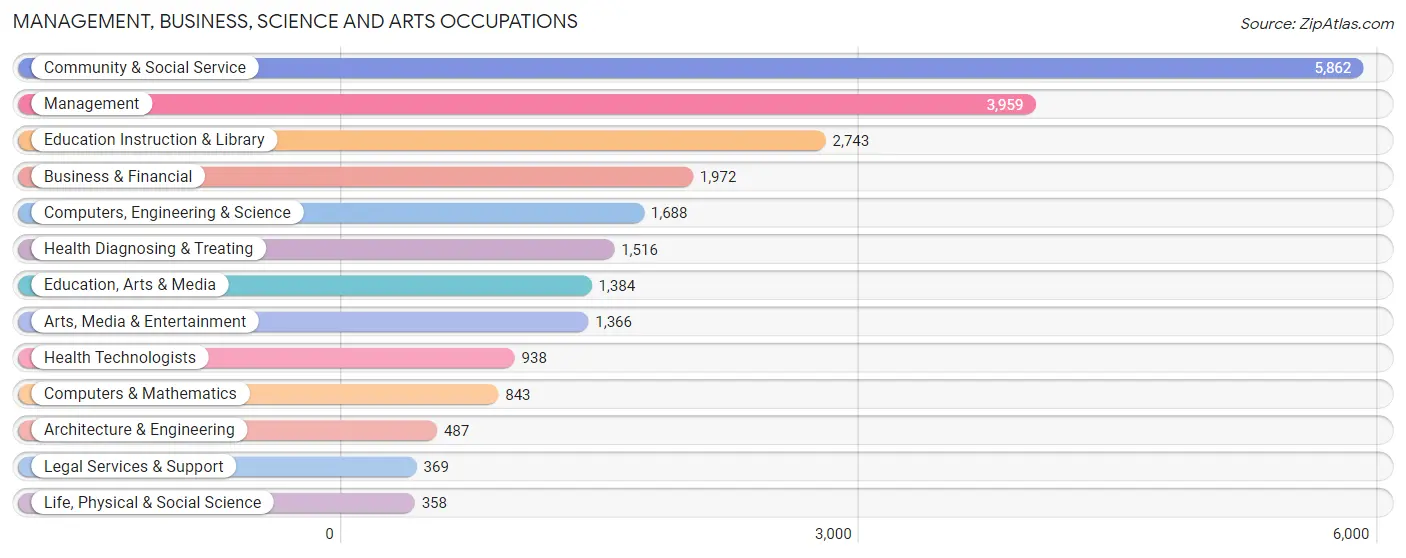
Management, Business, Science and Arts Occupations
The most common Management, Business, Science and Arts occupations in Inglewood are Community & Social Service (5,862 | 11.0%), Management (3,959 | 7.4%), Education Instruction & Library (2,743 | 5.1%), Business & Financial (1,972 | 3.7%), and Computers, Engineering & Science (1,688 | 3.2%).
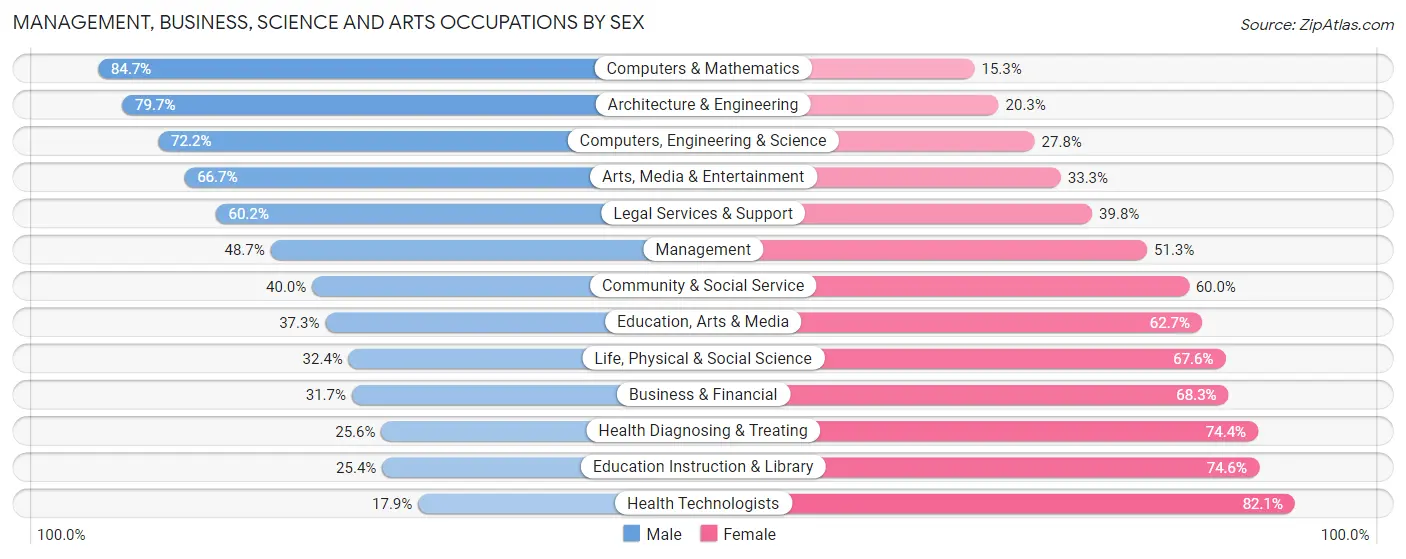
Management, Business, Science and Arts Occupations by Sex
Within the Management, Business, Science and Arts occupations in Inglewood, the most male-oriented occupations are Computers & Mathematics (84.7%), Architecture & Engineering (79.7%), and Computers, Engineering & Science (72.2%), while the most female-oriented occupations are Health Technologists (82.1%), Education Instruction & Library (74.6%), and Health Diagnosing & Treating (74.4%).
| Occupation | Male | Female |
| Management | 1,928 (48.7%) | 2,031 (51.3%) |
| Business & Financial | 626 (31.7%) | 1,346 (68.3%) |
| Computers, Engineering & Science | 1,218 (72.2%) | 470 (27.8%) |
| Computers & Mathematics | 714 (84.7%) | 129 (15.3%) |
| Architecture & Engineering | 388 (79.7%) | 99 (20.3%) |
| Life, Physical & Social Science | 116 (32.4%) | 242 (67.6%) |
| Community & Social Service | 2,346 (40.0%) | 3,516 (60.0%) |
| Education, Arts & Media | 516 (37.3%) | 868 (62.7%) |
| Legal Services & Support | 222 (60.2%) | 147 (39.8%) |
| Education Instruction & Library | 697 (25.4%) | 2,046 (74.6%) |
| Arts, Media & Entertainment | 911 (66.7%) | 455 (33.3%) |
| Health Diagnosing & Treating | 388 (25.6%) | 1,128 (74.4%) |
| Health Technologists | 168 (17.9%) | 770 (82.1%) |
| Total (Category) | 6,506 (43.4%) | 8,491 (56.6%) |
| Total (Overall) | 27,401 (51.3%) | 26,039 (48.7%) |
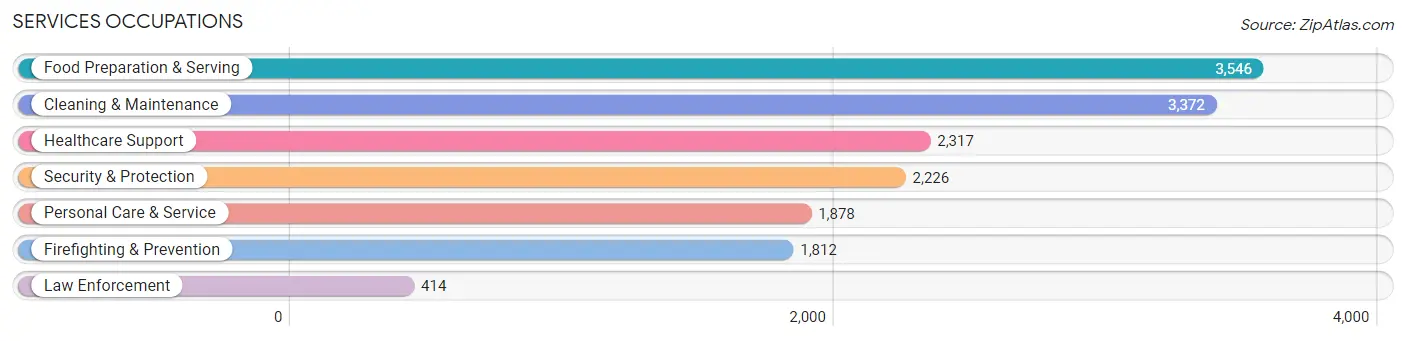
Services Occupations
The most common Services occupations in Inglewood are Food Preparation & Serving (3,546 | 6.6%), Cleaning & Maintenance (3,372 | 6.3%), Healthcare Support (2,317 | 4.3%), Security & Protection (2,226 | 4.2%), and Personal Care & Service (1,878 | 3.5%).
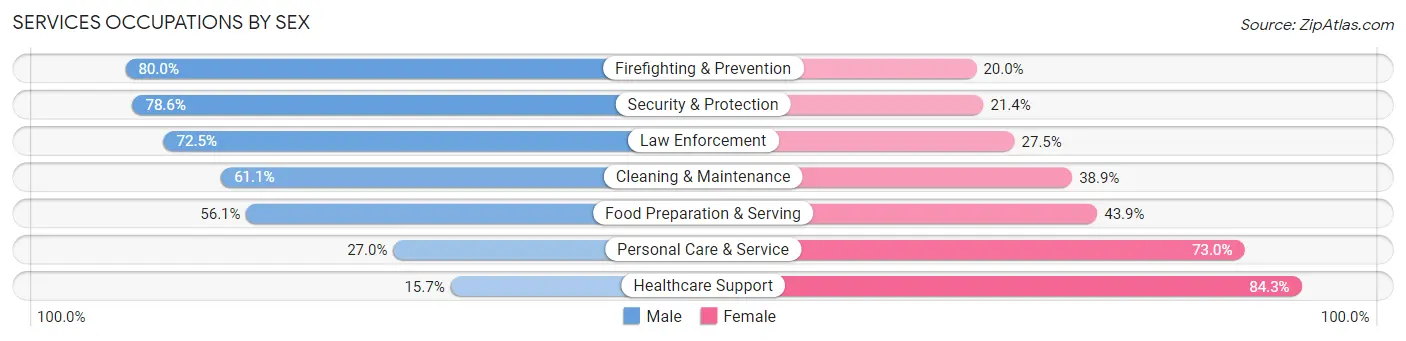
Services Occupations by Sex
Within the Services occupations in Inglewood, the most male-oriented occupations are Firefighting & Prevention (80.0%), Security & Protection (78.6%), and Law Enforcement (72.5%), while the most female-oriented occupations are Healthcare Support (84.3%), Personal Care & Service (73.0%), and Food Preparation & Serving (43.9%).
| Occupation | Male | Female |
| Healthcare Support | 363 (15.7%) | 1,954 (84.3%) |
| Security & Protection | 1,750 (78.6%) | 476 (21.4%) |
| Firefighting & Prevention | 1,450 (80.0%) | 362 (20.0%) |
| Law Enforcement | 300 (72.5%) | 114 (27.5%) |
| Food Preparation & Serving | 1,989 (56.1%) | 1,557 (43.9%) |
| Cleaning & Maintenance | 2,059 (61.1%) | 1,313 (38.9%) |
| Personal Care & Service | 507 (27.0%) | 1,371 (73.0%) |
| Total (Category) | 6,668 (50.0%) | 6,671 (50.0%) |
| Total (Overall) | 27,401 (51.3%) | 26,039 (48.7%) |
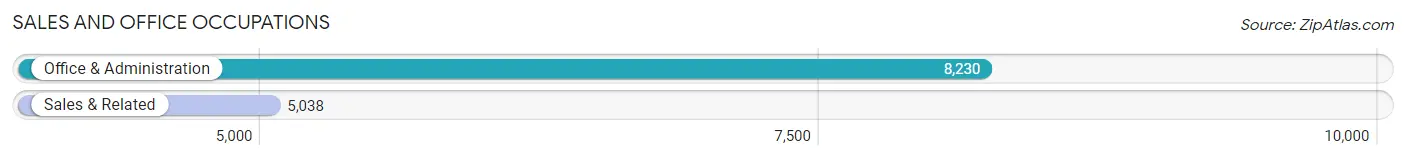
Sales and Office Occupations
The most common Sales and Office occupations in Inglewood are Office & Administration (8,230 | 15.4%), and Sales & Related (5,038 | 9.4%).
Sales and Office Occupations by Sex
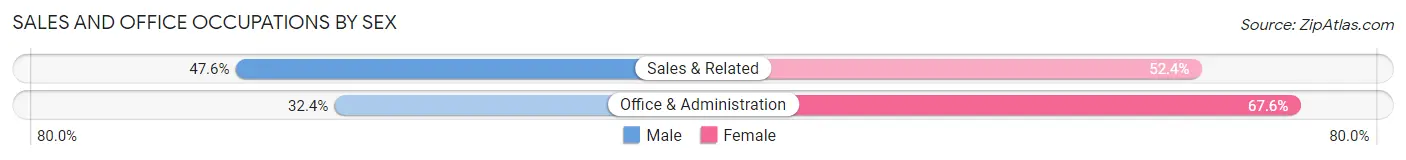
| Occupation | Male | Female |
| Sales & Related | 2,397 (47.6%) | 2,641 (52.4%) |
| Office & Administration | 2,665 (32.4%) | 5,565 (67.6%) |
| Total (Category) | 5,062 (38.2%) | 8,206 (61.9%) |
| Total (Overall) | 27,401 (51.3%) | 26,039 (48.7%) |
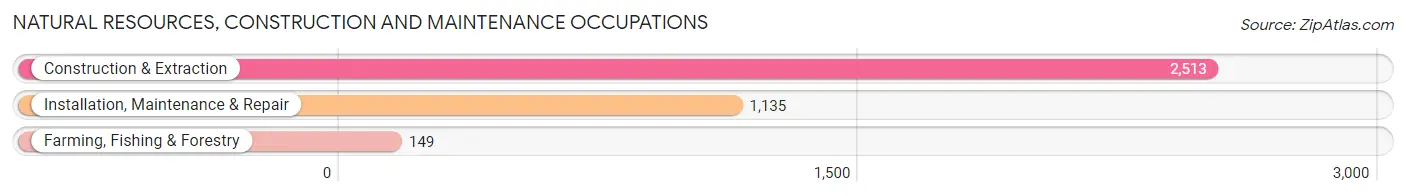
Natural Resources, Construction and Maintenance Occupations
The most common Natural Resources, Construction and Maintenance occupations in Inglewood are Construction & Extraction (2,513 | 4.7%), Installation, Maintenance & Repair (1,135 | 2.1%), and Farming, Fishing & Forestry (149 | 0.3%).
Natural Resources, Construction and Maintenance Occupations by Sex
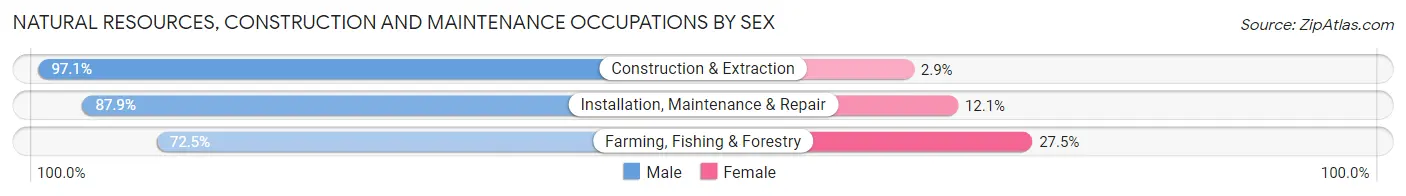
| Occupation | Male | Female |
| Farming, Fishing & Forestry | 108 (72.5%) | 41 (27.5%) |
| Construction & Extraction | 2,440 (97.1%) | 73 (2.9%) |
| Installation, Maintenance & Repair | 998 (87.9%) | 137 (12.1%) |
| Total (Category) | 3,546 (93.4%) | 251 (6.6%) |
| Total (Overall) | 27,401 (51.3%) | 26,039 (48.7%) |
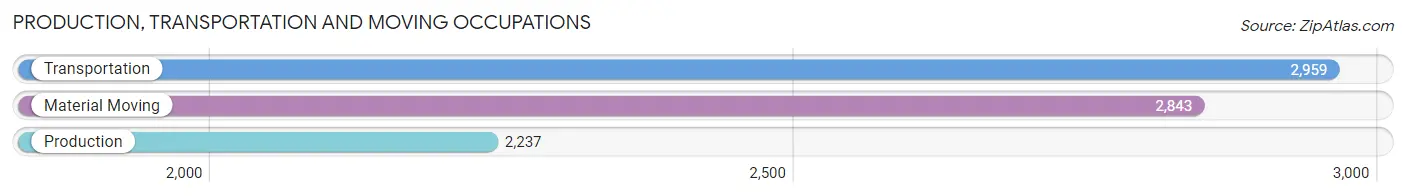
Production, Transportation and Moving Occupations
The most common Production, Transportation and Moving occupations in Inglewood are Transportation (2,959 | 5.5%), Material Moving (2,843 | 5.3%), and Production (2,237 | 4.2%).
Production, Transportation and Moving Occupations by Sex
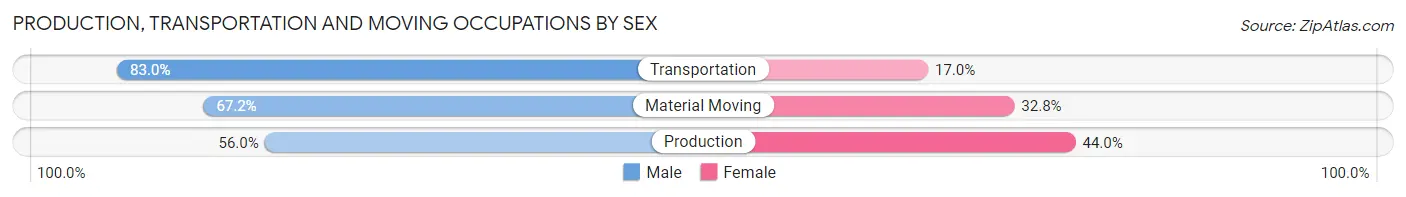
| Occupation | Male | Female |
| Production | 1,252 (56.0%) | 985 (44.0%) |
| Transportation | 2,457 (83.0%) | 502 (17.0%) |
| Material Moving | 1,910 (67.2%) | 933 (32.8%) |
| Total (Category) | 5,619 (69.9%) | 2,420 (30.1%) |
| Total (Overall) | 27,401 (51.3%) | 26,039 (48.7%) |
Employment Industries by Sex in Inglewood
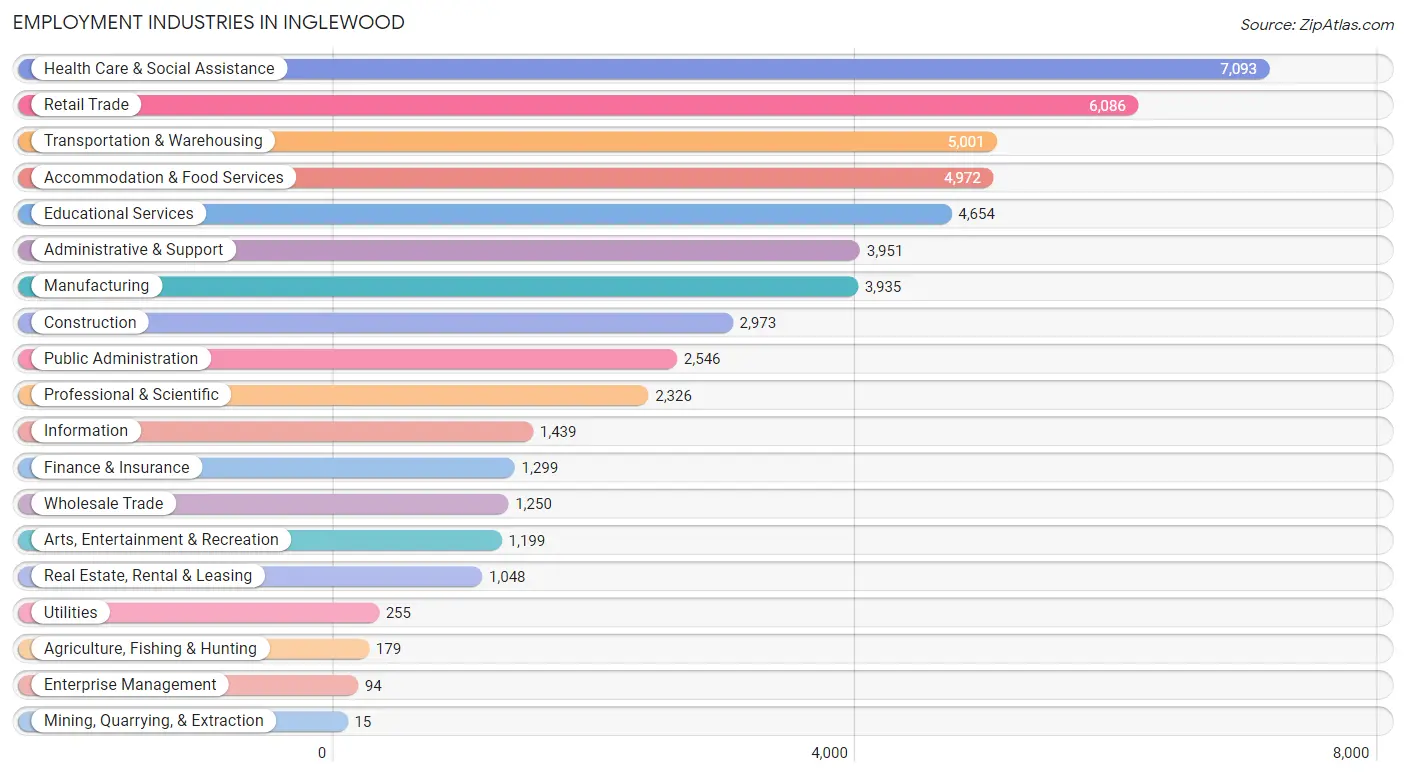
Employment Industries in Inglewood
The major employment industries in Inglewood include Health Care & Social Assistance (7,093 | 13.3%), Retail Trade (6,086 | 11.4%), Transportation & Warehousing (5,001 | 9.4%), Accommodation & Food Services (4,972 | 9.3%), and Educational Services (4,654 | 8.7%).
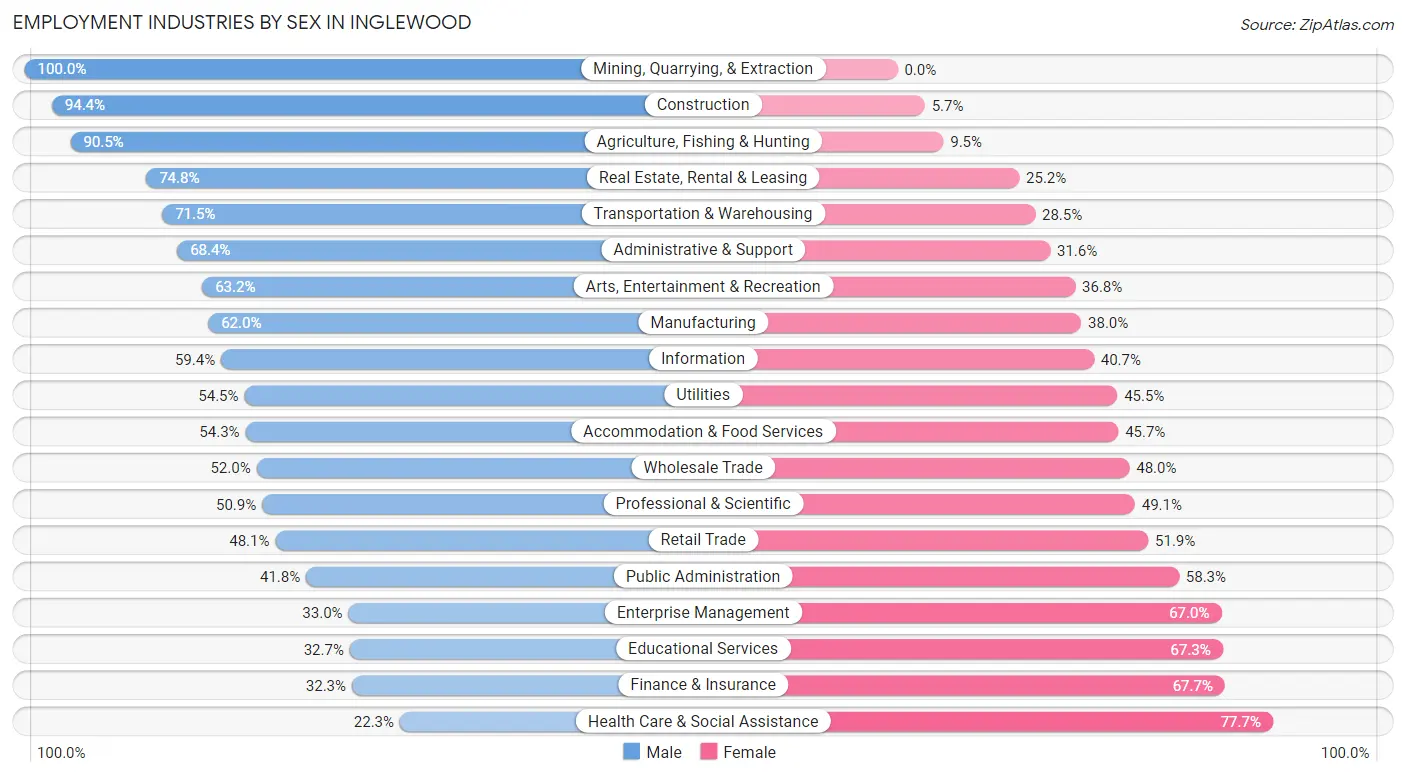
Employment Industries by Sex in Inglewood
The Inglewood industries that see more men than women are Mining, Quarrying, & Extraction (100.0%), Construction (94.4%), and Agriculture, Fishing & Hunting (90.5%), whereas the industries that tend to have a higher number of women are Health Care & Social Assistance (77.7%), Finance & Insurance (67.7%), and Educational Services (67.3%).
| Industry | Male | Female |
| Agriculture, Fishing & Hunting | 162 (90.5%) | 17 (9.5%) |
| Mining, Quarrying, & Extraction | 15 (100.0%) | 0 (0.0%) |
| Construction | 2,805 (94.4%) | 168 (5.7%) |
| Manufacturing | 2,439 (62.0%) | 1,496 (38.0%) |
| Wholesale Trade | 650 (52.0%) | 600 (48.0%) |
| Retail Trade | 2,928 (48.1%) | 3,158 (51.9%) |
| Transportation & Warehousing | 3,576 (71.5%) | 1,425 (28.5%) |
| Utilities | 139 (54.5%) | 116 (45.5%) |
| Information | 854 (59.4%) | 585 (40.6%) |
| Finance & Insurance | 419 (32.3%) | 880 (67.7%) |
| Real Estate, Rental & Leasing | 784 (74.8%) | 264 (25.2%) |
| Professional & Scientific | 1,183 (50.9%) | 1,143 (49.1%) |
| Enterprise Management | 31 (33.0%) | 63 (67.0%) |
| Administrative & Support | 2,703 (68.4%) | 1,248 (31.6%) |
| Educational Services | 1,522 (32.7%) | 3,132 (67.3%) |
| Health Care & Social Assistance | 1,583 (22.3%) | 5,510 (77.7%) |
| Arts, Entertainment & Recreation | 758 (63.2%) | 441 (36.8%) |
| Accommodation & Food Services | 2,700 (54.3%) | 2,272 (45.7%) |
| Public Administration | 1,063 (41.7%) | 1,483 (58.3%) |
| Total | 27,401 (51.3%) | 26,039 (48.7%) |
Education in Inglewood
School Enrollment in Inglewood
The most common levels of schooling among the 25,649 students in Inglewood are college / undergraduate (6,465 | 25.2%), high school (6,062 | 23.6%), and elementary school (4,907 | 19.1%).
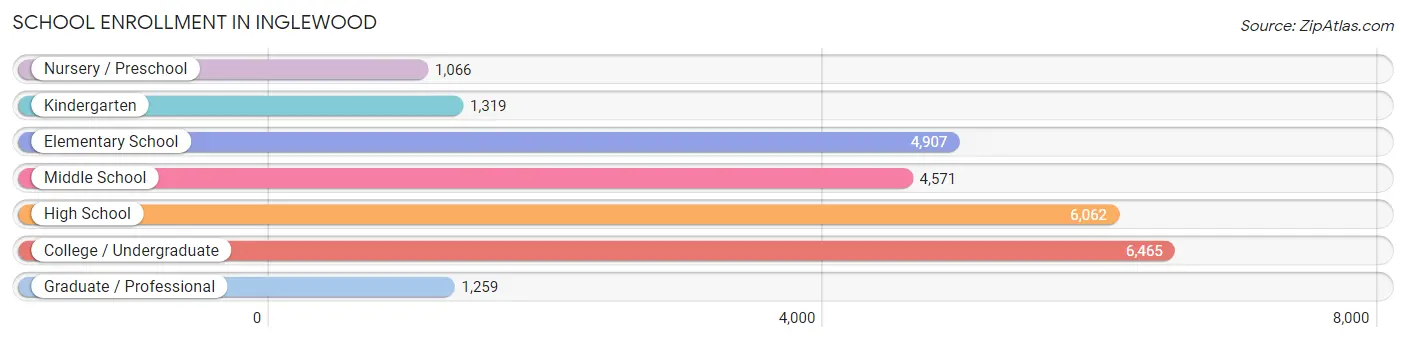
| School Level | # Students | % Students |
| Nursery / Preschool | 1,066 | 4.2% |
| Kindergarten | 1,319 | 5.1% |
| Elementary School | 4,907 | 19.1% |
| Middle School | 4,571 | 17.8% |
| High School | 6,062 | 23.6% |
| College / Undergraduate | 6,465 | 25.2% |
| Graduate / Professional | 1,259 | 4.9% |
| Total | 25,649 | 100.0% |
School Enrollment by Age by Funding Source in Inglewood
Out of a total of 25,649 students who are enrolled in schools in Inglewood, 3,232 (12.6%) attend a private institution, while the remaining 22,417 (87.4%) are enrolled in public schools. The age group of 35 years and over has the highest likelihood of being enrolled in private schools, with 596 (32.7% in the age bracket) enrolled. Conversely, the age group of 15 to 17 year olds has the lowest likelihood of being enrolled in a private school, with 3,440 (93.1% in the age bracket) attending a public institution.
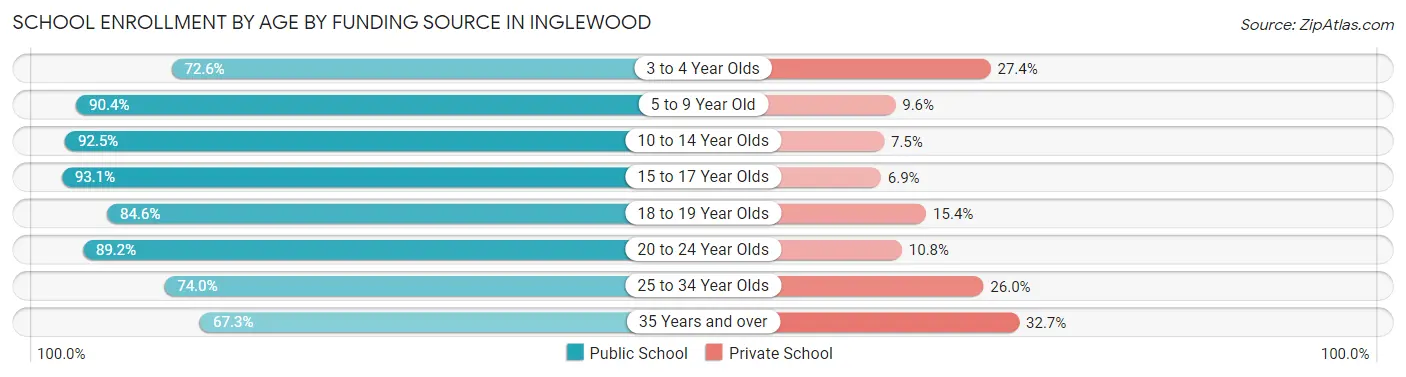
| Age Bracket | Public School | Private School |
| 3 to 4 Year Olds | 600 (72.6%) | 226 (27.4%) |
| 5 to 9 Year Old | 5,359 (90.4%) | 570 (9.6%) |
| 10 to 14 Year Olds | 5,904 (92.5%) | 480 (7.5%) |
| 15 to 17 Year Olds | 3,440 (93.1%) | 256 (6.9%) |
| 18 to 19 Year Olds | 1,582 (84.6%) | 287 (15.4%) |
| 20 to 24 Year Olds | 3,011 (89.2%) | 366 (10.8%) |
| 25 to 34 Year Olds | 1,290 (74.0%) | 454 (26.0%) |
| 35 Years and over | 1,228 (67.3%) | 596 (32.7%) |
| Total | 22,417 (87.4%) | 3,232 (12.6%) |
Educational Attainment by Field of Study in Inglewood
Business (3,844 | 21.2%), social sciences (2,216 | 12.2%), education (1,763 | 9.7%), communications (1,526 | 8.4%), and visual & performing arts (1,394 | 7.7%) are the most common fields of study among 18,154 individuals in Inglewood who have obtained a bachelor's degree or higher.
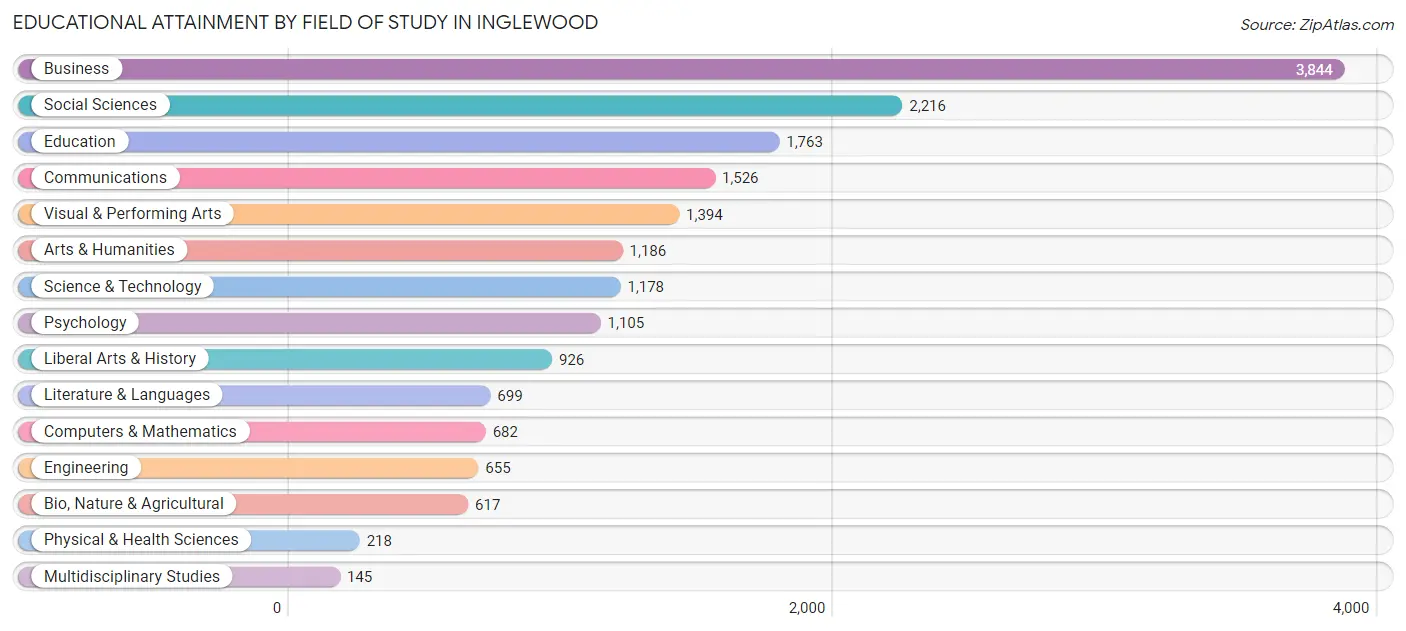
| Field of Study | # Graduates | % Graduates |
| Computers & Mathematics | 682 | 3.8% |
| Bio, Nature & Agricultural | 617 | 3.4% |
| Physical & Health Sciences | 218 | 1.2% |
| Psychology | 1,105 | 6.1% |
| Social Sciences | 2,216 | 12.2% |
| Engineering | 655 | 3.6% |
| Multidisciplinary Studies | 145 | 0.8% |
| Science & Technology | 1,178 | 6.5% |
| Business | 3,844 | 21.2% |
| Education | 1,763 | 9.7% |
| Literature & Languages | 699 | 3.8% |
| Liberal Arts & History | 926 | 5.1% |
| Visual & Performing Arts | 1,394 | 7.7% |
| Communications | 1,526 | 8.4% |
| Arts & Humanities | 1,186 | 6.5% |
| Total | 18,154 | 100.0% |
Transportation & Commute in Inglewood
Vehicle Availability by Sex in Inglewood
The most prevalent vehicle ownership categories in Inglewood are males with 2 vehicles (9,663, accounting for 36.6%) and females with 2 vehicles (9,636, making up 38.8%).
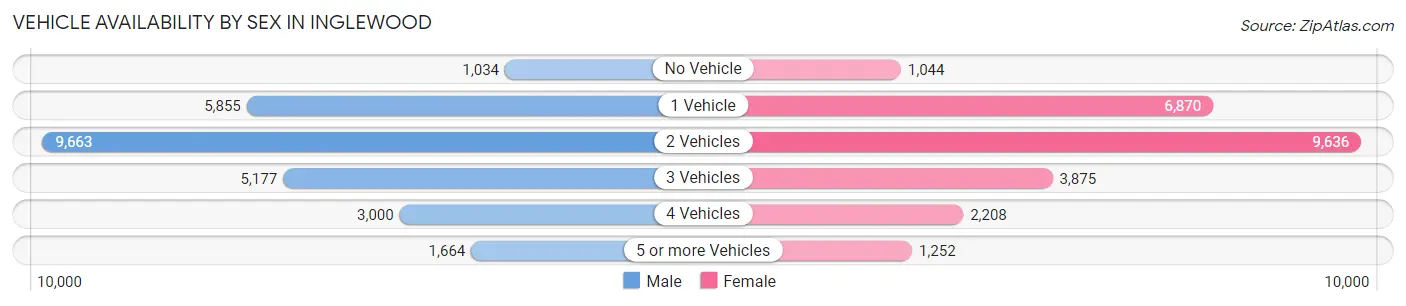
| Vehicles Available | Male | Female |
| No Vehicle | 1,034 (3.9%) | 1,044 (4.2%) |
| 1 Vehicle | 5,855 (22.2%) | 6,870 (27.6%) |
| 2 Vehicles | 9,663 (36.6%) | 9,636 (38.7%) |
| 3 Vehicles | 5,177 (19.6%) | 3,875 (15.6%) |
| 4 Vehicles | 3,000 (11.4%) | 2,208 (8.9%) |
| 5 or more Vehicles | 1,664 (6.3%) | 1,252 (5.0%) |
| Total | 26,393 (100.0%) | 24,885 (100.0%) |
Commute Time in Inglewood
The most frequently occuring commute durations in Inglewood are 30 to 34 minutes (7,614 commuters, 16.2%), 15 to 19 minutes (6,220 commuters, 13.2%), and 20 to 24 minutes (5,981 commuters, 12.7%).
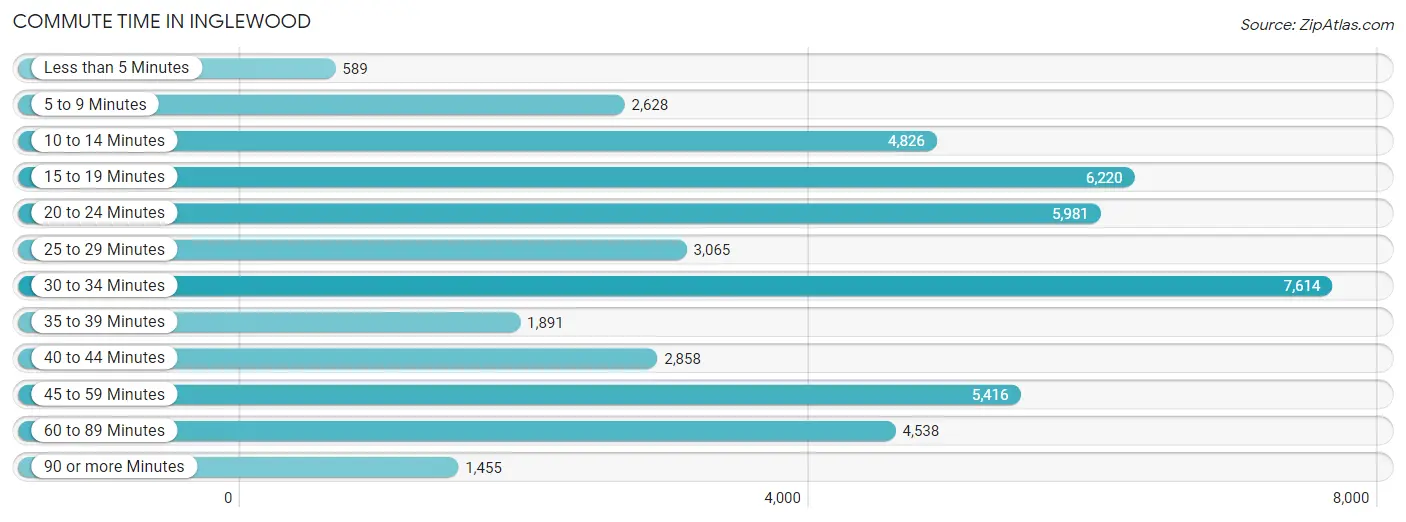
| Commute Time | # Commuters | % Commuters |
| Less than 5 Minutes | 589 | 1.3% |
| 5 to 9 Minutes | 2,628 | 5.6% |
| 10 to 14 Minutes | 4,826 | 10.2% |
| 15 to 19 Minutes | 6,220 | 13.2% |
| 20 to 24 Minutes | 5,981 | 12.7% |
| 25 to 29 Minutes | 3,065 | 6.5% |
| 30 to 34 Minutes | 7,614 | 16.2% |
| 35 to 39 Minutes | 1,891 | 4.0% |
| 40 to 44 Minutes | 2,858 | 6.1% |
| 45 to 59 Minutes | 5,416 | 11.5% |
| 60 to 89 Minutes | 4,538 | 9.6% |
| 90 or more Minutes | 1,455 | 3.1% |
Commute Time by Sex in Inglewood
The most common commute times in Inglewood are 30 to 34 minutes (4,203 commuters, 16.8%) for males and 30 to 34 minutes (3,411 commuters, 15.5%) for females.
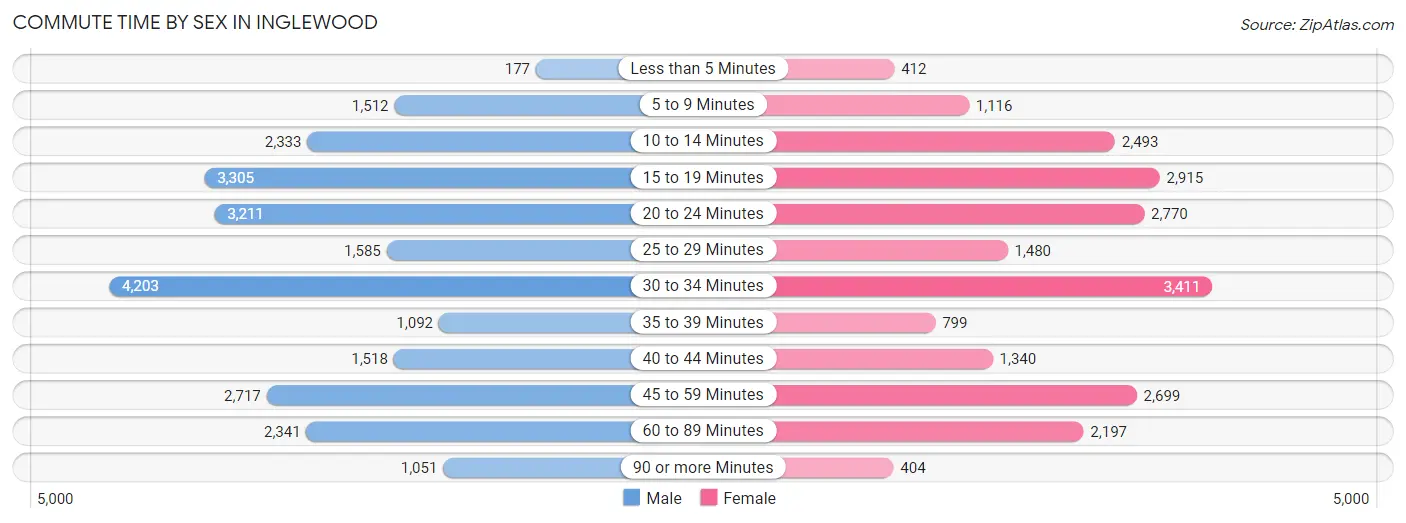
| Commute Time | Male | Female |
| Less than 5 Minutes | 177 (0.7%) | 412 (1.9%) |
| 5 to 9 Minutes | 1,512 (6.0%) | 1,116 (5.1%) |
| 10 to 14 Minutes | 2,333 (9.3%) | 2,493 (11.3%) |
| 15 to 19 Minutes | 3,305 (13.2%) | 2,915 (13.2%) |
| 20 to 24 Minutes | 3,211 (12.8%) | 2,770 (12.6%) |
| 25 to 29 Minutes | 1,585 (6.3%) | 1,480 (6.7%) |
| 30 to 34 Minutes | 4,203 (16.8%) | 3,411 (15.5%) |
| 35 to 39 Minutes | 1,092 (4.4%) | 799 (3.6%) |
| 40 to 44 Minutes | 1,518 (6.1%) | 1,340 (6.1%) |
| 45 to 59 Minutes | 2,717 (10.8%) | 2,699 (12.2%) |
| 60 to 89 Minutes | 2,341 (9.3%) | 2,197 (10.0%) |
| 90 or more Minutes | 1,051 (4.2%) | 404 (1.8%) |
Time of Departure to Work by Sex in Inglewood
The most frequent times of departure to work in Inglewood are 6:00 AM to 6:29 AM (3,105, 12.4%) for males and 7:00 AM to 7:29 AM (3,297, 15.0%) for females.
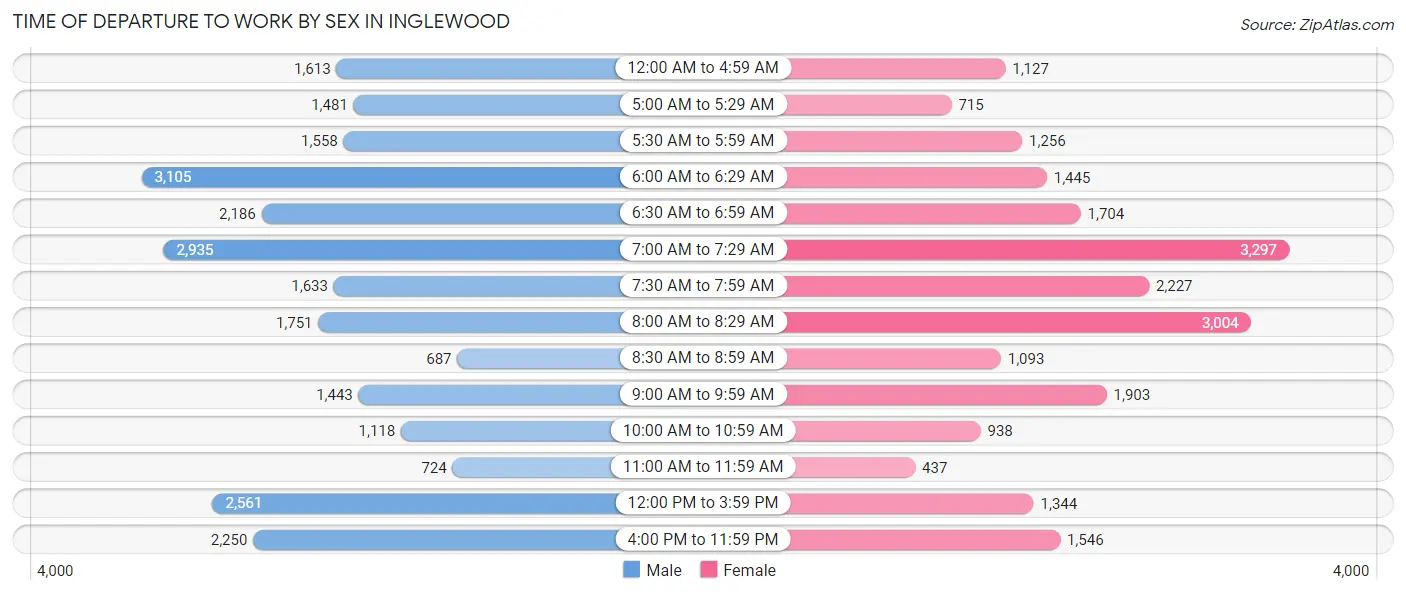
| Time of Departure | Male | Female |
| 12:00 AM to 4:59 AM | 1,613 (6.4%) | 1,127 (5.1%) |
| 5:00 AM to 5:29 AM | 1,481 (5.9%) | 715 (3.2%) |
| 5:30 AM to 5:59 AM | 1,558 (6.2%) | 1,256 (5.7%) |
| 6:00 AM to 6:29 AM | 3,105 (12.4%) | 1,445 (6.6%) |
| 6:30 AM to 6:59 AM | 2,186 (8.7%) | 1,704 (7.7%) |
| 7:00 AM to 7:29 AM | 2,935 (11.7%) | 3,297 (15.0%) |
| 7:30 AM to 7:59 AM | 1,633 (6.5%) | 2,227 (10.1%) |
| 8:00 AM to 8:29 AM | 1,751 (7.0%) | 3,004 (13.6%) |
| 8:30 AM to 8:59 AM | 687 (2.7%) | 1,093 (5.0%) |
| 9:00 AM to 9:59 AM | 1,443 (5.8%) | 1,903 (8.6%) |
| 10:00 AM to 10:59 AM | 1,118 (4.5%) | 938 (4.3%) |
| 11:00 AM to 11:59 AM | 724 (2.9%) | 437 (2.0%) |
| 12:00 PM to 3:59 PM | 2,561 (10.2%) | 1,344 (6.1%) |
| 4:00 PM to 11:59 PM | 2,250 (9.0%) | 1,546 (7.0%) |
| Total | 25,045 (100.0%) | 22,036 (100.0%) |
Housing Occupancy in Inglewood
Occupancy by Ownership in Inglewood
Of the total 35,773 dwellings in Inglewood, owner-occupied units account for 12,717 (35.5%), while renter-occupied units make up 23,056 (64.4%).
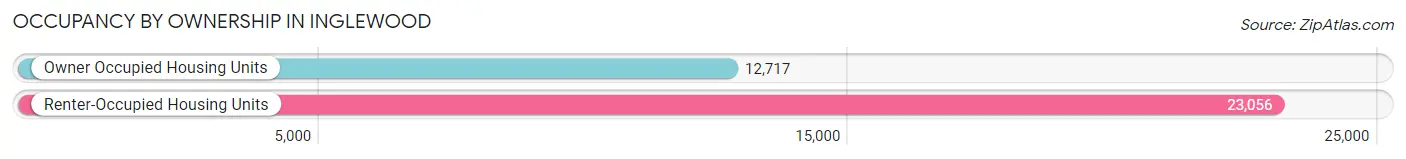
| Occupancy | # Housing Units | % Housing Units |
| Owner Occupied Housing Units | 12,717 | 35.5% |
| Renter-Occupied Housing Units | 23,056 | 64.4% |
| Total Occupied Housing Units | 35,773 | 100.0% |
Occupancy by Household Size in Inglewood
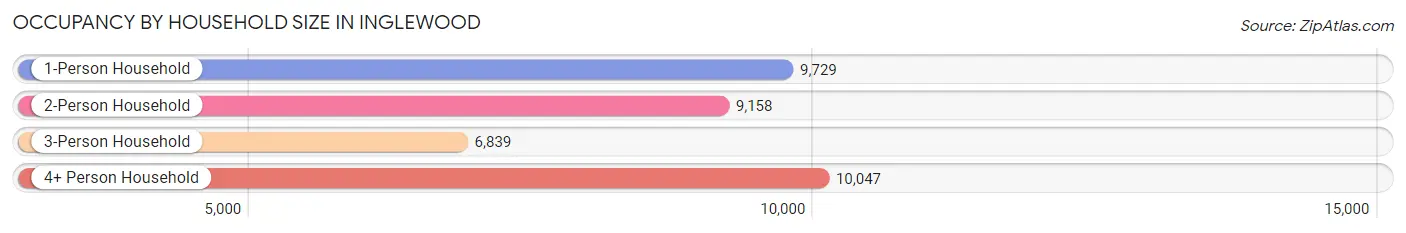
| Household Size | # Housing Units | % Housing Units |
| 1-Person Household | 9,729 | 27.2% |
| 2-Person Household | 9,158 | 25.6% |
| 3-Person Household | 6,839 | 19.1% |
| 4+ Person Household | 10,047 | 28.1% |
| Total Housing Units | 35,773 | 100.0% |
Occupancy by Ownership by Household Size in Inglewood
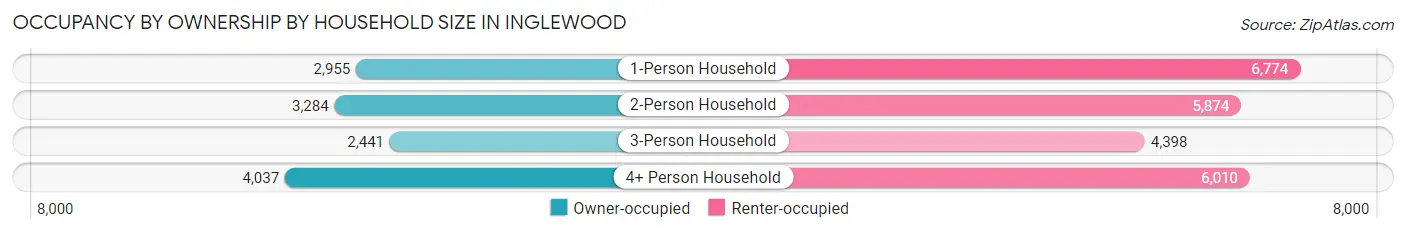
| Household Size | Owner-occupied | Renter-occupied |
| 1-Person Household | 2,955 (30.4%) | 6,774 (69.6%) |
| 2-Person Household | 3,284 (35.9%) | 5,874 (64.1%) |
| 3-Person Household | 2,441 (35.7%) | 4,398 (64.3%) |
| 4+ Person Household | 4,037 (40.2%) | 6,010 (59.8%) |
| Total Housing Units | 12,717 (35.5%) | 23,056 (64.4%) |
Occupancy by Educational Attainment in Inglewood
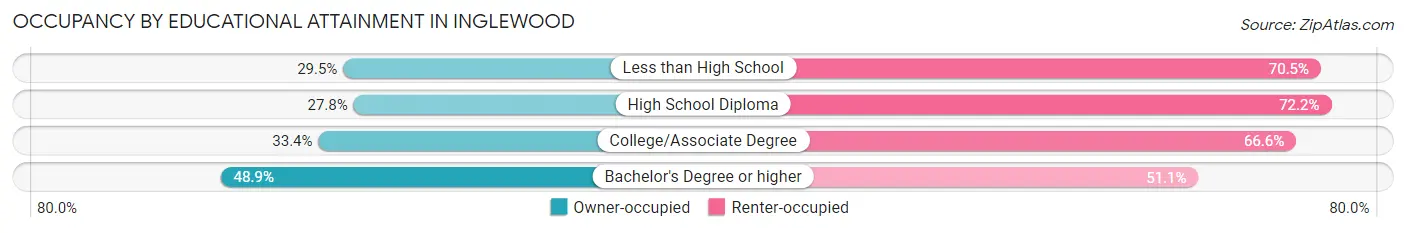
| Household Size | Owner-occupied | Renter-occupied |
| Less than High School | 1,940 (29.5%) | 4,644 (70.5%) |
| High School Diploma | 2,105 (27.8%) | 5,458 (72.2%) |
| College/Associate Degree | 4,106 (33.4%) | 8,184 (66.6%) |
| Bachelor's Degree or higher | 4,566 (48.9%) | 4,770 (51.1%) |
Occupancy by Age of Householder in Inglewood
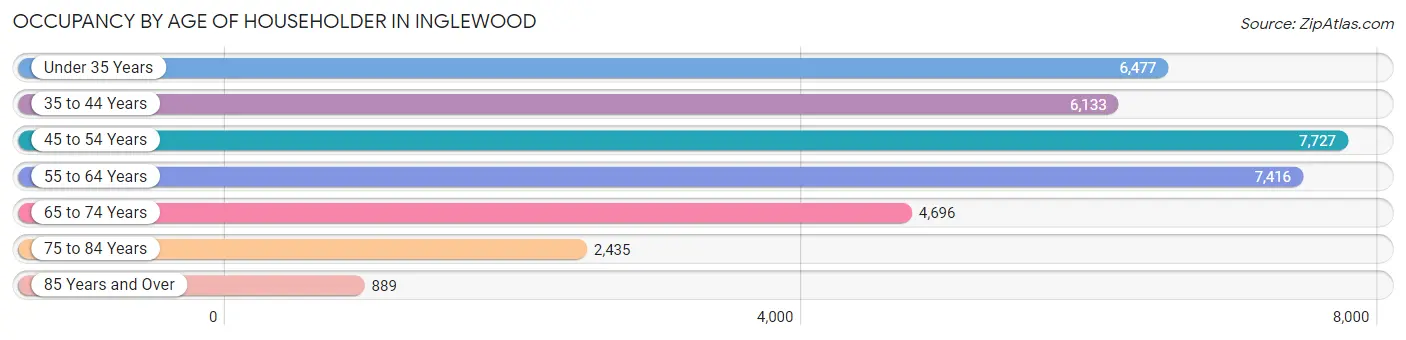
| Age Bracket | # Households | % Households |
| Under 35 Years | 6,477 | 18.1% |
| 35 to 44 Years | 6,133 | 17.1% |
| 45 to 54 Years | 7,727 | 21.6% |
| 55 to 64 Years | 7,416 | 20.7% |
| 65 to 74 Years | 4,696 | 13.1% |
| 75 to 84 Years | 2,435 | 6.8% |
| 85 Years and Over | 889 | 2.5% |
| Total | 35,773 | 100.0% |
Housing Finances in Inglewood
Median Income by Occupancy in Inglewood
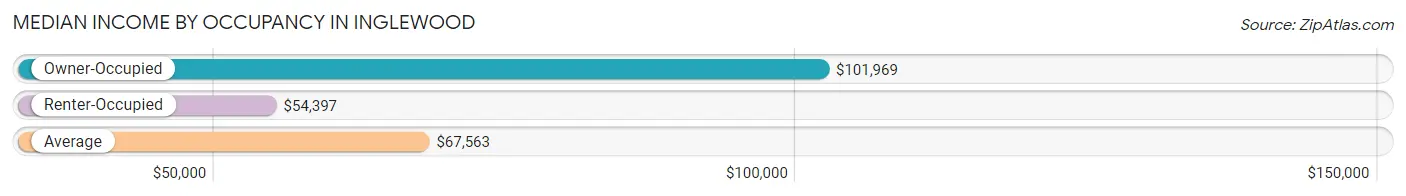
| Occupancy Type | # Households | Median Income |
| Owner-Occupied | 12,717 (35.5%) | $101,969 |
| Renter-Occupied | 23,056 (64.4%) | $54,397 |
| Average | 35,773 (100.0%) | $67,563 |
Occupancy by Householder Income Bracket in Inglewood
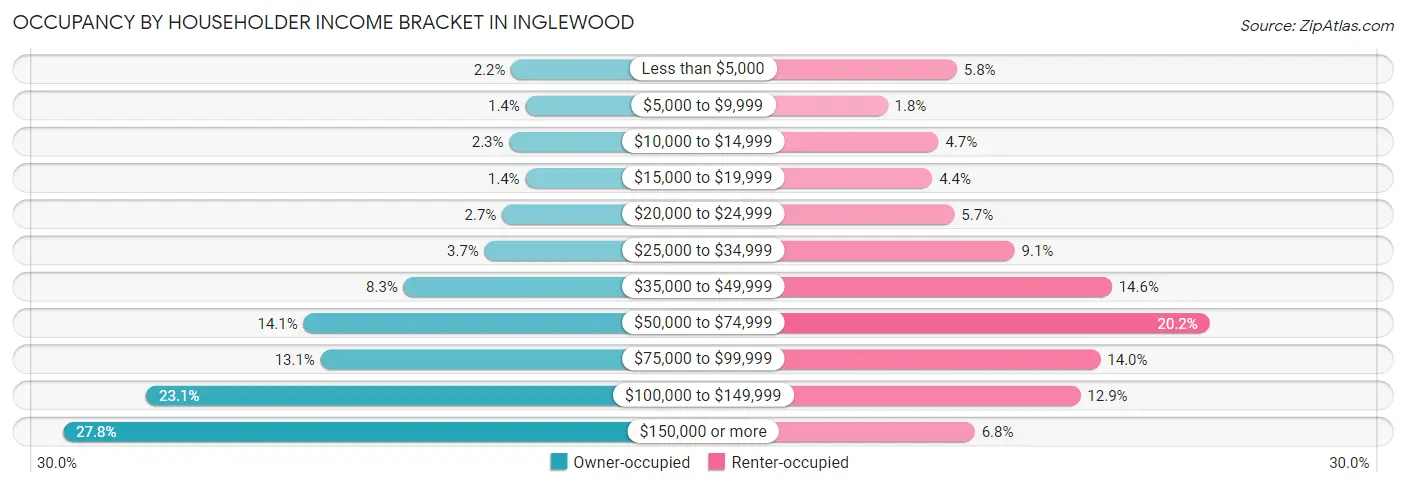
| Income Bracket | Owner-occupied | Renter-occupied |
| Less than $5,000 | 279 (2.2%) | 1,335 (5.8%) |
| $5,000 to $9,999 | 174 (1.4%) | 421 (1.8%) |
| $10,000 to $14,999 | 292 (2.3%) | 1,094 (4.7%) |
| $15,000 to $19,999 | 176 (1.4%) | 1,009 (4.4%) |
| $20,000 to $24,999 | 344 (2.7%) | 1,303 (5.7%) |
| $25,000 to $34,999 | 472 (3.7%) | 2,096 (9.1%) |
| $35,000 to $49,999 | 1,060 (8.3%) | 3,375 (14.6%) |
| $50,000 to $74,999 | 1,788 (14.1%) | 4,665 (20.2%) |
| $75,000 to $99,999 | 1,664 (13.1%) | 3,225 (14.0%) |
| $100,000 to $149,999 | 2,933 (23.1%) | 2,963 (12.9%) |
| $150,000 or more | 3,535 (27.8%) | 1,570 (6.8%) |
| Total | 12,717 (100.0%) | 23,056 (100.0%) |
Monthly Housing Cost Tiers in Inglewood
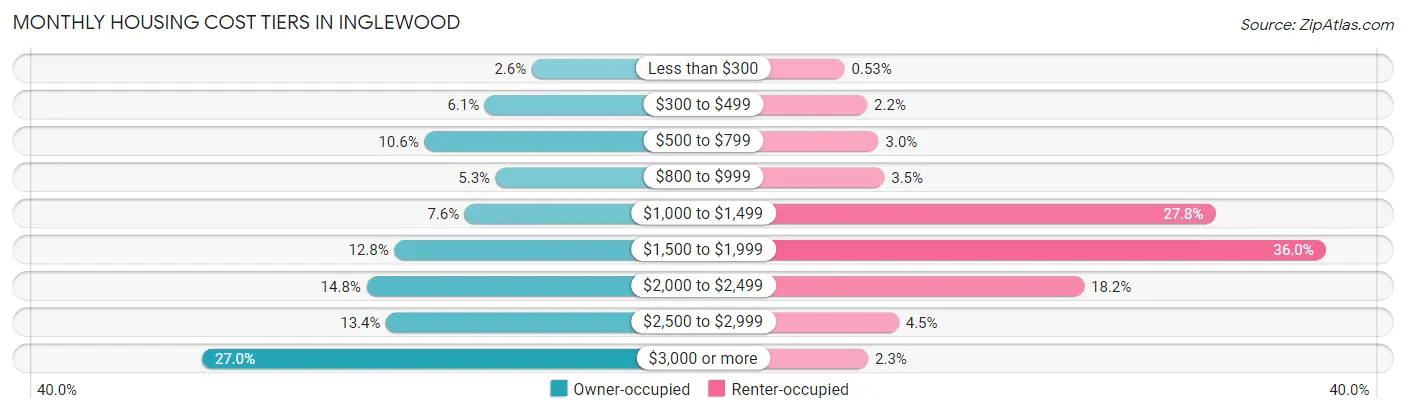
| Monthly Cost | Owner-occupied | Renter-occupied |
| Less than $300 | 334 (2.6%) | 122 (0.5%) |
| $300 to $499 | 774 (6.1%) | 505 (2.2%) |
| $500 to $799 | 1,342 (10.5%) | 699 (3.0%) |
| $800 to $999 | 673 (5.3%) | 795 (3.5%) |
| $1,000 to $1,499 | 961 (7.6%) | 6,416 (27.8%) |
| $1,500 to $1,999 | 1,623 (12.8%) | 8,289 (35.9%) |
| $2,000 to $2,499 | 1,884 (14.8%) | 4,189 (18.2%) |
| $2,500 to $2,999 | 1,699 (13.4%) | 1,042 (4.5%) |
| $3,000 or more | 3,427 (27.0%) | 521 (2.3%) |
| Total | 12,717 (100.0%) | 23,056 (100.0%) |
Physical Housing Characteristics in Inglewood
Housing Structures in Inglewood
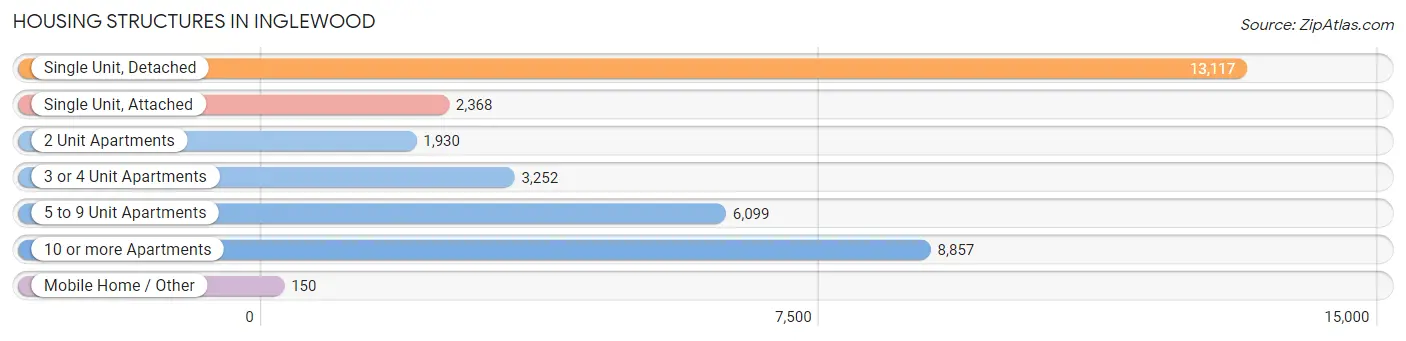
| Structure Type | # Housing Units | % Housing Units |
| Single Unit, Detached | 13,117 | 36.7% |
| Single Unit, Attached | 2,368 | 6.6% |
| 2 Unit Apartments | 1,930 | 5.4% |
| 3 or 4 Unit Apartments | 3,252 | 9.1% |
| 5 to 9 Unit Apartments | 6,099 | 17.1% |
| 10 or more Apartments | 8,857 | 24.8% |
| Mobile Home / Other | 150 | 0.4% |
| Total | 35,773 | 100.0% |
Housing Structures by Occupancy in Inglewood
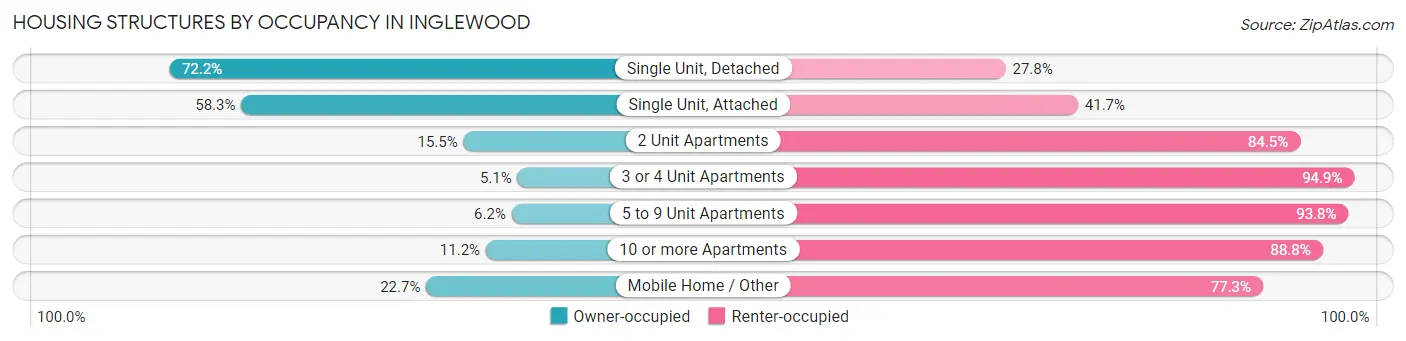
| Structure Type | Owner-occupied | Renter-occupied |
| Single Unit, Detached | 9,470 (72.2%) | 3,647 (27.8%) |
| Single Unit, Attached | 1,380 (58.3%) | 988 (41.7%) |
| 2 Unit Apartments | 299 (15.5%) | 1,631 (84.5%) |
| 3 or 4 Unit Apartments | 165 (5.1%) | 3,087 (94.9%) |
| 5 to 9 Unit Apartments | 379 (6.2%) | 5,720 (93.8%) |
| 10 or more Apartments | 990 (11.2%) | 7,867 (88.8%) |
| Mobile Home / Other | 34 (22.7%) | 116 (77.3%) |
| Total | 12,717 (35.5%) | 23,056 (64.4%) |
Housing Structures by Number of Rooms in Inglewood
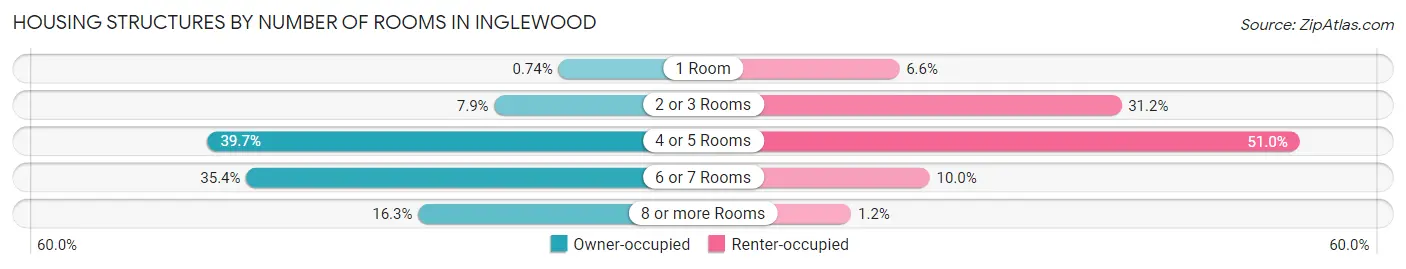
| Number of Rooms | Owner-occupied | Renter-occupied |
| 1 Room | 94 (0.7%) | 1,516 (6.6%) |
| 2 or 3 Rooms | 999 (7.9%) | 7,198 (31.2%) |
| 4 or 5 Rooms | 5,049 (39.7%) | 11,764 (51.0%) |
| 6 or 7 Rooms | 4,501 (35.4%) | 2,293 (10.0%) |
| 8 or more Rooms | 2,074 (16.3%) | 285 (1.2%) |
| Total | 12,717 (100.0%) | 23,056 (100.0%) |
Housing Structure by Heating Type in Inglewood
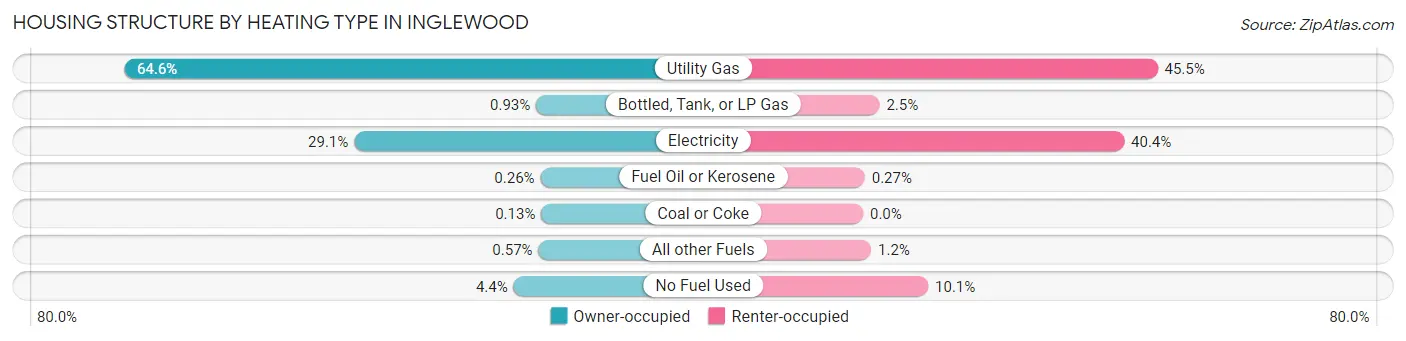
| Heating Type | Owner-occupied | Renter-occupied |
| Utility Gas | 8,220 (64.6%) | 10,498 (45.5%) |
| Bottled, Tank, or LP Gas | 118 (0.9%) | 585 (2.5%) |
| Electricity | 3,695 (29.1%) | 9,305 (40.4%) |
| Fuel Oil or Kerosene | 33 (0.3%) | 62 (0.3%) |
| Coal or Coke | 16 (0.1%) | 0 (0.0%) |
| All other Fuels | 73 (0.6%) | 286 (1.2%) |
| No Fuel Used | 562 (4.4%) | 2,320 (10.1%) |
| Total | 12,717 (100.0%) | 23,056 (100.0%) |
Household Vehicle Usage in Inglewood
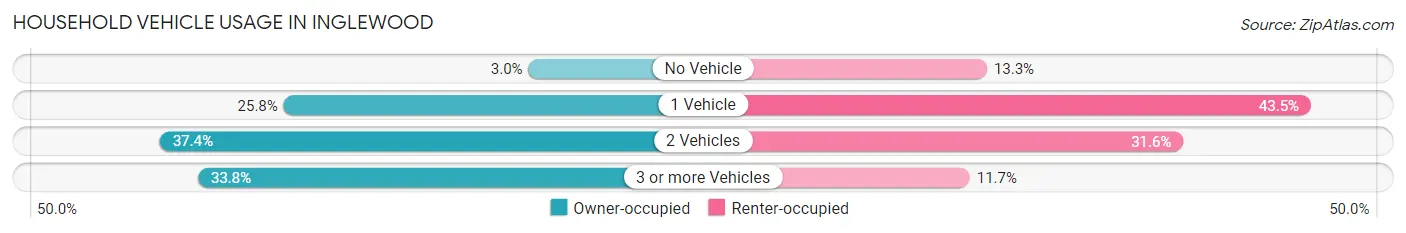
| Vehicles per Household | Owner-occupied | Renter-occupied |
| No Vehicle | 378 (3.0%) | 3,057 (13.3%) |
| 1 Vehicle | 3,283 (25.8%) | 10,029 (43.5%) |
| 2 Vehicles | 4,754 (37.4%) | 7,281 (31.6%) |
| 3 or more Vehicles | 4,302 (33.8%) | 2,689 (11.7%) |
| Total | 12,717 (100.0%) | 23,056 (100.0%) |
Real Estate & Mortgages in Inglewood
Real Estate and Mortgage Overview in Inglewood
| Characteristic | Without Mortgage | With Mortgage |
| Housing Units | 3,113 | 9,604 |
| Median Property Value | $707,400 | $685,500 |
| Median Household Income | $68,852 | $3,071 |
| Monthly Housing Costs | $628 | $3,427 |
| Real Estate Taxes | $3,324 | $97 |
Property Value by Mortgage Status in Inglewood
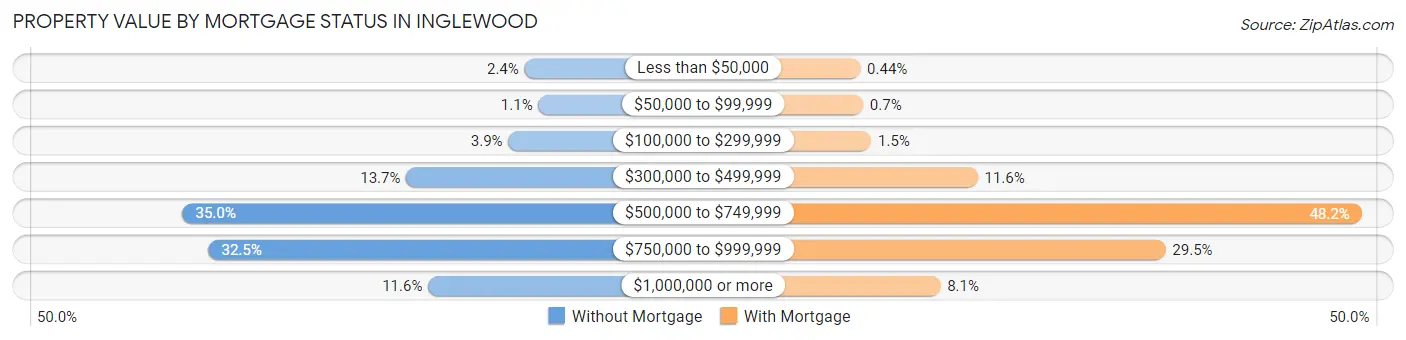
| Property Value | Without Mortgage | With Mortgage |
| Less than $50,000 | 74 (2.4%) | 42 (0.4%) |
| $50,000 to $99,999 | 33 (1.1%) | 67 (0.7%) |
| $100,000 to $299,999 | 122 (3.9%) | 142 (1.5%) |
| $300,000 to $499,999 | 425 (13.7%) | 1,116 (11.6%) |
| $500,000 to $749,999 | 1,088 (34.9%) | 4,629 (48.2%) |
| $750,000 to $999,999 | 1,011 (32.5%) | 2,834 (29.5%) |
| $1,000,000 or more | 360 (11.6%) | 774 (8.1%) |
| Total | 3,113 (100.0%) | 9,604 (100.0%) |
Household Income by Mortgage Status in Inglewood
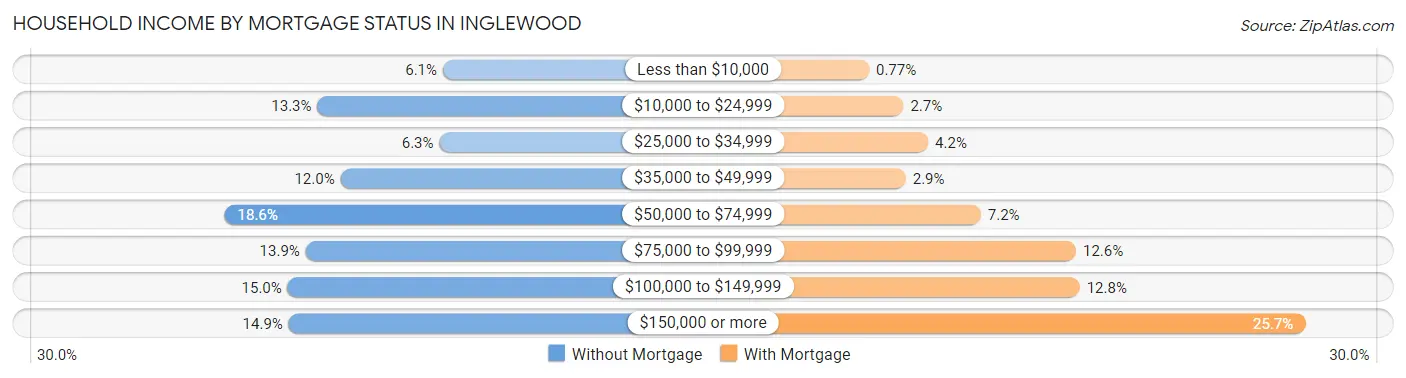
| Household Income | Without Mortgage | With Mortgage |
| Less than $10,000 | 190 (6.1%) | 74 (0.8%) |
| $10,000 to $24,999 | 413 (13.3%) | 263 (2.7%) |
| $25,000 to $34,999 | 196 (6.3%) | 399 (4.2%) |
| $35,000 to $49,999 | 372 (11.9%) | 276 (2.9%) |
| $50,000 to $74,999 | 578 (18.6%) | 688 (7.2%) |
| $75,000 to $99,999 | 434 (13.9%) | 1,210 (12.6%) |
| $100,000 to $149,999 | 466 (15.0%) | 1,230 (12.8%) |
| $150,000 or more | 464 (14.9%) | 2,467 (25.7%) |
| Total | 3,113 (100.0%) | 9,604 (100.0%) |
Property Value to Household Income Ratio in Inglewood
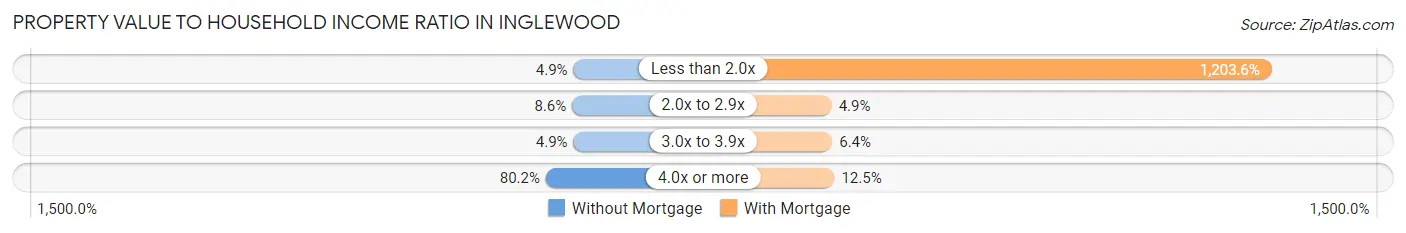
| Value-to-Income Ratio | Without Mortgage | With Mortgage |
| Less than 2.0x | 151 (4.9%) | 115,594 (1,203.6%) |
| 2.0x to 2.9x | 268 (8.6%) | 473 (4.9%) |
| 3.0x to 3.9x | 152 (4.9%) | 615 (6.4%) |
| 4.0x or more | 2,497 (80.2%) | 1,196 (12.4%) |
| Total | 3,113 (100.0%) | 9,604 (100.0%) |
Real Estate Taxes by Mortgage Status in Inglewood
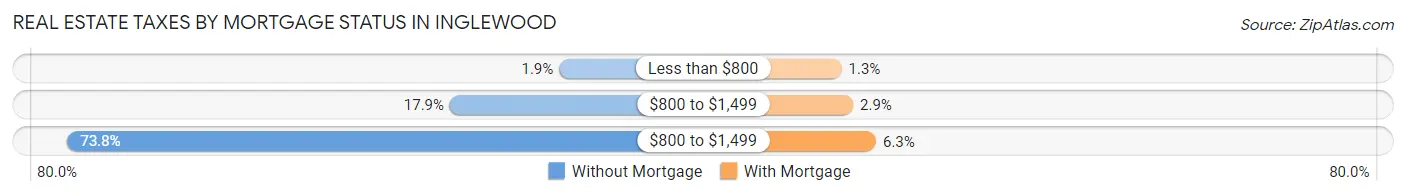
| Property Taxes | Without Mortgage | With Mortgage |
| Less than $800 | 59 (1.9%) | 120 (1.3%) |
| $800 to $1,499 | 556 (17.9%) | 281 (2.9%) |
| $800 to $1,499 | 2,296 (73.8%) | 603 (6.3%) |
| Total | 3,113 (100.0%) | 9,604 (100.0%) |
Health & Disability in Inglewood
Health Insurance Coverage by Age in Inglewood
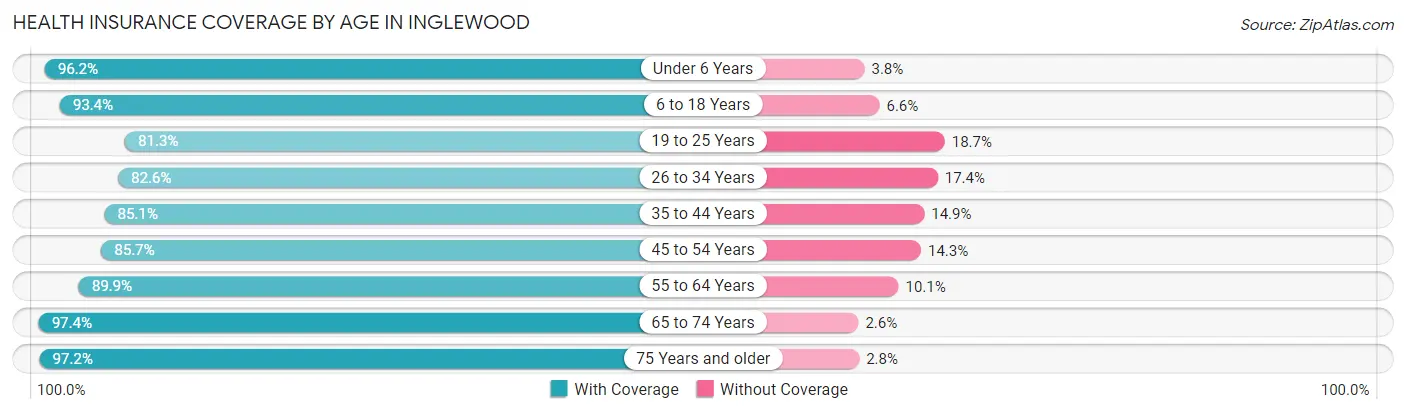
| Age Bracket | With Coverage | Without Coverage |
| Under 6 Years | 7,045 (96.2%) | 277 (3.8%) |
| 6 to 18 Years | 15,616 (93.4%) | 1,099 (6.6%) |
| 19 to 25 Years | 8,283 (81.3%) | 1,910 (18.7%) |
| 26 to 34 Years | 12,702 (82.6%) | 2,681 (17.4%) |
| 35 to 44 Years | 12,380 (85.1%) | 2,171 (14.9%) |
| 45 to 54 Years | 12,829 (85.7%) | 2,145 (14.3%) |
| 55 to 64 Years | 12,157 (89.9%) | 1,369 (10.1%) |
| 65 to 74 Years | 7,849 (97.4%) | 213 (2.6%) |
| 75 Years and older | 5,380 (97.2%) | 154 (2.8%) |
| Total | 94,241 (88.7%) | 12,019 (11.3%) |
Health Insurance Coverage by Citizenship Status in Inglewood
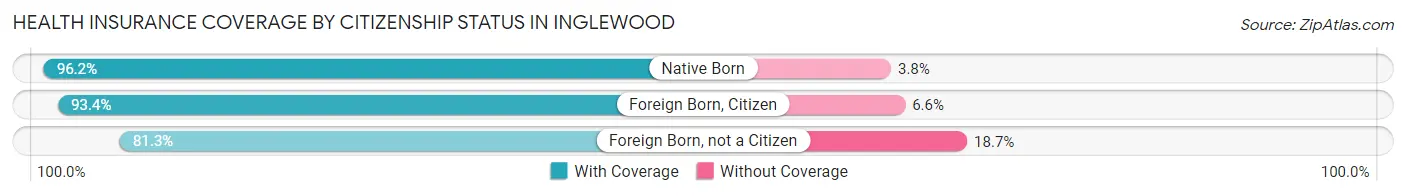
| Citizenship Status | With Coverage | Without Coverage |
| Native Born | 7,045 (96.2%) | 277 (3.8%) |
| Foreign Born, Citizen | 15,616 (93.4%) | 1,099 (6.6%) |
| Foreign Born, not a Citizen | 8,283 (81.3%) | 1,910 (18.7%) |
Health Insurance Coverage by Household Income in Inglewood
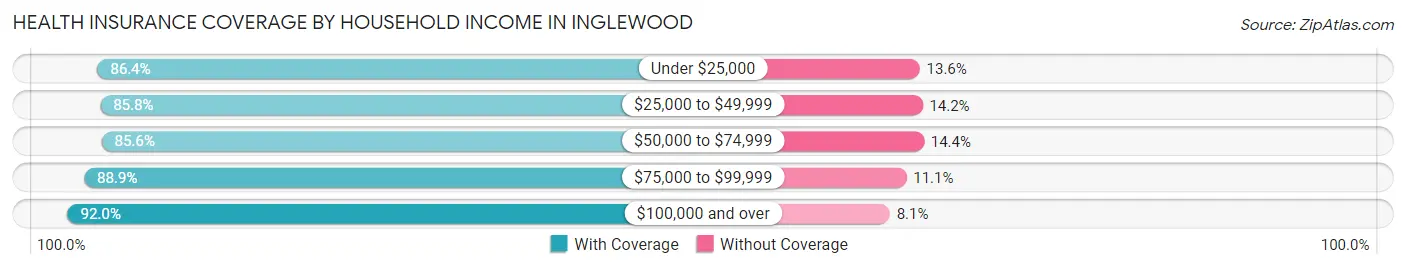
| Household Income | With Coverage | Without Coverage |
| Under $25,000 | 10,704 (86.4%) | 1,691 (13.6%) |
| $25,000 to $49,999 | 15,604 (85.8%) | 2,576 (14.2%) |
| $50,000 to $74,999 | 16,041 (85.6%) | 2,703 (14.4%) |
| $75,000 to $99,999 | 12,902 (88.9%) | 1,617 (11.1%) |
| $100,000 and over | 36,789 (91.9%) | 3,220 (8.1%) |
Public vs Private Health Insurance Coverage by Age in Inglewood
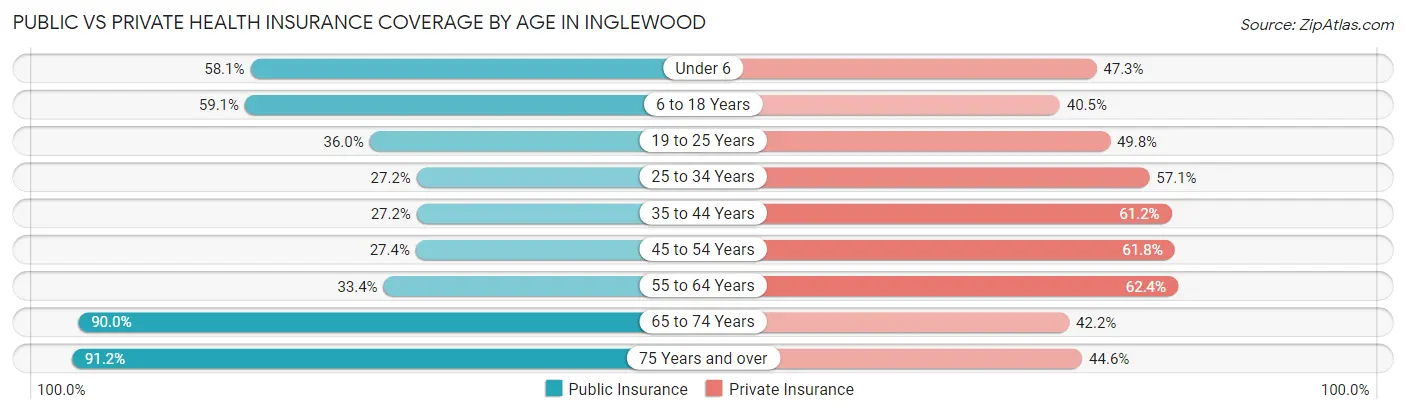
| Age Bracket | Public Insurance | Private Insurance |
| Under 6 | 4,254 (58.1%) | 3,460 (47.2%) |
| 6 to 18 Years | 9,882 (59.1%) | 6,765 (40.5%) |
| 19 to 25 Years | 3,666 (36.0%) | 5,073 (49.8%) |
| 25 to 34 Years | 4,189 (27.2%) | 8,784 (57.1%) |
| 35 to 44 Years | 3,961 (27.2%) | 8,903 (61.2%) |
| 45 to 54 Years | 4,103 (27.4%) | 9,247 (61.8%) |
| 55 to 64 Years | 4,517 (33.4%) | 8,436 (62.4%) |
| 65 to 74 Years | 7,259 (90.0%) | 3,402 (42.2%) |
| 75 Years and over | 5,048 (91.2%) | 2,469 (44.6%) |
| Total | 46,879 (44.1%) | 56,539 (53.2%) |
Disability Status by Sex by Age in Inglewood
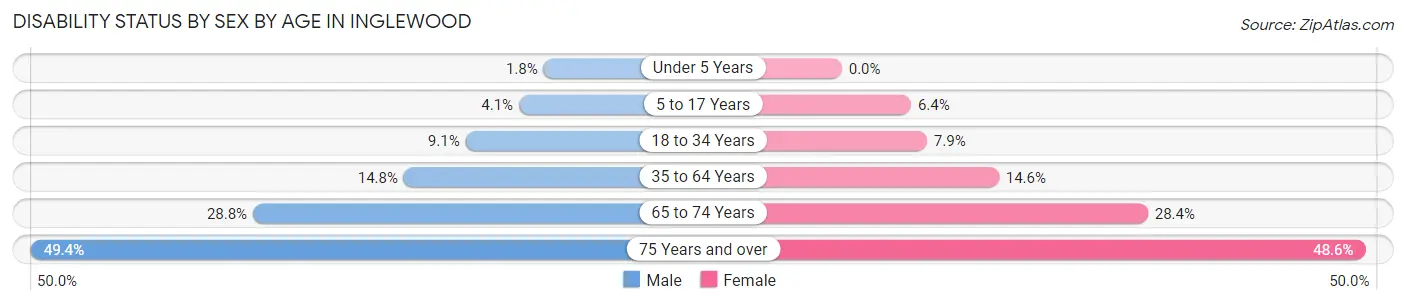
| Age Bracket | Male | Female |
| Under 5 Years | 56 (1.8%) | 0 (0.0%) |
| 5 to 17 Years | 348 (4.1%) | 540 (6.4%) |
| 18 to 34 Years | 1,240 (9.1%) | 1,045 (7.9%) |
| 35 to 64 Years | 3,167 (14.8%) | 3,156 (14.6%) |
| 65 to 74 Years | 1,018 (28.8%) | 1,286 (28.4%) |
| 75 Years and over | 1,101 (49.4%) | 1,606 (48.6%) |
Disability Class by Sex by Age in Inglewood
Disability Class: Hearing Difficulty
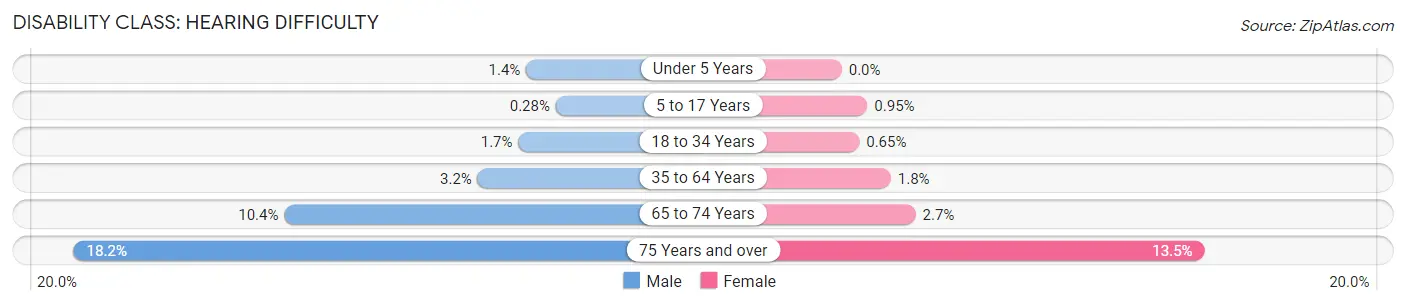
| Age Bracket | Male | Female |
| Under 5 Years | 42 (1.4%) | 0 (0.0%) |
| 5 to 17 Years | 24 (0.3%) | 80 (0.9%) |
| 18 to 34 Years | 228 (1.7%) | 86 (0.6%) |
| 35 to 64 Years | 681 (3.2%) | 394 (1.8%) |
| 65 to 74 Years | 366 (10.4%) | 124 (2.7%) |
| 75 Years and over | 405 (18.2%) | 445 (13.5%) |
Disability Class: Vision Difficulty
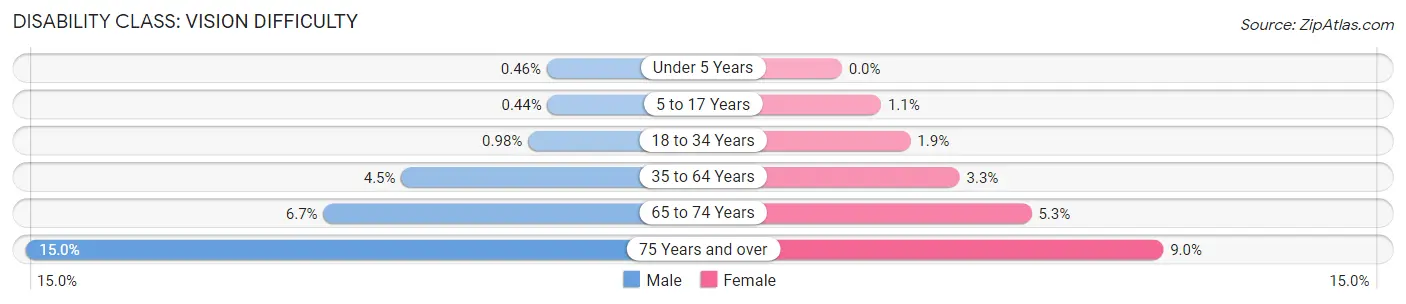
| Age Bracket | Male | Female |
| Under 5 Years | 14 (0.5%) | 0 (0.0%) |
| 5 to 17 Years | 37 (0.4%) | 92 (1.1%) |
| 18 to 34 Years | 134 (1.0%) | 253 (1.9%) |
| 35 to 64 Years | 965 (4.5%) | 711 (3.3%) |
| 65 to 74 Years | 236 (6.7%) | 239 (5.3%) |
| 75 Years and over | 333 (14.9%) | 296 (8.9%) |
Disability Class: Cognitive Difficulty
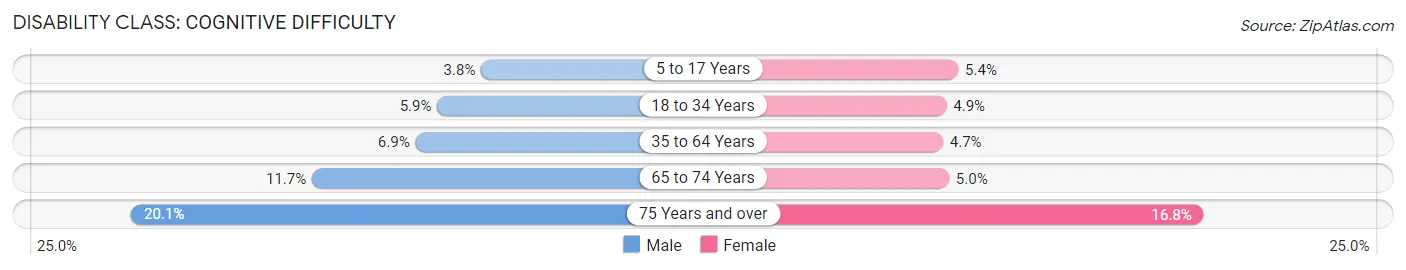
| Age Bracket | Male | Female |
| 5 to 17 Years | 322 (3.8%) | 454 (5.4%) |
| 18 to 34 Years | 799 (5.9%) | 642 (4.9%) |
| 35 to 64 Years | 1,467 (6.9%) | 1,016 (4.7%) |
| 65 to 74 Years | 412 (11.7%) | 225 (5.0%) |
| 75 Years and over | 447 (20.1%) | 555 (16.8%) |
Disability Class: Ambulatory Difficulty
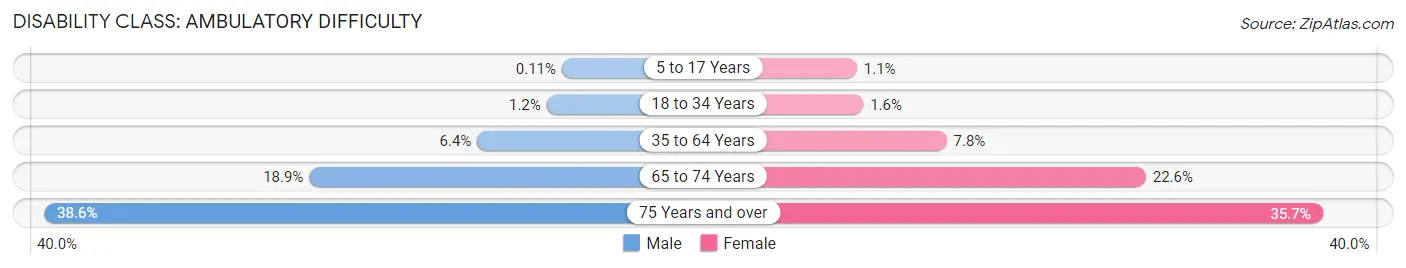
| Age Bracket | Male | Female |
| 5 to 17 Years | 9 (0.1%) | 94 (1.1%) |
| 18 to 34 Years | 170 (1.2%) | 211 (1.6%) |
| 35 to 64 Years | 1,368 (6.4%) | 1,686 (7.8%) |
| 65 to 74 Years | 667 (18.9%) | 1,022 (22.6%) |
| 75 Years and over | 859 (38.6%) | 1,180 (35.7%) |
Disability Class: Self-Care Difficulty
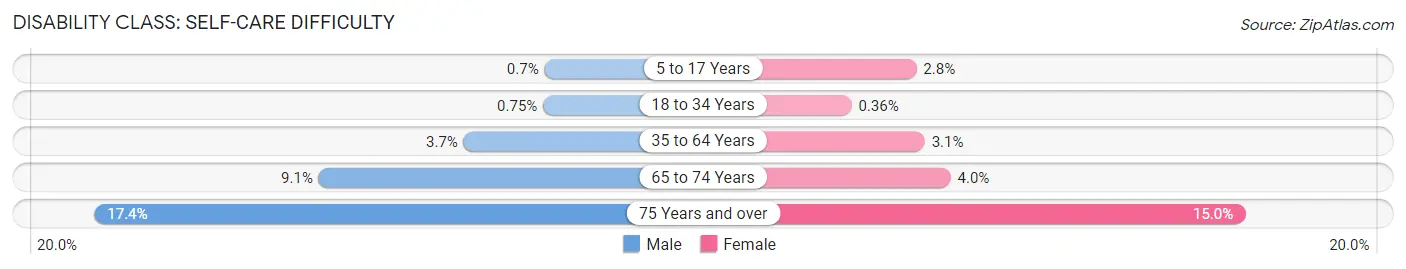
| Age Bracket | Male | Female |
| 5 to 17 Years | 59 (0.7%) | 233 (2.8%) |
| 18 to 34 Years | 102 (0.7%) | 48 (0.4%) |
| 35 to 64 Years | 792 (3.7%) | 668 (3.1%) |
| 65 to 74 Years | 321 (9.1%) | 183 (4.0%) |
| 75 Years and over | 388 (17.4%) | 495 (15.0%) |
Technology Access in Inglewood
Computing Device Access in Inglewood
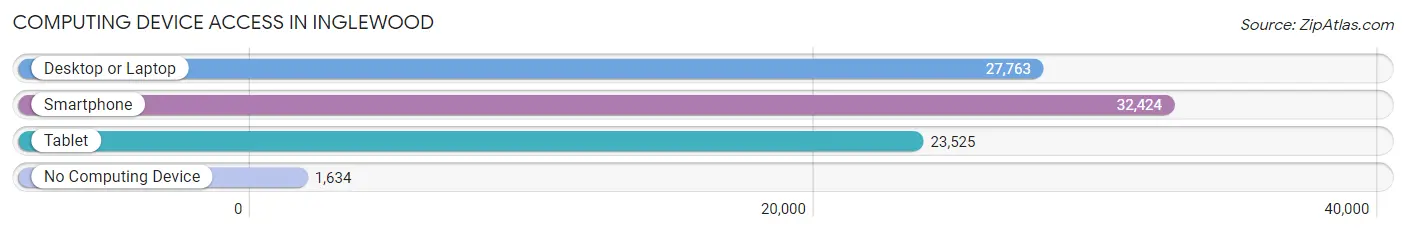
| Device Type | # Households | % Households |
| Desktop or Laptop | 27,763 | 77.6% |
| Smartphone | 32,424 | 90.6% |
| Tablet | 23,525 | 65.8% |
| No Computing Device | 1,634 | 4.6% |
| Total | 35,773 | 100.0% |
Internet Access in Inglewood
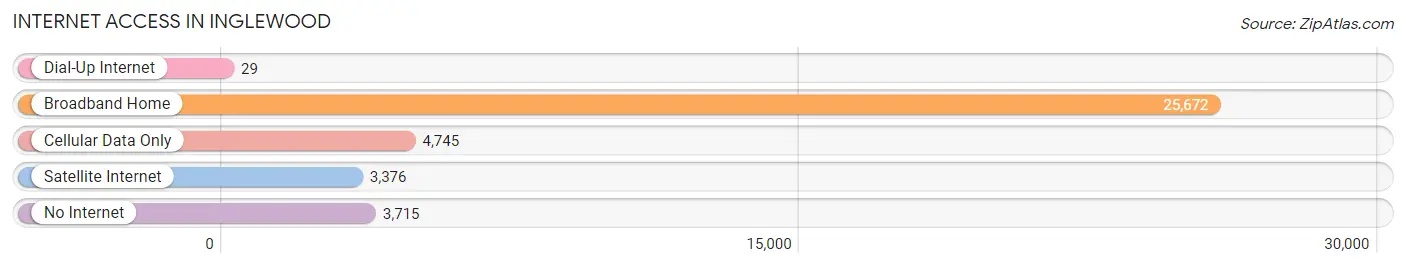
| Internet Type | # Households | % Households |
| Dial-Up Internet | 29 | 0.1% |
| Broadband Home | 25,672 | 71.8% |
| Cellular Data Only | 4,745 | 13.3% |
| Satellite Internet | 3,376 | 9.4% |
| No Internet | 3,715 | 10.4% |
| Total | 35,773 | 100.0% |
Inglewood Summary
Inglewood, California is a city located in the southwestern region of Los Angeles County, California. It is bordered by the cities of Los Angeles, Hawthorne, and Westchester. The city has a population of 109,673 as of the 2010 census, making it the ninth-largest city in Los Angeles County.
History
Inglewood was founded in 1888 by Daniel Freeman, a former slave who had purchased the land from the Spanish government. The city was named after his hometown of Inglewood, Scotland. The city was incorporated in 1908 and grew rapidly in the early 20th century, becoming a major center for the motion picture industry. In the 1950s, Inglewood was the site of the first African-American-owned television station in the United States, KBIG-TV.
Geography
Inglewood is located in the southwestern region of Los Angeles County, California. It is bordered by the cities of Los Angeles, Hawthorne, and Westchester. The city has a total area of 8.2 square miles, of which 8.1 square miles is land and 0.1 square miles is water. The city is located in the Los Angeles Basin and is surrounded by the Santa Monica Mountains to the north, the San Gabriel Mountains to the east, and the Pacific Ocean to the south.
Economy
Inglewood is a major center for the motion picture industry, with several major studios located in the city. The city is also home to the Hollywood Park Racetrack, which hosts the annual Hollywood Gold Cup. Other major employers in the city include the Los Angeles Air Force Base, the Los Angeles County Sheriff's Department, and the Los Angeles Unified School District.
Demographics
As of the 2010 census, Inglewood had a population of 109,673. The racial makeup of the city was 44.3% African American, 33.2% White, 11.2% Hispanic or Latino, 8.2% Asian, and 2.1% from other races. The median household income was $45,844, and the median family income was $50,819. The per capita income was $20,845.
Conclusion
Inglewood, California is a city located in the southwestern region of Los Angeles County, California. It has a rich history, dating back to its founding in 1888 by Daniel Freeman, a former slave. The city has a total area of 8.2 square miles and a population of 109,673 as of the 2010 census. Inglewood is a major center for the motion picture industry, with several major studios located in the city. The city also has a diverse population, with 44.3% African American, 33.2% White, 11.2% Hispanic or Latino, 8.2% Asian, and 2.1% from other races. The median household income was $45,844, and the median family income was $50,819.
Common Questions
What is Per Capita Income in Inglewood?
Per Capita income in Inglewood is $30,559.
What is the Median Family Income in Inglewood?
Median Family Income in Inglewood is $72,786.
What is the Median Household income in Inglewood?
Median Household Income in Inglewood is $67,563.
What is Income or Wage Gap in Inglewood?
Income or Wage Gap in Inglewood is 12.7%.
Women in Inglewood earn 87.3 cents for every dollar earned by a man.
What is Family Income Deficit in Inglewood?
Family Income Deficit in Inglewood is $11,099.
Families that are below poverty line in Inglewood earn $11,099 less on average than the poverty threshold level.
What is Inequality or Gini Index in Inglewood?
Inequality or Gini Index in Inglewood is 0.44.
What is the Total Population of Inglewood?
Total Population of Inglewood is 106,806.
What is the Total Male Population of Inglewood?
Total Male Population of Inglewood is 52,512.
What is the Total Female Population of Inglewood?
Total Female Population of Inglewood is 54,294.
What is the Ratio of Males per 100 Females in Inglewood?
There are 96.72 Males per 100 Females in Inglewood.
What is the Ratio of Females per 100 Males in Inglewood?
There are 103.39 Females per 100 Males in Inglewood.
What is the Median Population Age in Inglewood?
Median Population Age in Inglewood is 37.3 Years.
What is the Average Family Size in Inglewood
Average Family Size in Inglewood is 3.6 People.
What is the Average Household Size in Inglewood
Average Household Size in Inglewood is 2.9 People.
How Large is the Labor Force in Inglewood?
There are 58,348 People in the Labor Forcein in Inglewood.
What is the Percentage of People in the Labor Force in Inglewood?
67.4% of People are in the Labor Force in Inglewood.
What is the Unemployment Rate in Inglewood?
Unemployment Rate in Inglewood is 8.2%.