Bell, CA Map & Demographics
Bell Map
Bell Overview
$21,024
PER CAPITA INCOME
$57,058
AVG FAMILY INCOME
$56,685
AVG HOUSEHOLD INCOME
27.1%
WAGE / INCOME GAP [ % ]
72.9¢/ $1
WAGE / INCOME GAP [ $ ]
$8,754
FAMILY INCOME DEFICIT
0.42
INEQUALITY / GINI INDEX
33,377
TOTAL POPULATION
16,940
MALE POPULATION
16,437
FEMALE POPULATION
103.06
MALES / 100 FEMALES
97.03
FEMALES / 100 MALES
33.7
MEDIAN AGE
4.0
AVG FAMILY SIZE
3.7
AVG HOUSEHOLD SIZE
15,570
LABOR FORCE [ PEOPLE ]
60.2%
PERCENT IN LABOR FORCE
6.5%
UNEMPLOYMENT RATE
Bell Area Codes
Income in Bell
Income Overview in Bell
Per Capita Income in Bell is $21,024, while median incomes of families and households are $57,058 and $56,685 respectively.
| Characteristic | Number | Measure |
| Per Capita Income | 33,377 | $21,024 |
| Median Family Income | 7,320 | $57,058 |
| Mean Family Income | 7,320 | $70,051 |
| Median Household Income | 8,869 | $56,685 |
| Mean Household Income | 8,869 | $69,948 |
| Income Deficit | 7,320 | $8,754 |
| Wage / Income Gap (%) | 33,377 | 27.12% |
| Wage / Income Gap ($) | 33,377 | 72.88¢ per $1 |
| Gini / Inequality Index | 33,377 | 0.42 |
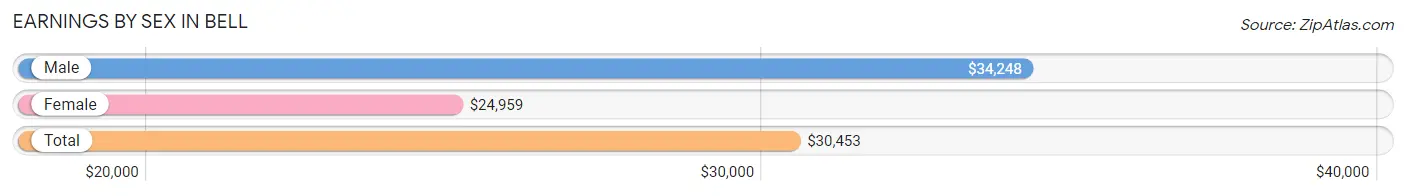
Earnings by Sex in Bell
Average Earnings in Bell are $30,453, $34,248 for men and $24,959 for women, a difference of 27.1%.
| Sex | Number | Average Earnings |
| Male | 8,977 (57.0%) | $34,248 |
| Female | 6,762 (43.0%) | $24,959 |
| Total | 15,739 (100.0%) | $30,453 |
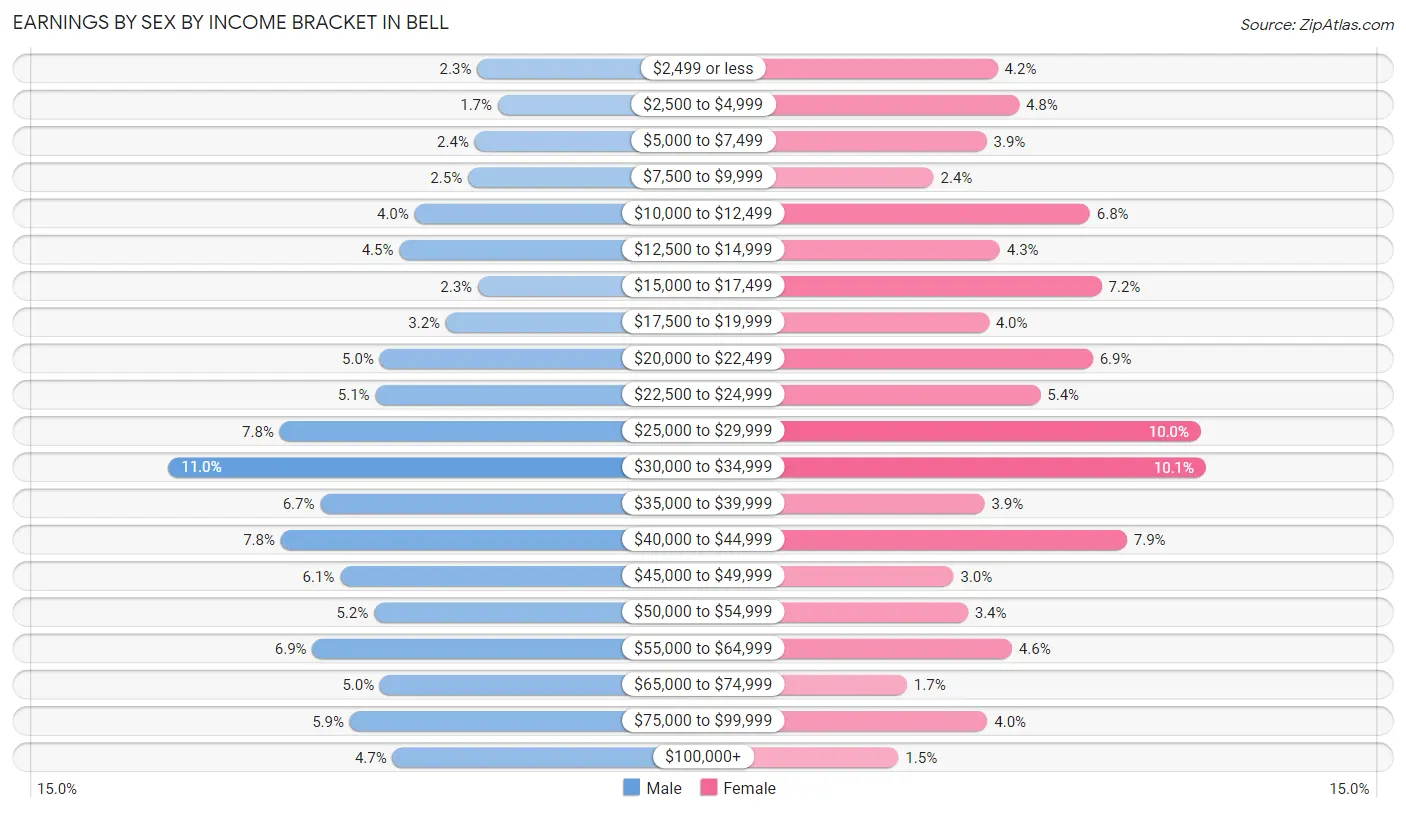
Earnings by Sex by Income Bracket in Bell
The most common earnings brackets in Bell are $30,000 to $34,999 for men (984 | 11.0%) and $30,000 to $34,999 for women (682 | 10.1%).
| Income | Male | Female |
| $2,499 or less | 205 (2.3%) | 287 (4.2%) |
| $2,500 to $4,999 | 153 (1.7%) | 327 (4.8%) |
| $5,000 to $7,499 | 211 (2.4%) | 266 (3.9%) |
| $7,500 to $9,999 | 228 (2.5%) | 165 (2.4%) |
| $10,000 to $12,499 | 363 (4.0%) | 462 (6.8%) |
| $12,500 to $14,999 | 401 (4.5%) | 291 (4.3%) |
| $15,000 to $17,499 | 203 (2.3%) | 484 (7.2%) |
| $17,500 to $19,999 | 284 (3.2%) | 270 (4.0%) |
| $20,000 to $22,499 | 451 (5.0%) | 467 (6.9%) |
| $22,500 to $24,999 | 461 (5.1%) | 368 (5.4%) |
| $25,000 to $29,999 | 703 (7.8%) | 673 (10.0%) |
| $30,000 to $34,999 | 984 (11.0%) | 682 (10.1%) |
| $35,000 to $39,999 | 601 (6.7%) | 262 (3.9%) |
| $40,000 to $44,999 | 700 (7.8%) | 532 (7.9%) |
| $45,000 to $49,999 | 550 (6.1%) | 203 (3.0%) |
| $50,000 to $54,999 | 465 (5.2%) | 230 (3.4%) |
| $55,000 to $64,999 | 620 (6.9%) | 314 (4.6%) |
| $65,000 to $74,999 | 450 (5.0%) | 114 (1.7%) |
| $75,000 to $99,999 | 526 (5.9%) | 267 (4.0%) |
| $100,000+ | 418 (4.7%) | 98 (1.5%) |
| Total | 8,977 (100.0%) | 6,762 (100.0%) |
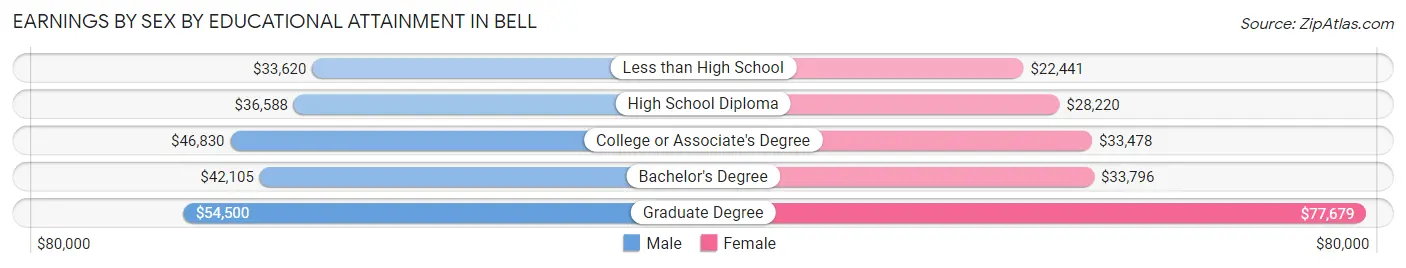
Earnings by Sex by Educational Attainment in Bell
Average earnings in Bell are $37,290 for men and $27,821 for women, a difference of 25.4%. Men with an educational attainment of graduate degree enjoy the highest average annual earnings of $54,500, while those with less than high school education earn the least with $33,620. Women with an educational attainment of graduate degree earn the most with the average annual earnings of $77,679, while those with less than high school education have the smallest earnings of $22,441.
| Educational Attainment | Male Income | Female Income |
| Less than High School | $33,620 | $22,441 |
| High School Diploma | $36,588 | $28,220 |
| College or Associate's Degree | $46,830 | $33,478 |
| Bachelor's Degree | $42,105 | $33,796 |
| Graduate Degree | $54,500 | $77,679 |
| Total | $37,290 | $27,821 |
Family Income in Bell
Family Income Brackets in Bell
According to the Bell family income data, there are 1,603 families falling into the $50,000 to $74,999 income range, which is the most common income bracket and makes up 21.9% of all families. Conversely, the $10,000 to $14,999 income bracket is the least frequent group with only 205 families (2.8%) belonging to this category.
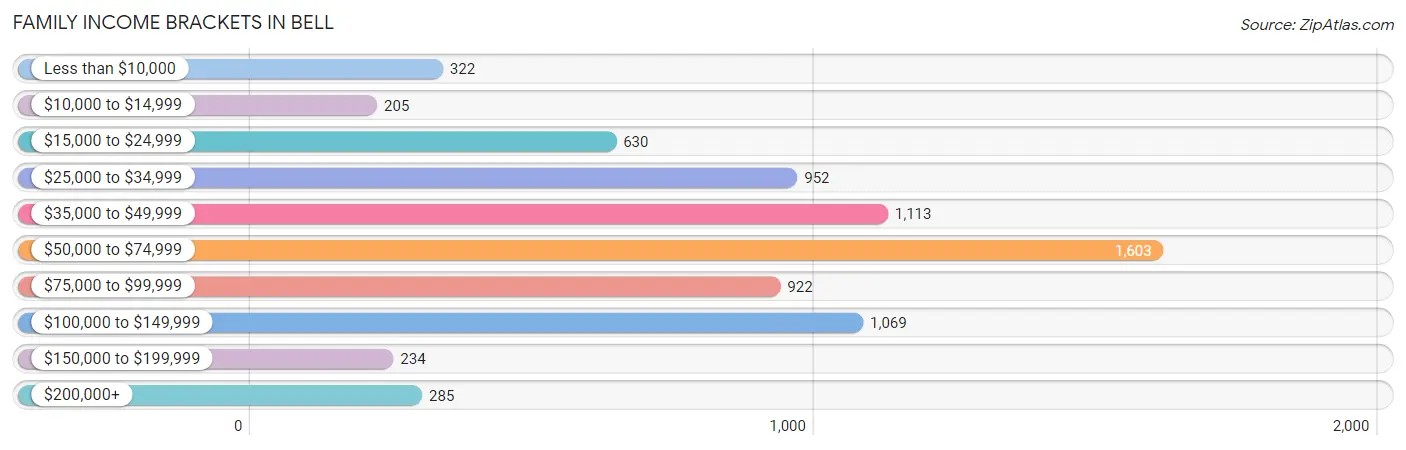
| Income Bracket | # Families | % Families |
| Less than $10,000 | 322 | 4.4% |
| $10,000 to $14,999 | 205 | 2.8% |
| $15,000 to $24,999 | 630 | 8.6% |
| $25,000 to $34,999 | 952 | 13.0% |
| $35,000 to $49,999 | 1,113 | 15.2% |
| $50,000 to $74,999 | 1,603 | 21.9% |
| $75,000 to $99,999 | 922 | 12.6% |
| $100,000 to $149,999 | 1,069 | 14.6% |
| $150,000 to $199,999 | 234 | 3.2% |
| $200,000+ | 285 | 3.9% |
Family Income by Famaliy Size in Bell
7+ person families (262 | 3.6%) account for the highest median family income in Bell with $108,640 per family, while 3-person families (1,546 | 21.1%) have the highest median income of $19,500 per family member.
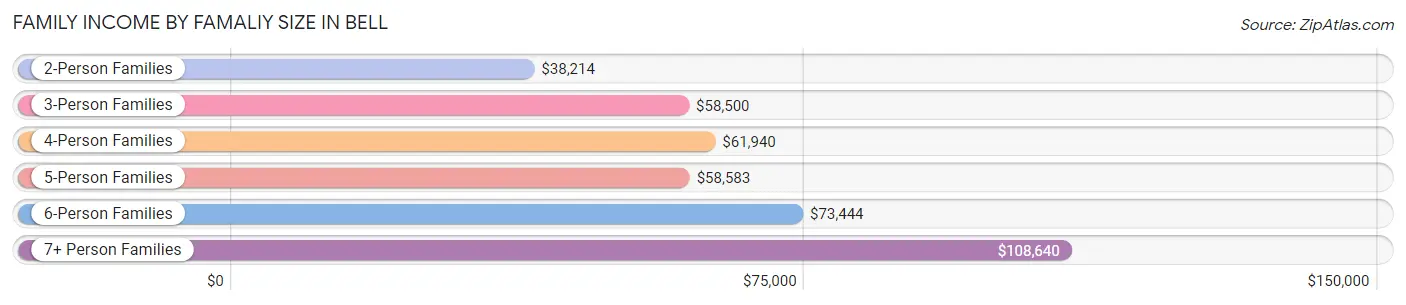
| Income Bracket | # Families | Median Income |
| 2-Person Families | 2,050 (28.0%) | $38,214 |
| 3-Person Families | 1,546 (21.1%) | $58,500 |
| 4-Person Families | 1,777 (24.3%) | $61,940 |
| 5-Person Families | 1,005 (13.7%) | $58,583 |
| 6-Person Families | 680 (9.3%) | $73,444 |
| 7+ Person Families | 262 (3.6%) | $108,640 |
| Total | 7,320 (100.0%) | $57,058 |
Family Income by Number of Earners in Bell
The median family income in Bell is $57,058, with families comprising 3+ earners (1,441) having the highest median family income of $108,668, while families with no earners (781) have the lowest median family income of $18,080, accounting for 19.7% and 10.7% of families, respectively.
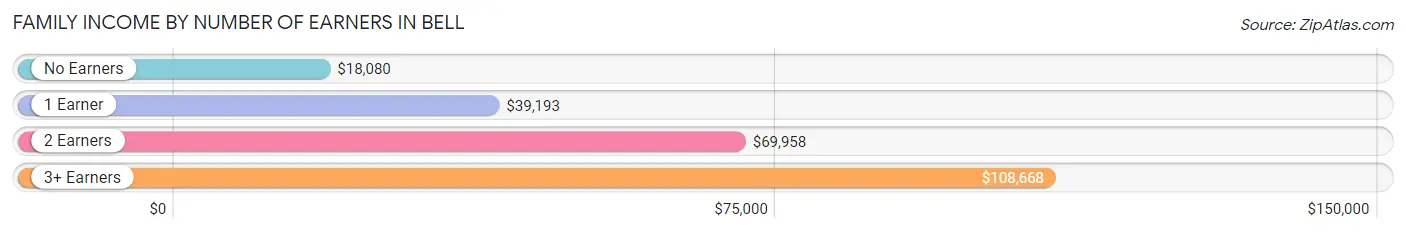
| Number of Earners | # Families | Median Income |
| No Earners | 781 (10.7%) | $18,080 |
| 1 Earner | 2,665 (36.4%) | $39,193 |
| 2 Earners | 2,433 (33.2%) | $69,958 |
| 3+ Earners | 1,441 (19.7%) | $108,668 |
| Total | 7,320 (100.0%) | $57,058 |
Household Income in Bell
Household Income Brackets in Bell
With 1,871 households falling in the category, the $50,000 to $74,999 income range is the most frequent in Bell, accounting for 21.1% of all households. In contrast, only 257 households (2.9%) fall into the $150,000 to $199,999 income bracket, making it the least populous group.
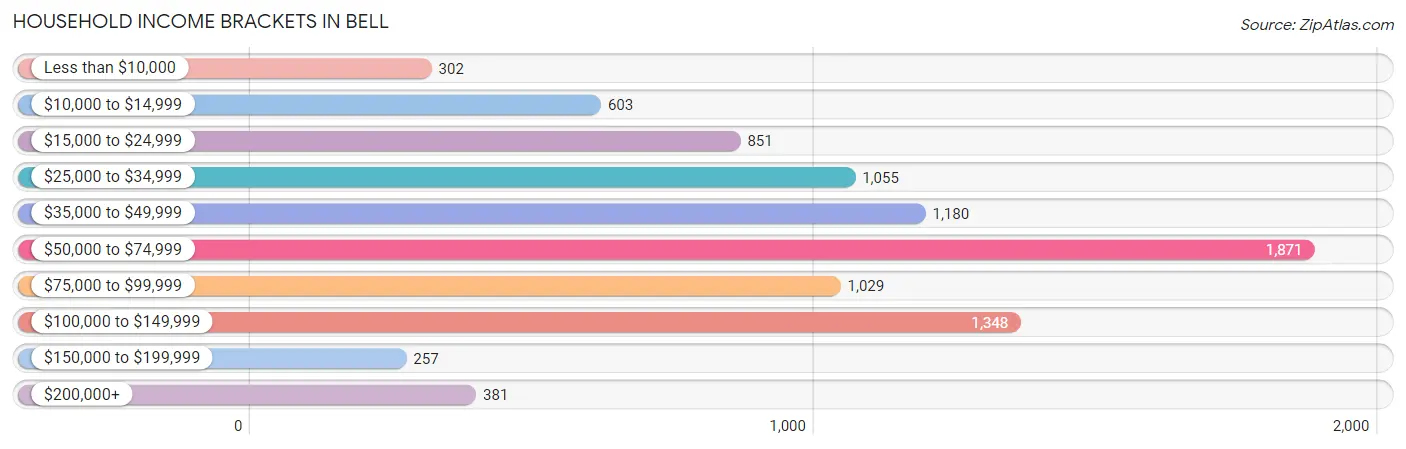
| Income Bracket | # Households | % Households |
| Less than $10,000 | 302 | 3.4% |
| $10,000 to $14,999 | 603 | 6.8% |
| $15,000 to $24,999 | 851 | 9.6% |
| $25,000 to $34,999 | 1,055 | 11.9% |
| $35,000 to $49,999 | 1,180 | 13.3% |
| $50,000 to $74,999 | 1,871 | 21.1% |
| $75,000 to $99,999 | 1,029 | 11.6% |
| $100,000 to $149,999 | 1,348 | 15.2% |
| $150,000 to $199,999 | 257 | 2.9% |
| $200,000+ | 381 | 4.3% |
Household Income by Householder Age in Bell
The median household income in Bell is $56,685, with the highest median household income of $64,800 found in the 45 to 64 years age bracket for the primary householder. A total of 3,692 households (41.6%) fall into this category. Meanwhile, the 65+ years age bracket for the primary householder has the lowest median household income of $35,408, with 1,628 households (18.4%) in this group.
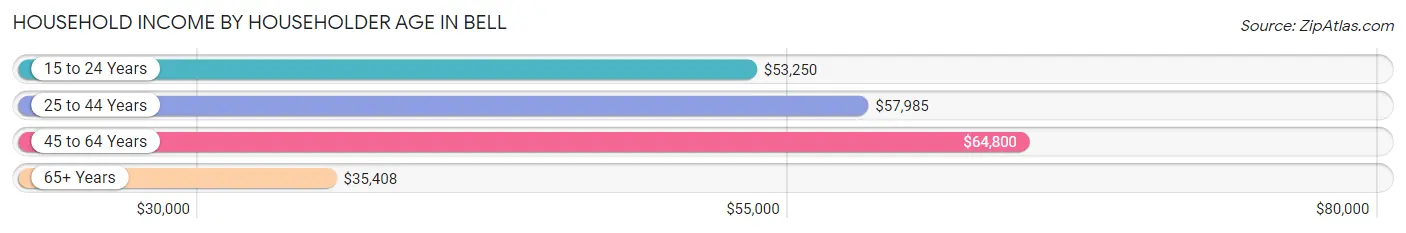
| Income Bracket | # Households | Median Income |
| 15 to 24 Years | 197 (2.2%) | $53,250 |
| 25 to 44 Years | 3,352 (37.8%) | $57,985 |
| 45 to 64 Years | 3,692 (41.6%) | $64,800 |
| 65+ Years | 1,628 (18.4%) | $35,408 |
| Total | 8,869 (100.0%) | $56,685 |
Poverty in Bell
Income Below Poverty by Sex and Age in Bell
With 21.7% poverty level for males and 25.1% for females among the residents of Bell, 6 to 11 year old males and 15 year old females are the most vulnerable to poverty, with 605 males (39.2%) and 111 females (39.5%) in their respective age groups living below the poverty level.
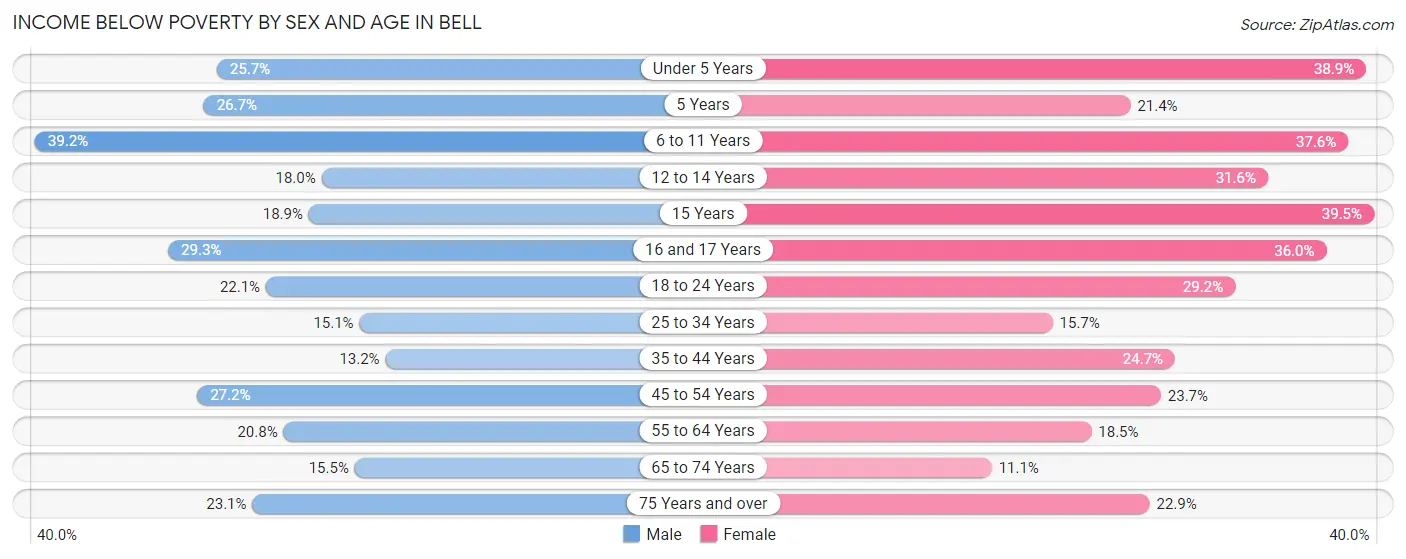
| Age Bracket | Male | Female |
| Under 5 Years | 268 (25.7%) | 474 (38.9%) |
| 5 Years | 59 (26.7%) | 42 (21.4%) |
| 6 to 11 Years | 605 (39.2%) | 403 (37.6%) |
| 12 to 14 Years | 131 (17.9%) | 265 (31.6%) |
| 15 Years | 55 (18.9%) | 111 (39.5%) |
| 16 and 17 Years | 147 (29.3%) | 218 (36.0%) |
| 18 to 24 Years | 474 (22.1%) | 545 (29.2%) |
| 25 to 34 Years | 363 (15.1%) | 381 (15.7%) |
| 35 to 44 Years | 334 (13.2%) | 568 (24.7%) |
| 45 to 54 Years | 539 (27.2%) | 512 (23.7%) |
| 55 to 64 Years | 364 (20.8%) | 321 (18.5%) |
| 65 to 74 Years | 167 (15.5%) | 107 (11.1%) |
| 75 Years and over | 136 (23.1%) | 170 (22.9%) |
| Total | 3,642 (21.7%) | 4,117 (25.1%) |
Income Above Poverty by Sex and Age in Bell
According to the poverty statistics in Bell, males aged 35 to 44 years and females aged 65 to 74 years are the age groups that are most secure financially, with 86.8% of males and 88.9% of females in these age groups living above the poverty line.
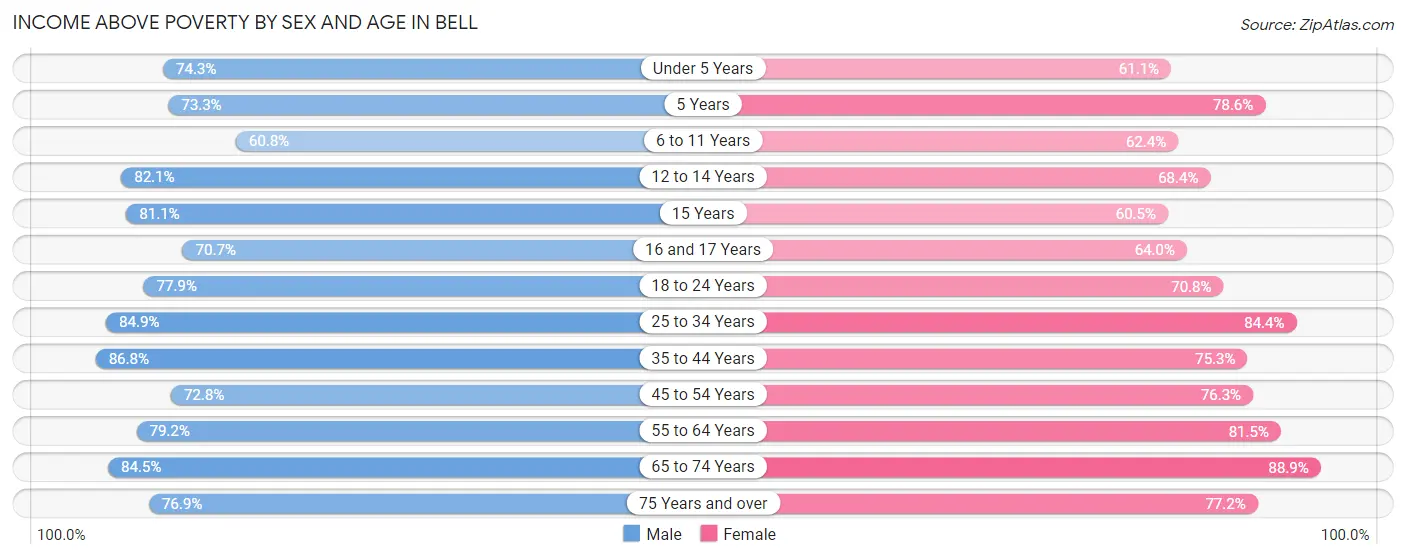
| Age Bracket | Male | Female |
| Under 5 Years | 774 (74.3%) | 744 (61.1%) |
| 5 Years | 162 (73.3%) | 154 (78.6%) |
| 6 to 11 Years | 937 (60.8%) | 669 (62.4%) |
| 12 to 14 Years | 599 (82.1%) | 573 (68.4%) |
| 15 Years | 236 (81.1%) | 170 (60.5%) |
| 16 and 17 Years | 354 (70.7%) | 388 (64.0%) |
| 18 to 24 Years | 1,673 (77.9%) | 1,322 (70.8%) |
| 25 to 34 Years | 2,035 (84.9%) | 2,053 (84.4%) |
| 35 to 44 Years | 2,195 (86.8%) | 1,729 (75.3%) |
| 45 to 54 Years | 1,444 (72.8%) | 1,649 (76.3%) |
| 55 to 64 Years | 1,388 (79.2%) | 1,411 (81.5%) |
| 65 to 74 Years | 911 (84.5%) | 854 (88.9%) |
| 75 Years and over | 453 (76.9%) | 574 (77.1%) |
| Total | 13,161 (78.3%) | 12,290 (74.9%) |
Income Below Poverty Among Married-Couple Families in Bell
The poverty statistics for married-couple families in Bell show that 12.2% or 492 of the total 4,040 families live below the poverty line. Families with 3 or 4 children have the highest poverty rate of 28.5%, comprising of 111 families. On the other hand, families with no children have the lowest poverty rate of 2.5%, which includes 46 families.
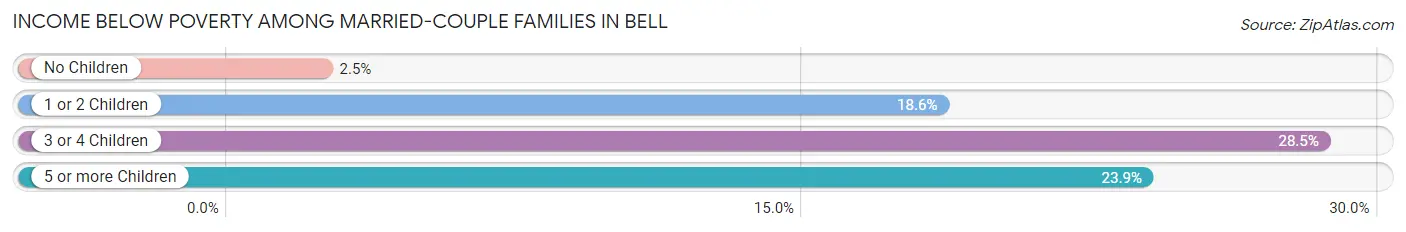
| Children | Above Poverty | Below Poverty |
| No Children | 1,814 (97.5%) | 46 (2.5%) |
| 1 or 2 Children | 1,421 (81.4%) | 324 (18.6%) |
| 3 or 4 Children | 278 (71.5%) | 111 (28.5%) |
| 5 or more Children | 35 (76.1%) | 11 (23.9%) |
| Total | 3,548 (87.8%) | 492 (12.2%) |
Income Below Poverty Among Single-Parent Households in Bell
According to the poverty data in Bell, 22.0% or 206 single-father households and 32.0% or 750 single-mother households are living below the poverty line. Among single-father households, those with 3 or 4 children have the highest poverty rate, with 29 households (52.7%) experiencing poverty. Likewise, among single-mother households, those with 3 or 4 children have the highest poverty rate, with 242 households (63.0%) falling below the poverty line.
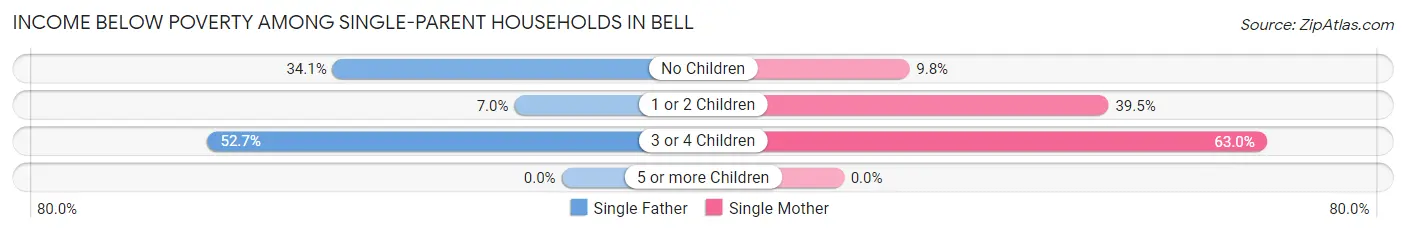
| Children | Single Father | Single Mother |
| No Children | 145 (34.1%) | 85 (9.8%) |
| 1 or 2 Children | 32 (7.0%) | 423 (39.5%) |
| 3 or 4 Children | 29 (52.7%) | 242 (63.0%) |
| 5 or more Children | 0 (0.0%) | 0 (0.0%) |
| Total | 206 (22.0%) | 750 (32.0%) |
Income Below Poverty Among Married-Couple vs Single-Parent Households in Bell
The poverty data for Bell shows that 492 of the married-couple family households (12.2%) and 956 of the single-parent households (29.1%) are living below the poverty level. Within the married-couple family households, those with 3 or 4 children have the highest poverty rate, with 111 households (28.5%) falling below the poverty line. Among the single-parent households, those with 3 or 4 children have the highest poverty rate, with 271 household (61.7%) living below poverty.
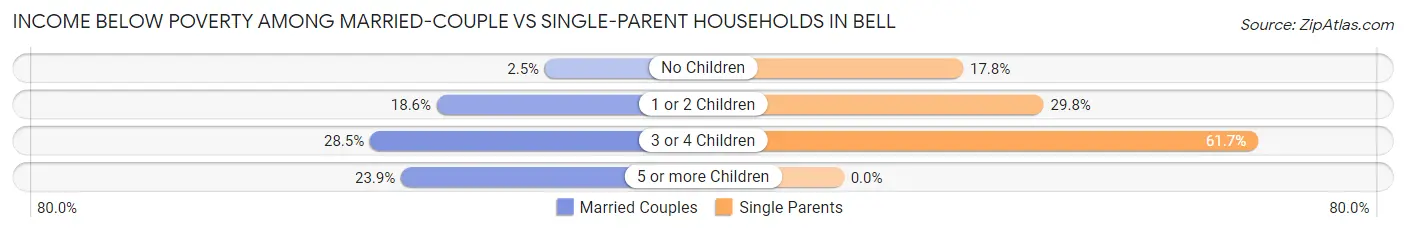
| Children | Married-Couple Families | Single-Parent Households |
| No Children | 46 (2.5%) | 230 (17.8%) |
| 1 or 2 Children | 324 (18.6%) | 455 (29.8%) |
| 3 or 4 Children | 111 (28.5%) | 271 (61.7%) |
| 5 or more Children | 11 (23.9%) | 0 (0.0%) |
| Total | 492 (12.2%) | 956 (29.1%) |
Race in Bell
The most populous races in Bell are Hispanic or Latino (29,753 | 89.1%), White / Caucasian (15,569 | 46.7%), and Two or more Races (8,706 | 26.1%).
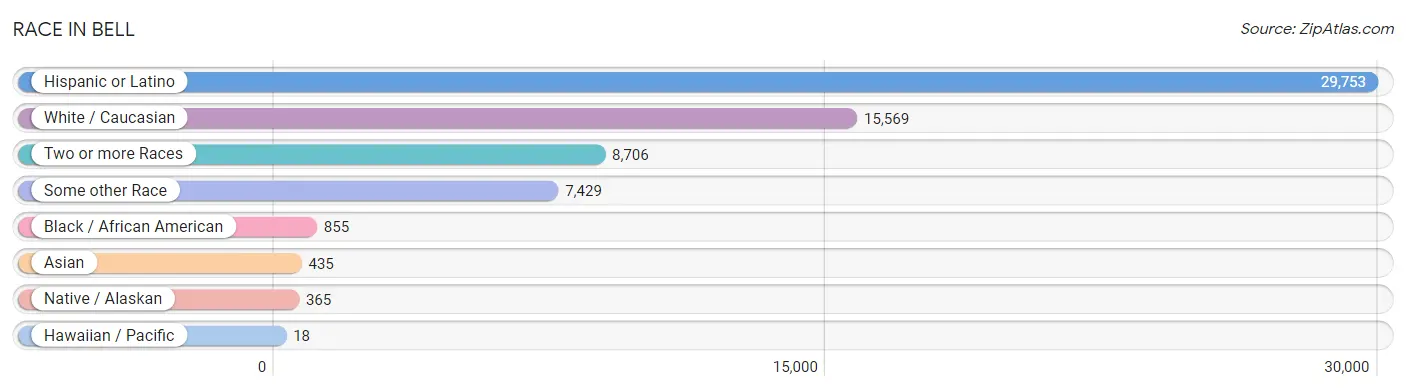
| Race | # Population | % Population |
| Asian | 435 | 1.3% |
| Black / African American | 855 | 2.6% |
| Hawaiian / Pacific | 18 | 0.1% |
| Hispanic or Latino | 29,753 | 89.1% |
| Native / Alaskan | 365 | 1.1% |
| White / Caucasian | 15,569 | 46.7% |
| Two or more Races | 8,706 | 26.1% |
| Some other Race | 7,429 | 22.3% |
| Total | 33,377 | 100.0% |
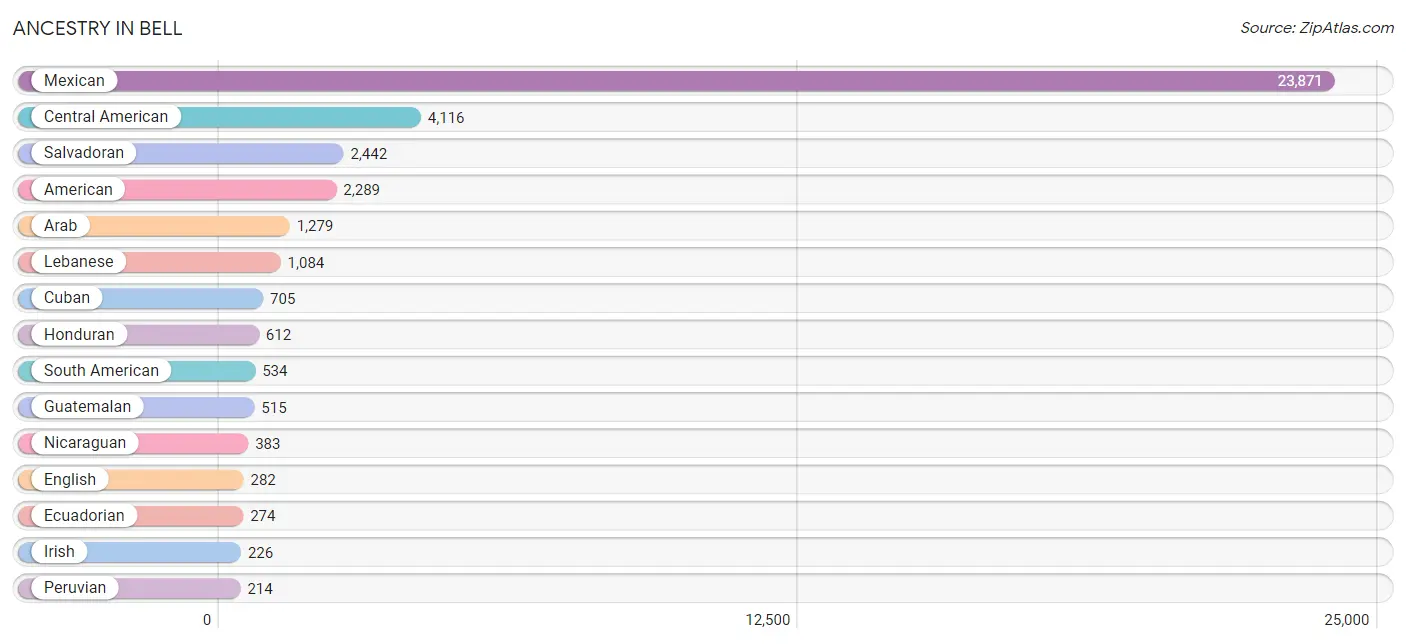
Ancestry in Bell
The most populous ancestries reported in Bell are Mexican (23,871 | 71.5%), Central American (4,116 | 12.3%), Salvadoran (2,442 | 7.3%), American (2,289 | 6.9%), and Arab (1,279 | 3.8%), together accounting for 101.9% of all Bell residents.
| Ancestry | # Population | % Population |
| African | 71 | 0.2% |
| American | 2,289 | 6.9% |
| Arab | 1,279 | 3.8% |
| Belgian | 27 | 0.1% |
| Belizean | 78 | 0.2% |
| Bhutanese | 9 | 0.0% |
| British | 25 | 0.1% |
| Burmese | 11 | 0.0% |
| Central American | 4,116 | 12.3% |
| Central American Indian | 96 | 0.3% |
| Cherokee | 18 | 0.1% |
| Chilean | 12 | 0.0% |
| Colombian | 34 | 0.1% |
| Costa Rican | 63 | 0.2% |
| Cree | 8 | 0.0% |
| Cuban | 705 | 2.1% |
| Dutch | 48 | 0.1% |
| Ecuadorian | 274 | 0.8% |
| English | 282 | 0.8% |
| European | 84 | 0.3% |
| French | 7 | 0.0% |
| German | 64 | 0.2% |
| Guatemalan | 515 | 1.5% |
| Guyanese | 19 | 0.1% |
| Honduran | 612 | 1.8% |
| Indian (Asian) | 127 | 0.4% |
| Irish | 226 | 0.7% |
| Italian | 45 | 0.1% |
| Korean | 169 | 0.5% |
| Lebanese | 1,084 | 3.3% |
| Mexican | 23,871 | 71.5% |
| Mexican American Indian | 106 | 0.3% |
| Native Hawaiian | 38 | 0.1% |
| Navajo | 19 | 0.1% |
| Nicaraguan | 383 | 1.1% |
| Palestinian | 195 | 0.6% |
| Panamanian | 9 | 0.0% |
| Peruvian | 214 | 0.6% |
| Polish | 39 | 0.1% |
| Puerto Rican | 43 | 0.1% |
| Romanian | 33 | 0.1% |
| Russian | 41 | 0.1% |
| Salvadoran | 2,442 | 7.3% |
| Scottish | 14 | 0.0% |
| South American | 534 | 1.6% |
| Spaniard | 132 | 0.4% |
| Sri Lankan | 139 | 0.4% |
| Subsaharan African | 71 | 0.2% |
| Thai | 8 | 0.0% |
| Welsh | 14 | 0.0% |
| West Indian | 24 | 0.1% | View All 51 Rows |
Immigrants in Bell
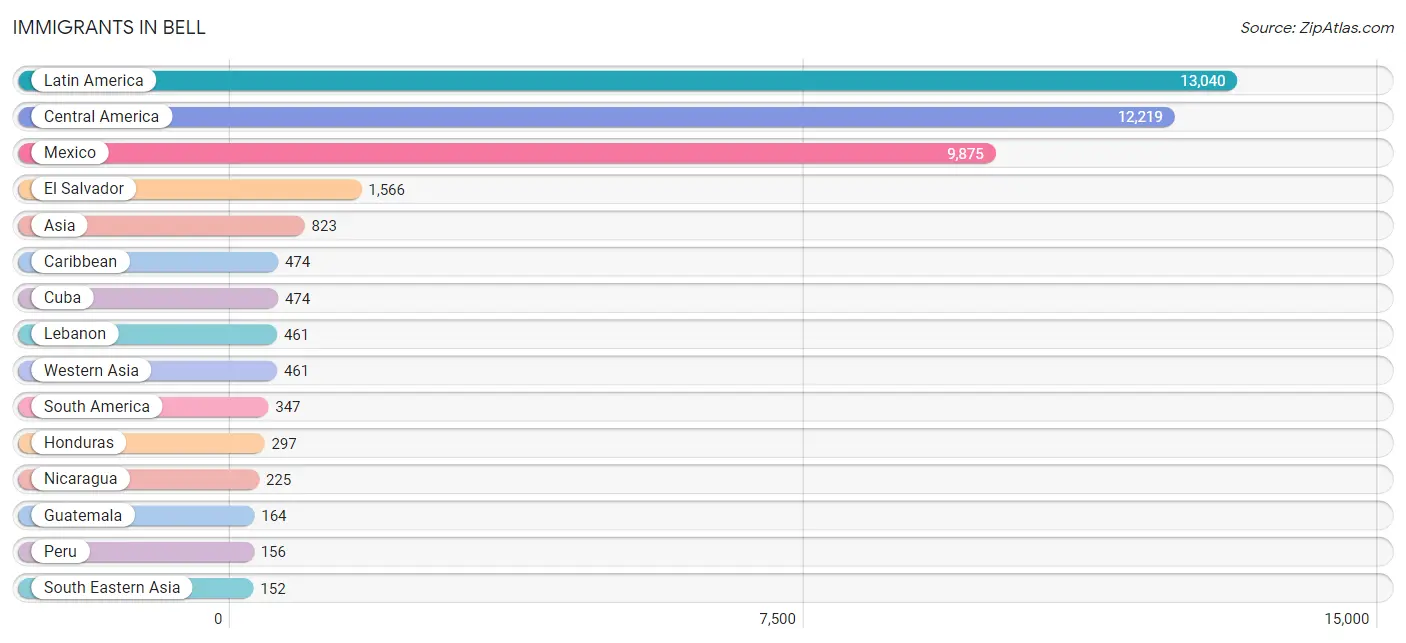
The most numerous immigrant groups reported in Bell came from Latin America (13,040 | 39.1%), Central America (12,219 | 36.6%), Mexico (9,875 | 29.6%), El Salvador (1,566 | 4.7%), and Asia (823 | 2.5%), together accounting for 112.4% of all Bell residents.
| Immigration Origin | # Population | % Population |
| Asia | 823 | 2.5% |
| Australia | 15 | 0.0% |
| Belize | 59 | 0.2% |
| Caribbean | 474 | 1.4% |
| Central America | 12,219 | 36.6% |
| Chile | 12 | 0.0% |
| Colombia | 41 | 0.1% |
| Costa Rica | 33 | 0.1% |
| Cuba | 474 | 1.4% |
| Eastern Asia | 11 | 0.0% |
| Ecuador | 138 | 0.4% |
| El Salvador | 1,566 | 4.7% |
| Europe | 45 | 0.1% |
| Guatemala | 164 | 0.5% |
| Honduras | 297 | 0.9% |
| Iran | 34 | 0.1% |
| Italy | 29 | 0.1% |
| Korea | 11 | 0.0% |
| Latin America | 13,040 | 39.1% |
| Lebanon | 461 | 1.4% |
| Mexico | 9,875 | 29.6% |
| Nepal | 8 | 0.0% |
| Nicaragua | 225 | 0.7% |
| Oceania | 15 | 0.0% |
| Peru | 156 | 0.5% |
| Philippines | 90 | 0.3% |
| South America | 347 | 1.0% |
| South Central Asia | 42 | 0.1% |
| South Eastern Asia | 152 | 0.5% |
| Southern Europe | 45 | 0.1% |
| Spain | 16 | 0.1% |
| Vietnam | 62 | 0.2% |
| Western Asia | 461 | 1.4% | View All 33 Rows |
Sex and Age in Bell
Sex and Age in Bell
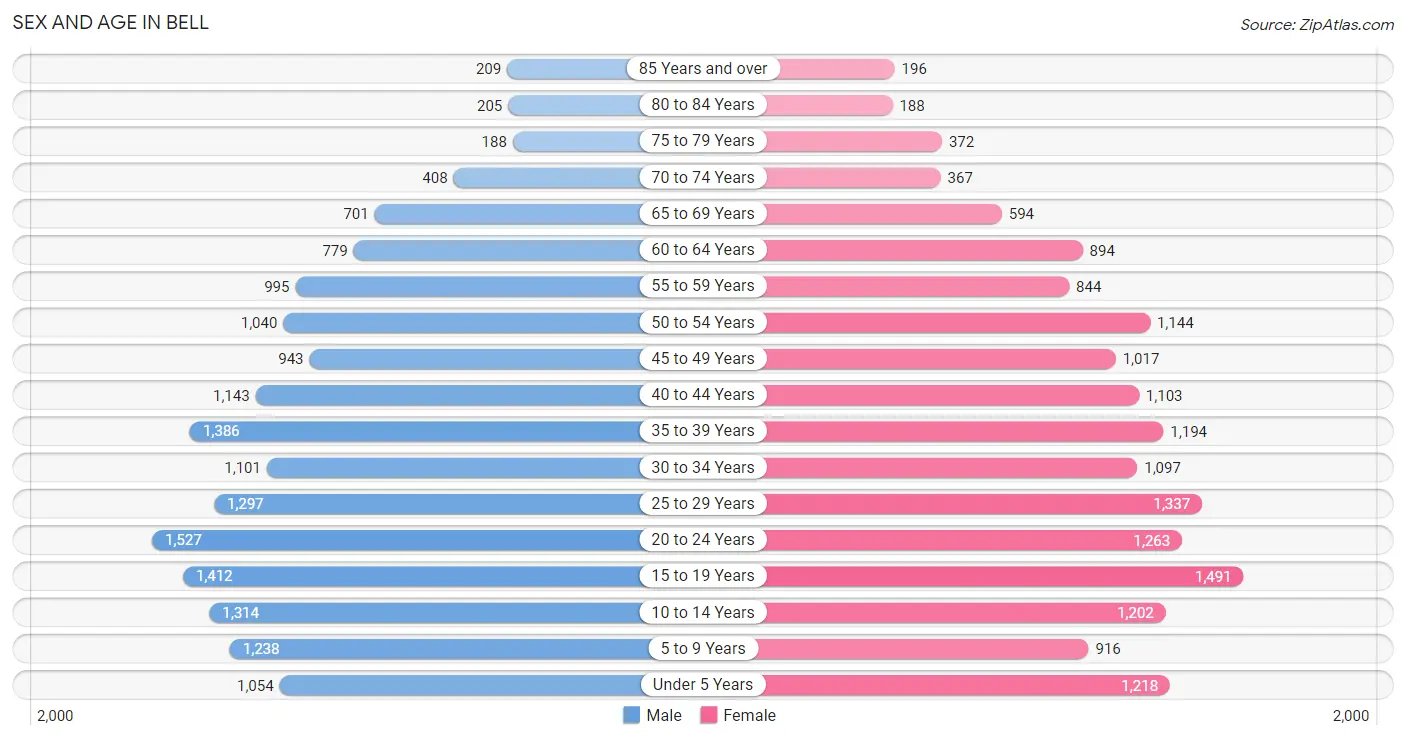
The most populous age groups in Bell are 20 to 24 Years (1,527 | 9.0%) for men and 15 to 19 Years (1,491 | 9.1%) for women.
| Age Bracket | Male | Female |
| Under 5 Years | 1,054 (6.2%) | 1,218 (7.4%) |
| 5 to 9 Years | 1,238 (7.3%) | 916 (5.6%) |
| 10 to 14 Years | 1,314 (7.8%) | 1,202 (7.3%) |
| 15 to 19 Years | 1,412 (8.3%) | 1,491 (9.1%) |
| 20 to 24 Years | 1,527 (9.0%) | 1,263 (7.7%) |
| 25 to 29 Years | 1,297 (7.7%) | 1,337 (8.1%) |
| 30 to 34 Years | 1,101 (6.5%) | 1,097 (6.7%) |
| 35 to 39 Years | 1,386 (8.2%) | 1,194 (7.3%) |
| 40 to 44 Years | 1,143 (6.8%) | 1,103 (6.7%) |
| 45 to 49 Years | 943 (5.6%) | 1,017 (6.2%) |
| 50 to 54 Years | 1,040 (6.1%) | 1,144 (7.0%) |
| 55 to 59 Years | 995 (5.9%) | 844 (5.1%) |
| 60 to 64 Years | 779 (4.6%) | 894 (5.4%) |
| 65 to 69 Years | 701 (4.1%) | 594 (3.6%) |
| 70 to 74 Years | 408 (2.4%) | 367 (2.2%) |
| 75 to 79 Years | 188 (1.1%) | 372 (2.3%) |
| 80 to 84 Years | 205 (1.2%) | 188 (1.1%) |
| 85 Years and over | 209 (1.2%) | 196 (1.2%) |
| Total | 16,940 (100.0%) | 16,437 (100.0%) |
Families and Households in Bell
Median Family Size in Bell
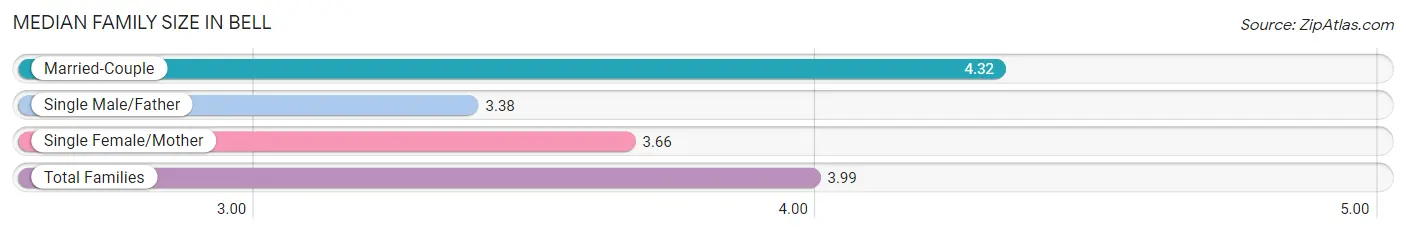
The median family size in Bell is 3.99 persons per family, with married-couple families (4,040 | 55.2%) accounting for the largest median family size of 4.32 persons per family. On the other hand, single male/father families (935 | 12.8%) represent the smallest median family size with 3.38 persons per family.
| Family Type | # Families | Family Size |
| Married-Couple | 4,040 (55.2%) | 4.32 |
| Single Male/Father | 935 (12.8%) | 3.38 |
| Single Female/Mother | 2,345 (32.0%) | 3.66 |
| Total Families | 7,320 (100.0%) | 3.99 |
Median Household Size in Bell
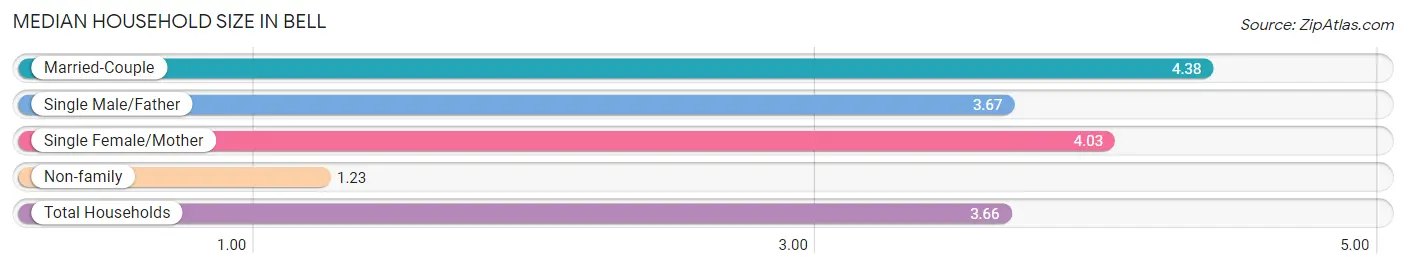
The median household size in Bell is 3.66 persons per household, with married-couple households (4,040 | 45.6%) accounting for the largest median household size of 4.38 persons per household. non-family households (1,549 | 17.5%) represent the smallest median household size with 1.23 persons per household.
| Household Type | # Households | Household Size |
| Married-Couple | 4,040 (45.6%) | 4.38 |
| Single Male/Father | 935 (10.5%) | 3.67 |
| Single Female/Mother | 2,345 (26.4%) | 4.03 |
| Non-family | 1,549 (17.5%) | 1.23 |
| Total Households | 8,869 (100.0%) | 3.66 |
Household Size by Marriage Status in Bell
Out of a total of 8,869 households in Bell, 7,320 (82.5%) are family households, while 1,549 (17.5%) are nonfamily households. The most numerous type of family households are 4-person households, comprising 1,818, and the most common type of nonfamily households are 1-person households, comprising 1,251.
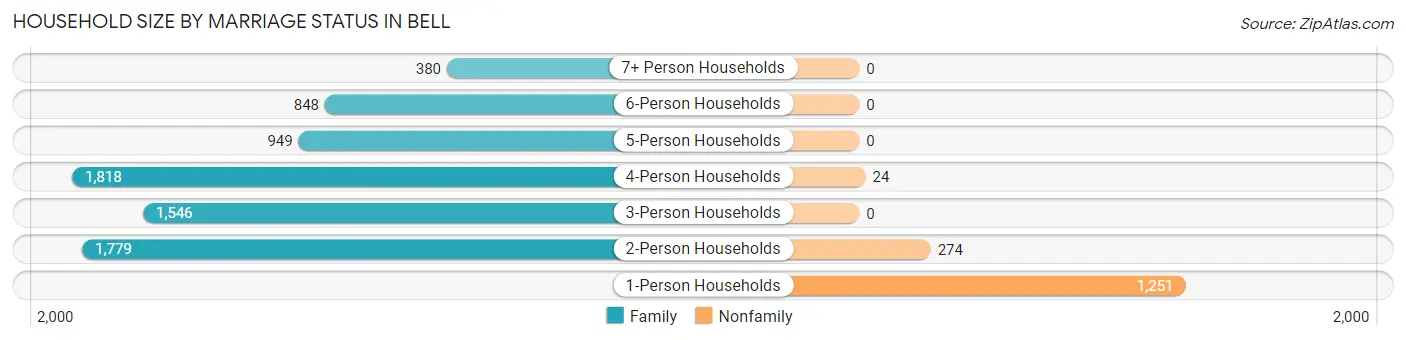
| Household Size | Family Households | Nonfamily Households |
| 1-Person Households | - | 1,251 (14.1%) |
| 2-Person Households | 1,779 (20.1%) | 274 (3.1%) |
| 3-Person Households | 1,546 (17.4%) | 0 (0.0%) |
| 4-Person Households | 1,818 (20.5%) | 24 (0.3%) |
| 5-Person Households | 949 (10.7%) | 0 (0.0%) |
| 6-Person Households | 848 (9.6%) | 0 (0.0%) |
| 7+ Person Households | 380 (4.3%) | 0 (0.0%) |
| Total | 7,320 (82.5%) | 1,549 (17.5%) |
Female Fertility in Bell
Fertility by Age in Bell
Average fertility rate in Bell is 46.0 births per 1,000 women. Women in the age bracket of 20 to 34 years have the highest fertility rate with 67.0 births per 1,000 women. Women in the age bracket of 20 to 34 years acount for 62.3% of all women with births.
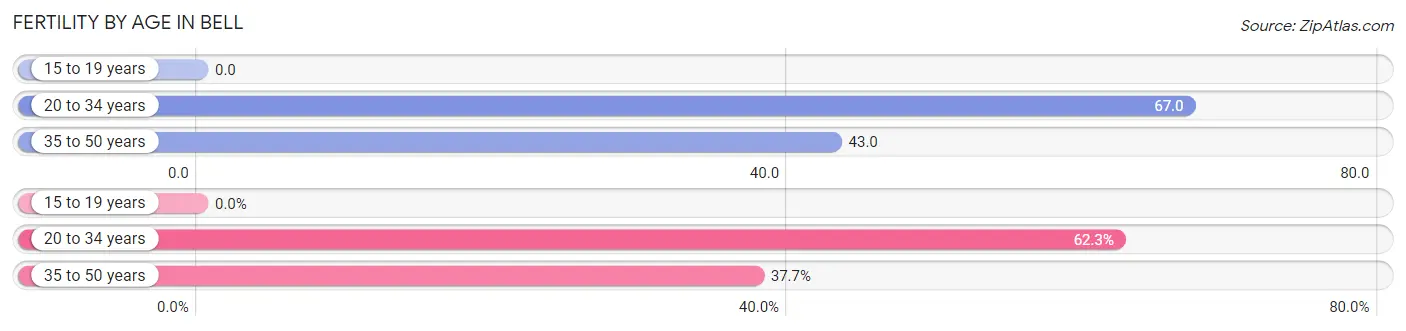
| Age Bracket | Women with Births | Births / 1,000 Women |
| 15 to 19 years | 0 (0.0%) | 0.0 |
| 20 to 34 years | 246 (62.3%) | 67.0 |
| 35 to 50 years | 149 (37.7%) | 43.0 |
| Total | 395 (100.0%) | 46.0 |
Fertility by Age by Marriage Status in Bell
48.1% of women with births (395) in Bell are married. The highest percentage of unmarried women with births falls into 35 to 50 years age bracket with 62.4% of them unmarried at the time of birth, while the lowest percentage of unmarried women with births belong to 20 to 34 years age bracket with 45.5% of them unmarried.
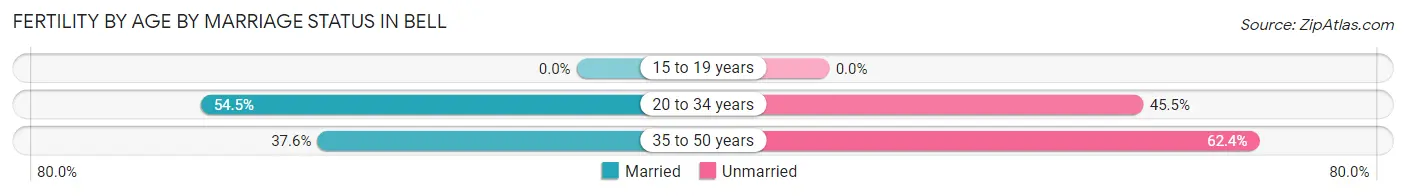
| Age Bracket | Married | Unmarried |
| 15 to 19 years | 0 (0.0%) | 0 (0.0%) |
| 20 to 34 years | 134 (54.5%) | 112 (45.5%) |
| 35 to 50 years | 56 (37.6%) | 93 (62.4%) |
| Total | 190 (48.1%) | 205 (51.9%) |
Fertility by Education in Bell
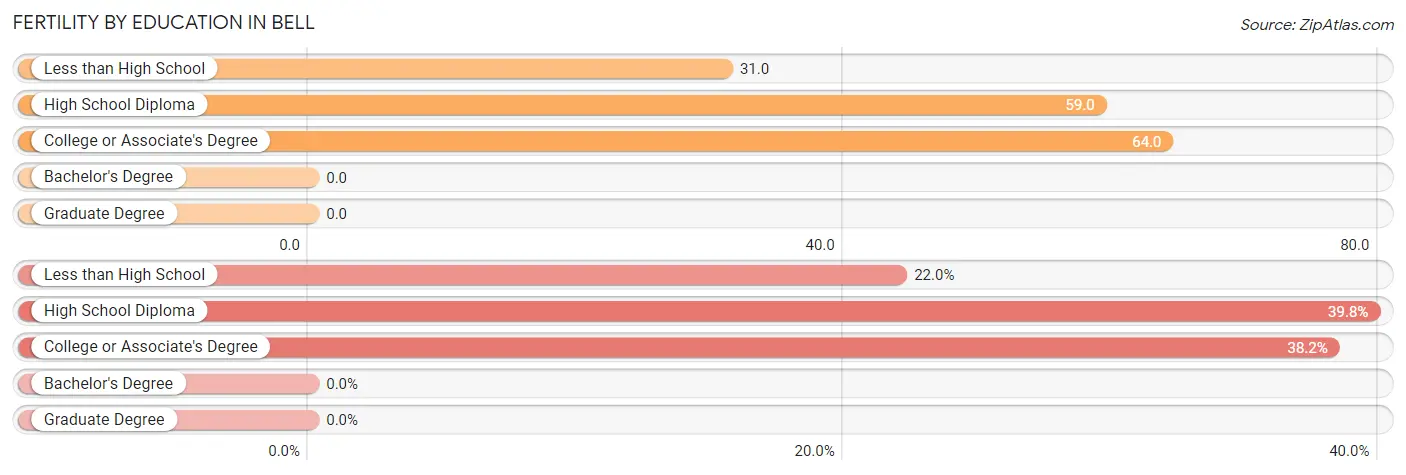
| Educational Attainment | Women with Births | Births / 1,000 Women |
| Less than High School | 87 (22.0%) | 31.0 |
| High School Diploma | 157 (39.8%) | 59.0 |
| College or Associate's Degree | 151 (38.2%) | 64.0 |
| Bachelor's Degree | 0 (0.0%) | 0.0 |
| Graduate Degree | 0 (0.0%) | 0.0 |
| Total | 395 (100.0%) | 46.0 |
Fertility by Education by Marriage Status in Bell
51.9% of women with births in Bell are unmarried. Women with the educational attainment of less than high school are most likely to be married with 70.1% of them married at childbirth, while women with the educational attainment of high school diploma are least likely to be married with 77.1% of them unmarried at childbirth.
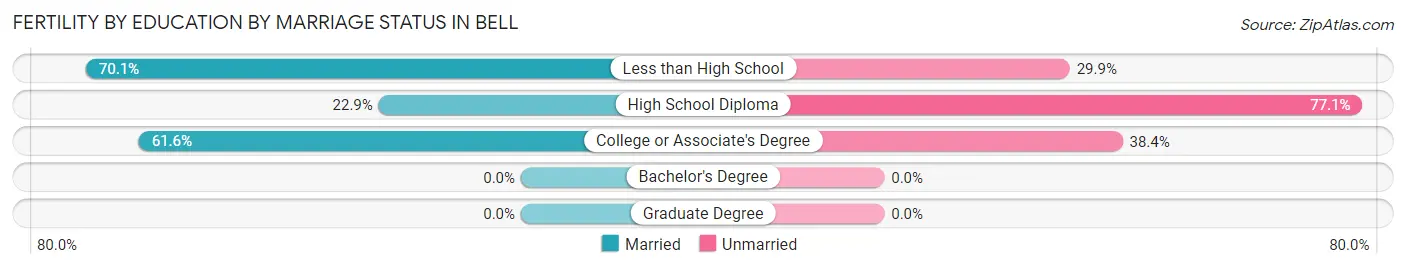
| Educational Attainment | Married | Unmarried |
| Less than High School | 61 (70.1%) | 26 (29.9%) |
| High School Diploma | 36 (22.9%) | 121 (77.1%) |
| College or Associate's Degree | 93 (61.6%) | 58 (38.4%) |
| Bachelor's Degree | 0 (0.0%) | 0 (0.0%) |
| Graduate Degree | 0 (0.0%) | 0 (0.0%) |
| Total | 190 (48.1%) | 205 (51.9%) |
Employment Characteristics in Bell
Employment by Class of Employer in Bell
Among the 14,236 employed individuals in Bell, private company employees (10,572 | 74.3%), self-employed (not incorporated) (1,275 | 9.0%), and local government employees (1,043 | 7.3%) make up the most common classes of employment.
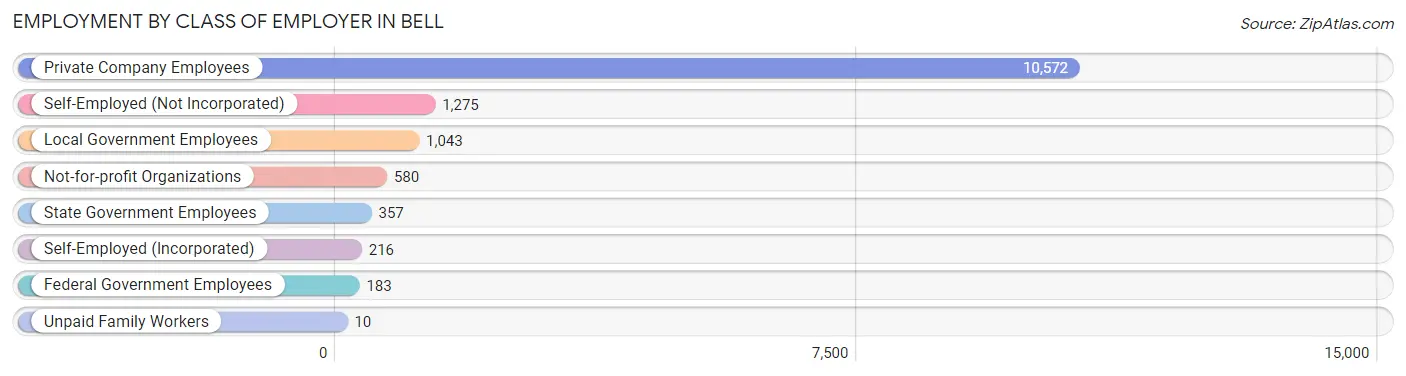
| Employer Class | # Employees | % Employees |
| Private Company Employees | 10,572 | 74.3% |
| Self-Employed (Incorporated) | 216 | 1.5% |
| Self-Employed (Not Incorporated) | 1,275 | 9.0% |
| Not-for-profit Organizations | 580 | 4.1% |
| Local Government Employees | 1,043 | 7.3% |
| State Government Employees | 357 | 2.5% |
| Federal Government Employees | 183 | 1.3% |
| Unpaid Family Workers | 10 | 0.1% |
| Total | 14,236 | 100.0% |
Employment Status by Age in Bell
According to the labor force statistics for Bell, out of the total population over 16 years of age (25,863), 60.2% or 15,570 individuals are in the labor force, with 6.5% or 1,012 of them unemployed. The age group with the highest labor force participation rate is 25 to 29 years, with 83.0% or 2,186 individuals in the labor force. Within the labor force, the 16 to 19 years age range has the highest percentage of unemployed individuals, with 24.3% or 117 of them being unemployed.
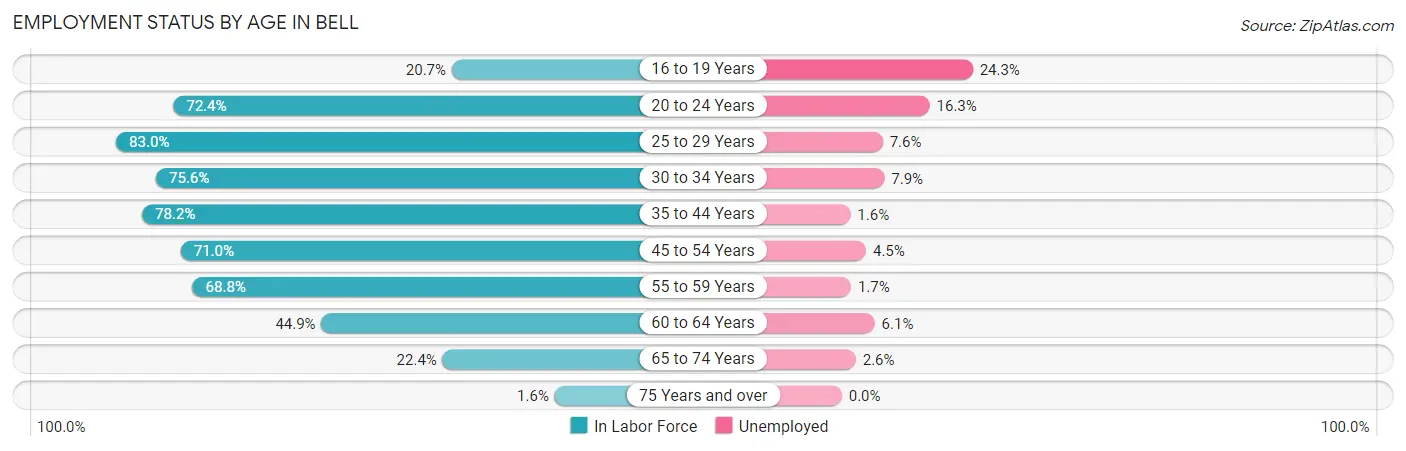
| Age Bracket | In Labor Force | Unemployed |
| 16 to 19 Years | 483 (20.7%) | 117 (24.3%) |
| 20 to 24 Years | 2,020 (72.4%) | 329 (16.3%) |
| 25 to 29 Years | 2,186 (83.0%) | 166 (7.6%) |
| 30 to 34 Years | 1,662 (75.6%) | 131 (7.9%) |
| 35 to 44 Years | 3,774 (78.2%) | 60 (1.6%) |
| 45 to 54 Years | 2,942 (71.0%) | 132 (4.5%) |
| 55 to 59 Years | 1,265 (68.8%) | 22 (1.7%) |
| 60 to 64 Years | 751 (44.9%) | 46 (6.1%) |
| 65 to 74 Years | 464 (22.4%) | 12 (2.6%) |
| 75 Years and over | 22 (1.6%) | 0 (0.0%) |
| Total | 15,570 (60.2%) | 1,012 (6.5%) |
Employment Status by Educational Attainment in Bell
According to labor force statistics for Bell, 72.7% of individuals (12,587) out of the total population between 25 and 64 years of age (17,314) are in the labor force, with 4.4% or 554 of them being unemployed. The group with the highest labor force participation rate are those with the educational attainment of bachelor's degree or higher, with 91.9% or 1,526 individuals in the labor force. Within the labor force, individuals with bachelor's degree or higher education have the highest percentage of unemployment, with 6.6% or 101 of them being unemployed.
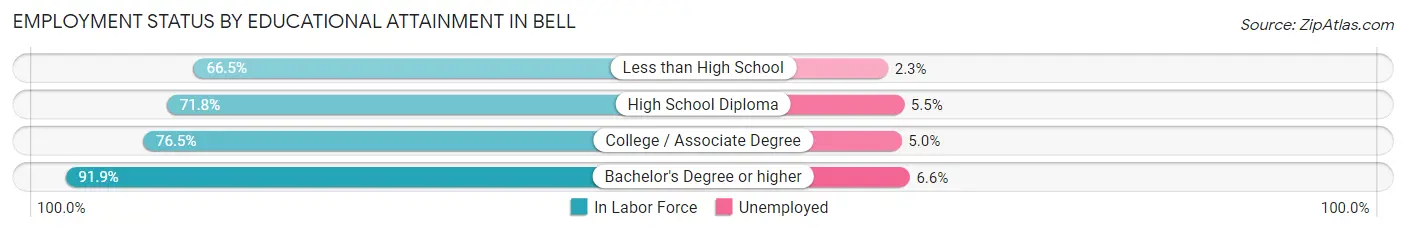
| Educational Attainment | In Labor Force | Unemployed |
| Less than High School | 4,370 (66.5%) | 151 (2.3%) |
| High School Diploma | 4,026 (71.8%) | 308 (5.5%) |
| College / Associate Degree | 2,658 (76.5%) | 174 (5.0%) |
| Bachelor's Degree or higher | 1,526 (91.9%) | 110 (6.6%) |
| Total | 12,587 (72.7%) | 762 (4.4%) |
Employment Occupations by Sex in Bell
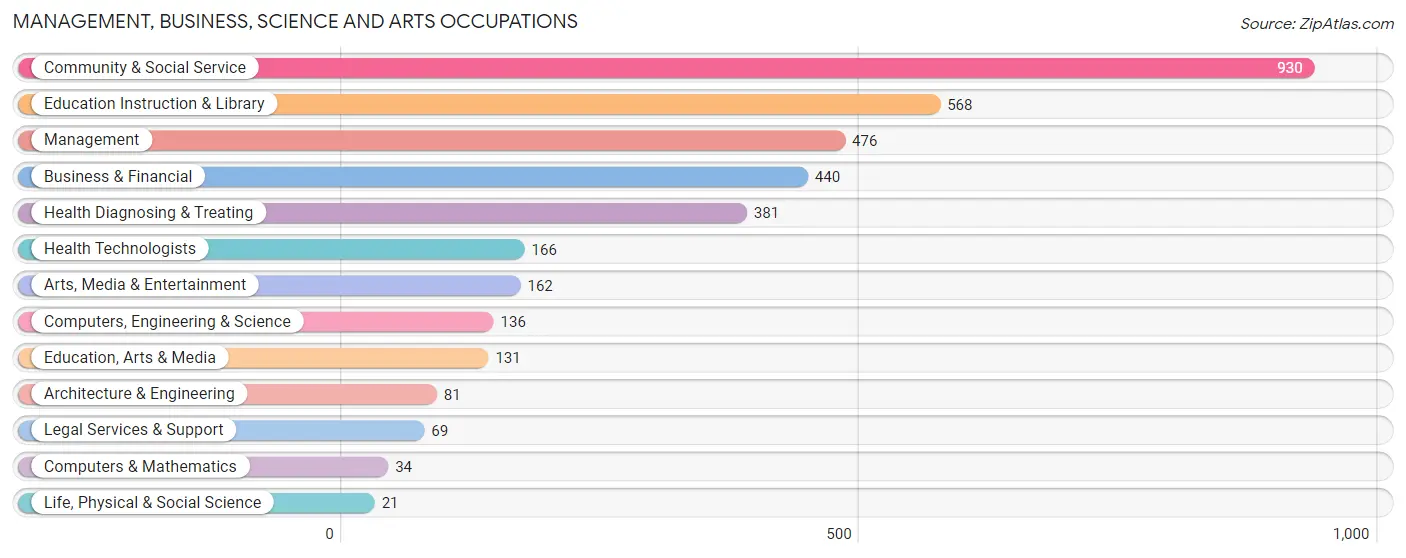
Management, Business, Science and Arts Occupations
The most common Management, Business, Science and Arts occupations in Bell are Community & Social Service (930 | 6.4%), Education Instruction & Library (568 | 3.9%), Management (476 | 3.3%), Business & Financial (440 | 3.0%), and Health Diagnosing & Treating (381 | 2.6%).
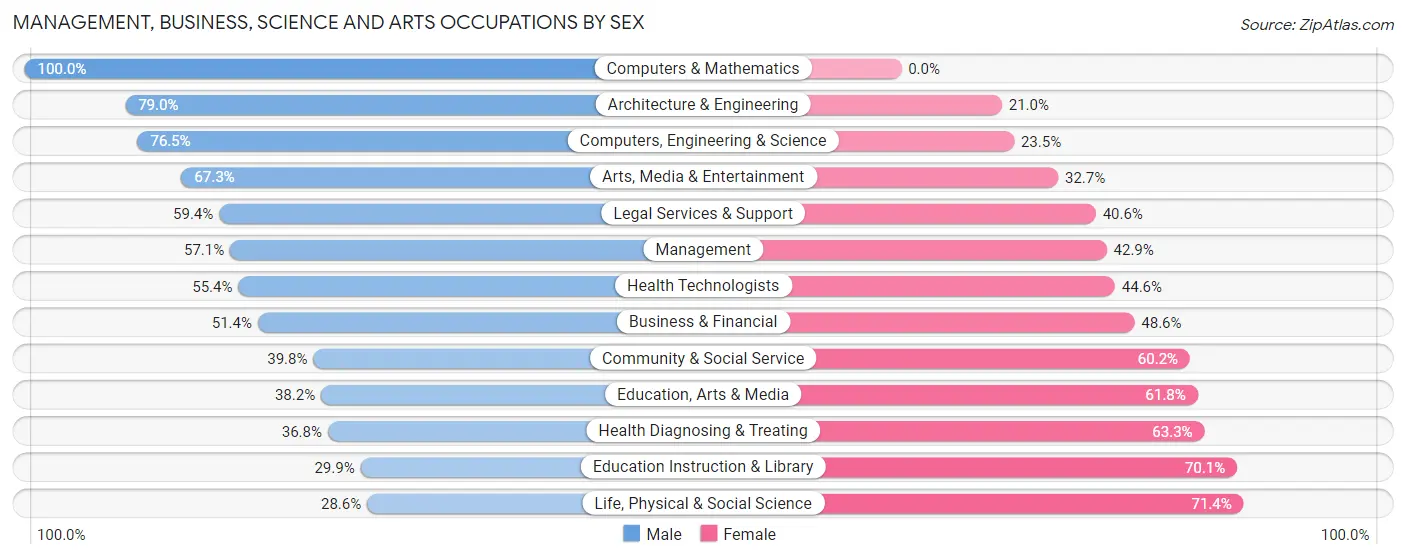
Management, Business, Science and Arts Occupations by Sex
Within the Management, Business, Science and Arts occupations in Bell, the most male-oriented occupations are Computers & Mathematics (100.0%), Architecture & Engineering (79.0%), and Computers, Engineering & Science (76.5%), while the most female-oriented occupations are Life, Physical & Social Science (71.4%), Education Instruction & Library (70.1%), and Health Diagnosing & Treating (63.2%).
| Occupation | Male | Female |
| Management | 272 (57.1%) | 204 (42.9%) |
| Business & Financial | 226 (51.4%) | 214 (48.6%) |
| Computers, Engineering & Science | 104 (76.5%) | 32 (23.5%) |
| Computers & Mathematics | 34 (100.0%) | 0 (0.0%) |
| Architecture & Engineering | 64 (79.0%) | 17 (21.0%) |
| Life, Physical & Social Science | 6 (28.6%) | 15 (71.4%) |
| Community & Social Service | 370 (39.8%) | 560 (60.2%) |
| Education, Arts & Media | 50 (38.2%) | 81 (61.8%) |
| Legal Services & Support | 41 (59.4%) | 28 (40.6%) |
| Education Instruction & Library | 170 (29.9%) | 398 (70.1%) |
| Arts, Media & Entertainment | 109 (67.3%) | 53 (32.7%) |
| Health Diagnosing & Treating | 140 (36.7%) | 241 (63.2%) |
| Health Technologists | 92 (55.4%) | 74 (44.6%) |
| Total (Category) | 1,112 (47.1%) | 1,251 (52.9%) |
| Total (Overall) | 8,265 (56.8%) | 6,287 (43.2%) |
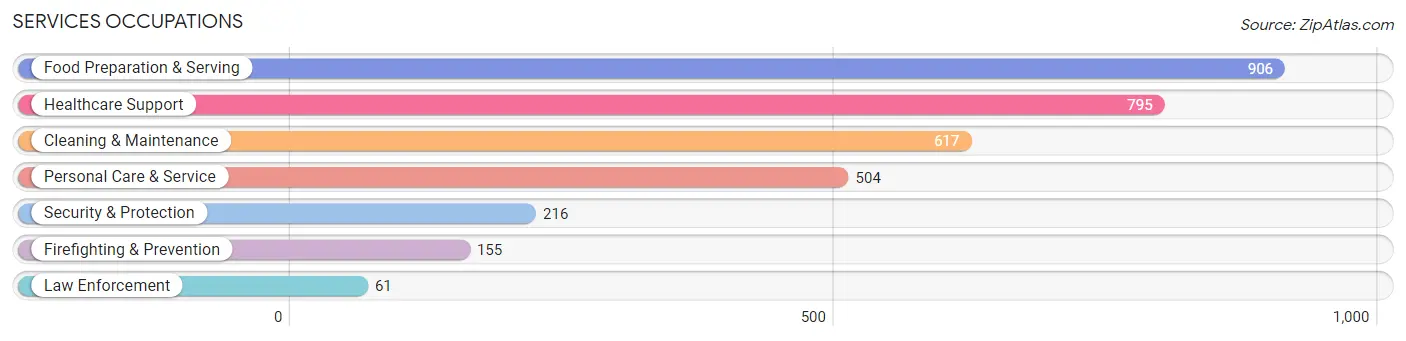
Services Occupations
The most common Services occupations in Bell are Food Preparation & Serving (906 | 6.2%), Healthcare Support (795 | 5.5%), Cleaning & Maintenance (617 | 4.2%), Personal Care & Service (504 | 3.5%), and Security & Protection (216 | 1.5%).
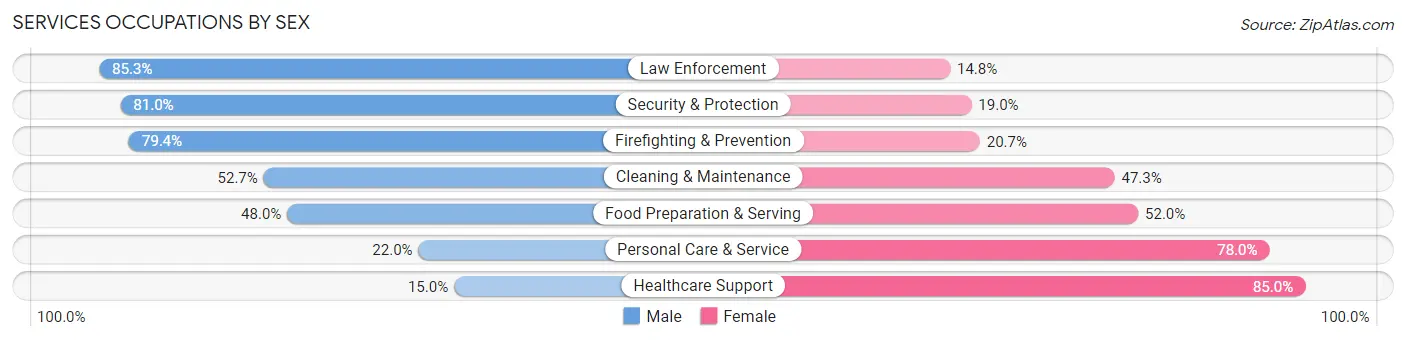
Services Occupations by Sex
Within the Services occupations in Bell, the most male-oriented occupations are Law Enforcement (85.3%), Security & Protection (81.0%), and Firefighting & Prevention (79.3%), while the most female-oriented occupations are Healthcare Support (85.0%), Personal Care & Service (78.0%), and Food Preparation & Serving (52.0%).
| Occupation | Male | Female |
| Healthcare Support | 119 (15.0%) | 676 (85.0%) |
| Security & Protection | 175 (81.0%) | 41 (19.0%) |
| Firefighting & Prevention | 123 (79.3%) | 32 (20.6%) |
| Law Enforcement | 52 (85.3%) | 9 (14.7%) |
| Food Preparation & Serving | 435 (48.0%) | 471 (52.0%) |
| Cleaning & Maintenance | 325 (52.7%) | 292 (47.3%) |
| Personal Care & Service | 111 (22.0%) | 393 (78.0%) |
| Total (Category) | 1,165 (38.4%) | 1,873 (61.7%) |
| Total (Overall) | 8,265 (56.8%) | 6,287 (43.2%) |
Sales and Office Occupations
The most common Sales and Office occupations in Bell are Office & Administration (1,760 | 12.1%), and Sales & Related (1,370 | 9.4%).

Sales and Office Occupations by Sex
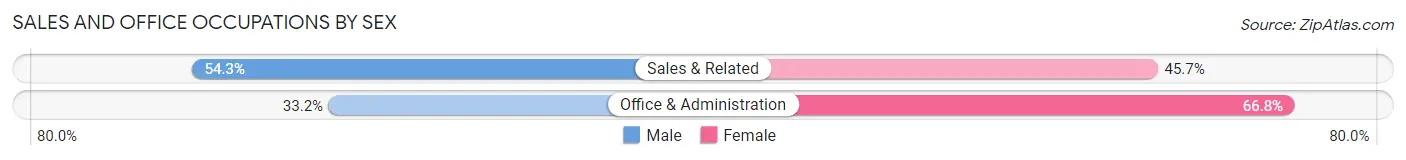
| Occupation | Male | Female |
| Sales & Related | 744 (54.3%) | 626 (45.7%) |
| Office & Administration | 584 (33.2%) | 1,176 (66.8%) |
| Total (Category) | 1,328 (42.4%) | 1,802 (57.6%) |
| Total (Overall) | 8,265 (56.8%) | 6,287 (43.2%) |
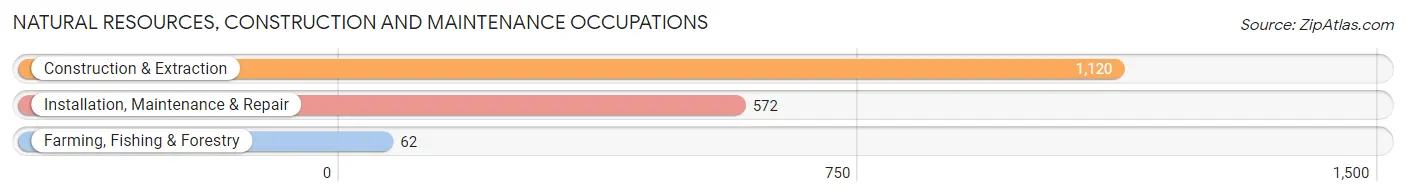
Natural Resources, Construction and Maintenance Occupations
The most common Natural Resources, Construction and Maintenance occupations in Bell are Construction & Extraction (1,120 | 7.7%), Installation, Maintenance & Repair (572 | 3.9%), and Farming, Fishing & Forestry (62 | 0.4%).
Natural Resources, Construction and Maintenance Occupations by Sex
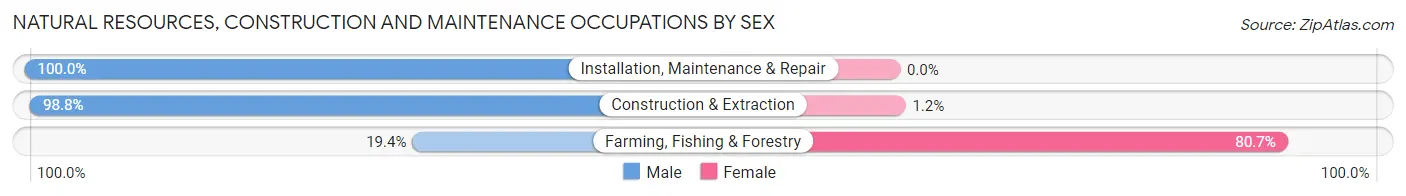
| Occupation | Male | Female |
| Farming, Fishing & Forestry | 12 (19.4%) | 50 (80.6%) |
| Construction & Extraction | 1,107 (98.8%) | 13 (1.2%) |
| Installation, Maintenance & Repair | 572 (100.0%) | 0 (0.0%) |
| Total (Category) | 1,691 (96.4%) | 63 (3.6%) |
| Total (Overall) | 8,265 (56.8%) | 6,287 (43.2%) |
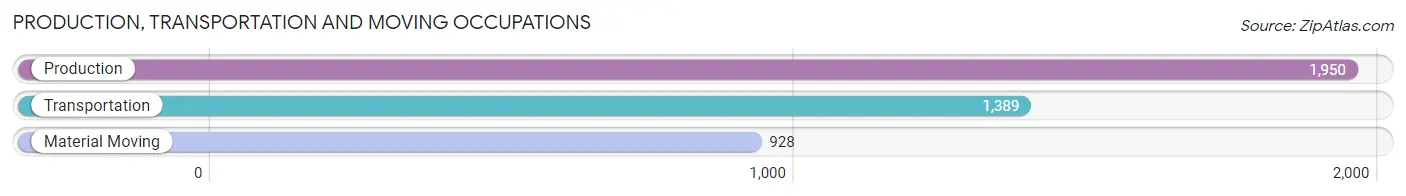
Production, Transportation and Moving Occupations
The most common Production, Transportation and Moving occupations in Bell are Production (1,950 | 13.4%), Transportation (1,389 | 9.6%), and Material Moving (928 | 6.4%).
Production, Transportation and Moving Occupations by Sex
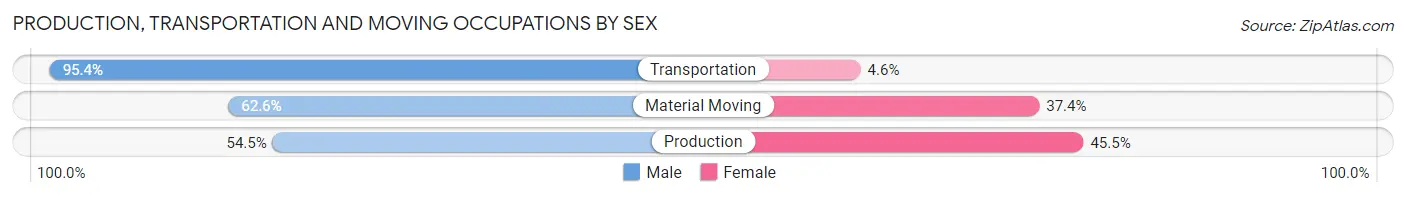
| Occupation | Male | Female |
| Production | 1,063 (54.5%) | 887 (45.5%) |
| Transportation | 1,325 (95.4%) | 64 (4.6%) |
| Material Moving | 581 (62.6%) | 347 (37.4%) |
| Total (Category) | 2,969 (69.6%) | 1,298 (30.4%) |
| Total (Overall) | 8,265 (56.8%) | 6,287 (43.2%) |
Employment Industries by Sex in Bell
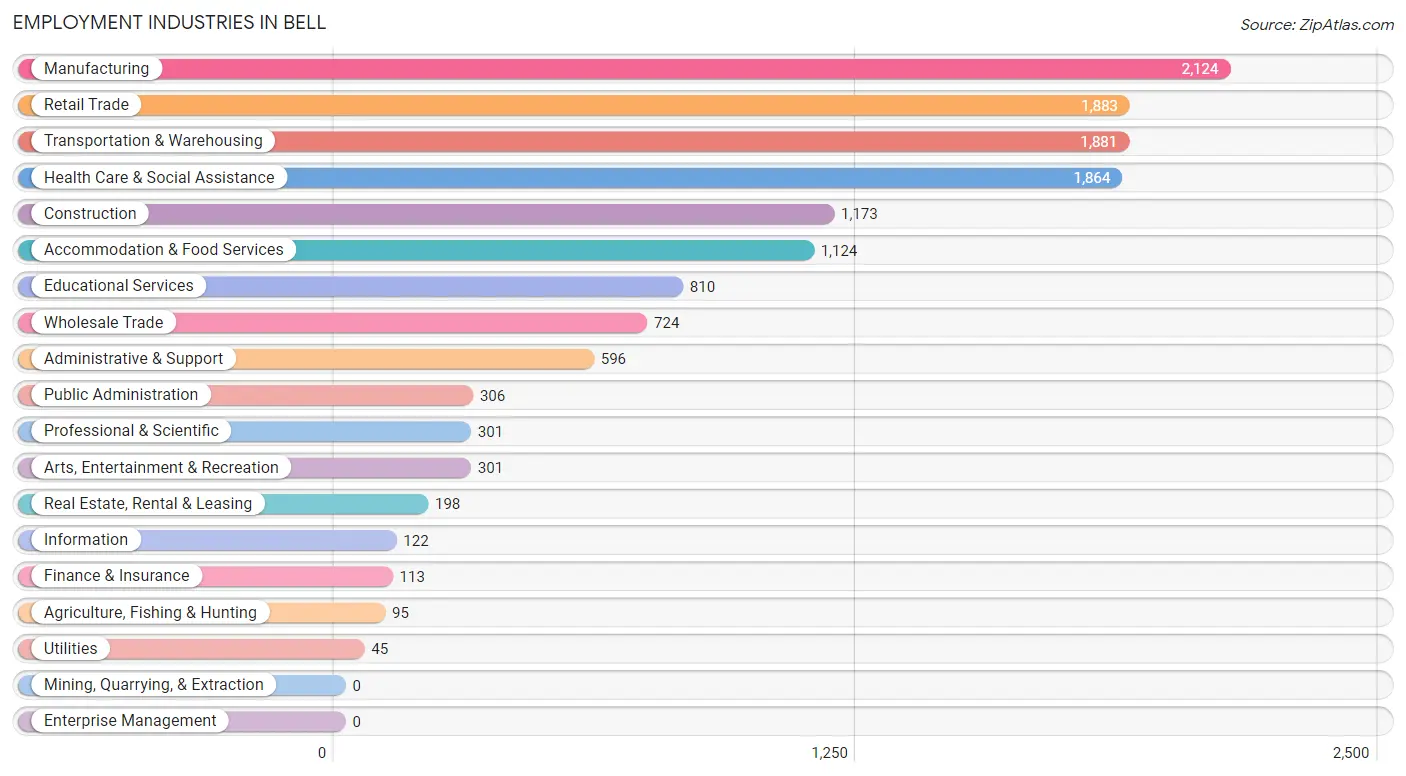
Employment Industries in Bell
The major employment industries in Bell include Manufacturing (2,124 | 14.6%), Retail Trade (1,883 | 12.9%), Transportation & Warehousing (1,881 | 12.9%), Health Care & Social Assistance (1,864 | 12.8%), and Construction (1,173 | 8.1%).
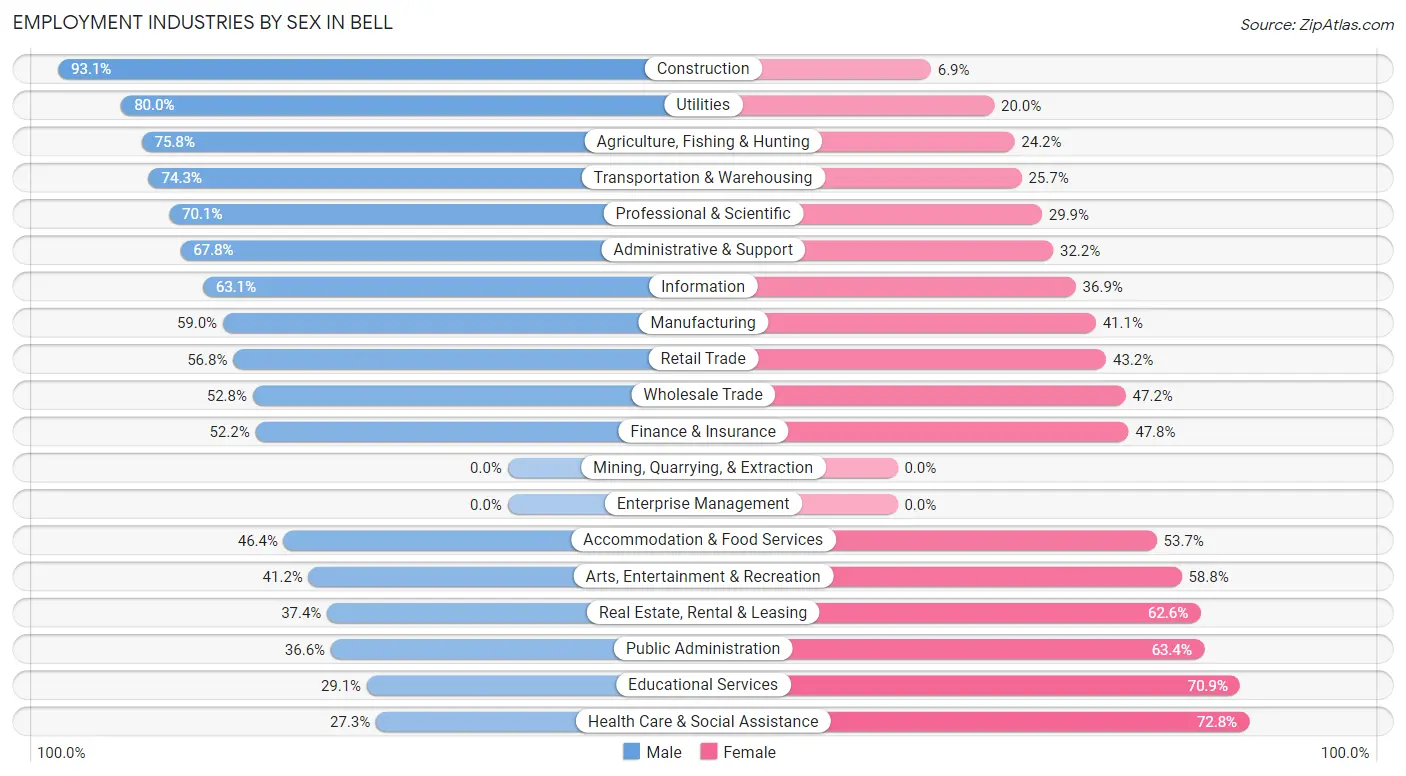
Employment Industries by Sex in Bell
The Bell industries that see more men than women are Construction (93.1%), Utilities (80.0%), and Agriculture, Fishing & Hunting (75.8%), whereas the industries that tend to have a higher number of women are Health Care & Social Assistance (72.8%), Educational Services (70.9%), and Public Administration (63.4%).
| Industry | Male | Female |
| Agriculture, Fishing & Hunting | 72 (75.8%) | 23 (24.2%) |
| Mining, Quarrying, & Extraction | 0 (0.0%) | 0 (0.0%) |
| Construction | 1,092 (93.1%) | 81 (6.9%) |
| Manufacturing | 1,252 (59.0%) | 872 (41.0%) |
| Wholesale Trade | 382 (52.8%) | 342 (47.2%) |
| Retail Trade | 1,070 (56.8%) | 813 (43.2%) |
| Transportation & Warehousing | 1,398 (74.3%) | 483 (25.7%) |
| Utilities | 36 (80.0%) | 9 (20.0%) |
| Information | 77 (63.1%) | 45 (36.9%) |
| Finance & Insurance | 59 (52.2%) | 54 (47.8%) |
| Real Estate, Rental & Leasing | 74 (37.4%) | 124 (62.6%) |
| Professional & Scientific | 211 (70.1%) | 90 (29.9%) |
| Enterprise Management | 0 (0.0%) | 0 (0.0%) |
| Administrative & Support | 404 (67.8%) | 192 (32.2%) |
| Educational Services | 236 (29.1%) | 574 (70.9%) |
| Health Care & Social Assistance | 508 (27.3%) | 1,356 (72.8%) |
| Arts, Entertainment & Recreation | 124 (41.2%) | 177 (58.8%) |
| Accommodation & Food Services | 521 (46.4%) | 603 (53.6%) |
| Public Administration | 112 (36.6%) | 194 (63.4%) |
| Total | 8,265 (56.8%) | 6,287 (43.2%) |
Education in Bell
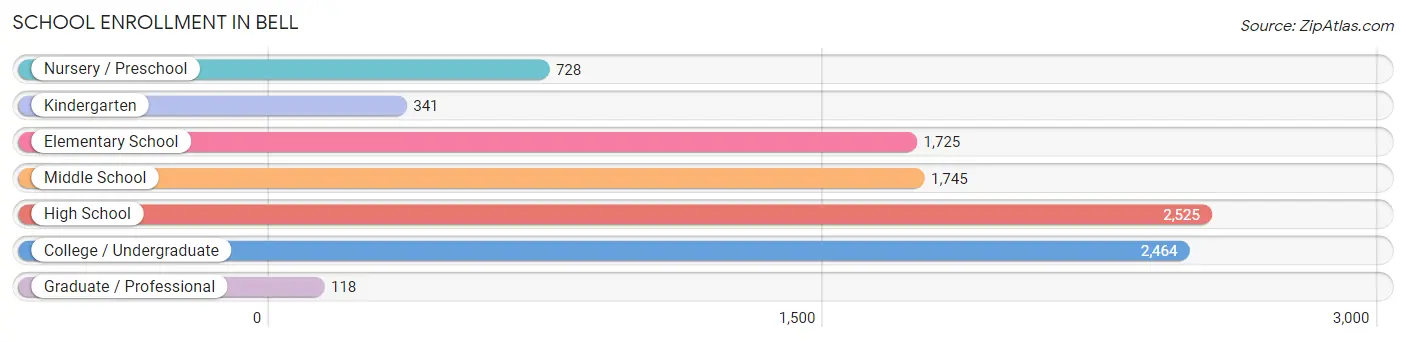
School Enrollment in Bell
The most common levels of schooling among the 9,646 students in Bell are high school (2,525 | 26.2%), college / undergraduate (2,464 | 25.5%), and middle school (1,745 | 18.1%).
| School Level | # Students | % Students |
| Nursery / Preschool | 728 | 7.5% |
| Kindergarten | 341 | 3.5% |
| Elementary School | 1,725 | 17.9% |
| Middle School | 1,745 | 18.1% |
| High School | 2,525 | 26.2% |
| College / Undergraduate | 2,464 | 25.5% |
| Graduate / Professional | 118 | 1.2% |
| Total | 9,646 | 100.0% |
School Enrollment by Age by Funding Source in Bell
Out of a total of 9,646 students who are enrolled in schools in Bell, 357 (3.7%) attend a private institution, while the remaining 9,289 (96.3%) are enrolled in public schools. The age group of 25 to 34 year olds has the highest likelihood of being enrolled in private schools, with 58 (8.7% in the age bracket) enrolled. Conversely, the age group of 35 years and over has the lowest likelihood of being enrolled in a private school, with 266 (100.0% in the age bracket) attending a public institution.
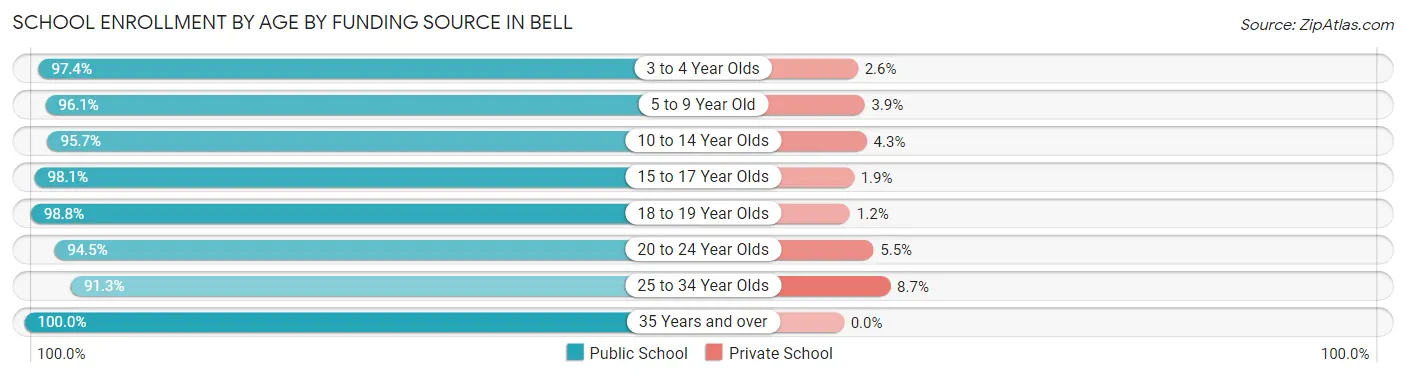
| Age Bracket | Public School | Private School |
| 3 to 4 Year Olds | 560 (97.4%) | 15 (2.6%) |
| 5 to 9 Year Old | 1,932 (96.1%) | 78 (3.9%) |
| 10 to 14 Year Olds | 2,326 (95.7%) | 104 (4.3%) |
| 15 to 17 Year Olds | 1,624 (98.1%) | 31 (1.9%) |
| 18 to 19 Year Olds | 854 (98.8%) | 10 (1.2%) |
| 20 to 24 Year Olds | 1,111 (94.5%) | 65 (5.5%) |
| 25 to 34 Year Olds | 612 (91.3%) | 58 (8.7%) |
| 35 Years and over | 266 (100.0%) | 0 (0.0%) |
| Total | 9,289 (96.3%) | 357 (3.7%) |
Educational Attainment by Field of Study in Bell
Business (329 | 16.5%), science & technology (318 | 15.9%), education (221 | 11.1%), social sciences (219 | 11.0%), and communications (194 | 9.7%) are the most common fields of study among 1,999 individuals in Bell who have obtained a bachelor's degree or higher.
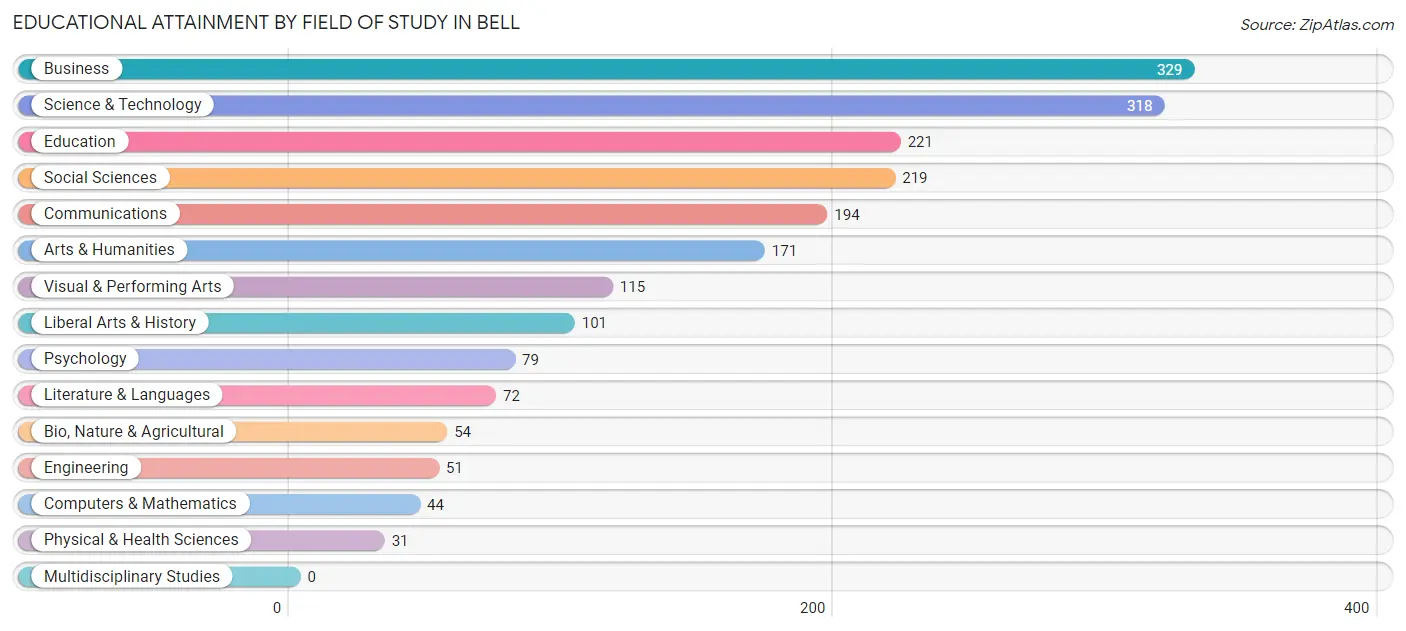
| Field of Study | # Graduates | % Graduates |
| Computers & Mathematics | 44 | 2.2% |
| Bio, Nature & Agricultural | 54 | 2.7% |
| Physical & Health Sciences | 31 | 1.5% |
| Psychology | 79 | 4.0% |
| Social Sciences | 219 | 11.0% |
| Engineering | 51 | 2.5% |
| Multidisciplinary Studies | 0 | 0.0% |
| Science & Technology | 318 | 15.9% |
| Business | 329 | 16.5% |
| Education | 221 | 11.1% |
| Literature & Languages | 72 | 3.6% |
| Liberal Arts & History | 101 | 5.1% |
| Visual & Performing Arts | 115 | 5.8% |
| Communications | 194 | 9.7% |
| Arts & Humanities | 171 | 8.6% |
| Total | 1,999 | 100.0% |
Transportation & Commute in Bell
Vehicle Availability by Sex in Bell
The most prevalent vehicle ownership categories in Bell are males with 2 vehicles (3,132, accounting for 38.8%) and females with 2 vehicles (2,240, making up 51.3%).
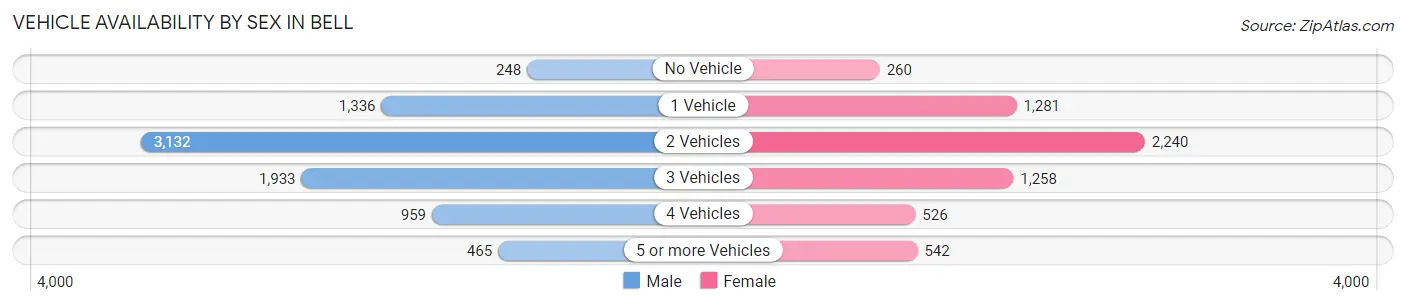
| Vehicles Available | Male | Female |
| No Vehicle | 248 (3.1%) | 260 (4.3%) |
| 1 Vehicle | 1,336 (16.6%) | 1,281 (21.0%) |
| 2 Vehicles | 3,132 (38.8%) | 2,240 (36.7%) |
| 3 Vehicles | 1,933 (23.9%) | 1,258 (20.6%) |
| 4 Vehicles | 959 (11.9%) | 526 (8.6%) |
| 5 or more Vehicles | 465 (5.8%) | 542 (8.9%) |
| Total | 8,073 (100.0%) | 6,107 (100.0%) |
Commute Time in Bell
The most frequently occuring commute durations in Bell are 30 to 34 minutes (3,448 commuters, 25.2%), 20 to 24 minutes (2,257 commuters, 16.5%), and 15 to 19 minutes (1,943 commuters, 14.2%).
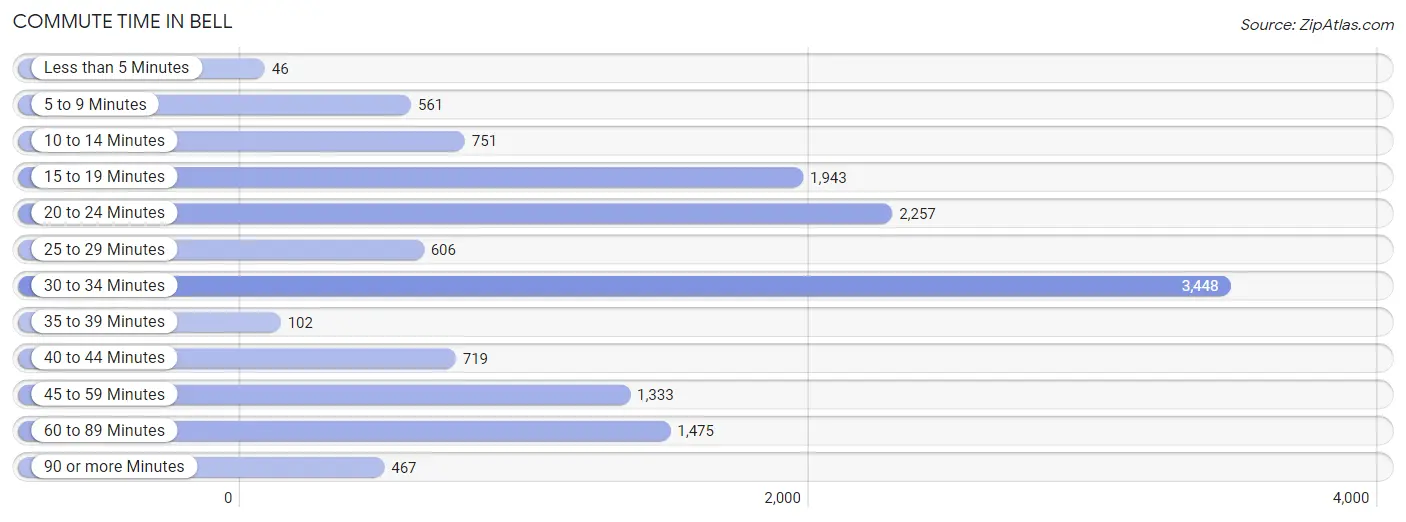
| Commute Time | # Commuters | % Commuters |
| Less than 5 Minutes | 46 | 0.3% |
| 5 to 9 Minutes | 561 | 4.1% |
| 10 to 14 Minutes | 751 | 5.5% |
| 15 to 19 Minutes | 1,943 | 14.2% |
| 20 to 24 Minutes | 2,257 | 16.5% |
| 25 to 29 Minutes | 606 | 4.4% |
| 30 to 34 Minutes | 3,448 | 25.2% |
| 35 to 39 Minutes | 102 | 0.7% |
| 40 to 44 Minutes | 719 | 5.2% |
| 45 to 59 Minutes | 1,333 | 9.7% |
| 60 to 89 Minutes | 1,475 | 10.8% |
| 90 or more Minutes | 467 | 3.4% |
Commute Time by Sex in Bell
The most common commute times in Bell are 30 to 34 minutes (2,064 commuters, 26.1%) for males and 30 to 34 minutes (1,384 commuters, 23.9%) for females.
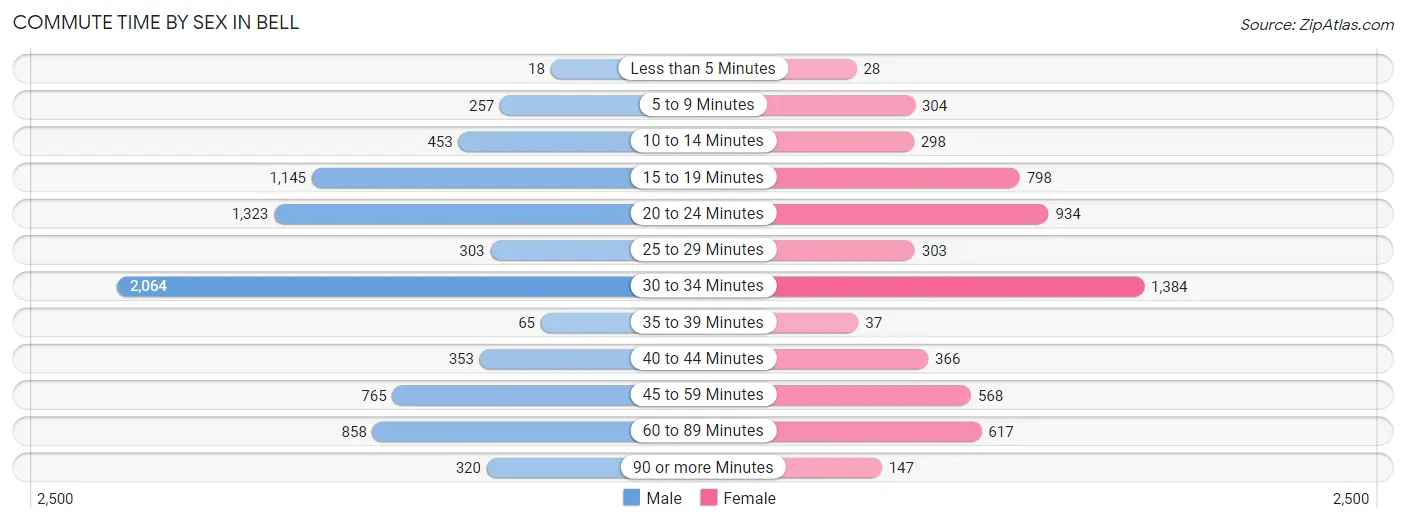
| Commute Time | Male | Female |
| Less than 5 Minutes | 18 (0.2%) | 28 (0.5%) |
| 5 to 9 Minutes | 257 (3.2%) | 304 (5.3%) |
| 10 to 14 Minutes | 453 (5.7%) | 298 (5.1%) |
| 15 to 19 Minutes | 1,145 (14.4%) | 798 (13.8%) |
| 20 to 24 Minutes | 1,323 (16.7%) | 934 (16.2%) |
| 25 to 29 Minutes | 303 (3.8%) | 303 (5.2%) |
| 30 to 34 Minutes | 2,064 (26.1%) | 1,384 (23.9%) |
| 35 to 39 Minutes | 65 (0.8%) | 37 (0.6%) |
| 40 to 44 Minutes | 353 (4.4%) | 366 (6.3%) |
| 45 to 59 Minutes | 765 (9.7%) | 568 (9.8%) |
| 60 to 89 Minutes | 858 (10.8%) | 617 (10.7%) |
| 90 or more Minutes | 320 (4.0%) | 147 (2.5%) |
Time of Departure to Work by Sex in Bell
The most frequent times of departure to work in Bell are 12:00 AM to 4:59 AM (1,155, 14.6%) for males and 7:00 AM to 7:29 AM (770, 13.3%) for females.
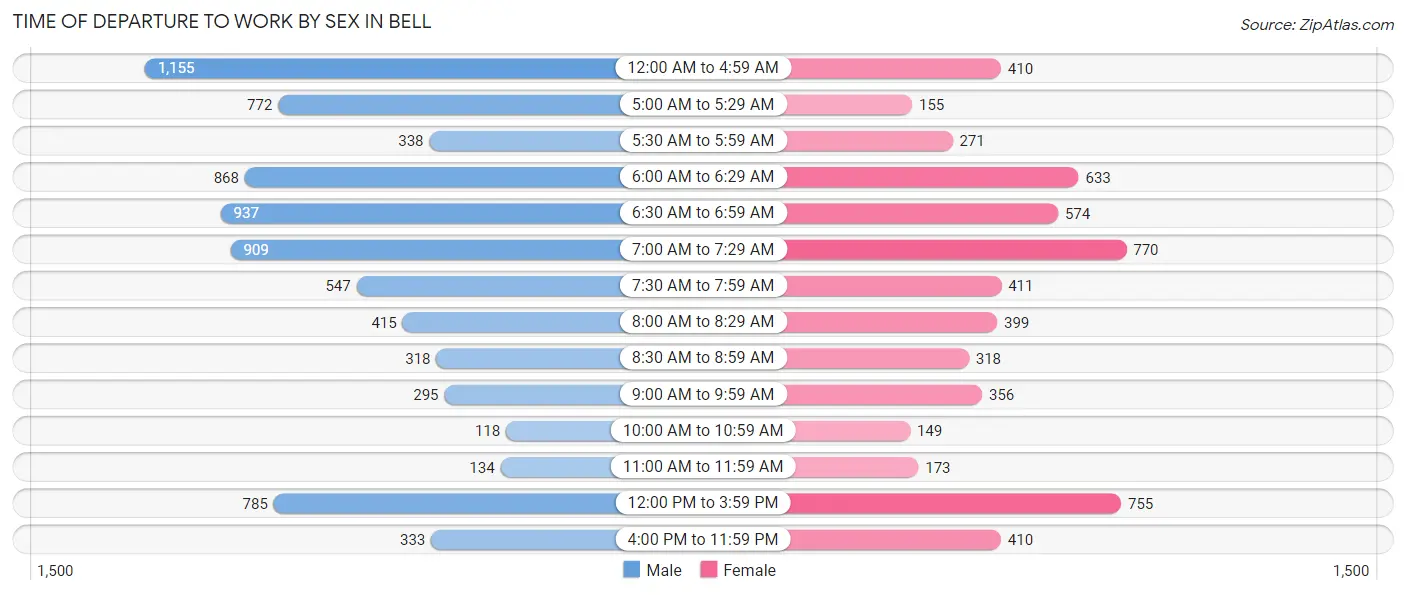
| Time of Departure | Male | Female |
| 12:00 AM to 4:59 AM | 1,155 (14.6%) | 410 (7.1%) |
| 5:00 AM to 5:29 AM | 772 (9.7%) | 155 (2.7%) |
| 5:30 AM to 5:59 AM | 338 (4.3%) | 271 (4.7%) |
| 6:00 AM to 6:29 AM | 868 (11.0%) | 633 (10.9%) |
| 6:30 AM to 6:59 AM | 937 (11.8%) | 574 (9.9%) |
| 7:00 AM to 7:29 AM | 909 (11.5%) | 770 (13.3%) |
| 7:30 AM to 7:59 AM | 547 (6.9%) | 411 (7.1%) |
| 8:00 AM to 8:29 AM | 415 (5.2%) | 399 (6.9%) |
| 8:30 AM to 8:59 AM | 318 (4.0%) | 318 (5.5%) |
| 9:00 AM to 9:59 AM | 295 (3.7%) | 356 (6.1%) |
| 10:00 AM to 10:59 AM | 118 (1.5%) | 149 (2.6%) |
| 11:00 AM to 11:59 AM | 134 (1.7%) | 173 (3.0%) |
| 12:00 PM to 3:59 PM | 785 (9.9%) | 755 (13.1%) |
| 4:00 PM to 11:59 PM | 333 (4.2%) | 410 (7.1%) |
| Total | 7,924 (100.0%) | 5,784 (100.0%) |
Housing Occupancy in Bell
Occupancy by Ownership in Bell
Of the total 8,869 dwellings in Bell, owner-occupied units account for 2,483 (28.0%), while renter-occupied units make up 6,386 (72.0%).
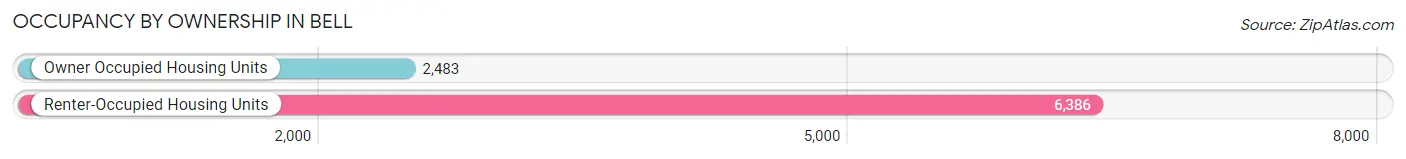
| Occupancy | # Housing Units | % Housing Units |
| Owner Occupied Housing Units | 2,483 | 28.0% |
| Renter-Occupied Housing Units | 6,386 | 72.0% |
| Total Occupied Housing Units | 8,869 | 100.0% |
Occupancy by Household Size in Bell
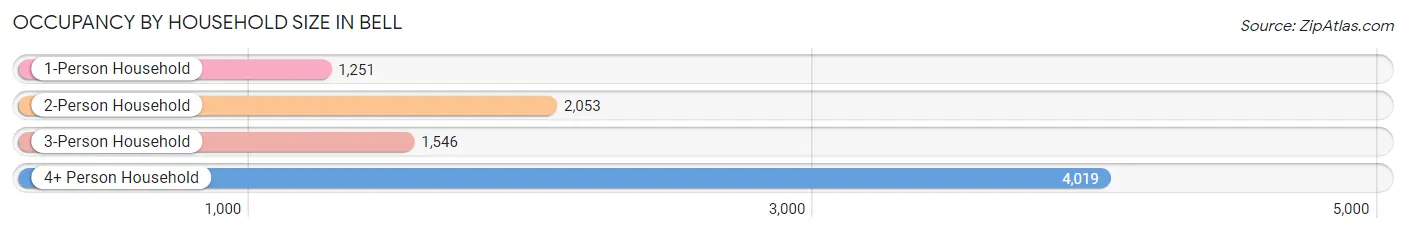
| Household Size | # Housing Units | % Housing Units |
| 1-Person Household | 1,251 | 14.1% |
| 2-Person Household | 2,053 | 23.2% |
| 3-Person Household | 1,546 | 17.4% |
| 4+ Person Household | 4,019 | 45.3% |
| Total Housing Units | 8,869 | 100.0% |
Occupancy by Ownership by Household Size in Bell
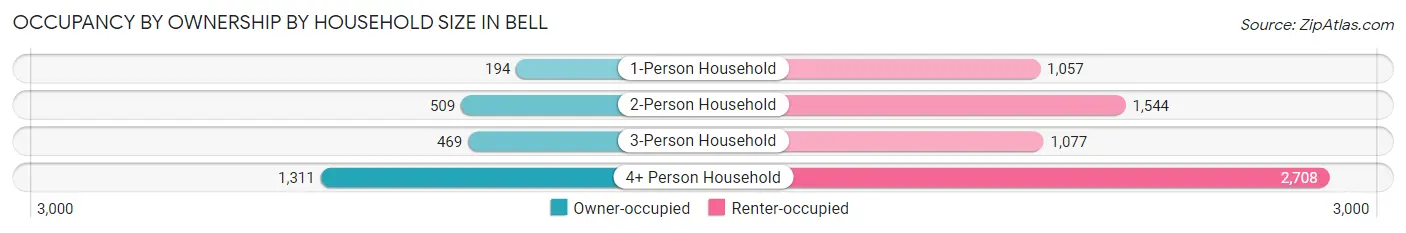
| Household Size | Owner-occupied | Renter-occupied |
| 1-Person Household | 194 (15.5%) | 1,057 (84.5%) |
| 2-Person Household | 509 (24.8%) | 1,544 (75.2%) |
| 3-Person Household | 469 (30.3%) | 1,077 (69.7%) |
| 4+ Person Household | 1,311 (32.6%) | 2,708 (67.4%) |
| Total Housing Units | 2,483 (28.0%) | 6,386 (72.0%) |
Occupancy by Educational Attainment in Bell
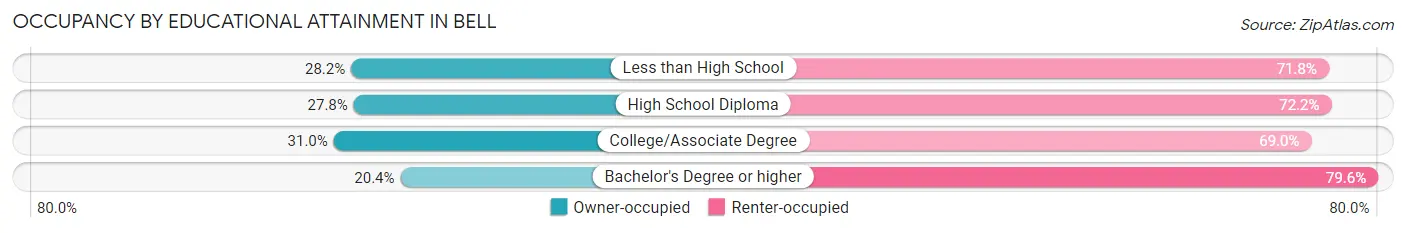
| Household Size | Owner-occupied | Renter-occupied |
| Less than High School | 1,069 (28.2%) | 2,719 (71.8%) |
| High School Diploma | 710 (27.8%) | 1,843 (72.2%) |
| College/Associate Degree | 551 (31.0%) | 1,227 (69.0%) |
| Bachelor's Degree or higher | 153 (20.4%) | 597 (79.6%) |
Occupancy by Age of Householder in Bell
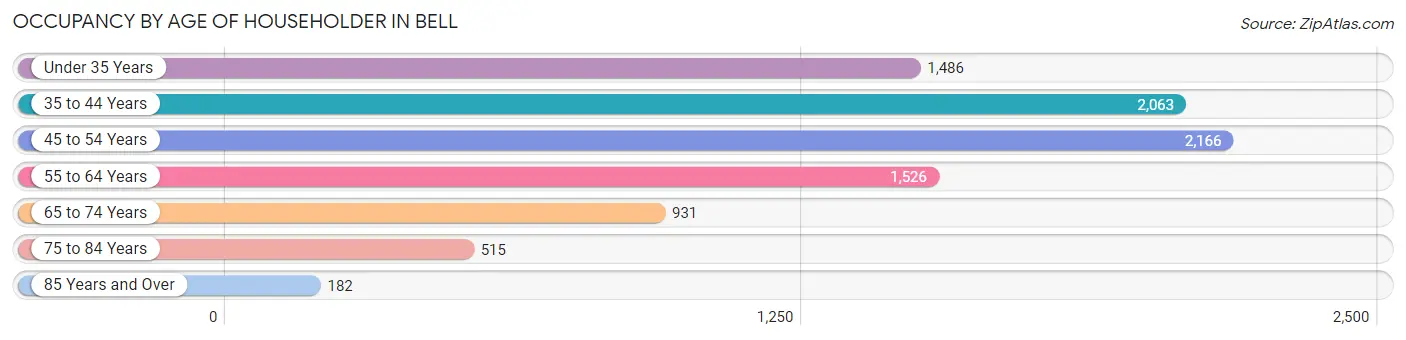
| Age Bracket | # Households | % Households |
| Under 35 Years | 1,486 | 16.8% |
| 35 to 44 Years | 2,063 | 23.3% |
| 45 to 54 Years | 2,166 | 24.4% |
| 55 to 64 Years | 1,526 | 17.2% |
| 65 to 74 Years | 931 | 10.5% |
| 75 to 84 Years | 515 | 5.8% |
| 85 Years and Over | 182 | 2.1% |
| Total | 8,869 | 100.0% |
Housing Finances in Bell
Median Income by Occupancy in Bell
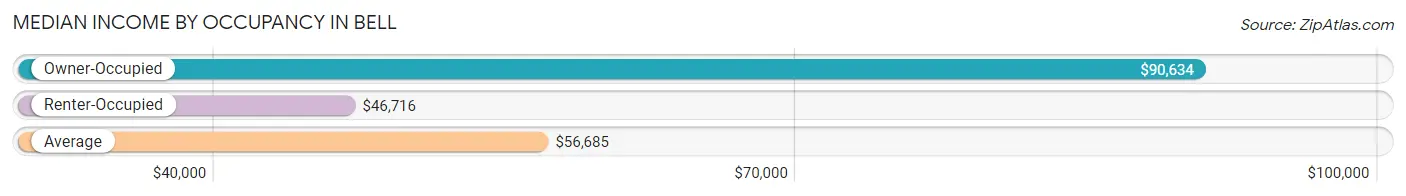
| Occupancy Type | # Households | Median Income |
| Owner-Occupied | 2,483 (28.0%) | $90,634 |
| Renter-Occupied | 6,386 (72.0%) | $46,716 |
| Average | 8,869 (100.0%) | $56,685 |
Occupancy by Householder Income Bracket in Bell
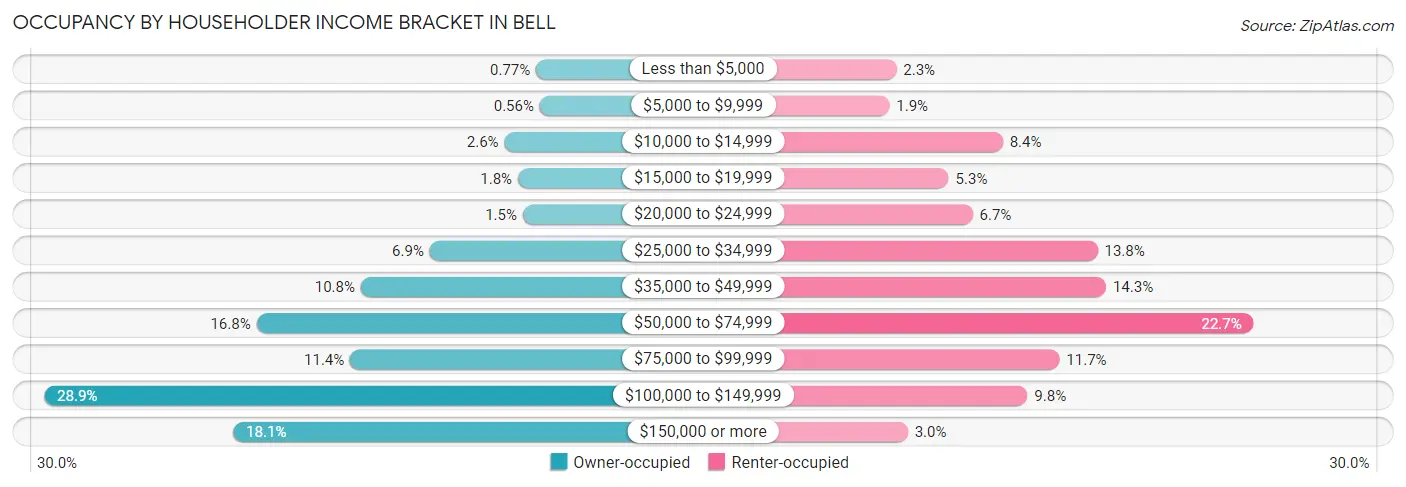
| Income Bracket | Owner-occupied | Renter-occupied |
| Less than $5,000 | 19 (0.8%) | 149 (2.3%) |
| $5,000 to $9,999 | 14 (0.6%) | 123 (1.9%) |
| $10,000 to $14,999 | 64 (2.6%) | 537 (8.4%) |
| $15,000 to $19,999 | 45 (1.8%) | 340 (5.3%) |
| $20,000 to $24,999 | 38 (1.5%) | 427 (6.7%) |
| $25,000 to $34,999 | 170 (6.9%) | 883 (13.8%) |
| $35,000 to $49,999 | 268 (10.8%) | 914 (14.3%) |
| $50,000 to $74,999 | 416 (16.8%) | 1,452 (22.7%) |
| $75,000 to $99,999 | 283 (11.4%) | 744 (11.7%) |
| $100,000 to $149,999 | 717 (28.9%) | 627 (9.8%) |
| $150,000 or more | 449 (18.1%) | 190 (3.0%) |
| Total | 2,483 (100.0%) | 6,386 (100.0%) |
Monthly Housing Cost Tiers in Bell
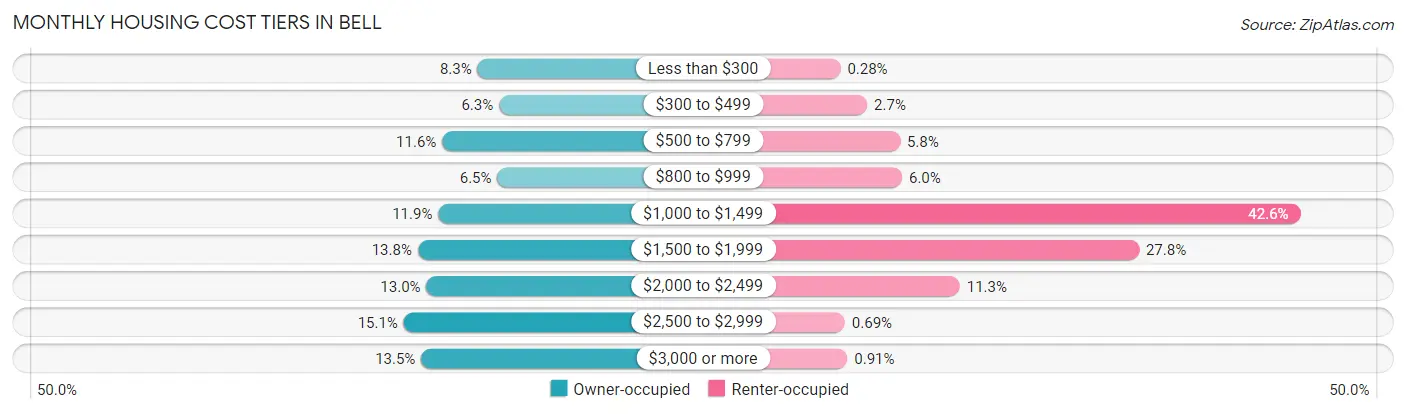
| Monthly Cost | Owner-occupied | Renter-occupied |
| Less than $300 | 206 (8.3%) | 18 (0.3%) |
| $300 to $499 | 157 (6.3%) | 175 (2.7%) |
| $500 to $799 | 287 (11.6%) | 368 (5.8%) |
| $800 to $999 | 161 (6.5%) | 380 (5.9%) |
| $1,000 to $1,499 | 296 (11.9%) | 2,722 (42.6%) |
| $1,500 to $1,999 | 343 (13.8%) | 1,773 (27.8%) |
| $2,000 to $2,499 | 323 (13.0%) | 720 (11.3%) |
| $2,500 to $2,999 | 375 (15.1%) | 44 (0.7%) |
| $3,000 or more | 335 (13.5%) | 58 (0.9%) |
| Total | 2,483 (100.0%) | 6,386 (100.0%) |
Physical Housing Characteristics in Bell
Housing Structures in Bell
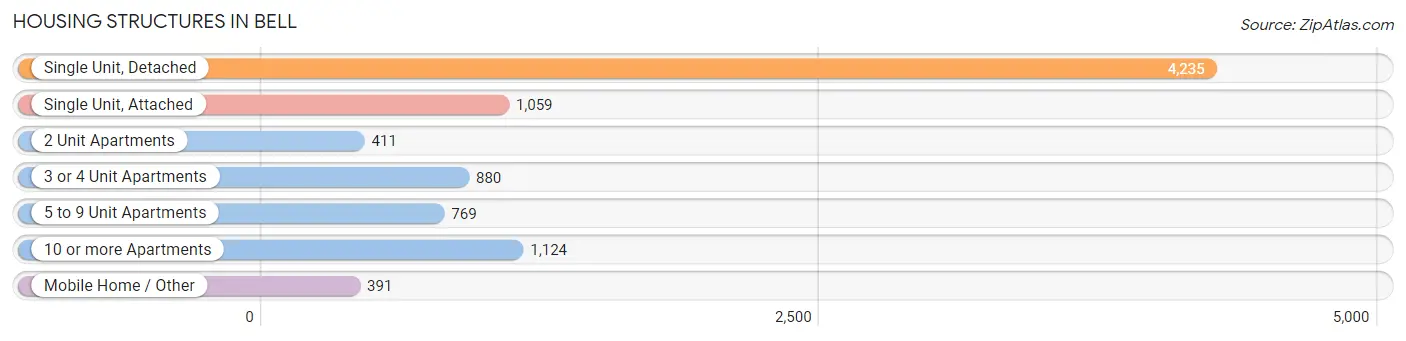
| Structure Type | # Housing Units | % Housing Units |
| Single Unit, Detached | 4,235 | 47.7% |
| Single Unit, Attached | 1,059 | 11.9% |
| 2 Unit Apartments | 411 | 4.6% |
| 3 or 4 Unit Apartments | 880 | 9.9% |
| 5 to 9 Unit Apartments | 769 | 8.7% |
| 10 or more Apartments | 1,124 | 12.7% |
| Mobile Home / Other | 391 | 4.4% |
| Total | 8,869 | 100.0% |
Housing Structures by Occupancy in Bell
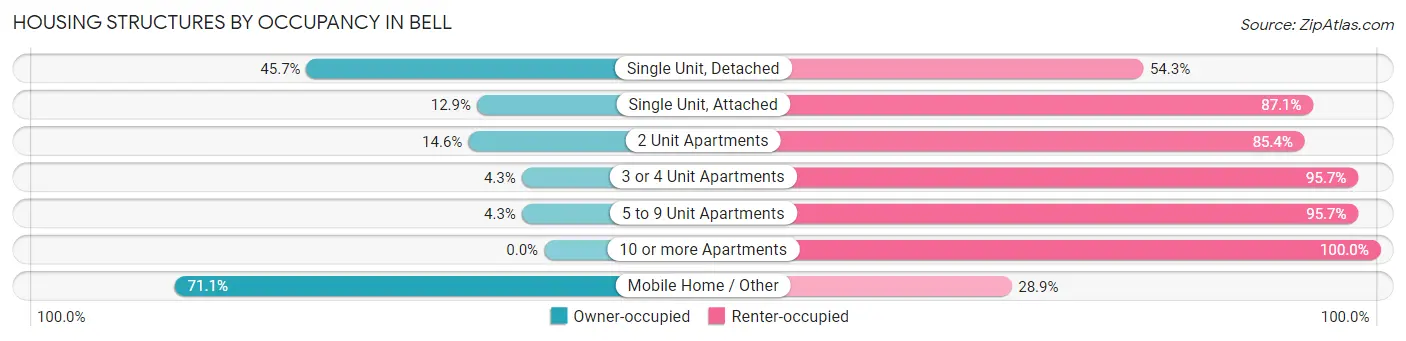
| Structure Type | Owner-occupied | Renter-occupied |
| Single Unit, Detached | 1,937 (45.7%) | 2,298 (54.3%) |
| Single Unit, Attached | 137 (12.9%) | 922 (87.1%) |
| 2 Unit Apartments | 60 (14.6%) | 351 (85.4%) |
| 3 or 4 Unit Apartments | 38 (4.3%) | 842 (95.7%) |
| 5 to 9 Unit Apartments | 33 (4.3%) | 736 (95.7%) |
| 10 or more Apartments | 0 (0.0%) | 1,124 (100.0%) |
| Mobile Home / Other | 278 (71.1%) | 113 (28.9%) |
| Total | 2,483 (28.0%) | 6,386 (72.0%) |
Housing Structures by Number of Rooms in Bell
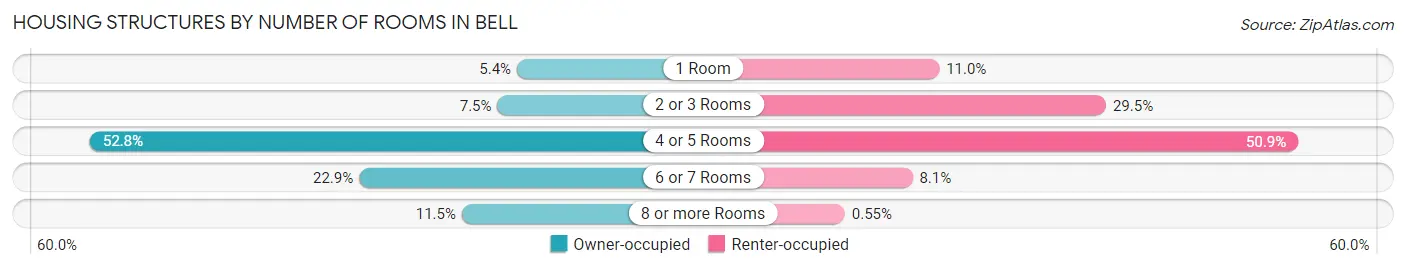
| Number of Rooms | Owner-occupied | Renter-occupied |
| 1 Room | 133 (5.4%) | 704 (11.0%) |
| 2 or 3 Rooms | 187 (7.5%) | 1,886 (29.5%) |
| 4 or 5 Rooms | 1,310 (52.8%) | 3,247 (50.8%) |
| 6 or 7 Rooms | 568 (22.9%) | 514 (8.1%) |
| 8 or more Rooms | 285 (11.5%) | 35 (0.5%) |
| Total | 2,483 (100.0%) | 6,386 (100.0%) |
Housing Structure by Heating Type in Bell
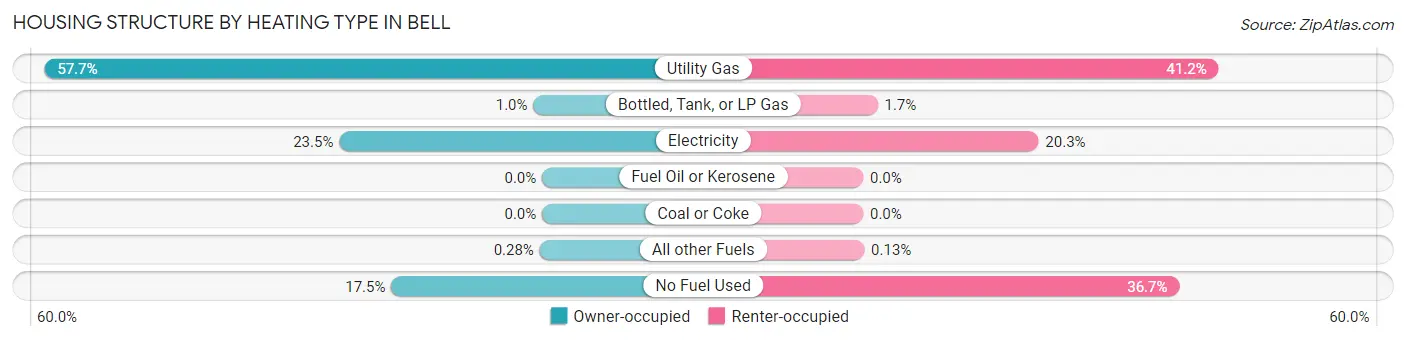
| Heating Type | Owner-occupied | Renter-occupied |
| Utility Gas | 1,433 (57.7%) | 2,632 (41.2%) |
| Bottled, Tank, or LP Gas | 25 (1.0%) | 107 (1.7%) |
| Electricity | 584 (23.5%) | 1,298 (20.3%) |
| Fuel Oil or Kerosene | 0 (0.0%) | 0 (0.0%) |
| Coal or Coke | 0 (0.0%) | 0 (0.0%) |
| All other Fuels | 7 (0.3%) | 8 (0.1%) |
| No Fuel Used | 434 (17.5%) | 2,341 (36.7%) |
| Total | 2,483 (100.0%) | 6,386 (100.0%) |
Household Vehicle Usage in Bell
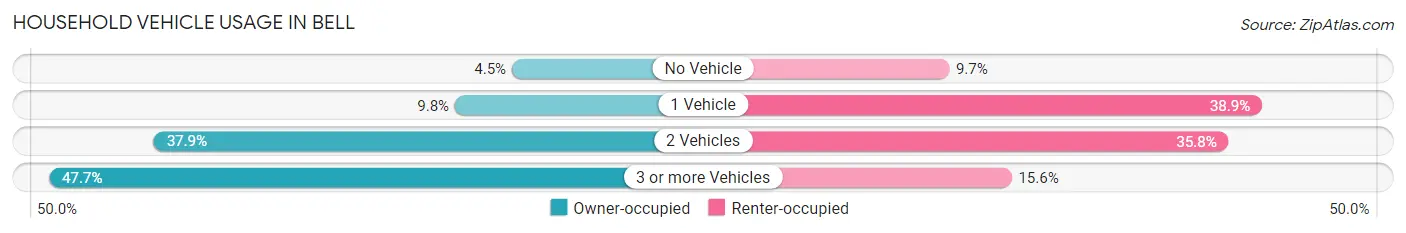
| Vehicles per Household | Owner-occupied | Renter-occupied |
| No Vehicle | 112 (4.5%) | 620 (9.7%) |
| 1 Vehicle | 244 (9.8%) | 2,486 (38.9%) |
| 2 Vehicles | 942 (37.9%) | 2,287 (35.8%) |
| 3 or more Vehicles | 1,185 (47.7%) | 993 (15.5%) |
| Total | 2,483 (100.0%) | 6,386 (100.0%) |
Real Estate & Mortgages in Bell
Real Estate and Mortgage Overview in Bell
| Characteristic | Without Mortgage | With Mortgage |
| Housing Units | 858 | 1,625 |
| Median Property Value | $481,800 | $581,900 |
| Median Household Income | $70,603 | $368 |
| Monthly Housing Costs | $563 | $335 |
| Real Estate Taxes | $3,811 | $142 |
Property Value by Mortgage Status in Bell
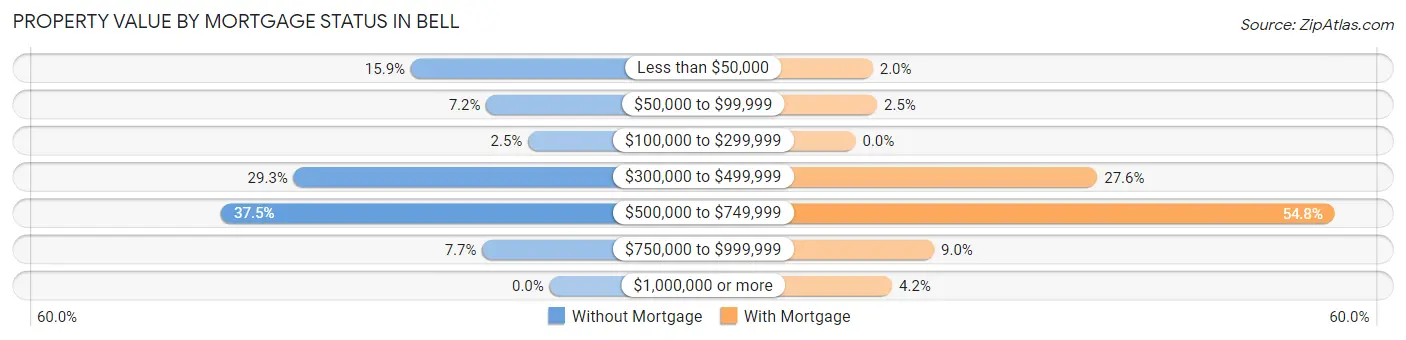
| Property Value | Without Mortgage | With Mortgage |
| Less than $50,000 | 136 (15.9%) | 32 (2.0%) |
| $50,000 to $99,999 | 62 (7.2%) | 40 (2.5%) |
| $100,000 to $299,999 | 21 (2.5%) | 0 (0.0%) |
| $300,000 to $499,999 | 251 (29.2%) | 449 (27.6%) |
| $500,000 to $749,999 | 322 (37.5%) | 890 (54.8%) |
| $750,000 to $999,999 | 66 (7.7%) | 146 (9.0%) |
| $1,000,000 or more | 0 (0.0%) | 68 (4.2%) |
| Total | 858 (100.0%) | 1,625 (100.0%) |
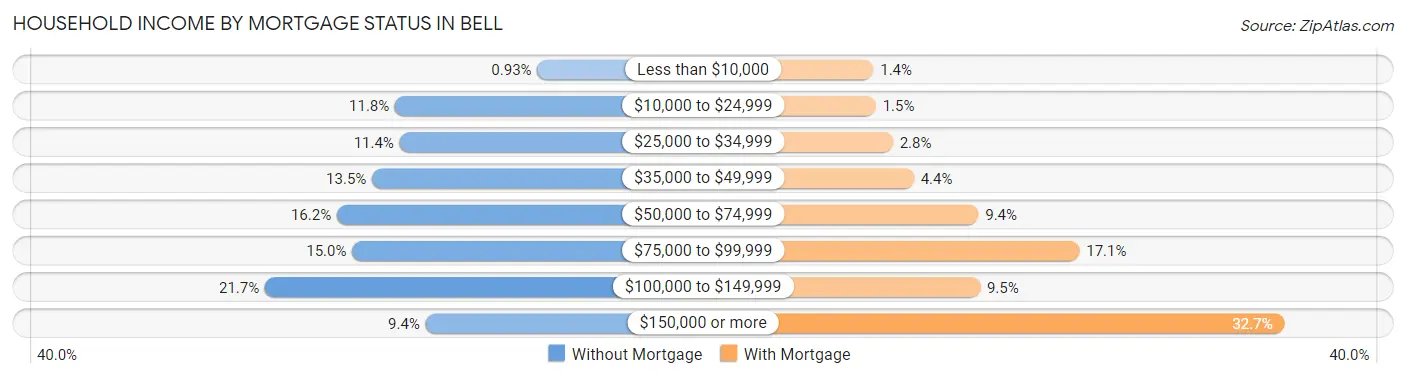
Household Income by Mortgage Status in Bell
| Household Income | Without Mortgage | With Mortgage |
| Less than $10,000 | 8 (0.9%) | 22 (1.3%) |
| $10,000 to $24,999 | 101 (11.8%) | 25 (1.5%) |
| $25,000 to $34,999 | 98 (11.4%) | 46 (2.8%) |
| $35,000 to $49,999 | 116 (13.5%) | 72 (4.4%) |
| $50,000 to $74,999 | 139 (16.2%) | 152 (9.3%) |
| $75,000 to $99,999 | 129 (15.0%) | 277 (17.1%) |
| $100,000 to $149,999 | 186 (21.7%) | 154 (9.5%) |
| $150,000 or more | 81 (9.4%) | 531 (32.7%) |
| Total | 858 (100.0%) | 1,625 (100.0%) |
Property Value to Household Income Ratio in Bell
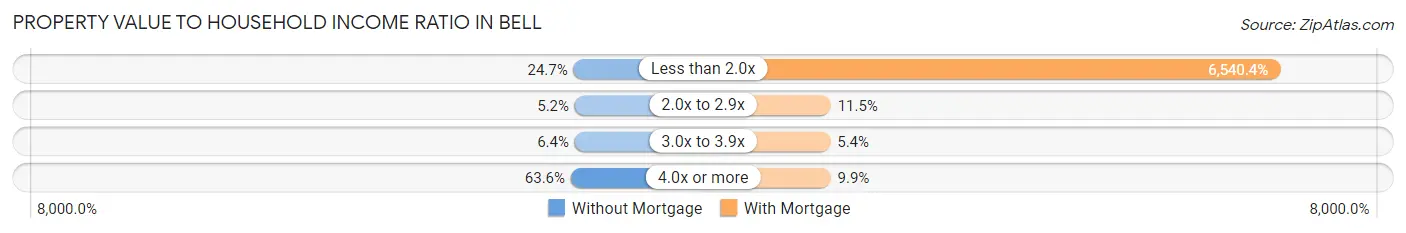
| Value-to-Income Ratio | Without Mortgage | With Mortgage |
| Less than 2.0x | 212 (24.7%) | 106,282 (6,540.4%) |
| 2.0x to 2.9x | 45 (5.2%) | 187 (11.5%) |
| 3.0x to 3.9x | 55 (6.4%) | 88 (5.4%) |
| 4.0x or more | 546 (63.6%) | 161 (9.9%) |
| Total | 858 (100.0%) | 1,625 (100.0%) |
Real Estate Taxes by Mortgage Status in Bell
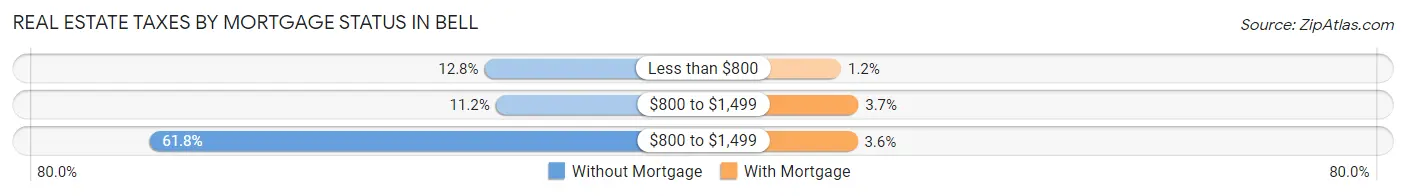
| Property Taxes | Without Mortgage | With Mortgage |
| Less than $800 | 110 (12.8%) | 19 (1.2%) |
| $800 to $1,499 | 96 (11.2%) | 60 (3.7%) |
| $800 to $1,499 | 530 (61.8%) | 58 (3.6%) |
| Total | 858 (100.0%) | 1,625 (100.0%) |
Health & Disability in Bell
Health Insurance Coverage by Age in Bell
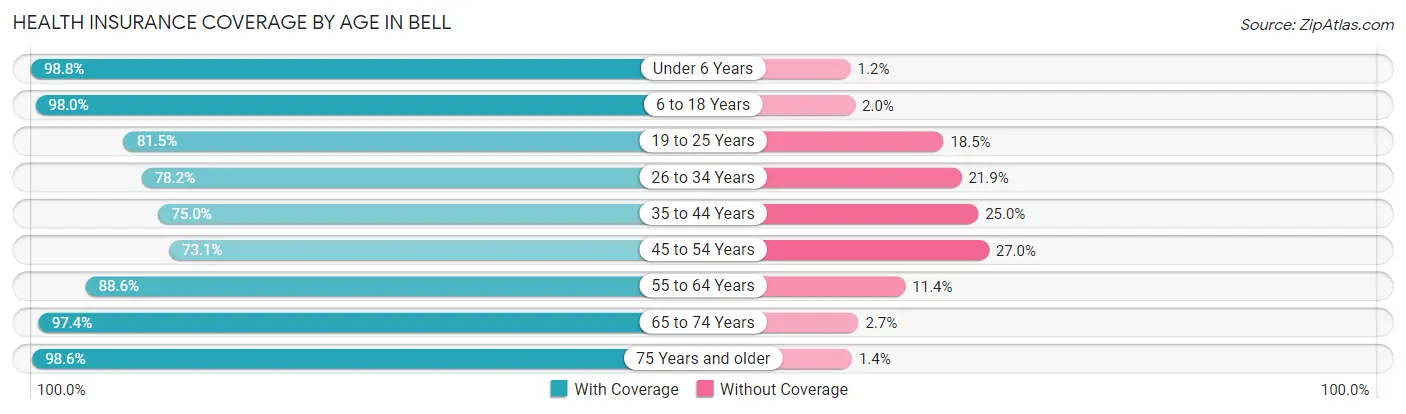
| Age Bracket | With Coverage | Without Coverage |
| Under 6 Years | 2,657 (98.8%) | 32 (1.2%) |
| 6 to 18 Years | 6,439 (98.0%) | 132 (2.0%) |
| 19 to 25 Years | 3,175 (81.5%) | 720 (18.5%) |
| 26 to 34 Years | 3,370 (78.1%) | 942 (21.8%) |
| 35 to 44 Years | 3,621 (75.0%) | 1,205 (25.0%) |
| 45 to 54 Years | 3,027 (73.1%) | 1,117 (27.0%) |
| 55 to 64 Years | 3,087 (88.6%) | 397 (11.4%) |
| 65 to 74 Years | 1,985 (97.4%) | 54 (2.6%) |
| 75 Years and older | 1,314 (98.6%) | 19 (1.4%) |
| Total | 28,675 (86.1%) | 4,618 (13.9%) |
Health Insurance Coverage by Citizenship Status in Bell
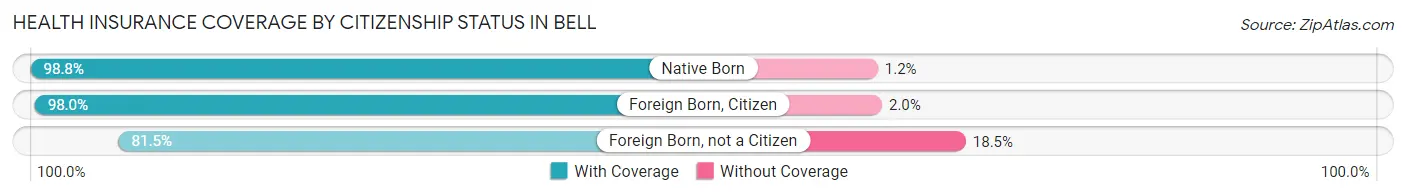
| Citizenship Status | With Coverage | Without Coverage |
| Native Born | 2,657 (98.8%) | 32 (1.2%) |
| Foreign Born, Citizen | 6,439 (98.0%) | 132 (2.0%) |
| Foreign Born, not a Citizen | 3,175 (81.5%) | 720 (18.5%) |
Health Insurance Coverage by Household Income in Bell
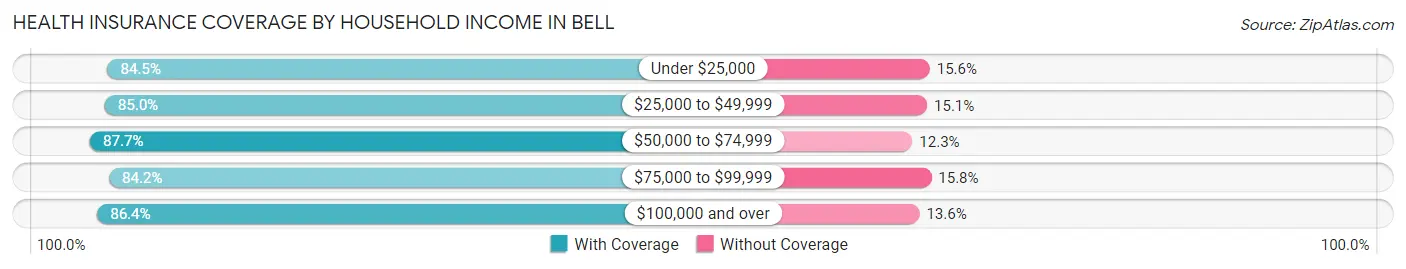
| Household Income | With Coverage | Without Coverage |
| Under $25,000 | 3,231 (84.5%) | 595 (15.5%) |
| $25,000 to $49,999 | 6,378 (85.0%) | 1,130 (15.0%) |
| $50,000 to $74,999 | 6,993 (87.7%) | 980 (12.3%) |
| $75,000 to $99,999 | 3,081 (84.2%) | 580 (15.8%) |
| $100,000 and over | 8,204 (86.4%) | 1,294 (13.6%) |
Public vs Private Health Insurance Coverage by Age in Bell
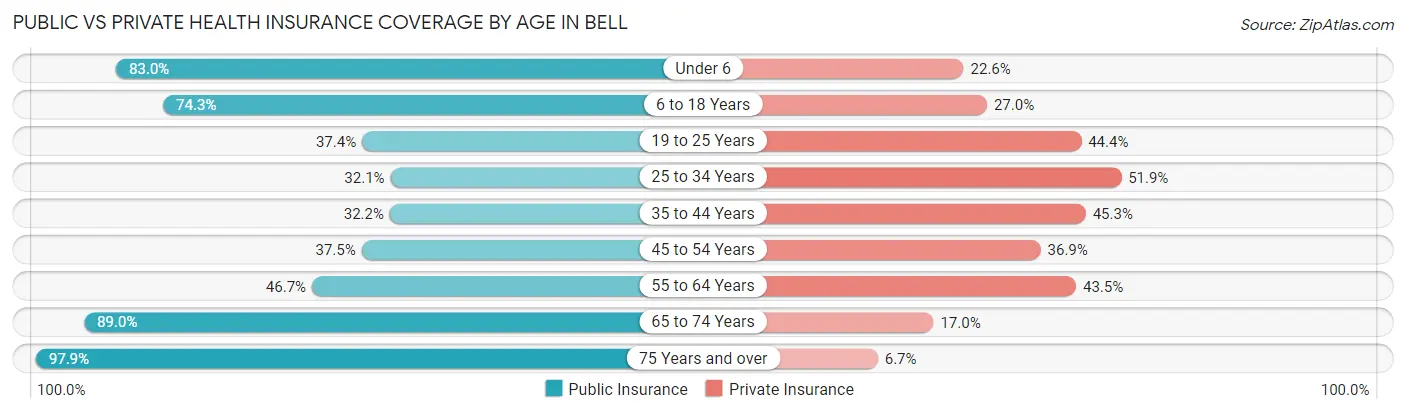
| Age Bracket | Public Insurance | Private Insurance |
| Under 6 | 2,233 (83.0%) | 608 (22.6%) |
| 6 to 18 Years | 4,881 (74.3%) | 1,771 (27.0%) |
| 19 to 25 Years | 1,456 (37.4%) | 1,731 (44.4%) |
| 25 to 34 Years | 1,384 (32.1%) | 2,236 (51.9%) |
| 35 to 44 Years | 1,555 (32.2%) | 2,185 (45.3%) |
| 45 to 54 Years | 1,552 (37.4%) | 1,529 (36.9%) |
| 55 to 64 Years | 1,626 (46.7%) | 1,515 (43.5%) |
| 65 to 74 Years | 1,814 (89.0%) | 347 (17.0%) |
| 75 Years and over | 1,305 (97.9%) | 89 (6.7%) |
| Total | 17,806 (53.5%) | 12,011 (36.1%) |
Disability Status by Sex by Age in Bell
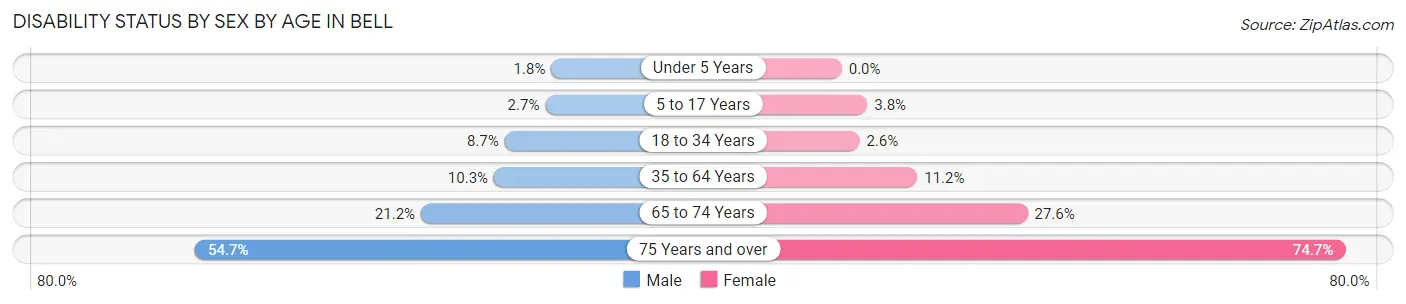
| Age Bracket | Male | Female |
| Under 5 Years | 19 (1.8%) | 0 (0.0%) |
| 5 to 17 Years | 90 (2.7%) | 114 (3.8%) |
| 18 to 34 Years | 397 (8.7%) | 113 (2.6%) |
| 35 to 64 Years | 646 (10.3%) | 694 (11.2%) |
| 65 to 74 Years | 228 (21.1%) | 265 (27.6%) |
| 75 Years and over | 322 (54.7%) | 556 (74.7%) |
Disability Class by Sex by Age in Bell
Disability Class: Hearing Difficulty
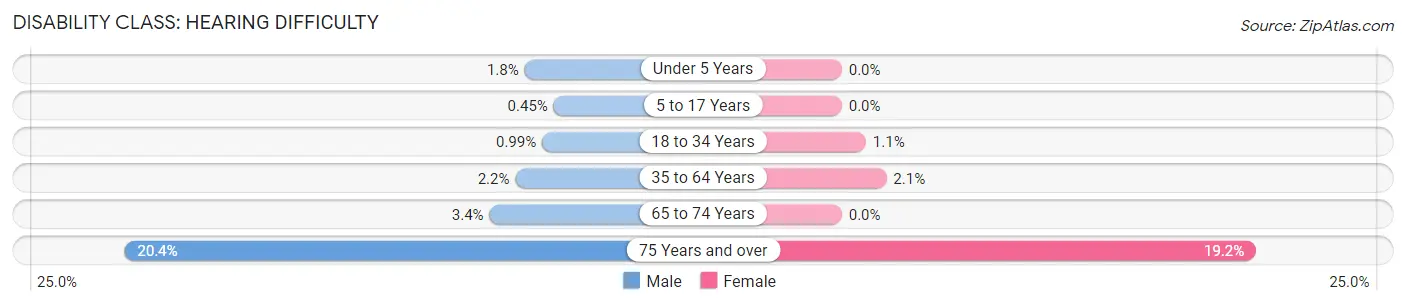
| Age Bracket | Male | Female |
| Under 5 Years | 19 (1.8%) | 0 (0.0%) |
| 5 to 17 Years | 15 (0.4%) | 0 (0.0%) |
| 18 to 34 Years | 45 (1.0%) | 48 (1.1%) |
| 35 to 64 Years | 140 (2.2%) | 128 (2.1%) |
| 65 to 74 Years | 37 (3.4%) | 0 (0.0%) |
| 75 Years and over | 120 (20.4%) | 143 (19.2%) |
Disability Class: Vision Difficulty
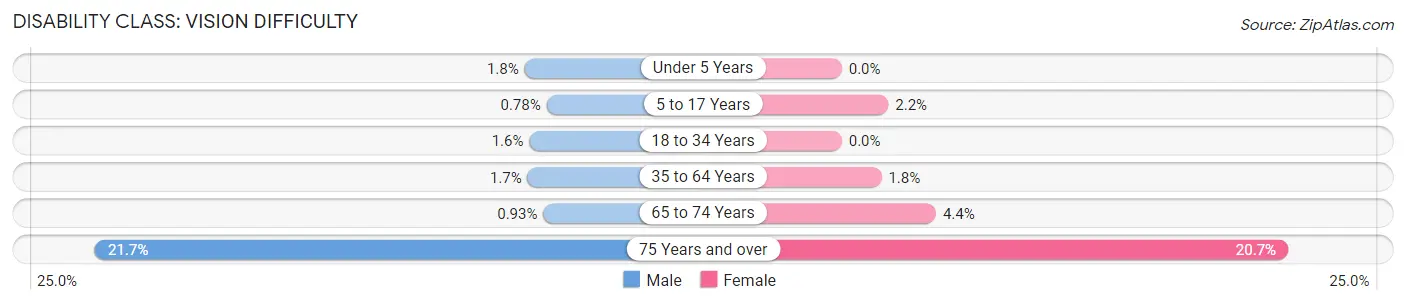
| Age Bracket | Male | Female |
| Under 5 Years | 19 (1.8%) | 0 (0.0%) |
| 5 to 17 Years | 26 (0.8%) | 65 (2.2%) |
| 18 to 34 Years | 72 (1.6%) | 0 (0.0%) |
| 35 to 64 Years | 104 (1.7%) | 114 (1.8%) |
| 65 to 74 Years | 10 (0.9%) | 42 (4.4%) |
| 75 Years and over | 128 (21.7%) | 154 (20.7%) |
Disability Class: Cognitive Difficulty
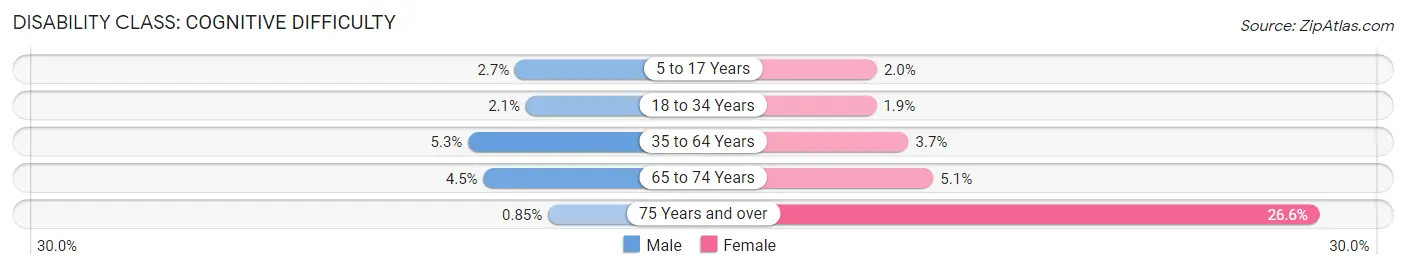
| Age Bracket | Male | Female |
| 5 to 17 Years | 90 (2.7%) | 59 (2.0%) |
| 18 to 34 Years | 95 (2.1%) | 83 (1.9%) |
| 35 to 64 Years | 332 (5.3%) | 230 (3.7%) |
| 65 to 74 Years | 48 (4.4%) | 49 (5.1%) |
| 75 Years and over | 5 (0.9%) | 198 (26.6%) |
Disability Class: Ambulatory Difficulty
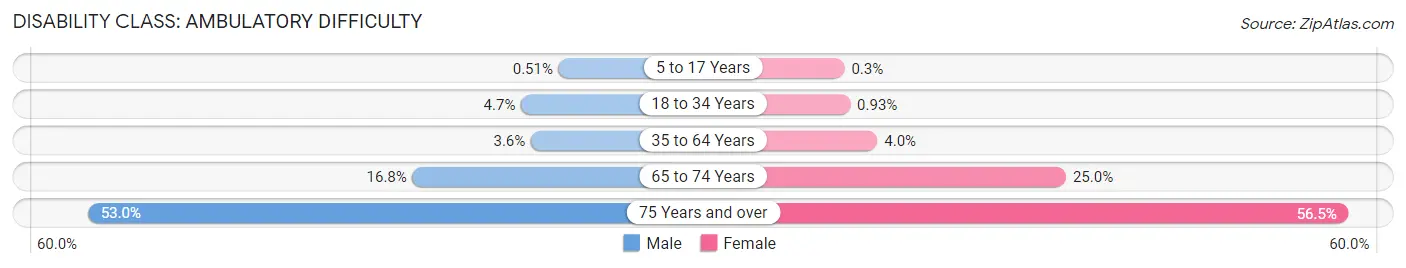
| Age Bracket | Male | Female |
| 5 to 17 Years | 17 (0.5%) | 9 (0.3%) |
| 18 to 34 Years | 213 (4.7%) | 40 (0.9%) |
| 35 to 64 Years | 225 (3.6%) | 245 (4.0%) |
| 65 to 74 Years | 181 (16.8%) | 240 (25.0%) |
| 75 Years and over | 312 (53.0%) | 420 (56.5%) |
Disability Class: Self-Care Difficulty
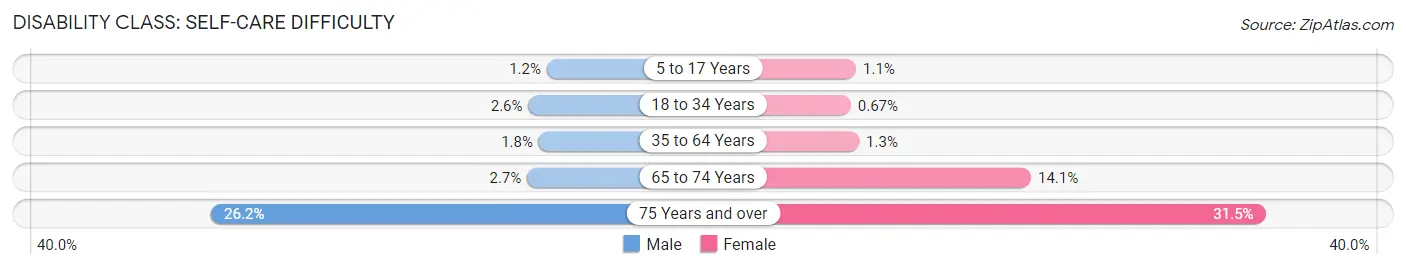
| Age Bracket | Male | Female |
| 5 to 17 Years | 41 (1.2%) | 32 (1.1%) |
| 18 to 34 Years | 118 (2.6%) | 29 (0.7%) |
| 35 to 64 Years | 114 (1.8%) | 80 (1.3%) |
| 65 to 74 Years | 29 (2.7%) | 135 (14.1%) |
| 75 Years and over | 154 (26.2%) | 234 (31.5%) |
Technology Access in Bell
Computing Device Access in Bell
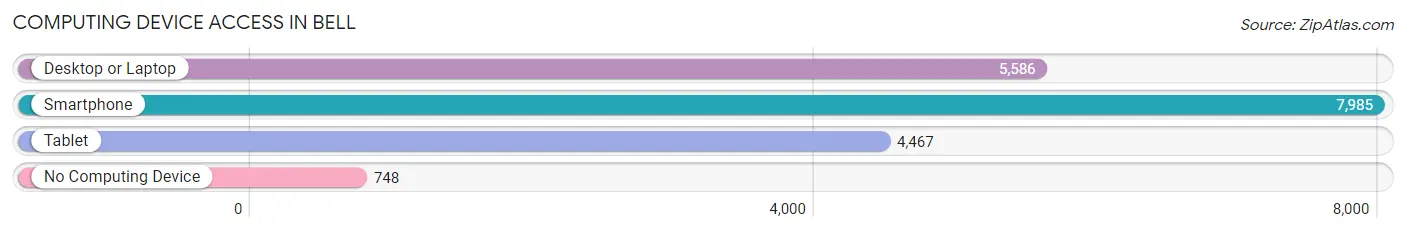
| Device Type | # Households | % Households |
| Desktop or Laptop | 5,586 | 63.0% |
| Smartphone | 7,985 | 90.0% |
| Tablet | 4,467 | 50.4% |
| No Computing Device | 748 | 8.4% |
| Total | 8,869 | 100.0% |
Internet Access in Bell
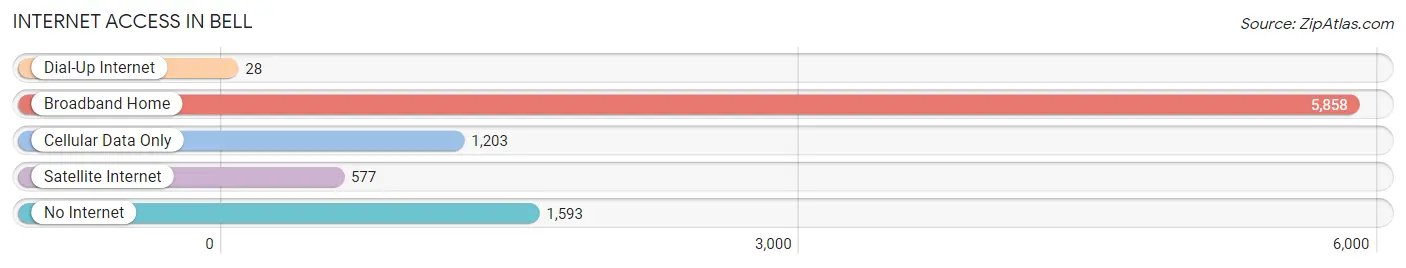
| Internet Type | # Households | % Households |
| Dial-Up Internet | 28 | 0.3% |
| Broadband Home | 5,858 | 66.0% |
| Cellular Data Only | 1,203 | 13.6% |
| Satellite Internet | 577 | 6.5% |
| No Internet | 1,593 | 18.0% |
| Total | 8,869 | 100.0% |
Bell Summary
Bell, California is a small city located in the southeastern corner of Los Angeles County. It is bordered by the cities of Maywood, Huntington Park, South Gate, and Cudahy. The city has a population of about 35,000 people and is known for its diverse population and vibrant culture.
Geography
Bell is located in the southeastern corner of Los Angeles County, about 10 miles southeast of downtown Los Angeles. It is bordered by the cities of Maywood, Huntington Park, South Gate, and Cudahy. The city is situated in the Los Angeles Basin, with the San Gabriel Mountains to the north and the Pacific Ocean to the south. The city is divided into two distinct areas: the residential area to the north and the industrial area to the south. The residential area is characterized by single-family homes, while the industrial area is home to factories, warehouses, and other businesses.
Economy
Bell is a predominantly working-class city, with a median household income of $37,000. The city’s economy is largely based on manufacturing and retail. The city is home to several factories and warehouses, as well as a number of retail stores. The city is also home to a number of small businesses, including restaurants, auto repair shops, and other services.
Demographics
Bell is a diverse city, with a population of about 35,000 people. The city is majority Hispanic, with a population that is about 70% Hispanic. The city is also home to a large number of immigrants, with about 40% of the population being foreign-born. The city is also home to a large number of African Americans, with about 10% of the population being African American.
Conclusion
Bell, California is a small city located in the southeastern corner of Los Angeles County. It is bordered by the cities of Maywood, Huntington Park, South Gate, and Cudahy. The city has a population of about 35,000 people and is known for its diverse population and vibrant culture. The city’s economy is largely based on manufacturing and retail, and the city is home to a large number of immigrants and African Americans. Bell is a diverse city with a rich culture and a vibrant economy.
Common Questions
What is Per Capita Income in Bell?
Per Capita income in Bell is $21,024.
What is the Median Family Income in Bell?
Median Family Income in Bell is $57,058.
What is the Median Household income in Bell?
Median Household Income in Bell is $56,685.
What is Income or Wage Gap in Bell?
Income or Wage Gap in Bell is 27.1%.
Women in Bell earn 72.9 cents for every dollar earned by a man.
What is Family Income Deficit in Bell?
Family Income Deficit in Bell is $8,754.
Families that are below poverty line in Bell earn $8,754 less on average than the poverty threshold level.
What is Inequality or Gini Index in Bell?
Inequality or Gini Index in Bell is 0.42.
What is the Total Population of Bell?
Total Population of Bell is 33,377.
What is the Total Male Population of Bell?
Total Male Population of Bell is 16,940.
What is the Total Female Population of Bell?
Total Female Population of Bell is 16,437.
What is the Ratio of Males per 100 Females in Bell?
There are 103.06 Males per 100 Females in Bell.
What is the Ratio of Females per 100 Males in Bell?
There are 97.03 Females per 100 Males in Bell.
What is the Median Population Age in Bell?
Median Population Age in Bell is 33.7 Years.
What is the Average Family Size in Bell
Average Family Size in Bell is 4.0 People.
What is the Average Household Size in Bell
Average Household Size in Bell is 3.7 People.
How Large is the Labor Force in Bell?
There are 15,570 People in the Labor Forcein in Bell.
What is the Percentage of People in the Labor Force in Bell?
60.2% of People are in the Labor Force in Bell.
What is the Unemployment Rate in Bell?
Unemployment Rate in Bell is 6.5%.