Lynwood, CA Map & Demographics
Lynwood Map
Lynwood Overview
$20,275
PER CAPITA INCOME
$66,030
AVG FAMILY INCOME
$67,350
AVG HOUSEHOLD INCOME
18.4%
WAGE / INCOME GAP [ % ]
81.6¢/ $1
WAGE / INCOME GAP [ $ ]
$12,518
FAMILY INCOME DEFICIT
0.40
INEQUALITY / GINI INDEX
66,346
TOTAL POPULATION
33,283
MALE POPULATION
33,063
FEMALE POPULATION
100.67
MALES / 100 FEMALES
99.34
FEMALES / 100 MALES
32.3
MEDIAN AGE
4.4
AVG FAMILY SIZE
4.2
AVG HOUSEHOLD SIZE
31,070
LABOR FORCE [ PEOPLE ]
61.4%
PERCENT IN LABOR FORCE
9.6%
UNEMPLOYMENT RATE
Lynwood Zip Codes
Income in Lynwood
Income Overview in Lynwood
Per Capita Income in Lynwood is $20,275, while median incomes of families and households are $66,030 and $67,350 respectively.
| Characteristic | Number | Measure |
| Per Capita Income | 66,346 | $20,275 |
| Median Family Income | 13,101 | $66,030 |
| Mean Family Income | 13,101 | $81,026 |
| Median Household Income | 15,239 | $67,350 |
| Mean Household Income | 15,239 | $81,581 |
| Income Deficit | 13,101 | $12,518 |
| Wage / Income Gap (%) | 66,346 | 18.36% |
| Wage / Income Gap ($) | 66,346 | 81.64¢ per $1 |
| Gini / Inequality Index | 66,346 | 0.40 |
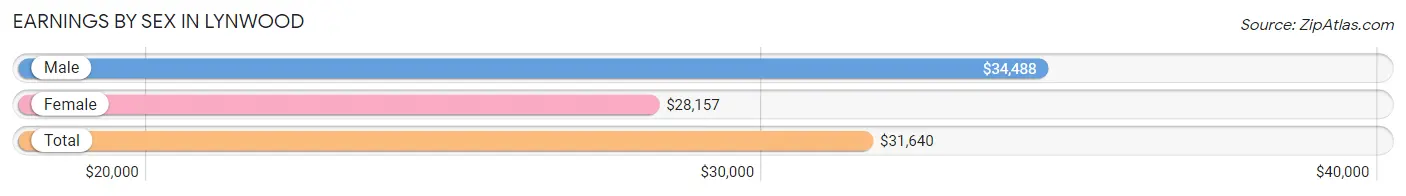
Earnings by Sex in Lynwood
Average Earnings in Lynwood are $31,640, $34,488 for men and $28,157 for women, a difference of 18.4%.
| Sex | Number | Average Earnings |
| Male | 17,431 (56.2%) | $34,488 |
| Female | 13,578 (43.8%) | $28,157 |
| Total | 31,009 (100.0%) | $31,640 |
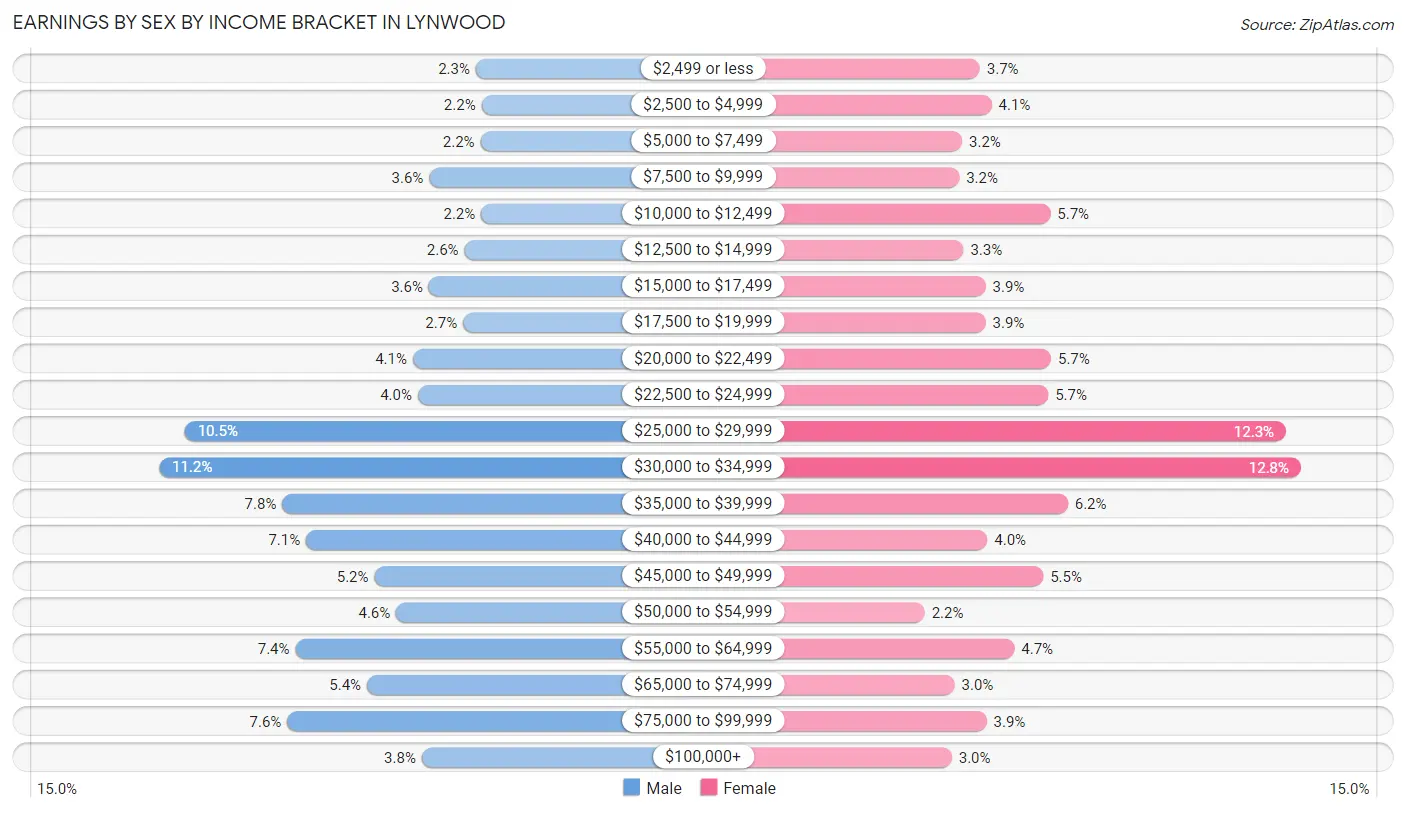
Earnings by Sex by Income Bracket in Lynwood
The most common earnings brackets in Lynwood are $30,000 to $34,999 for men (1,955 | 11.2%) and $30,000 to $34,999 for women (1,733 | 12.8%).
| Income | Male | Female |
| $2,499 or less | 404 (2.3%) | 508 (3.7%) |
| $2,500 to $4,999 | 377 (2.2%) | 553 (4.1%) |
| $5,000 to $7,499 | 381 (2.2%) | 440 (3.2%) |
| $7,500 to $9,999 | 632 (3.6%) | 429 (3.2%) |
| $10,000 to $12,499 | 379 (2.2%) | 777 (5.7%) |
| $12,500 to $14,999 | 460 (2.6%) | 445 (3.3%) |
| $15,000 to $17,499 | 635 (3.6%) | 529 (3.9%) |
| $17,500 to $19,999 | 468 (2.7%) | 529 (3.9%) |
| $20,000 to $22,499 | 713 (4.1%) | 780 (5.7%) |
| $22,500 to $24,999 | 689 (4.0%) | 769 (5.7%) |
| $25,000 to $29,999 | 1,830 (10.5%) | 1,675 (12.3%) |
| $30,000 to $34,999 | 1,955 (11.2%) | 1,733 (12.8%) |
| $35,000 to $39,999 | 1,353 (7.8%) | 843 (6.2%) |
| $40,000 to $44,999 | 1,235 (7.1%) | 536 (4.0%) |
| $45,000 to $49,999 | 902 (5.2%) | 749 (5.5%) |
| $50,000 to $54,999 | 795 (4.6%) | 298 (2.2%) |
| $55,000 to $64,999 | 1,288 (7.4%) | 640 (4.7%) |
| $65,000 to $74,999 | 937 (5.4%) | 411 (3.0%) |
| $75,000 to $99,999 | 1,329 (7.6%) | 533 (3.9%) |
| $100,000+ | 669 (3.8%) | 401 (2.9%) |
| Total | 17,431 (100.0%) | 13,578 (100.0%) |
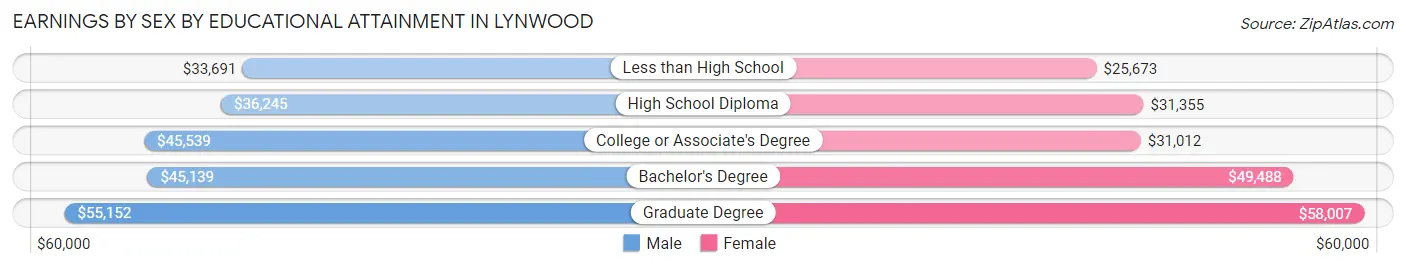
Earnings by Sex by Educational Attainment in Lynwood
Average earnings in Lynwood are $37,361 for men and $30,200 for women, a difference of 19.2%. Men with an educational attainment of graduate degree enjoy the highest average annual earnings of $55,152, while those with less than high school education earn the least with $33,691. Women with an educational attainment of graduate degree earn the most with the average annual earnings of $58,007, while those with less than high school education have the smallest earnings of $25,673.
| Educational Attainment | Male Income | Female Income |
| Less than High School | $33,691 | $25,673 |
| High School Diploma | $36,245 | $31,355 |
| College or Associate's Degree | $45,539 | $31,012 |
| Bachelor's Degree | $45,139 | $49,488 |
| Graduate Degree | $55,152 | $58,007 |
| Total | $37,361 | $30,200 |
Family Income in Lynwood
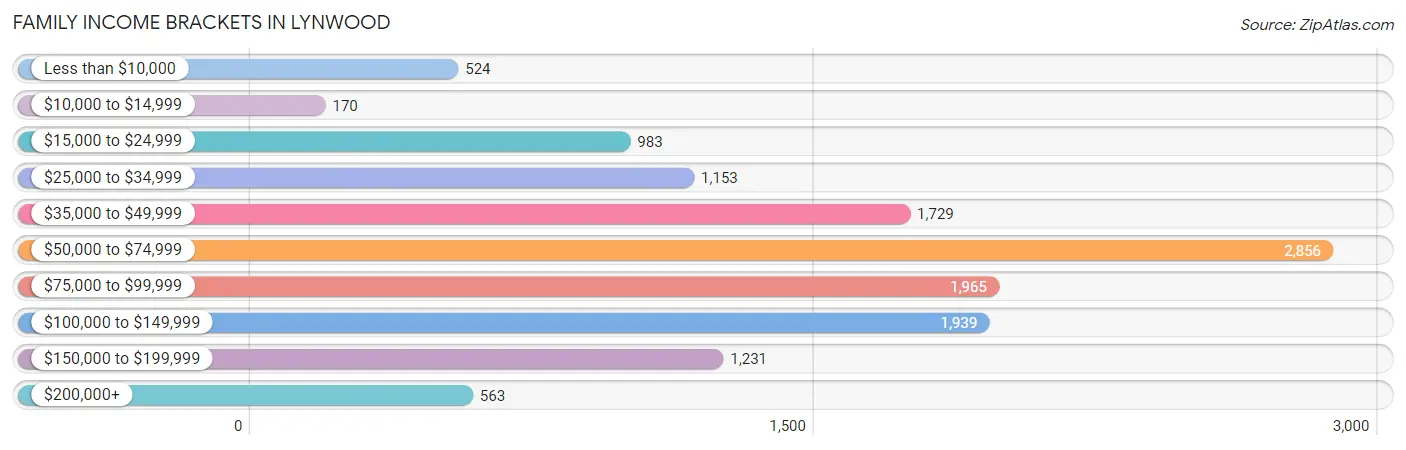
Family Income Brackets in Lynwood
According to the Lynwood family income data, there are 2,856 families falling into the $50,000 to $74,999 income range, which is the most common income bracket and makes up 21.8% of all families. Conversely, the $10,000 to $14,999 income bracket is the least frequent group with only 170 families (1.3%) belonging to this category.
| Income Bracket | # Families | % Families |
| Less than $10,000 | 524 | 4.0% |
| $10,000 to $14,999 | 170 | 1.3% |
| $15,000 to $24,999 | 983 | 7.5% |
| $25,000 to $34,999 | 1,153 | 8.8% |
| $35,000 to $49,999 | 1,729 | 13.2% |
| $50,000 to $74,999 | 2,856 | 21.8% |
| $75,000 to $99,999 | 1,965 | 15.0% |
| $100,000 to $149,999 | 1,939 | 14.8% |
| $150,000 to $199,999 | 1,231 | 9.4% |
| $200,000+ | 563 | 4.3% |
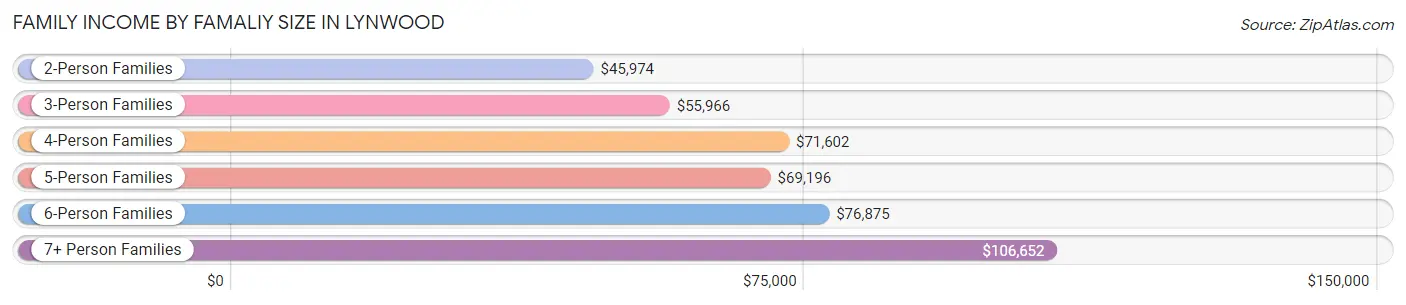
Family Income by Famaliy Size in Lynwood
7+ person families (1,211 | 9.2%) account for the highest median family income in Lynwood with $106,652 per family, while 2-person families (2,845 | 21.7%) have the highest median income of $22,987 per family member.
| Income Bracket | # Families | Median Income |
| 2-Person Families | 2,845 (21.7%) | $45,974 |
| 3-Person Families | 2,731 (20.8%) | $55,966 |
| 4-Person Families | 2,499 (19.1%) | $71,602 |
| 5-Person Families | 2,552 (19.5%) | $69,196 |
| 6-Person Families | 1,263 (9.6%) | $76,875 |
| 7+ Person Families | 1,211 (9.2%) | $106,652 |
| Total | 13,101 (100.0%) | $66,030 |
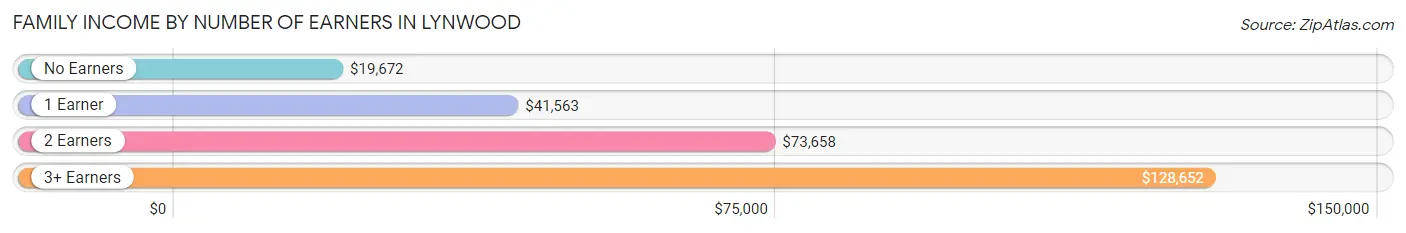
Family Income by Number of Earners in Lynwood
The median family income in Lynwood is $66,030, with families comprising 3+ earners (3,499) having the highest median family income of $128,652, while families with no earners (1,164) have the lowest median family income of $19,672, accounting for 26.7% and 8.9% of families, respectively.
| Number of Earners | # Families | Median Income |
| No Earners | 1,164 (8.9%) | $19,672 |
| 1 Earner | 4,423 (33.8%) | $41,563 |
| 2 Earners | 4,015 (30.6%) | $73,658 |
| 3+ Earners | 3,499 (26.7%) | $128,652 |
| Total | 13,101 (100.0%) | $66,030 |
Household Income in Lynwood
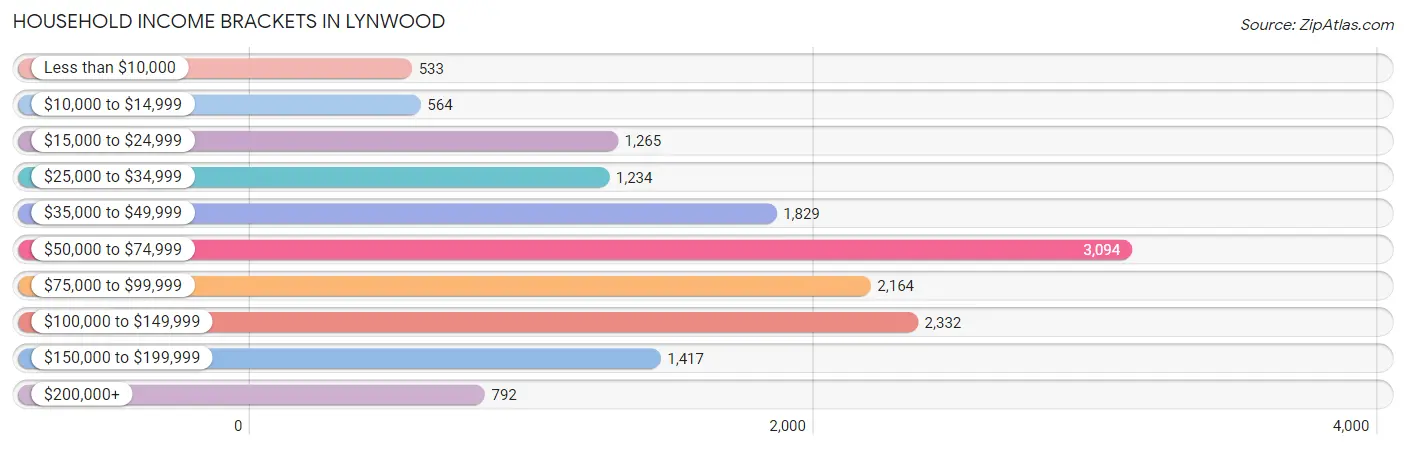
Household Income Brackets in Lynwood
With 3,094 households falling in the category, the $50,000 to $74,999 income range is the most frequent in Lynwood, accounting for 20.3% of all households. In contrast, only 533 households (3.5%) fall into the less than $10,000 income bracket, making it the least populous group.
| Income Bracket | # Households | % Households |
| Less than $10,000 | 533 | 3.5% |
| $10,000 to $14,999 | 564 | 3.7% |
| $15,000 to $24,999 | 1,265 | 8.3% |
| $25,000 to $34,999 | 1,234 | 8.1% |
| $35,000 to $49,999 | 1,829 | 12.0% |
| $50,000 to $74,999 | 3,094 | 20.3% |
| $75,000 to $99,999 | 2,164 | 14.2% |
| $100,000 to $149,999 | 2,332 | 15.3% |
| $150,000 to $199,999 | 1,417 | 9.3% |
| $200,000+ | 792 | 5.2% |
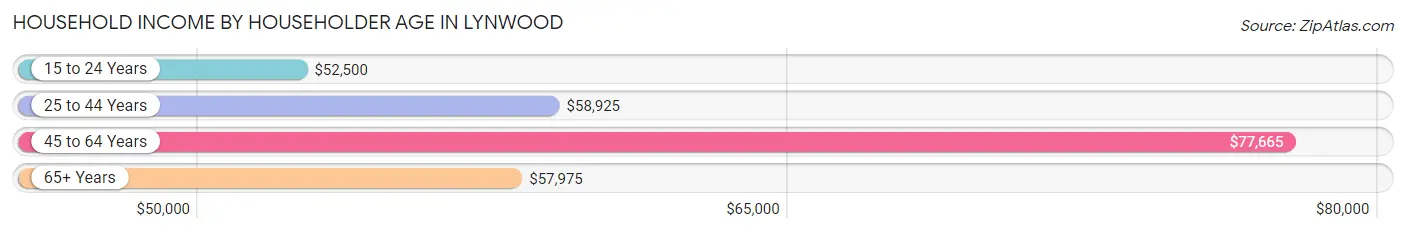
Household Income by Householder Age in Lynwood
The median household income in Lynwood is $67,350, with the highest median household income of $77,665 found in the 45 to 64 years age bracket for the primary householder. A total of 7,082 households (46.5%) fall into this category. Meanwhile, the 15 to 24 years age bracket for the primary householder has the lowest median household income of $52,500, with 226 households (1.5%) in this group.
| Income Bracket | # Households | Median Income |
| 15 to 24 Years | 226 (1.5%) | $52,500 |
| 25 to 44 Years | 5,501 (36.1%) | $58,925 |
| 45 to 64 Years | 7,082 (46.5%) | $77,665 |
| 65+ Years | 2,430 (16.0%) | $57,975 |
| Total | 15,239 (100.0%) | $67,350 |
Poverty in Lynwood
Income Below Poverty by Sex and Age in Lynwood
With 14.3% poverty level for males and 18.0% for females among the residents of Lynwood, under 5 year old males and 15 year old females are the most vulnerable to poverty, with 576 males (23.9%) and 164 females (35.5%) in their respective age groups living below the poverty level.
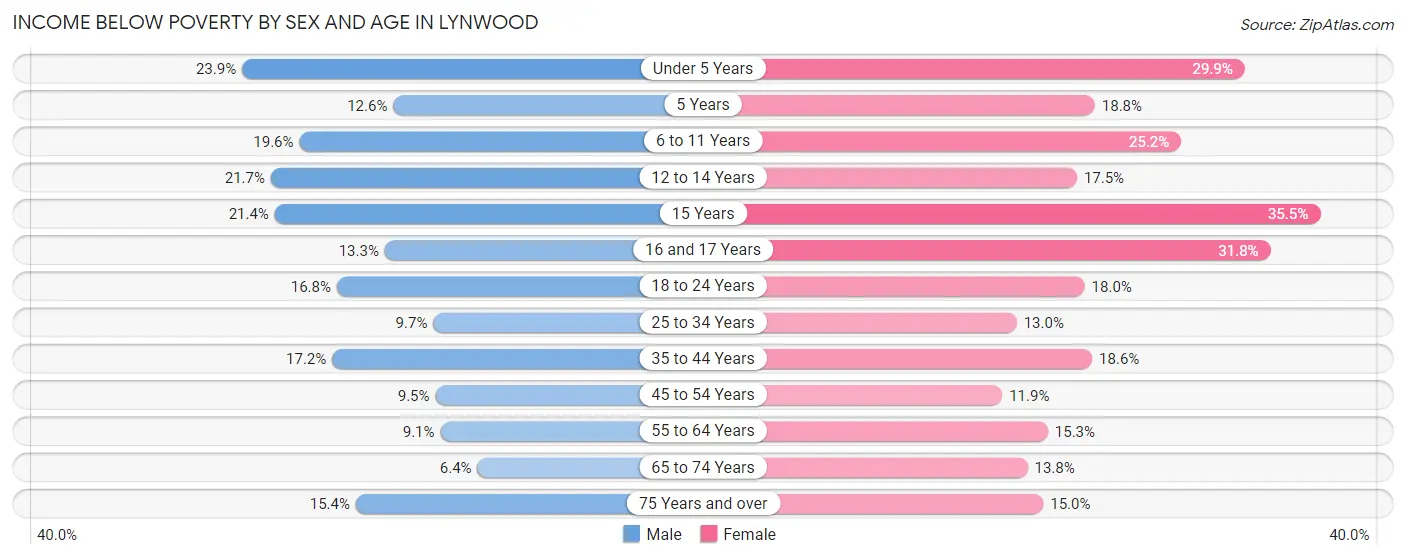
| Age Bracket | Male | Female |
| Under 5 Years | 576 (23.9%) | 655 (29.9%) |
| 5 Years | 36 (12.6%) | 81 (18.8%) |
| 6 to 11 Years | 668 (19.6%) | 731 (25.2%) |
| 12 to 14 Years | 341 (21.7%) | 228 (17.5%) |
| 15 Years | 96 (21.4%) | 164 (35.5%) |
| 16 and 17 Years | 115 (13.3%) | 203 (31.8%) |
| 18 to 24 Years | 598 (16.8%) | 665 (18.0%) |
| 25 to 34 Years | 532 (9.7%) | 638 (13.0%) |
| 35 to 44 Years | 763 (17.2%) | 859 (18.6%) |
| 45 to 54 Years | 381 (9.5%) | 418 (11.9%) |
| 55 to 64 Years | 346 (9.1%) | 557 (15.3%) |
| 65 to 74 Years | 98 (6.4%) | 274 (13.8%) |
| 75 Years and over | 145 (15.4%) | 136 (15.0%) |
| Total | 4,695 (14.3%) | 5,609 (18.0%) |
Income Above Poverty by Sex and Age in Lynwood
According to the poverty statistics in Lynwood, males aged 65 to 74 years and females aged 45 to 54 years are the age groups that are most secure financially, with 93.6% of males and 88.1% of females in these age groups living above the poverty line.
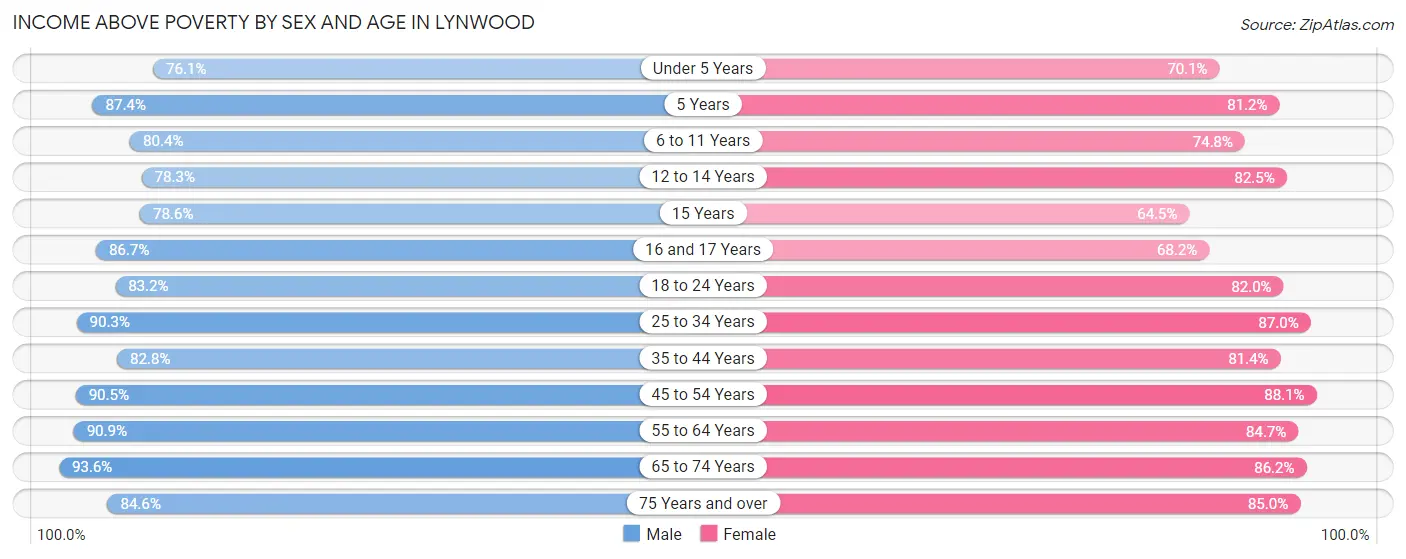
| Age Bracket | Male | Female |
| Under 5 Years | 1,838 (76.1%) | 1,535 (70.1%) |
| 5 Years | 249 (87.4%) | 350 (81.2%) |
| 6 to 11 Years | 2,741 (80.4%) | 2,171 (74.8%) |
| 12 to 14 Years | 1,229 (78.3%) | 1,078 (82.5%) |
| 15 Years | 352 (78.6%) | 298 (64.5%) |
| 16 and 17 Years | 752 (86.7%) | 435 (68.2%) |
| 18 to 24 Years | 2,957 (83.2%) | 3,024 (82.0%) |
| 25 to 34 Years | 4,978 (90.3%) | 4,275 (87.0%) |
| 35 to 44 Years | 3,680 (82.8%) | 3,761 (81.4%) |
| 45 to 54 Years | 3,630 (90.5%) | 3,091 (88.1%) |
| 55 to 64 Years | 3,445 (90.9%) | 3,084 (84.7%) |
| 65 to 74 Years | 1,438 (93.6%) | 1,713 (86.2%) |
| 75 Years and over | 796 (84.6%) | 773 (85.0%) |
| Total | 28,085 (85.7%) | 25,588 (82.0%) |
Income Below Poverty Among Married-Couple Families in Lynwood
The poverty statistics for married-couple families in Lynwood show that 10.7% or 845 of the total 7,924 families live below the poverty line. Families with 5 or more children have the highest poverty rate of 28.1%, comprising of 46 families. On the other hand, families with no children have the lowest poverty rate of 7.3%, which includes 243 families.
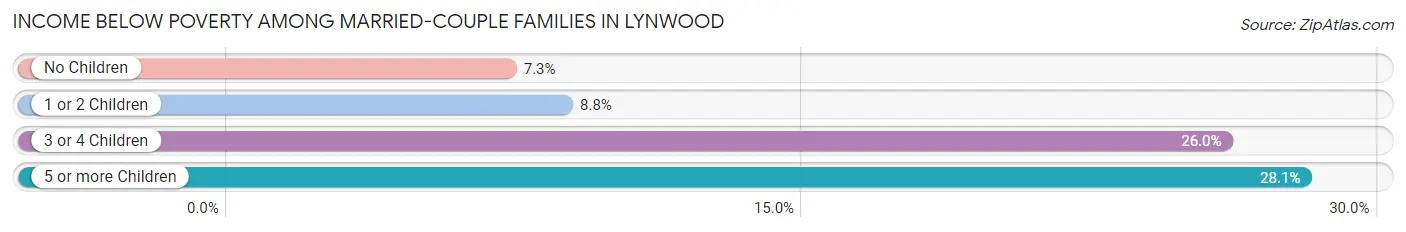
| Children | Above Poverty | Below Poverty |
| No Children | 3,095 (92.7%) | 243 (7.3%) |
| 1 or 2 Children | 3,140 (91.2%) | 301 (8.7%) |
| 3 or 4 Children | 726 (74.0%) | 255 (26.0%) |
| 5 or more Children | 118 (72.0%) | 46 (28.1%) |
| Total | 7,079 (89.3%) | 845 (10.7%) |
Income Below Poverty Among Single-Parent Households in Lynwood
According to the poverty data in Lynwood, 13.6% or 257 single-father households and 20.8% or 684 single-mother households are living below the poverty line. Among single-father households, those with 5 or more children have the highest poverty rate, with 71 households (100.0%) experiencing poverty. Likewise, among single-mother households, those with 3 or 4 children have the highest poverty rate, with 211 households (46.4%) falling below the poverty line.
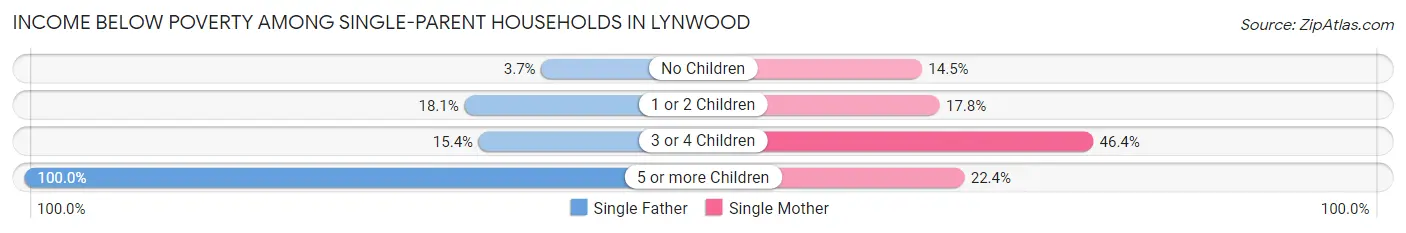
| Children | Single Father | Single Mother |
| No Children | 36 (3.7%) | 159 (14.5%) |
| 1 or 2 Children | 122 (18.0%) | 280 (17.8%) |
| 3 or 4 Children | 28 (15.4%) | 211 (46.4%) |
| 5 or more Children | 71 (100.0%) | 34 (22.4%) |
| Total | 257 (13.6%) | 684 (20.8%) |
Income Below Poverty Among Married-Couple vs Single-Parent Households in Lynwood
The poverty data for Lynwood shows that 845 of the married-couple family households (10.7%) and 941 of the single-parent households (18.2%) are living below the poverty level. Within the married-couple family households, those with 5 or more children have the highest poverty rate, with 46 households (28.1%) falling below the poverty line. Among the single-parent households, those with 5 or more children have the highest poverty rate, with 105 household (47.1%) living below poverty.
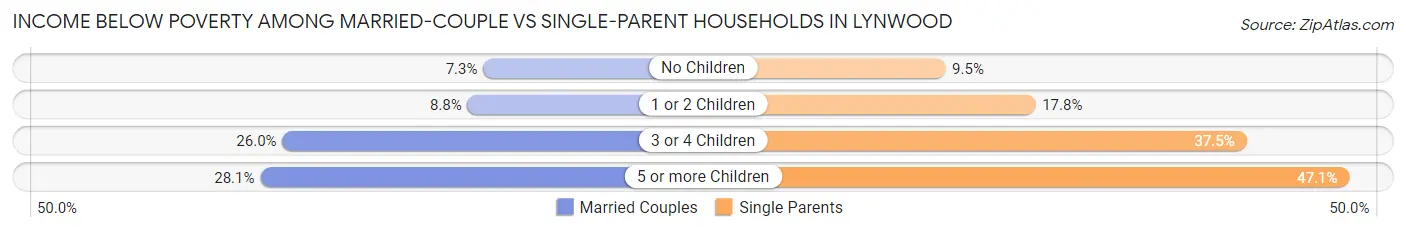
| Children | Married-Couple Families | Single-Parent Households |
| No Children | 243 (7.3%) | 195 (9.5%) |
| 1 or 2 Children | 301 (8.7%) | 402 (17.8%) |
| 3 or 4 Children | 255 (26.0%) | 239 (37.5%) |
| 5 or more Children | 46 (28.1%) | 105 (47.1%) |
| Total | 845 (10.7%) | 941 (18.2%) |
Race in Lynwood
The most populous races in Lynwood are Hispanic or Latino (58,104 | 87.6%), Some other Race (24,588 | 37.1%), and White / Caucasian (21,884 | 33.0%).
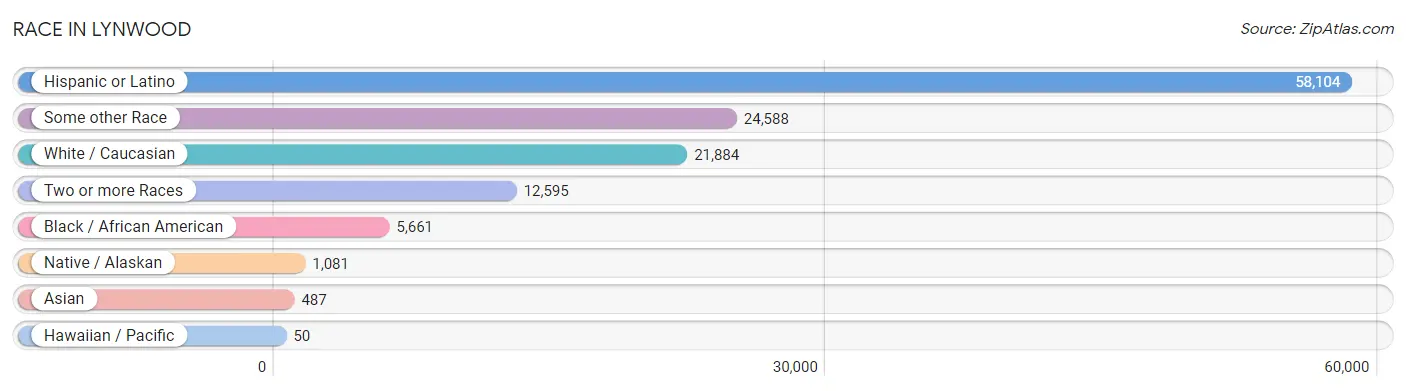
| Race | # Population | % Population |
| Asian | 487 | 0.7% |
| Black / African American | 5,661 | 8.5% |
| Hawaiian / Pacific | 50 | 0.1% |
| Hispanic or Latino | 58,104 | 87.6% |
| Native / Alaskan | 1,081 | 1.6% |
| White / Caucasian | 21,884 | 33.0% |
| Two or more Races | 12,595 | 19.0% |
| Some other Race | 24,588 | 37.1% |
| Total | 66,346 | 100.0% |
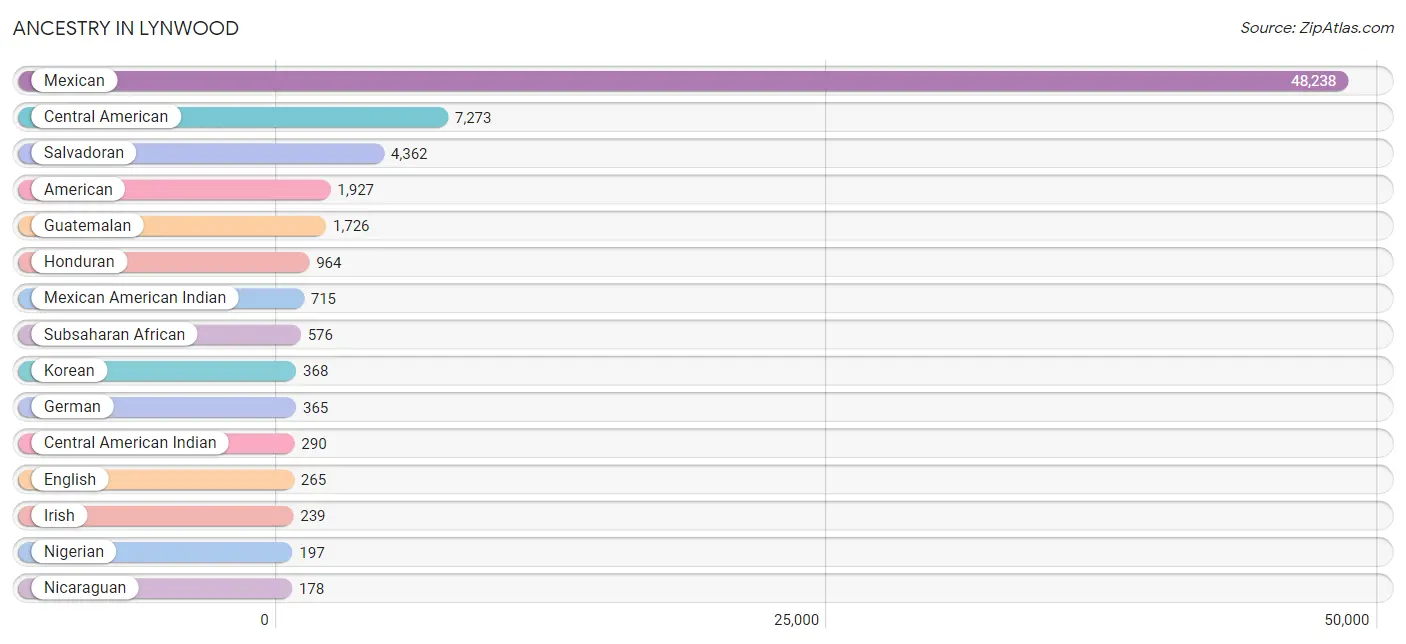
Ancestry in Lynwood
The most populous ancestries reported in Lynwood are Mexican (48,238 | 72.7%), Central American (7,273 | 11.0%), Salvadoran (4,362 | 6.6%), American (1,927 | 2.9%), and Guatemalan (1,726 | 2.6%), together accounting for 95.7% of all Lynwood residents.
| Ancestry | # Population | % Population |
| African | 129 | 0.2% |
| American | 1,927 | 2.9% |
| Apache | 66 | 0.1% |
| Arab | 17 | 0.0% |
| Armenian | 16 | 0.0% |
| Australian | 6 | 0.0% |
| Belizean | 4 | 0.0% |
| Bhutanese | 69 | 0.1% |
| Blackfeet | 7 | 0.0% |
| Brazilian | 10 | 0.0% |
| British | 46 | 0.1% |
| Burmese | 29 | 0.0% |
| Central American | 7,273 | 11.0% |
| Central American Indian | 290 | 0.4% |
| Cherokee | 28 | 0.0% |
| Chilean | 3 | 0.0% |
| Chippewa | 3 | 0.0% |
| Colombian | 64 | 0.1% |
| Cree | 7 | 0.0% |
| Croatian | 3 | 0.0% |
| Cuban | 27 | 0.0% |
| Danish | 30 | 0.1% |
| Dominican | 23 | 0.0% |
| Dutch | 29 | 0.0% |
| Ecuadorian | 49 | 0.1% |
| English | 265 | 0.4% |
| European | 108 | 0.2% |
| French | 83 | 0.1% |
| German | 365 | 0.5% |
| Greek | 13 | 0.0% |
| Guatemalan | 1,726 | 2.6% |
| Honduran | 964 | 1.5% |
| Hungarian | 10 | 0.0% |
| Indian (Asian) | 9 | 0.0% |
| Iranian | 30 | 0.1% |
| Irish | 239 | 0.4% |
| Israeli | 47 | 0.1% |
| Italian | 95 | 0.1% |
| Jamaican | 32 | 0.1% |
| Japanese | 19 | 0.0% |
| Korean | 368 | 0.5% |
| Laotian | 4 | 0.0% |
| Lebanese | 17 | 0.0% |
| Mexican | 48,238 | 72.7% |
| Mexican American Indian | 715 | 1.1% |
| Native Hawaiian | 20 | 0.0% |
| Navajo | 18 | 0.0% |
| Nicaraguan | 178 | 0.3% |
| Nigerian | 197 | 0.3% |
| Norwegian | 46 | 0.1% |
| Pakistani | 97 | 0.2% |
| Panamanian | 20 | 0.0% |
| Peruvian | 40 | 0.1% |
| Polish | 6 | 0.0% |
| Portuguese | 38 | 0.1% |
| Puerto Rican | 158 | 0.2% |
| Romanian | 8 | 0.0% |
| Russian | 54 | 0.1% |
| Salvadoran | 4,362 | 6.6% |
| Samoan | 30 | 0.1% |
| Scottish | 84 | 0.1% |
| Serbian | 34 | 0.1% |
| South American | 156 | 0.2% |
| Spaniard | 16 | 0.0% |
| Spanish | 16 | 0.0% |
| Sri Lankan | 110 | 0.2% |
| Subsaharan African | 576 | 0.9% |
| Swiss | 16 | 0.0% |
| West Indian | 59 | 0.1% |
| Yuman | 6 | 0.0% | View All 70 Rows |
Immigrants in Lynwood
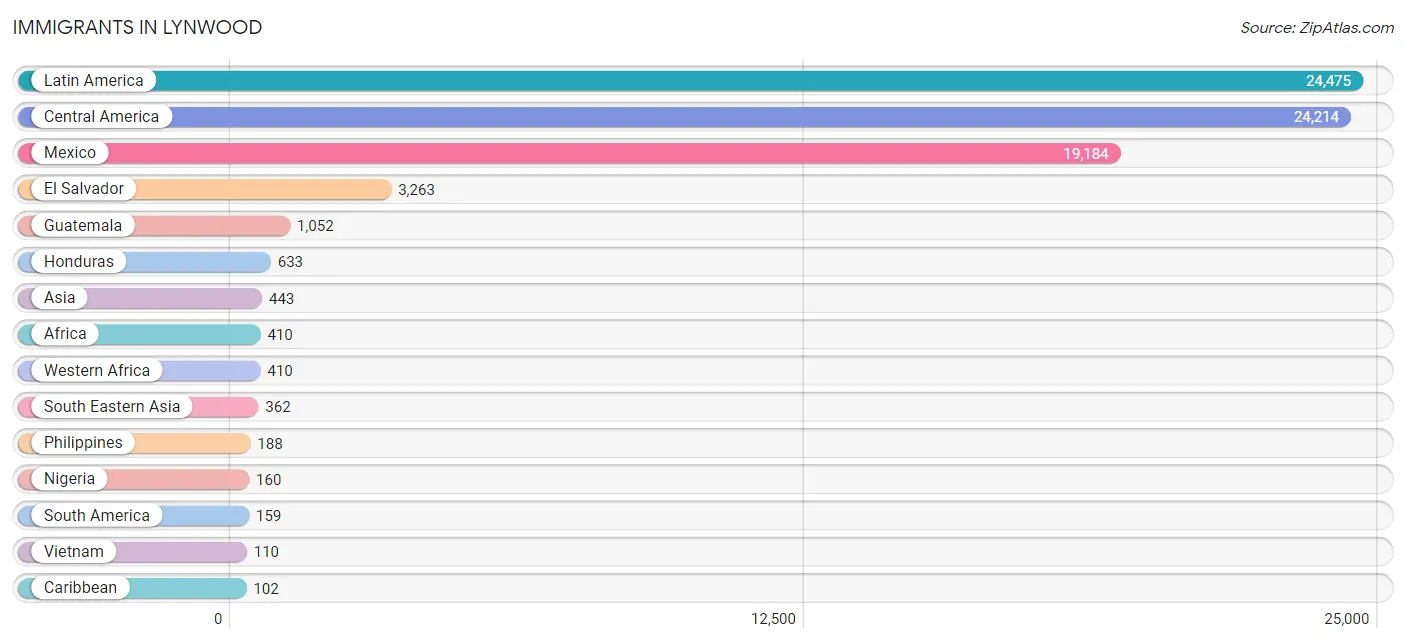
The most numerous immigrant groups reported in Lynwood came from Latin America (24,475 | 36.9%), Central America (24,214 | 36.5%), Mexico (19,184 | 28.9%), El Salvador (3,263 | 4.9%), and Guatemala (1,052 | 1.6%), together accounting for 108.8% of all Lynwood residents.
| Immigration Origin | # Population | % Population |
| Africa | 410 | 0.6% |
| Asia | 443 | 0.7% |
| Australia | 1 | 0.0% |
| Belize | 4 | 0.0% |
| Cambodia | 9 | 0.0% |
| Caribbean | 102 | 0.2% |
| Central America | 24,214 | 36.5% |
| China | 49 | 0.1% |
| Colombia | 31 | 0.1% |
| Croatia | 3 | 0.0% |
| Cuba | 10 | 0.0% |
| Dominican Republic | 23 | 0.0% |
| Eastern Asia | 52 | 0.1% |
| Eastern Europe | 57 | 0.1% |
| Ecuador | 47 | 0.1% |
| El Salvador | 3,263 | 4.9% |
| Europe | 72 | 0.1% |
| Germany | 7 | 0.0% |
| Guatemala | 1,052 | 1.6% |
| Guyana | 7 | 0.0% |
| Haiti | 8 | 0.0% |
| Honduras | 633 | 0.9% |
| Indonesia | 4 | 0.0% |
| Iran | 29 | 0.0% |
| Jamaica | 4 | 0.0% |
| Korea | 3 | 0.0% |
| Latin America | 24,475 | 36.9% |
| Mexico | 19,184 | 28.9% |
| Nicaragua | 31 | 0.1% |
| Nigeria | 160 | 0.2% |
| Northern Europe | 8 | 0.0% |
| Oceania | 19 | 0.0% |
| Panama | 20 | 0.0% |
| Peru | 74 | 0.1% |
| Philippines | 188 | 0.3% |
| Russia | 54 | 0.1% |
| South America | 159 | 0.2% |
| South Central Asia | 29 | 0.0% |
| South Eastern Asia | 362 | 0.5% |
| Thailand | 51 | 0.1% |
| Vietnam | 110 | 0.2% |
| West Indies | 57 | 0.1% |
| Western Africa | 410 | 0.6% |
| Western Europe | 7 | 0.0% | View All 44 Rows |
Sex and Age in Lynwood
Sex and Age in Lynwood
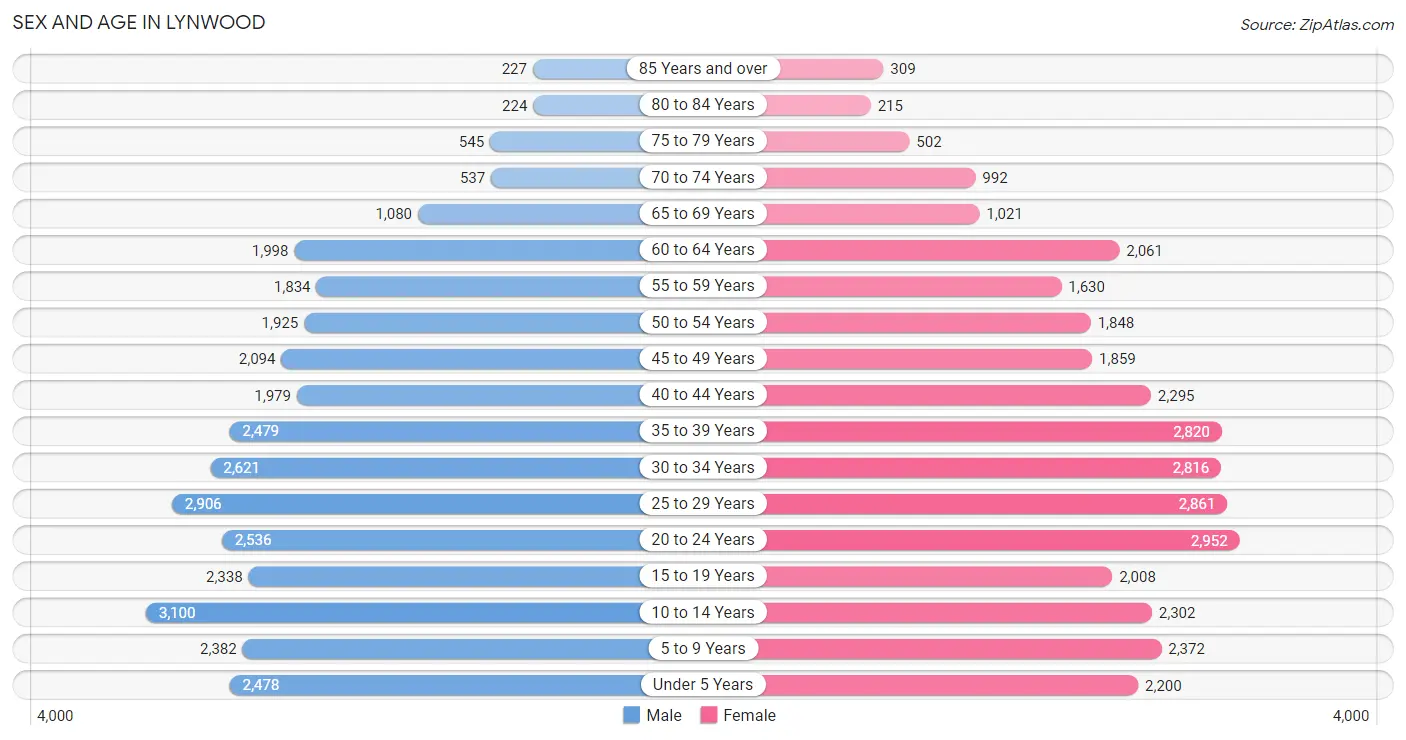
The most populous age groups in Lynwood are 10 to 14 Years (3,100 | 9.3%) for men and 20 to 24 Years (2,952 | 8.9%) for women.
| Age Bracket | Male | Female |
| Under 5 Years | 2,478 (7.4%) | 2,200 (6.7%) |
| 5 to 9 Years | 2,382 (7.2%) | 2,372 (7.2%) |
| 10 to 14 Years | 3,100 (9.3%) | 2,302 (7.0%) |
| 15 to 19 Years | 2,338 (7.0%) | 2,008 (6.1%) |
| 20 to 24 Years | 2,536 (7.6%) | 2,952 (8.9%) |
| 25 to 29 Years | 2,906 (8.7%) | 2,861 (8.6%) |
| 30 to 34 Years | 2,621 (7.9%) | 2,816 (8.5%) |
| 35 to 39 Years | 2,479 (7.4%) | 2,820 (8.5%) |
| 40 to 44 Years | 1,979 (5.9%) | 2,295 (6.9%) |
| 45 to 49 Years | 2,094 (6.3%) | 1,859 (5.6%) |
| 50 to 54 Years | 1,925 (5.8%) | 1,848 (5.6%) |
| 55 to 59 Years | 1,834 (5.5%) | 1,630 (4.9%) |
| 60 to 64 Years | 1,998 (6.0%) | 2,061 (6.2%) |
| 65 to 69 Years | 1,080 (3.2%) | 1,021 (3.1%) |
| 70 to 74 Years | 537 (1.6%) | 992 (3.0%) |
| 75 to 79 Years | 545 (1.6%) | 502 (1.5%) |
| 80 to 84 Years | 224 (0.7%) | 215 (0.6%) |
| 85 Years and over | 227 (0.7%) | 309 (0.9%) |
| Total | 33,283 (100.0%) | 33,063 (100.0%) |
Families and Households in Lynwood
Median Family Size in Lynwood
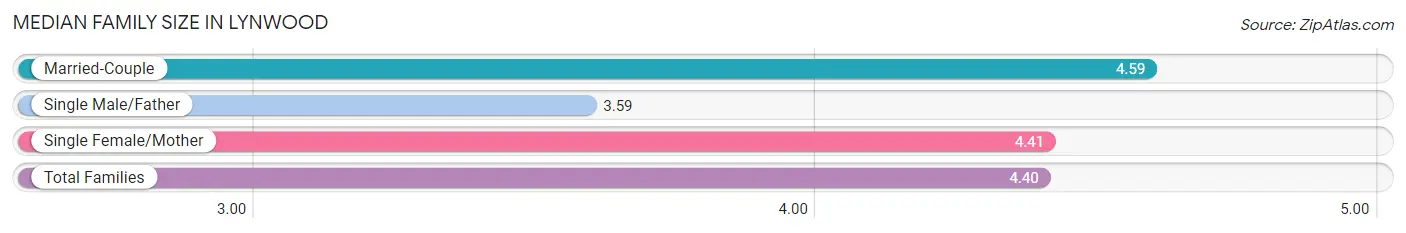
The median family size in Lynwood is 4.40 persons per family, with married-couple families (7,924 | 60.5%) accounting for the largest median family size of 4.59 persons per family. On the other hand, single male/father families (1,895 | 14.5%) represent the smallest median family size with 3.59 persons per family.
| Family Type | # Families | Family Size |
| Married-Couple | 7,924 (60.5%) | 4.59 |
| Single Male/Father | 1,895 (14.5%) | 3.59 |
| Single Female/Mother | 3,282 (25.1%) | 4.41 |
| Total Families | 13,101 (100.0%) | 4.40 |
Median Household Size in Lynwood
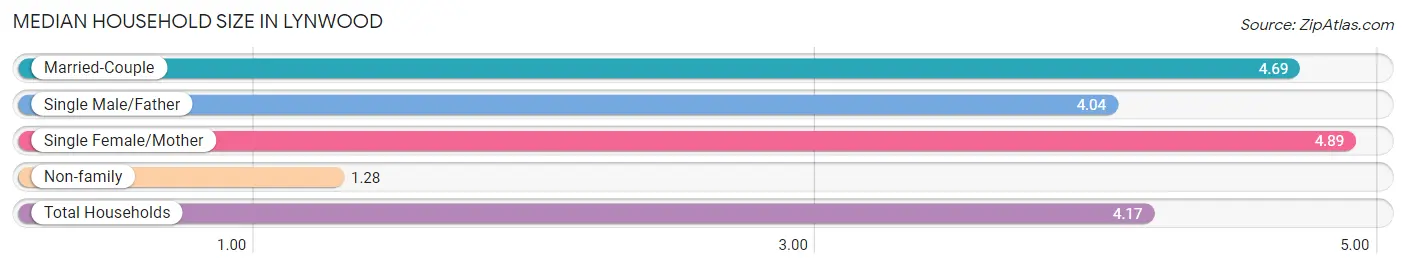
The median household size in Lynwood is 4.17 persons per household, with single female/mother households (3,282 | 21.5%) accounting for the largest median household size of 4.89 persons per household. non-family households (2,138 | 14.0%) represent the smallest median household size with 1.28 persons per household.
| Household Type | # Households | Household Size |
| Married-Couple | 7,924 (52.0%) | 4.69 |
| Single Male/Father | 1,895 (12.4%) | 4.04 |
| Single Female/Mother | 3,282 (21.5%) | 4.89 |
| Non-family | 2,138 (14.0%) | 1.28 |
| Total Households | 15,239 (100.0%) | 4.17 |
Household Size by Marriage Status in Lynwood
Out of a total of 15,239 households in Lynwood, 13,101 (86.0%) are family households, while 2,138 (14.0%) are nonfamily households. The most numerous type of family households are 4-person households, comprising 2,870, and the most common type of nonfamily households are 1-person households, comprising 1,801.
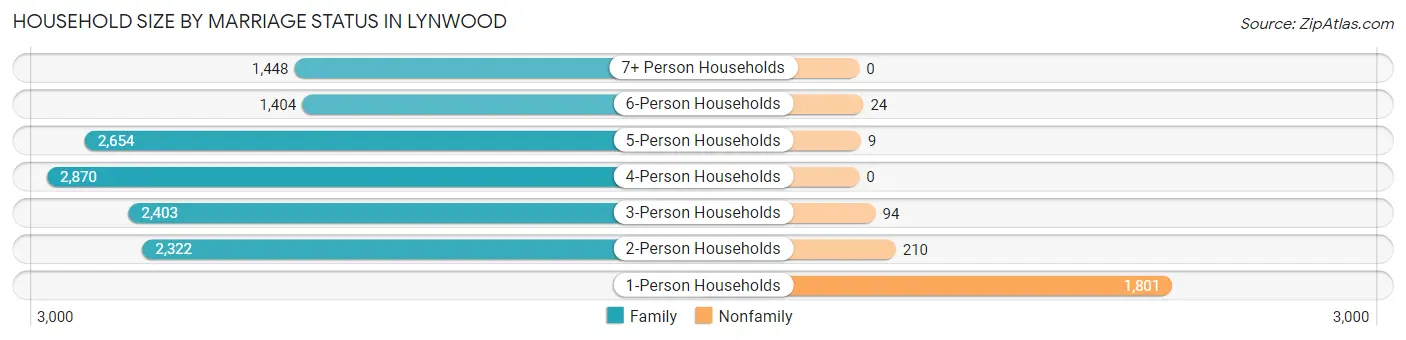
| Household Size | Family Households | Nonfamily Households |
| 1-Person Households | - | 1,801 (11.8%) |
| 2-Person Households | 2,322 (15.2%) | 210 (1.4%) |
| 3-Person Households | 2,403 (15.8%) | 94 (0.6%) |
| 4-Person Households | 2,870 (18.8%) | 0 (0.0%) |
| 5-Person Households | 2,654 (17.4%) | 9 (0.1%) |
| 6-Person Households | 1,404 (9.2%) | 24 (0.2%) |
| 7+ Person Households | 1,448 (9.5%) | 0 (0.0%) |
| Total | 13,101 (86.0%) | 2,138 (14.0%) |
Female Fertility in Lynwood
Fertility by Age in Lynwood
Average fertility rate in Lynwood is 56.0 births per 1,000 women. Women in the age bracket of 20 to 34 years have the highest fertility rate with 76.0 births per 1,000 women. Women in the age bracket of 20 to 34 years acount for 64.0% of all women with births.
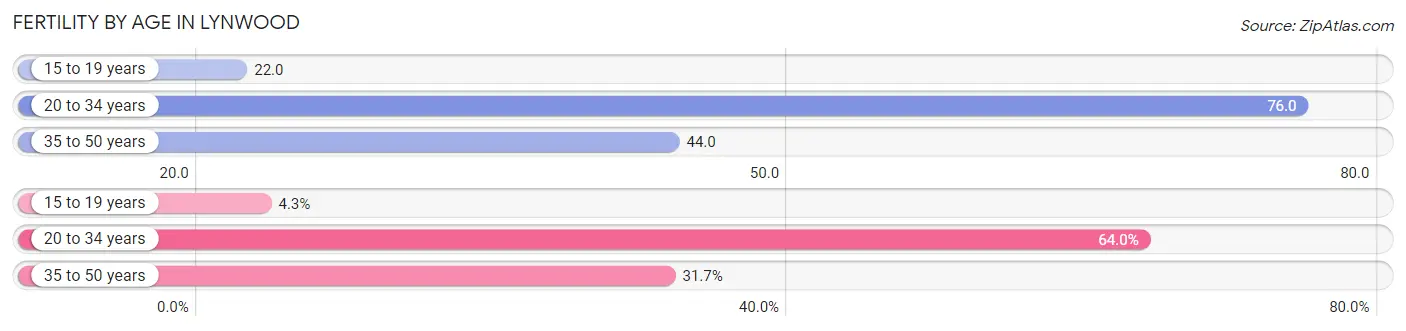
| Age Bracket | Women with Births | Births / 1,000 Women |
| 15 to 19 years | 44 (4.3%) | 22.0 |
| 20 to 34 years | 653 (64.0%) | 76.0 |
| 35 to 50 years | 324 (31.7%) | 44.0 |
| Total | 1,021 (100.0%) | 56.0 |
Fertility by Age by Marriage Status in Lynwood
60.4% of women with births (1,021) in Lynwood are married. The highest percentage of unmarried women with births falls into 15 to 19 years age bracket with 100.0% of them unmarried at the time of birth, while the lowest percentage of unmarried women with births belong to 35 to 50 years age bracket with 21.0% of them unmarried.
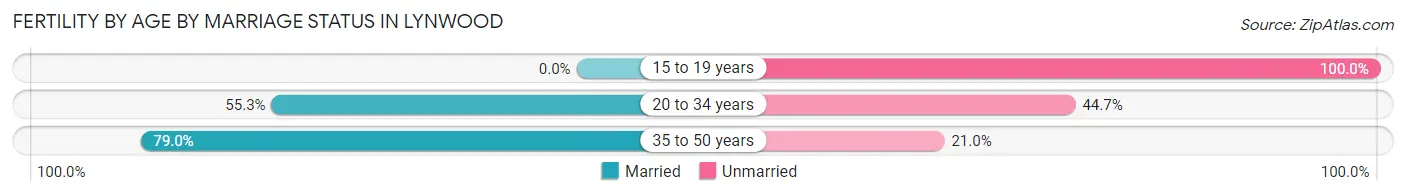
| Age Bracket | Married | Unmarried |
| 15 to 19 years | 0 (0.0%) | 44 (100.0%) |
| 20 to 34 years | 361 (55.3%) | 292 (44.7%) |
| 35 to 50 years | 256 (79.0%) | 68 (21.0%) |
| Total | 617 (60.4%) | 404 (39.6%) |
Fertility by Education in Lynwood
Average fertility rate in Lynwood is 56.0 births per 1,000 women. Women with the education attainment of graduate degree have the highest fertility rate of 91.0 births per 1,000 women, while women with the education attainment of less than high school have the lowest fertility at 38.0 births per 1,000 women. Women with the education attainment of high school diploma represent 36.9% of all women with births.
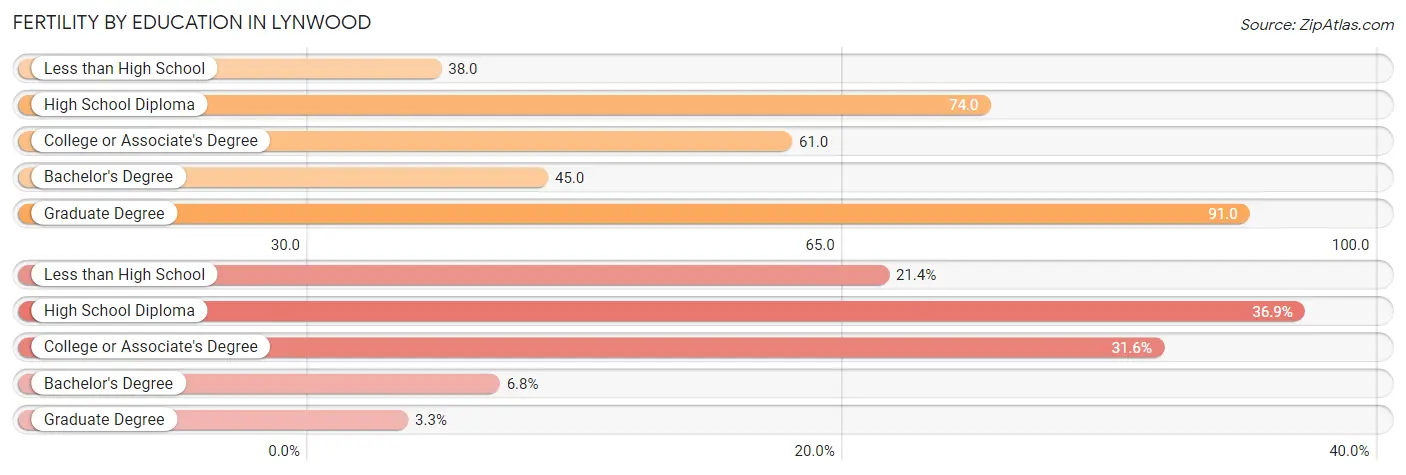
| Educational Attainment | Women with Births | Births / 1,000 Women |
| Less than High School | 218 (21.3%) | 38.0 |
| High School Diploma | 377 (36.9%) | 74.0 |
| College or Associate's Degree | 323 (31.6%) | 61.0 |
| Bachelor's Degree | 69 (6.8%) | 45.0 |
| Graduate Degree | 34 (3.3%) | 91.0 |
| Total | 1,021 (100.0%) | 56.0 |
Fertility by Education by Marriage Status in Lynwood
39.6% of women with births in Lynwood are unmarried. Women with the educational attainment of high school diploma are most likely to be married with 72.7% of them married at childbirth, while women with the educational attainment of bachelor's degree are least likely to be married with 78.3% of them unmarried at childbirth.
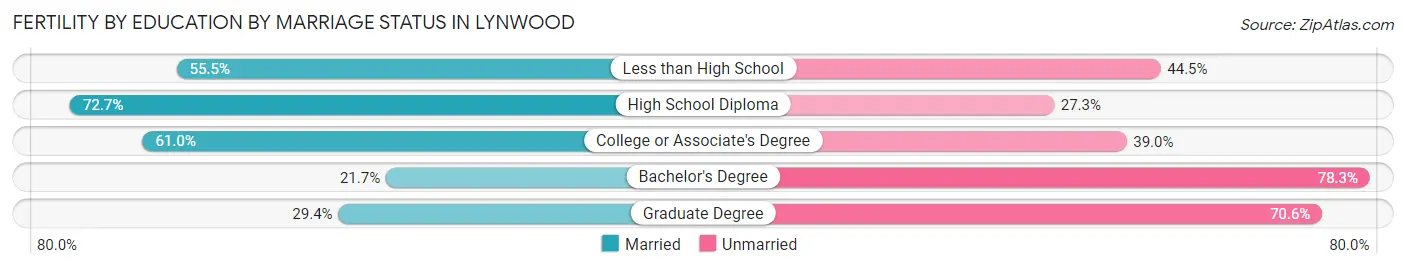
| Educational Attainment | Married | Unmarried |
| Less than High School | 121 (55.5%) | 97 (44.5%) |
| High School Diploma | 274 (72.7%) | 103 (27.3%) |
| College or Associate's Degree | 197 (61.0%) | 126 (39.0%) |
| Bachelor's Degree | 15 (21.7%) | 54 (78.3%) |
| Graduate Degree | 10 (29.4%) | 24 (70.6%) |
| Total | 617 (60.4%) | 404 (39.6%) |
Employment Characteristics in Lynwood
Employment by Class of Employer in Lynwood
Among the 27,631 employed individuals in Lynwood, private company employees (21,834 | 79.0%), self-employed (not incorporated) (1,793 | 6.5%), and local government employees (1,278 | 4.6%) make up the most common classes of employment.
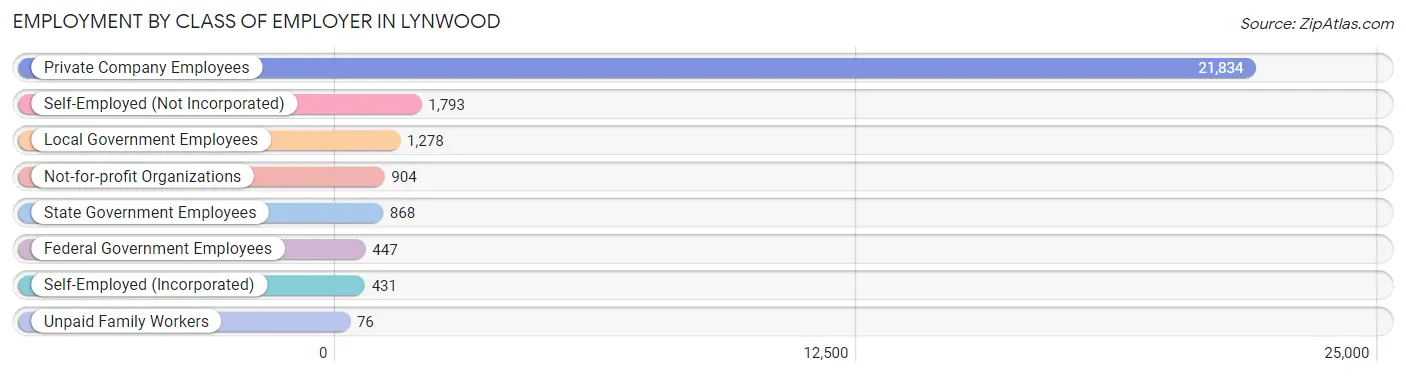
| Employer Class | # Employees | % Employees |
| Private Company Employees | 21,834 | 79.0% |
| Self-Employed (Incorporated) | 431 | 1.6% |
| Self-Employed (Not Incorporated) | 1,793 | 6.5% |
| Not-for-profit Organizations | 904 | 3.3% |
| Local Government Employees | 1,278 | 4.6% |
| State Government Employees | 868 | 3.1% |
| Federal Government Employees | 447 | 1.6% |
| Unpaid Family Workers | 76 | 0.3% |
| Total | 27,631 | 100.0% |
Employment Status by Age in Lynwood
According to the labor force statistics for Lynwood, out of the total population over 16 years of age (50,602), 61.4% or 31,070 individuals are in the labor force, with 9.6% or 2,983 of them unemployed. The age group with the highest labor force participation rate is 25 to 29 years, with 76.7% or 4,423 individuals in the labor force. Within the labor force, the 16 to 19 years age range has the highest percentage of unemployed individuals, with 27.7% or 298 of them being unemployed.
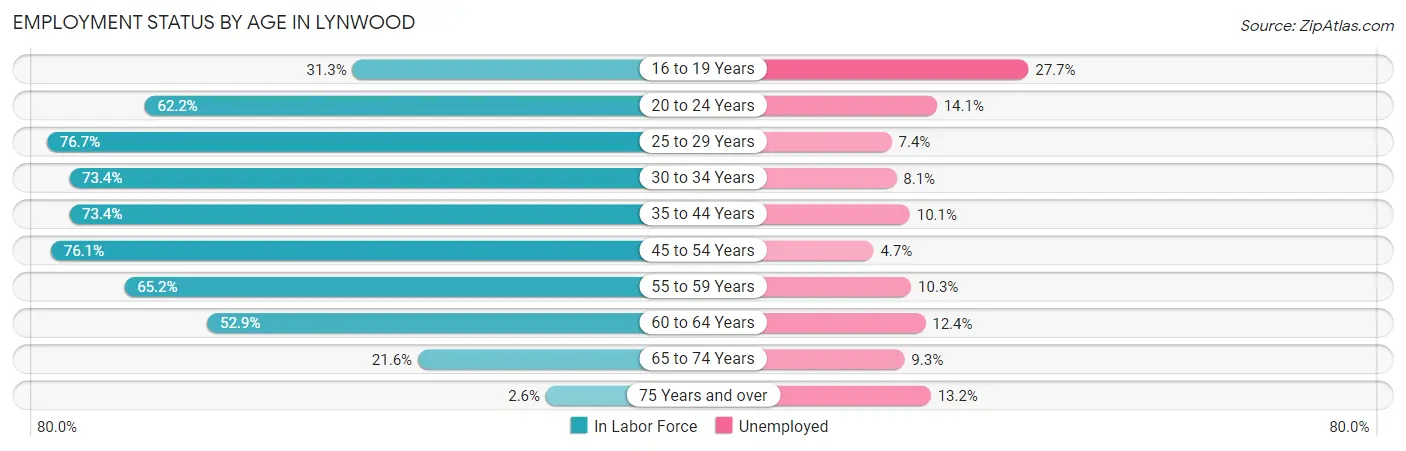
| Age Bracket | In Labor Force | Unemployed |
| 16 to 19 Years | 1,075 (31.3%) | 298 (27.7%) |
| 20 to 24 Years | 3,414 (62.2%) | 481 (14.1%) |
| 25 to 29 Years | 4,423 (76.7%) | 327 (7.4%) |
| 30 to 34 Years | 3,991 (73.4%) | 323 (8.1%) |
| 35 to 44 Years | 7,027 (73.4%) | 710 (10.1%) |
| 45 to 54 Years | 5,879 (76.1%) | 276 (4.7%) |
| 55 to 59 Years | 2,259 (65.2%) | 233 (10.3%) |
| 60 to 64 Years | 2,147 (52.9%) | 266 (12.4%) |
| 65 to 74 Years | 784 (21.6%) | 73 (9.3%) |
| 75 Years and over | 53 (2.6%) | 7 (13.2%) |
| Total | 31,070 (61.4%) | 2,983 (9.6%) |
Employment Status by Educational Attainment in Lynwood
According to labor force statistics for Lynwood, 71.4% of individuals (25,723) out of the total population between 25 and 64 years of age (36,026) are in the labor force, with 8.3% or 2,135 of them being unemployed. The group with the highest labor force participation rate are those with the educational attainment of bachelor's degree or higher, with 86.2% or 2,770 individuals in the labor force. Within the labor force, individuals with high school diploma education have the highest percentage of unemployment, with 9.6% or 673 of them being unemployed.
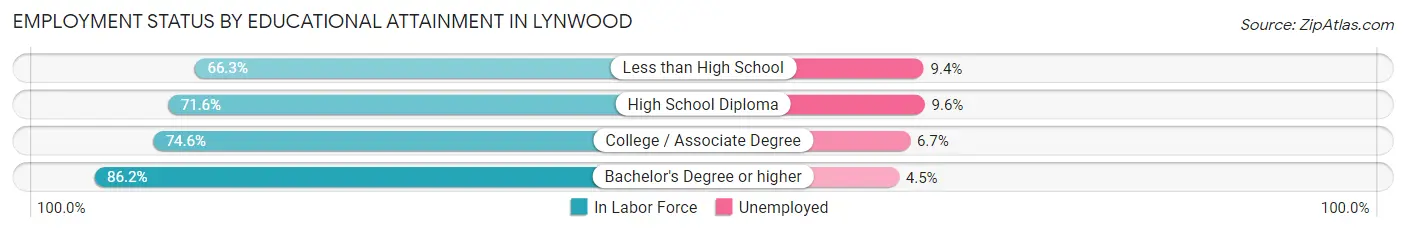
| Educational Attainment | In Labor Force | Unemployed |
| Less than High School | 9,852 (66.3%) | 1,397 (9.4%) |
| High School Diploma | 7,011 (71.6%) | 940 (9.6%) |
| College / Associate Degree | 6,088 (74.6%) | 547 (6.7%) |
| Bachelor's Degree or higher | 2,770 (86.2%) | 145 (4.5%) |
| Total | 25,723 (71.4%) | 2,990 (8.3%) |
Employment Occupations by Sex in Lynwood
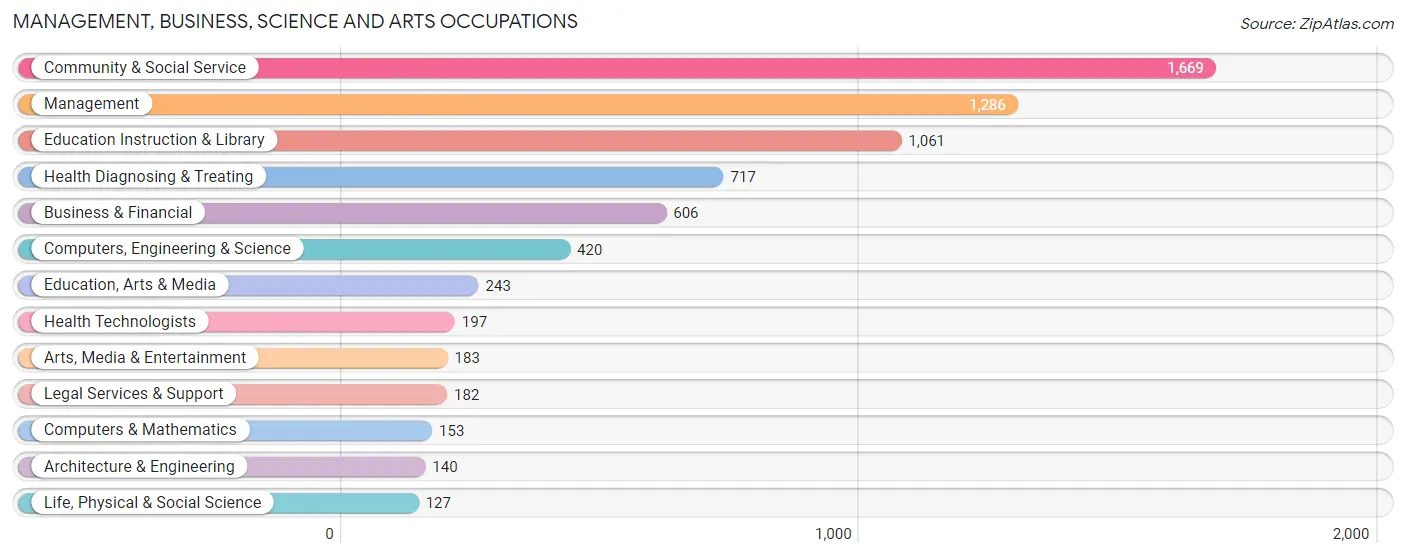
Management, Business, Science and Arts Occupations
The most common Management, Business, Science and Arts occupations in Lynwood are Community & Social Service (1,669 | 5.9%), Management (1,286 | 4.6%), Education Instruction & Library (1,061 | 3.8%), Health Diagnosing & Treating (717 | 2.6%), and Business & Financial (606 | 2.2%).
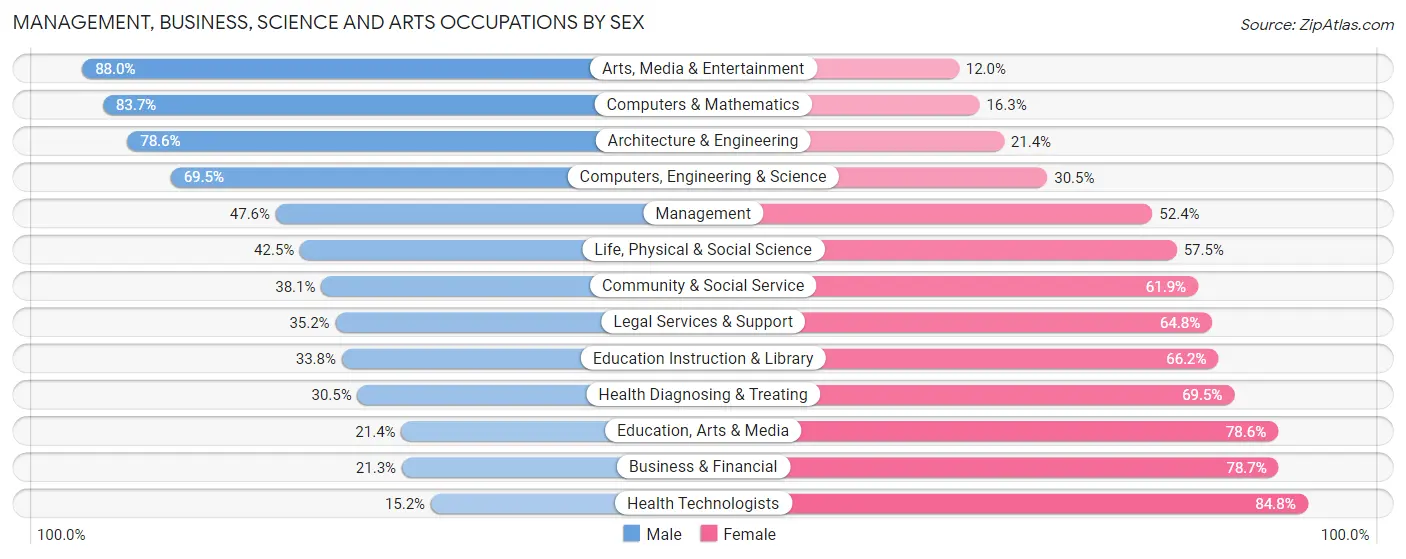
Management, Business, Science and Arts Occupations by Sex
Within the Management, Business, Science and Arts occupations in Lynwood, the most male-oriented occupations are Arts, Media & Entertainment (88.0%), Computers & Mathematics (83.7%), and Architecture & Engineering (78.6%), while the most female-oriented occupations are Health Technologists (84.8%), Business & Financial (78.7%), and Education, Arts & Media (78.6%).
| Occupation | Male | Female |
| Management | 612 (47.6%) | 674 (52.4%) |
| Business & Financial | 129 (21.3%) | 477 (78.7%) |
| Computers, Engineering & Science | 292 (69.5%) | 128 (30.5%) |
| Computers & Mathematics | 128 (83.7%) | 25 (16.3%) |
| Architecture & Engineering | 110 (78.6%) | 30 (21.4%) |
| Life, Physical & Social Science | 54 (42.5%) | 73 (57.5%) |
| Community & Social Service | 636 (38.1%) | 1,033 (61.9%) |
| Education, Arts & Media | 52 (21.4%) | 191 (78.6%) |
| Legal Services & Support | 64 (35.2%) | 118 (64.8%) |
| Education Instruction & Library | 359 (33.8%) | 702 (66.2%) |
| Arts, Media & Entertainment | 161 (88.0%) | 22 (12.0%) |
| Health Diagnosing & Treating | 219 (30.5%) | 498 (69.5%) |
| Health Technologists | 30 (15.2%) | 167 (84.8%) |
| Total (Category) | 1,888 (40.2%) | 2,810 (59.8%) |
| Total (Overall) | 15,896 (56.7%) | 12,147 (43.3%) |
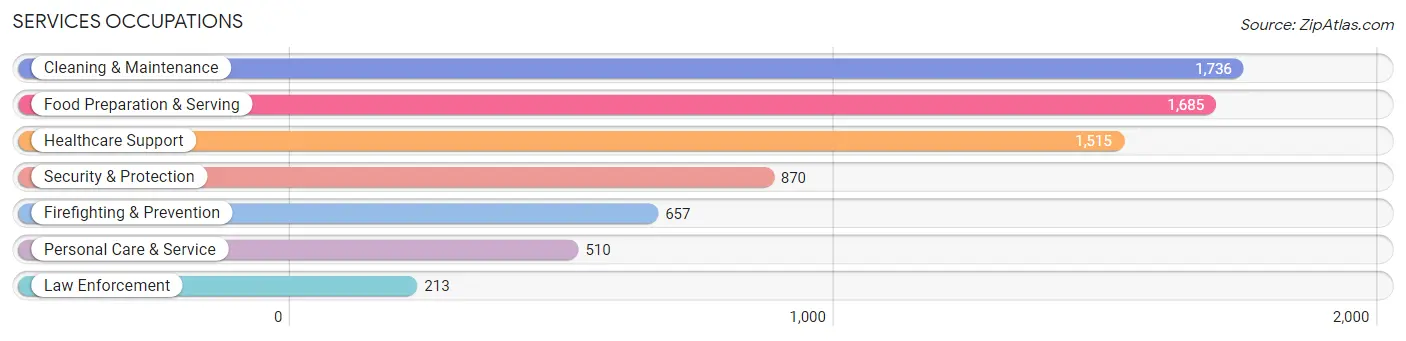
Services Occupations
The most common Services occupations in Lynwood are Cleaning & Maintenance (1,736 | 6.2%), Food Preparation & Serving (1,685 | 6.0%), Healthcare Support (1,515 | 5.4%), Security & Protection (870 | 3.1%), and Firefighting & Prevention (657 | 2.3%).
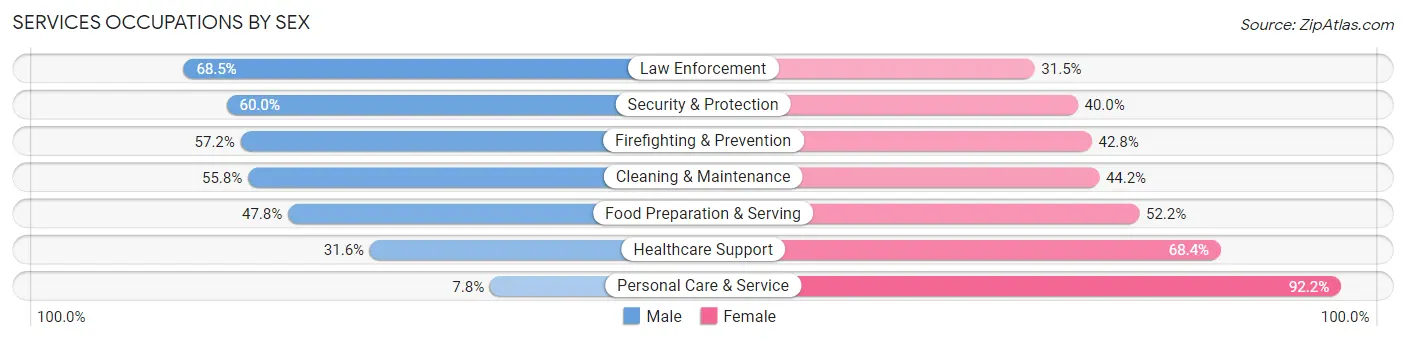
Services Occupations by Sex
Within the Services occupations in Lynwood, the most male-oriented occupations are Law Enforcement (68.5%), Security & Protection (60.0%), and Firefighting & Prevention (57.2%), while the most female-oriented occupations are Personal Care & Service (92.2%), Healthcare Support (68.4%), and Food Preparation & Serving (52.2%).
| Occupation | Male | Female |
| Healthcare Support | 479 (31.6%) | 1,036 (68.4%) |
| Security & Protection | 522 (60.0%) | 348 (40.0%) |
| Firefighting & Prevention | 376 (57.2%) | 281 (42.8%) |
| Law Enforcement | 146 (68.5%) | 67 (31.5%) |
| Food Preparation & Serving | 806 (47.8%) | 879 (52.2%) |
| Cleaning & Maintenance | 968 (55.8%) | 768 (44.2%) |
| Personal Care & Service | 40 (7.8%) | 470 (92.2%) |
| Total (Category) | 2,815 (44.6%) | 3,501 (55.4%) |
| Total (Overall) | 15,896 (56.7%) | 12,147 (43.3%) |
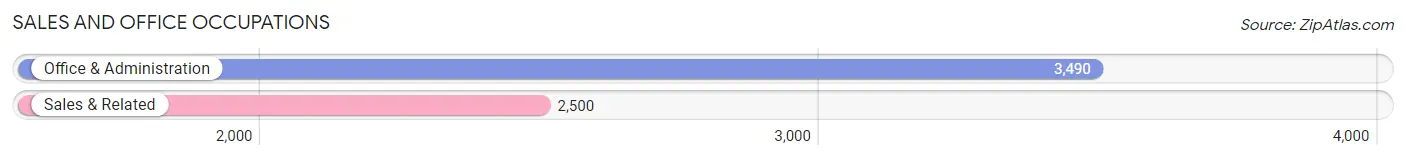
Sales and Office Occupations
The most common Sales and Office occupations in Lynwood are Office & Administration (3,490 | 12.4%), and Sales & Related (2,500 | 8.9%).
Sales and Office Occupations by Sex
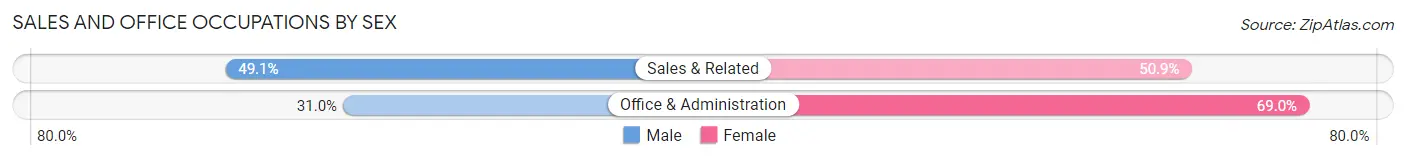
| Occupation | Male | Female |
| Sales & Related | 1,228 (49.1%) | 1,272 (50.9%) |
| Office & Administration | 1,083 (31.0%) | 2,407 (69.0%) |
| Total (Category) | 2,311 (38.6%) | 3,679 (61.4%) |
| Total (Overall) | 15,896 (56.7%) | 12,147 (43.3%) |
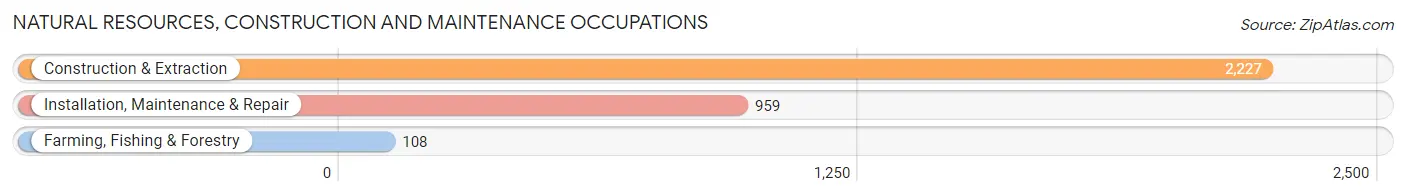
Natural Resources, Construction and Maintenance Occupations
The most common Natural Resources, Construction and Maintenance occupations in Lynwood are Construction & Extraction (2,227 | 7.9%), Installation, Maintenance & Repair (959 | 3.4%), and Farming, Fishing & Forestry (108 | 0.4%).
Natural Resources, Construction and Maintenance Occupations by Sex
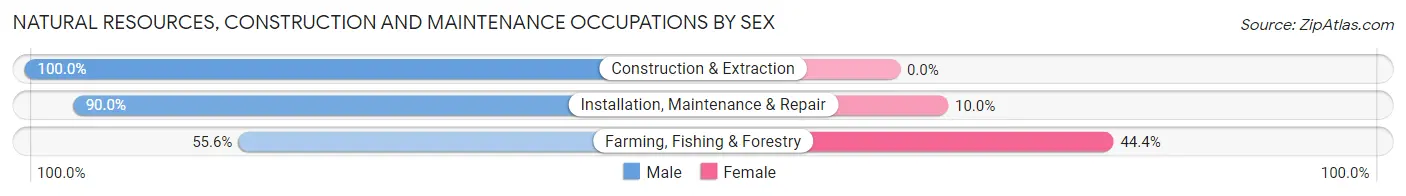
| Occupation | Male | Female |
| Farming, Fishing & Forestry | 60 (55.6%) | 48 (44.4%) |
| Construction & Extraction | 2,227 (100.0%) | 0 (0.0%) |
| Installation, Maintenance & Repair | 863 (90.0%) | 96 (10.0%) |
| Total (Category) | 3,150 (95.6%) | 144 (4.4%) |
| Total (Overall) | 15,896 (56.7%) | 12,147 (43.3%) |
Production, Transportation and Moving Occupations
The most common Production, Transportation and Moving occupations in Lynwood are Production (3,187 | 11.4%), Material Moving (2,555 | 9.1%), and Transportation (2,003 | 7.1%).
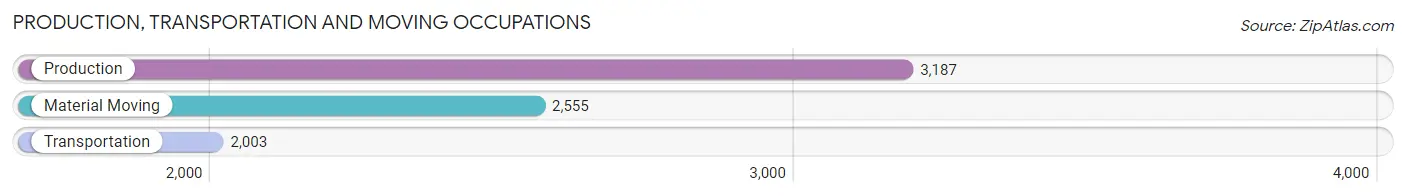
Production, Transportation and Moving Occupations by Sex
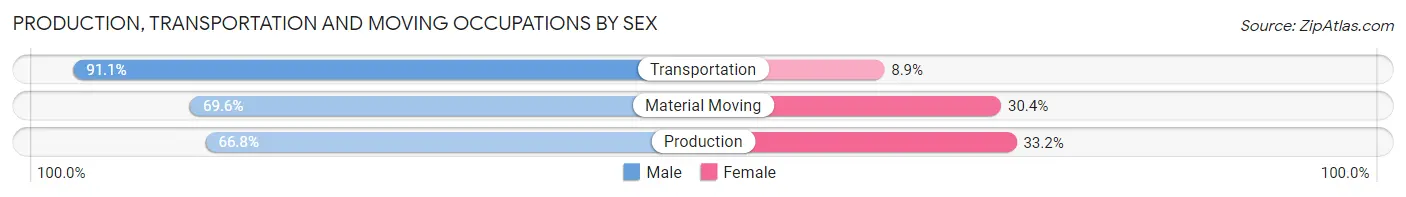
| Occupation | Male | Female |
| Production | 2,129 (66.8%) | 1,058 (33.2%) |
| Transportation | 1,824 (91.1%) | 179 (8.9%) |
| Material Moving | 1,779 (69.6%) | 776 (30.4%) |
| Total (Category) | 5,732 (74.0%) | 2,013 (26.0%) |
| Total (Overall) | 15,896 (56.7%) | 12,147 (43.3%) |
Employment Industries by Sex in Lynwood
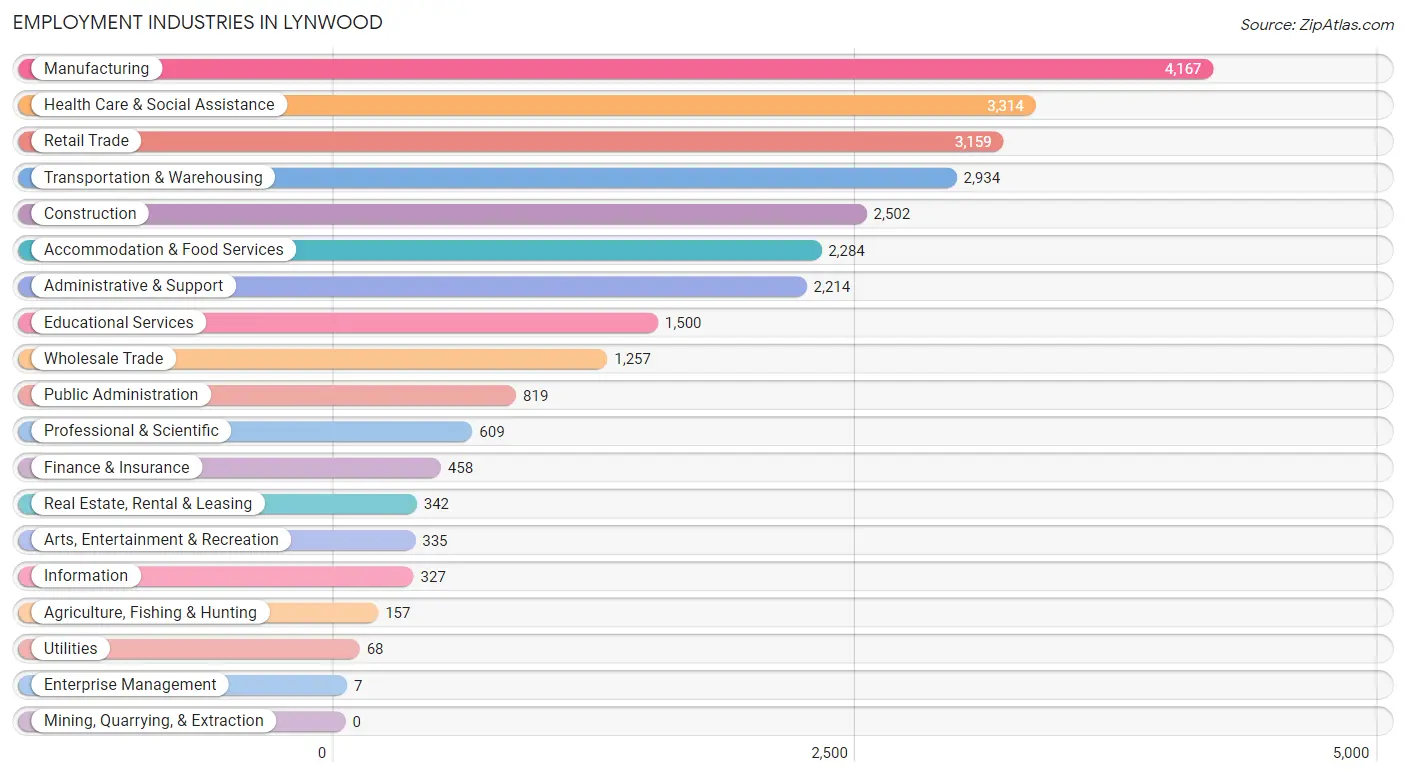
Employment Industries in Lynwood
The major employment industries in Lynwood include Manufacturing (4,167 | 14.9%), Health Care & Social Assistance (3,314 | 11.8%), Retail Trade (3,159 | 11.3%), Transportation & Warehousing (2,934 | 10.5%), and Construction (2,502 | 8.9%).
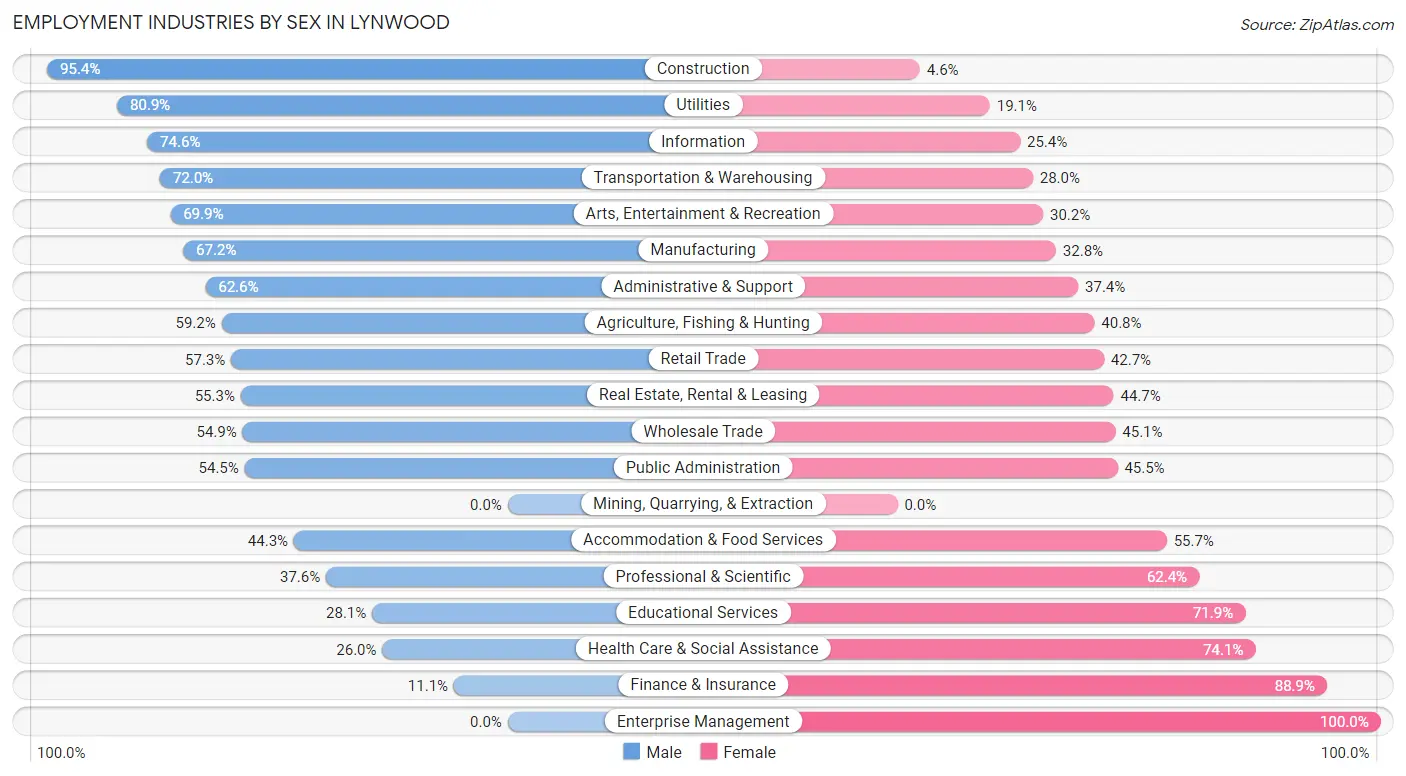
Employment Industries by Sex in Lynwood
The Lynwood industries that see more men than women are Construction (95.4%), Utilities (80.9%), and Information (74.6%), whereas the industries that tend to have a higher number of women are Enterprise Management (100.0%), Finance & Insurance (88.9%), and Health Care & Social Assistance (74.1%).
| Industry | Male | Female |
| Agriculture, Fishing & Hunting | 93 (59.2%) | 64 (40.8%) |
| Mining, Quarrying, & Extraction | 0 (0.0%) | 0 (0.0%) |
| Construction | 2,386 (95.4%) | 116 (4.6%) |
| Manufacturing | 2,800 (67.2%) | 1,367 (32.8%) |
| Wholesale Trade | 690 (54.9%) | 567 (45.1%) |
| Retail Trade | 1,809 (57.3%) | 1,350 (42.7%) |
| Transportation & Warehousing | 2,112 (72.0%) | 822 (28.0%) |
| Utilities | 55 (80.9%) | 13 (19.1%) |
| Information | 244 (74.6%) | 83 (25.4%) |
| Finance & Insurance | 51 (11.1%) | 407 (88.9%) |
| Real Estate, Rental & Leasing | 189 (55.3%) | 153 (44.7%) |
| Professional & Scientific | 229 (37.6%) | 380 (62.4%) |
| Enterprise Management | 0 (0.0%) | 7 (100.0%) |
| Administrative & Support | 1,386 (62.6%) | 828 (37.4%) |
| Educational Services | 421 (28.1%) | 1,079 (71.9%) |
| Health Care & Social Assistance | 860 (26.0%) | 2,454 (74.1%) |
| Arts, Entertainment & Recreation | 234 (69.9%) | 101 (30.1%) |
| Accommodation & Food Services | 1,011 (44.3%) | 1,273 (55.7%) |
| Public Administration | 446 (54.5%) | 373 (45.5%) |
| Total | 15,896 (56.7%) | 12,147 (43.3%) |
Education in Lynwood
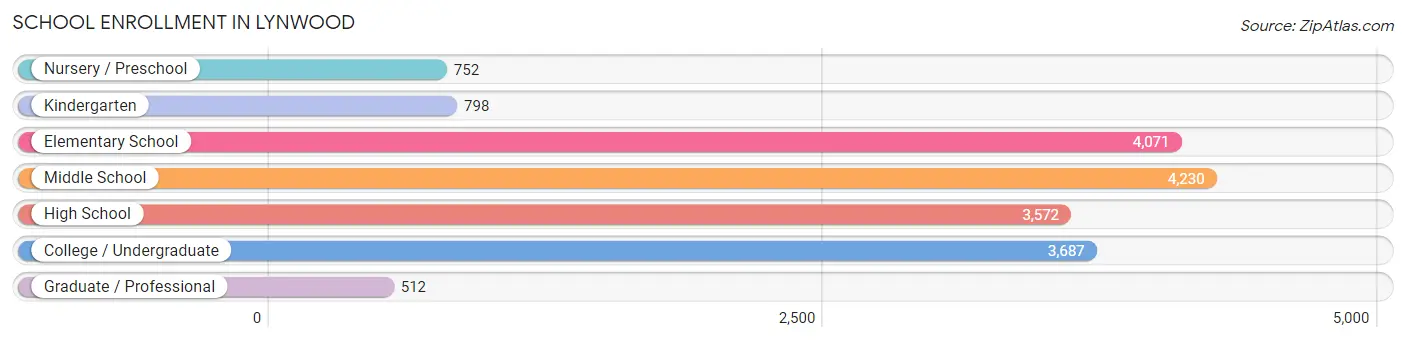
School Enrollment in Lynwood
The most common levels of schooling among the 17,622 students in Lynwood are middle school (4,230 | 24.0%), elementary school (4,071 | 23.1%), and college / undergraduate (3,687 | 20.9%).
| School Level | # Students | % Students |
| Nursery / Preschool | 752 | 4.3% |
| Kindergarten | 798 | 4.5% |
| Elementary School | 4,071 | 23.1% |
| Middle School | 4,230 | 24.0% |
| High School | 3,572 | 20.3% |
| College / Undergraduate | 3,687 | 20.9% |
| Graduate / Professional | 512 | 2.9% |
| Total | 17,622 | 100.0% |
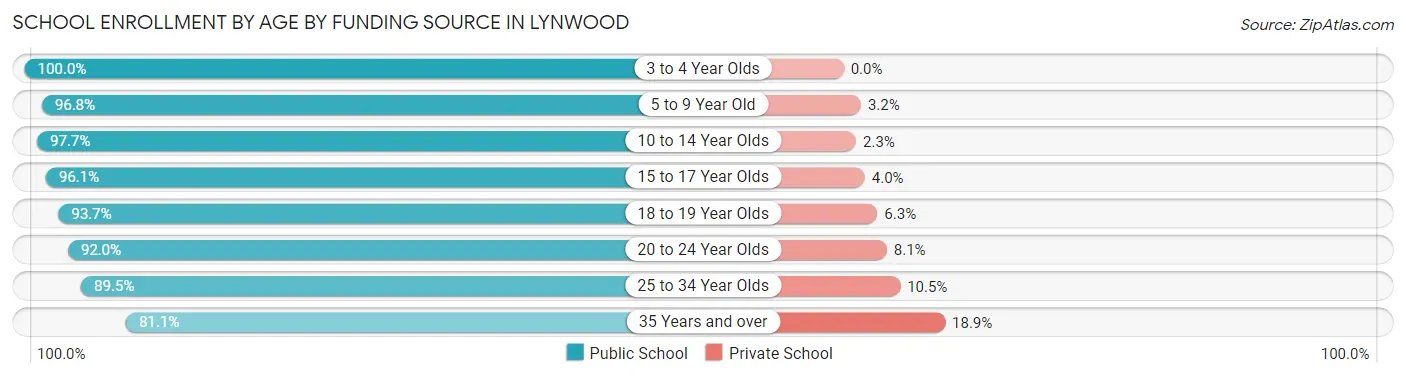
School Enrollment by Age by Funding Source in Lynwood
Out of a total of 17,622 students who are enrolled in schools in Lynwood, 811 (4.6%) attend a private institution, while the remaining 16,811 (95.4%) are enrolled in public schools. The age group of 35 years and over has the highest likelihood of being enrolled in private schools, with 122 (18.9% in the age bracket) enrolled. Conversely, the age group of 3 to 4 year olds has the lowest likelihood of being enrolled in a private school, with 686 (100.0% in the age bracket) attending a public institution.
| Age Bracket | Public School | Private School |
| 3 to 4 Year Olds | 686 (100.0%) | 0 (0.0%) |
| 5 to 9 Year Old | 4,363 (96.8%) | 145 (3.2%) |
| 10 to 14 Year Olds | 5,181 (97.7%) | 123 (2.3%) |
| 15 to 17 Year Olds | 2,142 (96.1%) | 88 (4.0%) |
| 18 to 19 Year Olds | 1,089 (93.7%) | 73 (6.3%) |
| 20 to 24 Year Olds | 2,113 (91.9%) | 185 (8.1%) |
| 25 to 34 Year Olds | 705 (89.5%) | 83 (10.5%) |
| 35 Years and over | 524 (81.1%) | 122 (18.9%) |
| Total | 16,811 (95.4%) | 811 (4.6%) |
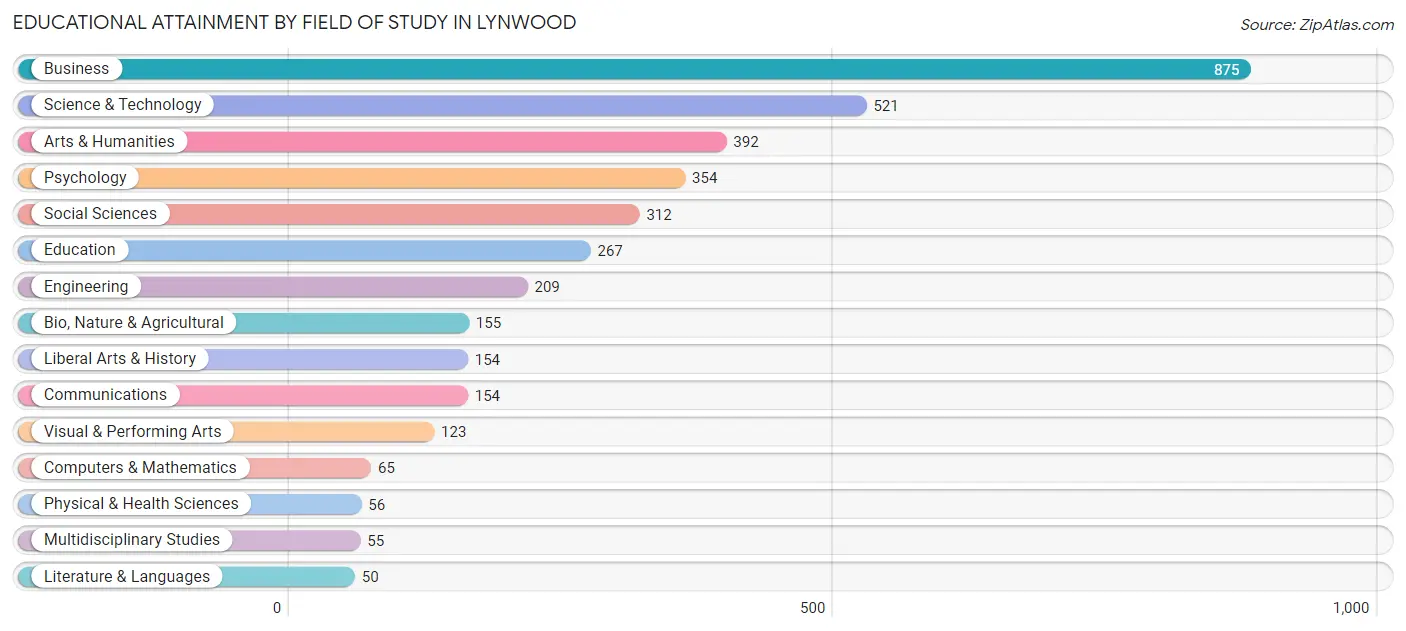
Educational Attainment by Field of Study in Lynwood
Business (875 | 23.4%), science & technology (521 | 13.9%), arts & humanities (392 | 10.5%), psychology (354 | 9.5%), and social sciences (312 | 8.3%) are the most common fields of study among 3,742 individuals in Lynwood who have obtained a bachelor's degree or higher.
| Field of Study | # Graduates | % Graduates |
| Computers & Mathematics | 65 | 1.7% |
| Bio, Nature & Agricultural | 155 | 4.1% |
| Physical & Health Sciences | 56 | 1.5% |
| Psychology | 354 | 9.5% |
| Social Sciences | 312 | 8.3% |
| Engineering | 209 | 5.6% |
| Multidisciplinary Studies | 55 | 1.5% |
| Science & Technology | 521 | 13.9% |
| Business | 875 | 23.4% |
| Education | 267 | 7.1% |
| Literature & Languages | 50 | 1.3% |
| Liberal Arts & History | 154 | 4.1% |
| Visual & Performing Arts | 123 | 3.3% |
| Communications | 154 | 4.1% |
| Arts & Humanities | 392 | 10.5% |
| Total | 3,742 | 100.0% |
Transportation & Commute in Lynwood
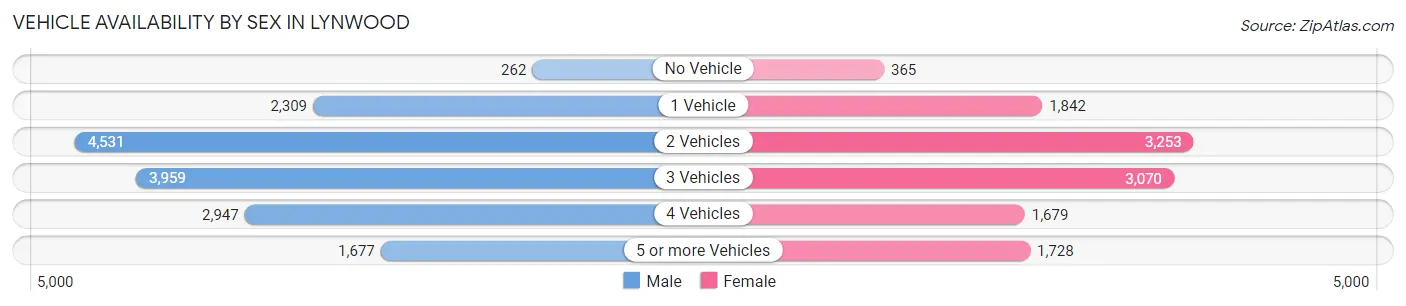
Vehicle Availability by Sex in Lynwood
The most prevalent vehicle ownership categories in Lynwood are males with 2 vehicles (4,531, accounting for 28.9%) and females with 2 vehicles (3,253, making up 38.0%).
| Vehicles Available | Male | Female |
| No Vehicle | 262 (1.7%) | 365 (3.1%) |
| 1 Vehicle | 2,309 (14.7%) | 1,842 (15.4%) |
| 2 Vehicles | 4,531 (28.9%) | 3,253 (27.3%) |
| 3 Vehicles | 3,959 (25.2%) | 3,070 (25.7%) |
| 4 Vehicles | 2,947 (18.8%) | 1,679 (14.1%) |
| 5 or more Vehicles | 1,677 (10.7%) | 1,728 (14.5%) |
| Total | 15,685 (100.0%) | 11,937 (100.0%) |
Commute Time in Lynwood
The most frequently occuring commute durations in Lynwood are 30 to 34 minutes (5,809 commuters, 21.7%), 20 to 24 minutes (4,514 commuters, 16.9%), and 15 to 19 minutes (3,193 commuters, 11.9%).
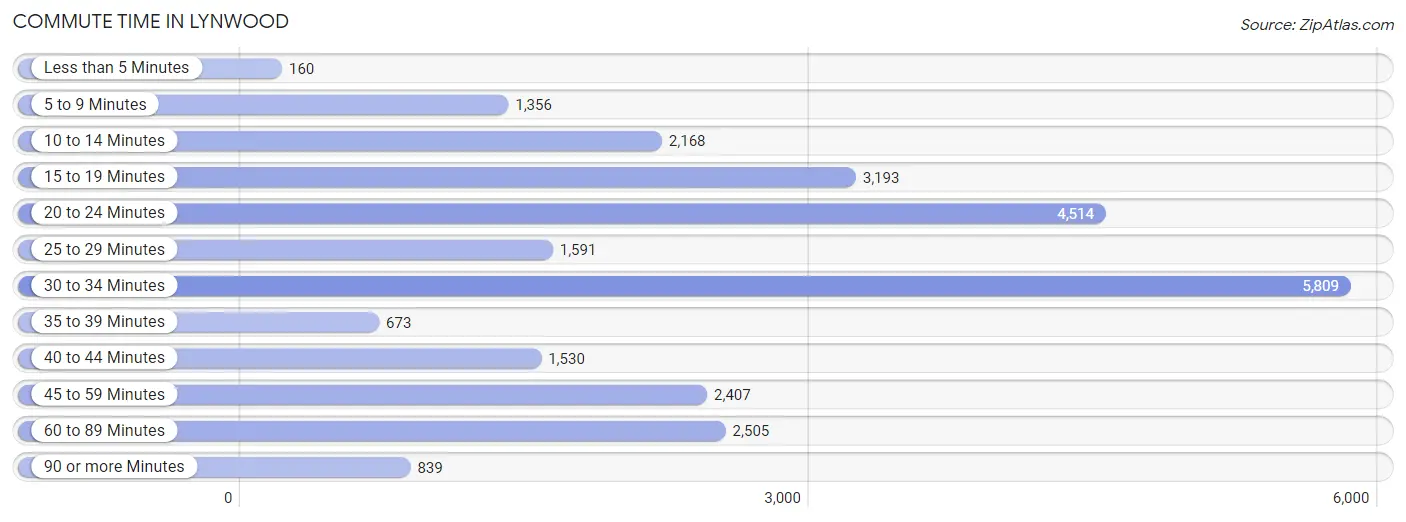
| Commute Time | # Commuters | % Commuters |
| Less than 5 Minutes | 160 | 0.6% |
| 5 to 9 Minutes | 1,356 | 5.1% |
| 10 to 14 Minutes | 2,168 | 8.1% |
| 15 to 19 Minutes | 3,193 | 11.9% |
| 20 to 24 Minutes | 4,514 | 16.9% |
| 25 to 29 Minutes | 1,591 | 5.9% |
| 30 to 34 Minutes | 5,809 | 21.7% |
| 35 to 39 Minutes | 673 | 2.5% |
| 40 to 44 Minutes | 1,530 | 5.7% |
| 45 to 59 Minutes | 2,407 | 9.0% |
| 60 to 89 Minutes | 2,505 | 9.4% |
| 90 or more Minutes | 839 | 3.1% |
Commute Time by Sex in Lynwood
The most common commute times in Lynwood are 30 to 34 minutes (3,840 commuters, 25.0%) for males and 20 to 24 minutes (2,073 commuters, 18.2%) for females.
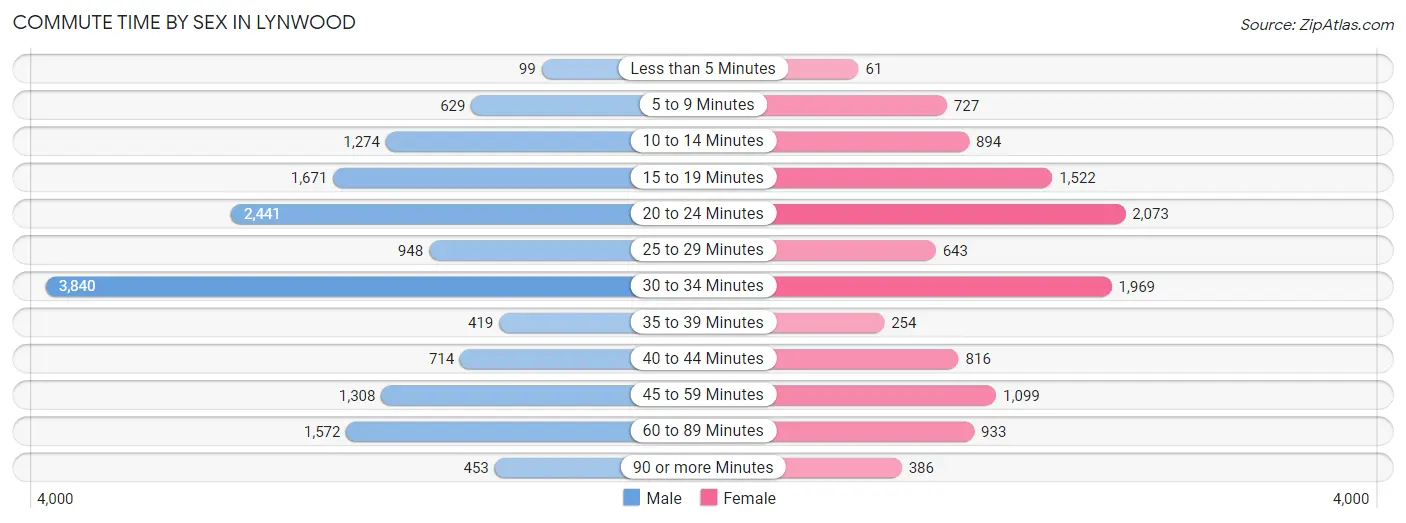
| Commute Time | Male | Female |
| Less than 5 Minutes | 99 (0.6%) | 61 (0.5%) |
| 5 to 9 Minutes | 629 (4.1%) | 727 (6.4%) |
| 10 to 14 Minutes | 1,274 (8.3%) | 894 (7.9%) |
| 15 to 19 Minutes | 1,671 (10.9%) | 1,522 (13.4%) |
| 20 to 24 Minutes | 2,441 (15.9%) | 2,073 (18.2%) |
| 25 to 29 Minutes | 948 (6.2%) | 643 (5.7%) |
| 30 to 34 Minutes | 3,840 (25.0%) | 1,969 (17.3%) |
| 35 to 39 Minutes | 419 (2.7%) | 254 (2.2%) |
| 40 to 44 Minutes | 714 (4.6%) | 816 (7.2%) |
| 45 to 59 Minutes | 1,308 (8.5%) | 1,099 (9.7%) |
| 60 to 89 Minutes | 1,572 (10.2%) | 933 (8.2%) |
| 90 or more Minutes | 453 (2.9%) | 386 (3.4%) |
Time of Departure to Work by Sex in Lynwood
The most frequent times of departure to work in Lynwood are 12:00 AM to 4:59 AM (2,002, 13.0%) for males and 7:30 AM to 7:59 AM (1,364, 12.0%) for females.
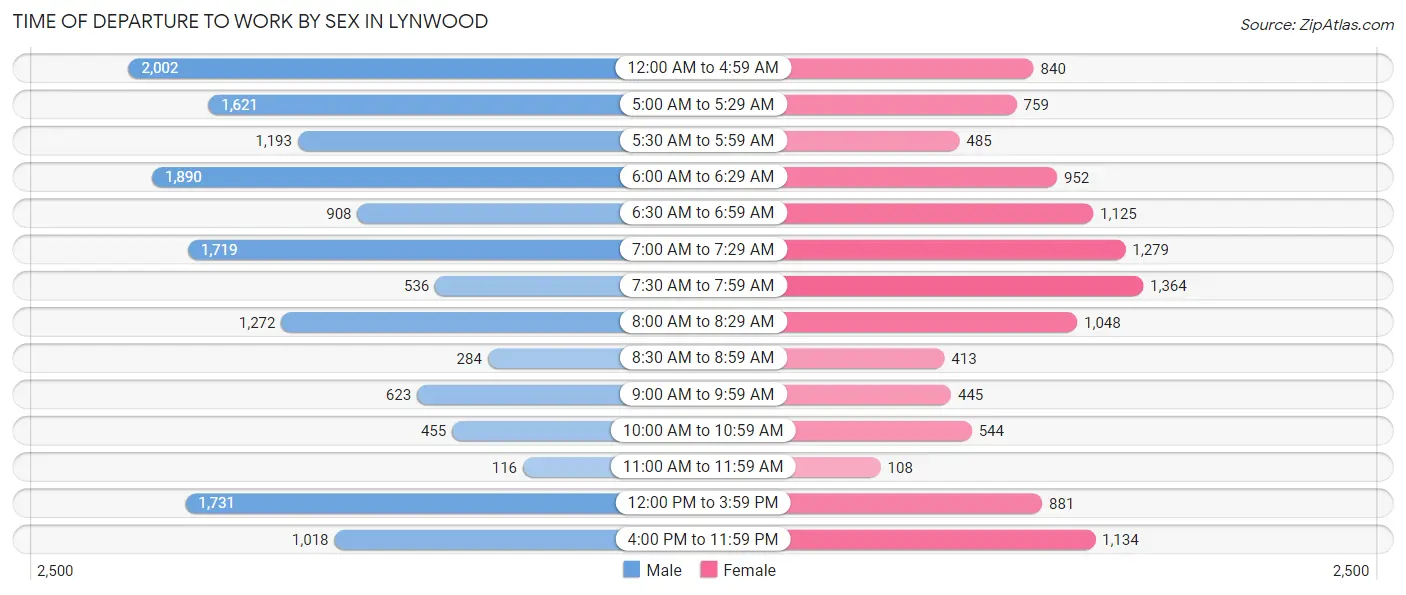
| Time of Departure | Male | Female |
| 12:00 AM to 4:59 AM | 2,002 (13.0%) | 840 (7.4%) |
| 5:00 AM to 5:29 AM | 1,621 (10.5%) | 759 (6.7%) |
| 5:30 AM to 5:59 AM | 1,193 (7.8%) | 485 (4.3%) |
| 6:00 AM to 6:29 AM | 1,890 (12.3%) | 952 (8.4%) |
| 6:30 AM to 6:59 AM | 908 (5.9%) | 1,125 (9.9%) |
| 7:00 AM to 7:29 AM | 1,719 (11.2%) | 1,279 (11.2%) |
| 7:30 AM to 7:59 AM | 536 (3.5%) | 1,364 (12.0%) |
| 8:00 AM to 8:29 AM | 1,272 (8.3%) | 1,048 (9.2%) |
| 8:30 AM to 8:59 AM | 284 (1.8%) | 413 (3.6%) |
| 9:00 AM to 9:59 AM | 623 (4.1%) | 445 (3.9%) |
| 10:00 AM to 10:59 AM | 455 (3.0%) | 544 (4.8%) |
| 11:00 AM to 11:59 AM | 116 (0.7%) | 108 (0.9%) |
| 12:00 PM to 3:59 PM | 1,731 (11.3%) | 881 (7.7%) |
| 4:00 PM to 11:59 PM | 1,018 (6.6%) | 1,134 (10.0%) |
| Total | 15,368 (100.0%) | 11,377 (100.0%) |
Housing Occupancy in Lynwood
Occupancy by Ownership in Lynwood
Of the total 15,239 dwellings in Lynwood, owner-occupied units account for 7,535 (49.4%), while renter-occupied units make up 7,704 (50.5%).
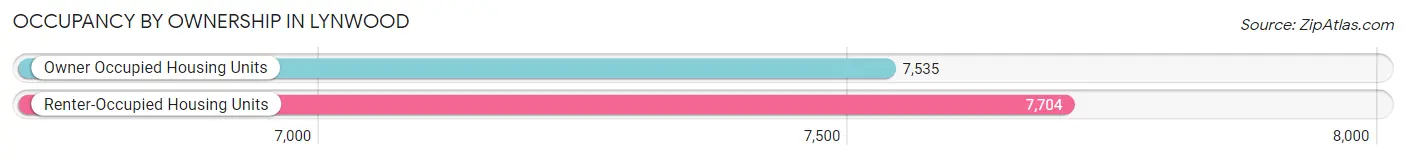
| Occupancy | # Housing Units | % Housing Units |
| Owner Occupied Housing Units | 7,535 | 49.4% |
| Renter-Occupied Housing Units | 7,704 | 50.5% |
| Total Occupied Housing Units | 15,239 | 100.0% |
Occupancy by Household Size in Lynwood
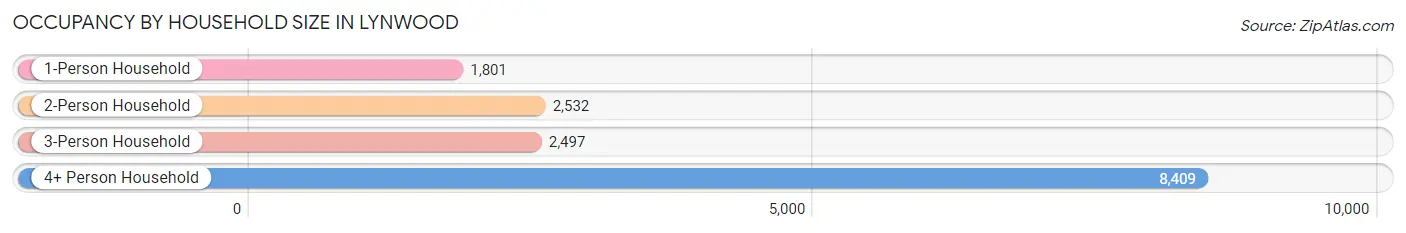
| Household Size | # Housing Units | % Housing Units |
| 1-Person Household | 1,801 | 11.8% |
| 2-Person Household | 2,532 | 16.6% |
| 3-Person Household | 2,497 | 16.4% |
| 4+ Person Household | 8,409 | 55.2% |
| Total Housing Units | 15,239 | 100.0% |
Occupancy by Ownership by Household Size in Lynwood
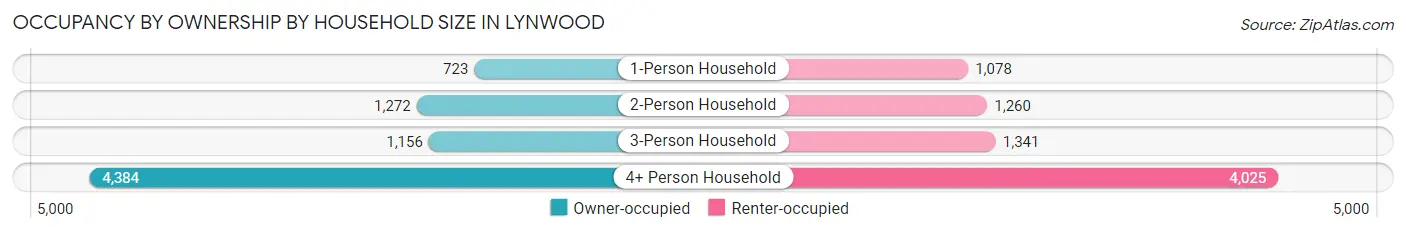
| Household Size | Owner-occupied | Renter-occupied |
| 1-Person Household | 723 (40.1%) | 1,078 (59.9%) |
| 2-Person Household | 1,272 (50.2%) | 1,260 (49.8%) |
| 3-Person Household | 1,156 (46.3%) | 1,341 (53.7%) |
| 4+ Person Household | 4,384 (52.1%) | 4,025 (47.9%) |
| Total Housing Units | 7,535 (49.4%) | 7,704 (50.5%) |
Occupancy by Educational Attainment in Lynwood
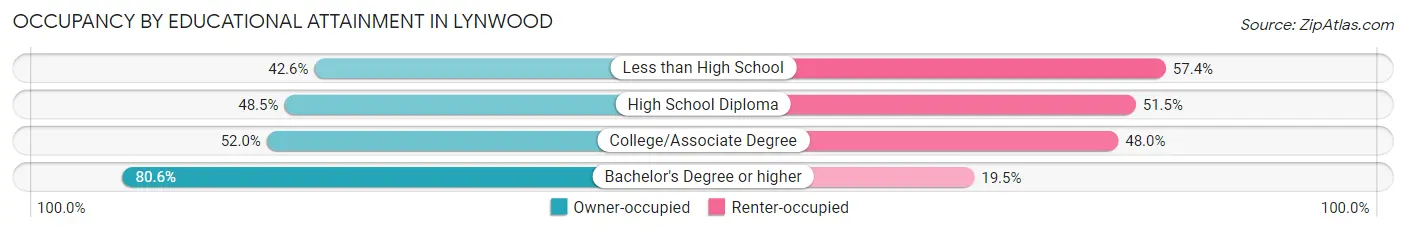
| Household Size | Owner-occupied | Renter-occupied |
| Less than High School | 2,882 (42.6%) | 3,890 (57.4%) |
| High School Diploma | 1,837 (48.5%) | 1,949 (51.5%) |
| College/Associate Degree | 1,739 (52.0%) | 1,605 (48.0%) |
| Bachelor's Degree or higher | 1,077 (80.5%) | 260 (19.5%) |
Occupancy by Age of Householder in Lynwood
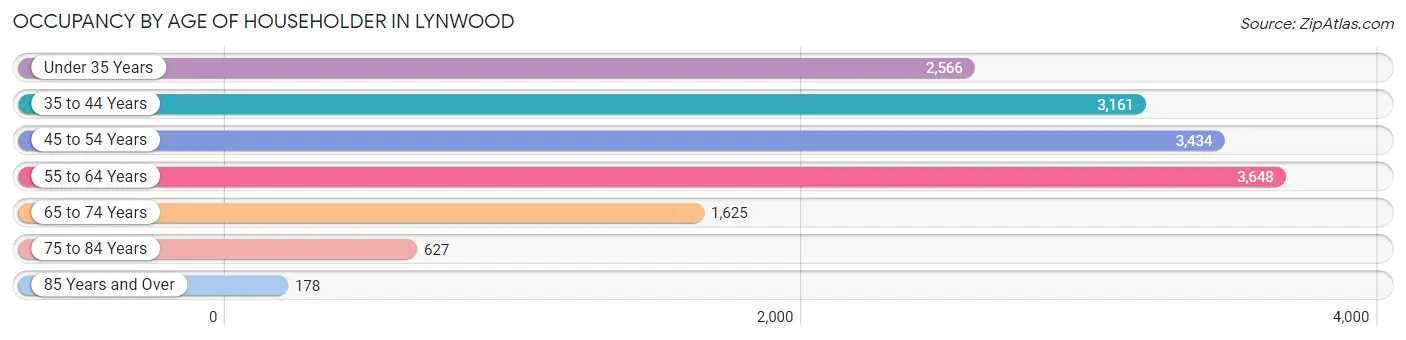
| Age Bracket | # Households | % Households |
| Under 35 Years | 2,566 | 16.8% |
| 35 to 44 Years | 3,161 | 20.7% |
| 45 to 54 Years | 3,434 | 22.5% |
| 55 to 64 Years | 3,648 | 23.9% |
| 65 to 74 Years | 1,625 | 10.7% |
| 75 to 84 Years | 627 | 4.1% |
| 85 Years and Over | 178 | 1.2% |
| Total | 15,239 | 100.0% |
Housing Finances in Lynwood
Median Income by Occupancy in Lynwood
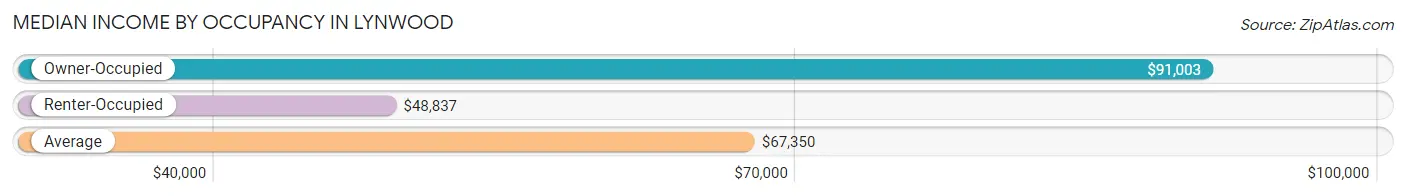
| Occupancy Type | # Households | Median Income |
| Owner-Occupied | 7,535 (49.4%) | $91,003 |
| Renter-Occupied | 7,704 (50.5%) | $48,837 |
| Average | 15,239 (100.0%) | $67,350 |
Occupancy by Householder Income Bracket in Lynwood
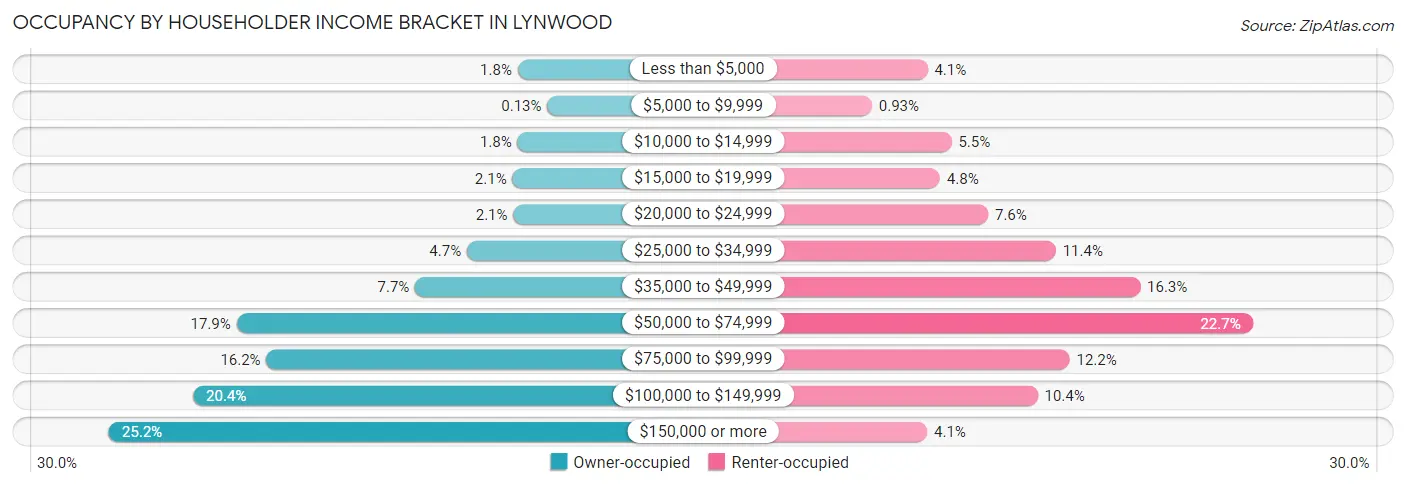
| Income Bracket | Owner-occupied | Renter-occupied |
| Less than $5,000 | 137 (1.8%) | 317 (4.1%) |
| $5,000 to $9,999 | 10 (0.1%) | 72 (0.9%) |
| $10,000 to $14,999 | 138 (1.8%) | 422 (5.5%) |
| $15,000 to $19,999 | 160 (2.1%) | 371 (4.8%) |
| $20,000 to $24,999 | 156 (2.1%) | 583 (7.6%) |
| $25,000 to $34,999 | 356 (4.7%) | 881 (11.4%) |
| $35,000 to $49,999 | 579 (7.7%) | 1,253 (16.3%) |
| $50,000 to $74,999 | 1,348 (17.9%) | 1,747 (22.7%) |
| $75,000 to $99,999 | 1,219 (16.2%) | 942 (12.2%) |
| $100,000 to $149,999 | 1,535 (20.4%) | 801 (10.4%) |
| $150,000 or more | 1,897 (25.2%) | 315 (4.1%) |
| Total | 7,535 (100.0%) | 7,704 (100.0%) |
Monthly Housing Cost Tiers in Lynwood
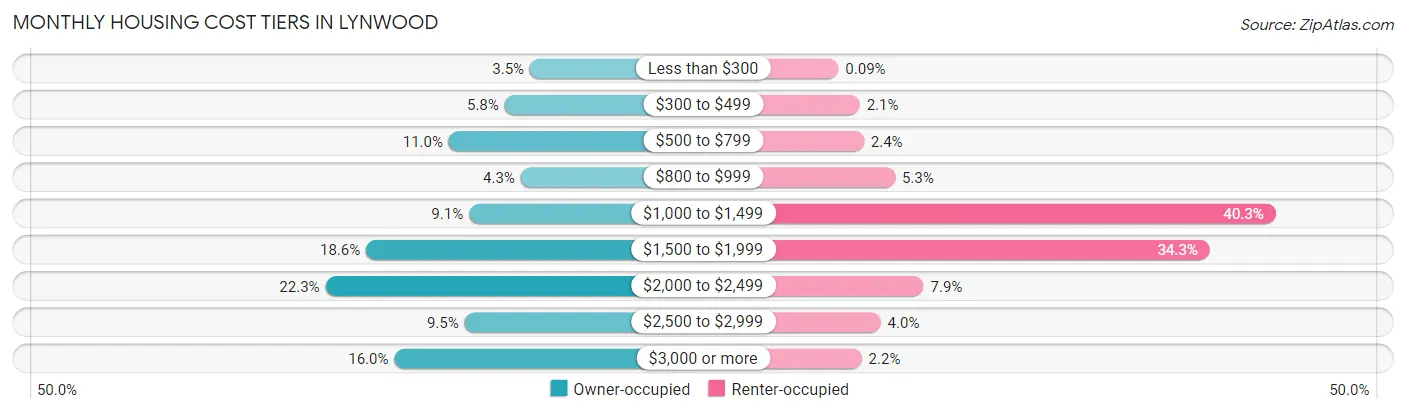
| Monthly Cost | Owner-occupied | Renter-occupied |
| Less than $300 | 262 (3.5%) | 7 (0.1%) |
| $300 to $499 | 438 (5.8%) | 158 (2.1%) |
| $500 to $799 | 825 (11.0%) | 187 (2.4%) |
| $800 to $999 | 326 (4.3%) | 408 (5.3%) |
| $1,000 to $1,499 | 685 (9.1%) | 3,108 (40.3%) |
| $1,500 to $1,999 | 1,399 (18.6%) | 2,640 (34.3%) |
| $2,000 to $2,499 | 1,681 (22.3%) | 611 (7.9%) |
| $2,500 to $2,999 | 716 (9.5%) | 307 (4.0%) |
| $3,000 or more | 1,203 (16.0%) | 172 (2.2%) |
| Total | 7,535 (100.0%) | 7,704 (100.0%) |
Physical Housing Characteristics in Lynwood
Housing Structures in Lynwood
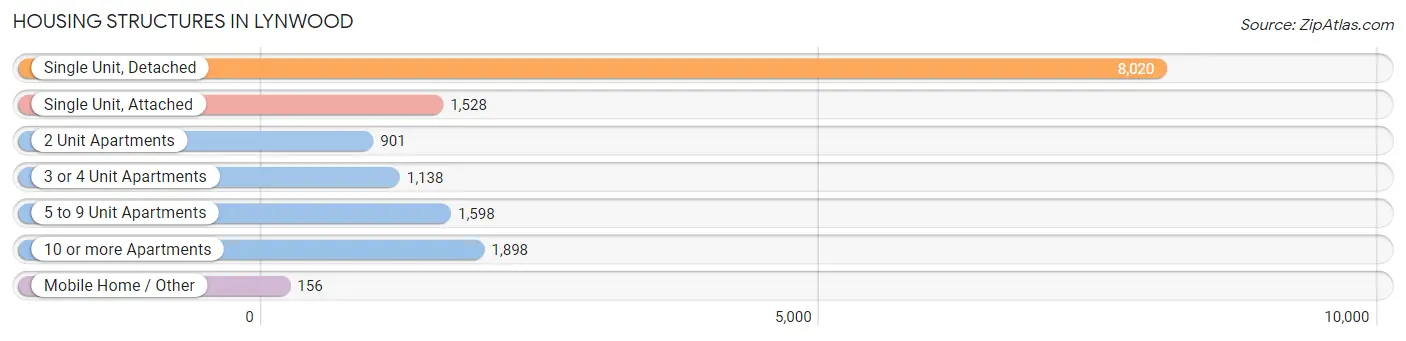
| Structure Type | # Housing Units | % Housing Units |
| Single Unit, Detached | 8,020 | 52.6% |
| Single Unit, Attached | 1,528 | 10.0% |
| 2 Unit Apartments | 901 | 5.9% |
| 3 or 4 Unit Apartments | 1,138 | 7.5% |
| 5 to 9 Unit Apartments | 1,598 | 10.5% |
| 10 or more Apartments | 1,898 | 12.4% |
| Mobile Home / Other | 156 | 1.0% |
| Total | 15,239 | 100.0% |
Housing Structures by Occupancy in Lynwood
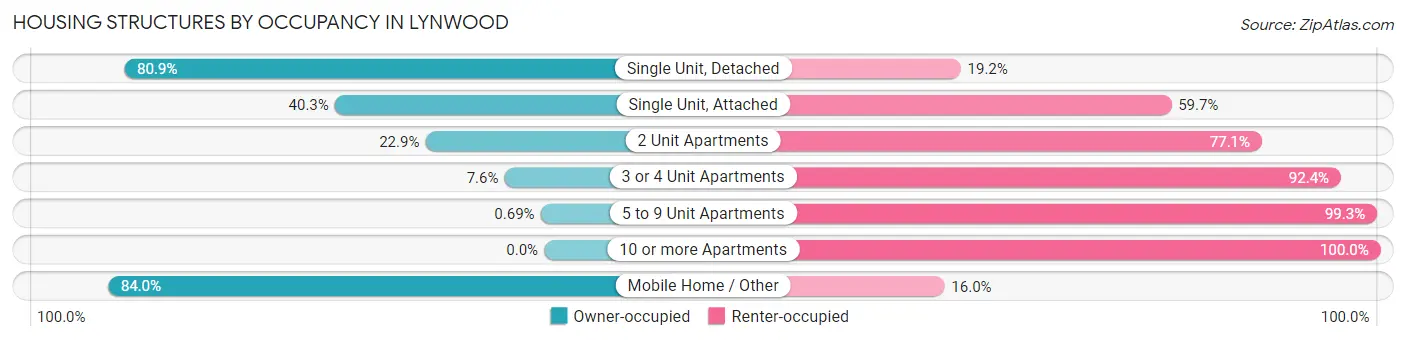
| Structure Type | Owner-occupied | Renter-occupied |
| Single Unit, Detached | 6,484 (80.8%) | 1,536 (19.2%) |
| Single Unit, Attached | 616 (40.3%) | 912 (59.7%) |
| 2 Unit Apartments | 206 (22.9%) | 695 (77.1%) |
| 3 or 4 Unit Apartments | 87 (7.6%) | 1,051 (92.4%) |
| 5 to 9 Unit Apartments | 11 (0.7%) | 1,587 (99.3%) |
| 10 or more Apartments | 0 (0.0%) | 1,898 (100.0%) |
| Mobile Home / Other | 131 (84.0%) | 25 (16.0%) |
| Total | 7,535 (49.4%) | 7,704 (50.5%) |
Housing Structures by Number of Rooms in Lynwood
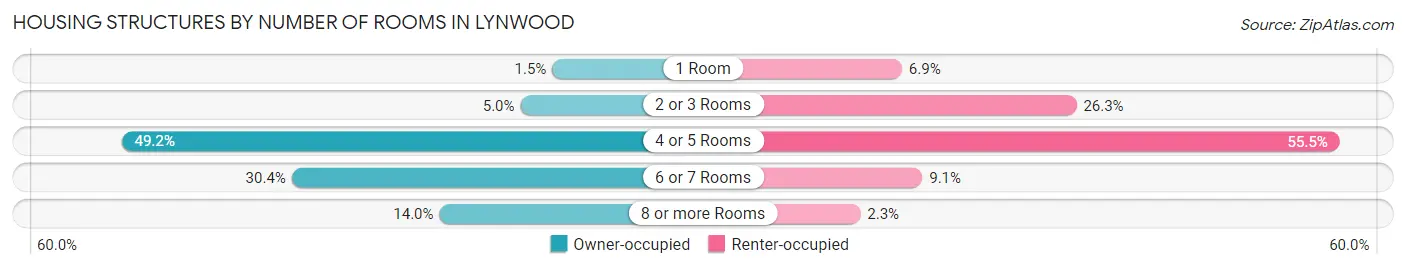
| Number of Rooms | Owner-occupied | Renter-occupied |
| 1 Room | 109 (1.5%) | 530 (6.9%) |
| 2 or 3 Rooms | 375 (5.0%) | 2,022 (26.3%) |
| 4 or 5 Rooms | 3,710 (49.2%) | 4,273 (55.5%) |
| 6 or 7 Rooms | 2,288 (30.4%) | 704 (9.1%) |
| 8 or more Rooms | 1,053 (14.0%) | 175 (2.3%) |
| Total | 7,535 (100.0%) | 7,704 (100.0%) |
Housing Structure by Heating Type in Lynwood
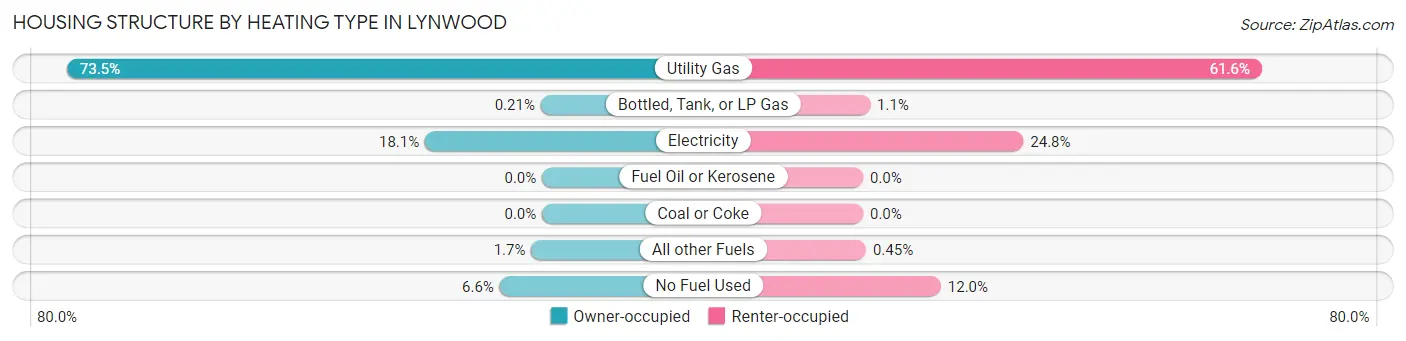
| Heating Type | Owner-occupied | Renter-occupied |
| Utility Gas | 5,535 (73.5%) | 4,749 (61.6%) |
| Bottled, Tank, or LP Gas | 16 (0.2%) | 84 (1.1%) |
| Electricity | 1,364 (18.1%) | 1,909 (24.8%) |
| Fuel Oil or Kerosene | 0 (0.0%) | 0 (0.0%) |
| Coal or Coke | 0 (0.0%) | 0 (0.0%) |
| All other Fuels | 126 (1.7%) | 35 (0.4%) |
| No Fuel Used | 494 (6.6%) | 927 (12.0%) |
| Total | 7,535 (100.0%) | 7,704 (100.0%) |
Household Vehicle Usage in Lynwood
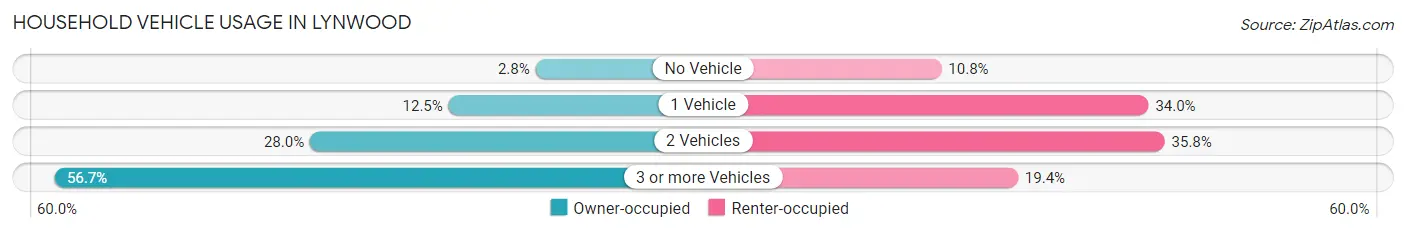
| Vehicles per Household | Owner-occupied | Renter-occupied |
| No Vehicle | 208 (2.8%) | 833 (10.8%) |
| 1 Vehicle | 942 (12.5%) | 2,619 (34.0%) |
| 2 Vehicles | 2,112 (28.0%) | 2,759 (35.8%) |
| 3 or more Vehicles | 4,273 (56.7%) | 1,493 (19.4%) |
| Total | 7,535 (100.0%) | 7,704 (100.0%) |
Real Estate & Mortgages in Lynwood
Real Estate and Mortgage Overview in Lynwood
| Characteristic | Without Mortgage | With Mortgage |
| Housing Units | 1,964 | 5,571 |
| Median Property Value | $491,600 | $552,300 |
| Median Household Income | $83,056 | $1,624 |
| Monthly Housing Costs | $620 | $1,175 |
| Real Estate Taxes | $3,399 | $151 |
Property Value by Mortgage Status in Lynwood
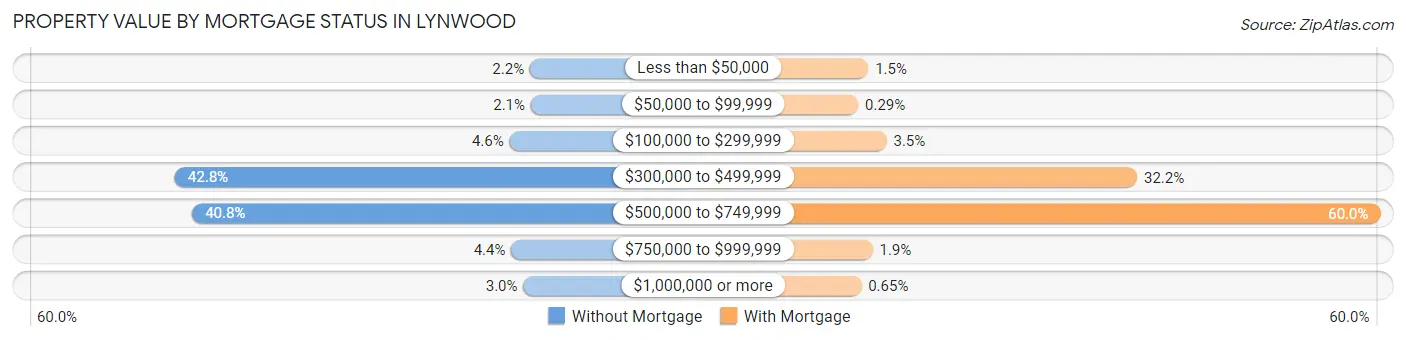
| Property Value | Without Mortgage | With Mortgage |
| Less than $50,000 | 44 (2.2%) | 81 (1.5%) |
| $50,000 to $99,999 | 42 (2.1%) | 16 (0.3%) |
| $100,000 to $299,999 | 90 (4.6%) | 197 (3.5%) |
| $300,000 to $499,999 | 841 (42.8%) | 1,792 (32.2%) |
| $500,000 to $749,999 | 802 (40.8%) | 3,341 (60.0%) |
| $750,000 to $999,999 | 86 (4.4%) | 108 (1.9%) |
| $1,000,000 or more | 59 (3.0%) | 36 (0.6%) |
| Total | 1,964 (100.0%) | 5,571 (100.0%) |
Household Income by Mortgage Status in Lynwood
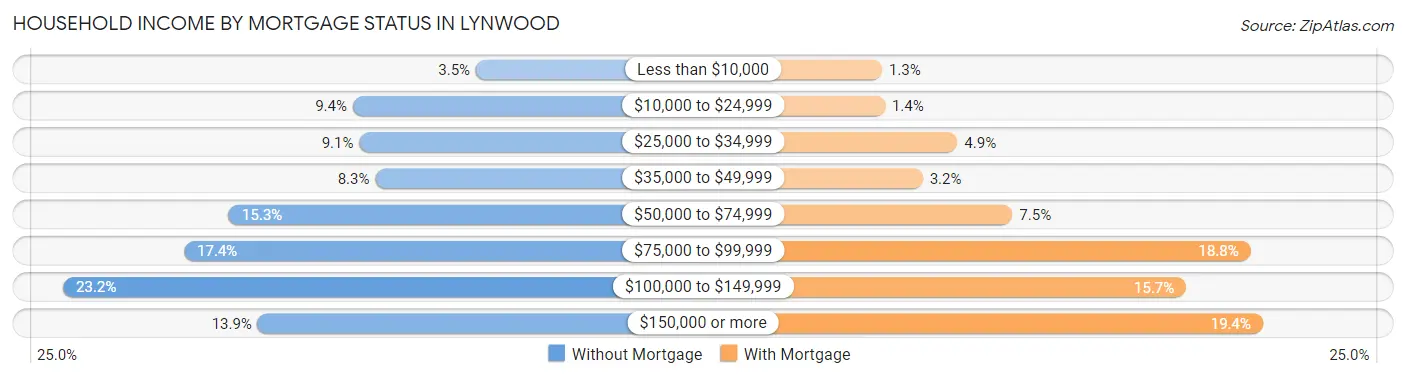
| Household Income | Without Mortgage | With Mortgage |
| Less than $10,000 | 69 (3.5%) | 70 (1.3%) |
| $10,000 to $24,999 | 184 (9.4%) | 78 (1.4%) |
| $25,000 to $34,999 | 178 (9.1%) | 270 (4.9%) |
| $35,000 to $49,999 | 163 (8.3%) | 178 (3.2%) |
| $50,000 to $74,999 | 300 (15.3%) | 416 (7.5%) |
| $75,000 to $99,999 | 342 (17.4%) | 1,048 (18.8%) |
| $100,000 to $149,999 | 455 (23.2%) | 877 (15.7%) |
| $150,000 or more | 273 (13.9%) | 1,080 (19.4%) |
| Total | 1,964 (100.0%) | 5,571 (100.0%) |
Property Value to Household Income Ratio in Lynwood
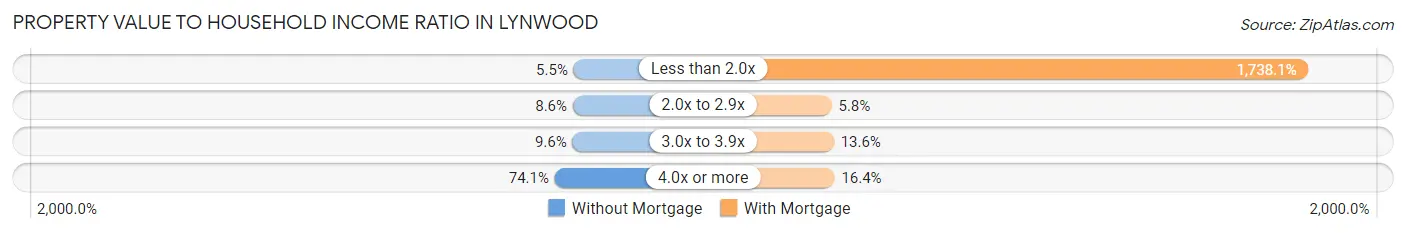
| Value-to-Income Ratio | Without Mortgage | With Mortgage |
| Less than 2.0x | 107 (5.4%) | 96,831 (1,738.1%) |
| 2.0x to 2.9x | 168 (8.6%) | 325 (5.8%) |
| 3.0x to 3.9x | 189 (9.6%) | 760 (13.6%) |
| 4.0x or more | 1,455 (74.1%) | 916 (16.4%) |
| Total | 1,964 (100.0%) | 5,571 (100.0%) |
Real Estate Taxes by Mortgage Status in Lynwood
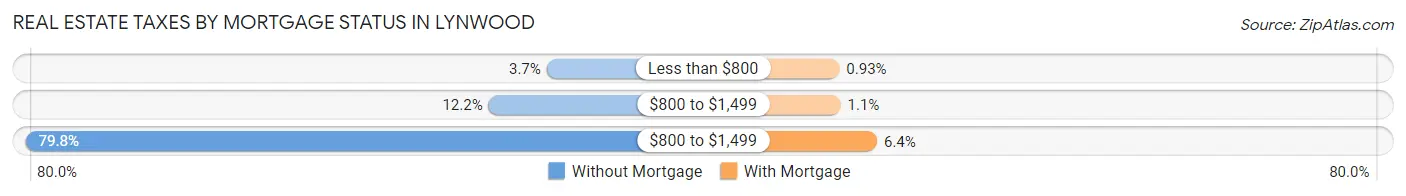
| Property Taxes | Without Mortgage | With Mortgage |
| Less than $800 | 73 (3.7%) | 52 (0.9%) |
| $800 to $1,499 | 240 (12.2%) | 62 (1.1%) |
| $800 to $1,499 | 1,568 (79.8%) | 358 (6.4%) |
| Total | 1,964 (100.0%) | 5,571 (100.0%) |
Health & Disability in Lynwood
Health Insurance Coverage by Age in Lynwood
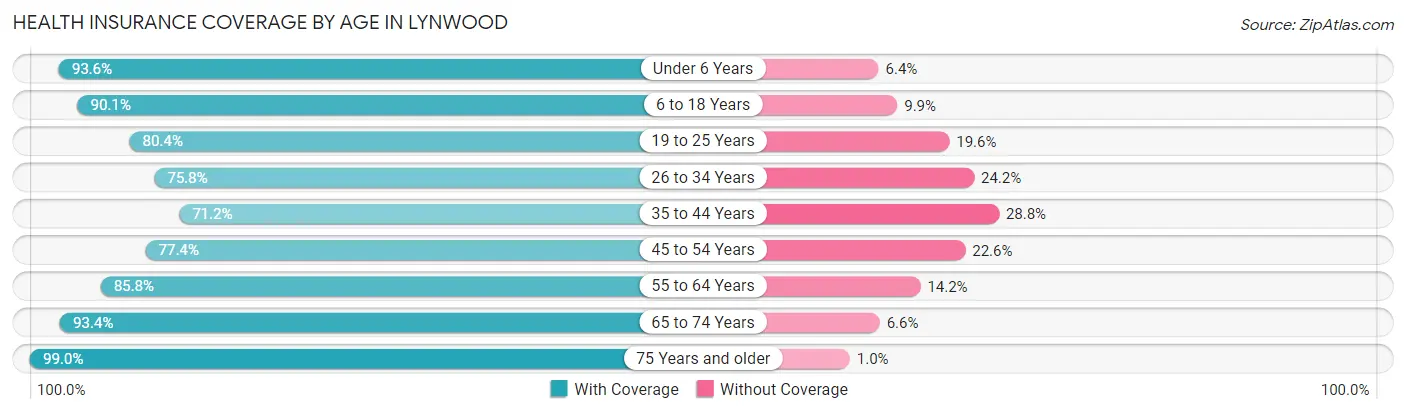
| Age Bracket | With Coverage | Without Coverage |
| Under 6 Years | 5,086 (93.6%) | 347 (6.4%) |
| 6 to 18 Years | 11,585 (90.1%) | 1,270 (9.9%) |
| 19 to 25 Years | 5,790 (80.4%) | 1,410 (19.6%) |
| 26 to 34 Years | 7,132 (75.8%) | 2,276 (24.2%) |
| 35 to 44 Years | 6,449 (71.2%) | 2,614 (28.8%) |
| 45 to 54 Years | 5,823 (77.4%) | 1,697 (22.6%) |
| 55 to 64 Years | 6,377 (85.8%) | 1,055 (14.2%) |
| 65 to 74 Years | 3,290 (93.4%) | 233 (6.6%) |
| 75 Years and older | 1,831 (99.0%) | 19 (1.0%) |
| Total | 53,363 (83.0%) | 10,921 (17.0%) |
Health Insurance Coverage by Citizenship Status in Lynwood
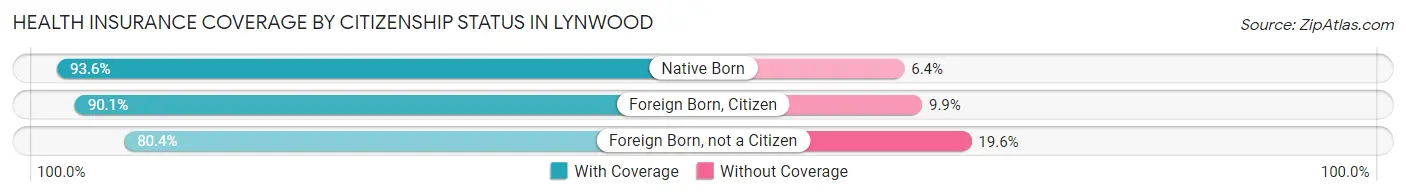
| Citizenship Status | With Coverage | Without Coverage |
| Native Born | 5,086 (93.6%) | 347 (6.4%) |
| Foreign Born, Citizen | 11,585 (90.1%) | 1,270 (9.9%) |
| Foreign Born, not a Citizen | 5,790 (80.4%) | 1,410 (19.6%) |
Health Insurance Coverage by Household Income in Lynwood
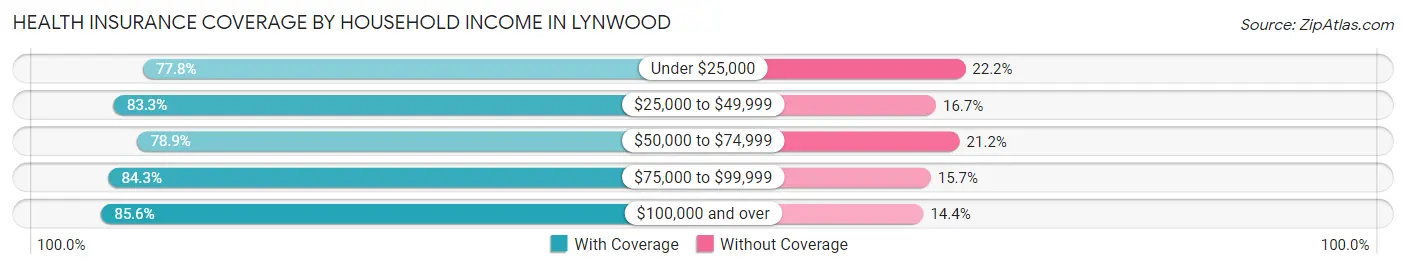
| Household Income | With Coverage | Without Coverage |
| Under $25,000 | 4,705 (77.8%) | 1,343 (22.2%) |
| $25,000 to $49,999 | 9,223 (83.3%) | 1,853 (16.7%) |
| $50,000 to $74,999 | 10,094 (78.8%) | 2,708 (21.1%) |
| $75,000 to $99,999 | 7,837 (84.3%) | 1,464 (15.7%) |
| $100,000 and over | 20,843 (85.6%) | 3,498 (14.4%) |
Public vs Private Health Insurance Coverage by Age in Lynwood
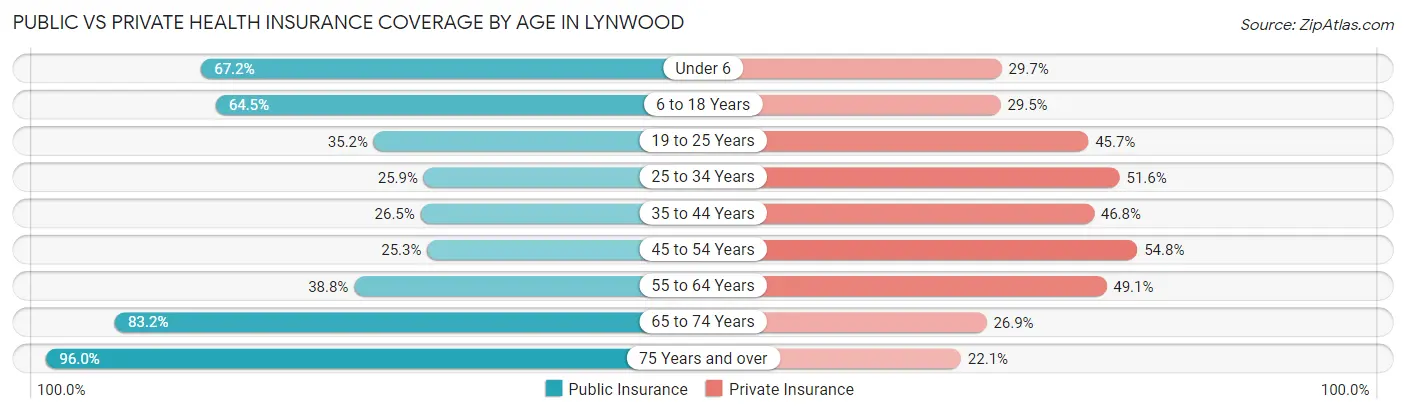
| Age Bracket | Public Insurance | Private Insurance |
| Under 6 | 3,651 (67.2%) | 1,611 (29.6%) |
| 6 to 18 Years | 8,292 (64.5%) | 3,786 (29.4%) |
| 19 to 25 Years | 2,532 (35.2%) | 3,293 (45.7%) |
| 25 to 34 Years | 2,437 (25.9%) | 4,850 (51.5%) |
| 35 to 44 Years | 2,402 (26.5%) | 4,240 (46.8%) |
| 45 to 54 Years | 1,899 (25.3%) | 4,124 (54.8%) |
| 55 to 64 Years | 2,885 (38.8%) | 3,648 (49.1%) |
| 65 to 74 Years | 2,932 (83.2%) | 946 (26.9%) |
| 75 Years and over | 1,775 (96.0%) | 409 (22.1%) |
| Total | 28,805 (44.8%) | 26,907 (41.9%) |
Disability Status by Sex by Age in Lynwood
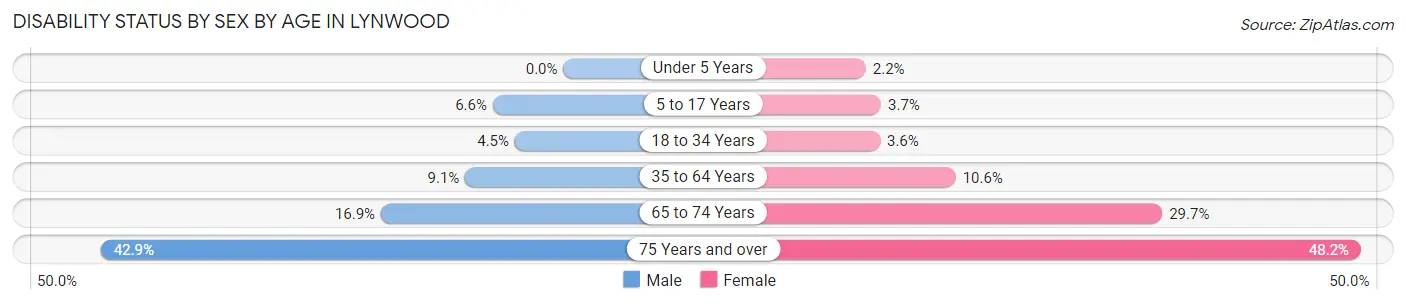
| Age Bracket | Male | Female |
| Under 5 Years | 0 (0.0%) | 49 (2.2%) |
| 5 to 17 Years | 445 (6.6%) | 211 (3.6%) |
| 18 to 34 Years | 407 (4.5%) | 305 (3.5%) |
| 35 to 64 Years | 1,115 (9.1%) | 1,244 (10.6%) |
| 65 to 74 Years | 260 (16.9%) | 591 (29.7%) |
| 75 Years and over | 404 (42.9%) | 438 (48.2%) |
Disability Class by Sex by Age in Lynwood
Disability Class: Hearing Difficulty
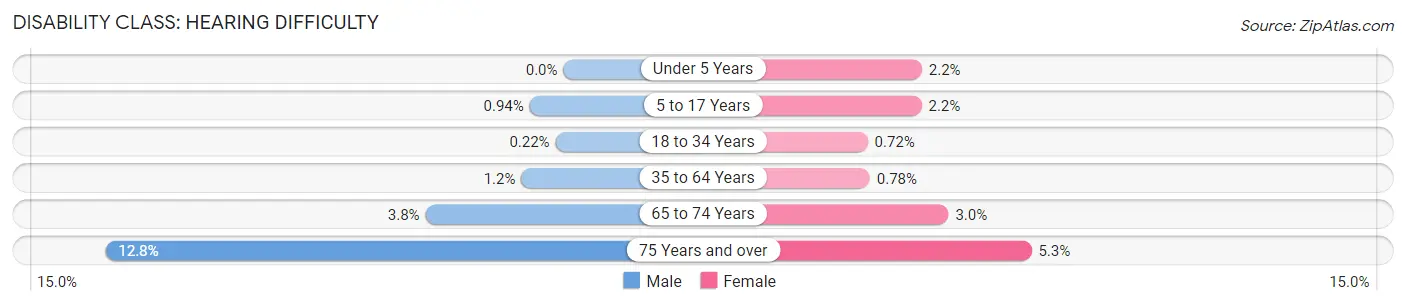
| Age Bracket | Male | Female |
| Under 5 Years | 0 (0.0%) | 49 (2.2%) |
| 5 to 17 Years | 64 (0.9%) | 128 (2.2%) |
| 18 to 34 Years | 20 (0.2%) | 62 (0.7%) |
| 35 to 64 Years | 143 (1.2%) | 92 (0.8%) |
| 65 to 74 Years | 59 (3.8%) | 59 (3.0%) |
| 75 Years and over | 120 (12.8%) | 48 (5.3%) |
Disability Class: Vision Difficulty
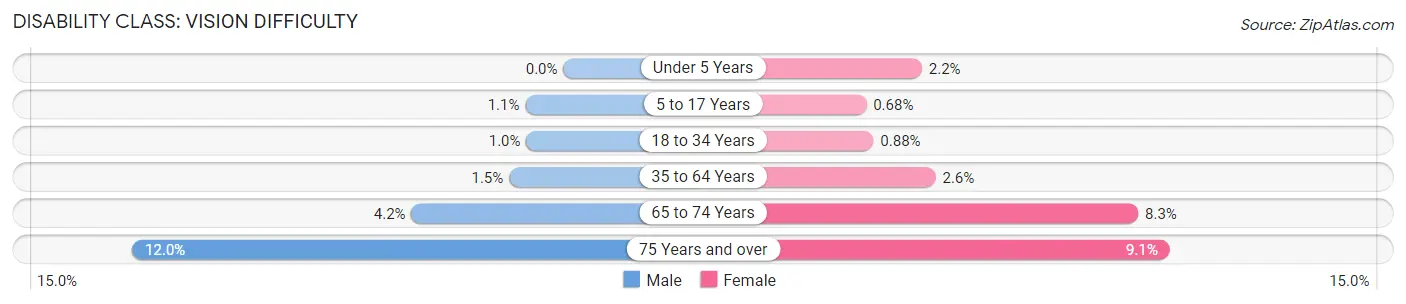
| Age Bracket | Male | Female |
| Under 5 Years | 0 (0.0%) | 49 (2.2%) |
| 5 to 17 Years | 72 (1.1%) | 39 (0.7%) |
| 18 to 34 Years | 93 (1.0%) | 76 (0.9%) |
| 35 to 64 Years | 185 (1.5%) | 307 (2.6%) |
| 65 to 74 Years | 65 (4.2%) | 164 (8.3%) |
| 75 Years and over | 113 (12.0%) | 83 (9.1%) |
Disability Class: Cognitive Difficulty
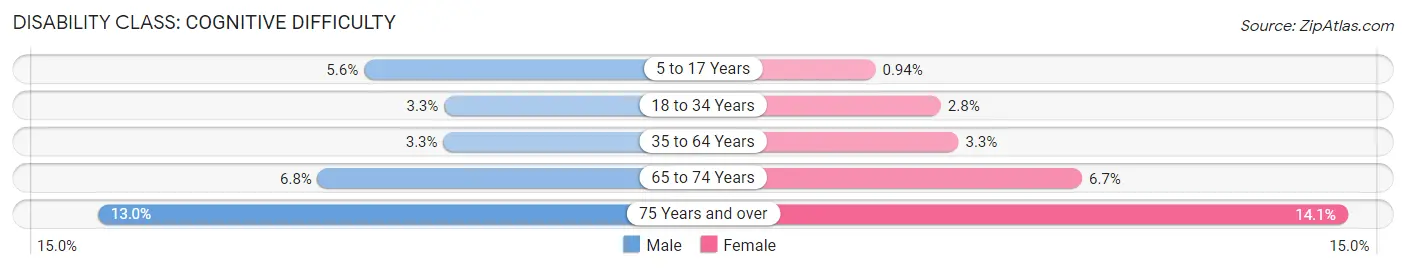
| Age Bracket | Male | Female |
| 5 to 17 Years | 377 (5.6%) | 54 (0.9%) |
| 18 to 34 Years | 300 (3.3%) | 237 (2.8%) |
| 35 to 64 Years | 409 (3.3%) | 383 (3.3%) |
| 65 to 74 Years | 105 (6.8%) | 133 (6.7%) |
| 75 Years and over | 122 (13.0%) | 128 (14.1%) |
Disability Class: Ambulatory Difficulty
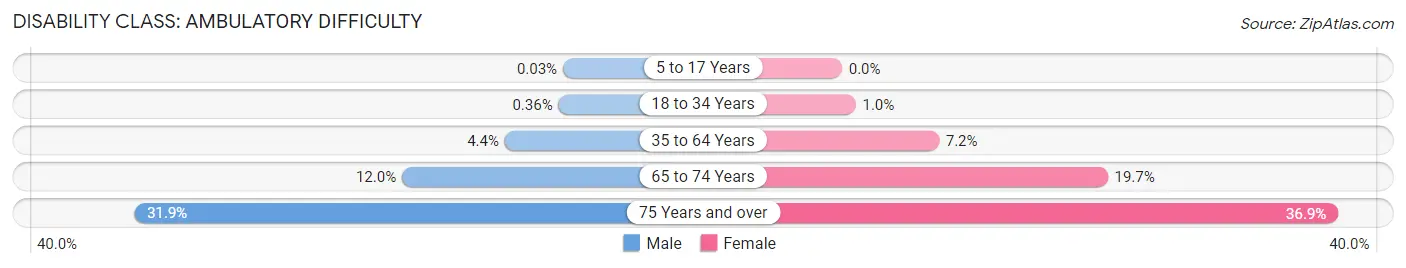
| Age Bracket | Male | Female |
| 5 to 17 Years | 2 (0.0%) | 0 (0.0%) |
| 18 to 34 Years | 33 (0.4%) | 88 (1.0%) |
| 35 to 64 Years | 533 (4.3%) | 848 (7.2%) |
| 65 to 74 Years | 184 (12.0%) | 392 (19.7%) |
| 75 Years and over | 300 (31.9%) | 335 (36.8%) |
Disability Class: Self-Care Difficulty
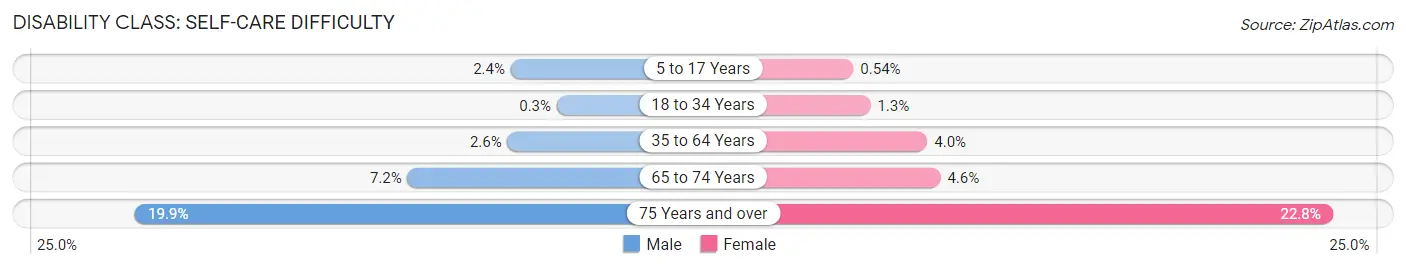
| Age Bracket | Male | Female |
| 5 to 17 Years | 166 (2.4%) | 31 (0.5%) |
| 18 to 34 Years | 27 (0.3%) | 114 (1.3%) |
| 35 to 64 Years | 317 (2.6%) | 467 (4.0%) |
| 65 to 74 Years | 111 (7.2%) | 91 (4.6%) |
| 75 Years and over | 187 (19.9%) | 207 (22.8%) |
Technology Access in Lynwood
Computing Device Access in Lynwood
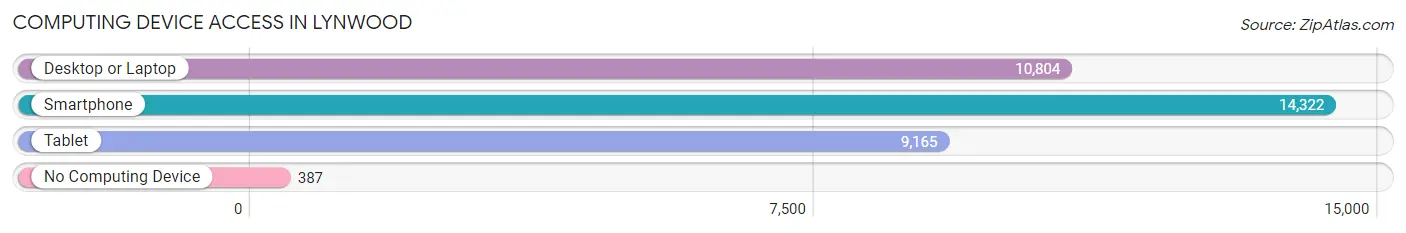
| Device Type | # Households | % Households |
| Desktop or Laptop | 10,804 | 70.9% |
| Smartphone | 14,322 | 94.0% |
| Tablet | 9,165 | 60.1% |
| No Computing Device | 387 | 2.5% |
| Total | 15,239 | 100.0% |
Internet Access in Lynwood
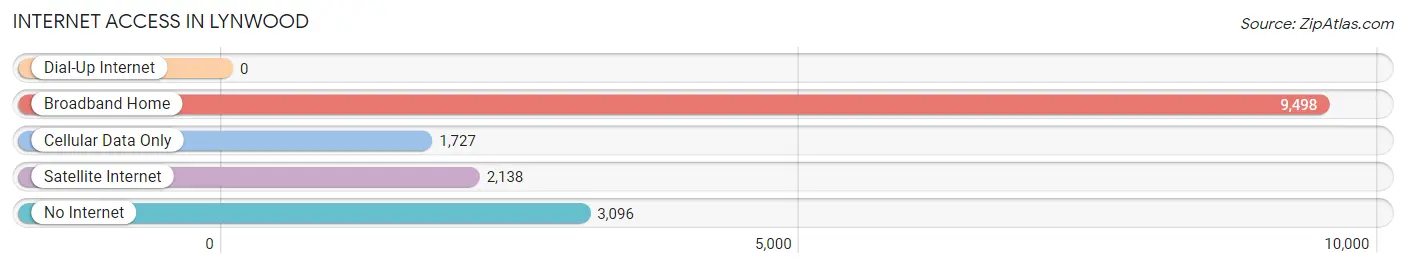
| Internet Type | # Households | % Households |
| Dial-Up Internet | 0 | 0.0% |
| Broadband Home | 9,498 | 62.3% |
| Cellular Data Only | 1,727 | 11.3% |
| Satellite Internet | 2,138 | 14.0% |
| No Internet | 3,096 | 20.3% |
| Total | 15,239 | 100.0% |
Lynwood Summary
Lynwood is a city located in Los Angeles County, California, United States. The city is located in the Gateway Cities region of southeastern Los Angeles County, near Long Beach and Compton. As of the 2010 census, the city had a total population of 69,772, making it the 58th most populous city in California.
History
The area that is now Lynwood was originally inhabited by the Tongva people, who were later displaced by Spanish settlers in the late 1700s. The area was part of the Rancho San Antonio, a large Spanish land grant given to Manuel Nieto in 1784. In the late 1800s, the area was subdivided and sold off to settlers, and the city of Lynwood was officially incorporated in 1921.
Geography
Lynwood is located at 33°53′N 118°11′W (33.88, -118.18). According to the United States Census Bureau, the city has a total area of 5.2 square miles (13.4 km2), all of it land.
Economy
The economy of Lynwood is largely based on retail and services. The city is home to several large shopping centers, including the Lynwood Plaza Shopping Center, the Plaza Mexico Shopping Center, and the Lynwood Marketplace. The city is also home to several industrial parks, including the Lynwood Business Park and the Lynwood Industrial Park.
Demographics
As of the 2010 census, there were 69,772 people, 19,945 households, and 15,845 families residing in the city. The population density was 13,400 people per square mile (5,200/km2). There were 21,845 housing units at an average density of 4,200 per square mile (1,600/km2). The racial makeup of the city was 57.2% Hispanic or Latino, 28.2% African American, 0.7% White, 0.5% Native American, 0.7% Asian, 0.1% Pacific Islander, 10.2% from other races, and 2.7% from two or more races.
The median income for a household in the city was $37,845, and the median income for a family was $41,945. Males had a median income of $30,945 versus $27,845 for females. The per capita income for the city was $14,845. About 16.2% of families and 19.2% of the population were below the poverty line, including 25.2% of those under age 18 and 11.2% of those age 65 or over.
Common Questions
What is Per Capita Income in Lynwood?
Per Capita income in Lynwood is $20,275.
What is the Median Family Income in Lynwood?
Median Family Income in Lynwood is $66,030.
What is the Median Household income in Lynwood?
Median Household Income in Lynwood is $67,350.
What is Income or Wage Gap in Lynwood?
Income or Wage Gap in Lynwood is 18.4%.
Women in Lynwood earn 81.6 cents for every dollar earned by a man.
What is Family Income Deficit in Lynwood?
Family Income Deficit in Lynwood is $12,518.
Families that are below poverty line in Lynwood earn $12,518 less on average than the poverty threshold level.
What is Inequality or Gini Index in Lynwood?
Inequality or Gini Index in Lynwood is 0.40.
What is the Total Population of Lynwood?
Total Population of Lynwood is 66,346.
What is the Total Male Population of Lynwood?
Total Male Population of Lynwood is 33,283.
What is the Total Female Population of Lynwood?
Total Female Population of Lynwood is 33,063.
What is the Ratio of Males per 100 Females in Lynwood?
There are 100.67 Males per 100 Females in Lynwood.
What is the Ratio of Females per 100 Males in Lynwood?
There are 99.34 Females per 100 Males in Lynwood.
What is the Median Population Age in Lynwood?
Median Population Age in Lynwood is 32.3 Years.
What is the Average Family Size in Lynwood
Average Family Size in Lynwood is 4.4 People.
What is the Average Household Size in Lynwood
Average Household Size in Lynwood is 4.2 People.
How Large is the Labor Force in Lynwood?
There are 31,070 People in the Labor Forcein in Lynwood.
What is the Percentage of People in the Labor Force in Lynwood?
61.4% of People are in the Labor Force in Lynwood.
What is the Unemployment Rate in Lynwood?
Unemployment Rate in Lynwood is 9.6%.