San Ardo, CA Map & Demographics
San Ardo Map
San Ardo Overview
$20,745
PER CAPITA INCOME
$83,068
AVG FAMILY INCOME
$70,417
AVG HOUSEHOLD INCOME
60.6%
WAGE / INCOME GAP [ % ]
39.4¢/ $1
WAGE / INCOME GAP [ $ ]
0.27
INEQUALITY / GINI INDEX
624
TOTAL POPULATION
353
MALE POPULATION
271
FEMALE POPULATION
130.26
MALES / 100 FEMALES
76.77
FEMALES / 100 MALES
30.5
MEDIAN AGE
3.8
AVG FAMILY SIZE
3.8
AVG HOUSEHOLD SIZE
326
LABOR FORCE [ PEOPLE ]
72.4%
PERCENT IN LABOR FORCE
17.2%
UNEMPLOYMENT RATE
San Ardo Zip Codes
Income in San Ardo
Income Overview in San Ardo
Per Capita Income in San Ardo is $20,745, while median incomes of families and households are $83,068 and $70,417 respectively.
| Characteristic | Number | Measure |
| Per Capita Income | 624 | $20,745 |
| Median Family Income | 151 | $83,068 |
| Mean Family Income | 151 | $78,428 |
| Median Household Income | 166 | $70,417 |
| Mean Household Income | 166 | $78,281 |
| Income Deficit | 151 | $0 |
| Wage / Income Gap (%) | 624 | 60.60% |
| Wage / Income Gap ($) | 624 | 39.40¢ per $1 |
| Gini / Inequality Index | 624 | 0.27 |
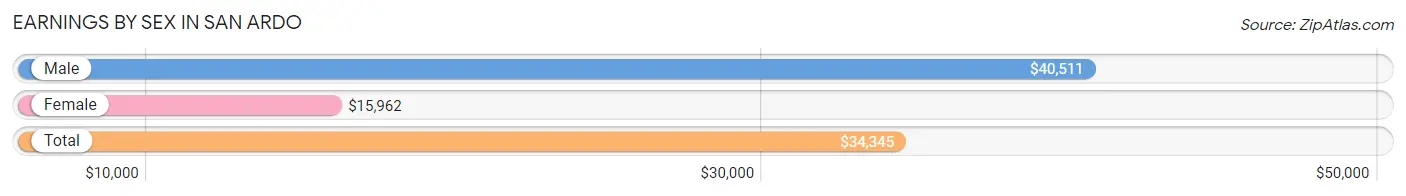
Earnings by Sex in San Ardo
Average Earnings in San Ardo are $34,345, $40,511 for men and $15,962 for women, a difference of 60.6%.
| Sex | Number | Average Earnings |
| Male | 230 (68.0%) | $40,511 |
| Female | 108 (32.0%) | $15,962 |
| Total | 338 (100.0%) | $34,345 |
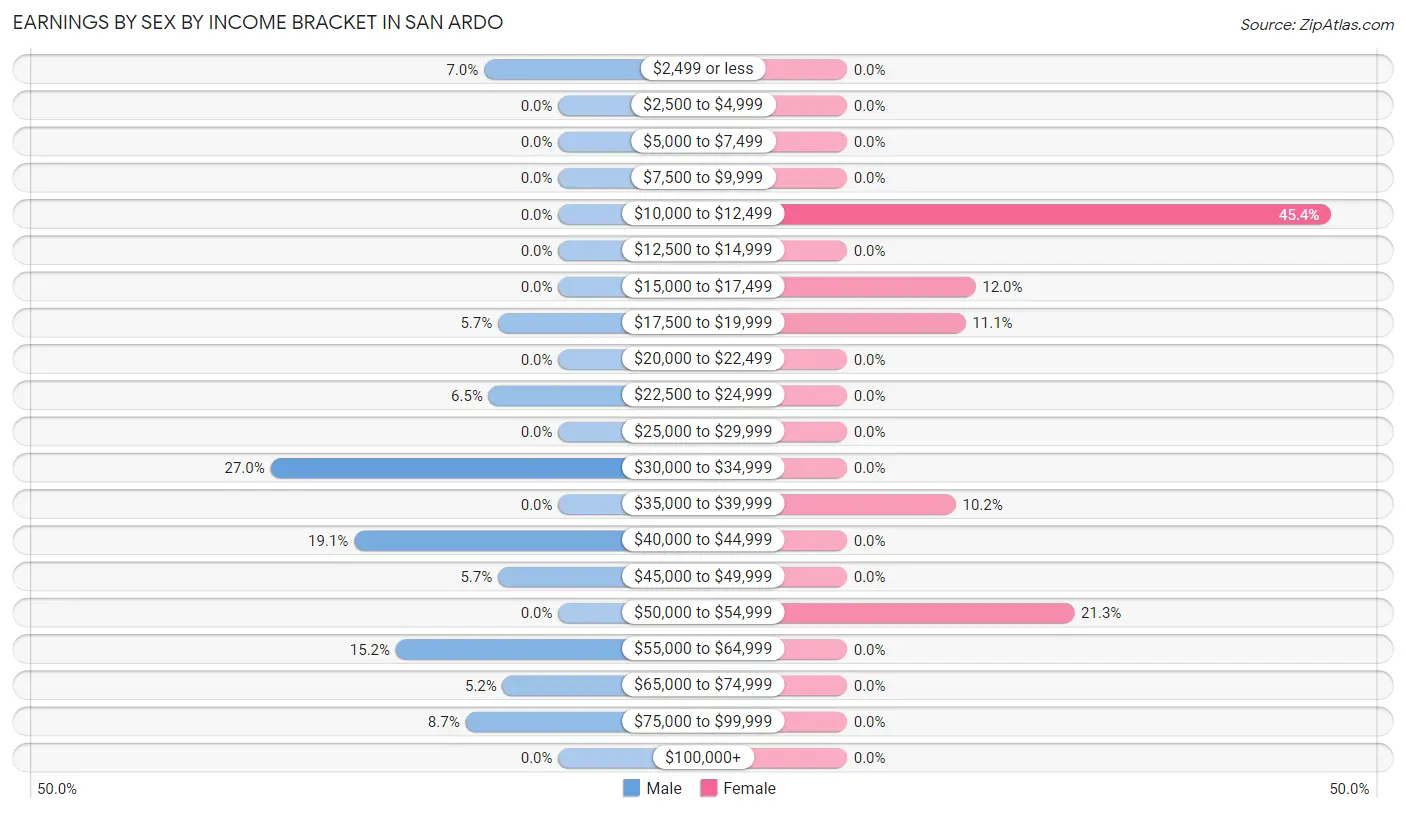
Earnings by Sex by Income Bracket in San Ardo
The most common earnings brackets in San Ardo are $30,000 to $34,999 for men (62 | 27.0%) and $10,000 to $12,499 for women (49 | 45.4%).
| Income | Male | Female |
| $2,499 or less | 16 (7.0%) | 0 (0.0%) |
| $2,500 to $4,999 | 0 (0.0%) | 0 (0.0%) |
| $5,000 to $7,499 | 0 (0.0%) | 0 (0.0%) |
| $7,500 to $9,999 | 0 (0.0%) | 0 (0.0%) |
| $10,000 to $12,499 | 0 (0.0%) | 49 (45.4%) |
| $12,500 to $14,999 | 0 (0.0%) | 0 (0.0%) |
| $15,000 to $17,499 | 0 (0.0%) | 13 (12.0%) |
| $17,500 to $19,999 | 13 (5.7%) | 12 (11.1%) |
| $20,000 to $22,499 | 0 (0.0%) | 0 (0.0%) |
| $22,500 to $24,999 | 15 (6.5%) | 0 (0.0%) |
| $25,000 to $29,999 | 0 (0.0%) | 0 (0.0%) |
| $30,000 to $34,999 | 62 (27.0%) | 0 (0.0%) |
| $35,000 to $39,999 | 0 (0.0%) | 11 (10.2%) |
| $40,000 to $44,999 | 44 (19.1%) | 0 (0.0%) |
| $45,000 to $49,999 | 13 (5.7%) | 0 (0.0%) |
| $50,000 to $54,999 | 0 (0.0%) | 23 (21.3%) |
| $55,000 to $64,999 | 35 (15.2%) | 0 (0.0%) |
| $65,000 to $74,999 | 12 (5.2%) | 0 (0.0%) |
| $75,000 to $99,999 | 20 (8.7%) | 0 (0.0%) |
| $100,000+ | 0 (0.0%) | 0 (0.0%) |
| Total | 230 (100.0%) | 108 (100.0%) |
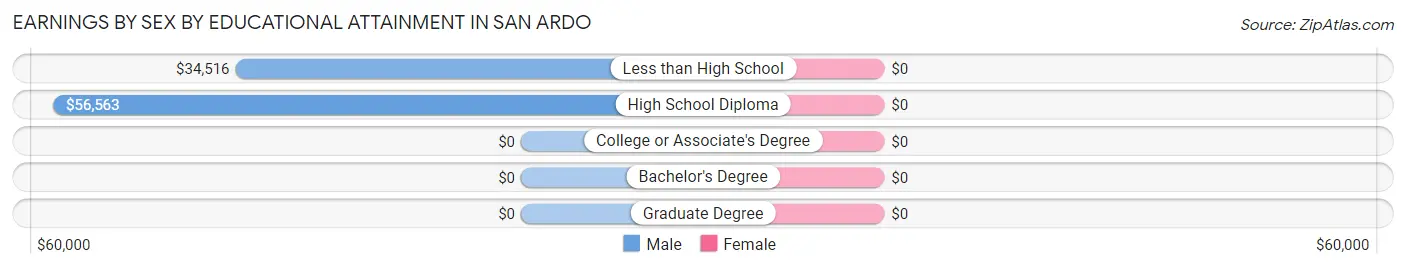
Earnings by Sex by Educational Attainment in San Ardo
| Educational Attainment | Male Income | Female Income |
| Less than High School | $34,516 | $0 |
| High School Diploma | $56,563 | $0 |
| College or Associate's Degree | - | - |
| Bachelor's Degree | - | - |
| Graduate Degree | - | - |
| Total | $40,909 | $0 |
Family Income in San Ardo
Family Income Brackets in San Ardo
According to the San Ardo family income data, there are 67 families falling into the $100,000 to $149,999 income range, which is the most common income bracket and makes up 44.4% of all families.
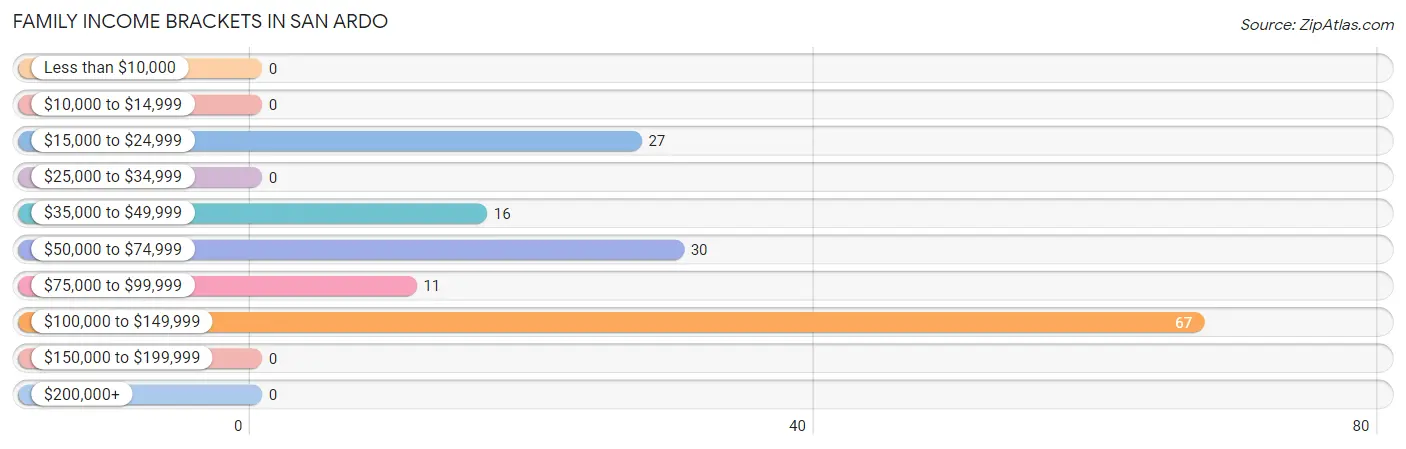
| Income Bracket | # Families | % Families |
| Less than $10,000 | 0 | 0.0% |
| $10,000 to $14,999 | 0 | 0.0% |
| $15,000 to $24,999 | 27 | 17.9% |
| $25,000 to $34,999 | 0 | 0.0% |
| $35,000 to $49,999 | 16 | 10.6% |
| $50,000 to $74,999 | 30 | 19.9% |
| $75,000 to $99,999 | 11 | 7.3% |
| $100,000 to $149,999 | 67 | 44.4% |
| $150,000 to $199,999 | 0 | 0.0% |
| $200,000+ | 0 | 0.0% |
Family Income by Famaliy Size in San Ardo
4-person families (57 | 37.8%) account for the highest median family income in San Ardo with $103,607 per family, while 2-person families (38 | 25.2%) have the highest median income of $31,591 per family member.
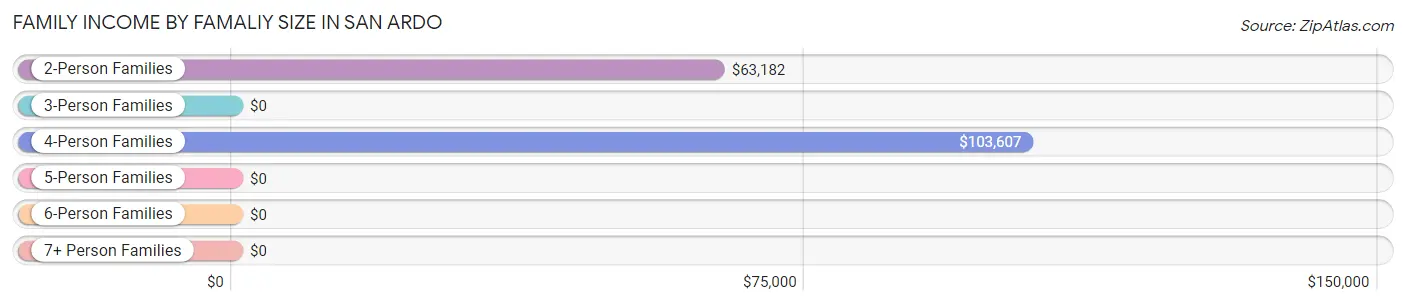
| Income Bracket | # Families | Median Income |
| 2-Person Families | 38 (25.2%) | $63,182 |
| 3-Person Families | 26 (17.2%) | $0 |
| 4-Person Families | 57 (37.8%) | $103,607 |
| 5-Person Families | 24 (15.9%) | $0 |
| 6-Person Families | 6 (4.0%) | $0 |
| 7+ Person Families | 0 (0.0%) | $0 |
| Total | 151 (100.0%) | $83,068 |
Family Income by Number of Earners in San Ardo
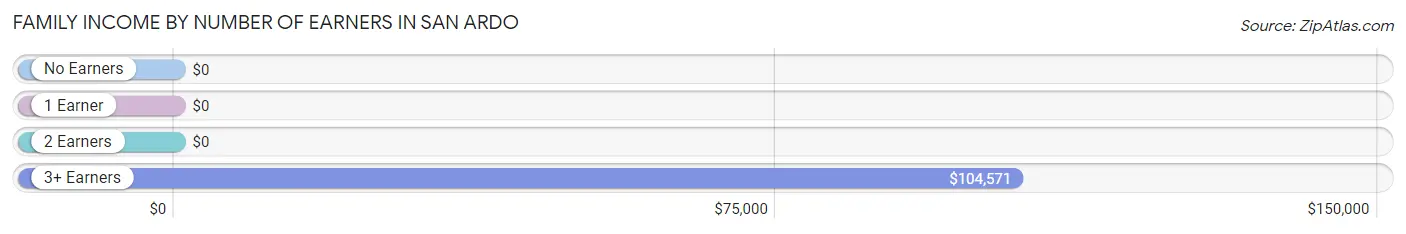
| Number of Earners | # Families | Median Income |
| No Earners | 0 (0.0%) | $0 |
| 1 Earner | 71 (47.0%) | $0 |
| 2 Earners | 22 (14.6%) | $0 |
| 3+ Earners | 58 (38.4%) | $104,571 |
| Total | 151 (100.0%) | $83,068 |
Household Income in San Ardo
Household Income Brackets in San Ardo
With 67 households falling in the category, the $100,000 to $149,999 income range is the most frequent in San Ardo, accounting for 40.4% of all households.
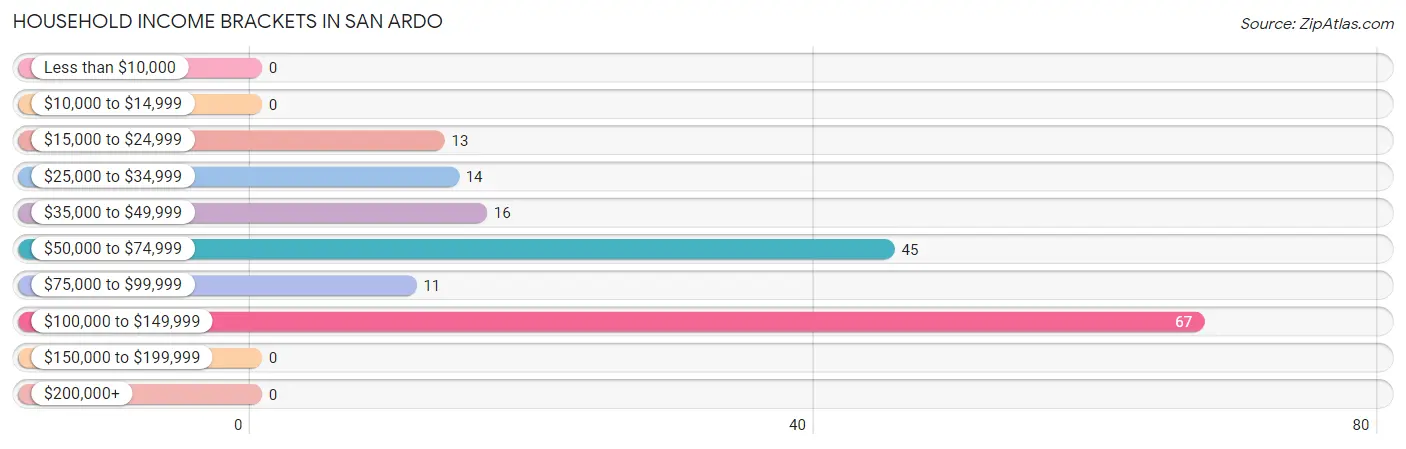
| Income Bracket | # Households | % Households |
| Less than $10,000 | 0 | 0.0% |
| $10,000 to $14,999 | 0 | 0.0% |
| $15,000 to $24,999 | 13 | 7.8% |
| $25,000 to $34,999 | 14 | 8.4% |
| $35,000 to $49,999 | 16 | 9.6% |
| $50,000 to $74,999 | 45 | 27.1% |
| $75,000 to $99,999 | 11 | 6.6% |
| $100,000 to $149,999 | 67 | 40.4% |
| $150,000 to $199,999 | 0 | 0.0% |
| $200,000+ | 0 | 0.0% |
Household Income by Householder Age in San Ardo
The median household income in San Ardo is $70,417, with the highest median household income of $83,977 found in the 45 to 64 years age bracket for the primary householder. A total of 97 households (58.4%) fall into this category. Meanwhile, the 15 to 24 years age bracket for the primary householder has the lowest median household income of $0, with 25 households (15.1%) in this group.
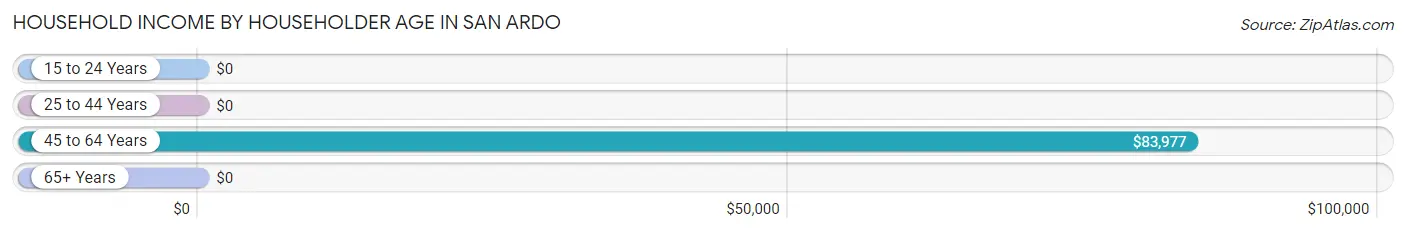
| Income Bracket | # Households | Median Income |
| 15 to 24 Years | 25 (15.1%) | $0 |
| 25 to 44 Years | 38 (22.9%) | $0 |
| 45 to 64 Years | 97 (58.4%) | $83,977 |
| 65+ Years | 6 (3.6%) | $0 |
| Total | 166 (100.0%) | $70,417 |
Poverty in San Ardo
Income Below Poverty by Sex and Age in San Ardo
With 15.6% poverty level for males and 25.8% for females among the residents of San Ardo, 16 and 17 year old males and 6 to 11 year old females are the most vulnerable to poverty, with 13 males (100.0%) and 29 females (100.0%) in their respective age groups living below the poverty level.
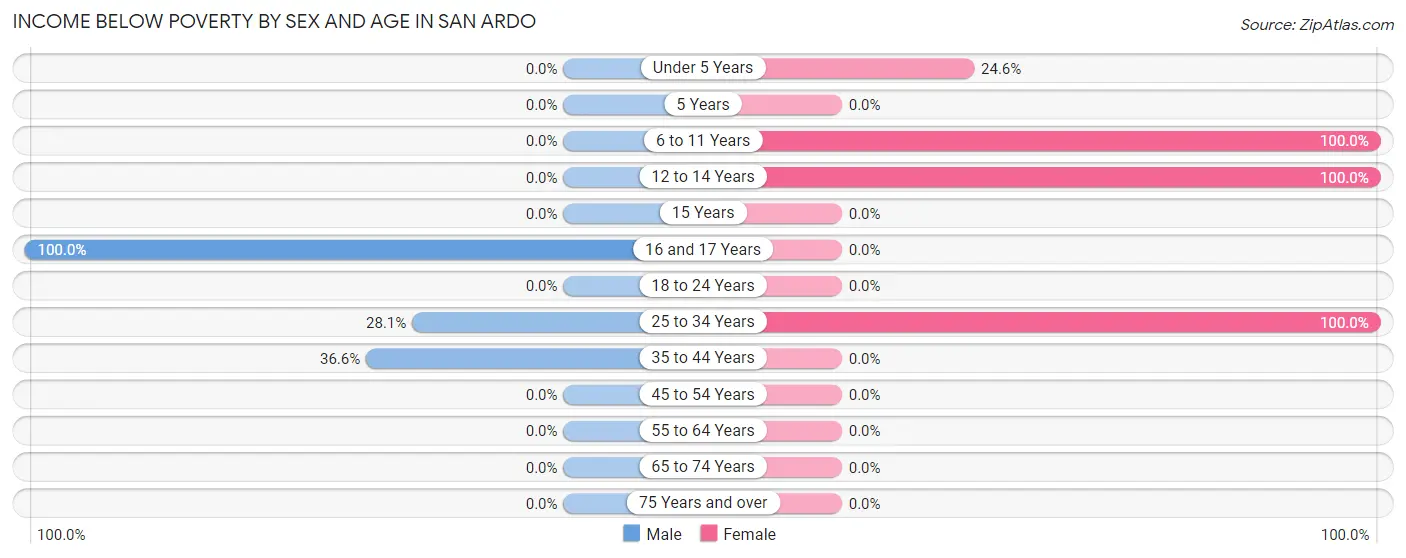
| Age Bracket | Male | Female |
| Under 5 Years | 0 (0.0%) | 14 (24.6%) |
| 5 Years | 0 (0.0%) | 0 (0.0%) |
| 6 to 11 Years | 0 (0.0%) | 29 (100.0%) |
| 12 to 14 Years | 0 (0.0%) | 13 (100.0%) |
| 15 Years | 0 (0.0%) | 0 (0.0%) |
| 16 and 17 Years | 13 (100.0%) | 0 (0.0%) |
| 18 to 24 Years | 0 (0.0%) | 0 (0.0%) |
| 25 to 34 Years | 16 (28.1%) | 14 (100.0%) |
| 35 to 44 Years | 26 (36.6%) | 0 (0.0%) |
| 45 to 54 Years | 0 (0.0%) | 0 (0.0%) |
| 55 to 64 Years | 0 (0.0%) | 0 (0.0%) |
| 65 to 74 Years | 0 (0.0%) | 0 (0.0%) |
| 75 Years and over | 0 (0.0%) | 0 (0.0%) |
| Total | 55 (15.6%) | 70 (25.8%) |
Income Above Poverty by Sex and Age in San Ardo
According to the poverty statistics in San Ardo, males aged under 5 years and females aged 16 and 17 years are the age groups that are most secure financially, with 100.0% of males and 100.0% of females in these age groups living above the poverty line.
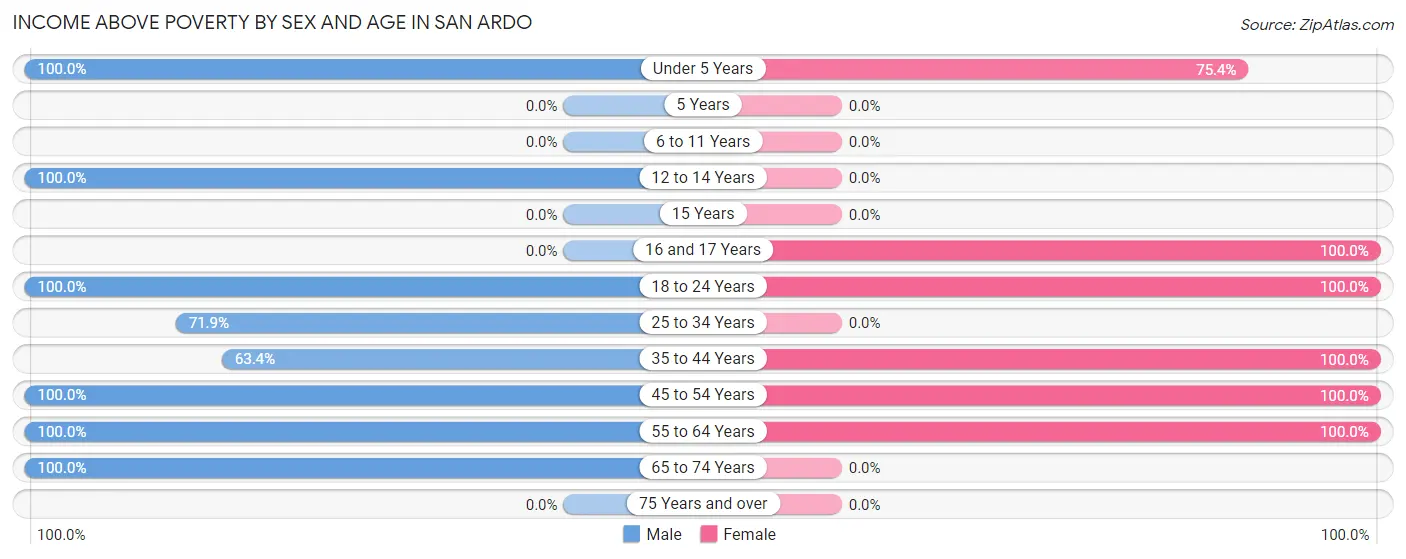
| Age Bracket | Male | Female |
| Under 5 Years | 36 (100.0%) | 43 (75.4%) |
| 5 Years | 0 (0.0%) | 0 (0.0%) |
| 6 to 11 Years | 0 (0.0%) | 0 (0.0%) |
| 12 to 14 Years | 39 (100.0%) | 0 (0.0%) |
| 15 Years | 0 (0.0%) | 0 (0.0%) |
| 16 and 17 Years | 0 (0.0%) | 22 (100.0%) |
| 18 to 24 Years | 38 (100.0%) | 23 (100.0%) |
| 25 to 34 Years | 41 (71.9%) | 0 (0.0%) |
| 35 to 44 Years | 45 (63.4%) | 46 (100.0%) |
| 45 to 54 Years | 47 (100.0%) | 9 (100.0%) |
| 55 to 64 Years | 46 (100.0%) | 58 (100.0%) |
| 65 to 74 Years | 6 (100.0%) | 0 (0.0%) |
| 75 Years and over | 0 (0.0%) | 0 (0.0%) |
| Total | 298 (84.4%) | 201 (74.2%) |
Income Below Poverty Among Married-Couple Families in San Ardo
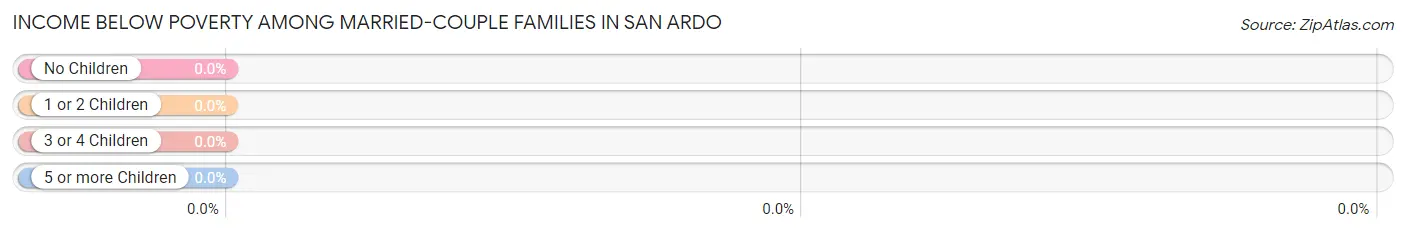
| Children | Above Poverty | Below Poverty |
| No Children | 22 (100.0%) | 0 (0.0%) |
| 1 or 2 Children | 55 (100.0%) | 0 (0.0%) |
| 3 or 4 Children | 0 (0.0%) | 0 (0.0%) |
| 5 or more Children | 0 (0.0%) | 0 (0.0%) |
| Total | 77 (100.0%) | 0 (0.0%) |
Income Below Poverty Among Single-Parent Households in San Ardo
According to the poverty data in San Ardo, 27.7% or 13 single-father households and 51.8% or 14 single-mother households are living below the poverty line. Among single-father households, those with 3 or 4 children have the highest poverty rate, with 13 households (68.4%) experiencing poverty. Likewise, among single-mother households, those with 1 or 2 children have the highest poverty rate, with 14 households (51.8%) falling below the poverty line.
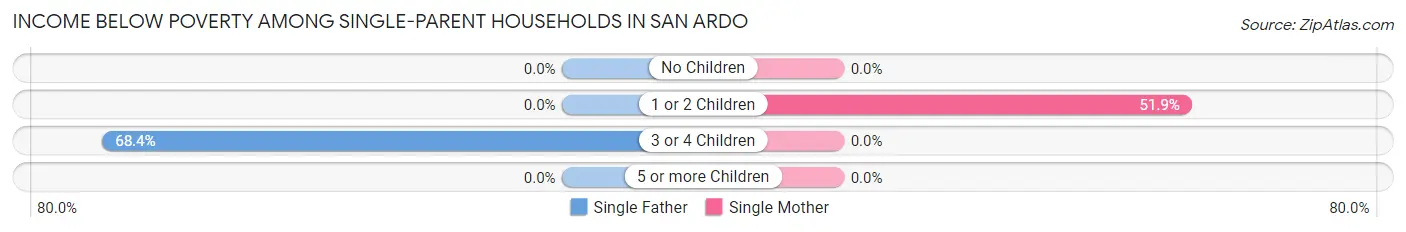
| Children | Single Father | Single Mother |
| No Children | 0 (0.0%) | 0 (0.0%) |
| 1 or 2 Children | 0 (0.0%) | 14 (51.8%) |
| 3 or 4 Children | 13 (68.4%) | 0 (0.0%) |
| 5 or more Children | 0 (0.0%) | 0 (0.0%) |
| Total | 13 (27.7%) | 14 (51.8%) |
Income Below Poverty Among Married-Couple vs Single-Parent Households in San Ardo
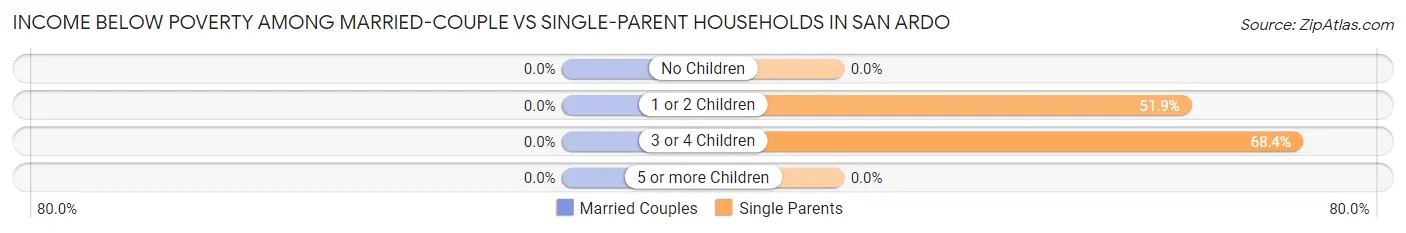
| Children | Married-Couple Families | Single-Parent Households |
| No Children | 0 (0.0%) | 0 (0.0%) |
| 1 or 2 Children | 0 (0.0%) | 14 (51.8%) |
| 3 or 4 Children | 0 (0.0%) | 13 (68.4%) |
| 5 or more Children | 0 (0.0%) | 0 (0.0%) |
| Total | 0 (0.0%) | 27 (36.5%) |
Race in San Ardo
The most populous races in San Ardo are Hispanic or Latino (522 | 83.7%), Some other Race (341 | 54.6%), and White / Caucasian (274 | 43.9%).
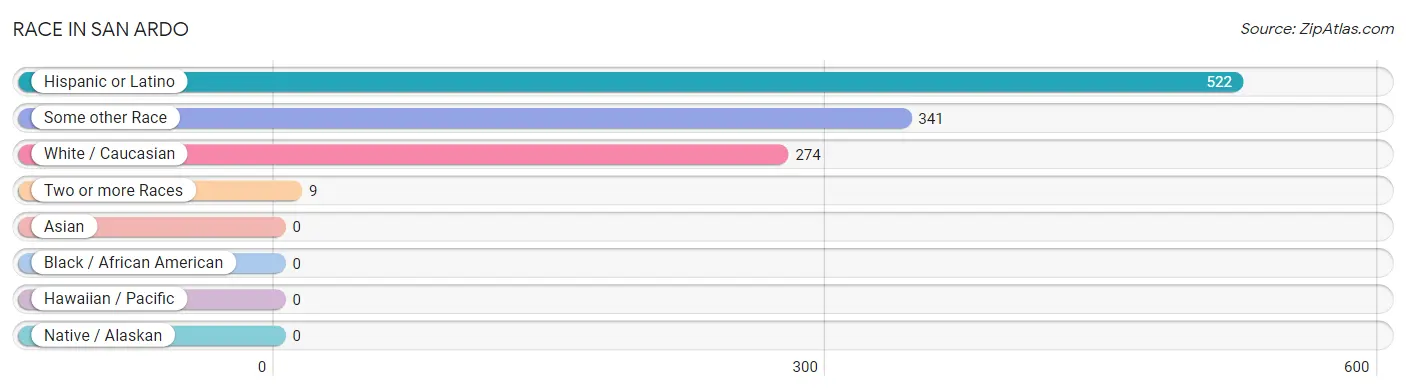
| Race | # Population | % Population |
| Asian | 0 | 0.0% |
| Black / African American | 0 | 0.0% |
| Hawaiian / Pacific | 0 | 0.0% |
| Hispanic or Latino | 522 | 83.7% |
| Native / Alaskan | 0 | 0.0% |
| White / Caucasian | 274 | 43.9% |
| Two or more Races | 9 | 1.4% |
| Some other Race | 341 | 54.6% |
| Total | 624 | 100.0% |
Ancestry in San Ardo
The most populous ancestries reported in San Ardo are Mexican (470 | 75.3%), Central American (42 | 6.7%), Salvadoran (42 | 6.7%), Irish (37 | 5.9%), and English (23 | 3.7%), together accounting for 98.4% of all San Ardo residents.
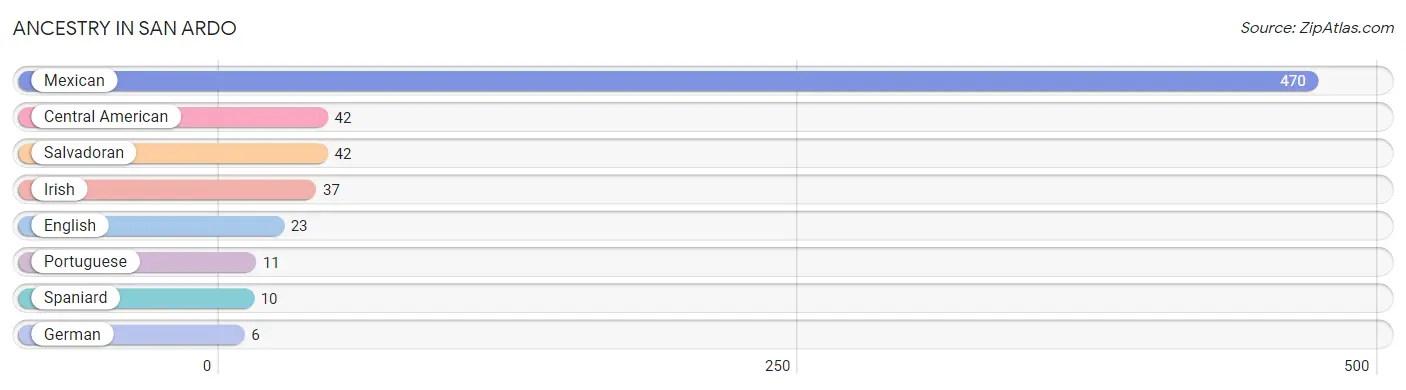
| Ancestry | # Population | % Population |
| Central American | 42 | 6.7% |
| English | 23 | 3.7% |
| German | 6 | 1.0% |
| Irish | 37 | 5.9% |
| Mexican | 470 | 75.3% |
| Portuguese | 11 | 1.8% |
| Salvadoran | 42 | 6.7% |
| Spaniard | 10 | 1.6% | View All 8 Rows |
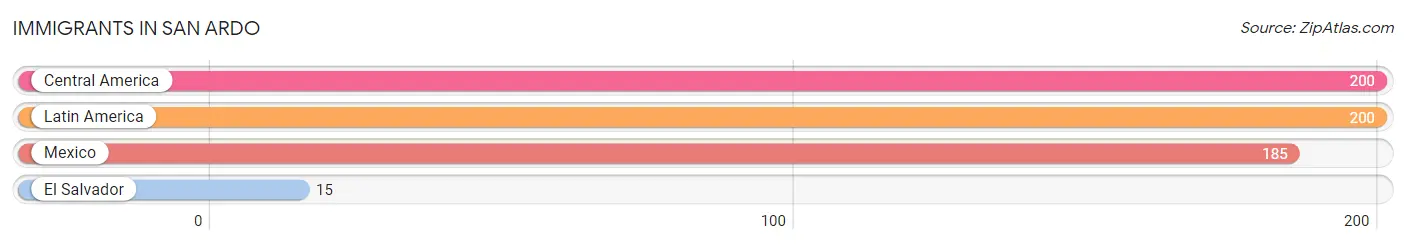
Immigrants in San Ardo
The most numerous immigrant groups reported in San Ardo came from Central America (200 | 32.1%), Latin America (200 | 32.1%), Mexico (185 | 29.6%), and El Salvador (15 | 2.4%), together accounting for 96.2% of all San Ardo residents.
| Immigration Origin | # Population | % Population |
| Central America | 200 | 32.1% |
| El Salvador | 15 | 2.4% |
| Latin America | 200 | 32.1% |
| Mexico | 185 | 29.6% | View All 4 Rows |
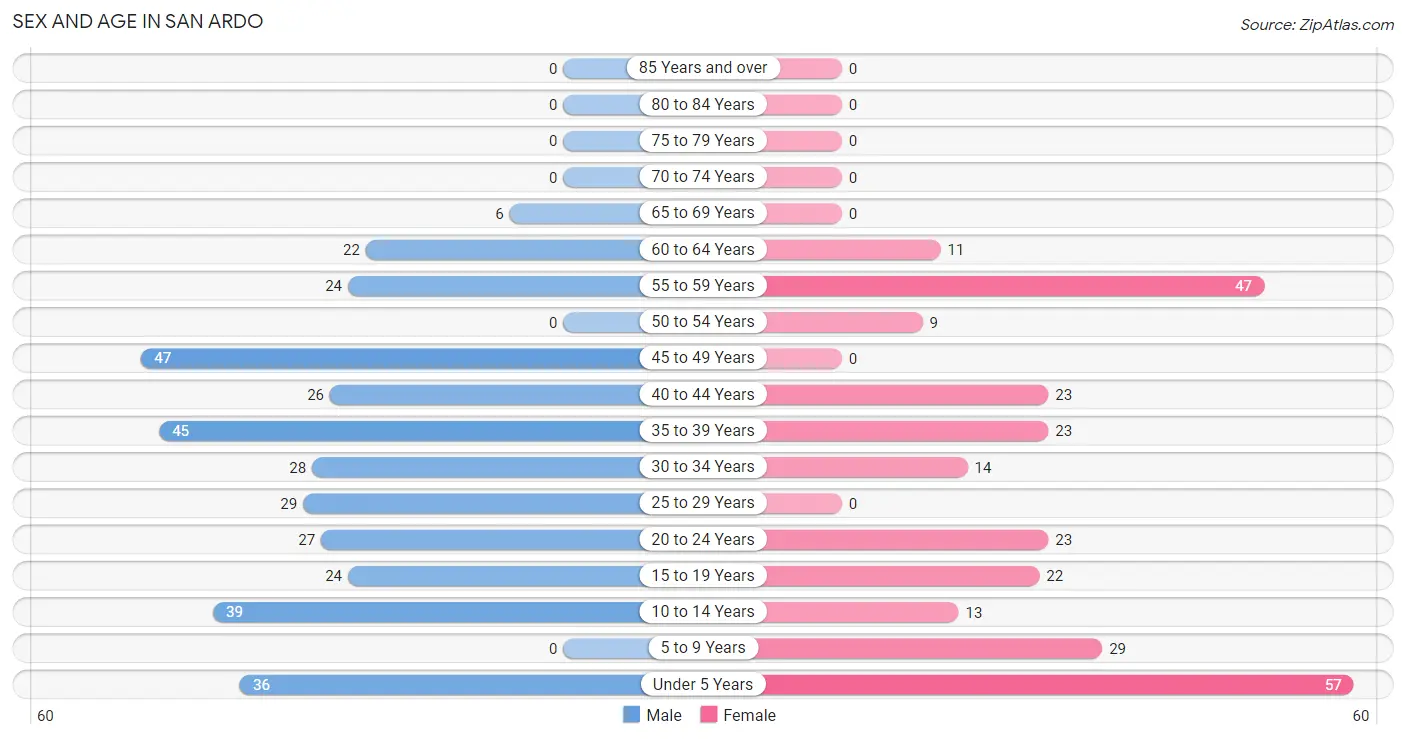
Sex and Age in San Ardo
Sex and Age in San Ardo
The most populous age groups in San Ardo are 45 to 49 Years (47 | 13.3%) for men and Under 5 Years (57 | 21.0%) for women.
| Age Bracket | Male | Female |
| Under 5 Years | 36 (10.2%) | 57 (21.0%) |
| 5 to 9 Years | 0 (0.0%) | 29 (10.7%) |
| 10 to 14 Years | 39 (11.1%) | 13 (4.8%) |
| 15 to 19 Years | 24 (6.8%) | 22 (8.1%) |
| 20 to 24 Years | 27 (7.6%) | 23 (8.5%) |
| 25 to 29 Years | 29 (8.2%) | 0 (0.0%) |
| 30 to 34 Years | 28 (7.9%) | 14 (5.2%) |
| 35 to 39 Years | 45 (12.8%) | 23 (8.5%) |
| 40 to 44 Years | 26 (7.4%) | 23 (8.5%) |
| 45 to 49 Years | 47 (13.3%) | 0 (0.0%) |
| 50 to 54 Years | 0 (0.0%) | 9 (3.3%) |
| 55 to 59 Years | 24 (6.8%) | 47 (17.3%) |
| 60 to 64 Years | 22 (6.2%) | 11 (4.1%) |
| 65 to 69 Years | 6 (1.7%) | 0 (0.0%) |
| 70 to 74 Years | 0 (0.0%) | 0 (0.0%) |
| 75 to 79 Years | 0 (0.0%) | 0 (0.0%) |
| 80 to 84 Years | 0 (0.0%) | 0 (0.0%) |
| 85 Years and over | 0 (0.0%) | 0 (0.0%) |
| Total | 353 (100.0%) | 271 (100.0%) |
Families and Households in San Ardo
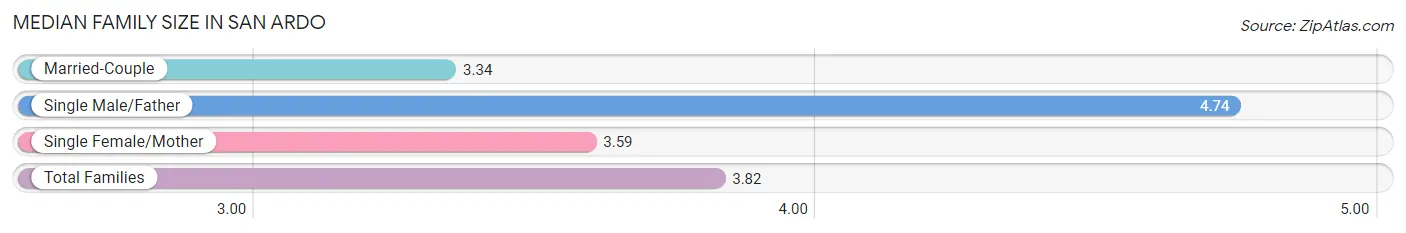
Median Family Size in San Ardo
The median family size in San Ardo is 3.82 persons per family, with single male/father families (47 | 31.1%) accounting for the largest median family size of 4.74 persons per family. On the other hand, married-couple families (77 | 51.0%) represent the smallest median family size with 3.34 persons per family.
| Family Type | # Families | Family Size |
| Married-Couple | 77 (51.0%) | 3.34 |
| Single Male/Father | 47 (31.1%) | 4.74 |
| Single Female/Mother | 27 (17.9%) | 3.59 |
| Total Families | 151 (100.0%) | 3.82 |
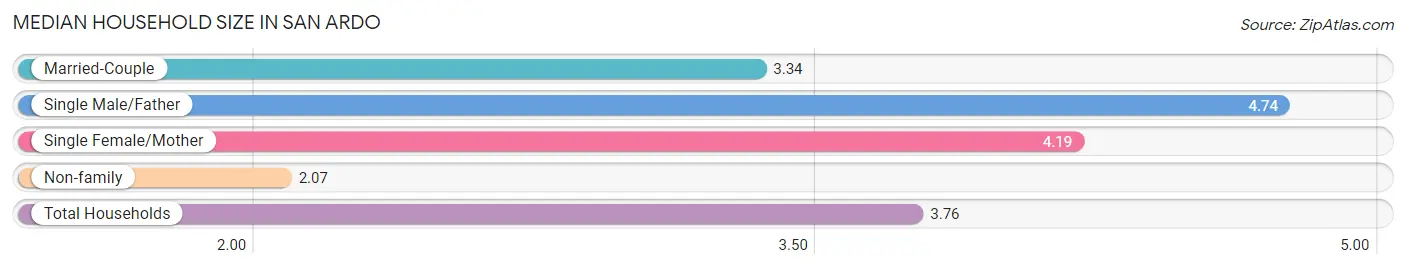
Median Household Size in San Ardo
The median household size in San Ardo is 3.76 persons per household, with single male/father households (47 | 28.3%) accounting for the largest median household size of 4.74 persons per household. non-family households (15 | 9.0%) represent the smallest median household size with 2.07 persons per household.
| Household Type | # Households | Household Size |
| Married-Couple | 77 (46.4%) | 3.34 |
| Single Male/Father | 47 (28.3%) | 4.74 |
| Single Female/Mother | 27 (16.3%) | 4.19 |
| Non-family | 15 (9.0%) | 2.07 |
| Total Households | 166 (100.0%) | 3.76 |
Household Size by Marriage Status in San Ardo
Out of a total of 166 households in San Ardo, 151 (91.0%) are family households, while 15 (9.0%) are nonfamily households. The most numerous type of family households are 4-person households, comprising 71, and the most common type of nonfamily households are 2-person households, comprising 15.
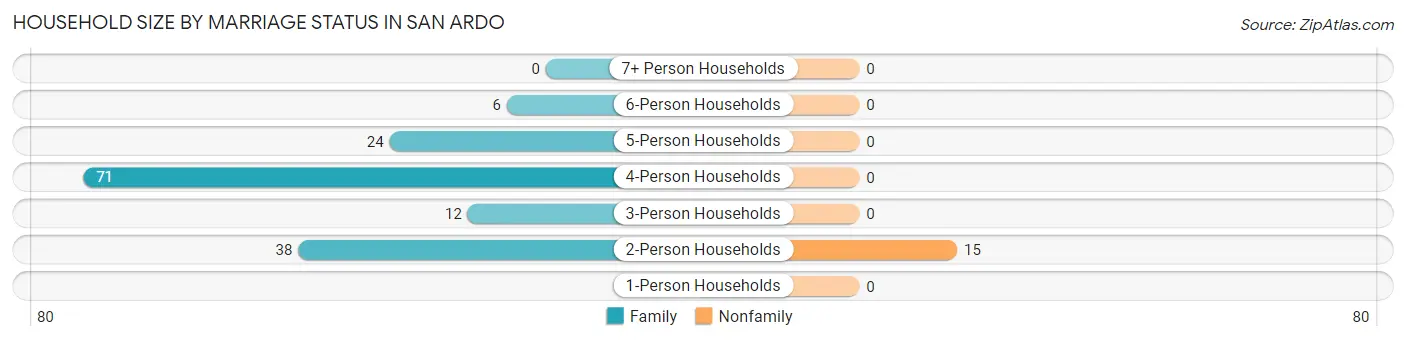
| Household Size | Family Households | Nonfamily Households |
| 1-Person Households | - | 0 (0.0%) |
| 2-Person Households | 38 (22.9%) | 15 (9.0%) |
| 3-Person Households | 12 (7.2%) | 0 (0.0%) |
| 4-Person Households | 71 (42.8%) | 0 (0.0%) |
| 5-Person Households | 24 (14.5%) | 0 (0.0%) |
| 6-Person Households | 6 (3.6%) | 0 (0.0%) |
| 7+ Person Households | 0 (0.0%) | 0 (0.0%) |
| Total | 151 (91.0%) | 15 (9.0%) |
Female Fertility in San Ardo
Fertility by Age in San Ardo
Average fertility rate in San Ardo is 95.0 births per 1,000 women. Women in the age bracket of 20 to 34 years have the highest fertility rate with 270.0 births per 1,000 women. Women in the age bracket of 20 to 34 years acount for 100.0% of all women with births.
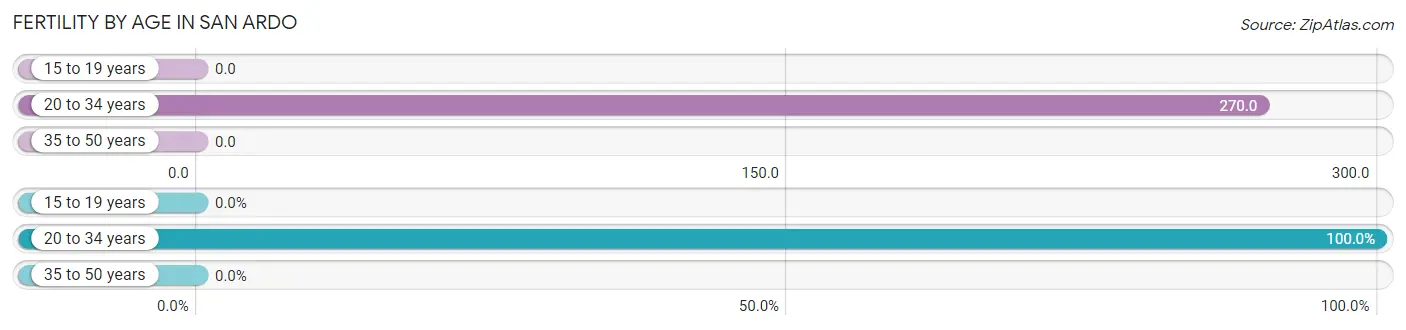
| Age Bracket | Women with Births | Births / 1,000 Women |
| 15 to 19 years | 0 (0.0%) | 0.0 |
| 20 to 34 years | 10 (100.0%) | 270.0 |
| 35 to 50 years | 0 (0.0%) | 0.0 |
| Total | 10 (100.0%) | 95.0 |
Fertility by Age by Marriage Status in San Ardo
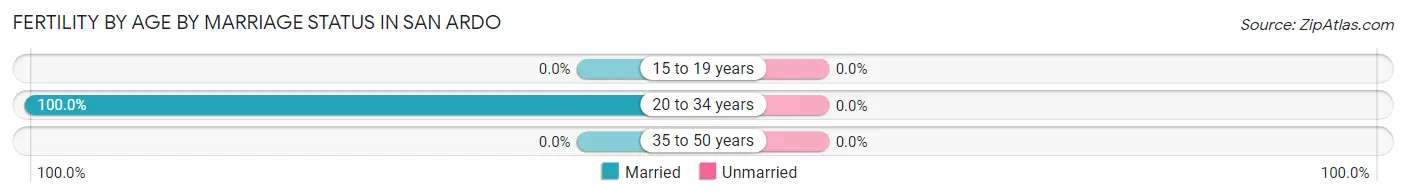
| Age Bracket | Married | Unmarried |
| 15 to 19 years | 0 (0.0%) | 0 (0.0%) |
| 20 to 34 years | 10 (100.0%) | 0 (0.0%) |
| 35 to 50 years | 0 (0.0%) | 0 (0.0%) |
| Total | 10 (100.0%) | 0 (0.0%) |
Fertility by Education in San Ardo
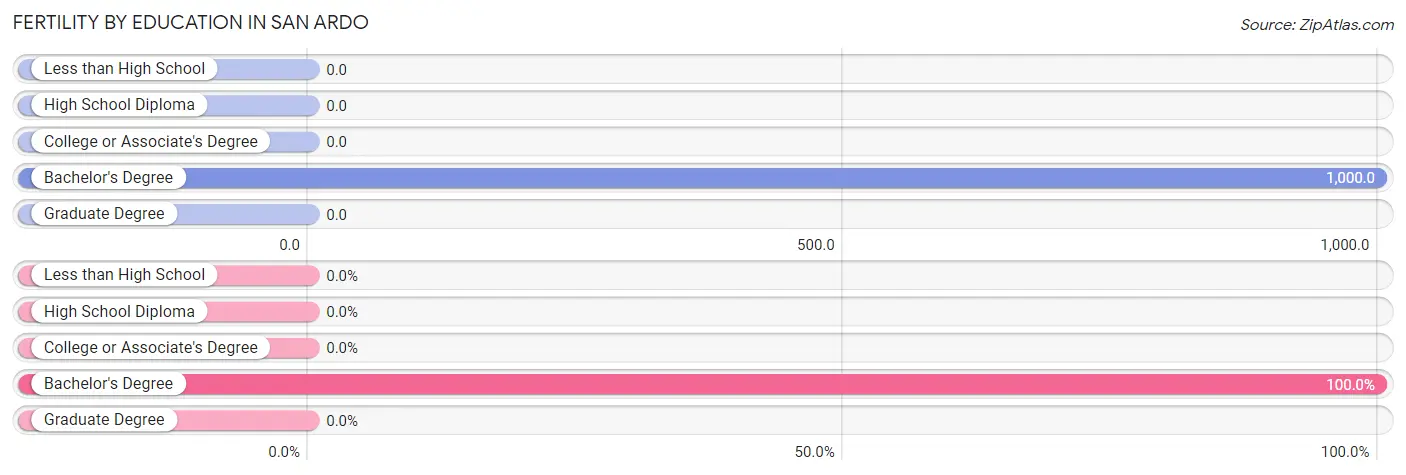
| Educational Attainment | Women with Births | Births / 1,000 Women |
| Less than High School | 0 (0.0%) | 0.0 |
| High School Diploma | 0 (0.0%) | 0.0 |
| College or Associate's Degree | 0 (0.0%) | 0.0 |
| Bachelor's Degree | 10 (100.0%) | 1,000.0 |
| Graduate Degree | 0 (0.0%) | 0.0 |
| Total | 10 (100.0%) | 95.0 |
Fertility by Education by Marriage Status in San Ardo
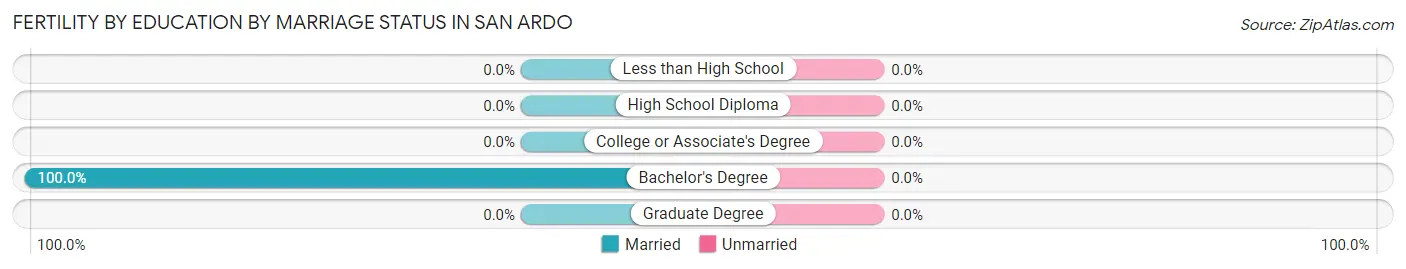
| Educational Attainment | Married | Unmarried |
| Less than High School | 0 (0.0%) | 0 (0.0%) |
| High School Diploma | 0 (0.0%) | 0 (0.0%) |
| College or Associate's Degree | 0 (0.0%) | 0 (0.0%) |
| Bachelor's Degree | 10 (100.0%) | 0 (0.0%) |
| Graduate Degree | 0 (0.0%) | 0 (0.0%) |
| Total | 10 (100.0%) | 0 (0.0%) |
Employment Characteristics in San Ardo
Employment by Class of Employer in San Ardo
Among the 270 employed individuals in San Ardo, private company employees (185 | 68.5%), state government employees (39 | 14.4%), and local government employees (35 | 13.0%) make up the most common classes of employment.
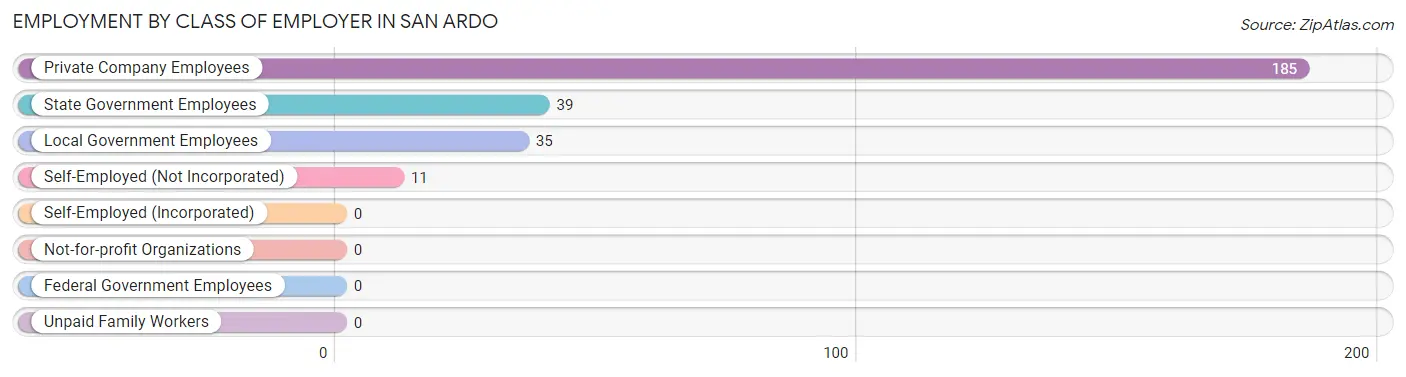
| Employer Class | # Employees | % Employees |
| Private Company Employees | 185 | 68.5% |
| Self-Employed (Incorporated) | 0 | 0.0% |
| Self-Employed (Not Incorporated) | 11 | 4.1% |
| Not-for-profit Organizations | 0 | 0.0% |
| Local Government Employees | 35 | 13.0% |
| State Government Employees | 39 | 14.4% |
| Federal Government Employees | 0 | 0.0% |
| Unpaid Family Workers | 0 | 0.0% |
| Total | 270 | 100.0% |
Employment Status by Age in San Ardo
According to the labor force statistics for San Ardo, out of the total population over 16 years of age (450), 72.4% or 326 individuals are in the labor force, with 17.2% or 56 of them unemployed. The age group with the highest labor force participation rate is 25 to 29 years, with 100.0% or 29 individuals in the labor force. Within the labor force, the 30 to 34 years age range has the highest percentage of unemployed individuals, with 71.4% or 30 of them being unemployed.
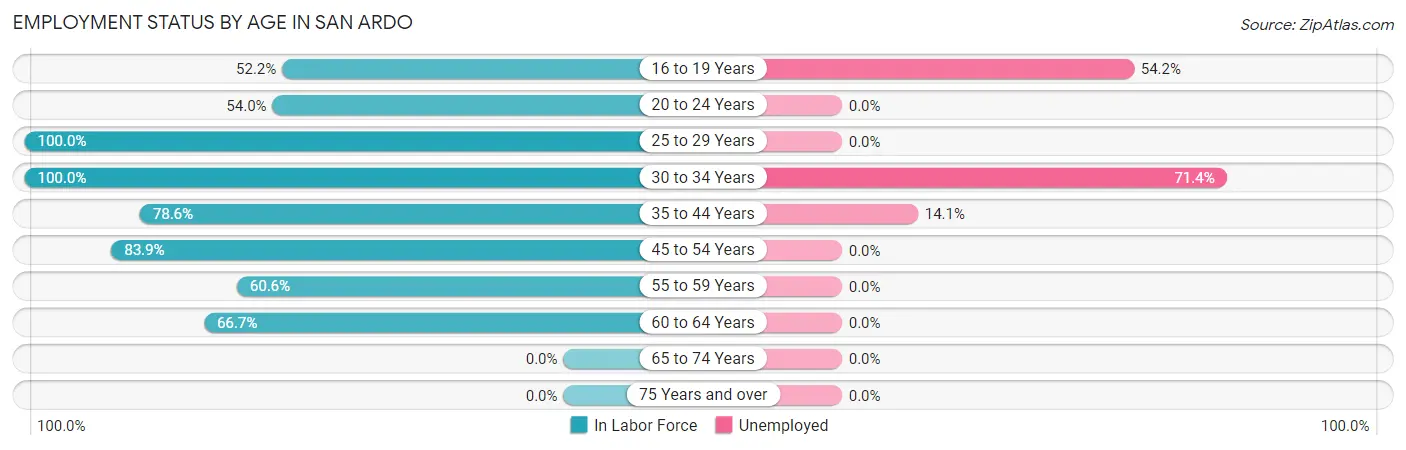
| Age Bracket | In Labor Force | Unemployed |
| 16 to 19 Years | 24 (52.2%) | 13 (54.2%) |
| 20 to 24 Years | 27 (54.0%) | 0 (0.0%) |
| 25 to 29 Years | 29 (100.0%) | 0 (0.0%) |
| 30 to 34 Years | 42 (100.0%) | 30 (71.4%) |
| 35 to 44 Years | 92 (78.6%) | 13 (14.1%) |
| 45 to 54 Years | 47 (83.9%) | 0 (0.0%) |
| 55 to 59 Years | 43 (60.6%) | 0 (0.0%) |
| 60 to 64 Years | 22 (66.7%) | 0 (0.0%) |
| 65 to 74 Years | 0 (0.0%) | 0 (0.0%) |
| 75 Years and over | 0 (0.0%) | 0 (0.0%) |
| Total | 326 (72.4%) | 56 (17.2%) |
Employment Status by Educational Attainment in San Ardo
According to labor force statistics for San Ardo, 79.0% of individuals (275) out of the total population between 25 and 64 years of age (348) are in the labor force, with 15.6% or 43 of them being unemployed. The group with the highest labor force participation rate are those with the educational attainment of high school diploma, with 87.5% or 147 individuals in the labor force. Within the labor force, individuals with college / associate degree education have the highest percentage of unemployment, with 100.0% or 30 of them being unemployed.
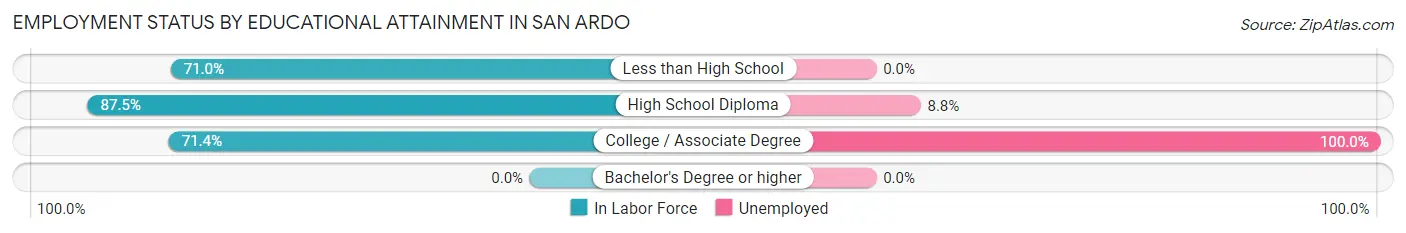
| Educational Attainment | In Labor Force | Unemployed |
| Less than High School | 98 (71.0%) | 0 (0.0%) |
| High School Diploma | 147 (87.5%) | 15 (8.8%) |
| College / Associate Degree | 30 (71.4%) | 42 (100.0%) |
| Bachelor's Degree or higher | 0 (0.0%) | 0 (0.0%) |
| Total | 275 (79.0%) | 54 (15.6%) |
Employment Occupations by Sex in San Ardo
Management, Business, Science and Arts Occupations
The most common Management, Business, Science and Arts occupations in San Ardo are , and Management (19 | 7.0%).
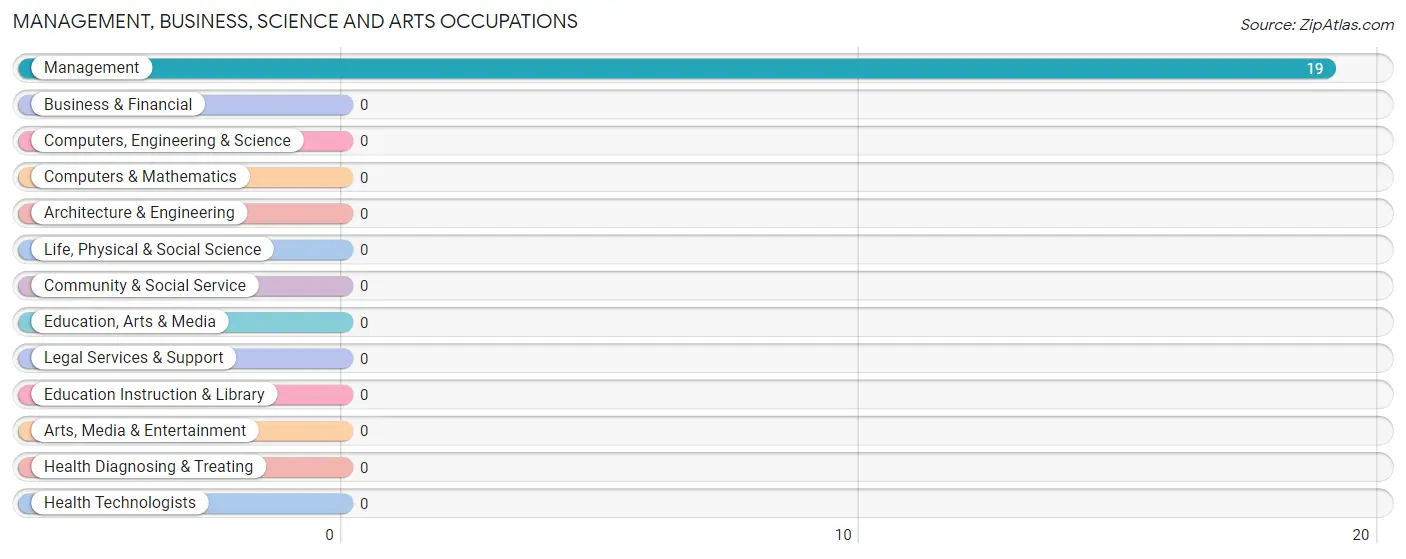
Management, Business, Science and Arts Occupations by Sex
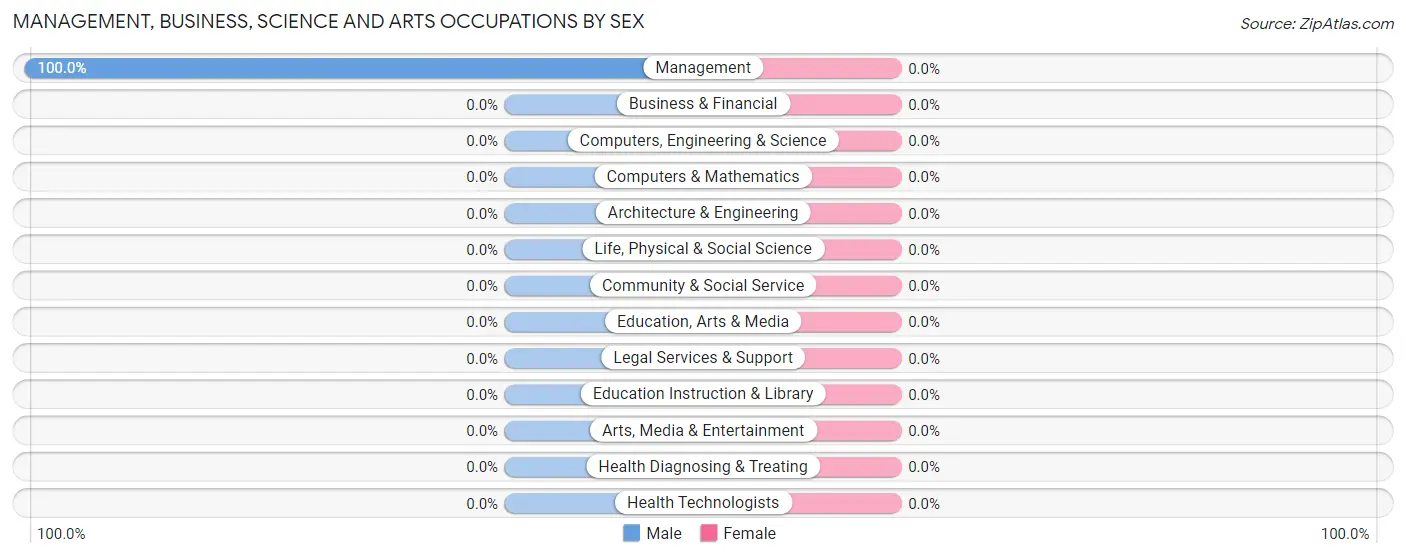
| Occupation | Male | Female |
| Management | 19 (100.0%) | 0 (0.0%) |
| Business & Financial | 0 (0.0%) | 0 (0.0%) |
| Computers, Engineering & Science | 0 (0.0%) | 0 (0.0%) |
| Computers & Mathematics | 0 (0.0%) | 0 (0.0%) |
| Architecture & Engineering | 0 (0.0%) | 0 (0.0%) |
| Life, Physical & Social Science | 0 (0.0%) | 0 (0.0%) |
| Community & Social Service | 0 (0.0%) | 0 (0.0%) |
| Education, Arts & Media | 0 (0.0%) | 0 (0.0%) |
| Legal Services & Support | 0 (0.0%) | 0 (0.0%) |
| Education Instruction & Library | 0 (0.0%) | 0 (0.0%) |
| Arts, Media & Entertainment | 0 (0.0%) | 0 (0.0%) |
| Health Diagnosing & Treating | 0 (0.0%) | 0 (0.0%) |
| Health Technologists | 0 (0.0%) | 0 (0.0%) |
| Total (Category) | 19 (100.0%) | 0 (0.0%) |
| Total (Overall) | 201 (74.4%) | 69 (25.6%) |
Services Occupations
The most common Services occupations in San Ardo are Healthcare Support (58 | 21.5%), and Cleaning & Maintenance (36 | 13.3%).
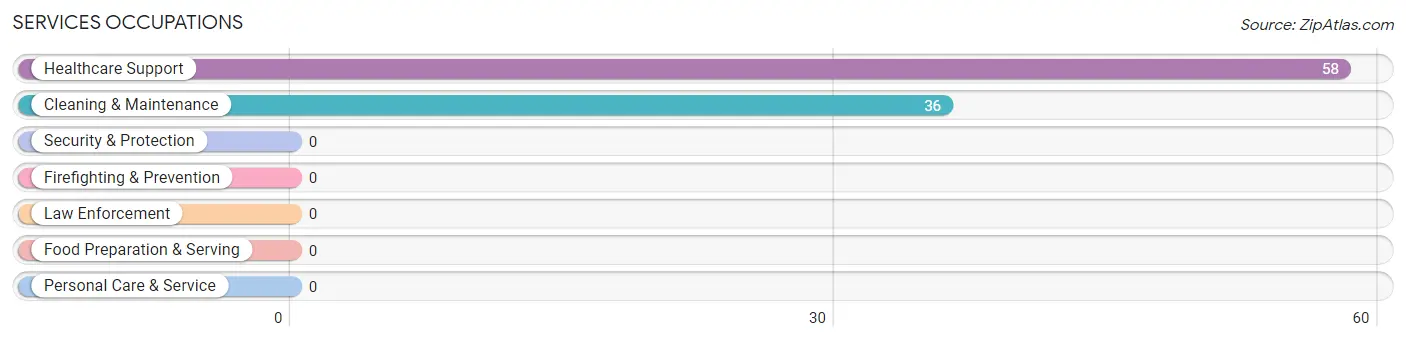
Services Occupations by Sex
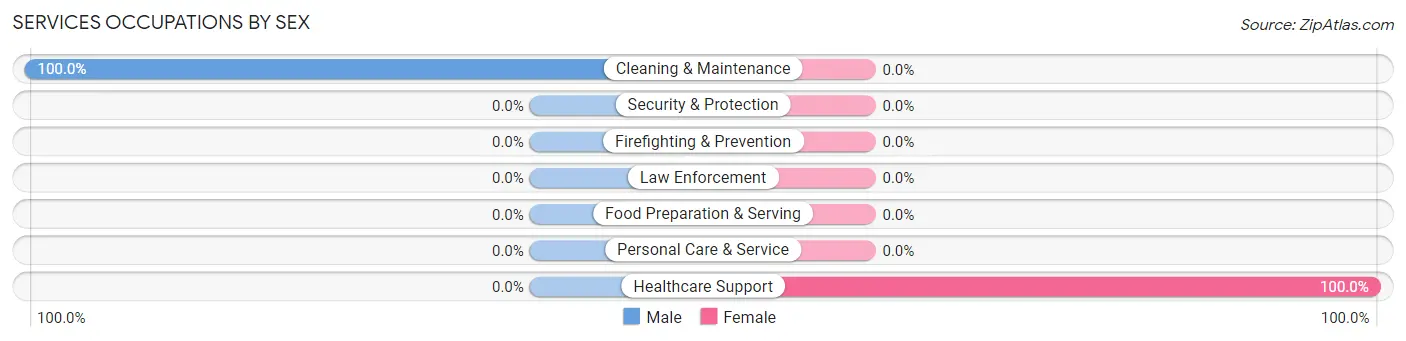
| Occupation | Male | Female |
| Healthcare Support | 0 (0.0%) | 58 (100.0%) |
| Security & Protection | 0 (0.0%) | 0 (0.0%) |
| Firefighting & Prevention | 0 (0.0%) | 0 (0.0%) |
| Law Enforcement | 0 (0.0%) | 0 (0.0%) |
| Food Preparation & Serving | 0 (0.0%) | 0 (0.0%) |
| Cleaning & Maintenance | 36 (100.0%) | 0 (0.0%) |
| Personal Care & Service | 0 (0.0%) | 0 (0.0%) |
| Total (Category) | 36 (38.3%) | 58 (61.7%) |
| Total (Overall) | 201 (74.4%) | 69 (25.6%) |
Sales and Office Occupations
The most common Sales and Office occupations in San Ardo are , and Office & Administration (11 | 4.1%).
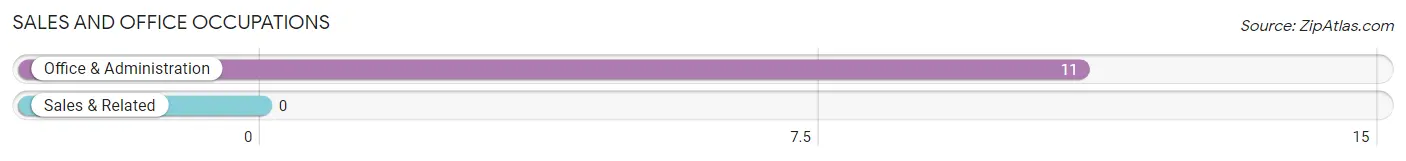
Sales and Office Occupations by Sex
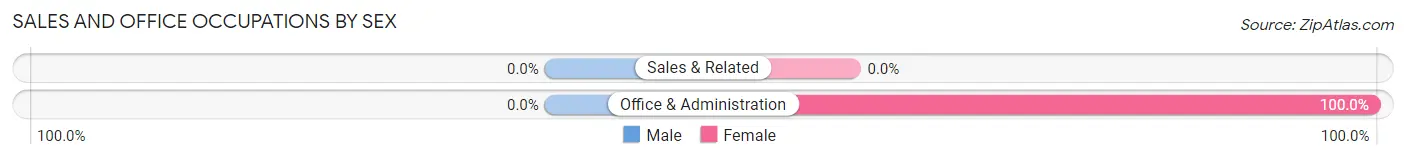
| Occupation | Male | Female |
| Sales & Related | 0 (0.0%) | 0 (0.0%) |
| Office & Administration | 0 (0.0%) | 11 (100.0%) |
| Total (Category) | 0 (0.0%) | 11 (100.0%) |
| Total (Overall) | 201 (74.4%) | 69 (25.6%) |
Natural Resources, Construction and Maintenance Occupations
The most common Natural Resources, Construction and Maintenance occupations in San Ardo are Farming, Fishing & Forestry (62 | 23.0%), Installation, Maintenance & Repair (22 | 8.2%), and Construction & Extraction (12 | 4.4%).
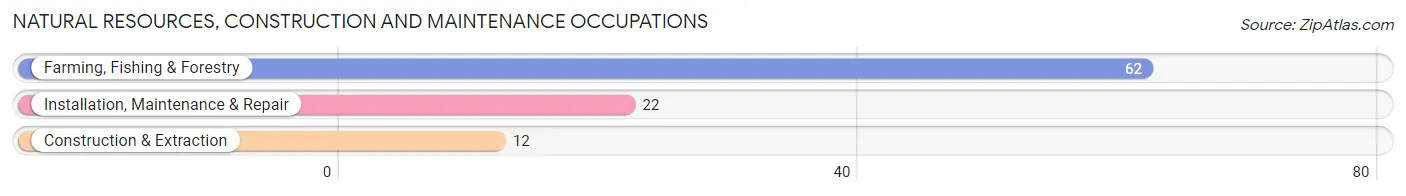
Natural Resources, Construction and Maintenance Occupations by Sex
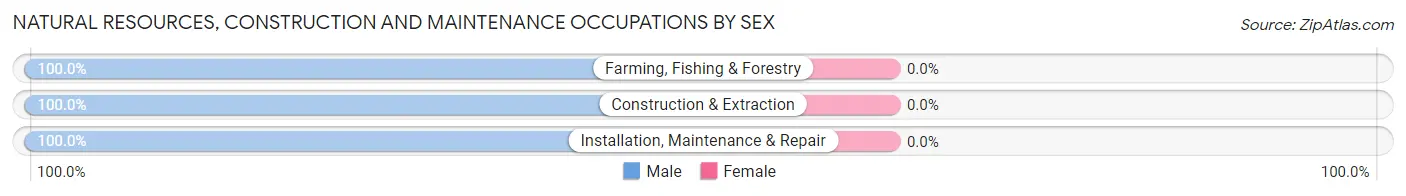
| Occupation | Male | Female |
| Farming, Fishing & Forestry | 62 (100.0%) | 0 (0.0%) |
| Construction & Extraction | 12 (100.0%) | 0 (0.0%) |
| Installation, Maintenance & Repair | 22 (100.0%) | 0 (0.0%) |
| Total (Category) | 96 (100.0%) | 0 (0.0%) |
| Total (Overall) | 201 (74.4%) | 69 (25.6%) |
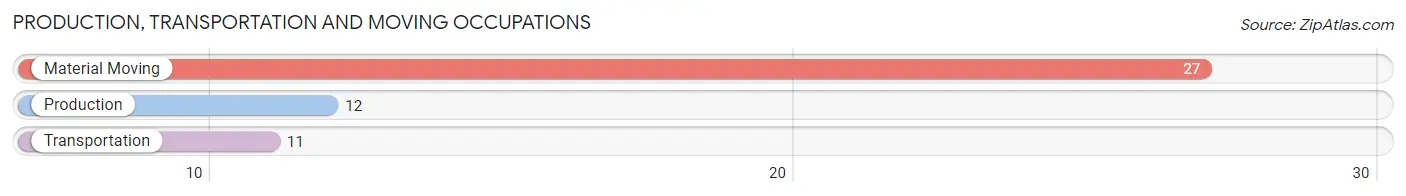
Production, Transportation and Moving Occupations
The most common Production, Transportation and Moving occupations in San Ardo are Material Moving (27 | 10.0%), Production (12 | 4.4%), and Transportation (11 | 4.1%).
Production, Transportation and Moving Occupations by Sex
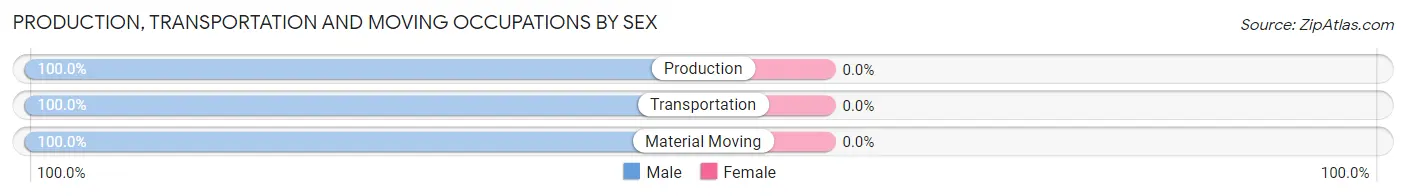
| Occupation | Male | Female |
| Production | 12 (100.0%) | 0 (0.0%) |
| Transportation | 11 (100.0%) | 0 (0.0%) |
| Material Moving | 27 (100.0%) | 0 (0.0%) |
| Total (Category) | 50 (100.0%) | 0 (0.0%) |
| Total (Overall) | 201 (74.4%) | 69 (25.6%) |
Employment Industries by Sex in San Ardo
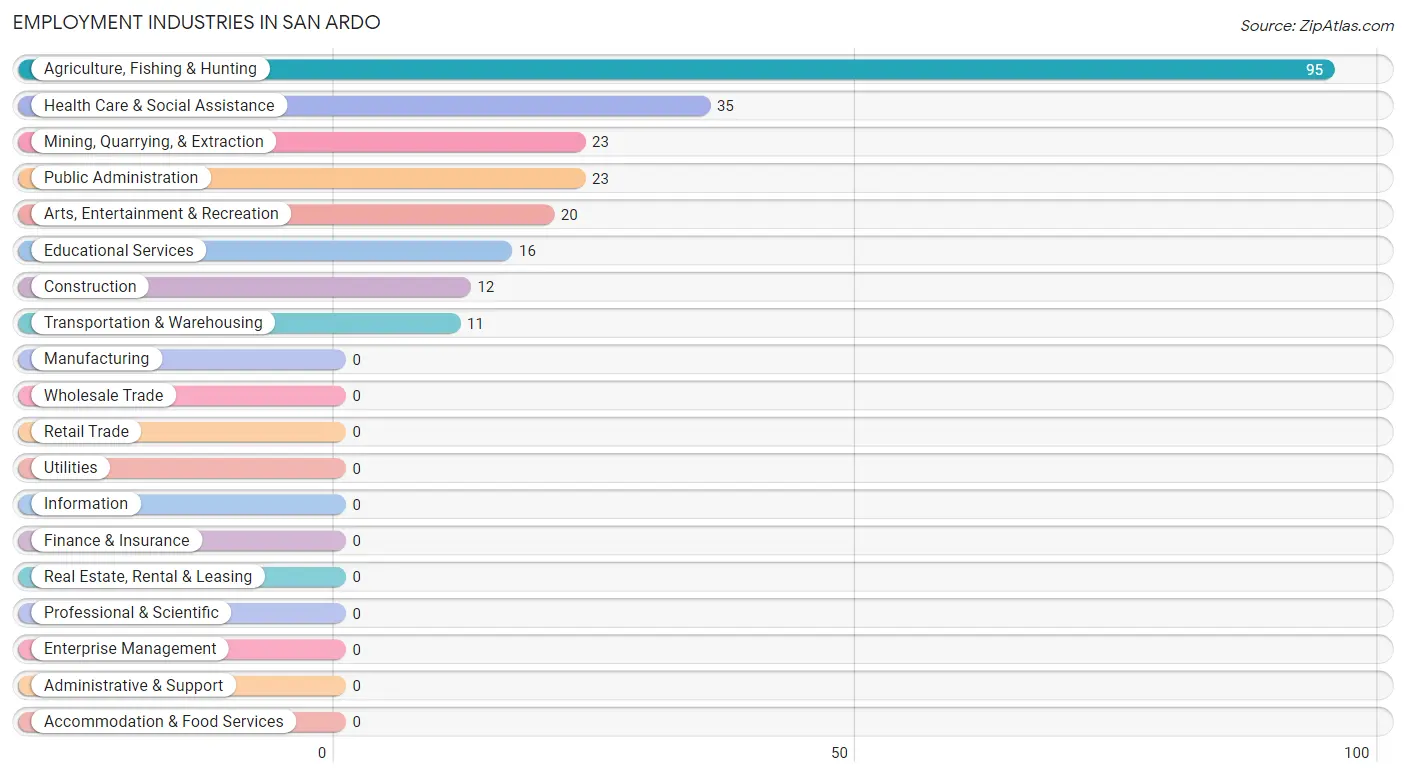
Employment Industries in San Ardo
The major employment industries in San Ardo include Agriculture, Fishing & Hunting (95 | 35.2%), Health Care & Social Assistance (35 | 13.0%), Mining, Quarrying, & Extraction (23 | 8.5%), Public Administration (23 | 8.5%), and Arts, Entertainment & Recreation (20 | 7.4%).
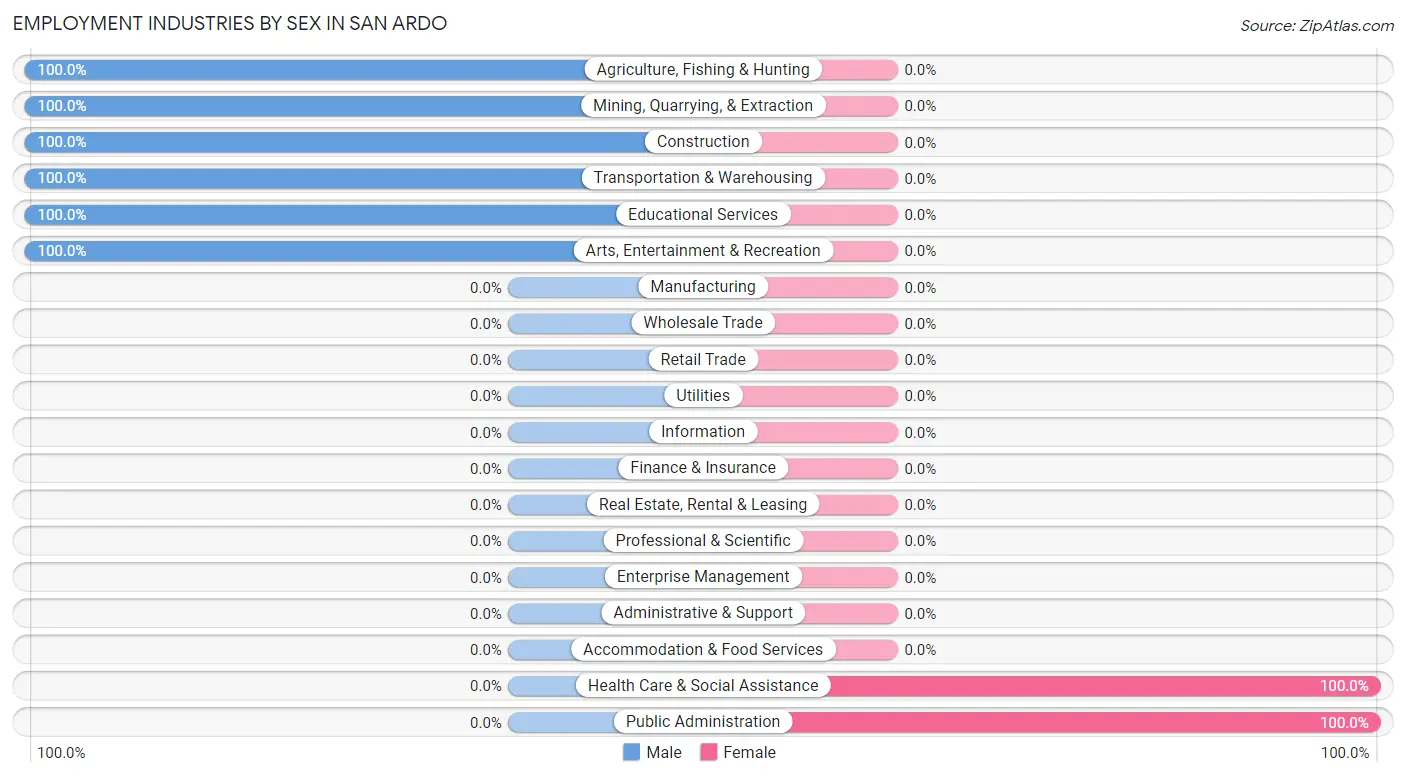
Employment Industries by Sex in San Ardo
The San Ardo industries that see more men than women are Agriculture, Fishing & Hunting (100.0%), Mining, Quarrying, & Extraction (100.0%), and Construction (100.0%), whereas the industries that tend to have a higher number of women are Health Care & Social Assistance (100.0%), and Public Administration (100.0%).
| Industry | Male | Female |
| Agriculture, Fishing & Hunting | 95 (100.0%) | 0 (0.0%) |
| Mining, Quarrying, & Extraction | 23 (100.0%) | 0 (0.0%) |
| Construction | 12 (100.0%) | 0 (0.0%) |
| Manufacturing | 0 (0.0%) | 0 (0.0%) |
| Wholesale Trade | 0 (0.0%) | 0 (0.0%) |
| Retail Trade | 0 (0.0%) | 0 (0.0%) |
| Transportation & Warehousing | 11 (100.0%) | 0 (0.0%) |
| Utilities | 0 (0.0%) | 0 (0.0%) |
| Information | 0 (0.0%) | 0 (0.0%) |
| Finance & Insurance | 0 (0.0%) | 0 (0.0%) |
| Real Estate, Rental & Leasing | 0 (0.0%) | 0 (0.0%) |
| Professional & Scientific | 0 (0.0%) | 0 (0.0%) |
| Enterprise Management | 0 (0.0%) | 0 (0.0%) |
| Administrative & Support | 0 (0.0%) | 0 (0.0%) |
| Educational Services | 16 (100.0%) | 0 (0.0%) |
| Health Care & Social Assistance | 0 (0.0%) | 35 (100.0%) |
| Arts, Entertainment & Recreation | 20 (100.0%) | 0 (0.0%) |
| Accommodation & Food Services | 0 (0.0%) | 0 (0.0%) |
| Public Administration | 0 (0.0%) | 23 (100.0%) |
| Total | 201 (74.4%) | 69 (25.6%) |
Education in San Ardo
School Enrollment in San Ardo
The most common levels of schooling among the 116 students in San Ardo are middle school (52 | 44.8%), high school (35 | 30.2%), and elementary school (29 | 25.0%).
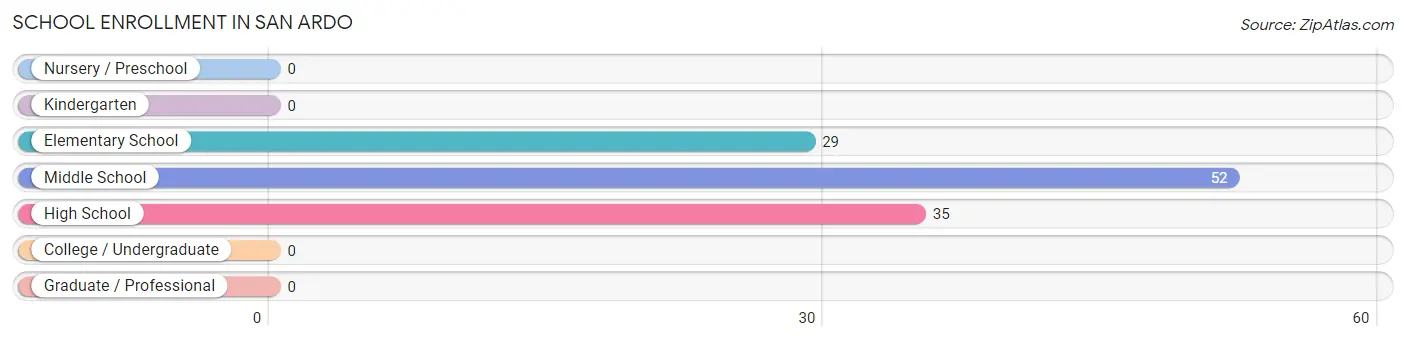
| School Level | # Students | % Students |
| Nursery / Preschool | 0 | 0.0% |
| Kindergarten | 0 | 0.0% |
| Elementary School | 29 | 25.0% |
| Middle School | 52 | 44.8% |
| High School | 35 | 30.2% |
| College / Undergraduate | 0 | 0.0% |
| Graduate / Professional | 0 | 0.0% |
| Total | 116 | 100.0% |
School Enrollment by Age by Funding Source in San Ardo
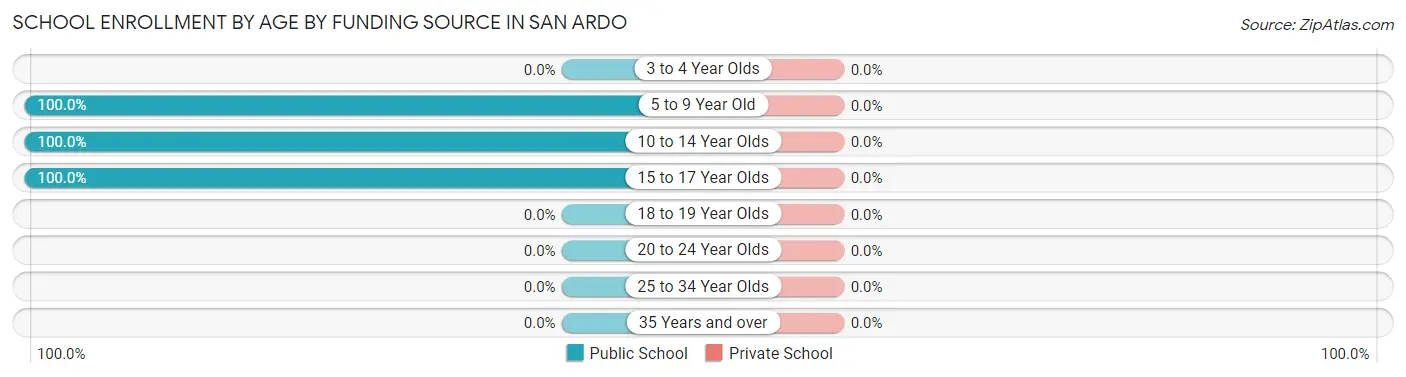
| Age Bracket | Public School | Private School |
| 3 to 4 Year Olds | 0 (0.0%) | 0 (0.0%) |
| 5 to 9 Year Old | 29 (100.0%) | 0 (0.0%) |
| 10 to 14 Year Olds | 52 (100.0%) | 0 (0.0%) |
| 15 to 17 Year Olds | 35 (100.0%) | 0 (0.0%) |
| 18 to 19 Year Olds | 0 (0.0%) | 0 (0.0%) |
| 20 to 24 Year Olds | 0 (0.0%) | 0 (0.0%) |
| 25 to 34 Year Olds | 0 (0.0%) | 0 (0.0%) |
| 35 Years and over | 0 (0.0%) | 0 (0.0%) |
| Total | 116 (100.0%) | 0 (0.0%) |
Educational Attainment by Field of Study in San Ardo
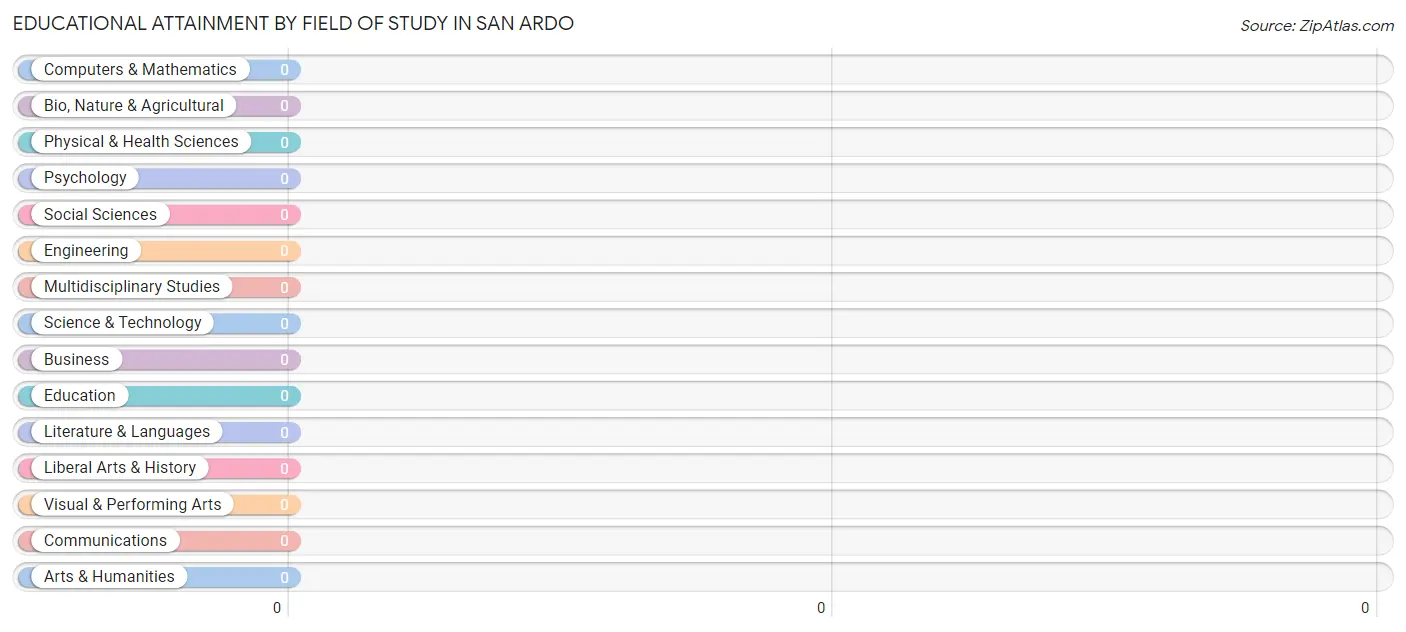
| Field of Study | # Graduates | % Graduates |
| Computers & Mathematics | 0 | 0.0% |
| Bio, Nature & Agricultural | 0 | 0.0% |
| Physical & Health Sciences | 0 | 0.0% |
| Psychology | 0 | 0.0% |
| Social Sciences | 0 | 0.0% |
| Engineering | 0 | 0.0% |
| Multidisciplinary Studies | 0 | 0.0% |
| Science & Technology | 0 | 0.0% |
| Business | 0 | 0.0% |
| Education | 0 | 0.0% |
| Literature & Languages | 0 | 0.0% |
| Liberal Arts & History | 0 | 0.0% |
| Visual & Performing Arts | 0 | 0.0% |
| Communications | 0 | 0.0% |
| Arts & Humanities | 0 | 0.0% |
| Total | 0 | 0.0% |
Transportation & Commute in San Ardo
Vehicle Availability by Sex in San Ardo
The most prevalent vehicle ownership categories in San Ardo are males with 3 vehicles (107, accounting for 53.2%) and females with 3 vehicles (58, making up 155.1%).
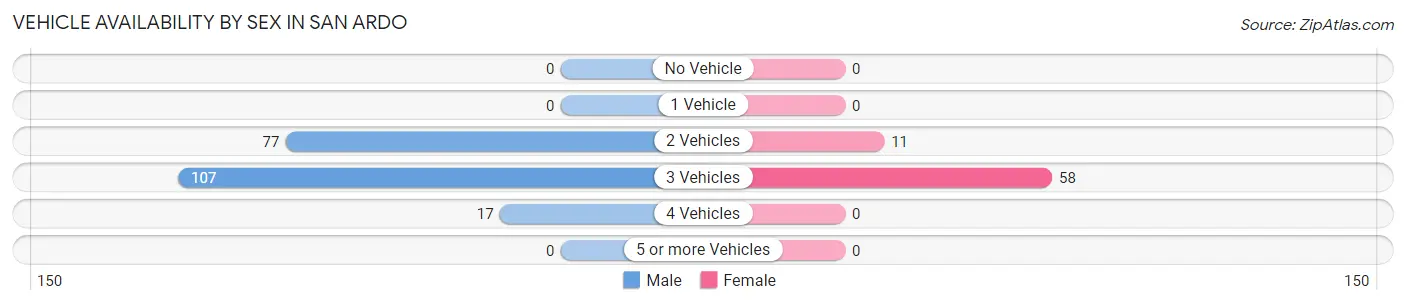
| Vehicles Available | Male | Female |
| No Vehicle | 0 (0.0%) | 0 (0.0%) |
| 1 Vehicle | 0 (0.0%) | 0 (0.0%) |
| 2 Vehicles | 77 (38.3%) | 11 (15.9%) |
| 3 Vehicles | 107 (53.2%) | 58 (84.1%) |
| 4 Vehicles | 17 (8.5%) | 0 (0.0%) |
| 5 or more Vehicles | 0 (0.0%) | 0 (0.0%) |
| Total | 201 (100.0%) | 69 (100.0%) |
Commute Time in San Ardo
The most frequently occuring commute durations in San Ardo are 10 to 14 minutes (104 commuters, 38.5%), 20 to 24 minutes (44 commuters, 16.3%), and 25 to 29 minutes (36 commuters, 13.3%).
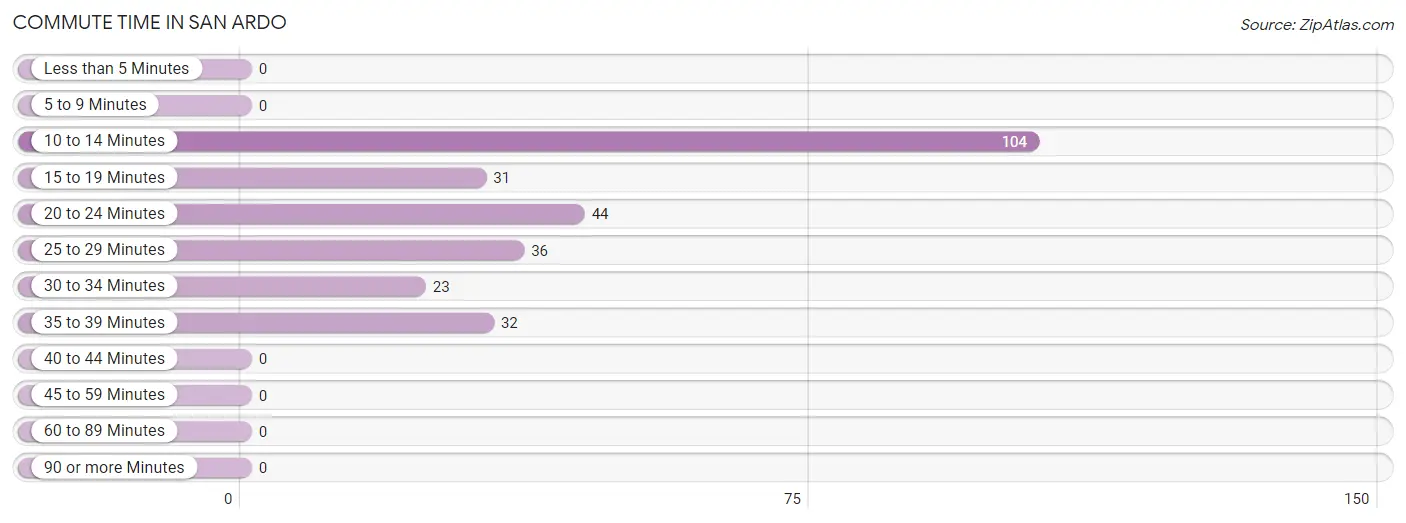
| Commute Time | # Commuters | % Commuters |
| Less than 5 Minutes | 0 | 0.0% |
| 5 to 9 Minutes | 0 | 0.0% |
| 10 to 14 Minutes | 104 | 38.5% |
| 15 to 19 Minutes | 31 | 11.5% |
| 20 to 24 Minutes | 44 | 16.3% |
| 25 to 29 Minutes | 36 | 13.3% |
| 30 to 34 Minutes | 23 | 8.5% |
| 35 to 39 Minutes | 32 | 11.8% |
| 40 to 44 Minutes | 0 | 0.0% |
| 45 to 59 Minutes | 0 | 0.0% |
| 60 to 89 Minutes | 0 | 0.0% |
| 90 or more Minutes | 0 | 0.0% |
Commute Time by Sex in San Ardo
The most common commute times in San Ardo are 10 to 14 minutes (58 commuters, 28.9%) for males and 10 to 14 minutes (46 commuters, 66.7%) for females.
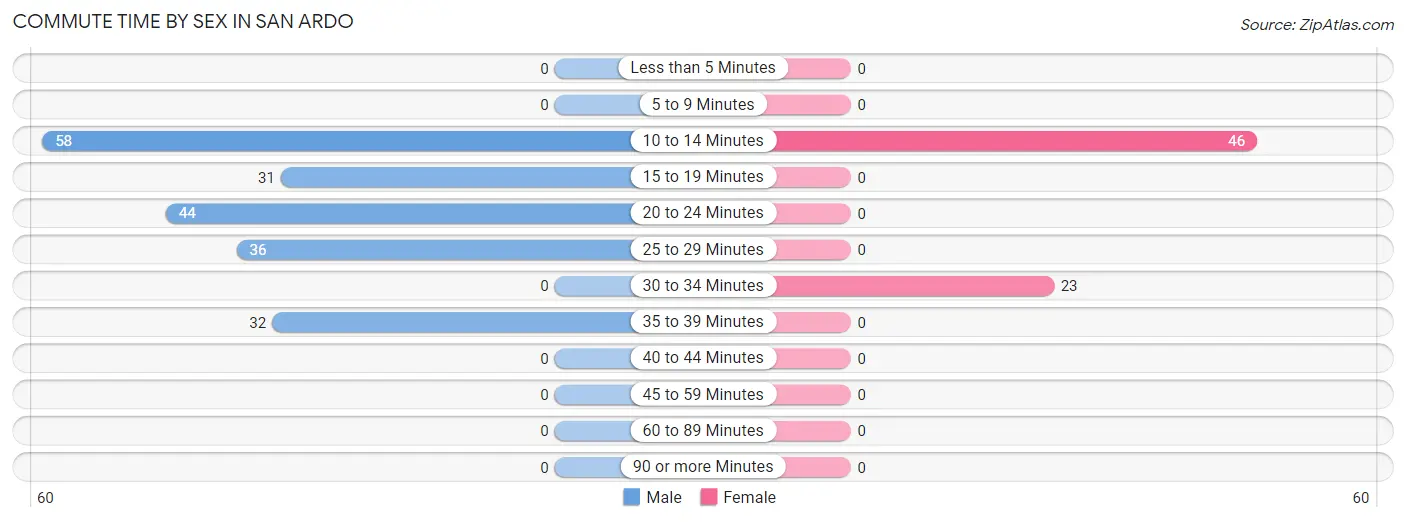
| Commute Time | Male | Female |
| Less than 5 Minutes | 0 (0.0%) | 0 (0.0%) |
| 5 to 9 Minutes | 0 (0.0%) | 0 (0.0%) |
| 10 to 14 Minutes | 58 (28.9%) | 46 (66.7%) |
| 15 to 19 Minutes | 31 (15.4%) | 0 (0.0%) |
| 20 to 24 Minutes | 44 (21.9%) | 0 (0.0%) |
| 25 to 29 Minutes | 36 (17.9%) | 0 (0.0%) |
| 30 to 34 Minutes | 0 (0.0%) | 23 (33.3%) |
| 35 to 39 Minutes | 32 (15.9%) | 0 (0.0%) |
| 40 to 44 Minutes | 0 (0.0%) | 0 (0.0%) |
| 45 to 59 Minutes | 0 (0.0%) | 0 (0.0%) |
| 60 to 89 Minutes | 0 (0.0%) | 0 (0.0%) |
| 90 or more Minutes | 0 (0.0%) | 0 (0.0%) |
Time of Departure to Work by Sex in San Ardo
The most frequent times of departure to work in San Ardo are 6:30 AM to 6:59 AM (47, 23.4%) for males and 7:00 AM to 7:29 AM (58, 84.1%) for females.
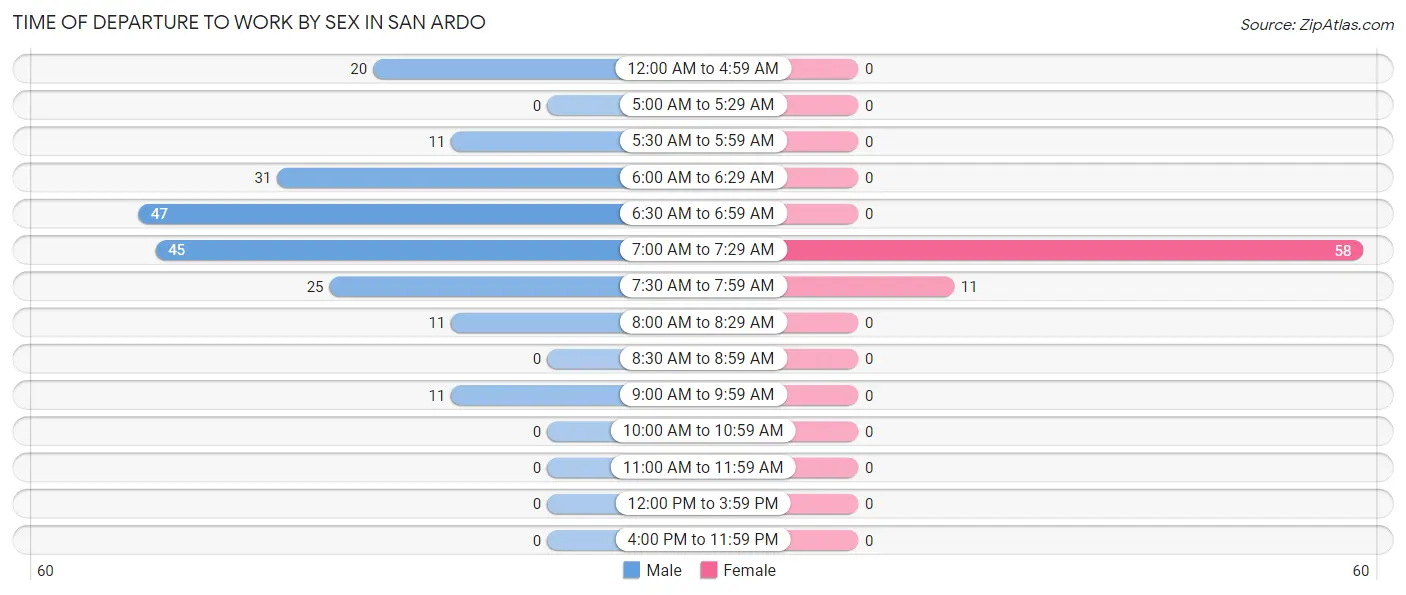
| Time of Departure | Male | Female |
| 12:00 AM to 4:59 AM | 20 (10.0%) | 0 (0.0%) |
| 5:00 AM to 5:29 AM | 0 (0.0%) | 0 (0.0%) |
| 5:30 AM to 5:59 AM | 11 (5.5%) | 0 (0.0%) |
| 6:00 AM to 6:29 AM | 31 (15.4%) | 0 (0.0%) |
| 6:30 AM to 6:59 AM | 47 (23.4%) | 0 (0.0%) |
| 7:00 AM to 7:29 AM | 45 (22.4%) | 58 (84.1%) |
| 7:30 AM to 7:59 AM | 25 (12.4%) | 11 (15.9%) |
| 8:00 AM to 8:29 AM | 11 (5.5%) | 0 (0.0%) |
| 8:30 AM to 8:59 AM | 0 (0.0%) | 0 (0.0%) |
| 9:00 AM to 9:59 AM | 11 (5.5%) | 0 (0.0%) |
| 10:00 AM to 10:59 AM | 0 (0.0%) | 0 (0.0%) |
| 11:00 AM to 11:59 AM | 0 (0.0%) | 0 (0.0%) |
| 12:00 PM to 3:59 PM | 0 (0.0%) | 0 (0.0%) |
| 4:00 PM to 11:59 PM | 0 (0.0%) | 0 (0.0%) |
| Total | 201 (100.0%) | 69 (100.0%) |
Housing Occupancy in San Ardo
Occupancy by Ownership in San Ardo
Of the total 166 dwellings in San Ardo, owner-occupied units account for 71 (42.8%), while renter-occupied units make up 95 (57.2%).
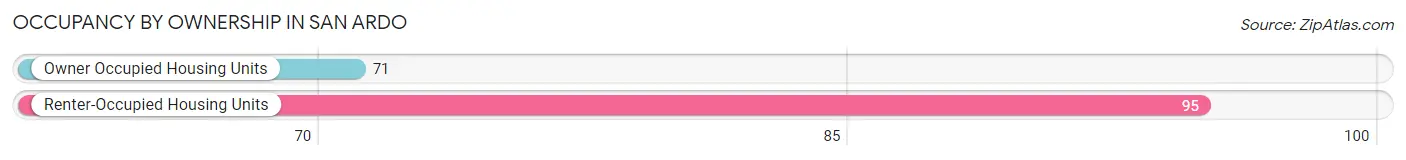
| Occupancy | # Housing Units | % Housing Units |
| Owner Occupied Housing Units | 71 | 42.8% |
| Renter-Occupied Housing Units | 95 | 57.2% |
| Total Occupied Housing Units | 166 | 100.0% |
Occupancy by Household Size in San Ardo
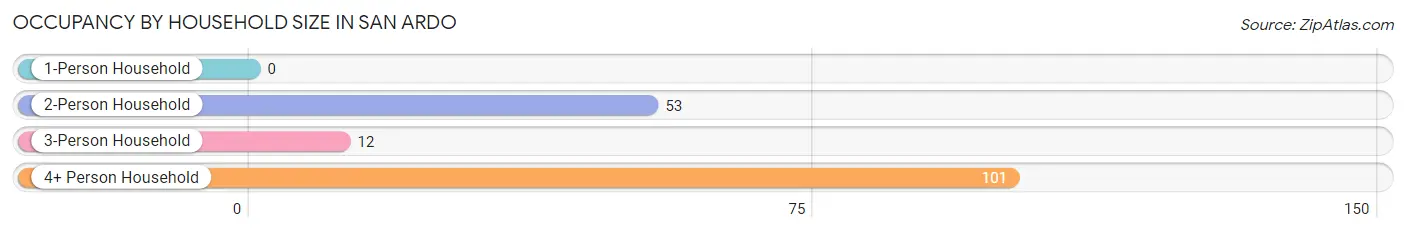
| Household Size | # Housing Units | % Housing Units |
| 1-Person Household | 0 | 0.0% |
| 2-Person Household | 53 | 31.9% |
| 3-Person Household | 12 | 7.2% |
| 4+ Person Household | 101 | 60.8% |
| Total Housing Units | 166 | 100.0% |
Occupancy by Ownership by Household Size in San Ardo
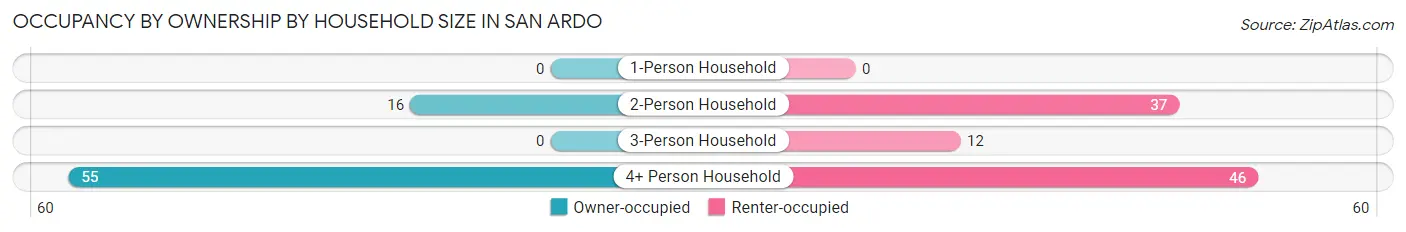
| Household Size | Owner-occupied | Renter-occupied |
| 1-Person Household | 0 (0.0%) | 0 (0.0%) |
| 2-Person Household | 16 (30.2%) | 37 (69.8%) |
| 3-Person Household | 0 (0.0%) | 12 (100.0%) |
| 4+ Person Household | 55 (54.5%) | 46 (45.5%) |
| Total Housing Units | 71 (42.8%) | 95 (57.2%) |
Occupancy by Educational Attainment in San Ardo
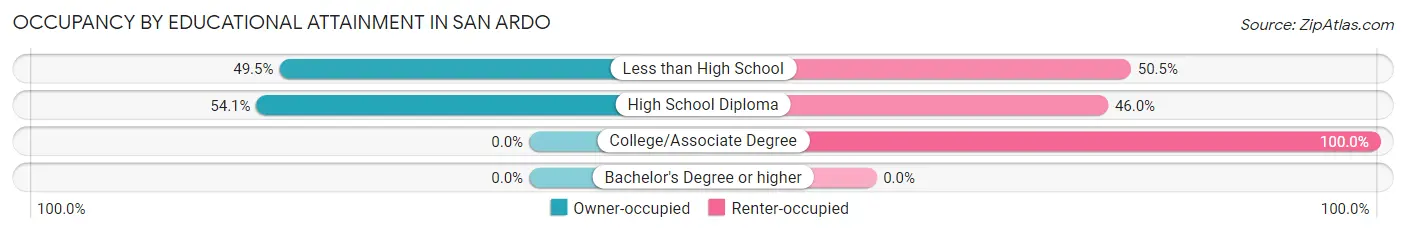
| Household Size | Owner-occupied | Renter-occupied |
| Less than High School | 51 (49.5%) | 52 (50.5%) |
| High School Diploma | 20 (54.0%) | 17 (46.0%) |
| College/Associate Degree | 0 (0.0%) | 26 (100.0%) |
| Bachelor's Degree or higher | 0 (0.0%) | 0 (0.0%) |
Occupancy by Age of Householder in San Ardo
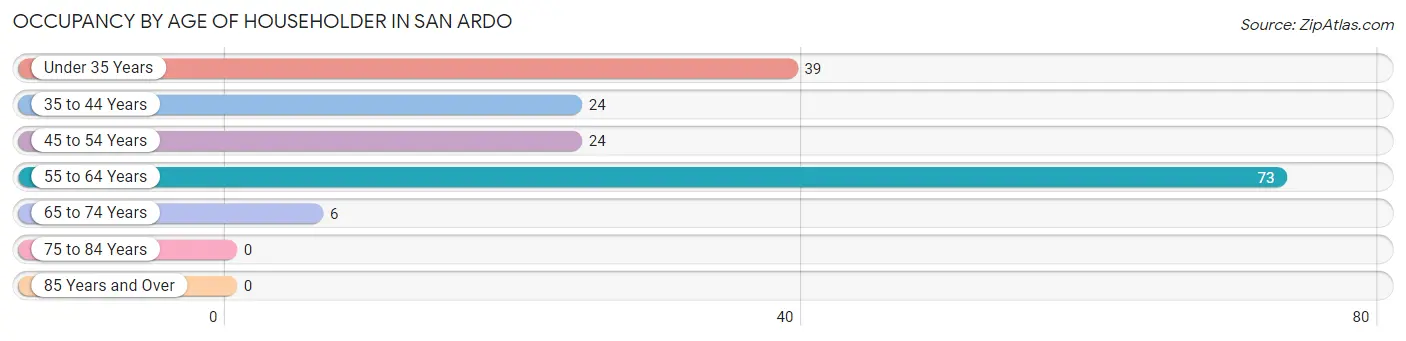
| Age Bracket | # Households | % Households |
| Under 35 Years | 39 | 23.5% |
| 35 to 44 Years | 24 | 14.5% |
| 45 to 54 Years | 24 | 14.5% |
| 55 to 64 Years | 73 | 44.0% |
| 65 to 74 Years | 6 | 3.6% |
| 75 to 84 Years | 0 | 0.0% |
| 85 Years and Over | 0 | 0.0% |
| Total | 166 | 100.0% |
Housing Finances in San Ardo
Median Income by Occupancy in San Ardo
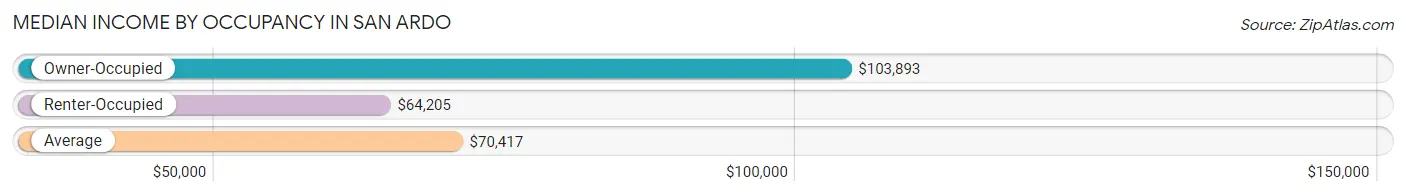
| Occupancy Type | # Households | Median Income |
| Owner-Occupied | 71 (42.8%) | $103,893 |
| Renter-Occupied | 95 (57.2%) | $64,205 |
| Average | 166 (100.0%) | $70,417 |
Occupancy by Householder Income Bracket in San Ardo
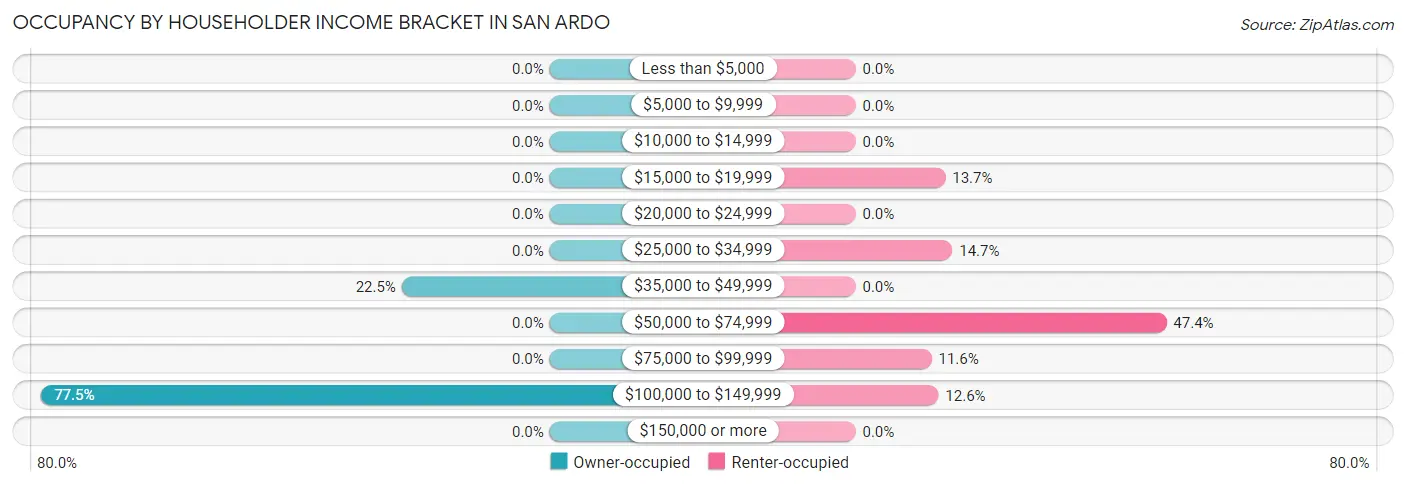
| Income Bracket | Owner-occupied | Renter-occupied |
| Less than $5,000 | 0 (0.0%) | 0 (0.0%) |
| $5,000 to $9,999 | 0 (0.0%) | 0 (0.0%) |
| $10,000 to $14,999 | 0 (0.0%) | 0 (0.0%) |
| $15,000 to $19,999 | 0 (0.0%) | 13 (13.7%) |
| $20,000 to $24,999 | 0 (0.0%) | 0 (0.0%) |
| $25,000 to $34,999 | 0 (0.0%) | 14 (14.7%) |
| $35,000 to $49,999 | 16 (22.5%) | 0 (0.0%) |
| $50,000 to $74,999 | 0 (0.0%) | 45 (47.4%) |
| $75,000 to $99,999 | 0 (0.0%) | 11 (11.6%) |
| $100,000 to $149,999 | 55 (77.5%) | 12 (12.6%) |
| $150,000 or more | 0 (0.0%) | 0 (0.0%) |
| Total | 71 (100.0%) | 95 (100.0%) |
Monthly Housing Cost Tiers in San Ardo
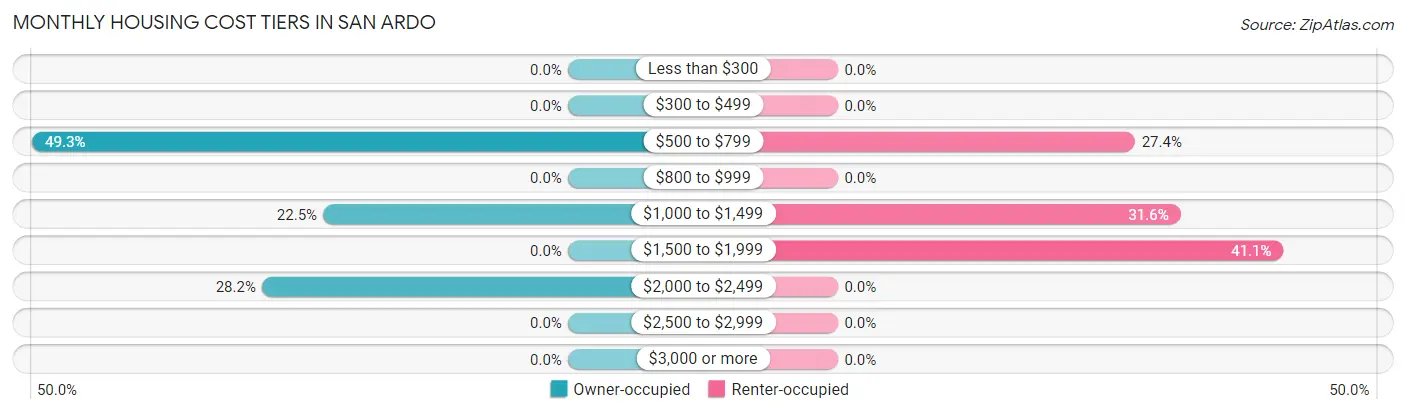
| Monthly Cost | Owner-occupied | Renter-occupied |
| Less than $300 | 0 (0.0%) | 0 (0.0%) |
| $300 to $499 | 0 (0.0%) | 0 (0.0%) |
| $500 to $799 | 35 (49.3%) | 26 (27.4%) |
| $800 to $999 | 0 (0.0%) | 0 (0.0%) |
| $1,000 to $1,499 | 16 (22.5%) | 30 (31.6%) |
| $1,500 to $1,999 | 0 (0.0%) | 39 (41.0%) |
| $2,000 to $2,499 | 20 (28.2%) | 0 (0.0%) |
| $2,500 to $2,999 | 0 (0.0%) | 0 (0.0%) |
| $3,000 or more | 0 (0.0%) | 0 (0.0%) |
| Total | 71 (100.0%) | 95 (100.0%) |
Physical Housing Characteristics in San Ardo
Housing Structures in San Ardo
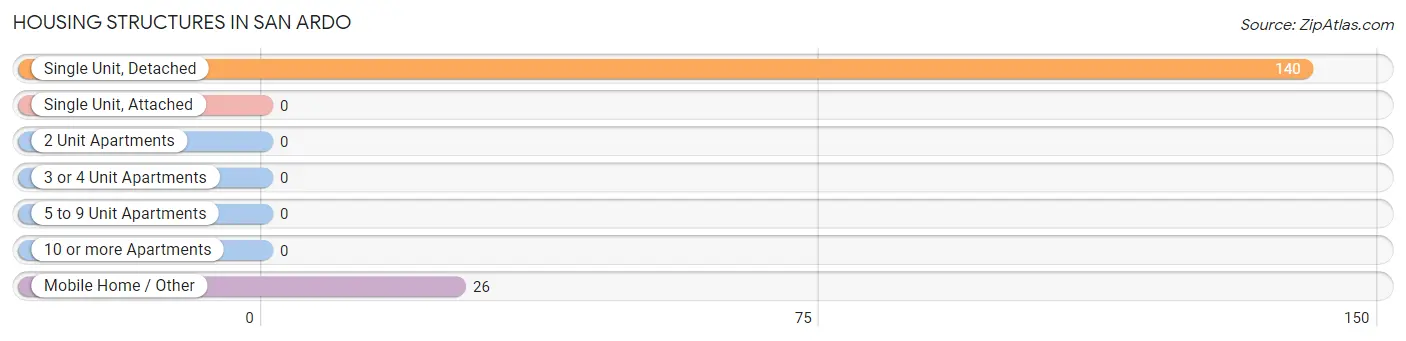
| Structure Type | # Housing Units | % Housing Units |
| Single Unit, Detached | 140 | 84.3% |
| Single Unit, Attached | 0 | 0.0% |
| 2 Unit Apartments | 0 | 0.0% |
| 3 or 4 Unit Apartments | 0 | 0.0% |
| 5 to 9 Unit Apartments | 0 | 0.0% |
| 10 or more Apartments | 0 | 0.0% |
| Mobile Home / Other | 26 | 15.7% |
| Total | 166 | 100.0% |
Housing Structures by Occupancy in San Ardo
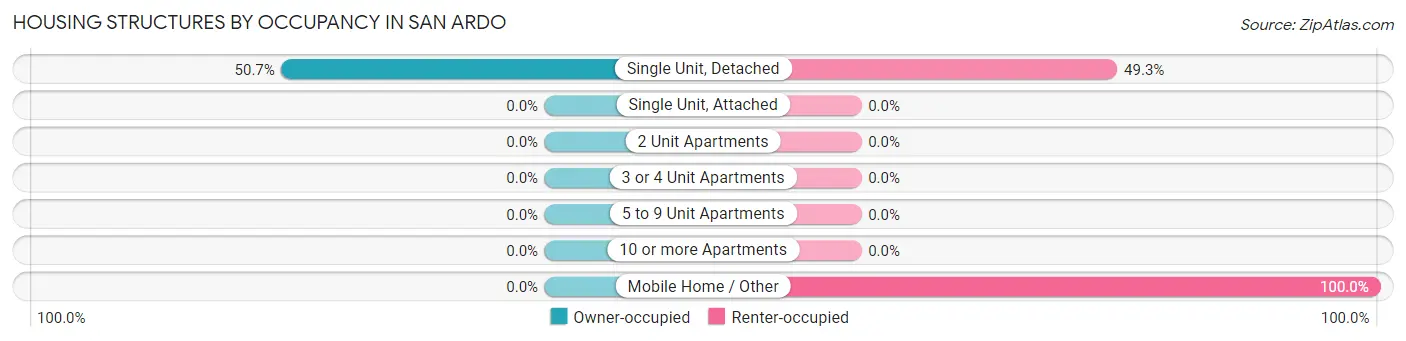
| Structure Type | Owner-occupied | Renter-occupied |
| Single Unit, Detached | 71 (50.7%) | 69 (49.3%) |
| Single Unit, Attached | 0 (0.0%) | 0 (0.0%) |
| 2 Unit Apartments | 0 (0.0%) | 0 (0.0%) |
| 3 or 4 Unit Apartments | 0 (0.0%) | 0 (0.0%) |
| 5 to 9 Unit Apartments | 0 (0.0%) | 0 (0.0%) |
| 10 or more Apartments | 0 (0.0%) | 0 (0.0%) |
| Mobile Home / Other | 0 (0.0%) | 26 (100.0%) |
| Total | 71 (42.8%) | 95 (57.2%) |
Housing Structures by Number of Rooms in San Ardo
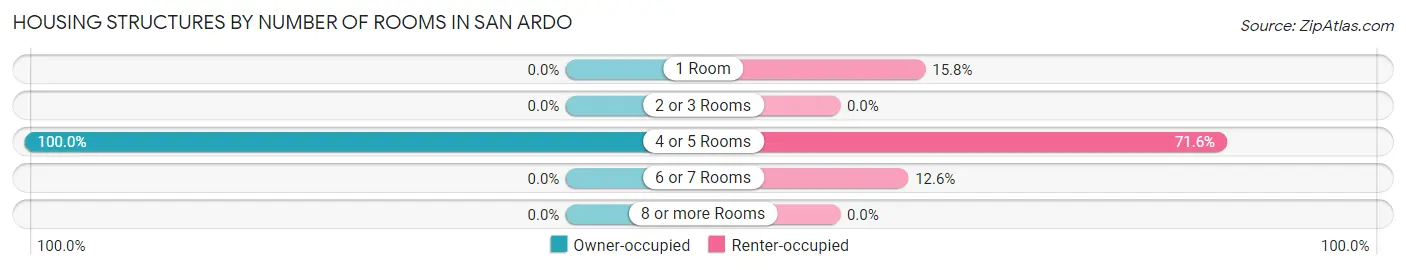
| Number of Rooms | Owner-occupied | Renter-occupied |
| 1 Room | 0 (0.0%) | 15 (15.8%) |
| 2 or 3 Rooms | 0 (0.0%) | 0 (0.0%) |
| 4 or 5 Rooms | 71 (100.0%) | 68 (71.6%) |
| 6 or 7 Rooms | 0 (0.0%) | 12 (12.6%) |
| 8 or more Rooms | 0 (0.0%) | 0 (0.0%) |
| Total | 71 (100.0%) | 95 (100.0%) |
Housing Structure by Heating Type in San Ardo
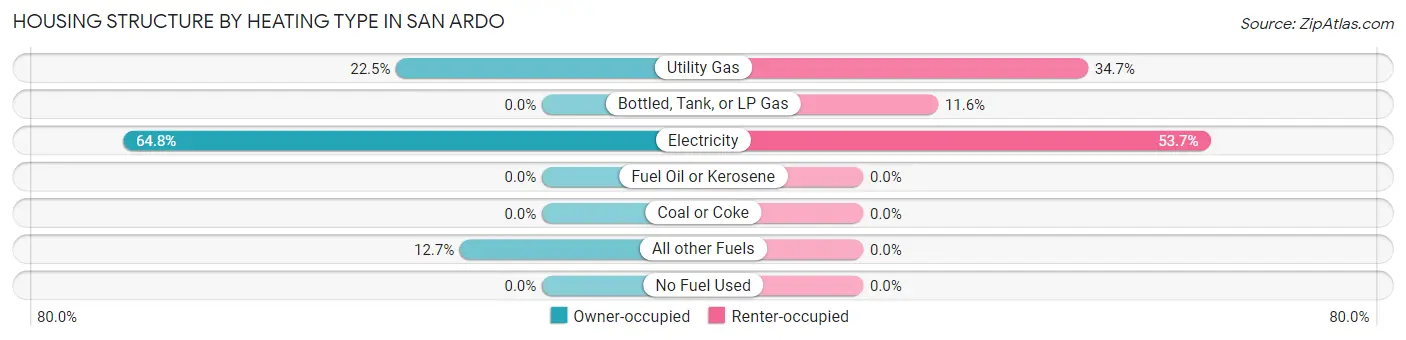
| Heating Type | Owner-occupied | Renter-occupied |
| Utility Gas | 16 (22.5%) | 33 (34.7%) |
| Bottled, Tank, or LP Gas | 0 (0.0%) | 11 (11.6%) |
| Electricity | 46 (64.8%) | 51 (53.7%) |
| Fuel Oil or Kerosene | 0 (0.0%) | 0 (0.0%) |
| Coal or Coke | 0 (0.0%) | 0 (0.0%) |
| All other Fuels | 9 (12.7%) | 0 (0.0%) |
| No Fuel Used | 0 (0.0%) | 0 (0.0%) |
| Total | 71 (100.0%) | 95 (100.0%) |
Household Vehicle Usage in San Ardo
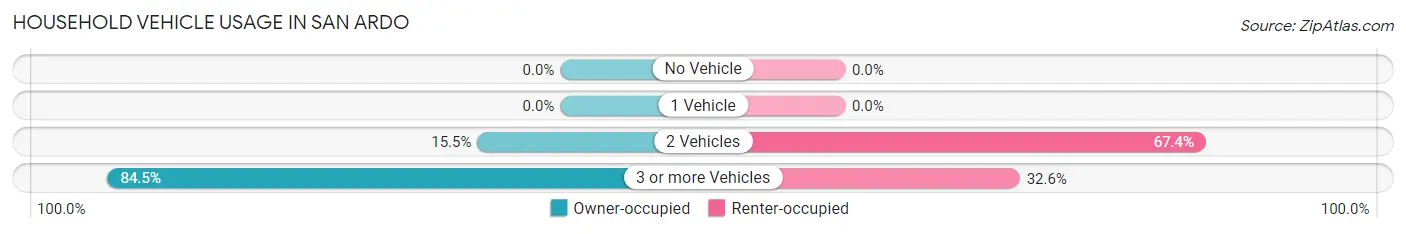
| Vehicles per Household | Owner-occupied | Renter-occupied |
| No Vehicle | 0 (0.0%) | 0 (0.0%) |
| 1 Vehicle | 0 (0.0%) | 0 (0.0%) |
| 2 Vehicles | 11 (15.5%) | 64 (67.4%) |
| 3 or more Vehicles | 60 (84.5%) | 31 (32.6%) |
| Total | 71 (100.0%) | 95 (100.0%) |
Real Estate & Mortgages in San Ardo
Real Estate and Mortgage Overview in San Ardo
| Characteristic | Without Mortgage | With Mortgage |
| Housing Units | 35 | 36 |
| Median Property Value | - | - |
| Median Household Income | - | - |
| Monthly Housing Costs | - | - |
| Real Estate Taxes | - | - |
Property Value by Mortgage Status in San Ardo
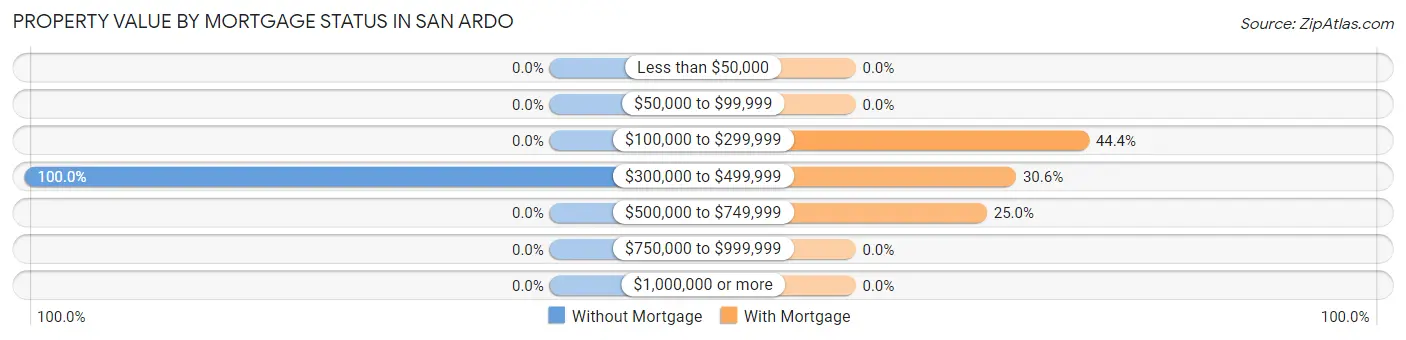
| Property Value | Without Mortgage | With Mortgage |
| Less than $50,000 | 0 (0.0%) | 0 (0.0%) |
| $50,000 to $99,999 | 0 (0.0%) | 0 (0.0%) |
| $100,000 to $299,999 | 0 (0.0%) | 16 (44.4%) |
| $300,000 to $499,999 | 35 (100.0%) | 11 (30.6%) |
| $500,000 to $749,999 | 0 (0.0%) | 9 (25.0%) |
| $750,000 to $999,999 | 0 (0.0%) | 0 (0.0%) |
| $1,000,000 or more | 0 (0.0%) | 0 (0.0%) |
| Total | 35 (100.0%) | 36 (100.0%) |
Household Income by Mortgage Status in San Ardo
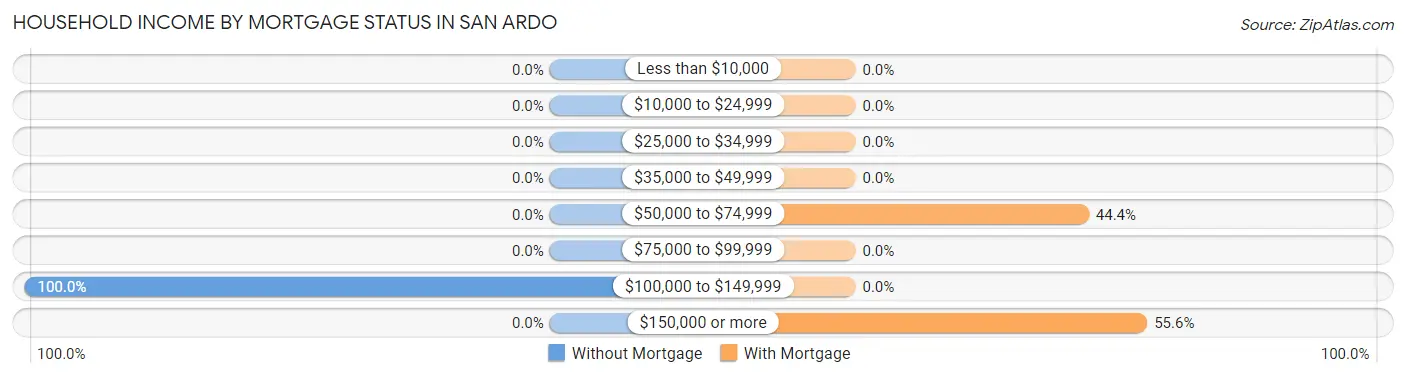
| Household Income | Without Mortgage | With Mortgage |
| Less than $10,000 | 0 (0.0%) | 0 (0.0%) |
| $10,000 to $24,999 | 0 (0.0%) | 0 (0.0%) |
| $25,000 to $34,999 | 0 (0.0%) | 0 (0.0%) |
| $35,000 to $49,999 | 0 (0.0%) | 0 (0.0%) |
| $50,000 to $74,999 | 0 (0.0%) | 16 (44.4%) |
| $75,000 to $99,999 | 0 (0.0%) | 0 (0.0%) |
| $100,000 to $149,999 | 35 (100.0%) | 0 (0.0%) |
| $150,000 or more | 0 (0.0%) | 20 (55.6%) |
| Total | 35 (100.0%) | 36 (100.0%) |
Property Value to Household Income Ratio in San Ardo
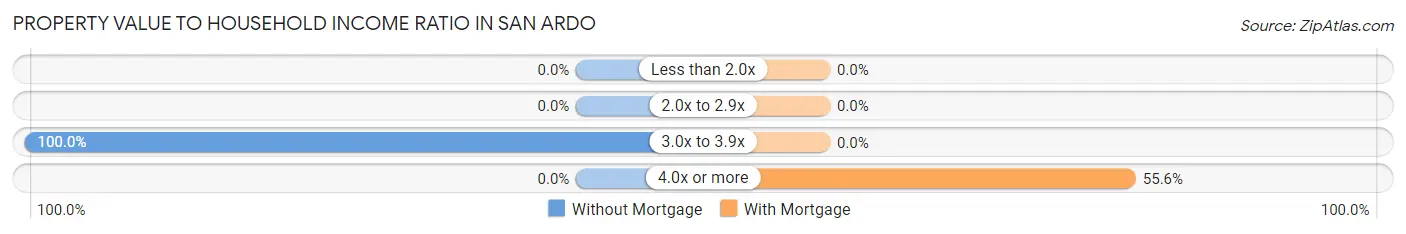
| Value-to-Income Ratio | Without Mortgage | With Mortgage |
| Less than 2.0x | 0 (0.0%) | 0 (0.0%) |
| 2.0x to 2.9x | 0 (0.0%) | 0 (0.0%) |
| 3.0x to 3.9x | 35 (100.0%) | 0 (0.0%) |
| 4.0x or more | 0 (0.0%) | 20 (55.6%) |
| Total | 35 (100.0%) | 36 (100.0%) |
Real Estate Taxes by Mortgage Status in San Ardo
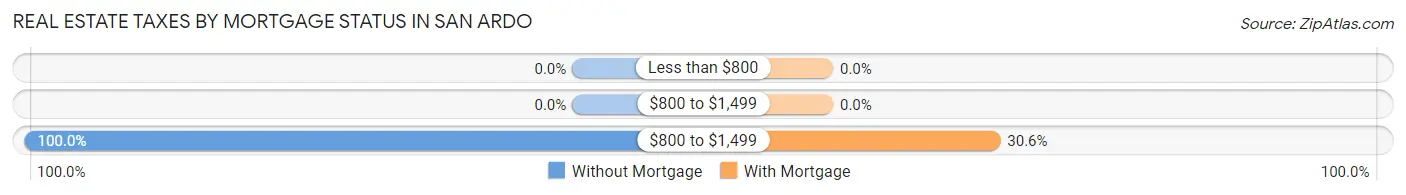
| Property Taxes | Without Mortgage | With Mortgage |
| Less than $800 | 0 (0.0%) | 0 (0.0%) |
| $800 to $1,499 | 0 (0.0%) | 0 (0.0%) |
| $800 to $1,499 | 35 (100.0%) | 11 (30.6%) |
| Total | 35 (100.0%) | 36 (100.0%) |
Health & Disability in San Ardo
Health Insurance Coverage by Age in San Ardo
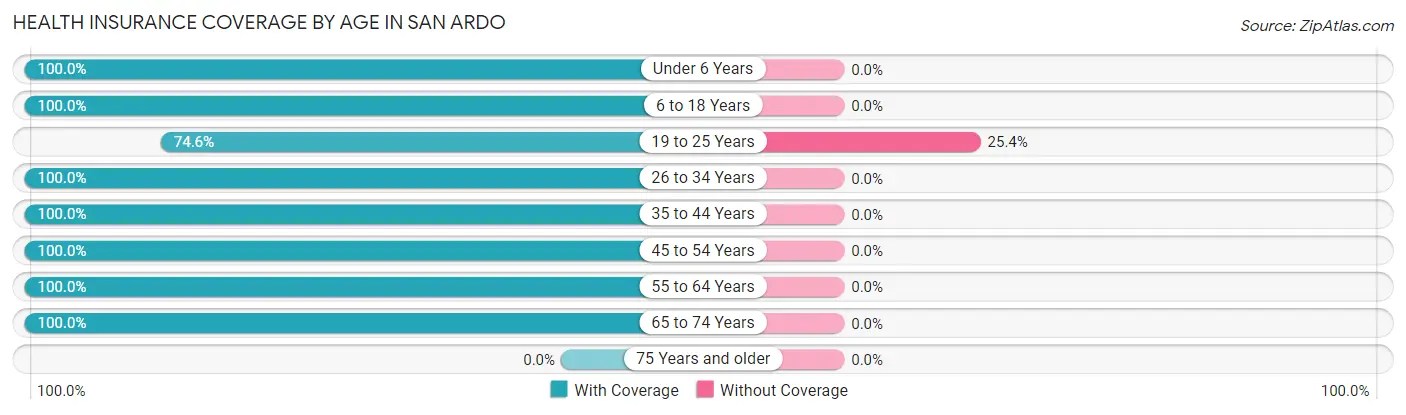
| Age Bracket | With Coverage | Without Coverage |
| Under 6 Years | 93 (100.0%) | 0 (0.0%) |
| 6 to 18 Years | 127 (100.0%) | 0 (0.0%) |
| 19 to 25 Years | 44 (74.6%) | 15 (25.4%) |
| 26 to 34 Years | 62 (100.0%) | 0 (0.0%) |
| 35 to 44 Years | 117 (100.0%) | 0 (0.0%) |
| 45 to 54 Years | 56 (100.0%) | 0 (0.0%) |
| 55 to 64 Years | 104 (100.0%) | 0 (0.0%) |
| 65 to 74 Years | 6 (100.0%) | 0 (0.0%) |
| 75 Years and older | 0 (0.0%) | 0 (0.0%) |
| Total | 609 (97.6%) | 15 (2.4%) |
Health Insurance Coverage by Citizenship Status in San Ardo
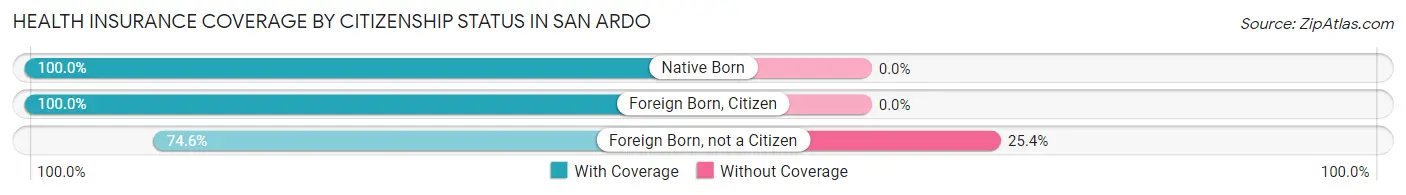
| Citizenship Status | With Coverage | Without Coverage |
| Native Born | 93 (100.0%) | 0 (0.0%) |
| Foreign Born, Citizen | 127 (100.0%) | 0 (0.0%) |
| Foreign Born, not a Citizen | 44 (74.6%) | 15 (25.4%) |
Health Insurance Coverage by Household Income in San Ardo
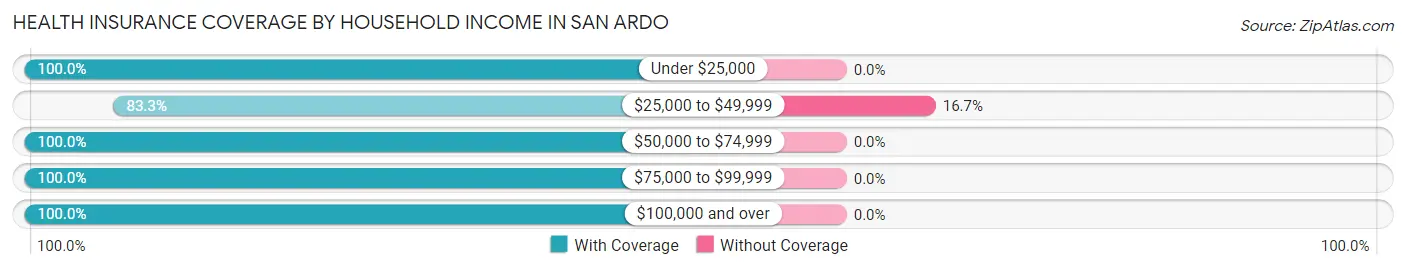
| Household Income | With Coverage | Without Coverage |
| Under $25,000 | 66 (100.0%) | 0 (0.0%) |
| $25,000 to $49,999 | 75 (83.3%) | 15 (16.7%) |
| $50,000 to $74,999 | 193 (100.0%) | 0 (0.0%) |
| $75,000 to $99,999 | 23 (100.0%) | 0 (0.0%) |
| $100,000 and over | 252 (100.0%) | 0 (0.0%) |
Public vs Private Health Insurance Coverage by Age in San Ardo
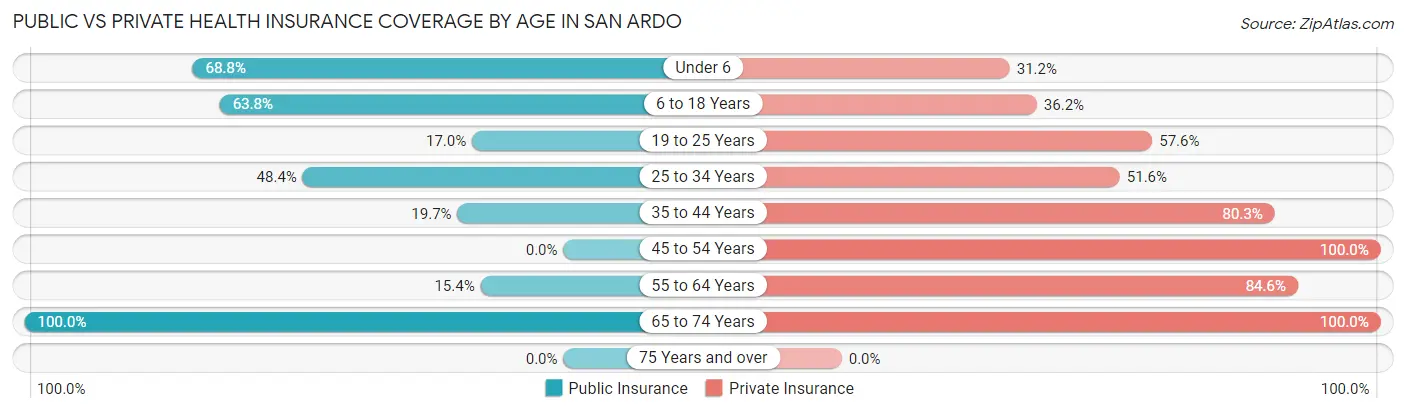
| Age Bracket | Public Insurance | Private Insurance |
| Under 6 | 64 (68.8%) | 29 (31.2%) |
| 6 to 18 Years | 81 (63.8%) | 46 (36.2%) |
| 19 to 25 Years | 10 (17.0%) | 34 (57.6%) |
| 25 to 34 Years | 30 (48.4%) | 32 (51.6%) |
| 35 to 44 Years | 23 (19.7%) | 94 (80.3%) |
| 45 to 54 Years | 0 (0.0%) | 56 (100.0%) |
| 55 to 64 Years | 16 (15.4%) | 88 (84.6%) |
| 65 to 74 Years | 6 (100.0%) | 6 (100.0%) |
| 75 Years and over | 0 (0.0%) | 0 (0.0%) |
| Total | 230 (36.9%) | 385 (61.7%) |
Disability Status by Sex by Age in San Ardo
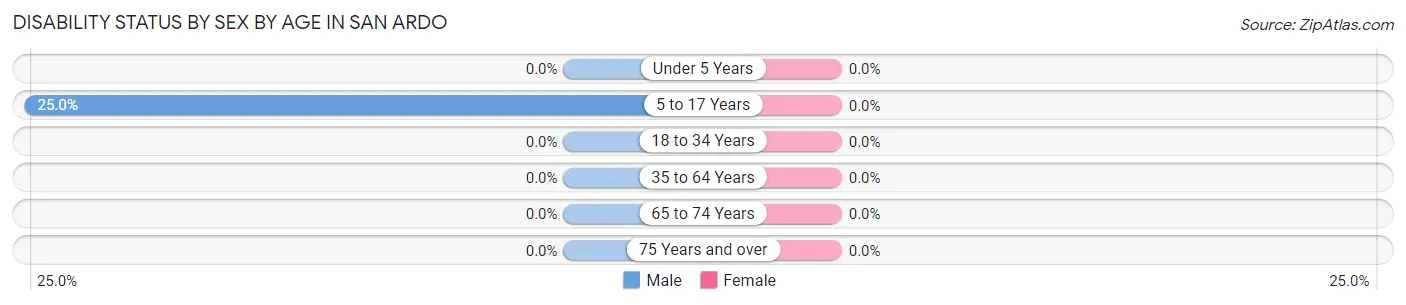
| Age Bracket | Male | Female |
| Under 5 Years | 0 (0.0%) | 0 (0.0%) |
| 5 to 17 Years | 13 (25.0%) | 0 (0.0%) |
| 18 to 34 Years | 0 (0.0%) | 0 (0.0%) |
| 35 to 64 Years | 0 (0.0%) | 0 (0.0%) |
| 65 to 74 Years | 0 (0.0%) | 0 (0.0%) |
| 75 Years and over | 0 (0.0%) | 0 (0.0%) |
Disability Class by Sex by Age in San Ardo
Disability Class: Hearing Difficulty
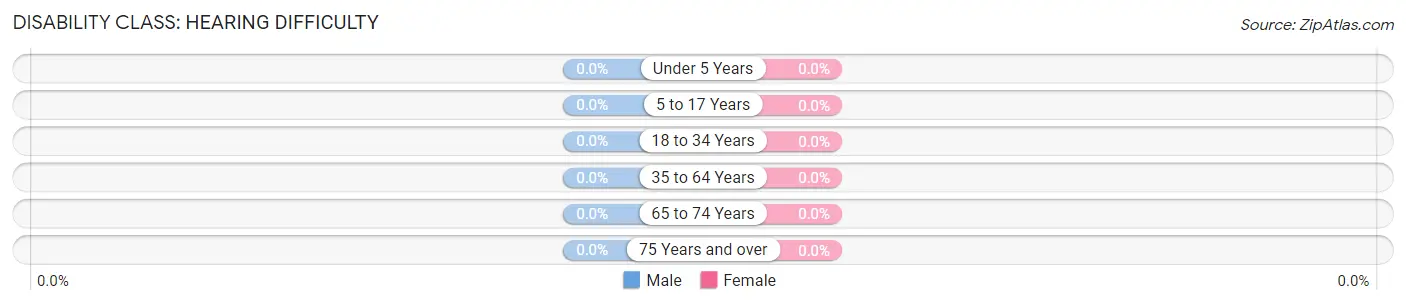
| Age Bracket | Male | Female |
| Under 5 Years | 0 (0.0%) | 0 (0.0%) |
| 5 to 17 Years | 0 (0.0%) | 0 (0.0%) |
| 18 to 34 Years | 0 (0.0%) | 0 (0.0%) |
| 35 to 64 Years | 0 (0.0%) | 0 (0.0%) |
| 65 to 74 Years | 0 (0.0%) | 0 (0.0%) |
| 75 Years and over | 0 (0.0%) | 0 (0.0%) |
Disability Class: Vision Difficulty
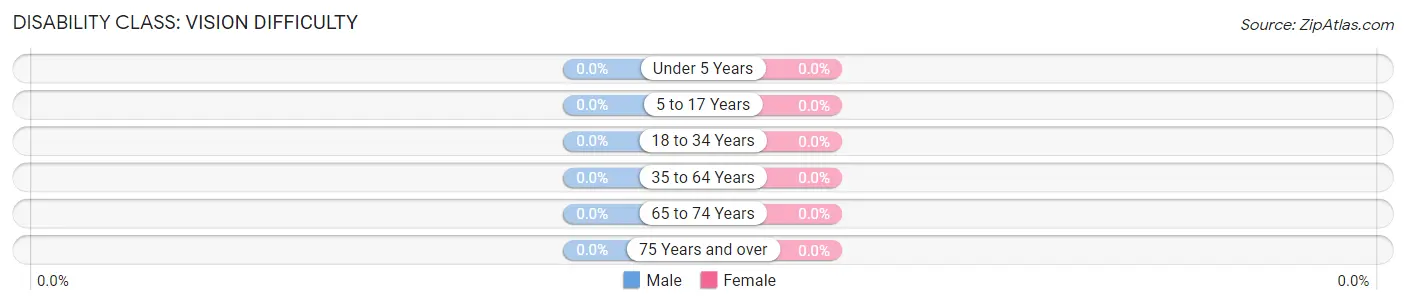
| Age Bracket | Male | Female |
| Under 5 Years | 0 (0.0%) | 0 (0.0%) |
| 5 to 17 Years | 0 (0.0%) | 0 (0.0%) |
| 18 to 34 Years | 0 (0.0%) | 0 (0.0%) |
| 35 to 64 Years | 0 (0.0%) | 0 (0.0%) |
| 65 to 74 Years | 0 (0.0%) | 0 (0.0%) |
| 75 Years and over | 0 (0.0%) | 0 (0.0%) |
Disability Class: Cognitive Difficulty
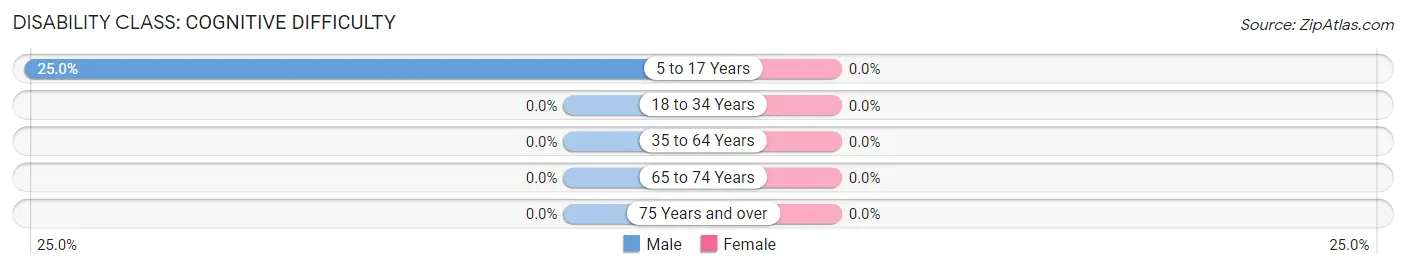
| Age Bracket | Male | Female |
| 5 to 17 Years | 13 (25.0%) | 0 (0.0%) |
| 18 to 34 Years | 0 (0.0%) | 0 (0.0%) |
| 35 to 64 Years | 0 (0.0%) | 0 (0.0%) |
| 65 to 74 Years | 0 (0.0%) | 0 (0.0%) |
| 75 Years and over | 0 (0.0%) | 0 (0.0%) |
Disability Class: Ambulatory Difficulty
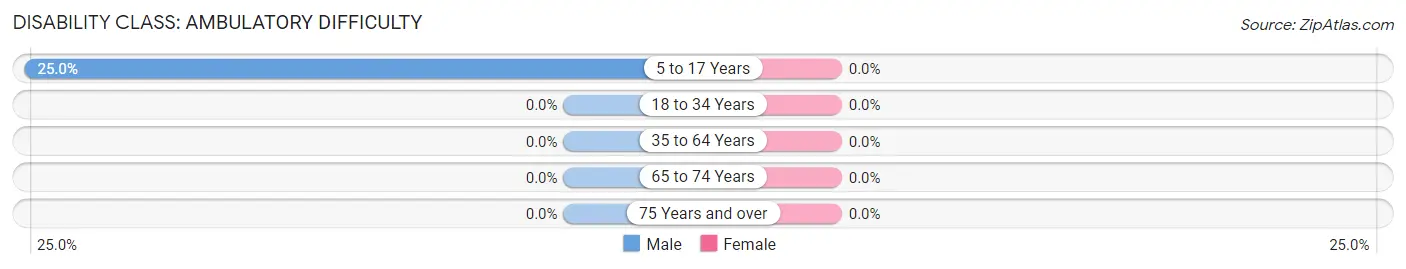
| Age Bracket | Male | Female |
| 5 to 17 Years | 13 (25.0%) | 0 (0.0%) |
| 18 to 34 Years | 0 (0.0%) | 0 (0.0%) |
| 35 to 64 Years | 0 (0.0%) | 0 (0.0%) |
| 65 to 74 Years | 0 (0.0%) | 0 (0.0%) |
| 75 Years and over | 0 (0.0%) | 0 (0.0%) |
Disability Class: Self-Care Difficulty

| Age Bracket | Male | Female |
| 5 to 17 Years | 13 (25.0%) | 0 (0.0%) |
| 18 to 34 Years | 0 (0.0%) | 0 (0.0%) |
| 35 to 64 Years | 0 (0.0%) | 0 (0.0%) |
| 65 to 74 Years | 0 (0.0%) | 0 (0.0%) |
| 75 Years and over | 0 (0.0%) | 0 (0.0%) |
Technology Access in San Ardo
Computing Device Access in San Ardo
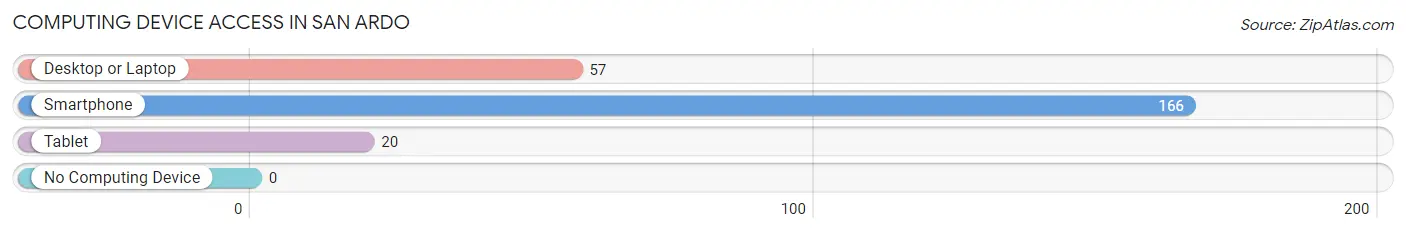
| Device Type | # Households | % Households |
| Desktop or Laptop | 57 | 34.3% |
| Smartphone | 166 | 100.0% |
| Tablet | 20 | 12.0% |
| No Computing Device | 0 | 0.0% |
| Total | 166 | 100.0% |
Internet Access in San Ardo
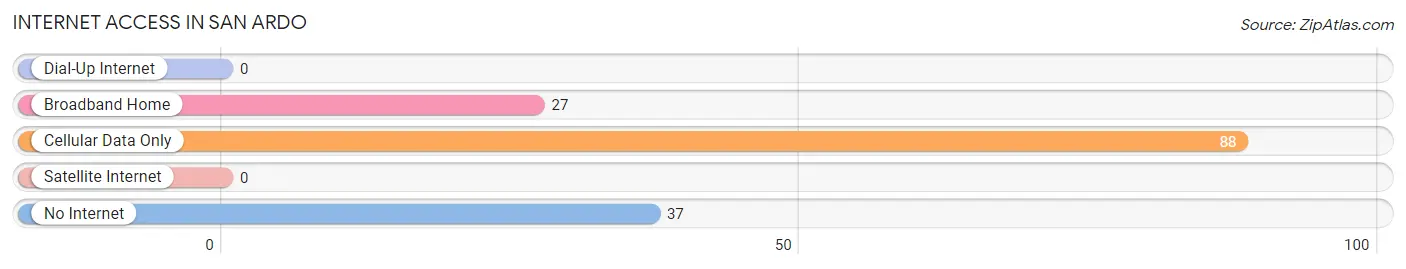
| Internet Type | # Households | % Households |
| Dial-Up Internet | 0 | 0.0% |
| Broadband Home | 27 | 16.3% |
| Cellular Data Only | 88 | 53.0% |
| Satellite Internet | 0 | 0.0% |
| No Internet | 37 | 22.3% |
| Total | 166 | 100.0% |
San Ardo Summary
San Ardo is a small unincorporated community located in Monterey County, California. It is situated in the Salinas Valley, approximately 20 miles south of King City and about 30 miles north of Paso Robles. The population of San Ardo was estimated to be 1,039 in 2019.
History
San Ardo was founded in 1868 by a group of Mexican settlers who were looking for a place to settle and farm. The town was named after San Ardo de Monterey, a mission founded in 1772 by Father Junipero Serra. The mission was abandoned in 1834, but the settlers of San Ardo kept the name.
The town grew slowly over the years, and by the early 1900s, it had become a thriving agricultural community. The main crops grown in the area were wheat, barley, and oats. In the 1920s, the town was home to a large dairy farm, and by the 1940s, it had become a major producer of wine grapes.
Geography
San Ardo is located in the Salinas Valley, which is part of the Central Coast region of California. The valley is surrounded by the Santa Lucia Mountains to the east and the Gabilan Range to the west. The climate in the area is Mediterranean, with mild winters and hot, dry summers.
The town is situated on the banks of the San Ardo River, which flows through the valley and empties into the Pacific Ocean. The river is a popular spot for fishing, swimming, and boating.
Economy
San Ardo’s economy is largely based on agriculture. The main crops grown in the area are grapes, lettuce, broccoli, and cauliflower. The town is also home to several wineries, which produce a variety of wines.
In addition to agriculture, San Ardo is home to several small businesses, including restaurants, shops, and a gas station. The town also has a post office and a library.
Demographics
As of 2019, the population of San Ardo was estimated to be 1,039. The racial makeup of the town was 79.3% White, 0.7% African American, 0.3% Native American, 0.2% Asian, 0.1% Pacific Islander, 16.2% from other races, and 3.4% from two or more races. Hispanic or Latino of any race were 33.2% of the population.
The median household income in San Ardo was $45,938 in 2019. The per capita income was $19,945. About 17.3% of the population was below the poverty line.
San Ardo is a small, rural community with a rich history and a strong agricultural economy. The town is home to a diverse population and offers a variety of recreational activities. It is a great place to live, work, and raise a family.
Common Questions
What is Per Capita Income in San Ardo?
Per Capita income in San Ardo is $20,745.
What is the Median Family Income in San Ardo?
Median Family Income in San Ardo is $83,068.
What is the Median Household income in San Ardo?
Median Household Income in San Ardo is $70,417.
What is Income or Wage Gap in San Ardo?
Income or Wage Gap in San Ardo is 60.6%.
Women in San Ardo earn 39.4 cents for every dollar earned by a man.
What is Inequality or Gini Index in San Ardo?
Inequality or Gini Index in San Ardo is 0.27.
What is the Total Population of San Ardo?
Total Population of San Ardo is 624.
What is the Total Male Population of San Ardo?
Total Male Population of San Ardo is 353.
What is the Total Female Population of San Ardo?
Total Female Population of San Ardo is 271.
What is the Ratio of Males per 100 Females in San Ardo?
There are 130.26 Males per 100 Females in San Ardo.
What is the Ratio of Females per 100 Males in San Ardo?
There are 76.77 Females per 100 Males in San Ardo.
What is the Median Population Age in San Ardo?
Median Population Age in San Ardo is 30.5 Years.
What is the Average Family Size in San Ardo
Average Family Size in San Ardo is 3.8 People.
What is the Average Household Size in San Ardo
Average Household Size in San Ardo is 3.8 People.
How Large is the Labor Force in San Ardo?
There are 326 People in the Labor Forcein in San Ardo.
What is the Percentage of People in the Labor Force in San Ardo?
72.4% of People are in the Labor Force in San Ardo.
What is the Unemployment Rate in San Ardo?
Unemployment Rate in San Ardo is 17.2%.