Cities with the Highest Percentage of Central American Population in Nebraska
RELATED REPORTS & OPTIONS
Central American
Nebraska
Compare Cities
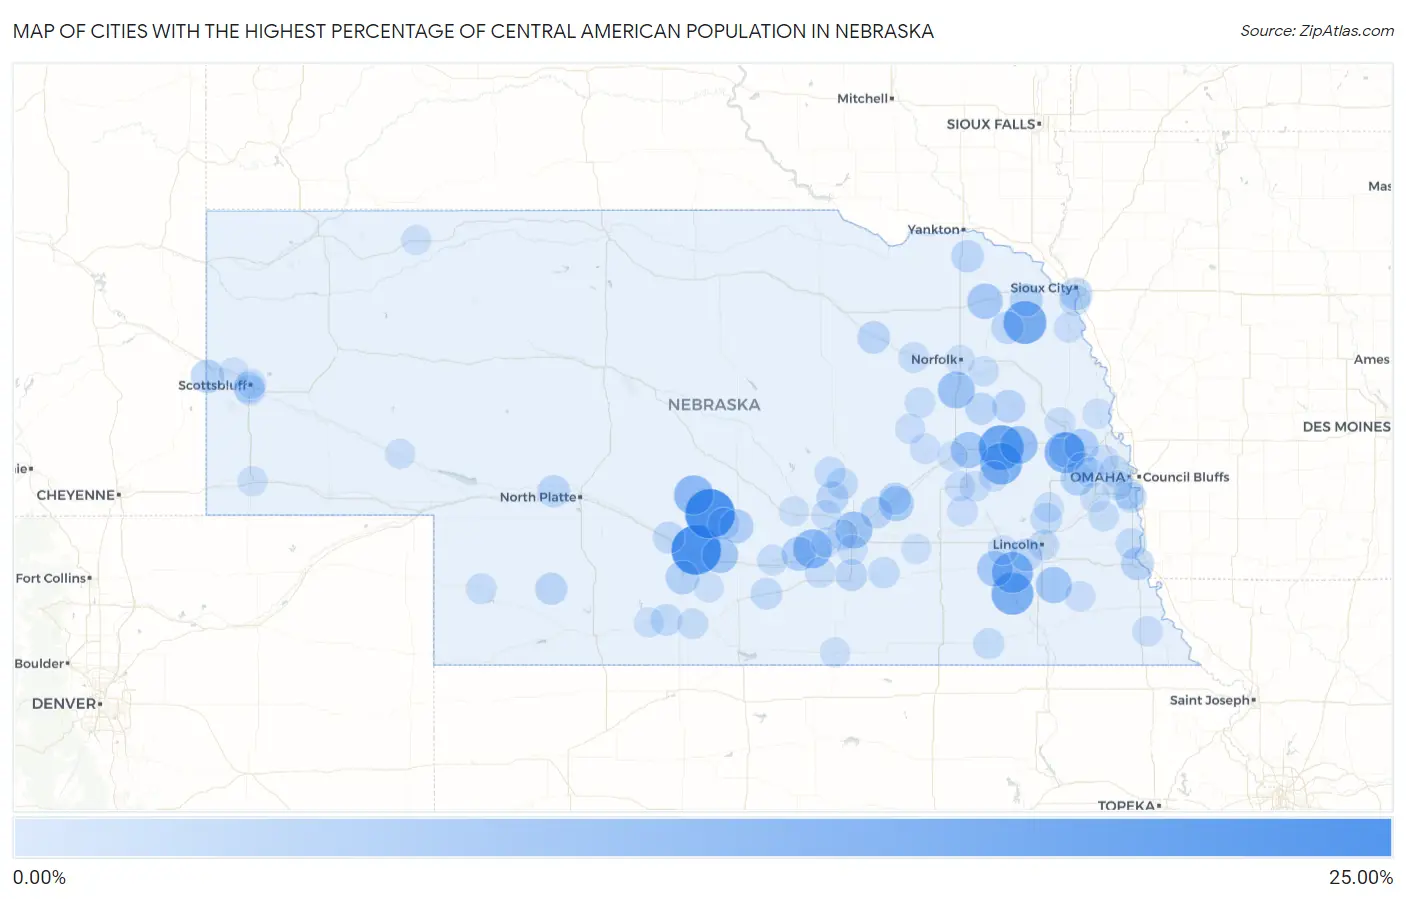
Map of Cities with the Highest Percentage of Central American Population in Nebraska
0.00%
25.00%
Cities with the Highest Percentage of Central American Population in Nebraska
| City | Central American | vs State | vs National | |
| 1. | Lexington | 24.53% | 1.61%(+22.9)#1 | 1.81%(+22.7)#101 |
| 2. | Eddyville | 24.49% | 1.61%(+22.9)#2 | 1.81%(+22.7)#102 |
| 3. | Schuyler | 18.31% | 1.61%(+16.7)#3 | 1.81%(+16.5)#181 |
| 4. | Wakefield | 16.03% | 1.61%(+14.4)#4 | 1.81%(+14.2)#214 |
| 5. | Wilber | 14.84% | 1.61%(+13.2)#5 | 1.81%(+13.0)#248 |
| 6. | Octavia | 14.47% | 1.61%(+12.9)#6 | 1.81%(+12.7)#261 |
| 7. | Inglewood | 13.50% | 1.61%(+11.9)#7 | 1.81%(+11.7)#287 |
| 8. | Crete | 13.49% | 1.61%(+11.9)#8 | 1.81%(+11.7)#288 |
| 9. | Oconto | 11.73% | 1.61%(+10.1)#9 | 1.81%(+9.92)#357 |
| 10. | Shelton | 10.88% | 1.61%(+9.27)#10 | 1.81%(+9.06)#392 |
| 11. | Rogers | 9.57% | 1.61%(+7.96)#11 | 1.81%(+7.76)#462 |
| 12. | Grand Island | 8.66% | 1.61%(+7.05)#12 | 1.81%(+6.85)#527 |
| 13. | Madison | 8.58% | 1.61%(+6.97)#13 | 1.81%(+6.77)#533 |
| 14. | Firth | 7.46% | 1.61%(+5.85)#14 | 1.81%(+5.65)#662 |
| 15. | Columbus | 7.41% | 1.61%(+5.80)#15 | 1.81%(+5.59)#668 |
| 16. | Overton | 7.37% | 1.61%(+5.75)#16 | 1.81%(+5.55)#673 |
| 17. | Dorchester | 6.95% | 1.61%(+5.34)#17 | 1.81%(+5.13)#728 |
| 18. | Fremont | 6.84% | 1.61%(+5.23)#18 | 1.81%(+5.03)#748 |
| 19. | Belden | 6.78% | 1.61%(+5.17)#19 | 1.81%(+4.97)#756 |
| 20. | Overland | 6.19% | 1.61%(+4.58)#20 | 1.81%(+4.37)#856 |
| 21. | Arlington | 5.60% | 1.61%(+3.99)#21 | 1.81%(+3.78)#981 |
| 22. | Gibbon | 5.21% | 1.61%(+3.60)#22 | 1.81%(+3.40)#1,075 |
| 23. | Miller | 5.11% | 1.61%(+3.50)#23 | 1.81%(+3.30)#1,099 |
| 24. | Elwood | 4.62% | 1.61%(+3.01)#24 | 1.81%(+2.81)#1,219 |
| 25. | Yutan | 4.55% | 1.61%(+2.94)#25 | 1.81%(+2.74)#1,241 |
| 26. | Lyman | 4.30% | 1.61%(+2.69)#26 | 1.81%(+2.49)#1,319 |
| 27. | Allen | 3.83% | 1.61%(+2.22)#27 | 1.81%(+2.02)#1,482 |
| 28. | Nebraska City | 3.68% | 1.61%(+2.07)#28 | 1.81%(+1.87)#1,540 |
| 29. | Howells | 3.58% | 1.61%(+1.97)#29 | 1.81%(+1.76)#1,584 |
| 30. | Denton | 3.29% | 1.61%(+1.68)#30 | 1.81%(+1.48)#1,737 |
| 31. | Clearwater | 3.25% | 1.61%(+1.64)#31 | 1.81%(+1.44)#1,756 |
| 32. | Wayne | 3.20% | 1.61%(+1.59)#32 | 1.81%(+1.38)#1,772 |
| 33. | Hershey | 2.99% | 1.61%(+1.38)#33 | 1.81%(+1.18)#1,886 |
| 34. | Fordyce | 2.95% | 1.61%(+1.34)#34 | 1.81%(+1.14)#1,912 |
| 35. | South Sioux City | 2.92% | 1.61%(+1.31)#35 | 1.81%(+1.11)#1,929 |
| 36. | Hayes Center | 2.82% | 1.61%(+1.21)#36 | 1.81%(+1.00)#1,996 |
| 37. | Hastings | 2.60% | 1.61%(+0.987)#37 | 1.81%(+0.785)#2,147 |
| 38. | Leigh | 2.56% | 1.61%(+0.954)#38 | 1.81%(+0.751)#2,177 |
| 39. | Central City | 2.54% | 1.61%(+0.927)#39 | 1.81%(+0.724)#2,194 |
| 40. | Dannebrog | 2.53% | 1.61%(+0.921)#40 | 1.81%(+0.719)#2,200 |
| 41. | Chapman | 2.51% | 1.61%(+0.898)#41 | 1.81%(+0.696)#2,219 |
| 42. | Sumner | 2.46% | 1.61%(+0.853)#42 | 1.81%(+0.650)#2,255 |
| 43. | Cozad | 2.41% | 1.61%(+0.799)#43 | 1.81%(+0.596)#2,289 |
| 44. | Axtell | 2.05% | 1.61%(+0.438)#44 | 1.81%(+0.236)#2,601 |
| 45. | Holbrook | 2.05% | 1.61%(+0.437)#45 | 1.81%(+0.235)#2,603 |
| 46. | Dakota City | 2.03% | 1.61%(+0.420)#46 | 1.81%(+0.217)#2,627 |
| 47. | Davey | 2.01% | 1.61%(+0.403)#47 | 1.81%(+0.200)#2,645 |
| 48. | Omaha | 1.69% | 1.61%(+0.077)#48 | 1.81%(-0.126)#3,037 |
| 49. | Terrytown | 1.68% | 1.61%(+0.070)#49 | 1.81%(-0.132)#3,047 |
| 50. | St Paul | 1.66% | 1.61%(+0.051)#50 | 1.81%(-0.152)#3,080 |
| 51. | Union | 1.65% | 1.61%(+0.042)#51 | 1.81%(-0.160)#3,093 |
| 52. | Harvard | 1.61% | 1.61%(-0.001)#52 | 1.81%(-0.203)#3,160 |
| 53. | Fairbury | 1.48% | 1.61%(-0.128)#53 | 1.81%(-0.331)#3,345 |
| 54. | Bellevue | 1.42% | 1.61%(-0.193)#54 | 1.81%(-0.395)#3,467 |
| 55. | Elba | 1.38% | 1.61%(-0.234)#55 | 1.81%(-0.437)#3,540 |
| 56. | Offutt Afb | 1.30% | 1.61%(-0.313)#56 | 1.81%(-0.516)#3,698 |
| 57. | Edison | 1.27% | 1.61%(-0.337)#57 | 1.81%(-0.539)#3,754 |
| 58. | Rising City | 1.19% | 1.61%(-0.424)#58 | 1.81%(-0.626)#3,905 |
| 59. | Tilden | 1.17% | 1.61%(-0.439)#59 | 1.81%(-0.642)#3,936 |
| 60. | Imperial | 1.09% | 1.61%(-0.523)#60 | 1.81%(-0.725)#4,140 |
| 61. | Alda | 1.07% | 1.61%(-0.545)#61 | 1.81%(-0.747)#4,188 |
| 62. | Newman Grove | 1.06% | 1.61%(-0.553)#62 | 1.81%(-0.756)#4,211 |
| 63. | Lincoln | 1.05% | 1.61%(-0.563)#63 | 1.81%(-0.766)#4,235 |
| 64. | Kearney | 1.01% | 1.61%(-0.599)#64 | 1.81%(-0.801)#4,330 |
| 65. | Gering | 0.98% | 1.61%(-0.632)#65 | 1.81%(-0.834)#4,400 |
| 66. | Kenesaw | 0.97% | 1.61%(-0.642)#66 | 1.81%(-0.844)#4,437 |
| 67. | Hooper | 0.82% | 1.61%(-0.794)#67 | 1.81%(-0.997)#4,911 |
| 68. | Genoa | 0.79% | 1.61%(-0.822)#68 | 1.81%(-1.02)#5,023 |
| 69. | Gresham | 0.72% | 1.61%(-0.891)#69 | 1.81%(-1.09)#5,262 |
| 70. | Stella | 0.72% | 1.61%(-0.891)#70 | 1.81%(-1.09)#5,263 |
| 71. | Sterling | 0.72% | 1.61%(-0.894)#71 | 1.81%(-1.10)#5,273 |
| 72. | Bennington | 0.66% | 1.61%(-0.953)#72 | 1.81%(-1.16)#5,489 |
| 73. | Wood River | 0.64% | 1.61%(-0.970)#73 | 1.81%(-1.17)#5,560 |
| 74. | Louisville | 0.60% | 1.61%(-1.01)#74 | 1.81%(-1.21)#5,733 |
| 75. | Stanton | 0.60% | 1.61%(-1.01)#75 | 1.81%(-1.22)#5,743 |
| 76. | Shelby | 0.59% | 1.61%(-1.02)#76 | 1.81%(-1.22)#5,759 |
| 77. | Winnebago | 0.58% | 1.61%(-1.04)#77 | 1.81%(-1.24)#5,840 |
| 78. | David City | 0.57% | 1.61%(-1.04)#78 | 1.81%(-1.25)#5,887 |
| 79. | St Edward | 0.50% | 1.61%(-1.11)#79 | 1.81%(-1.31)#6,190 |
| 80. | Duncan | 0.47% | 1.61%(-1.14)#80 | 1.81%(-1.34)#6,338 |
| 81. | Kimball | 0.47% | 1.61%(-1.15)#81 | 1.81%(-1.35)#6,370 |
| 82. | Cairo | 0.46% | 1.61%(-1.15)#82 | 1.81%(-1.35)#6,383 |
| 83. | Doniphan | 0.44% | 1.61%(-1.17)#83 | 1.81%(-1.38)#6,551 |
| 84. | Red Cloud | 0.44% | 1.61%(-1.17)#84 | 1.81%(-1.38)#6,554 |
| 85. | Cambridge | 0.43% | 1.61%(-1.18)#85 | 1.81%(-1.39)#6,610 |
| 86. | Ralston | 0.42% | 1.61%(-1.19)#86 | 1.81%(-1.40)#6,662 |
| 87. | Henderson | 0.42% | 1.61%(-1.19)#87 | 1.81%(-1.40)#6,663 |
| 88. | Norfolk | 0.41% | 1.61%(-1.20)#88 | 1.81%(-1.41)#6,716 |
| 89. | Scottsbluff | 0.40% | 1.61%(-1.21)#89 | 1.81%(-1.41)#6,737 |
| 90. | Mitchell | 0.36% | 1.61%(-1.25)#90 | 1.81%(-1.45)#6,943 |
| 91. | Milford | 0.36% | 1.61%(-1.25)#91 | 1.81%(-1.46)#6,991 |
| 92. | Ceresco | 0.35% | 1.61%(-1.26)#92 | 1.81%(-1.46)#7,013 |
| 93. | Gordon | 0.35% | 1.61%(-1.26)#93 | 1.81%(-1.46)#7,014 |
| 94. | Valley | 0.33% | 1.61%(-1.28)#94 | 1.81%(-1.48)#7,173 |
| 95. | Waterloo | 0.32% | 1.61%(-1.29)#95 | 1.81%(-1.49)#7,216 |
| 96. | Oshkosh | 0.31% | 1.61%(-1.30)#96 | 1.81%(-1.50)#7,297 |
| 97. | Bertrand | 0.29% | 1.61%(-1.32)#97 | 1.81%(-1.52)#7,421 |
| 98. | Gretna | 0.29% | 1.61%(-1.32)#98 | 1.81%(-1.52)#7,451 |
| 99. | Ravenna | 0.28% | 1.61%(-1.33)#99 | 1.81%(-1.53)#7,476 |
| 100. | Herman | 0.28% | 1.61%(-1.33)#100 | 1.81%(-1.54)#7,518 |
Common Questions
What are the Top 10 Cities with the Highest Percentage of Central American Population in Nebraska?
Top 10 Cities with the Highest Percentage of Central American Population in Nebraska are:
What city has the Highest Percentage of Central American Population in Nebraska?
Lexington has the Highest Percentage of Central American Population in Nebraska with 24.53%.
What is the Percentage of Central American Population in the State of Nebraska?
Percentage of Central American Population in Nebraska is 1.61%.
What is the Percentage of Central American Population in the United States?
Percentage of Central American Population in the United States is 1.81%.