Tara Hills, CA Map & Demographics
Tara Hills Map
Tara Hills Overview
$42,081
PER CAPITA INCOME
$121,585
AVG FAMILY INCOME
$113,333
AVG HOUSEHOLD INCOME
34.4%
WAGE / INCOME GAP [ % ]
65.6¢/ $1
WAGE / INCOME GAP [ $ ]
0.37
INEQUALITY / GINI INDEX
5,202
TOTAL POPULATION
2,473
MALE POPULATION
2,729
FEMALE POPULATION
90.62
MALES / 100 FEMALES
110.35
FEMALES / 100 MALES
39.3
MEDIAN AGE
3.3
AVG FAMILY SIZE
2.9
AVG HOUSEHOLD SIZE
3,000
LABOR FORCE [ PEOPLE ]
73.5%
PERCENT IN LABOR FORCE
4.5%
UNEMPLOYMENT RATE
Income in Tara Hills
Income Overview in Tara Hills
Per Capita Income in Tara Hills is $42,081, while median incomes of families and households are $121,585 and $113,333 respectively.
| Characteristic | Number | Measure |
| Per Capita Income | 5,202 | $42,081 |
| Median Family Income | 1,408 | $121,585 |
| Mean Family Income | 1,408 | $132,984 |
| Median Household Income | 1,772 | $113,333 |
| Mean Household Income | 1,772 | $120,489 |
| Income Deficit | 1,408 | $0 |
| Wage / Income Gap (%) | 5,202 | 34.35% |
| Wage / Income Gap ($) | 5,202 | 65.65¢ per $1 |
| Gini / Inequality Index | 5,202 | 0.37 |
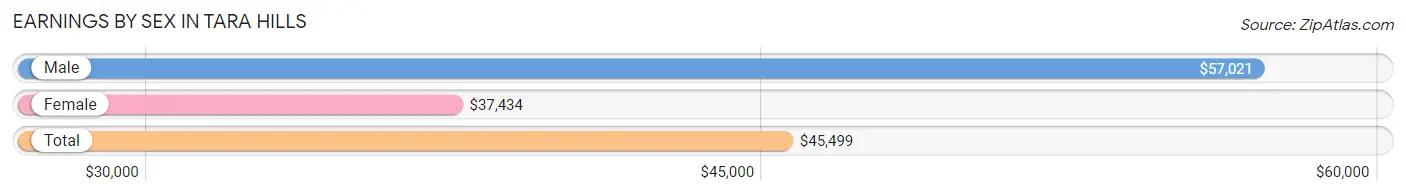
Earnings by Sex in Tara Hills
Average Earnings in Tara Hills are $45,499, $57,021 for men and $37,434 for women, a difference of 34.4%.
| Sex | Number | Average Earnings |
| Male | 1,568 (52.0%) | $57,021 |
| Female | 1,447 (48.0%) | $37,434 |
| Total | 3,015 (100.0%) | $45,499 |
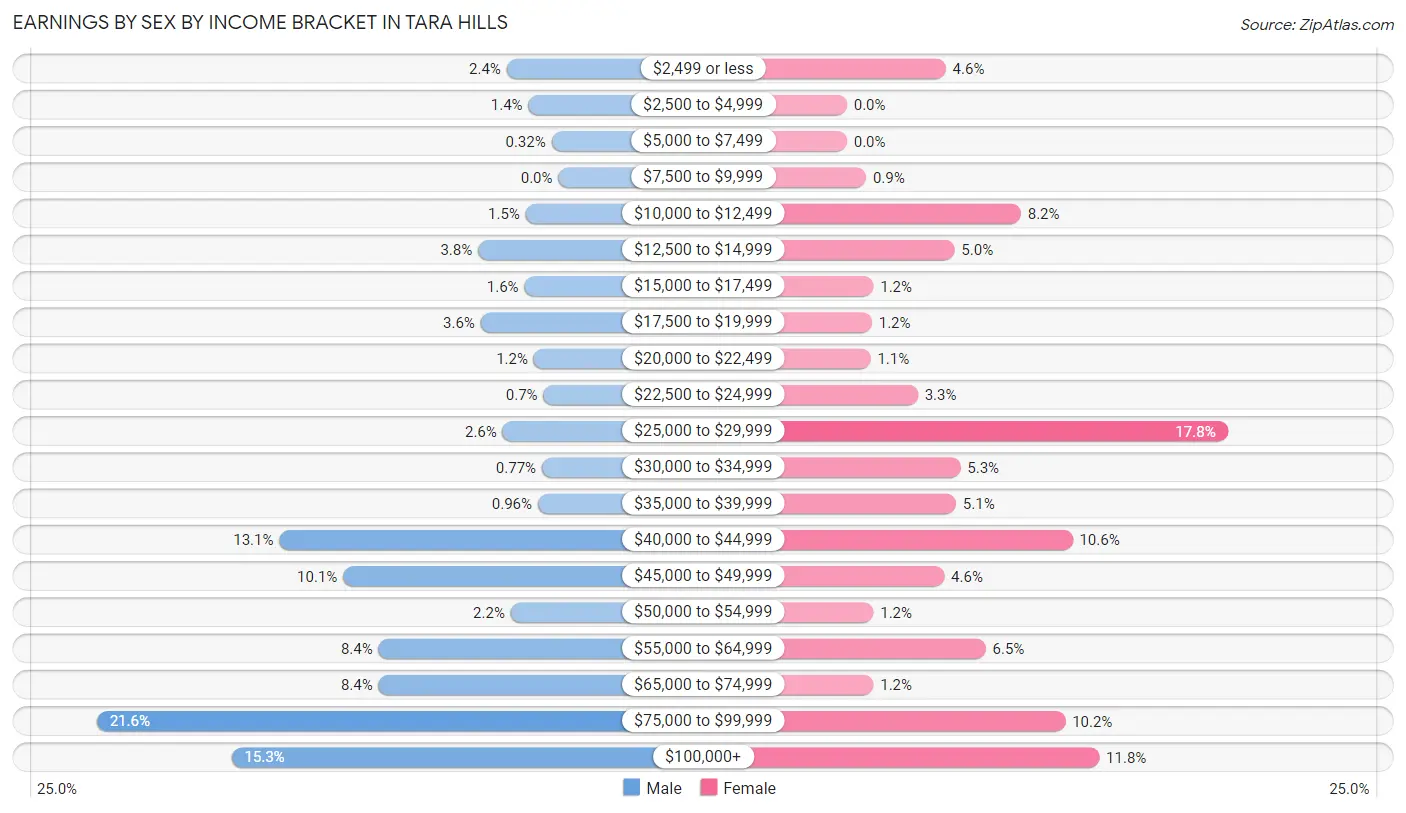
Earnings by Sex by Income Bracket in Tara Hills
The most common earnings brackets in Tara Hills are $75,000 to $99,999 for men (339 | 21.6%) and $25,000 to $29,999 for women (258 | 17.8%).
| Income | Male | Female |
| $2,499 or less | 38 (2.4%) | 67 (4.6%) |
| $2,500 to $4,999 | 22 (1.4%) | 0 (0.0%) |
| $5,000 to $7,499 | 5 (0.3%) | 0 (0.0%) |
| $7,500 to $9,999 | 0 (0.0%) | 13 (0.9%) |
| $10,000 to $12,499 | 24 (1.5%) | 118 (8.2%) |
| $12,500 to $14,999 | 59 (3.8%) | 73 (5.0%) |
| $15,000 to $17,499 | 25 (1.6%) | 18 (1.2%) |
| $17,500 to $19,999 | 57 (3.6%) | 17 (1.2%) |
| $20,000 to $22,499 | 18 (1.1%) | 16 (1.1%) |
| $22,500 to $24,999 | 11 (0.7%) | 48 (3.3%) |
| $25,000 to $29,999 | 41 (2.6%) | 258 (17.8%) |
| $30,000 to $34,999 | 12 (0.8%) | 77 (5.3%) |
| $35,000 to $39,999 | 15 (1.0%) | 74 (5.1%) |
| $40,000 to $44,999 | 205 (13.1%) | 153 (10.6%) |
| $45,000 to $49,999 | 158 (10.1%) | 66 (4.6%) |
| $50,000 to $54,999 | 35 (2.2%) | 18 (1.2%) |
| $55,000 to $64,999 | 132 (8.4%) | 94 (6.5%) |
| $65,000 to $74,999 | 132 (8.4%) | 18 (1.2%) |
| $75,000 to $99,999 | 339 (21.6%) | 148 (10.2%) |
| $100,000+ | 240 (15.3%) | 171 (11.8%) |
| Total | 1,568 (100.0%) | 1,447 (100.0%) |
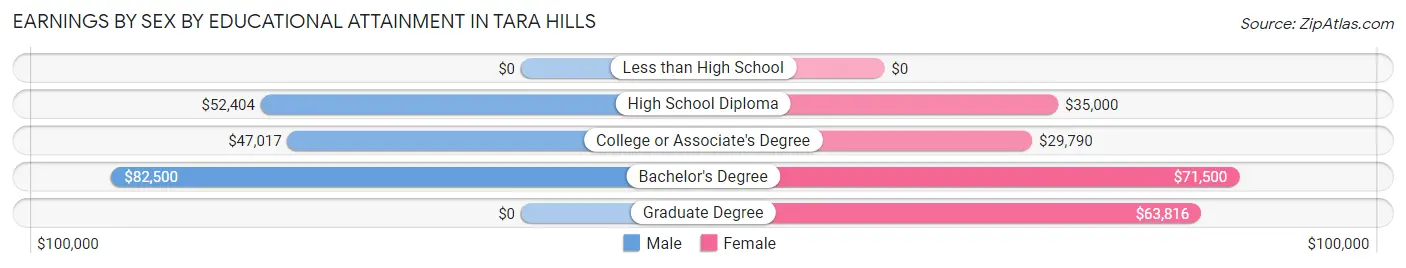
Earnings by Sex by Educational Attainment in Tara Hills
Average earnings in Tara Hills are $60,640 for men and $39,545 for women, a difference of 34.8%. Men with an educational attainment of bachelor's degree enjoy the highest average annual earnings of $82,500, while those with college or associate's degree education earn the least with $47,017. Women with an educational attainment of bachelor's degree earn the most with the average annual earnings of $71,500, while those with college or associate's degree education have the smallest earnings of $29,790.
| Educational Attainment | Male Income | Female Income |
| Less than High School | - | - |
| High School Diploma | $52,404 | $35,000 |
| College or Associate's Degree | $47,017 | $29,790 |
| Bachelor's Degree | $82,500 | $71,500 |
| Graduate Degree | - | - |
| Total | $60,640 | $39,545 |
Family Income in Tara Hills
Family Income Brackets in Tara Hills
According to the Tara Hills family income data, there are 529 families falling into the $100,000 to $149,999 income range, which is the most common income bracket and makes up 37.6% of all families. Conversely, the $15,000 to $24,999 income bracket is the least frequent group with only 13 families (0.9%) belonging to this category.
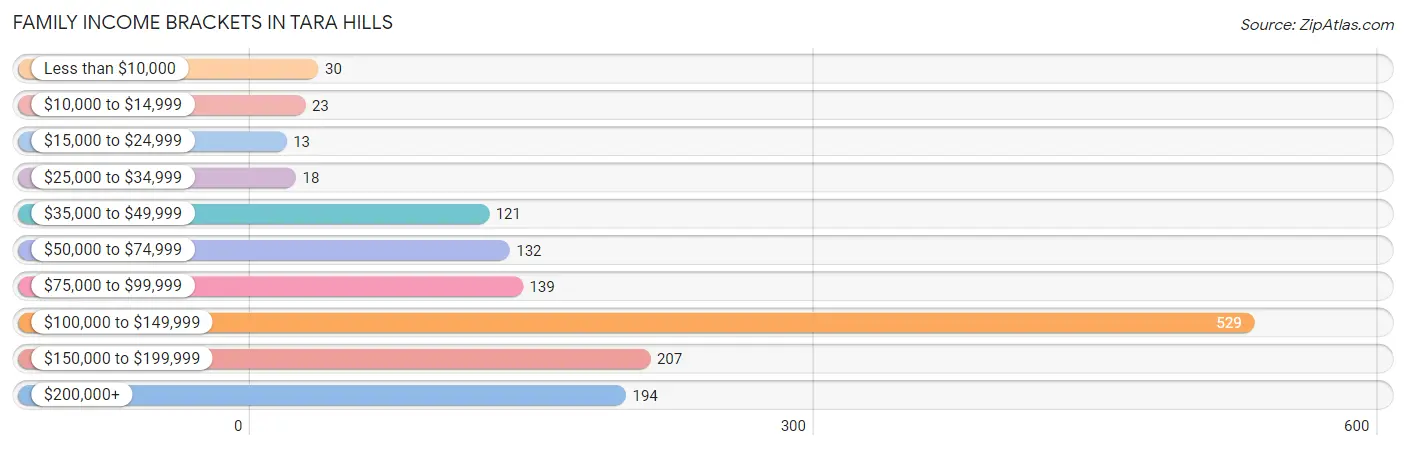
| Income Bracket | # Families | % Families |
| Less than $10,000 | 30 | 2.1% |
| $10,000 to $14,999 | 23 | 1.6% |
| $15,000 to $24,999 | 13 | 0.9% |
| $25,000 to $34,999 | 18 | 1.3% |
| $35,000 to $49,999 | 121 | 8.6% |
| $50,000 to $74,999 | 132 | 9.4% |
| $75,000 to $99,999 | 139 | 9.9% |
| $100,000 to $149,999 | 529 | 37.6% |
| $150,000 to $199,999 | 207 | 14.7% |
| $200,000+ | 194 | 13.8% |
Family Income by Famaliy Size in Tara Hills
3-person families (630 | 44.7%) account for the highest median family income in Tara Hills with $129,013 per family, while 2-person families (386 | 27.4%) have the highest median income of $55,084 per family member.
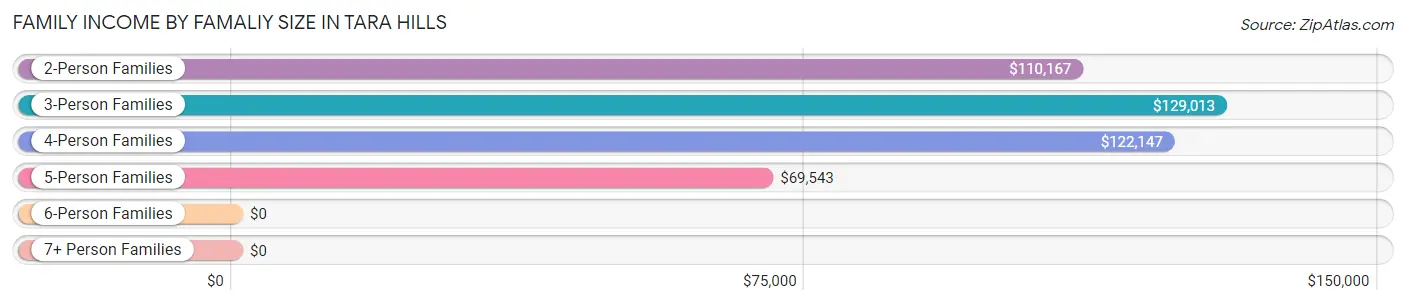
| Income Bracket | # Families | Median Income |
| 2-Person Families | 386 (27.4%) | $110,167 |
| 3-Person Families | 630 (44.7%) | $129,013 |
| 4-Person Families | 201 (14.3%) | $122,147 |
| 5-Person Families | 107 (7.6%) | $69,543 |
| 6-Person Families | 17 (1.2%) | $0 |
| 7+ Person Families | 67 (4.8%) | $0 |
| Total | 1,408 (100.0%) | $121,585 |
Family Income by Number of Earners in Tara Hills
The median family income in Tara Hills is $121,585, with families comprising 2 earners (741) having the highest median family income of $129,638, while families with no earners (130) have the lowest median family income of $42,734, accounting for 52.6% and 9.2% of families, respectively.
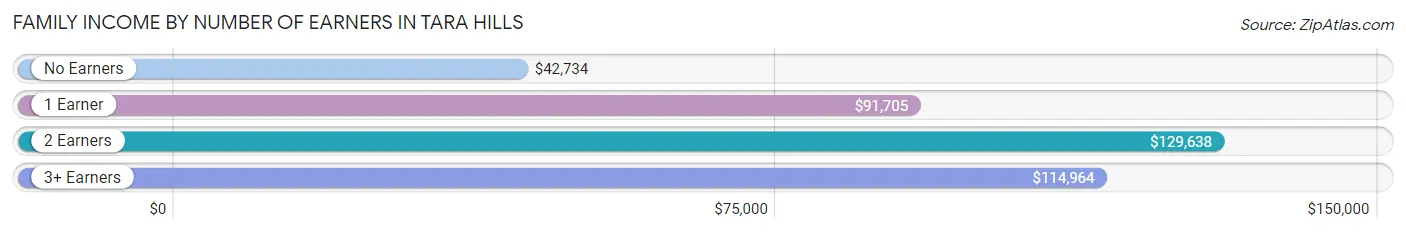
| Number of Earners | # Families | Median Income |
| No Earners | 130 (9.2%) | $42,734 |
| 1 Earner | 303 (21.5%) | $91,705 |
| 2 Earners | 741 (52.6%) | $129,638 |
| 3+ Earners | 234 (16.6%) | $114,964 |
| Total | 1,408 (100.0%) | $121,585 |
Household Income in Tara Hills
Household Income Brackets in Tara Hills
With 507 households falling in the category, the $100,000 to $149,999 income range is the most frequent in Tara Hills, accounting for 28.6% of all households. In contrast, only 44 households (2.5%) fall into the $15,000 to $24,999 income bracket, making it the least populous group.
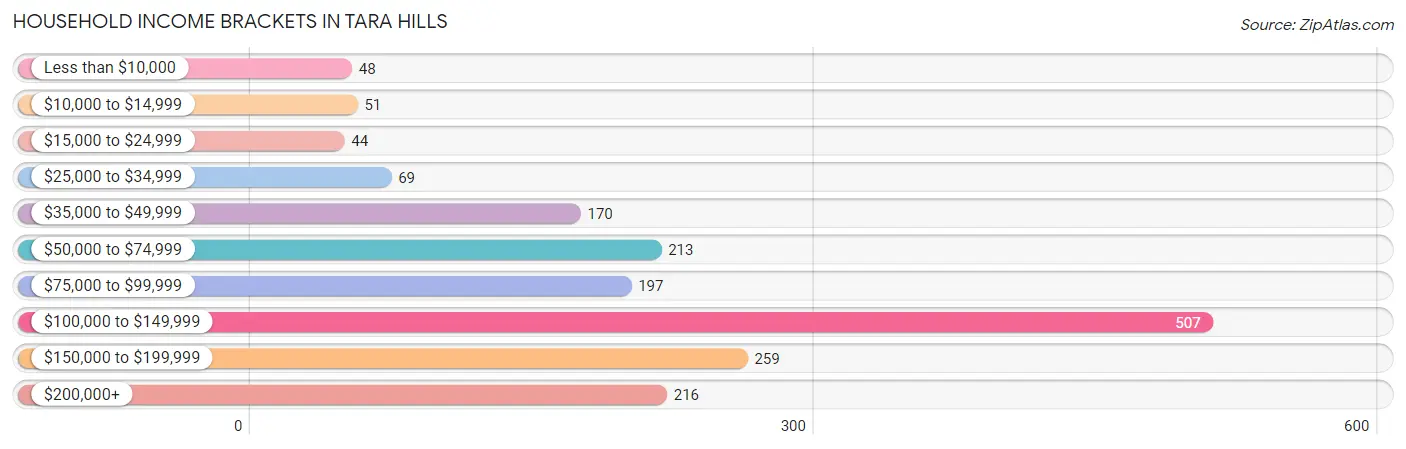
| Income Bracket | # Households | % Households |
| Less than $10,000 | 48 | 2.7% |
| $10,000 to $14,999 | 51 | 2.9% |
| $15,000 to $24,999 | 44 | 2.5% |
| $25,000 to $34,999 | 69 | 3.9% |
| $35,000 to $49,999 | 170 | 9.6% |
| $50,000 to $74,999 | 213 | 12.0% |
| $75,000 to $99,999 | 197 | 11.1% |
| $100,000 to $149,999 | 507 | 28.6% |
| $150,000 to $199,999 | 259 | 14.6% |
| $200,000+ | 216 | 12.2% |
Household Income by Householder Age in Tara Hills
The median household income in Tara Hills is $113,333, with the highest median household income of $129,497 found in the 25 to 44 years age bracket for the primary householder. A total of 591 households (33.4%) fall into this category. Meanwhile, the 15 to 24 years age bracket for the primary householder has the lowest median household income of $0, with 36 households (2.0%) in this group.
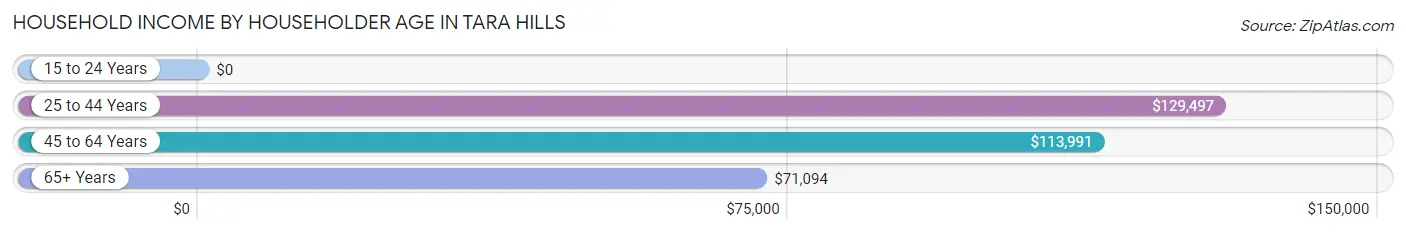
| Income Bracket | # Households | Median Income |
| 15 to 24 Years | 36 (2.0%) | $0 |
| 25 to 44 Years | 591 (33.4%) | $129,497 |
| 45 to 64 Years | 710 (40.1%) | $113,991 |
| 65+ Years | 435 (24.5%) | $71,094 |
| Total | 1,772 (100.0%) | $113,333 |
Poverty in Tara Hills
Income Below Poverty by Sex and Age in Tara Hills
With 5.7% poverty level for males and 5.1% for females among the residents of Tara Hills, 12 to 14 year old males and 5 year old females are the most vulnerable to poverty, with 21 males (19.3%) and 16 females (22.2%) in their respective age groups living below the poverty level.
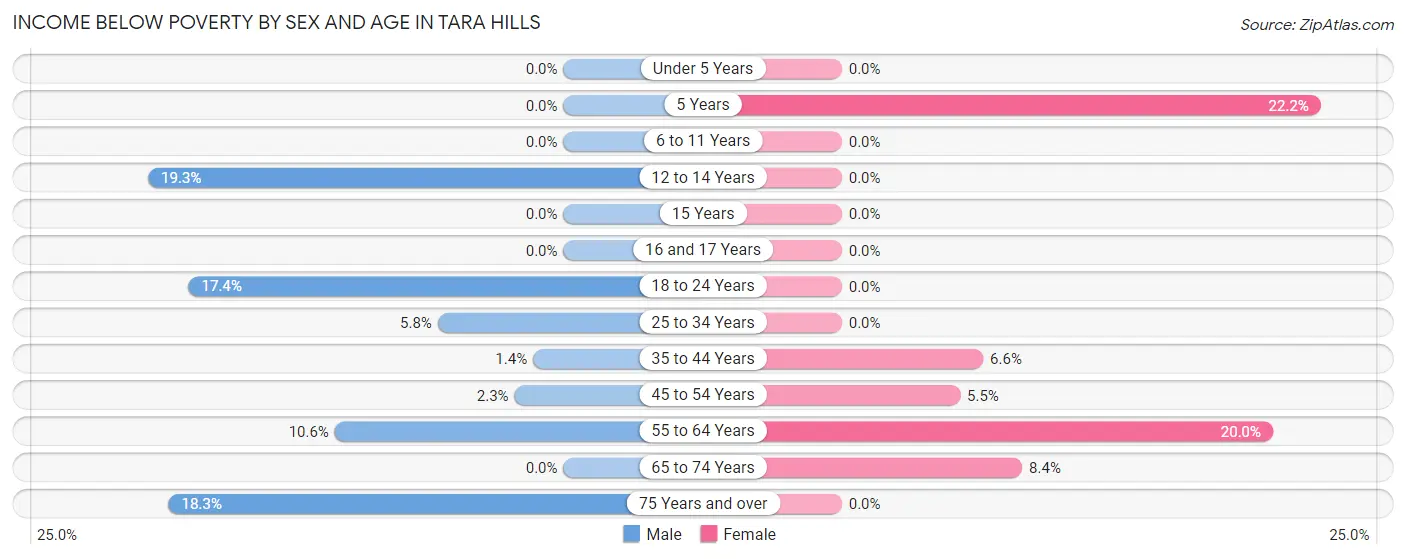
| Age Bracket | Male | Female |
| Under 5 Years | 0 (0.0%) | 0 (0.0%) |
| 5 Years | 0 (0.0%) | 16 (22.2%) |
| 6 to 11 Years | 0 (0.0%) | 0 (0.0%) |
| 12 to 14 Years | 21 (19.3%) | 0 (0.0%) |
| 15 Years | 0 (0.0%) | 0 (0.0%) |
| 16 and 17 Years | 0 (0.0%) | 0 (0.0%) |
| 18 to 24 Years | 28 (17.4%) | 0 (0.0%) |
| 25 to 34 Years | 19 (5.8%) | 0 (0.0%) |
| 35 to 44 Years | 6 (1.4%) | 16 (6.6%) |
| 45 to 54 Years | 8 (2.3%) | 29 (5.5%) |
| 55 to 64 Years | 35 (10.6%) | 58 (20.0%) |
| 65 to 74 Years | 0 (0.0%) | 19 (8.4%) |
| 75 Years and over | 24 (18.3%) | 0 (0.0%) |
| Total | 141 (5.7%) | 138 (5.1%) |
Income Above Poverty by Sex and Age in Tara Hills
According to the poverty statistics in Tara Hills, males aged under 5 years and females aged under 5 years are the age groups that are most secure financially, with 100.0% of males and 100.0% of females in these age groups living above the poverty line.
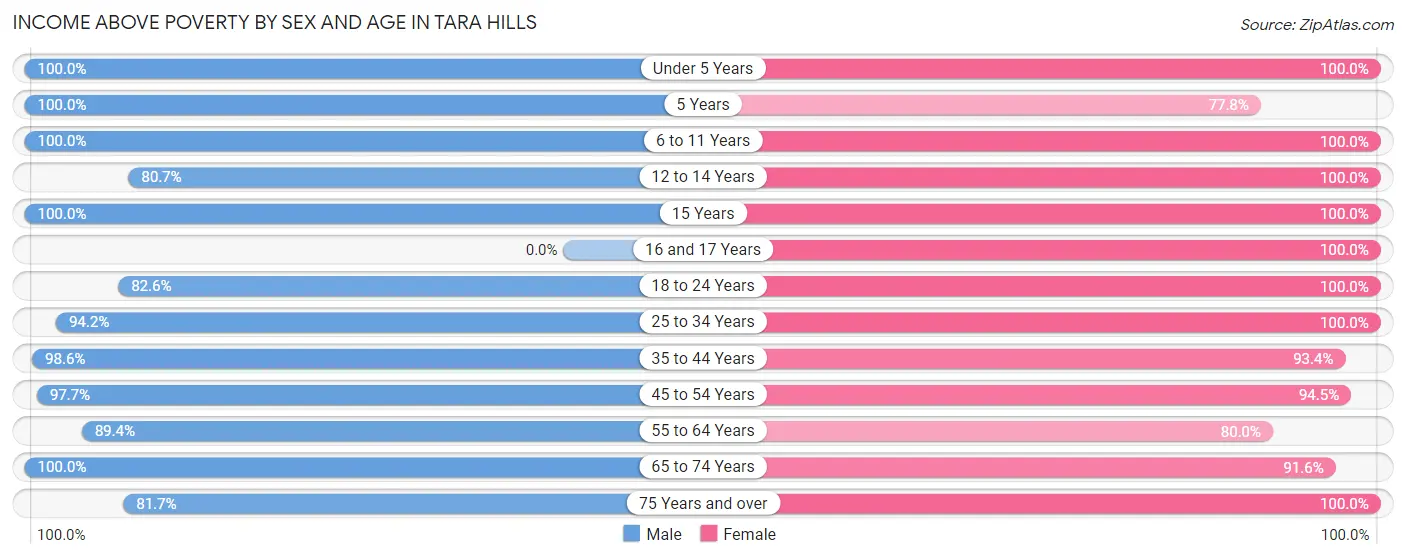
| Age Bracket | Male | Female |
| Under 5 Years | 196 (100.0%) | 230 (100.0%) |
| 5 Years | 55 (100.0%) | 56 (77.8%) |
| 6 to 11 Years | 113 (100.0%) | 96 (100.0%) |
| 12 to 14 Years | 88 (80.7%) | 157 (100.0%) |
| 15 Years | 8 (100.0%) | 84 (100.0%) |
| 16 and 17 Years | 0 (0.0%) | 72 (100.0%) |
| 18 to 24 Years | 133 (82.6%) | 192 (100.0%) |
| 25 to 34 Years | 307 (94.2%) | 376 (100.0%) |
| 35 to 44 Years | 420 (98.6%) | 228 (93.4%) |
| 45 to 54 Years | 345 (97.7%) | 499 (94.5%) |
| 55 to 64 Years | 295 (89.4%) | 232 (80.0%) |
| 65 to 74 Years | 265 (100.0%) | 208 (91.6%) |
| 75 Years and over | 107 (81.7%) | 160 (100.0%) |
| Total | 2,332 (94.3%) | 2,590 (94.9%) |
Income Below Poverty Among Married-Couple Families in Tara Hills
The poverty statistics for married-couple families in Tara Hills show that 1.3% or 13 of the total 976 families live below the poverty line. Families with no children have the highest poverty rate of 3.0%, comprising of 13 families. On the other hand, families with 1 or 2 children have the lowest poverty rate of 0.0%, which includes 0 families.
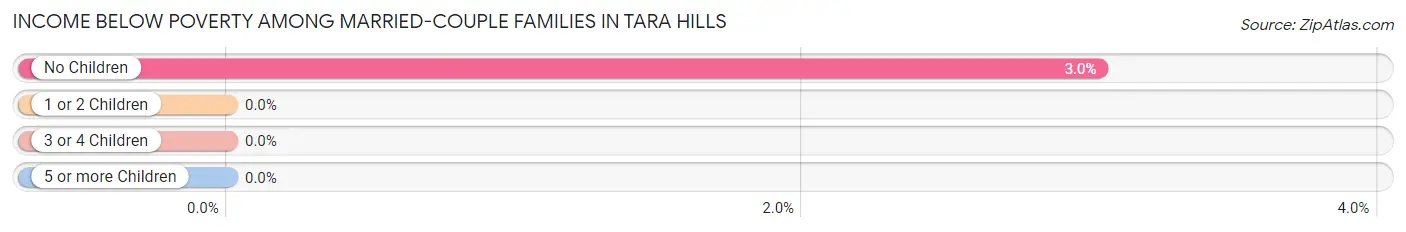
| Children | Above Poverty | Below Poverty |
| No Children | 416 (97.0%) | 13 (3.0%) |
| 1 or 2 Children | 529 (100.0%) | 0 (0.0%) |
| 3 or 4 Children | 18 (100.0%) | 0 (0.0%) |
| 5 or more Children | 0 (0.0%) | 0 (0.0%) |
| Total | 963 (98.7%) | 13 (1.3%) |
Income Below Poverty Among Single-Parent Households in Tara Hills
According to the poverty data in Tara Hills, 18.3% or 28 single-father households and 6.1% or 17 single-mother households are living below the poverty line. Among single-father households, those with 1 or 2 children have the highest poverty rate, with 22 households (44.0%) experiencing poverty. Likewise, among single-mother households, those with no children have the highest poverty rate, with 17 households (14.8%) falling below the poverty line.
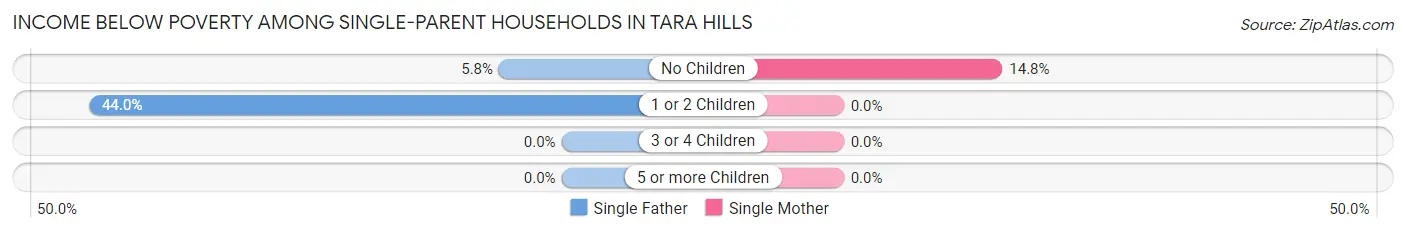
| Children | Single Father | Single Mother |
| No Children | 6 (5.8%) | 17 (14.8%) |
| 1 or 2 Children | 22 (44.0%) | 0 (0.0%) |
| 3 or 4 Children | 0 (0.0%) | 0 (0.0%) |
| 5 or more Children | 0 (0.0%) | 0 (0.0%) |
| Total | 28 (18.3%) | 17 (6.1%) |
Income Below Poverty Among Married-Couple vs Single-Parent Households in Tara Hills
The poverty data for Tara Hills shows that 13 of the married-couple family households (1.3%) and 45 of the single-parent households (10.4%) are living below the poverty level. Within the married-couple family households, those with no children have the highest poverty rate, with 13 households (3.0%) falling below the poverty line. Among the single-parent households, those with 1 or 2 children have the highest poverty rate, with 22 household (14.3%) living below poverty.
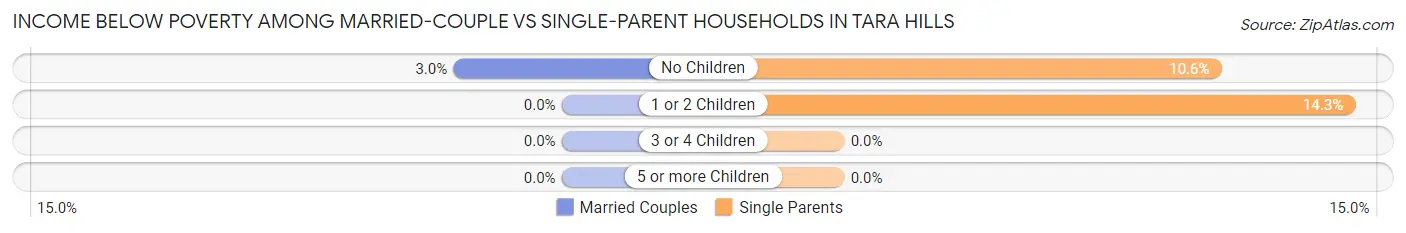
| Children | Married-Couple Families | Single-Parent Households |
| No Children | 13 (3.0%) | 23 (10.5%) |
| 1 or 2 Children | 0 (0.0%) | 22 (14.3%) |
| 3 or 4 Children | 0 (0.0%) | 0 (0.0%) |
| 5 or more Children | 0 (0.0%) | 0 (0.0%) |
| Total | 13 (1.3%) | 45 (10.4%) |
Race in Tara Hills
The most populous races in Tara Hills are Hispanic or Latino (2,039 | 39.2%), White / Caucasian (1,702 | 32.7%), and Asian (1,190 | 22.9%).
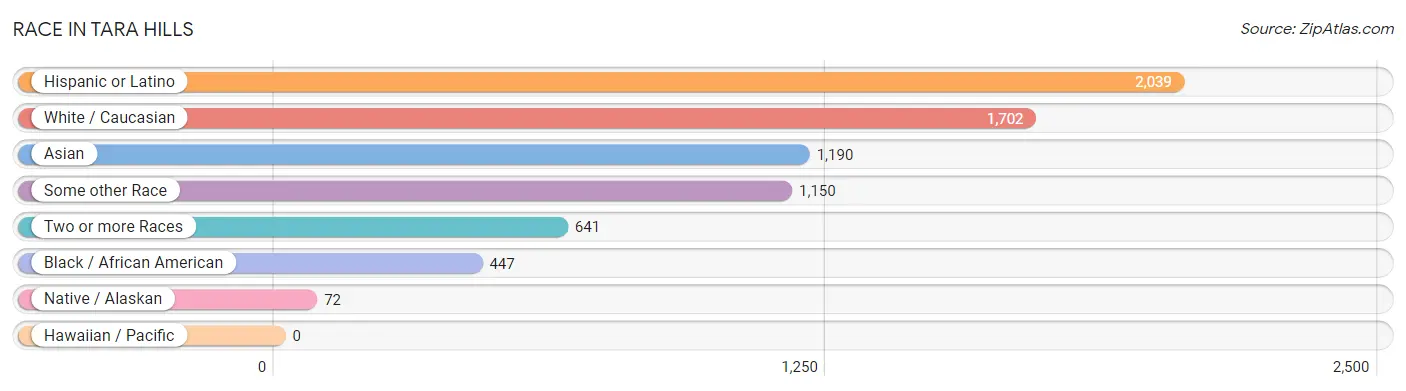
| Race | # Population | % Population |
| Asian | 1,190 | 22.9% |
| Black / African American | 447 | 8.6% |
| Hawaiian / Pacific | 0 | 0.0% |
| Hispanic or Latino | 2,039 | 39.2% |
| Native / Alaskan | 72 | 1.4% |
| White / Caucasian | 1,702 | 32.7% |
| Two or more Races | 641 | 12.3% |
| Some other Race | 1,150 | 22.1% |
| Total | 5,202 | 100.0% |
Ancestry in Tara Hills
The most populous ancestries reported in Tara Hills are Mexican (1,598 | 30.7%), Indian (Asian) (412 | 7.9%), Central American (351 | 6.8%), Salvadoran (326 | 6.3%), and English (325 | 6.2%), together accounting for 57.9% of all Tara Hills residents.
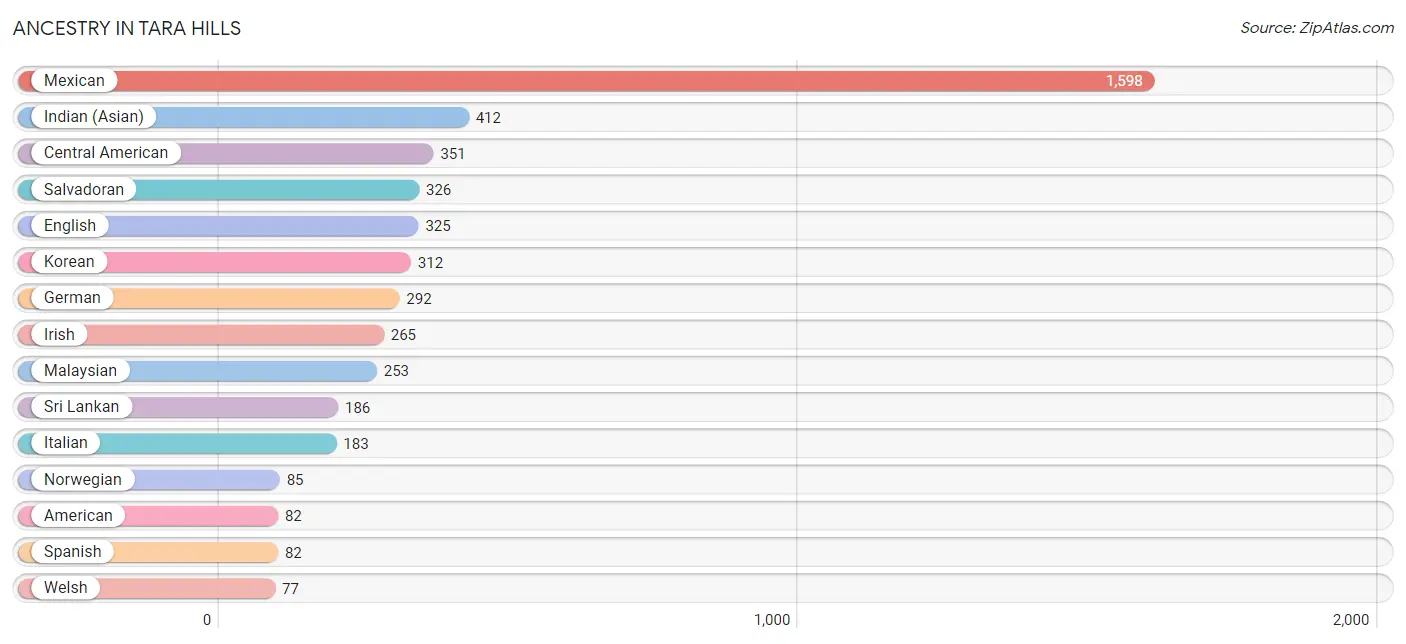
| Ancestry | # Population | % Population |
| Alsatian | 3 | 0.1% |
| American | 82 | 1.6% |
| Bhutanese | 46 | 0.9% |
| Burmese | 14 | 0.3% |
| Cambodian | 34 | 0.6% |
| Central American | 351 | 6.8% |
| Cherokee | 9 | 0.2% |
| Choctaw | 12 | 0.2% |
| Creek | 23 | 0.4% |
| Danish | 8 | 0.2% |
| Dutch | 8 | 0.2% |
| English | 325 | 6.2% |
| Ethiopian | 34 | 0.6% |
| European | 43 | 0.8% |
| Finnish | 54 | 1.0% |
| French | 52 | 1.0% |
| German | 292 | 5.6% |
| Guatemalan | 25 | 0.5% |
| Indian (Asian) | 412 | 7.9% |
| Iranian | 9 | 0.2% |
| Irish | 265 | 5.1% |
| Italian | 183 | 3.5% |
| Korean | 312 | 6.0% |
| Lithuanian | 7 | 0.1% |
| Malaysian | 253 | 4.9% |
| Mexican | 1,598 | 30.7% |
| Native Hawaiian | 20 | 0.4% |
| Nepalese | 63 | 1.2% |
| Northern European | 13 | 0.3% |
| Norwegian | 85 | 1.6% |
| Pakistani | 20 | 0.4% |
| Polish | 26 | 0.5% |
| Portuguese | 33 | 0.6% |
| Russian | 8 | 0.2% |
| Salvadoran | 326 | 6.3% |
| Scotch-Irish | 8 | 0.2% |
| Scottish | 10 | 0.2% |
| Seminole | 6 | 0.1% |
| Slovene | 36 | 0.7% |
| Spanish | 82 | 1.6% |
| Sri Lankan | 186 | 3.6% |
| Subsaharan African | 34 | 0.6% |
| Swedish | 25 | 0.5% |
| Welsh | 77 | 1.5% | View All 44 Rows |
Immigrants in Tara Hills
The most numerous immigrant groups reported in Tara Hills came from Central America (754 | 14.5%), Latin America (754 | 14.5%), Asia (733 | 14.1%), Mexico (566 | 10.9%), and South Eastern Asia (466 | 9.0%), together accounting for 62.9% of all Tara Hills residents.
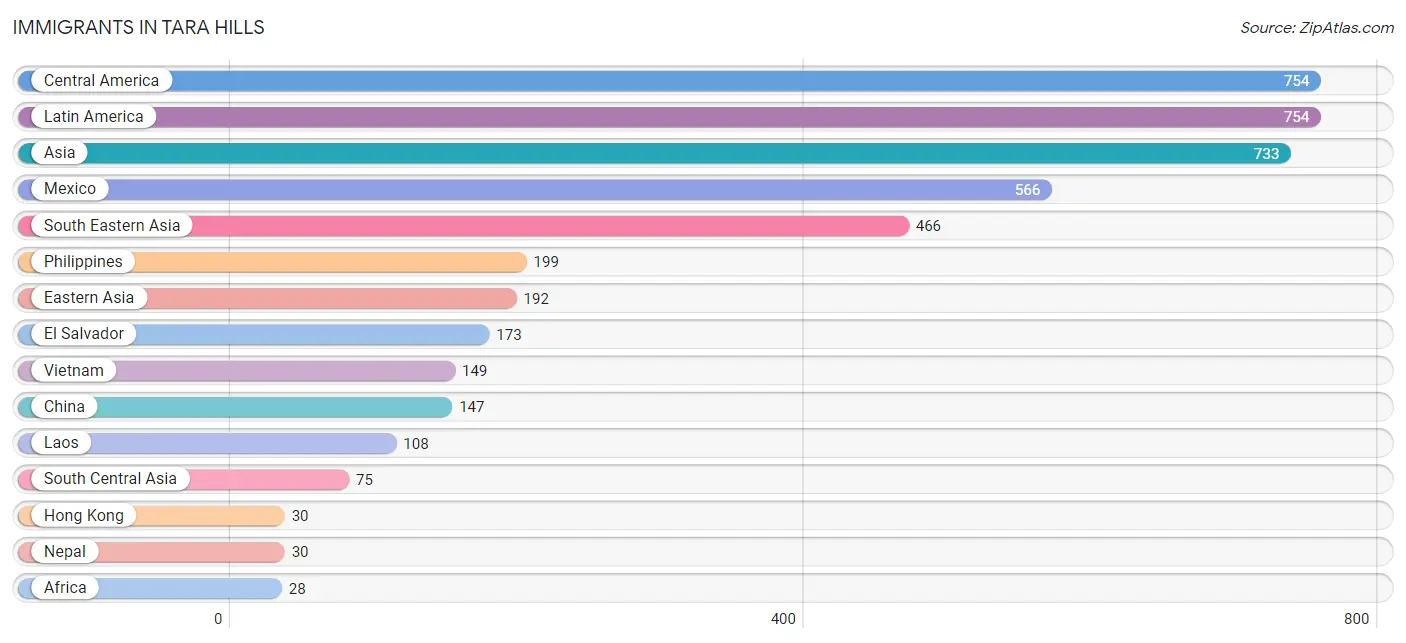
| Immigration Origin | # Population | % Population |
| Africa | 28 | 0.5% |
| Asia | 733 | 14.1% |
| Central America | 754 | 14.5% |
| China | 147 | 2.8% |
| Eastern Africa | 28 | 0.5% |
| Eastern Asia | 192 | 3.7% |
| Eastern Europe | 8 | 0.2% |
| El Salvador | 173 | 3.3% |
| Ethiopia | 28 | 0.5% |
| Europe | 19 | 0.4% |
| France | 3 | 0.1% |
| Hong Kong | 30 | 0.6% |
| Korea | 11 | 0.2% |
| Laos | 108 | 2.1% |
| Latin America | 754 | 14.5% |
| Lithuania | 8 | 0.2% |
| Mexico | 566 | 10.9% |
| Nepal | 30 | 0.6% |
| Nicaragua | 15 | 0.3% |
| Northern Europe | 8 | 0.2% |
| Philippines | 199 | 3.8% |
| South Central Asia | 75 | 1.4% |
| South Eastern Asia | 466 | 9.0% |
| Taiwan | 25 | 0.5% |
| Thailand | 10 | 0.2% |
| Vietnam | 149 | 2.9% |
| Western Europe | 3 | 0.1% | View All 27 Rows |
Sex and Age in Tara Hills
Sex and Age in Tara Hills
The most populous age groups in Tara Hills are 35 to 39 Years (273 | 11.0%) for men and 50 to 54 Years (370 | 13.6%) for women.
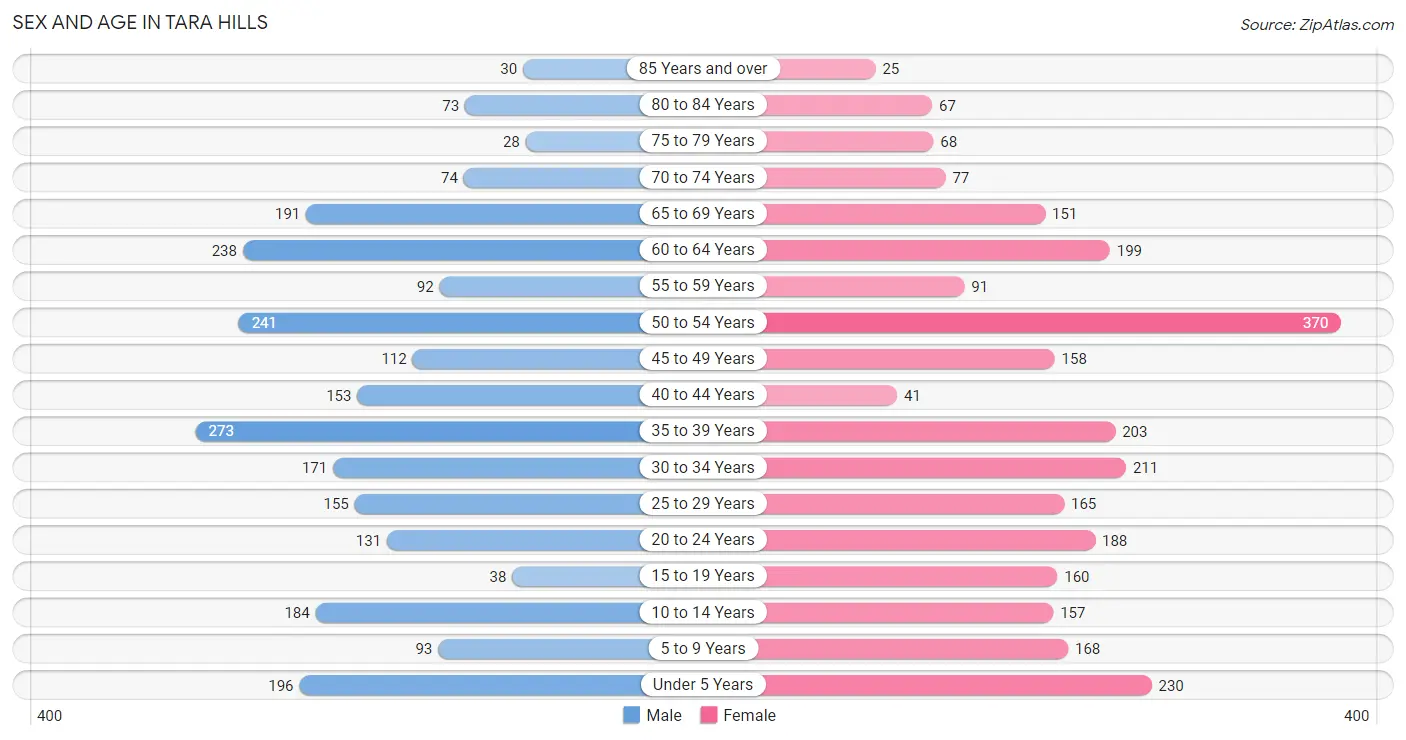
| Age Bracket | Male | Female |
| Under 5 Years | 196 (7.9%) | 230 (8.4%) |
| 5 to 9 Years | 93 (3.8%) | 168 (6.2%) |
| 10 to 14 Years | 184 (7.4%) | 157 (5.8%) |
| 15 to 19 Years | 38 (1.5%) | 160 (5.9%) |
| 20 to 24 Years | 131 (5.3%) | 188 (6.9%) |
| 25 to 29 Years | 155 (6.3%) | 165 (6.0%) |
| 30 to 34 Years | 171 (6.9%) | 211 (7.7%) |
| 35 to 39 Years | 273 (11.0%) | 203 (7.4%) |
| 40 to 44 Years | 153 (6.2%) | 41 (1.5%) |
| 45 to 49 Years | 112 (4.5%) | 158 (5.8%) |
| 50 to 54 Years | 241 (9.8%) | 370 (13.6%) |
| 55 to 59 Years | 92 (3.7%) | 91 (3.3%) |
| 60 to 64 Years | 238 (9.6%) | 199 (7.3%) |
| 65 to 69 Years | 191 (7.7%) | 151 (5.5%) |
| 70 to 74 Years | 74 (3.0%) | 77 (2.8%) |
| 75 to 79 Years | 28 (1.1%) | 68 (2.5%) |
| 80 to 84 Years | 73 (2.9%) | 67 (2.5%) |
| 85 Years and over | 30 (1.2%) | 25 (0.9%) |
| Total | 2,473 (100.0%) | 2,729 (100.0%) |
Families and Households in Tara Hills
Median Family Size in Tara Hills
The median family size in Tara Hills is 3.29 persons per family, with married-couple families (976 | 69.3%) accounting for the largest median family size of 3.35 persons per family. On the other hand, single male/father families (153 | 10.9%) represent the smallest median family size with 2.81 persons per family.
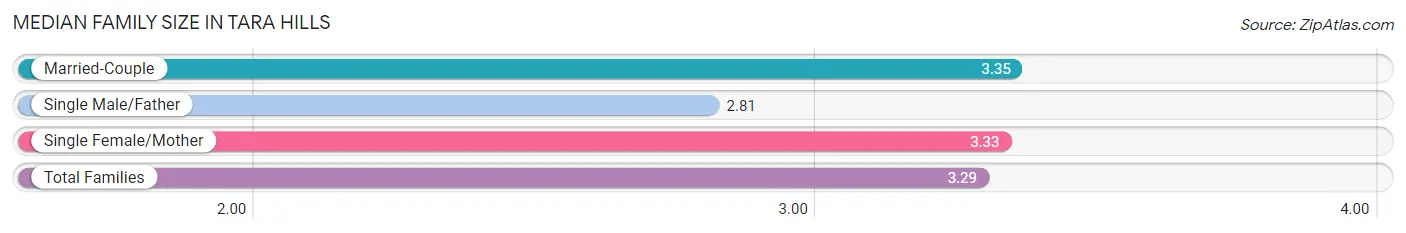
| Family Type | # Families | Family Size |
| Married-Couple | 976 (69.3%) | 3.35 |
| Single Male/Father | 153 (10.9%) | 2.81 |
| Single Female/Mother | 279 (19.8%) | 3.33 |
| Total Families | 1,408 (100.0%) | 3.29 |
Median Household Size in Tara Hills
The median household size in Tara Hills is 2.92 persons per household, with single male/father households (153 | 8.6%) accounting for the largest median household size of 3.57 persons per household. non-family households (364 | 20.5%) represent the smallest median household size with 1.17 persons per household.
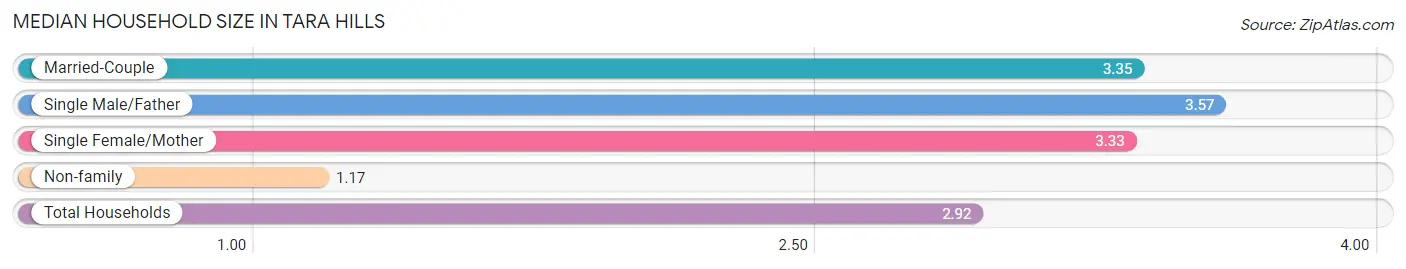
| Household Type | # Households | Household Size |
| Married-Couple | 976 (55.1%) | 3.35 |
| Single Male/Father | 153 (8.6%) | 3.57 |
| Single Female/Mother | 279 (15.7%) | 3.33 |
| Non-family | 364 (20.5%) | 1.17 |
| Total Households | 1,772 (100.0%) | 2.92 |
Household Size by Marriage Status in Tara Hills
Out of a total of 1,772 households in Tara Hills, 1,408 (79.5%) are family households, while 364 (20.5%) are nonfamily households. The most numerous type of family households are 3-person households, comprising 598, and the most common type of nonfamily households are 1-person households, comprising 302.
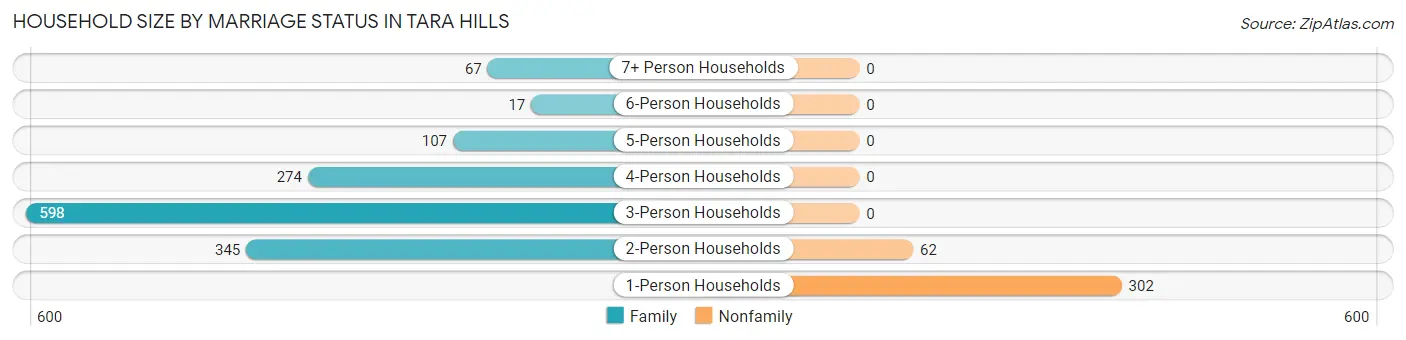
| Household Size | Family Households | Nonfamily Households |
| 1-Person Households | - | 302 (17.0%) |
| 2-Person Households | 345 (19.5%) | 62 (3.5%) |
| 3-Person Households | 598 (33.8%) | 0 (0.0%) |
| 4-Person Households | 274 (15.5%) | 0 (0.0%) |
| 5-Person Households | 107 (6.0%) | 0 (0.0%) |
| 6-Person Households | 17 (1.0%) | 0 (0.0%) |
| 7+ Person Households | 67 (3.8%) | 0 (0.0%) |
| Total | 1,408 (79.5%) | 364 (20.5%) |
Female Fertility in Tara Hills
Fertility by Age in Tara Hills
Average fertility rate in Tara Hills is 150.0 births per 1,000 women. Women in the age bracket of 20 to 34 years have the highest fertility rate with 285.0 births per 1,000 women. Women in the age bracket of 20 to 34 years acount for 86.1% of all women with births.
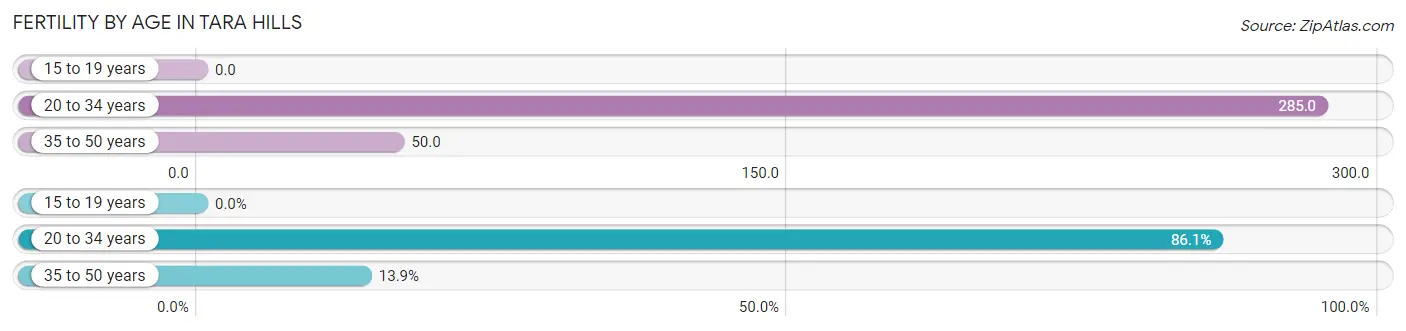
| Age Bracket | Women with Births | Births / 1,000 Women |
| 15 to 19 years | 0 (0.0%) | 0.0 |
| 20 to 34 years | 161 (86.1%) | 285.0 |
| 35 to 50 years | 26 (13.9%) | 50.0 |
| Total | 187 (100.0%) | 150.0 |
Fertility by Age by Marriage Status in Tara Hills
73.8% of women with births (187) in Tara Hills are married. The highest percentage of unmarried women with births falls into 20 to 34 years age bracket with 30.4% of them unmarried at the time of birth, while the lowest percentage of unmarried women with births belong to 35 to 50 years age bracket with 0.0% of them unmarried.
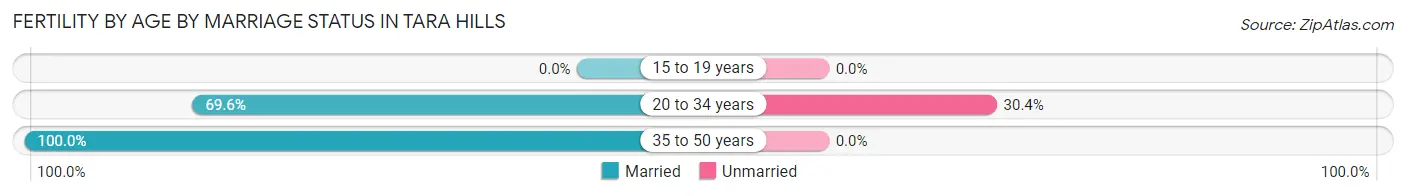
| Age Bracket | Married | Unmarried |
| 15 to 19 years | 0 (0.0%) | 0 (0.0%) |
| 20 to 34 years | 112 (69.6%) | 49 (30.4%) |
| 35 to 50 years | 26 (100.0%) | 0 (0.0%) |
| Total | 138 (73.8%) | 49 (26.2%) |
Fertility by Education in Tara Hills
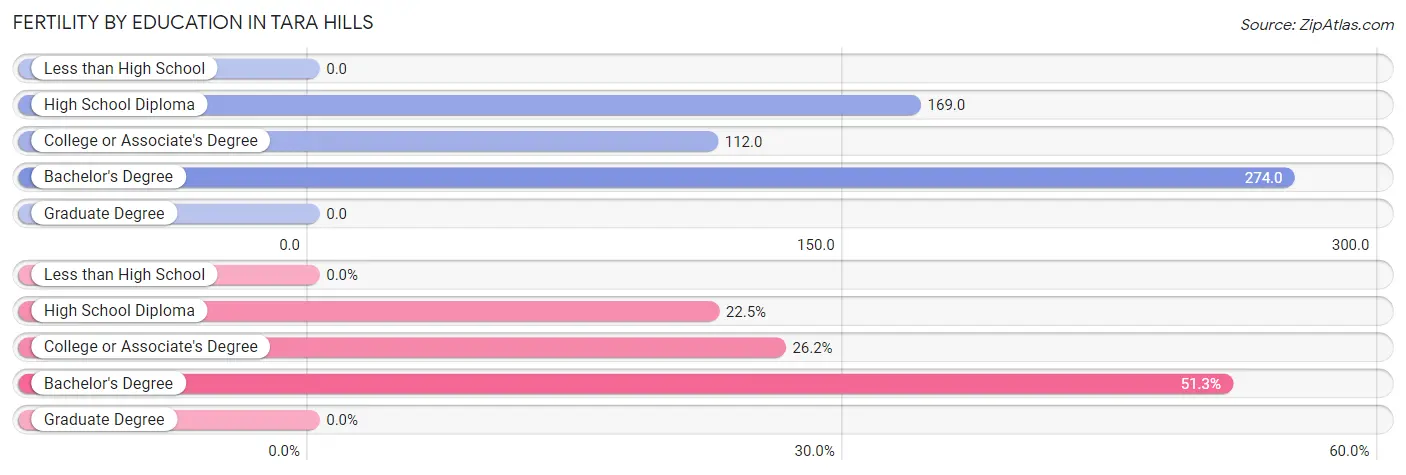
| Educational Attainment | Women with Births | Births / 1,000 Women |
| Less than High School | 0 (0.0%) | 0.0 |
| High School Diploma | 42 (22.5%) | 169.0 |
| College or Associate's Degree | 49 (26.2%) | 112.0 |
| Bachelor's Degree | 96 (51.3%) | 274.0 |
| Graduate Degree | 0 (0.0%) | 0.0 |
| Total | 187 (100.0%) | 150.0 |
Fertility by Education by Marriage Status in Tara Hills
26.2% of women with births in Tara Hills are unmarried. Women with the educational attainment of high school diploma are most likely to be married with 100.0% of them married at childbirth, while women with the educational attainment of college or associate's degree are least likely to be married with 100.0% of them unmarried at childbirth.
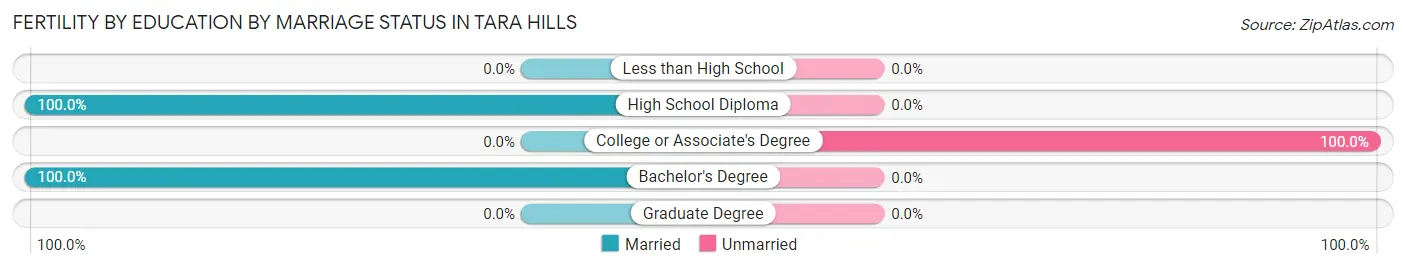
| Educational Attainment | Married | Unmarried |
| Less than High School | 0 (0.0%) | 0 (0.0%) |
| High School Diploma | 42 (100.0%) | 0 (0.0%) |
| College or Associate's Degree | 0 (0.0%) | 49 (100.0%) |
| Bachelor's Degree | 96 (100.0%) | 0 (0.0%) |
| Graduate Degree | 0 (0.0%) | 0 (0.0%) |
| Total | 138 (73.8%) | 49 (26.2%) |
Employment Characteristics in Tara Hills
Employment by Class of Employer in Tara Hills
Among the 2,564 employed individuals in Tara Hills, private company employees (1,856 | 72.4%), self-employed (not incorporated) (235 | 9.2%), and local government employees (231 | 9.0%) make up the most common classes of employment.
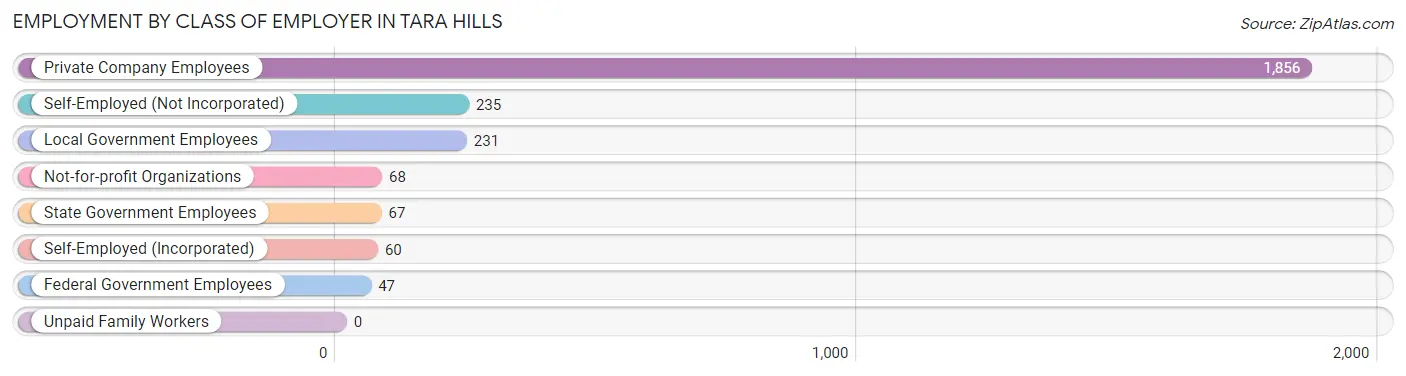
| Employer Class | # Employees | % Employees |
| Private Company Employees | 1,856 | 72.4% |
| Self-Employed (Incorporated) | 60 | 2.3% |
| Self-Employed (Not Incorporated) | 235 | 9.2% |
| Not-for-profit Organizations | 68 | 2.6% |
| Local Government Employees | 231 | 9.0% |
| State Government Employees | 67 | 2.6% |
| Federal Government Employees | 47 | 1.8% |
| Unpaid Family Workers | 0 | 0.0% |
| Total | 2,564 | 100.0% |
Employment Status by Age in Tara Hills
According to the labor force statistics for Tara Hills, out of the total population over 16 years of age (4,082), 73.5% or 3,000 individuals are in the labor force, with 4.5% or 135 of them unemployed. The age group with the highest labor force participation rate is 35 to 44 years, with 97.8% or 655 individuals in the labor force. Within the labor force, the 20 to 24 years age range has the highest percentage of unemployed individuals, with 28.0% or 72 of them being unemployed.
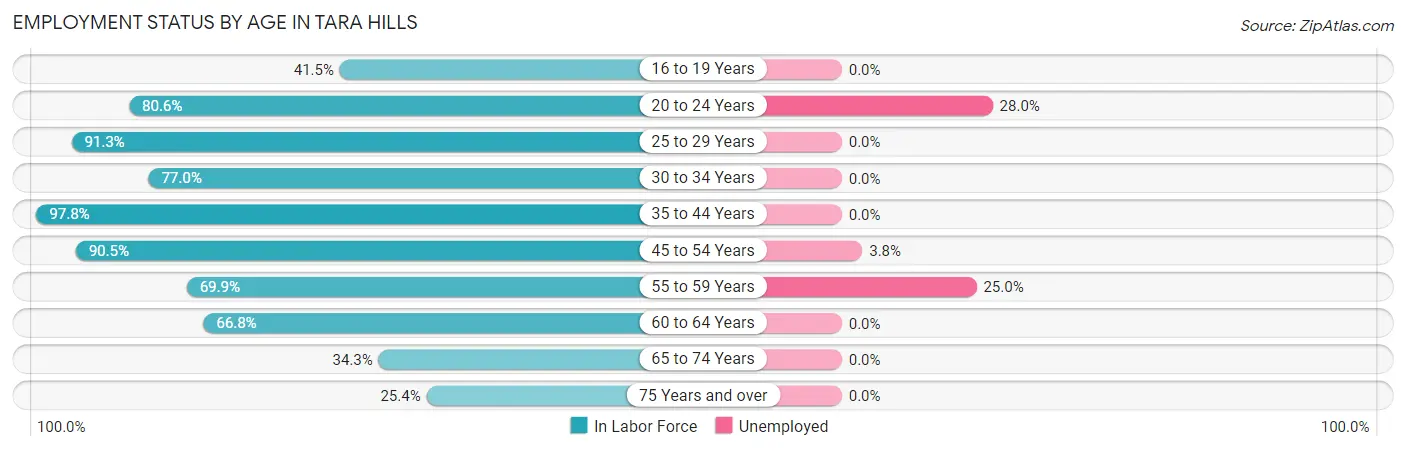
| Age Bracket | In Labor Force | Unemployed |
| 16 to 19 Years | 44 (41.5%) | 0 (0.0%) |
| 20 to 24 Years | 257 (80.6%) | 72 (28.0%) |
| 25 to 29 Years | 292 (91.3%) | 0 (0.0%) |
| 30 to 34 Years | 294 (77.0%) | 0 (0.0%) |
| 35 to 44 Years | 655 (97.8%) | 0 (0.0%) |
| 45 to 54 Years | 797 (90.5%) | 30 (3.8%) |
| 55 to 59 Years | 128 (69.9%) | 32 (25.0%) |
| 60 to 64 Years | 292 (66.8%) | 0 (0.0%) |
| 65 to 74 Years | 169 (34.3%) | 0 (0.0%) |
| 75 Years and over | 74 (25.4%) | 0 (0.0%) |
| Total | 3,000 (73.5%) | 135 (4.5%) |
Employment Status by Educational Attainment in Tara Hills
According to labor force statistics for Tara Hills, 85.6% of individuals (2,459) out of the total population between 25 and 64 years of age (2,873) are in the labor force, with 2.5% or 61 of them being unemployed. The group with the highest labor force participation rate are those with the educational attainment of bachelor's degree or higher, with 97.2% or 861 individuals in the labor force. Within the labor force, individuals with high school diploma education have the highest percentage of unemployment, with 6.4% or 44 of them being unemployed.
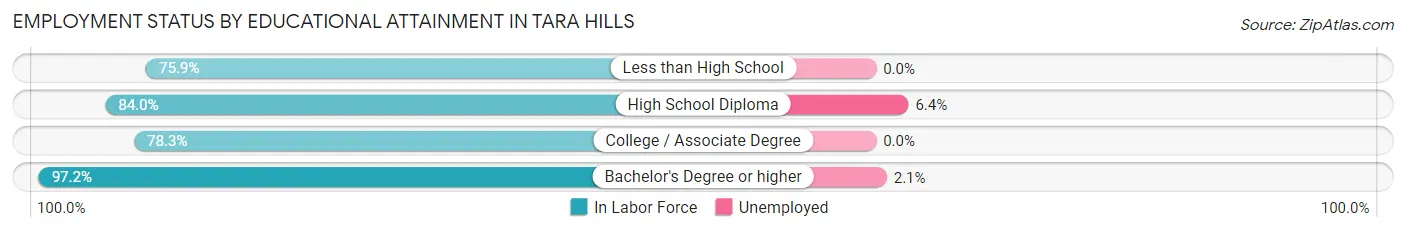
| Educational Attainment | In Labor Force | Unemployed |
| Less than High School | 189 (75.9%) | 0 (0.0%) |
| High School Diploma | 688 (84.0%) | 52 (6.4%) |
| College / Associate Degree | 720 (78.3%) | 0 (0.0%) |
| Bachelor's Degree or higher | 861 (97.2%) | 19 (2.1%) |
| Total | 2,459 (85.6%) | 72 (2.5%) |
Employment Occupations by Sex in Tara Hills
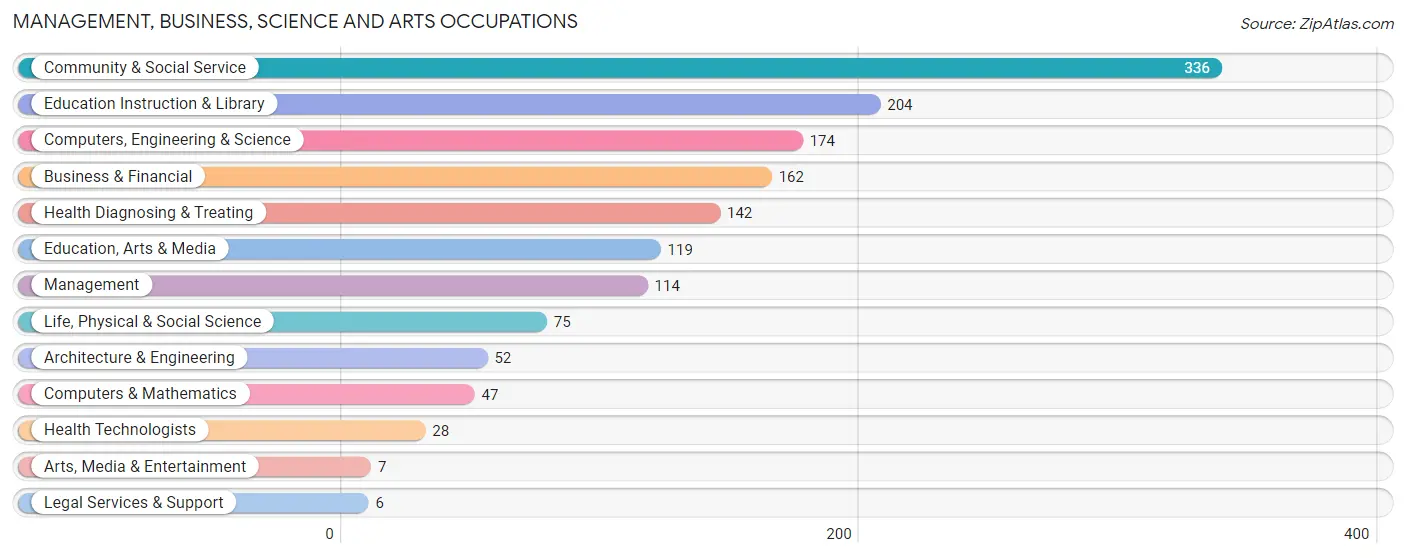
Management, Business, Science and Arts Occupations
The most common Management, Business, Science and Arts occupations in Tara Hills are Community & Social Service (336 | 11.7%), Education Instruction & Library (204 | 7.1%), Computers, Engineering & Science (174 | 6.1%), Business & Financial (162 | 5.7%), and Health Diagnosing & Treating (142 | 5.0%).
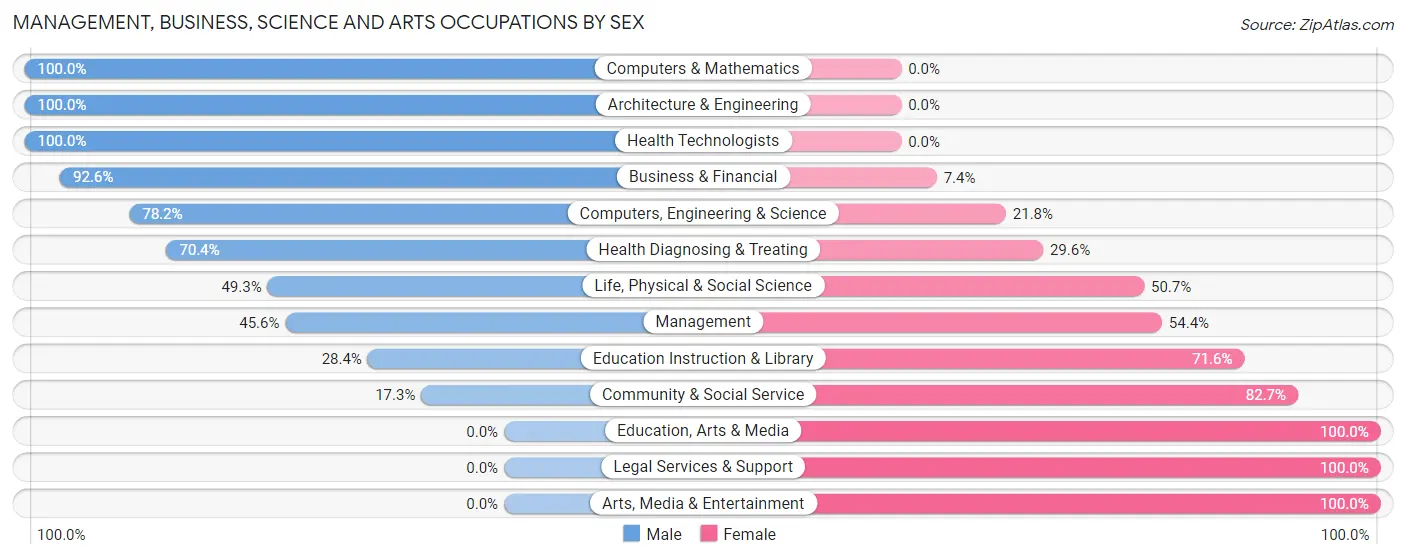
Management, Business, Science and Arts Occupations by Sex
Within the Management, Business, Science and Arts occupations in Tara Hills, the most male-oriented occupations are Computers & Mathematics (100.0%), Architecture & Engineering (100.0%), and Health Technologists (100.0%), while the most female-oriented occupations are Education, Arts & Media (100.0%), Legal Services & Support (100.0%), and Arts, Media & Entertainment (100.0%).
| Occupation | Male | Female |
| Management | 52 (45.6%) | 62 (54.4%) |
| Business & Financial | 150 (92.6%) | 12 (7.4%) |
| Computers, Engineering & Science | 136 (78.2%) | 38 (21.8%) |
| Computers & Mathematics | 47 (100.0%) | 0 (0.0%) |
| Architecture & Engineering | 52 (100.0%) | 0 (0.0%) |
| Life, Physical & Social Science | 37 (49.3%) | 38 (50.7%) |
| Community & Social Service | 58 (17.3%) | 278 (82.7%) |
| Education, Arts & Media | 0 (0.0%) | 119 (100.0%) |
| Legal Services & Support | 0 (0.0%) | 6 (100.0%) |
| Education Instruction & Library | 58 (28.4%) | 146 (71.6%) |
| Arts, Media & Entertainment | 0 (0.0%) | 7 (100.0%) |
| Health Diagnosing & Treating | 100 (70.4%) | 42 (29.6%) |
| Health Technologists | 28 (100.0%) | 0 (0.0%) |
| Total (Category) | 496 (53.4%) | 432 (46.6%) |
| Total (Overall) | 1,498 (52.2%) | 1,370 (47.8%) |
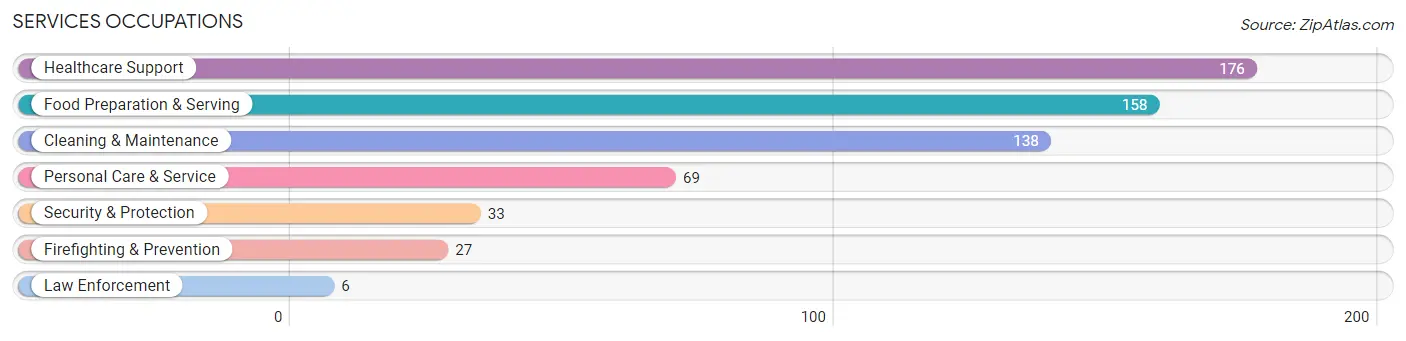
Services Occupations
The most common Services occupations in Tara Hills are Healthcare Support (176 | 6.1%), Food Preparation & Serving (158 | 5.5%), Cleaning & Maintenance (138 | 4.8%), Personal Care & Service (69 | 2.4%), and Security & Protection (33 | 1.1%).
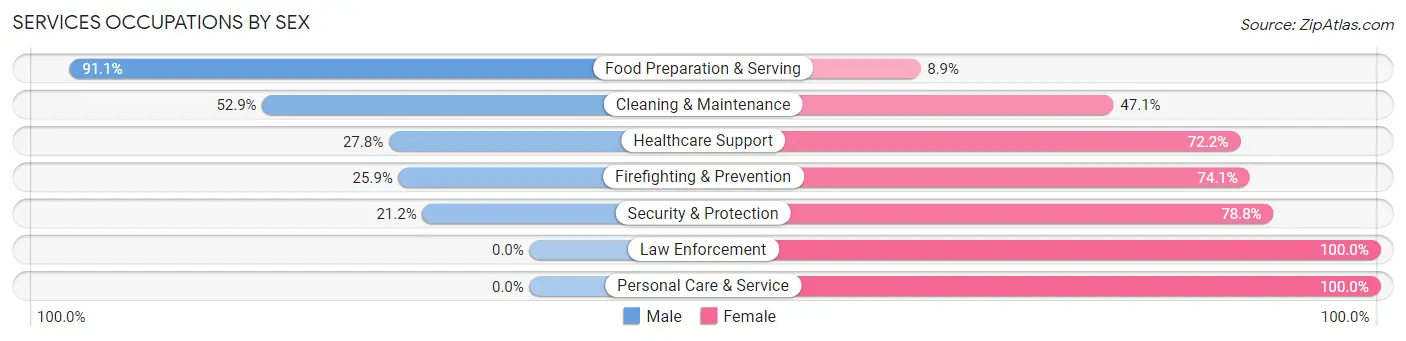
Services Occupations by Sex
Within the Services occupations in Tara Hills, the most male-oriented occupations are Food Preparation & Serving (91.1%), Cleaning & Maintenance (52.9%), and Healthcare Support (27.8%), while the most female-oriented occupations are Law Enforcement (100.0%), Personal Care & Service (100.0%), and Security & Protection (78.8%).
| Occupation | Male | Female |
| Healthcare Support | 49 (27.8%) | 127 (72.2%) |
| Security & Protection | 7 (21.2%) | 26 (78.8%) |
| Firefighting & Prevention | 7 (25.9%) | 20 (74.1%) |
| Law Enforcement | 0 (0.0%) | 6 (100.0%) |
| Food Preparation & Serving | 144 (91.1%) | 14 (8.9%) |
| Cleaning & Maintenance | 73 (52.9%) | 65 (47.1%) |
| Personal Care & Service | 0 (0.0%) | 69 (100.0%) |
| Total (Category) | 273 (47.6%) | 301 (52.4%) |
| Total (Overall) | 1,498 (52.2%) | 1,370 (47.8%) |
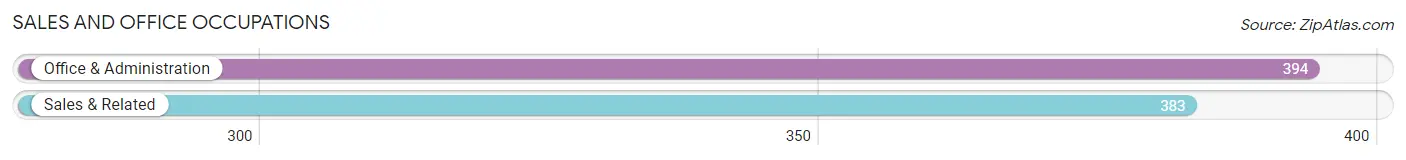
Sales and Office Occupations
The most common Sales and Office occupations in Tara Hills are Office & Administration (394 | 13.7%), and Sales & Related (383 | 13.4%).
Sales and Office Occupations by Sex
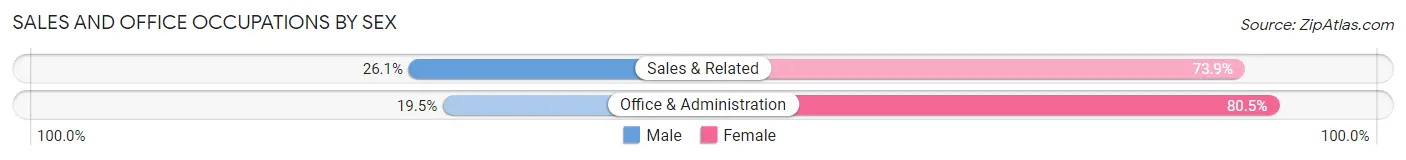
| Occupation | Male | Female |
| Sales & Related | 100 (26.1%) | 283 (73.9%) |
| Office & Administration | 77 (19.5%) | 317 (80.5%) |
| Total (Category) | 177 (22.8%) | 600 (77.2%) |
| Total (Overall) | 1,498 (52.2%) | 1,370 (47.8%) |
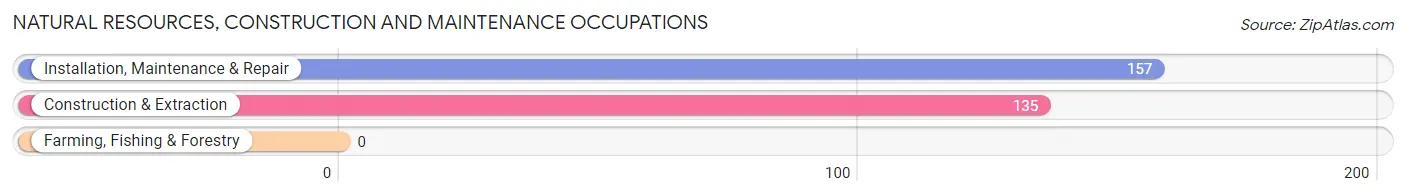
Natural Resources, Construction and Maintenance Occupations
The most common Natural Resources, Construction and Maintenance occupations in Tara Hills are Installation, Maintenance & Repair (157 | 5.5%), and Construction & Extraction (135 | 4.7%).
Natural Resources, Construction and Maintenance Occupations by Sex
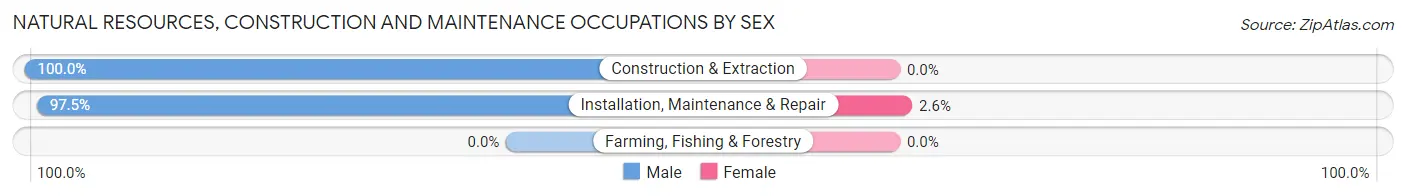
| Occupation | Male | Female |
| Farming, Fishing & Forestry | 0 (0.0%) | 0 (0.0%) |
| Construction & Extraction | 135 (100.0%) | 0 (0.0%) |
| Installation, Maintenance & Repair | 153 (97.5%) | 4 (2.5%) |
| Total (Category) | 288 (98.6%) | 4 (1.4%) |
| Total (Overall) | 1,498 (52.2%) | 1,370 (47.8%) |
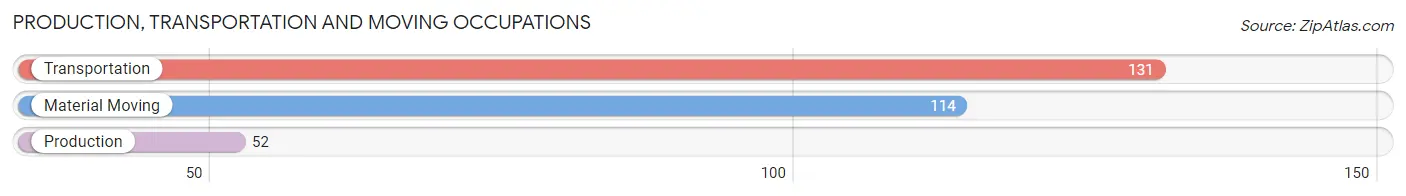
Production, Transportation and Moving Occupations
The most common Production, Transportation and Moving occupations in Tara Hills are Transportation (131 | 4.6%), Material Moving (114 | 4.0%), and Production (52 | 1.8%).
Production, Transportation and Moving Occupations by Sex
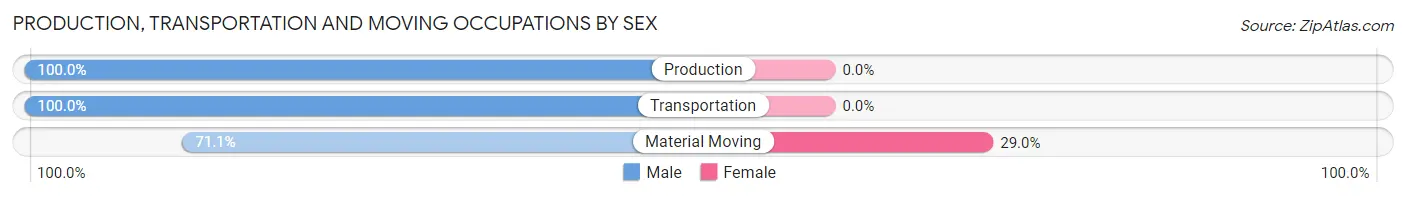
| Occupation | Male | Female |
| Production | 52 (100.0%) | 0 (0.0%) |
| Transportation | 131 (100.0%) | 0 (0.0%) |
| Material Moving | 81 (71.1%) | 33 (28.9%) |
| Total (Category) | 264 (88.9%) | 33 (11.1%) |
| Total (Overall) | 1,498 (52.2%) | 1,370 (47.8%) |
Employment Industries by Sex in Tara Hills
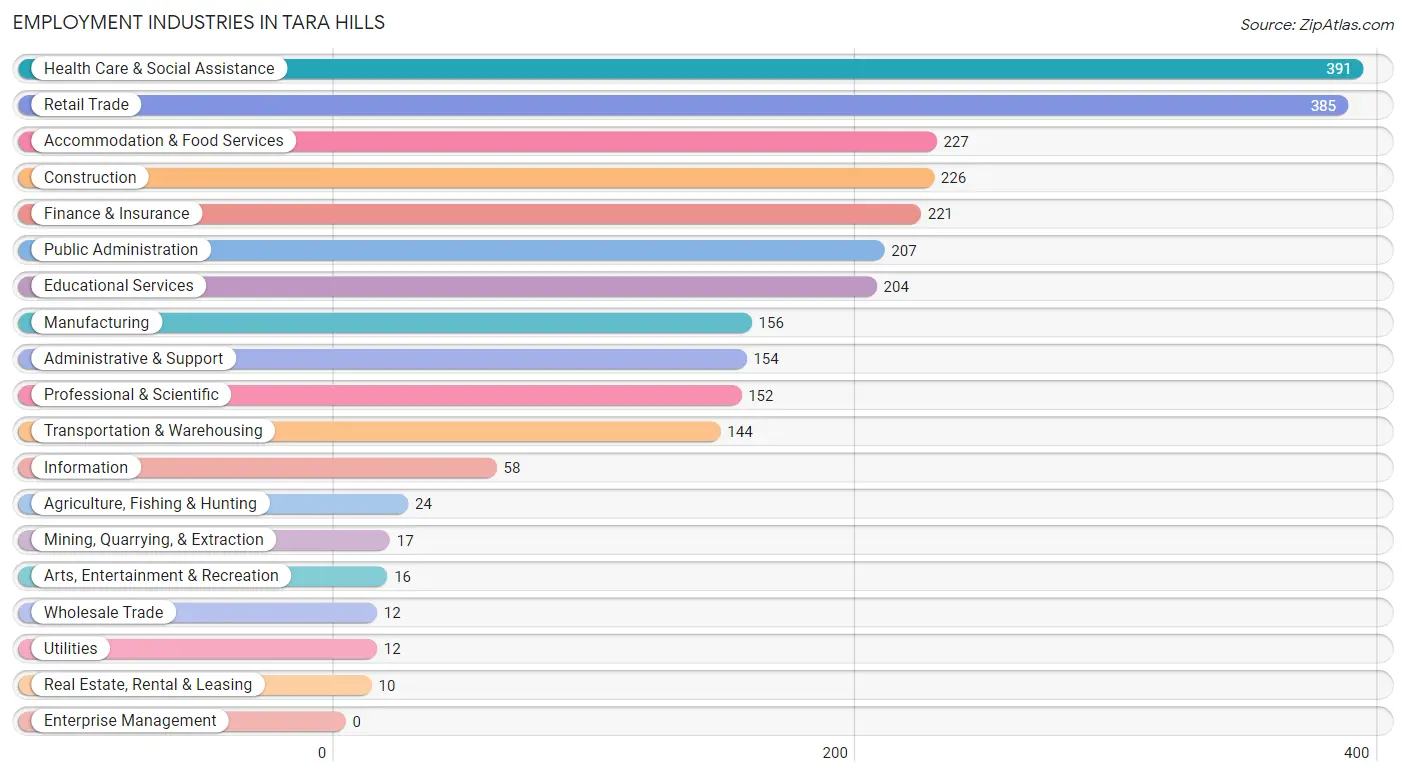
Employment Industries in Tara Hills
The major employment industries in Tara Hills include Health Care & Social Assistance (391 | 13.6%), Retail Trade (385 | 13.4%), Accommodation & Food Services (227 | 7.9%), Construction (226 | 7.9%), and Finance & Insurance (221 | 7.7%).
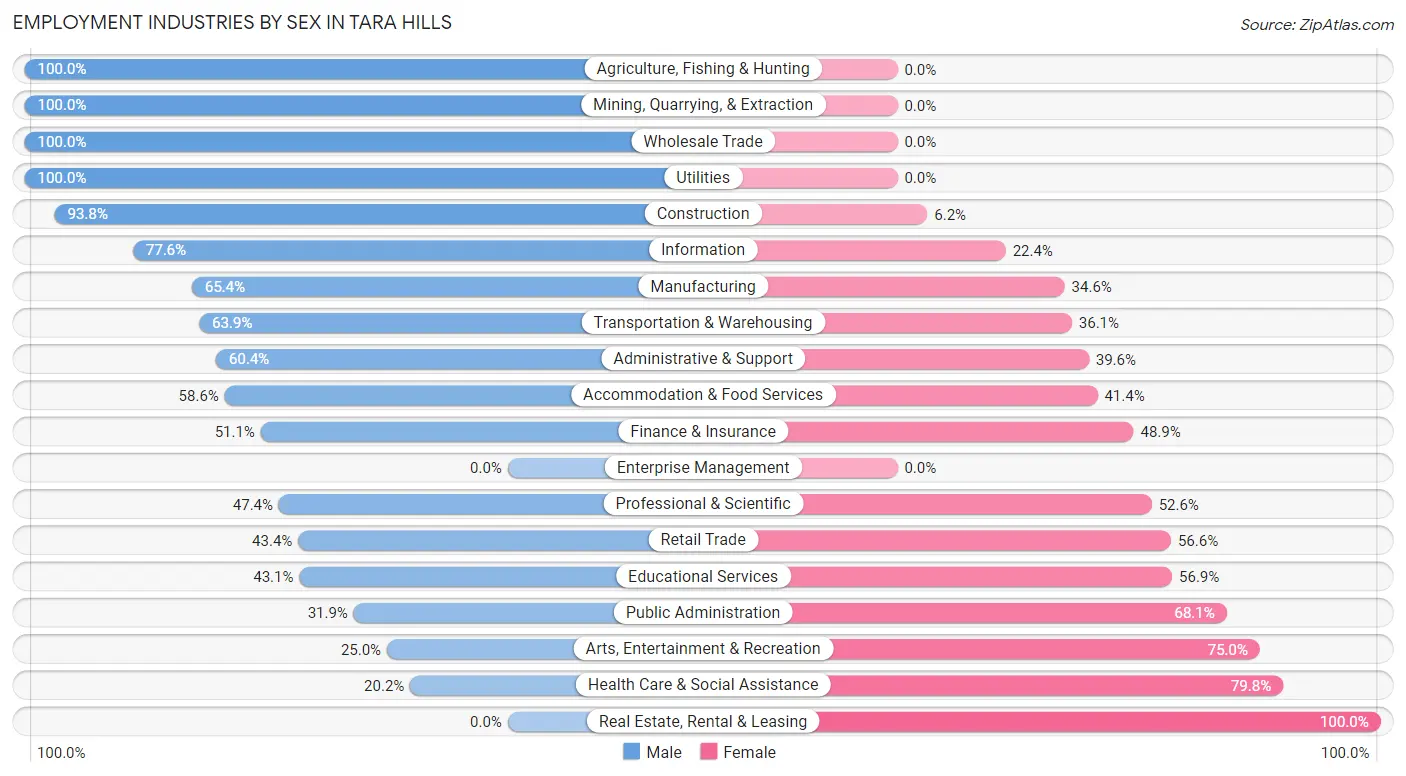
Employment Industries by Sex in Tara Hills
The Tara Hills industries that see more men than women are Agriculture, Fishing & Hunting (100.0%), Mining, Quarrying, & Extraction (100.0%), and Wholesale Trade (100.0%), whereas the industries that tend to have a higher number of women are Real Estate, Rental & Leasing (100.0%), Health Care & Social Assistance (79.8%), and Arts, Entertainment & Recreation (75.0%).
| Industry | Male | Female |
| Agriculture, Fishing & Hunting | 24 (100.0%) | 0 (0.0%) |
| Mining, Quarrying, & Extraction | 17 (100.0%) | 0 (0.0%) |
| Construction | 212 (93.8%) | 14 (6.2%) |
| Manufacturing | 102 (65.4%) | 54 (34.6%) |
| Wholesale Trade | 12 (100.0%) | 0 (0.0%) |
| Retail Trade | 167 (43.4%) | 218 (56.6%) |
| Transportation & Warehousing | 92 (63.9%) | 52 (36.1%) |
| Utilities | 12 (100.0%) | 0 (0.0%) |
| Information | 45 (77.6%) | 13 (22.4%) |
| Finance & Insurance | 113 (51.1%) | 108 (48.9%) |
| Real Estate, Rental & Leasing | 0 (0.0%) | 10 (100.0%) |
| Professional & Scientific | 72 (47.4%) | 80 (52.6%) |
| Enterprise Management | 0 (0.0%) | 0 (0.0%) |
| Administrative & Support | 93 (60.4%) | 61 (39.6%) |
| Educational Services | 88 (43.1%) | 116 (56.9%) |
| Health Care & Social Assistance | 79 (20.2%) | 312 (79.8%) |
| Arts, Entertainment & Recreation | 4 (25.0%) | 12 (75.0%) |
| Accommodation & Food Services | 133 (58.6%) | 94 (41.4%) |
| Public Administration | 66 (31.9%) | 141 (68.1%) |
| Total | 1,498 (52.2%) | 1,370 (47.8%) |
Education in Tara Hills
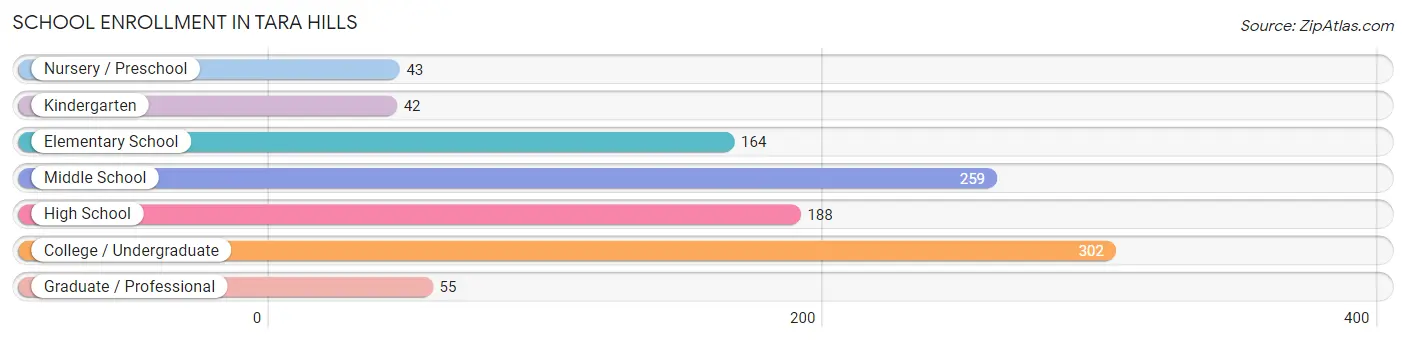
School Enrollment in Tara Hills
The most common levels of schooling among the 1,053 students in Tara Hills are college / undergraduate (302 | 28.7%), middle school (259 | 24.6%), and high school (188 | 17.8%).
| School Level | # Students | % Students |
| Nursery / Preschool | 43 | 4.1% |
| Kindergarten | 42 | 4.0% |
| Elementary School | 164 | 15.6% |
| Middle School | 259 | 24.6% |
| High School | 188 | 17.8% |
| College / Undergraduate | 302 | 28.7% |
| Graduate / Professional | 55 | 5.2% |
| Total | 1,053 | 100.0% |
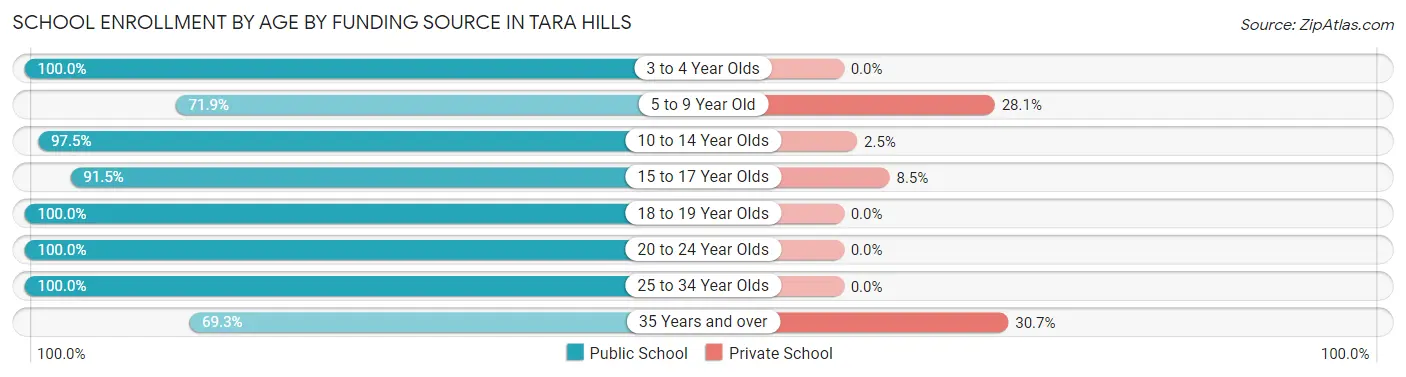
School Enrollment by Age by Funding Source in Tara Hills
Out of a total of 1,053 students who are enrolled in schools in Tara Hills, 120 (11.4%) attend a private institution, while the remaining 933 (88.6%) are enrolled in public schools. The age group of 35 years and over has the highest likelihood of being enrolled in private schools, with 42 (30.7% in the age bracket) enrolled. Conversely, the age group of 3 to 4 year olds has the lowest likelihood of being enrolled in a private school, with 13 (100.0% in the age bracket) attending a public institution.
| Age Bracket | Public School | Private School |
| 3 to 4 Year Olds | 13 (100.0%) | 0 (0.0%) |
| 5 to 9 Year Old | 143 (71.9%) | 56 (28.1%) |
| 10 to 14 Year Olds | 312 (97.5%) | 8 (2.5%) |
| 15 to 17 Year Olds | 150 (91.5%) | 14 (8.5%) |
| 18 to 19 Year Olds | 22 (100.0%) | 0 (0.0%) |
| 20 to 24 Year Olds | 171 (100.0%) | 0 (0.0%) |
| 25 to 34 Year Olds | 27 (100.0%) | 0 (0.0%) |
| 35 Years and over | 95 (69.3%) | 42 (30.7%) |
| Total | 933 (88.6%) | 120 (11.4%) |
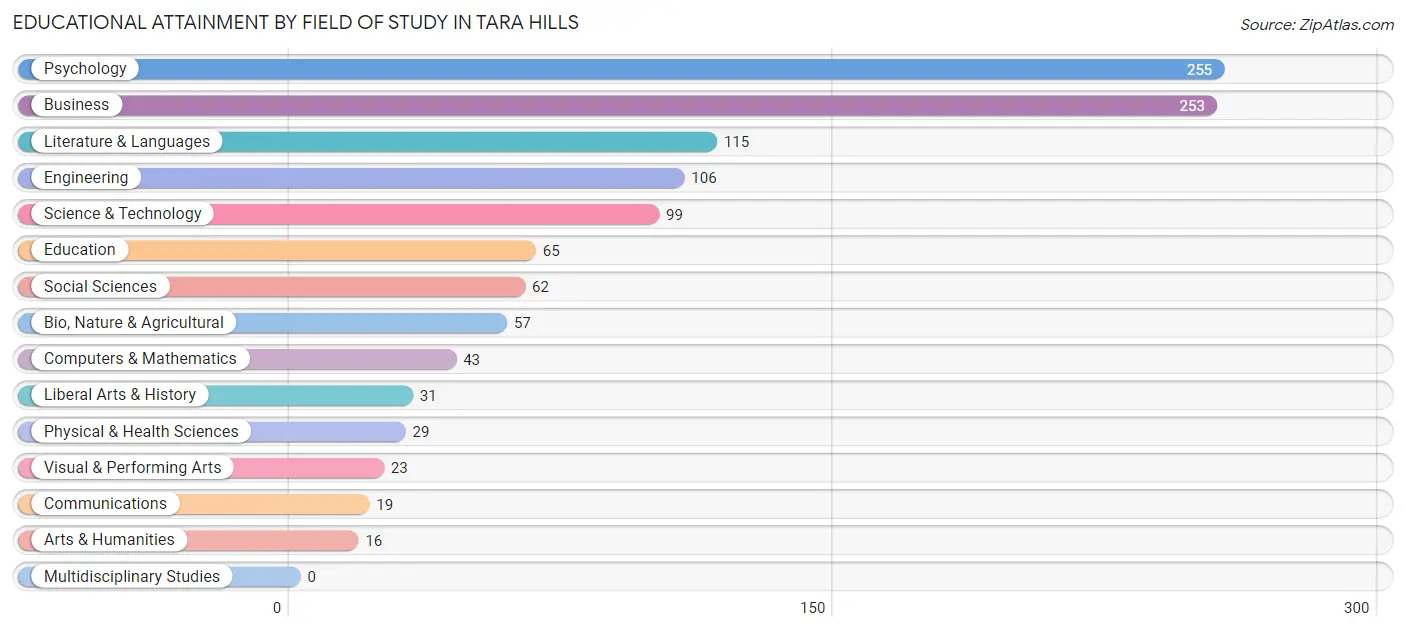
Educational Attainment by Field of Study in Tara Hills
Psychology (255 | 21.7%), business (253 | 21.6%), literature & languages (115 | 9.8%), engineering (106 | 9.0%), and science & technology (99 | 8.4%) are the most common fields of study among 1,173 individuals in Tara Hills who have obtained a bachelor's degree or higher.
| Field of Study | # Graduates | % Graduates |
| Computers & Mathematics | 43 | 3.7% |
| Bio, Nature & Agricultural | 57 | 4.9% |
| Physical & Health Sciences | 29 | 2.5% |
| Psychology | 255 | 21.7% |
| Social Sciences | 62 | 5.3% |
| Engineering | 106 | 9.0% |
| Multidisciplinary Studies | 0 | 0.0% |
| Science & Technology | 99 | 8.4% |
| Business | 253 | 21.6% |
| Education | 65 | 5.5% |
| Literature & Languages | 115 | 9.8% |
| Liberal Arts & History | 31 | 2.6% |
| Visual & Performing Arts | 23 | 2.0% |
| Communications | 19 | 1.6% |
| Arts & Humanities | 16 | 1.4% |
| Total | 1,173 | 100.0% |
Transportation & Commute in Tara Hills
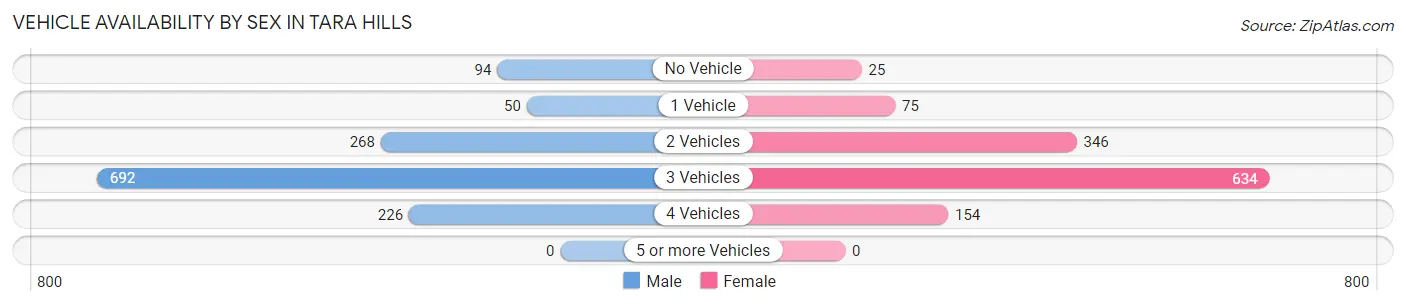
Vehicle Availability by Sex in Tara Hills
The most prevalent vehicle ownership categories in Tara Hills are males with 3 vehicles (692, accounting for 52.0%) and females with 3 vehicles (634, making up 56.1%).
| Vehicles Available | Male | Female |
| No Vehicle | 94 (7.1%) | 25 (2.0%) |
| 1 Vehicle | 50 (3.8%) | 75 (6.1%) |
| 2 Vehicles | 268 (20.2%) | 346 (28.0%) |
| 3 Vehicles | 692 (52.0%) | 634 (51.4%) |
| 4 Vehicles | 226 (17.0%) | 154 (12.5%) |
| 5 or more Vehicles | 0 (0.0%) | 0 (0.0%) |
| Total | 1,330 (100.0%) | 1,234 (100.0%) |
Commute Time in Tara Hills
The most frequently occuring commute durations in Tara Hills are 20 to 24 minutes (515 commuters, 21.5%), 10 to 14 minutes (316 commuters, 13.2%), and 30 to 34 minutes (293 commuters, 12.2%).
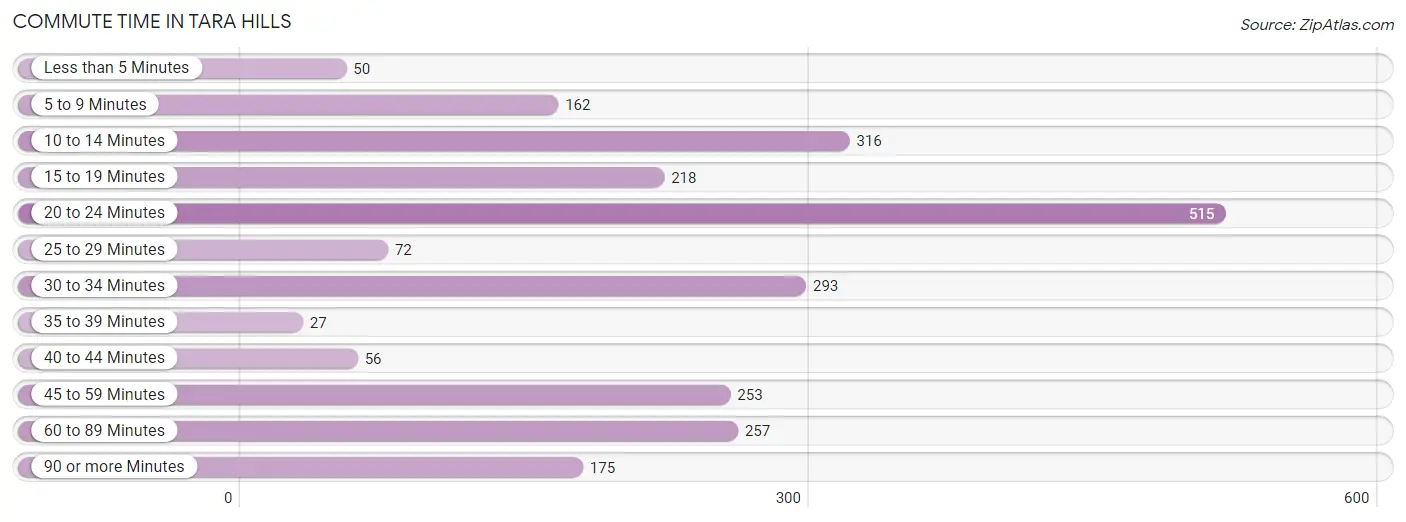
| Commute Time | # Commuters | % Commuters |
| Less than 5 Minutes | 50 | 2.1% |
| 5 to 9 Minutes | 162 | 6.8% |
| 10 to 14 Minutes | 316 | 13.2% |
| 15 to 19 Minutes | 218 | 9.1% |
| 20 to 24 Minutes | 515 | 21.5% |
| 25 to 29 Minutes | 72 | 3.0% |
| 30 to 34 Minutes | 293 | 12.2% |
| 35 to 39 Minutes | 27 | 1.1% |
| 40 to 44 Minutes | 56 | 2.3% |
| 45 to 59 Minutes | 253 | 10.6% |
| 60 to 89 Minutes | 257 | 10.7% |
| 90 or more Minutes | 175 | 7.3% |
Commute Time by Sex in Tara Hills
The most common commute times in Tara Hills are 20 to 24 minutes (268 commuters, 21.5%) for males and 20 to 24 minutes (247 commuters, 21.5%) for females.
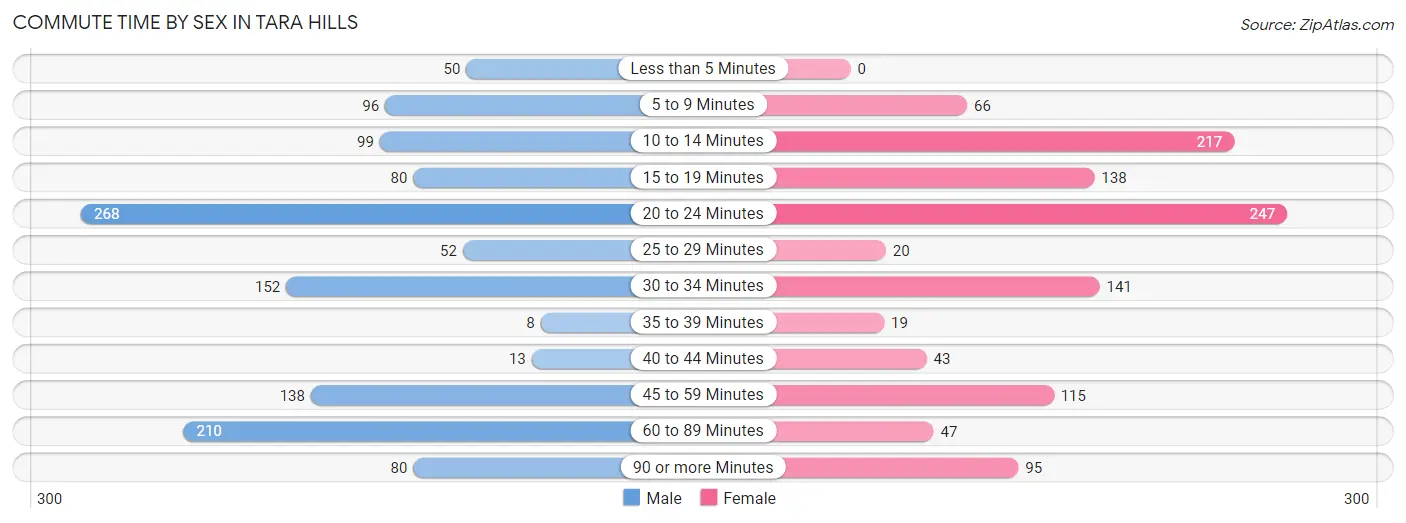
| Commute Time | Male | Female |
| Less than 5 Minutes | 50 (4.0%) | 0 (0.0%) |
| 5 to 9 Minutes | 96 (7.7%) | 66 (5.8%) |
| 10 to 14 Minutes | 99 (8.0%) | 217 (18.9%) |
| 15 to 19 Minutes | 80 (6.4%) | 138 (12.0%) |
| 20 to 24 Minutes | 268 (21.5%) | 247 (21.5%) |
| 25 to 29 Minutes | 52 (4.2%) | 20 (1.7%) |
| 30 to 34 Minutes | 152 (12.2%) | 141 (12.3%) |
| 35 to 39 Minutes | 8 (0.6%) | 19 (1.7%) |
| 40 to 44 Minutes | 13 (1.0%) | 43 (3.7%) |
| 45 to 59 Minutes | 138 (11.1%) | 115 (10.0%) |
| 60 to 89 Minutes | 210 (16.9%) | 47 (4.1%) |
| 90 or more Minutes | 80 (6.4%) | 95 (8.3%) |
Time of Departure to Work by Sex in Tara Hills
The most frequent times of departure to work in Tara Hills are 12:00 PM to 3:59 PM (203, 16.3%) for males and 12:00 PM to 3:59 PM (215, 18.7%) for females.
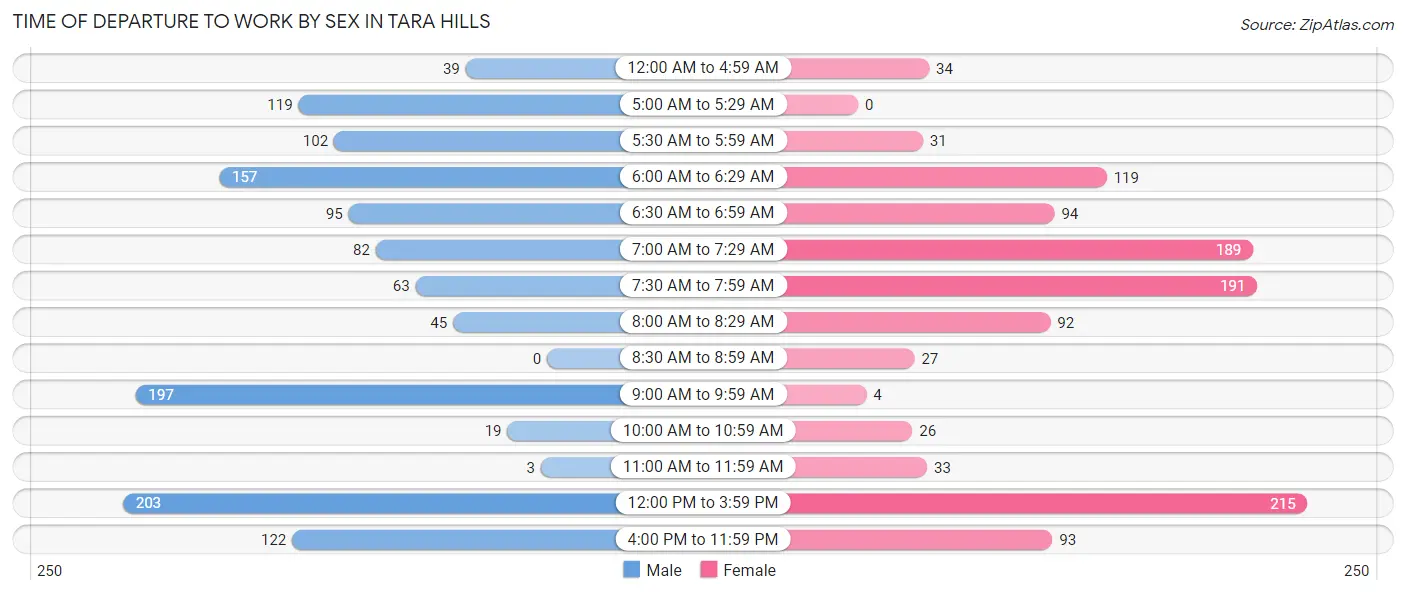
| Time of Departure | Male | Female |
| 12:00 AM to 4:59 AM | 39 (3.1%) | 34 (3.0%) |
| 5:00 AM to 5:29 AM | 119 (9.6%) | 0 (0.0%) |
| 5:30 AM to 5:59 AM | 102 (8.2%) | 31 (2.7%) |
| 6:00 AM to 6:29 AM | 157 (12.6%) | 119 (10.4%) |
| 6:30 AM to 6:59 AM | 95 (7.6%) | 94 (8.2%) |
| 7:00 AM to 7:29 AM | 82 (6.6%) | 189 (16.5%) |
| 7:30 AM to 7:59 AM | 63 (5.1%) | 191 (16.6%) |
| 8:00 AM to 8:29 AM | 45 (3.6%) | 92 (8.0%) |
| 8:30 AM to 8:59 AM | 0 (0.0%) | 27 (2.4%) |
| 9:00 AM to 9:59 AM | 197 (15.8%) | 4 (0.4%) |
| 10:00 AM to 10:59 AM | 19 (1.5%) | 26 (2.3%) |
| 11:00 AM to 11:59 AM | 3 (0.2%) | 33 (2.9%) |
| 12:00 PM to 3:59 PM | 203 (16.3%) | 215 (18.7%) |
| 4:00 PM to 11:59 PM | 122 (9.8%) | 93 (8.1%) |
| Total | 1,246 (100.0%) | 1,148 (100.0%) |
Housing Occupancy in Tara Hills
Occupancy by Ownership in Tara Hills
Of the total 1,772 dwellings in Tara Hills, owner-occupied units account for 1,251 (70.6%), while renter-occupied units make up 521 (29.4%).
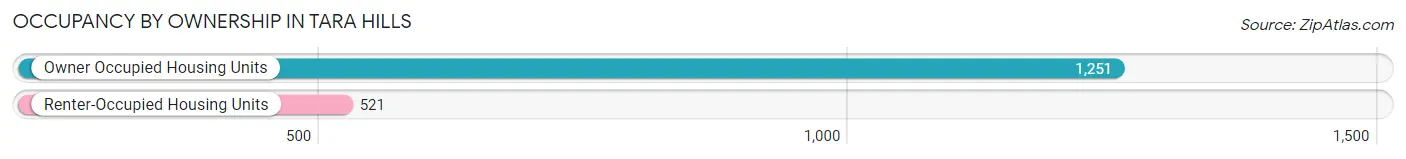
| Occupancy | # Housing Units | % Housing Units |
| Owner Occupied Housing Units | 1,251 | 70.6% |
| Renter-Occupied Housing Units | 521 | 29.4% |
| Total Occupied Housing Units | 1,772 | 100.0% |
Occupancy by Household Size in Tara Hills
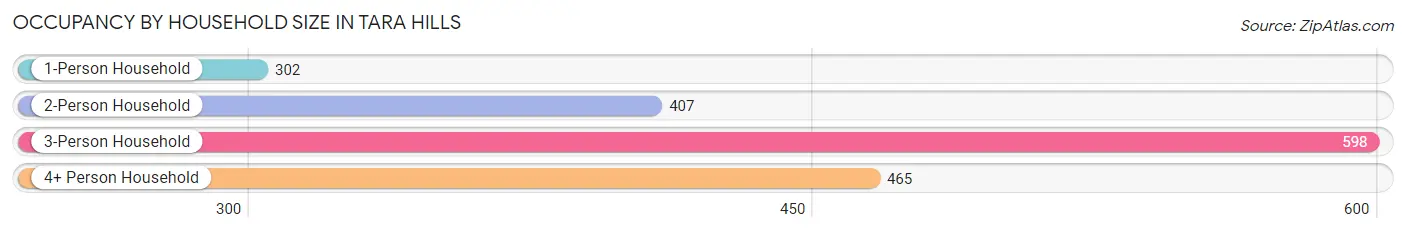
| Household Size | # Housing Units | % Housing Units |
| 1-Person Household | 302 | 17.0% |
| 2-Person Household | 407 | 23.0% |
| 3-Person Household | 598 | 33.8% |
| 4+ Person Household | 465 | 26.2% |
| Total Housing Units | 1,772 | 100.0% |
Occupancy by Ownership by Household Size in Tara Hills
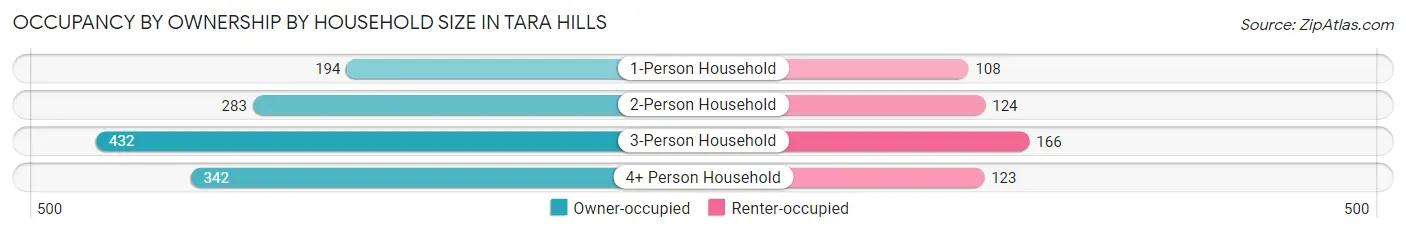
| Household Size | Owner-occupied | Renter-occupied |
| 1-Person Household | 194 (64.2%) | 108 (35.8%) |
| 2-Person Household | 283 (69.5%) | 124 (30.5%) |
| 3-Person Household | 432 (72.2%) | 166 (27.8%) |
| 4+ Person Household | 342 (73.6%) | 123 (26.5%) |
| Total Housing Units | 1,251 (70.6%) | 521 (29.4%) |
Occupancy by Educational Attainment in Tara Hills
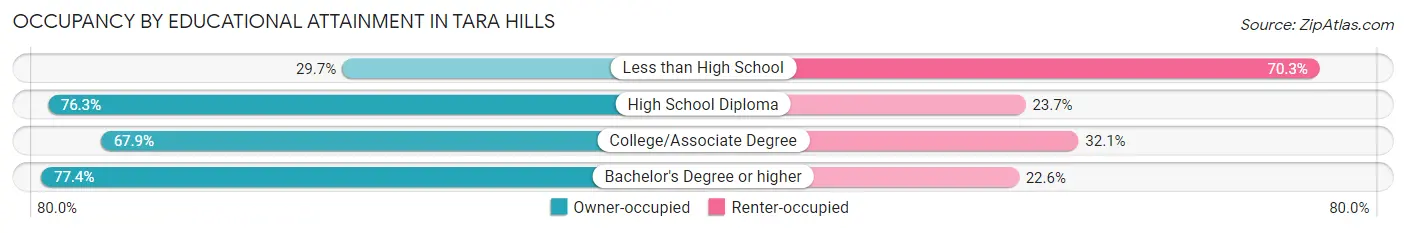
| Household Size | Owner-occupied | Renter-occupied |
| Less than High School | 35 (29.7%) | 83 (70.3%) |
| High School Diploma | 419 (76.3%) | 130 (23.7%) |
| College/Associate Degree | 417 (67.9%) | 197 (32.1%) |
| Bachelor's Degree or higher | 380 (77.4%) | 111 (22.6%) |
Occupancy by Age of Householder in Tara Hills
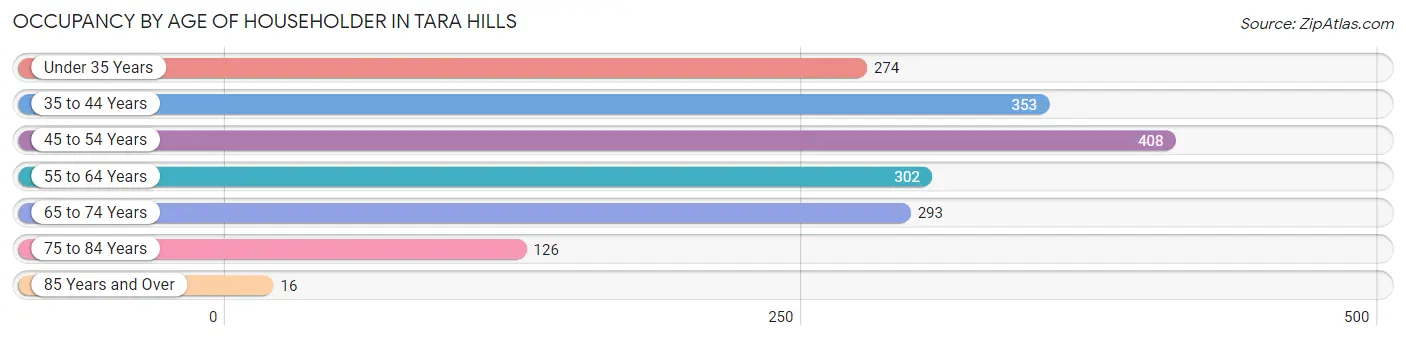
| Age Bracket | # Households | % Households |
| Under 35 Years | 274 | 15.5% |
| 35 to 44 Years | 353 | 19.9% |
| 45 to 54 Years | 408 | 23.0% |
| 55 to 64 Years | 302 | 17.0% |
| 65 to 74 Years | 293 | 16.5% |
| 75 to 84 Years | 126 | 7.1% |
| 85 Years and Over | 16 | 0.9% |
| Total | 1,772 | 100.0% |
Housing Finances in Tara Hills
Median Income by Occupancy in Tara Hills
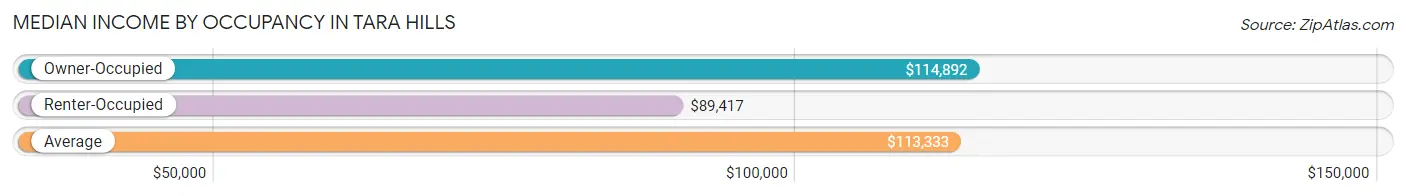
| Occupancy Type | # Households | Median Income |
| Owner-Occupied | 1,251 (70.6%) | $114,892 |
| Renter-Occupied | 521 (29.4%) | $89,417 |
| Average | 1,772 (100.0%) | $113,333 |
Occupancy by Householder Income Bracket in Tara Hills
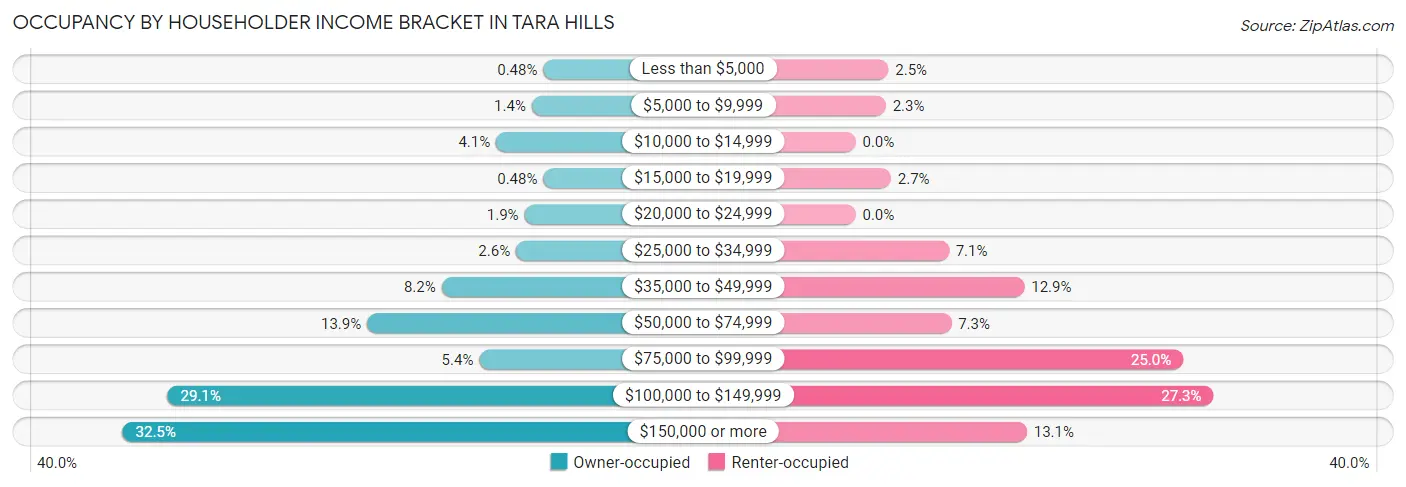
| Income Bracket | Owner-occupied | Renter-occupied |
| Less than $5,000 | 6 (0.5%) | 13 (2.5%) |
| $5,000 to $9,999 | 17 (1.4%) | 12 (2.3%) |
| $10,000 to $14,999 | 51 (4.1%) | 0 (0.0%) |
| $15,000 to $19,999 | 6 (0.5%) | 14 (2.7%) |
| $20,000 to $24,999 | 24 (1.9%) | 0 (0.0%) |
| $25,000 to $34,999 | 32 (2.6%) | 37 (7.1%) |
| $35,000 to $49,999 | 103 (8.2%) | 67 (12.9%) |
| $50,000 to $74,999 | 174 (13.9%) | 38 (7.3%) |
| $75,000 to $99,999 | 67 (5.4%) | 130 (24.9%) |
| $100,000 to $149,999 | 364 (29.1%) | 142 (27.3%) |
| $150,000 or more | 407 (32.5%) | 68 (13.1%) |
| Total | 1,251 (100.0%) | 521 (100.0%) |
Monthly Housing Cost Tiers in Tara Hills
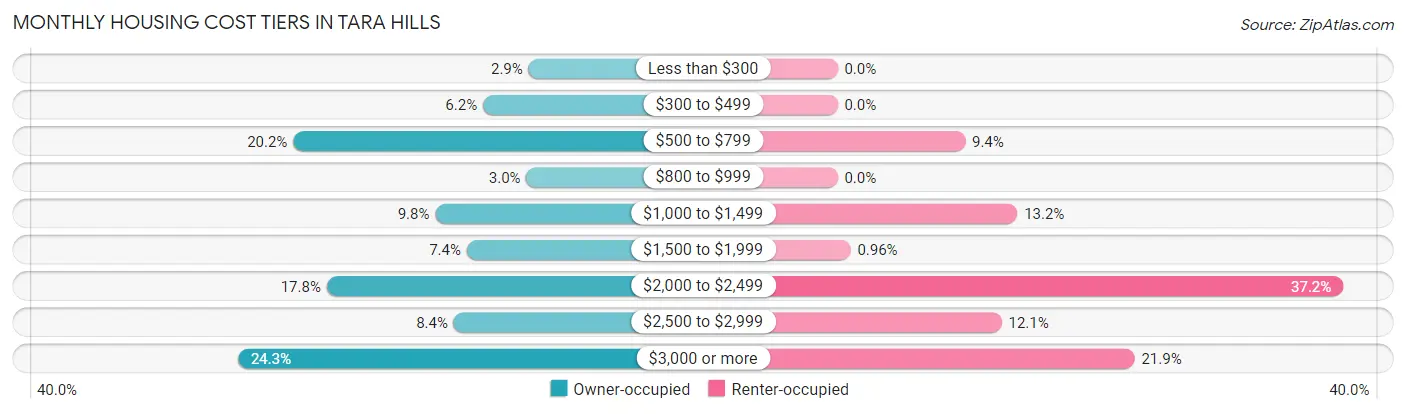
| Monthly Cost | Owner-occupied | Renter-occupied |
| Less than $300 | 36 (2.9%) | 0 (0.0%) |
| $300 to $499 | 78 (6.2%) | 0 (0.0%) |
| $500 to $799 | 253 (20.2%) | 49 (9.4%) |
| $800 to $999 | 38 (3.0%) | 0 (0.0%) |
| $1,000 to $1,499 | 122 (9.8%) | 69 (13.2%) |
| $1,500 to $1,999 | 93 (7.4%) | 5 (1.0%) |
| $2,000 to $2,499 | 222 (17.7%) | 194 (37.2%) |
| $2,500 to $2,999 | 105 (8.4%) | 63 (12.1%) |
| $3,000 or more | 304 (24.3%) | 114 (21.9%) |
| Total | 1,251 (100.0%) | 521 (100.0%) |
Physical Housing Characteristics in Tara Hills
Housing Structures in Tara Hills
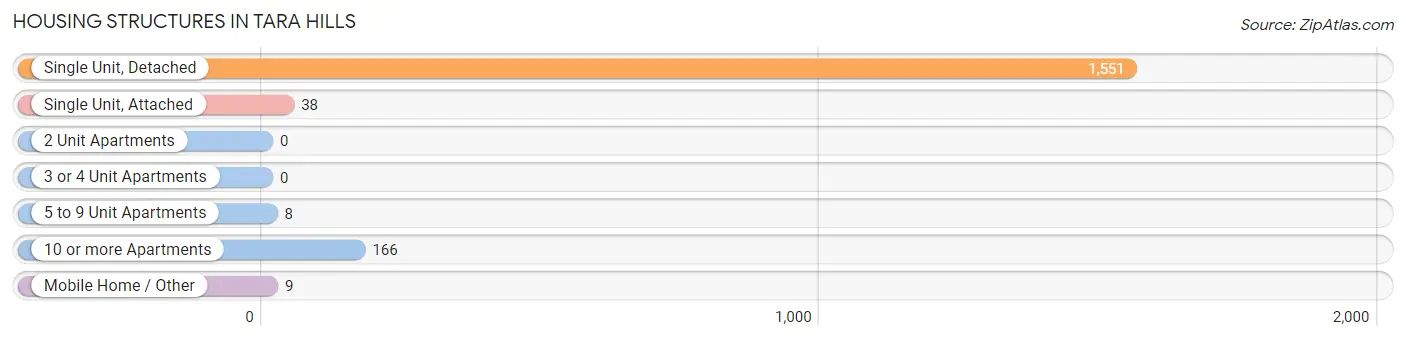
| Structure Type | # Housing Units | % Housing Units |
| Single Unit, Detached | 1,551 | 87.5% |
| Single Unit, Attached | 38 | 2.1% |
| 2 Unit Apartments | 0 | 0.0% |
| 3 or 4 Unit Apartments | 0 | 0.0% |
| 5 to 9 Unit Apartments | 8 | 0.4% |
| 10 or more Apartments | 166 | 9.4% |
| Mobile Home / Other | 9 | 0.5% |
| Total | 1,772 | 100.0% |
Housing Structures by Occupancy in Tara Hills
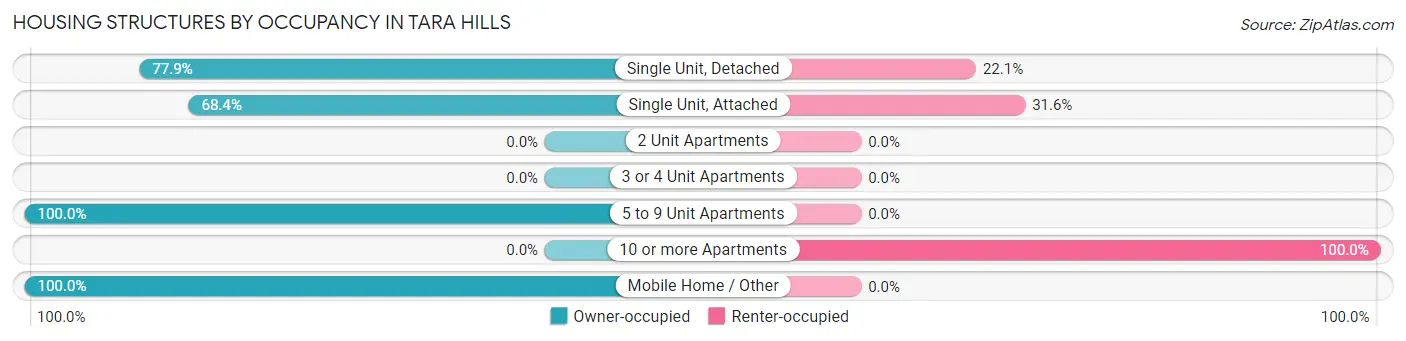
| Structure Type | Owner-occupied | Renter-occupied |
| Single Unit, Detached | 1,208 (77.9%) | 343 (22.1%) |
| Single Unit, Attached | 26 (68.4%) | 12 (31.6%) |
| 2 Unit Apartments | 0 (0.0%) | 0 (0.0%) |
| 3 or 4 Unit Apartments | 0 (0.0%) | 0 (0.0%) |
| 5 to 9 Unit Apartments | 8 (100.0%) | 0 (0.0%) |
| 10 or more Apartments | 0 (0.0%) | 166 (100.0%) |
| Mobile Home / Other | 9 (100.0%) | 0 (0.0%) |
| Total | 1,251 (70.6%) | 521 (29.4%) |
Housing Structures by Number of Rooms in Tara Hills
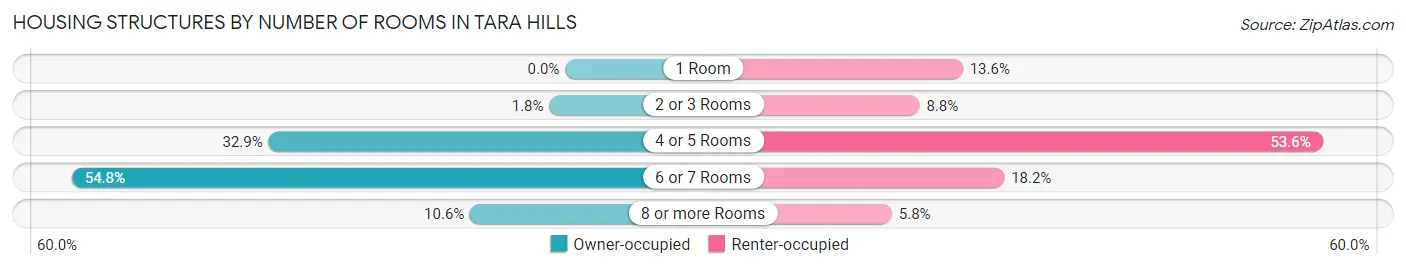
| Number of Rooms | Owner-occupied | Renter-occupied |
| 1 Room | 0 (0.0%) | 71 (13.6%) |
| 2 or 3 Rooms | 22 (1.8%) | 46 (8.8%) |
| 4 or 5 Rooms | 412 (32.9%) | 279 (53.5%) |
| 6 or 7 Rooms | 685 (54.8%) | 95 (18.2%) |
| 8 or more Rooms | 132 (10.5%) | 30 (5.8%) |
| Total | 1,251 (100.0%) | 521 (100.0%) |
Housing Structure by Heating Type in Tara Hills
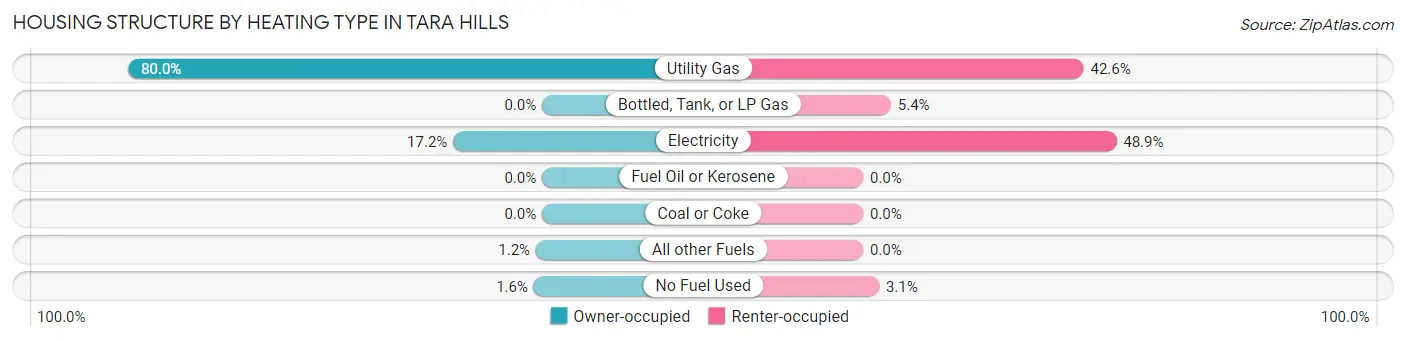
| Heating Type | Owner-occupied | Renter-occupied |
| Utility Gas | 1,001 (80.0%) | 222 (42.6%) |
| Bottled, Tank, or LP Gas | 0 (0.0%) | 28 (5.4%) |
| Electricity | 215 (17.2%) | 255 (48.9%) |
| Fuel Oil or Kerosene | 0 (0.0%) | 0 (0.0%) |
| Coal or Coke | 0 (0.0%) | 0 (0.0%) |
| All other Fuels | 15 (1.2%) | 0 (0.0%) |
| No Fuel Used | 20 (1.6%) | 16 (3.1%) |
| Total | 1,251 (100.0%) | 521 (100.0%) |
Household Vehicle Usage in Tara Hills
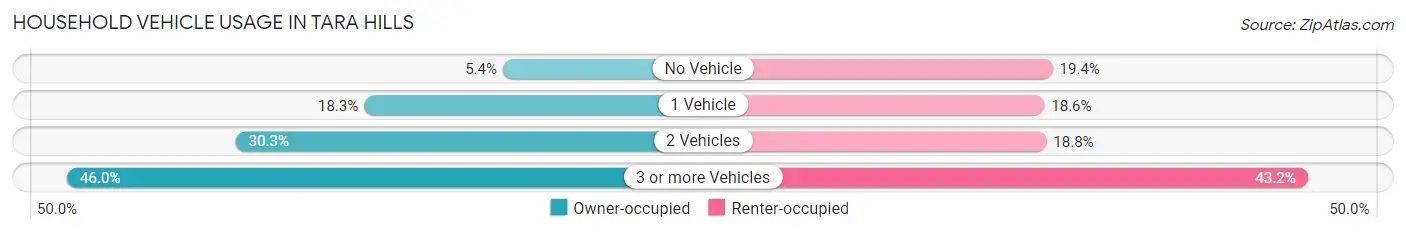
| Vehicles per Household | Owner-occupied | Renter-occupied |
| No Vehicle | 67 (5.4%) | 101 (19.4%) |
| 1 Vehicle | 229 (18.3%) | 97 (18.6%) |
| 2 Vehicles | 379 (30.3%) | 98 (18.8%) |
| 3 or more Vehicles | 576 (46.0%) | 225 (43.2%) |
| Total | 1,251 (100.0%) | 521 (100.0%) |
Real Estate & Mortgages in Tara Hills
Real Estate and Mortgage Overview in Tara Hills
| Characteristic | Without Mortgage | With Mortgage |
| Housing Units | 435 | 816 |
| Median Property Value | $596,600 | $599,800 |
| Median Household Income | $110,054 | $338 |
| Monthly Housing Costs | $641 | $304 |
| Real Estate Taxes | $3,386 | $11 |
Property Value by Mortgage Status in Tara Hills
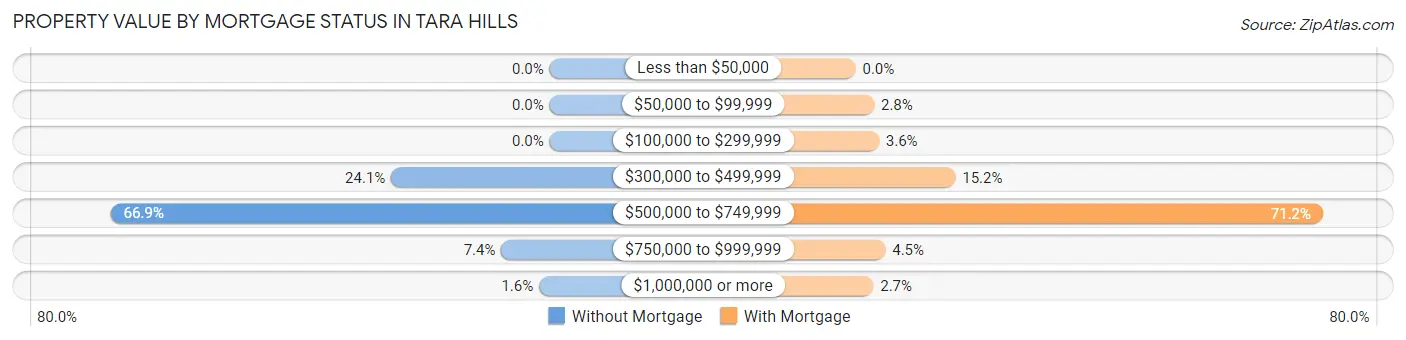
| Property Value | Without Mortgage | With Mortgage |
| Less than $50,000 | 0 (0.0%) | 0 (0.0%) |
| $50,000 to $99,999 | 0 (0.0%) | 23 (2.8%) |
| $100,000 to $299,999 | 0 (0.0%) | 29 (3.5%) |
| $300,000 to $499,999 | 105 (24.1%) | 124 (15.2%) |
| $500,000 to $749,999 | 291 (66.9%) | 581 (71.2%) |
| $750,000 to $999,999 | 32 (7.4%) | 37 (4.5%) |
| $1,000,000 or more | 7 (1.6%) | 22 (2.7%) |
| Total | 435 (100.0%) | 816 (100.0%) |
Household Income by Mortgage Status in Tara Hills
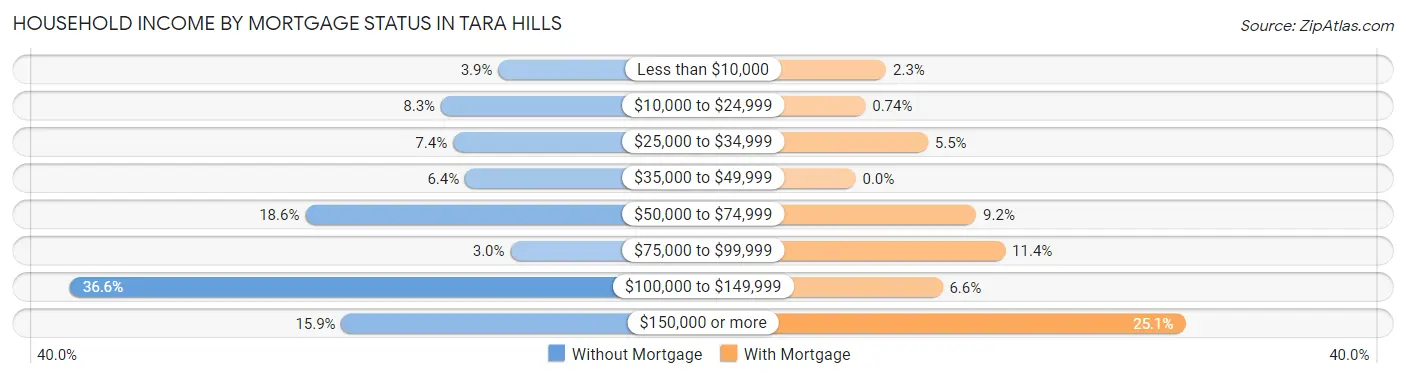
| Household Income | Without Mortgage | With Mortgage |
| Less than $10,000 | 17 (3.9%) | 19 (2.3%) |
| $10,000 to $24,999 | 36 (8.3%) | 6 (0.7%) |
| $25,000 to $34,999 | 32 (7.4%) | 45 (5.5%) |
| $35,000 to $49,999 | 28 (6.4%) | 0 (0.0%) |
| $50,000 to $74,999 | 81 (18.6%) | 75 (9.2%) |
| $75,000 to $99,999 | 13 (3.0%) | 93 (11.4%) |
| $100,000 to $149,999 | 159 (36.5%) | 54 (6.6%) |
| $150,000 or more | 69 (15.9%) | 205 (25.1%) |
| Total | 435 (100.0%) | 816 (100.0%) |
Property Value to Household Income Ratio in Tara Hills
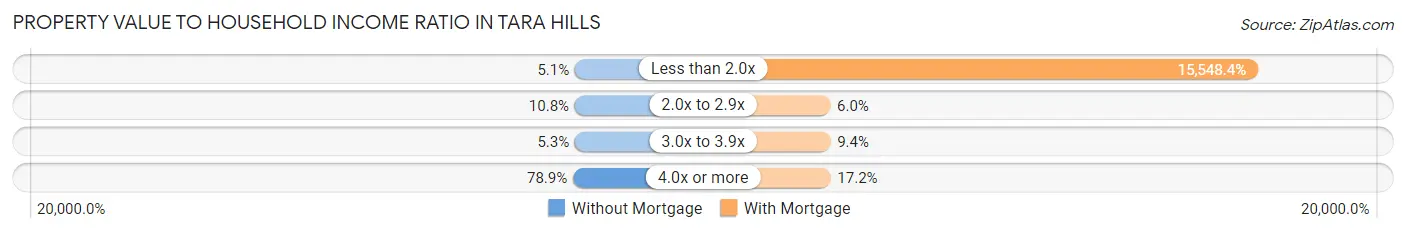
| Value-to-Income Ratio | Without Mortgage | With Mortgage |
| Less than 2.0x | 22 (5.1%) | 126,875 (15,548.4%) |
| 2.0x to 2.9x | 47 (10.8%) | 49 (6.0%) |
| 3.0x to 3.9x | 23 (5.3%) | 77 (9.4%) |
| 4.0x or more | 343 (78.8%) | 140 (17.2%) |
| Total | 435 (100.0%) | 816 (100.0%) |
Real Estate Taxes by Mortgage Status in Tara Hills
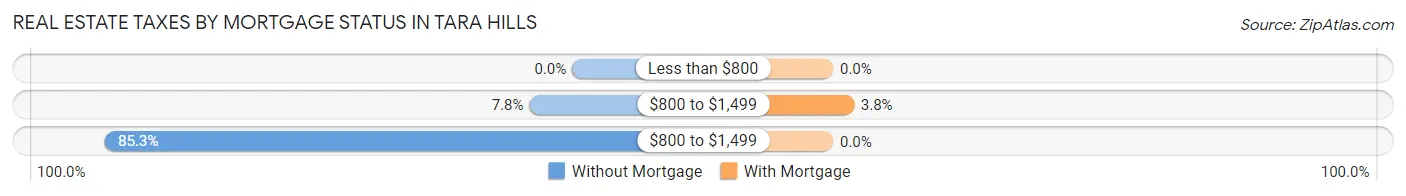
| Property Taxes | Without Mortgage | With Mortgage |
| Less than $800 | 0 (0.0%) | 0 (0.0%) |
| $800 to $1,499 | 34 (7.8%) | 31 (3.8%) |
| $800 to $1,499 | 371 (85.3%) | 0 (0.0%) |
| Total | 435 (100.0%) | 816 (100.0%) |
Health & Disability in Tara Hills
Health Insurance Coverage by Age in Tara Hills
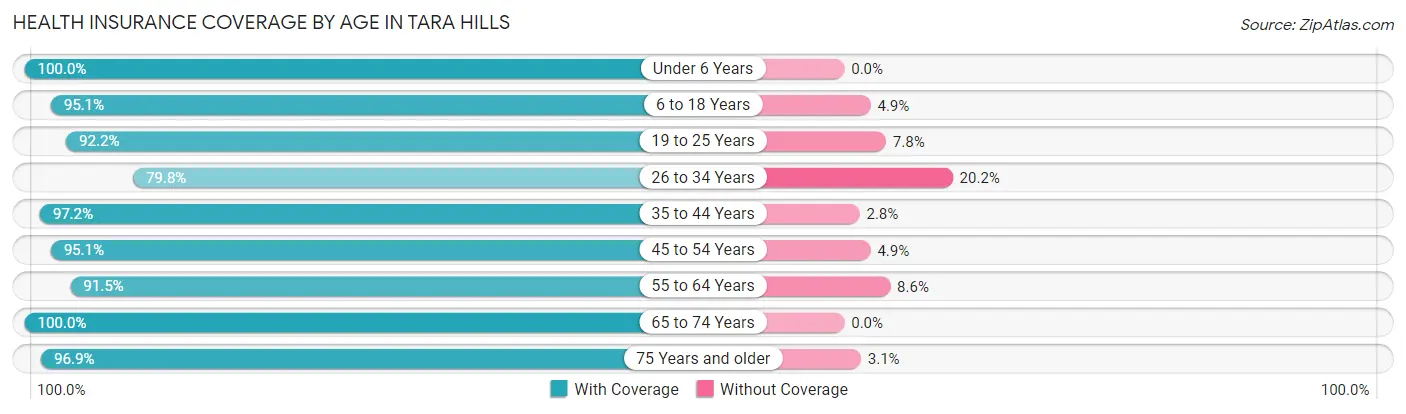
| Age Bracket | With Coverage | Without Coverage |
| Under 6 Years | 553 (100.0%) | 0 (0.0%) |
| 6 to 18 Years | 623 (95.1%) | 32 (4.9%) |
| 19 to 25 Years | 333 (92.2%) | 28 (7.8%) |
| 26 to 34 Years | 541 (79.8%) | 137 (20.2%) |
| 35 to 44 Years | 651 (97.2%) | 19 (2.8%) |
| 45 to 54 Years | 838 (95.1%) | 43 (4.9%) |
| 55 to 64 Years | 567 (91.4%) | 53 (8.6%) |
| 65 to 74 Years | 492 (100.0%) | 0 (0.0%) |
| 75 Years and older | 282 (96.9%) | 9 (3.1%) |
| Total | 4,880 (93.8%) | 321 (6.2%) |
Health Insurance Coverage by Citizenship Status in Tara Hills
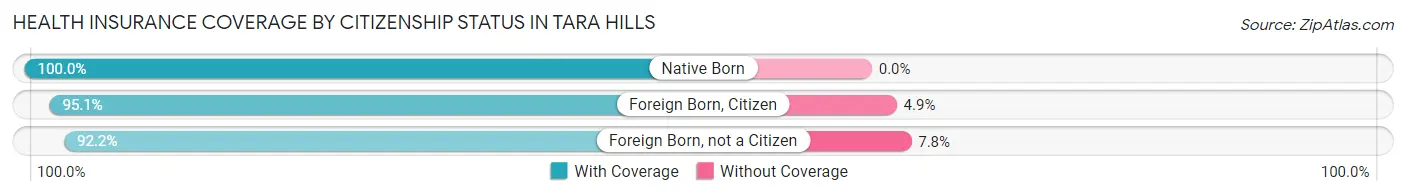
| Citizenship Status | With Coverage | Without Coverage |
| Native Born | 553 (100.0%) | 0 (0.0%) |
| Foreign Born, Citizen | 623 (95.1%) | 32 (4.9%) |
| Foreign Born, not a Citizen | 333 (92.2%) | 28 (7.8%) |
Health Insurance Coverage by Household Income in Tara Hills
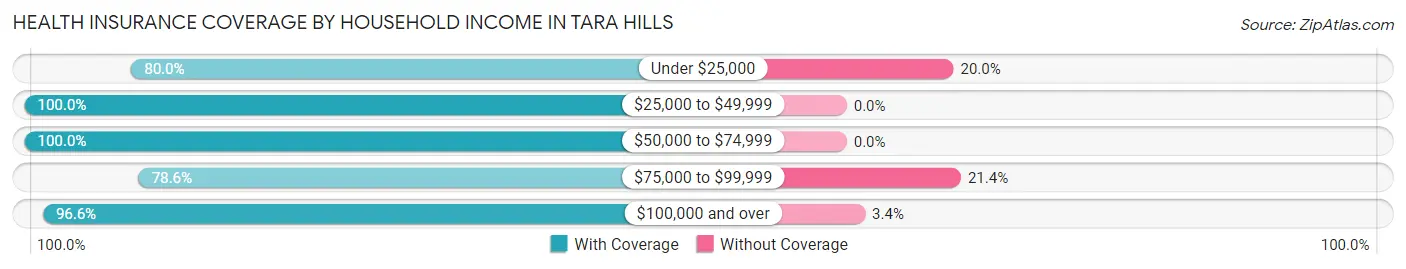
| Household Income | With Coverage | Without Coverage |
| Under $25,000 | 224 (80.0%) | 56 (20.0%) |
| $25,000 to $49,999 | 468 (100.0%) | 0 (0.0%) |
| $50,000 to $74,999 | 552 (100.0%) | 0 (0.0%) |
| $75,000 to $99,999 | 577 (78.6%) | 157 (21.4%) |
| $100,000 and over | 3,031 (96.6%) | 108 (3.4%) |
Public vs Private Health Insurance Coverage by Age in Tara Hills
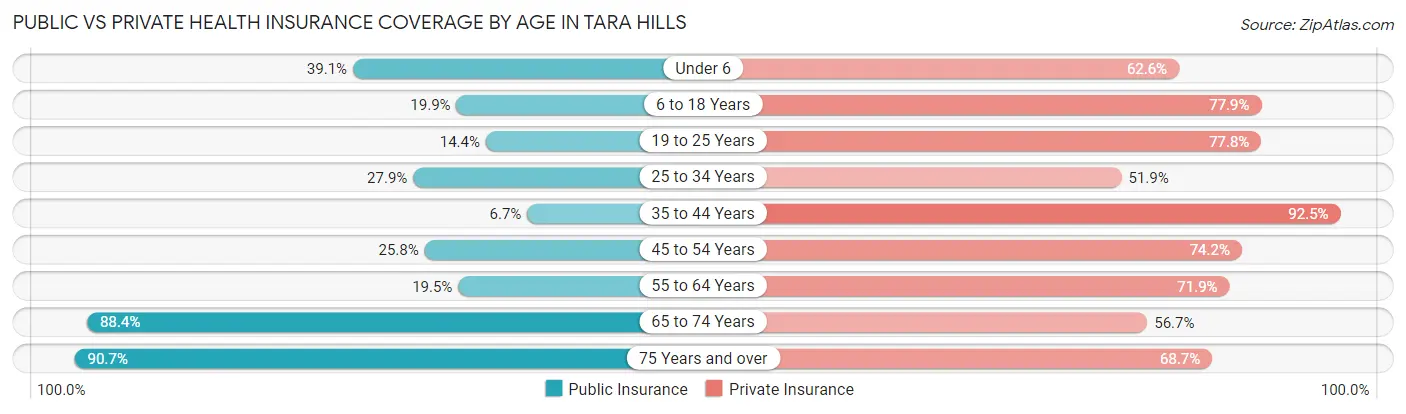
| Age Bracket | Public Insurance | Private Insurance |
| Under 6 | 216 (39.1%) | 346 (62.6%) |
| 6 to 18 Years | 130 (19.9%) | 510 (77.9%) |
| 19 to 25 Years | 52 (14.4%) | 281 (77.8%) |
| 25 to 34 Years | 189 (27.9%) | 352 (51.9%) |
| 35 to 44 Years | 45 (6.7%) | 620 (92.5%) |
| 45 to 54 Years | 227 (25.8%) | 654 (74.2%) |
| 55 to 64 Years | 121 (19.5%) | 446 (71.9%) |
| 65 to 74 Years | 435 (88.4%) | 279 (56.7%) |
| 75 Years and over | 264 (90.7%) | 200 (68.7%) |
| Total | 1,679 (32.3%) | 3,688 (70.9%) |
Disability Status by Sex by Age in Tara Hills
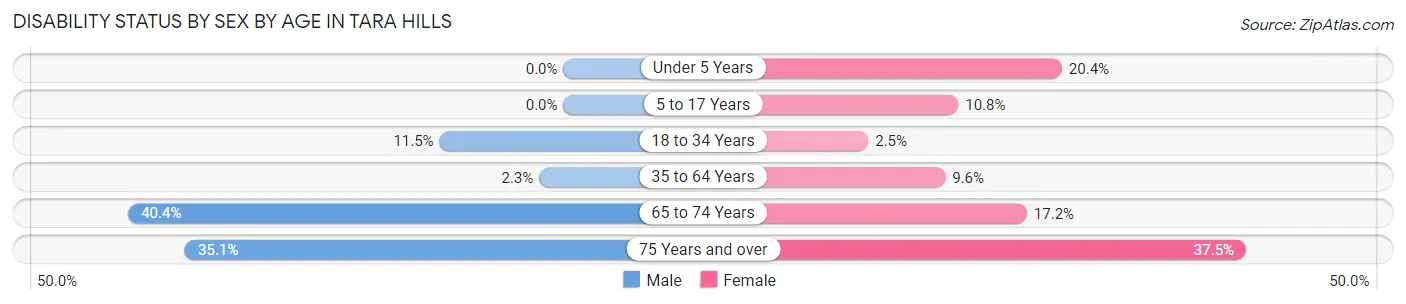
| Age Bracket | Male | Female |
| Under 5 Years | 0 (0.0%) | 47 (20.4%) |
| 5 to 17 Years | 0 (0.0%) | 52 (10.8%) |
| 18 to 34 Years | 56 (11.5%) | 14 (2.5%) |
| 35 to 64 Years | 25 (2.2%) | 102 (9.6%) |
| 65 to 74 Years | 107 (40.4%) | 39 (17.2%) |
| 75 Years and over | 46 (35.1%) | 60 (37.5%) |
Disability Class by Sex by Age in Tara Hills
Disability Class: Hearing Difficulty
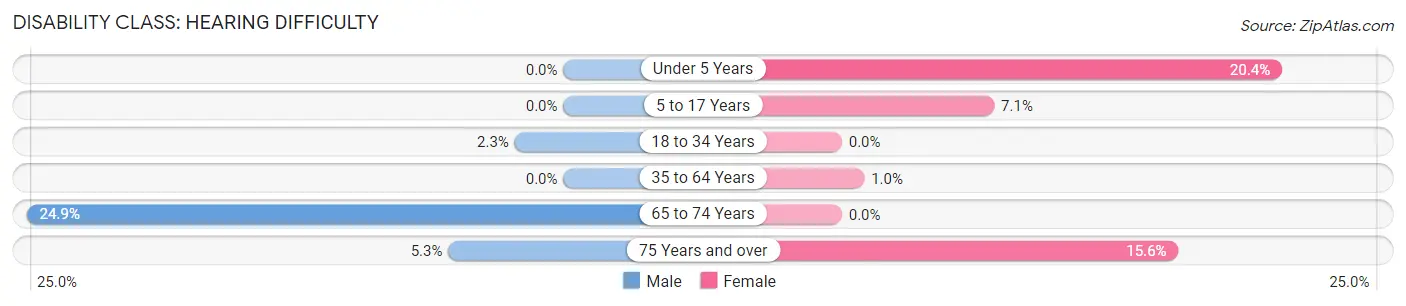
| Age Bracket | Male | Female |
| Under 5 Years | 0 (0.0%) | 47 (20.4%) |
| 5 to 17 Years | 0 (0.0%) | 34 (7.1%) |
| 18 to 34 Years | 11 (2.3%) | 0 (0.0%) |
| 35 to 64 Years | 0 (0.0%) | 11 (1.0%) |
| 65 to 74 Years | 66 (24.9%) | 0 (0.0%) |
| 75 Years and over | 7 (5.3%) | 25 (15.6%) |
Disability Class: Vision Difficulty
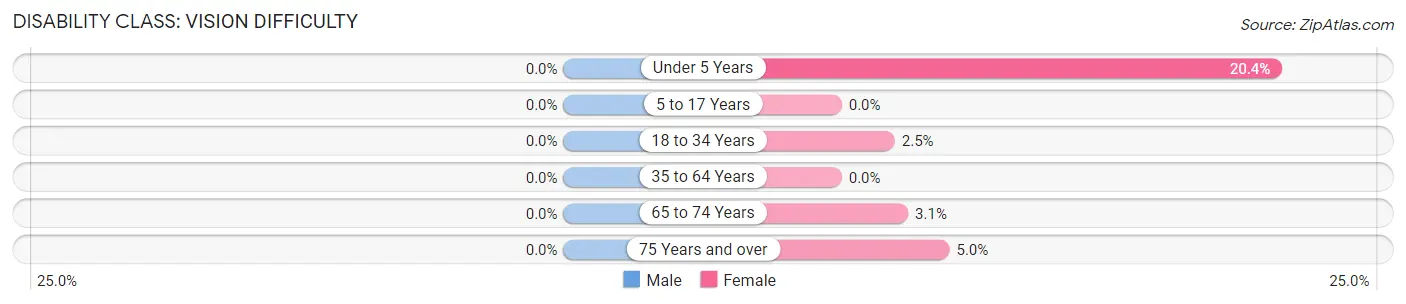
| Age Bracket | Male | Female |
| Under 5 Years | 0 (0.0%) | 47 (20.4%) |
| 5 to 17 Years | 0 (0.0%) | 0 (0.0%) |
| 18 to 34 Years | 0 (0.0%) | 14 (2.5%) |
| 35 to 64 Years | 0 (0.0%) | 0 (0.0%) |
| 65 to 74 Years | 0 (0.0%) | 7 (3.1%) |
| 75 Years and over | 0 (0.0%) | 8 (5.0%) |
Disability Class: Cognitive Difficulty
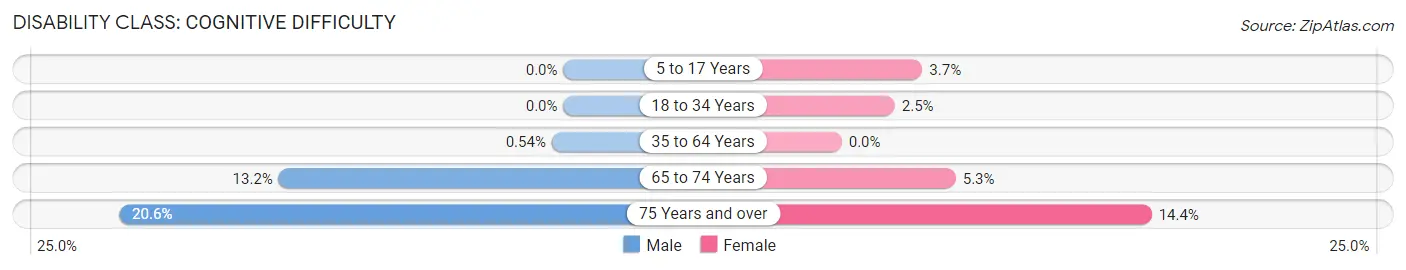
| Age Bracket | Male | Female |
| 5 to 17 Years | 0 (0.0%) | 18 (3.7%) |
| 18 to 34 Years | 0 (0.0%) | 14 (2.5%) |
| 35 to 64 Years | 6 (0.5%) | 0 (0.0%) |
| 65 to 74 Years | 35 (13.2%) | 12 (5.3%) |
| 75 Years and over | 27 (20.6%) | 23 (14.4%) |
Disability Class: Ambulatory Difficulty
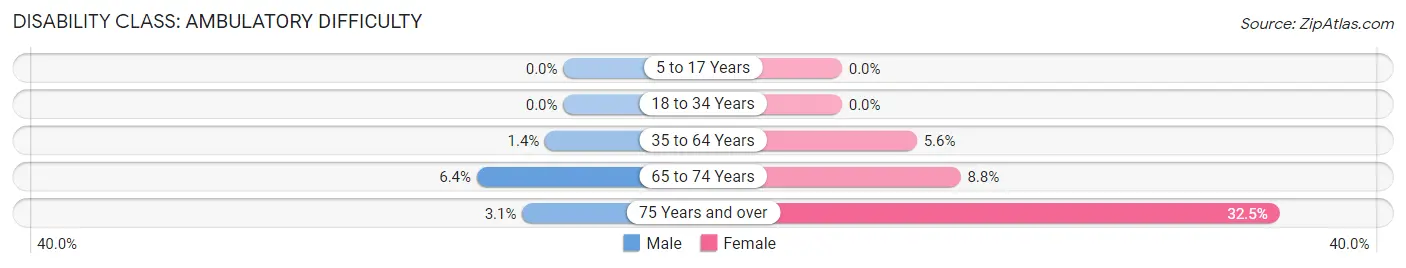
| Age Bracket | Male | Female |
| 5 to 17 Years | 0 (0.0%) | 0 (0.0%) |
| 18 to 34 Years | 0 (0.0%) | 0 (0.0%) |
| 35 to 64 Years | 15 (1.3%) | 59 (5.6%) |
| 65 to 74 Years | 17 (6.4%) | 20 (8.8%) |
| 75 Years and over | 4 (3.0%) | 52 (32.5%) |
Disability Class: Self-Care Difficulty
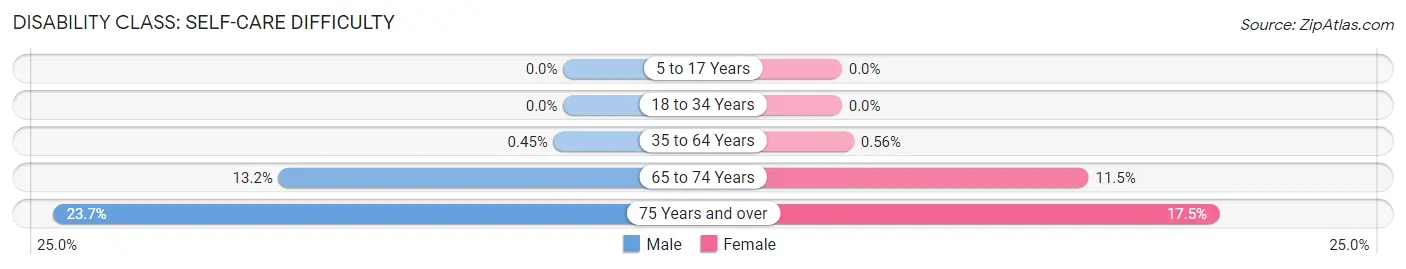
| Age Bracket | Male | Female |
| 5 to 17 Years | 0 (0.0%) | 0 (0.0%) |
| 18 to 34 Years | 0 (0.0%) | 0 (0.0%) |
| 35 to 64 Years | 5 (0.4%) | 6 (0.6%) |
| 65 to 74 Years | 35 (13.2%) | 26 (11.5%) |
| 75 Years and over | 31 (23.7%) | 28 (17.5%) |
Technology Access in Tara Hills
Computing Device Access in Tara Hills
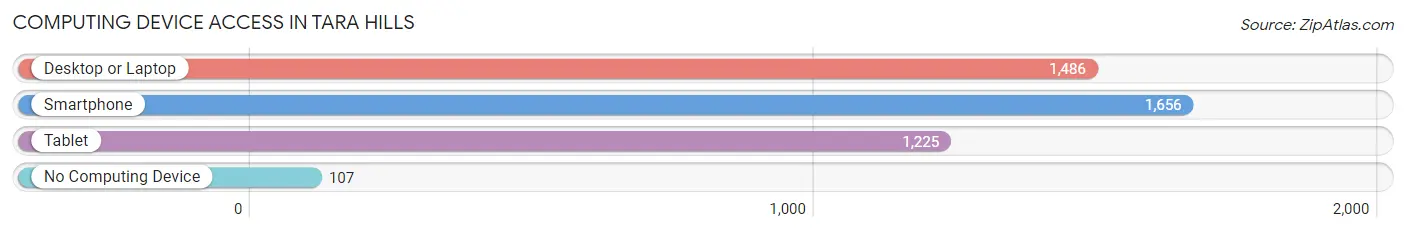
| Device Type | # Households | % Households |
| Desktop or Laptop | 1,486 | 83.9% |
| Smartphone | 1,656 | 93.4% |
| Tablet | 1,225 | 69.1% |
| No Computing Device | 107 | 6.0% |
| Total | 1,772 | 100.0% |
Internet Access in Tara Hills
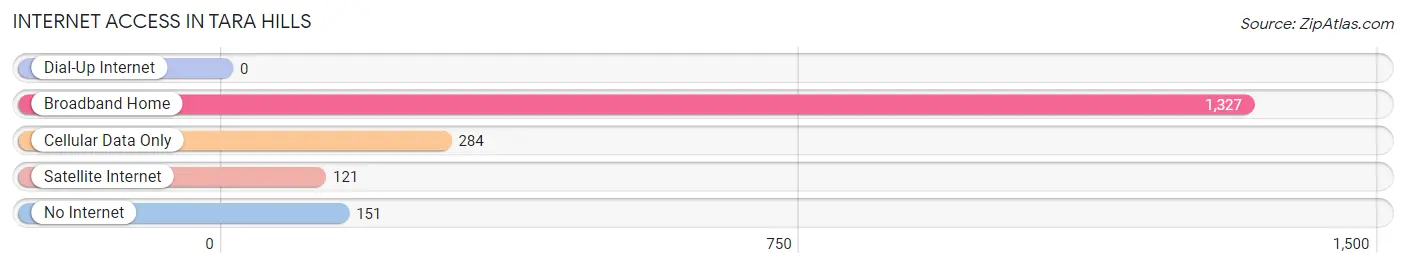
| Internet Type | # Households | % Households |
| Dial-Up Internet | 0 | 0.0% |
| Broadband Home | 1,327 | 74.9% |
| Cellular Data Only | 284 | 16.0% |
| Satellite Internet | 121 | 6.8% |
| No Internet | 151 | 8.5% |
| Total | 1,772 | 100.0% |
Tara Hills Summary
Tara Hills is a small city located in Contra Costa County, California. It is situated in the East Bay region of the San Francisco Bay Area, approximately 25 miles east of San Francisco. The city is bordered by the cities of San Pablo, Pinole, and Richmond. As of the 2010 census, the population of Tara Hills was 8,845.
History
Tara Hills was originally part of the Rancho San Pablo, a Mexican land grant given to Francisco Castro in 1823. The area was later acquired by the Miller-Lux family, who owned and operated a large cattle ranch in the area. In the early 1900s, the Miller-Lux family began to subdivide the land and sell it off to developers. The first subdivision was called Tara Hills, and it was developed in the 1920s.
The city of Tara Hills was officially incorporated in 1948. The city was named after the Miller-Lux family’s daughter, Tara. The city was primarily a residential community, with a few small businesses located in the downtown area.
Geography
Tara Hills is located in the East Bay region of the San Francisco Bay Area. It is situated in the San Pablo Bay, approximately 25 miles east of San Francisco. The city is bordered by the cities of San Pablo, Pinole, and Richmond.
The city has a total area of 1.7 square miles, all of which is land. The terrain is mostly flat, with some rolling hills in the northern part of the city. The climate is mild, with temperatures ranging from the mid-50s to the mid-70s throughout the year.
Economy
Tara Hills is primarily a residential community, with a few small businesses located in the downtown area. The city’s largest employer is the Tara Hills Unified School District, which employs over 500 people. Other major employers include the Contra Costa County Sheriff’s Office, the Tara Hills Fire Department, and the Tara Hills Public Library.
The city also has a number of small businesses, including restaurants, retail stores, and professional services. The city’s economy is largely supported by the surrounding communities, as many residents commute to nearby cities for work.
Demographics
As of the 2010 census, the population of Tara Hills was 8,845. The racial makeup of the city was 57.3% White, 22.2% Hispanic or Latino, 15.2% Asian, and 5.3% African American. The median household income was $68,845, and the median age was 39.
Tara Hills is a diverse community, with a variety of cultures and backgrounds represented. The city is home to a large Hispanic population, as well as a growing Asian population. The city also has a large number of families, with over half of the population under the age of 18.
Common Questions
What is Per Capita Income in Tara Hills?
Per Capita income in Tara Hills is $42,081.
What is the Median Family Income in Tara Hills?
Median Family Income in Tara Hills is $121,585.
What is the Median Household income in Tara Hills?
Median Household Income in Tara Hills is $113,333.
What is Income or Wage Gap in Tara Hills?
Income or Wage Gap in Tara Hills is 34.4%.
Women in Tara Hills earn 65.6 cents for every dollar earned by a man.
What is Inequality or Gini Index in Tara Hills?
Inequality or Gini Index in Tara Hills is 0.37.
What is the Total Population of Tara Hills?
Total Population of Tara Hills is 5,202.
What is the Total Male Population of Tara Hills?
Total Male Population of Tara Hills is 2,473.
What is the Total Female Population of Tara Hills?
Total Female Population of Tara Hills is 2,729.
What is the Ratio of Males per 100 Females in Tara Hills?
There are 90.62 Males per 100 Females in Tara Hills.
What is the Ratio of Females per 100 Males in Tara Hills?
There are 110.35 Females per 100 Males in Tara Hills.
What is the Median Population Age in Tara Hills?
Median Population Age in Tara Hills is 39.3 Years.
What is the Average Family Size in Tara Hills
Average Family Size in Tara Hills is 3.3 People.
What is the Average Household Size in Tara Hills
Average Household Size in Tara Hills is 2.9 People.
How Large is the Labor Force in Tara Hills?
There are 3,000 People in the Labor Forcein in Tara Hills.
What is the Percentage of People in the Labor Force in Tara Hills?
73.5% of People are in the Labor Force in Tara Hills.
What is the Unemployment Rate in Tara Hills?
Unemployment Rate in Tara Hills is 4.5%.