Florence Graham, CA Map & Demographics
Florence Graham Map
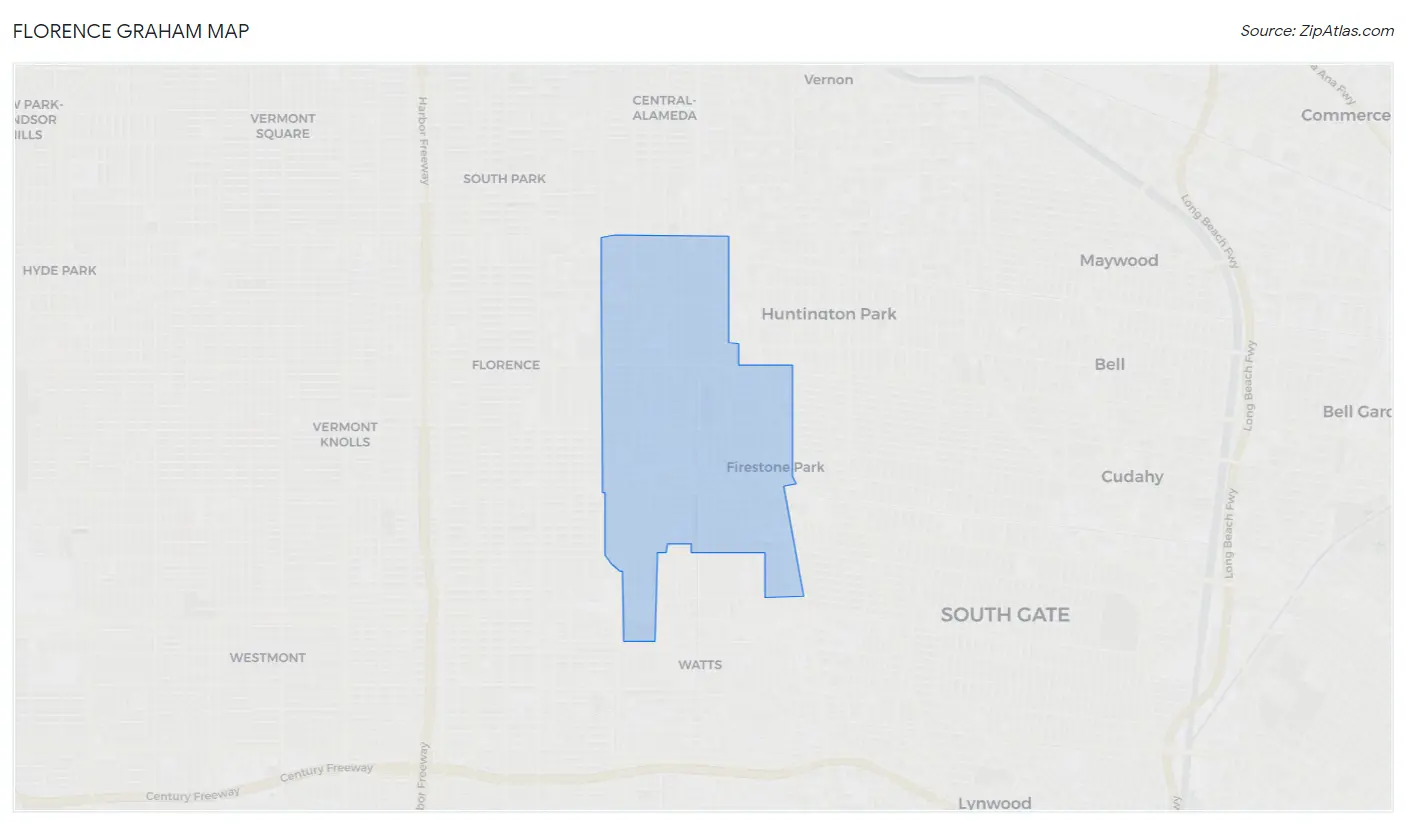
Florence Graham Overview
$17,607
PER CAPITA INCOME
$58,896
AVG FAMILY INCOME
$58,200
AVG HOUSEHOLD INCOME
26.9%
WAGE / INCOME GAP [ % ]
73.1¢/ $1
WAGE / INCOME GAP [ $ ]
$12,051
FAMILY INCOME DEFICIT
0.40
INEQUALITY / GINI INDEX
63,132
TOTAL POPULATION
31,969
MALE POPULATION
31,163
FEMALE POPULATION
102.59
MALES / 100 FEMALES
97.48
FEMALES / 100 MALES
30.4
MEDIAN AGE
4.6
AVG FAMILY SIZE
4.3
AVG HOUSEHOLD SIZE
29,298
LABOR FORCE [ PEOPLE ]
62.3%
PERCENT IN LABOR FORCE
10.2%
UNEMPLOYMENT RATE
Income in Florence Graham
Income Overview in Florence Graham
Per Capita Income in Florence Graham is $17,607, while median incomes of families and households are $58,896 and $58,200 respectively.
| Characteristic | Number | Measure |
| Per Capita Income | 63,132 | $17,607 |
| Median Family Income | 12,548 | $58,896 |
| Mean Family Income | 12,548 | $70,420 |
| Median Household Income | 14,630 | $58,200 |
| Mean Household Income | 14,630 | $70,520 |
| Income Deficit | 12,548 | $12,051 |
| Wage / Income Gap (%) | 63,132 | 26.91% |
| Wage / Income Gap ($) | 63,132 | 73.09¢ per $1 |
| Gini / Inequality Index | 63,132 | 0.40 |
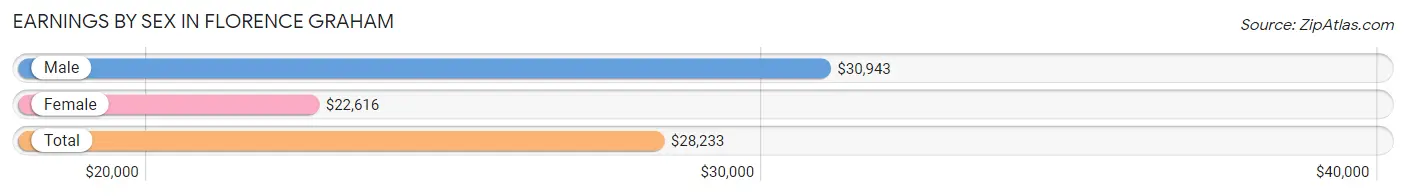
Earnings by Sex in Florence Graham
Average Earnings in Florence Graham are $28,233, $30,943 for men and $22,616 for women, a difference of 26.9%.
| Sex | Number | Average Earnings |
| Male | 17,172 (58.5%) | $30,943 |
| Female | 12,185 (41.5%) | $22,616 |
| Total | 29,357 (100.0%) | $28,233 |
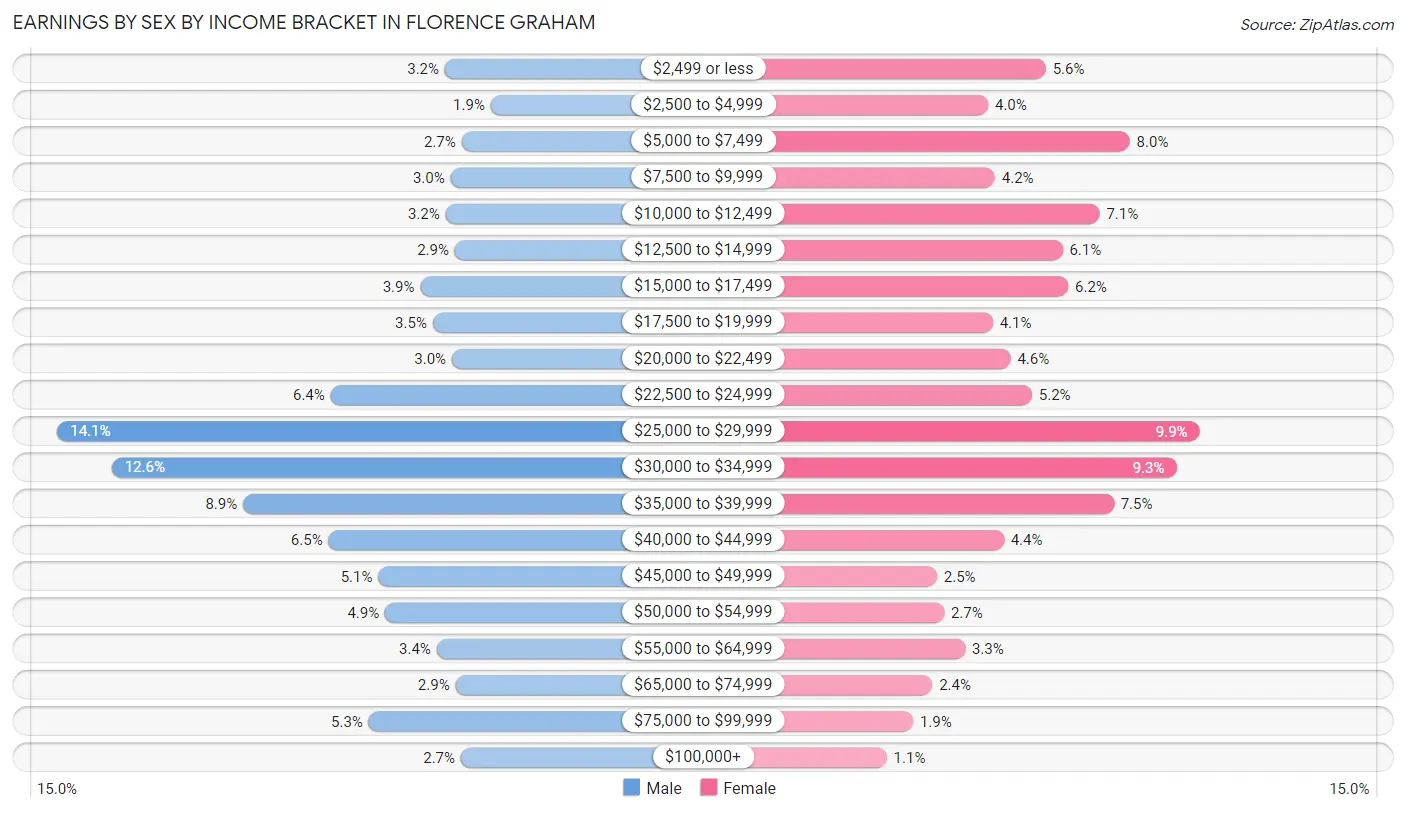
Earnings by Sex by Income Bracket in Florence Graham
The most common earnings brackets in Florence Graham are $25,000 to $29,999 for men (2,418 | 14.1%) and $25,000 to $29,999 for women (1,207 | 9.9%).
| Income | Male | Female |
| $2,499 or less | 548 (3.2%) | 681 (5.6%) |
| $2,500 to $4,999 | 326 (1.9%) | 484 (4.0%) |
| $5,000 to $7,499 | 467 (2.7%) | 969 (8.0%) |
| $7,500 to $9,999 | 521 (3.0%) | 507 (4.2%) |
| $10,000 to $12,499 | 545 (3.2%) | 865 (7.1%) |
| $12,500 to $14,999 | 500 (2.9%) | 739 (6.1%) |
| $15,000 to $17,499 | 667 (3.9%) | 758 (6.2%) |
| $17,500 to $19,999 | 606 (3.5%) | 499 (4.1%) |
| $20,000 to $22,499 | 514 (3.0%) | 561 (4.6%) |
| $22,500 to $24,999 | 1,099 (6.4%) | 634 (5.2%) |
| $25,000 to $29,999 | 2,418 (14.1%) | 1,207 (9.9%) |
| $30,000 to $34,999 | 2,155 (12.6%) | 1,128 (9.3%) |
| $35,000 to $39,999 | 1,522 (8.9%) | 914 (7.5%) |
| $40,000 to $44,999 | 1,109 (6.5%) | 537 (4.4%) |
| $45,000 to $49,999 | 869 (5.1%) | 308 (2.5%) |
| $50,000 to $54,999 | 837 (4.9%) | 333 (2.7%) |
| $55,000 to $64,999 | 587 (3.4%) | 405 (3.3%) |
| $65,000 to $74,999 | 497 (2.9%) | 293 (2.4%) |
| $75,000 to $99,999 | 915 (5.3%) | 227 (1.9%) |
| $100,000+ | 470 (2.7%) | 136 (1.1%) |
| Total | 17,172 (100.0%) | 12,185 (100.0%) |
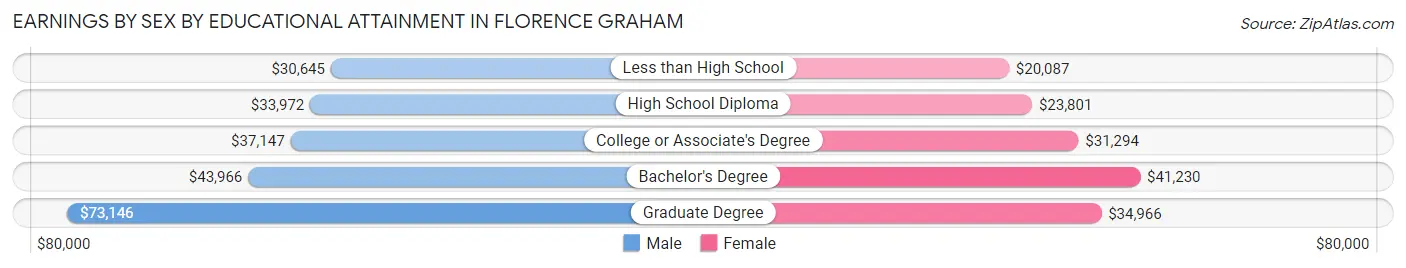
Earnings by Sex by Educational Attainment in Florence Graham
Average earnings in Florence Graham are $33,036 for men and $25,249 for women, a difference of 23.6%. Men with an educational attainment of graduate degree enjoy the highest average annual earnings of $73,146, while those with less than high school education earn the least with $30,645. Women with an educational attainment of bachelor's degree earn the most with the average annual earnings of $41,230, while those with less than high school education have the smallest earnings of $20,087.
| Educational Attainment | Male Income | Female Income |
| Less than High School | $30,645 | $20,087 |
| High School Diploma | $33,972 | $23,801 |
| College or Associate's Degree | $37,147 | $31,294 |
| Bachelor's Degree | $43,966 | $41,230 |
| Graduate Degree | $73,146 | $34,966 |
| Total | $33,036 | $25,249 |
Family Income in Florence Graham
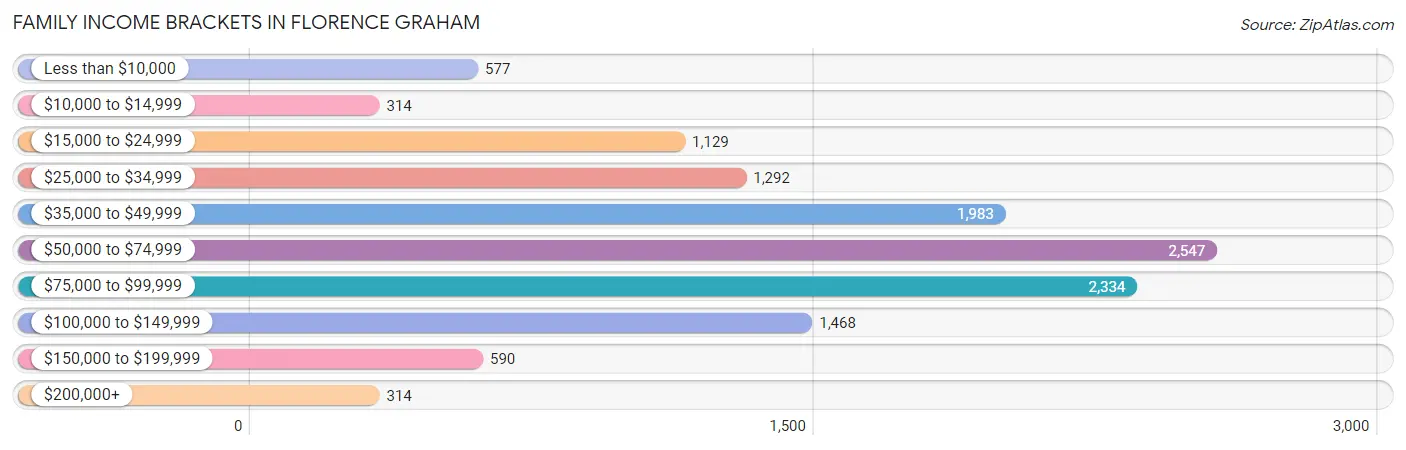
Family Income Brackets in Florence Graham
According to the Florence Graham family income data, there are 2,547 families falling into the $50,000 to $74,999 income range, which is the most common income bracket and makes up 20.3% of all families. Conversely, the $10,000 to $14,999 income bracket is the least frequent group with only 314 families (2.5%) belonging to this category.
| Income Bracket | # Families | % Families |
| Less than $10,000 | 577 | 4.6% |
| $10,000 to $14,999 | 314 | 2.5% |
| $15,000 to $24,999 | 1,129 | 9.0% |
| $25,000 to $34,999 | 1,292 | 10.3% |
| $35,000 to $49,999 | 1,983 | 15.8% |
| $50,000 to $74,999 | 2,547 | 20.3% |
| $75,000 to $99,999 | 2,334 | 18.6% |
| $100,000 to $149,999 | 1,468 | 11.7% |
| $150,000 to $199,999 | 590 | 4.7% |
| $200,000+ | 314 | 2.5% |
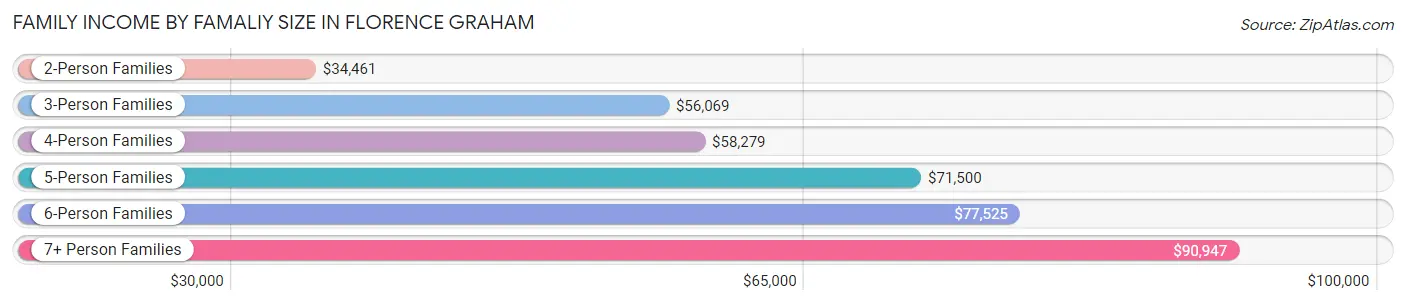
Family Income by Famaliy Size in Florence Graham
7+ person families (1,465 | 11.7%) account for the highest median family income in Florence Graham with $90,947 per family, while 3-person families (2,799 | 22.3%) have the highest median income of $18,690 per family member.
| Income Bracket | # Families | Median Income |
| 2-Person Families | 2,185 (17.4%) | $34,461 |
| 3-Person Families | 2,799 (22.3%) | $56,069 |
| 4-Person Families | 2,740 (21.8%) | $58,279 |
| 5-Person Families | 2,270 (18.1%) | $71,500 |
| 6-Person Families | 1,089 (8.7%) | $77,525 |
| 7+ Person Families | 1,465 (11.7%) | $90,947 |
| Total | 12,548 (100.0%) | $58,896 |
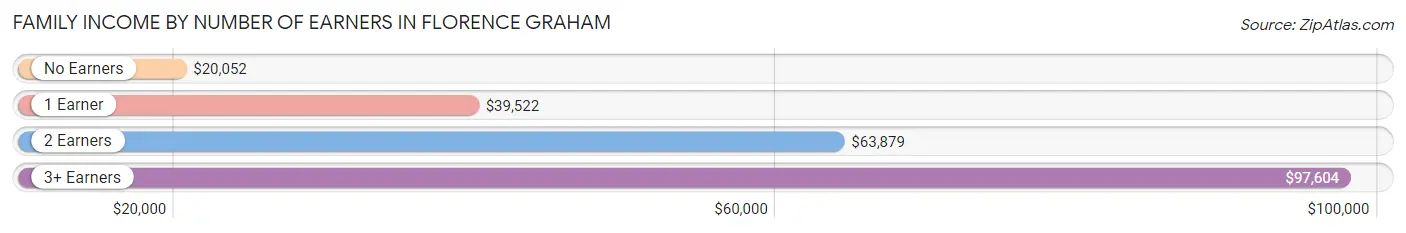
Family Income by Number of Earners in Florence Graham
The median family income in Florence Graham is $58,896, with families comprising 3+ earners (2,822) having the highest median family income of $97,604, while families with no earners (933) have the lowest median family income of $20,052, accounting for 22.5% and 7.4% of families, respectively.
| Number of Earners | # Families | Median Income |
| No Earners | 933 (7.4%) | $20,052 |
| 1 Earner | 4,271 (34.0%) | $39,522 |
| 2 Earners | 4,522 (36.0%) | $63,879 |
| 3+ Earners | 2,822 (22.5%) | $97,604 |
| Total | 12,548 (100.0%) | $58,896 |
Household Income in Florence Graham
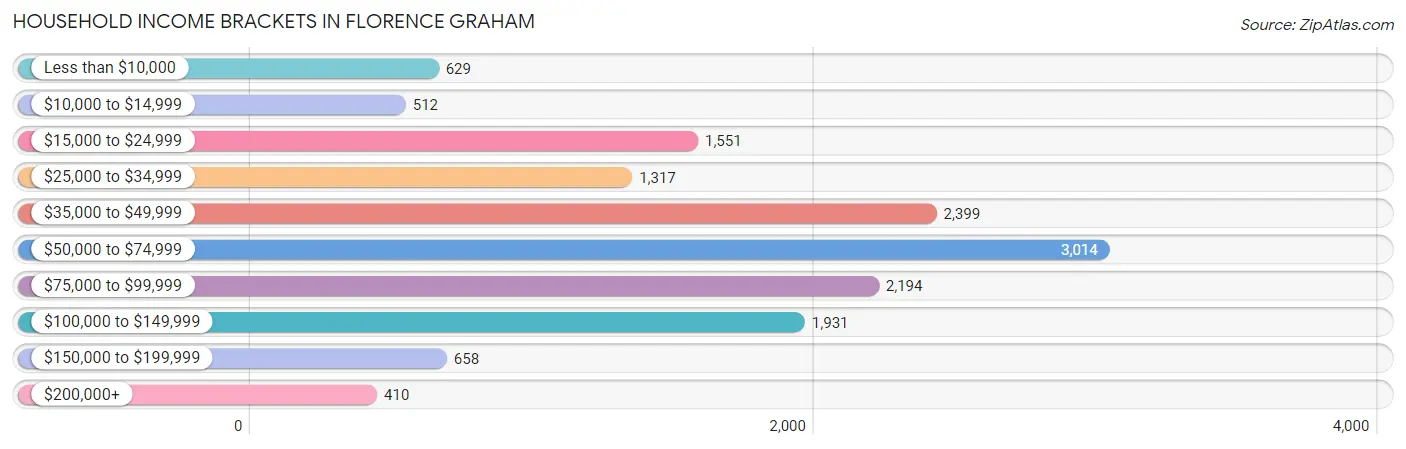
Household Income Brackets in Florence Graham
With 3,014 households falling in the category, the $50,000 to $74,999 income range is the most frequent in Florence Graham, accounting for 20.6% of all households. In contrast, only 410 households (2.8%) fall into the $200,000+ income bracket, making it the least populous group.
| Income Bracket | # Households | % Households |
| Less than $10,000 | 629 | 4.3% |
| $10,000 to $14,999 | 512 | 3.5% |
| $15,000 to $24,999 | 1,551 | 10.6% |
| $25,000 to $34,999 | 1,317 | 9.0% |
| $35,000 to $49,999 | 2,399 | 16.4% |
| $50,000 to $74,999 | 3,014 | 20.6% |
| $75,000 to $99,999 | 2,194 | 15.0% |
| $100,000 to $149,999 | 1,931 | 13.2% |
| $150,000 to $199,999 | 658 | 4.5% |
| $200,000+ | 410 | 2.8% |
Household Income by Householder Age in Florence Graham
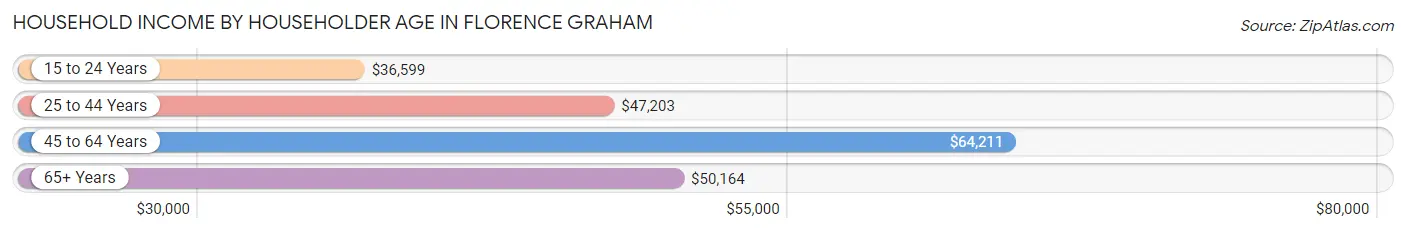
The median household income in Florence Graham is $58,200, with the highest median household income of $64,211 found in the 45 to 64 years age bracket for the primary householder. A total of 6,592 households (45.1%) fall into this category. Meanwhile, the 15 to 24 years age bracket for the primary householder has the lowest median household income of $36,599, with 333 households (2.3%) in this group.
| Income Bracket | # Households | Median Income |
| 15 to 24 Years | 333 (2.3%) | $36,599 |
| 25 to 44 Years | 5,326 (36.4%) | $47,203 |
| 45 to 64 Years | 6,592 (45.1%) | $64,211 |
| 65+ Years | 2,379 (16.3%) | $50,164 |
| Total | 14,630 (100.0%) | $58,200 |
Poverty in Florence Graham
Income Below Poverty by Sex and Age in Florence Graham
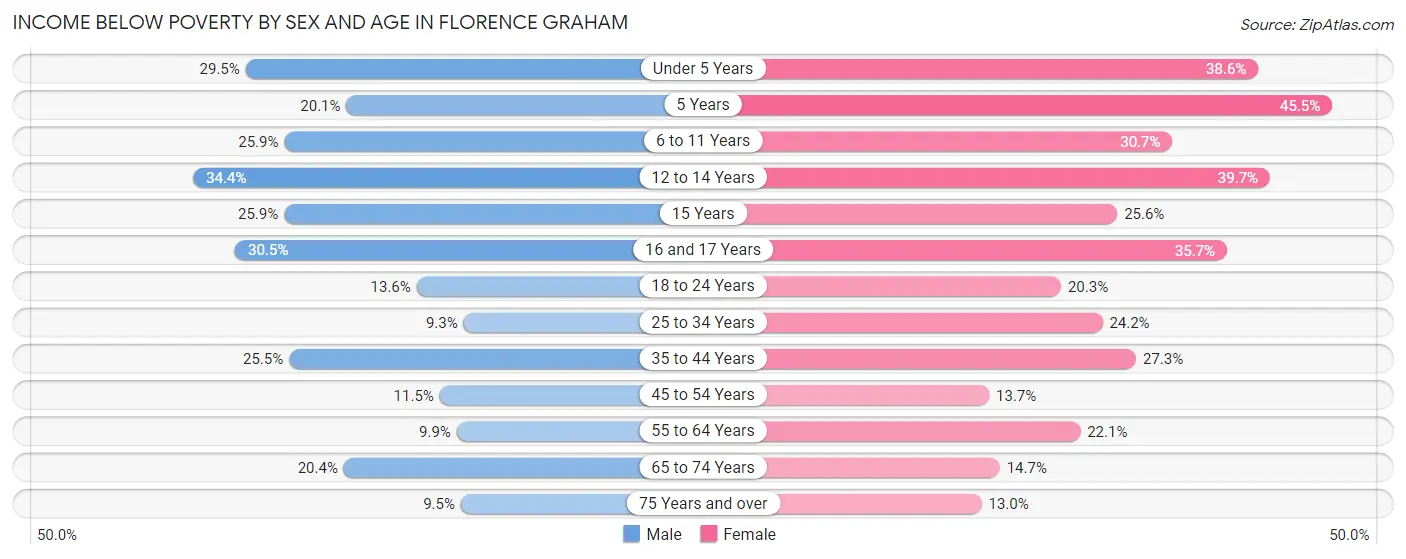
With 18.2% poverty level for males and 25.2% for females among the residents of Florence Graham, 12 to 14 year old males and 5 year old females are the most vulnerable to poverty, with 589 males (34.4%) and 172 females (45.5%) in their respective age groups living below the poverty level.
| Age Bracket | Male | Female |
| Under 5 Years | 606 (29.5%) | 932 (38.6%) |
| 5 Years | 115 (20.1%) | 172 (45.5%) |
| 6 to 11 Years | 827 (25.9%) | 952 (30.7%) |
| 12 to 14 Years | 589 (34.4%) | 563 (39.7%) |
| 15 Years | 134 (25.9%) | 160 (25.6%) |
| 16 and 17 Years | 318 (30.5%) | 456 (35.7%) |
| 18 to 24 Years | 536 (13.6%) | 709 (20.3%) |
| 25 to 34 Years | 489 (9.3%) | 1,172 (24.2%) |
| 35 to 44 Years | 1,005 (25.5%) | 1,185 (27.3%) |
| 45 to 54 Years | 483 (11.5%) | 478 (13.7%) |
| 55 to 64 Years | 302 (9.9%) | 684 (22.1%) |
| 65 to 74 Years | 351 (20.4%) | 246 (14.7%) |
| 75 Years and over | 67 (9.5%) | 120 (13.0%) |
| Total | 5,822 (18.2%) | 7,829 (25.2%) |
Income Above Poverty by Sex and Age in Florence Graham
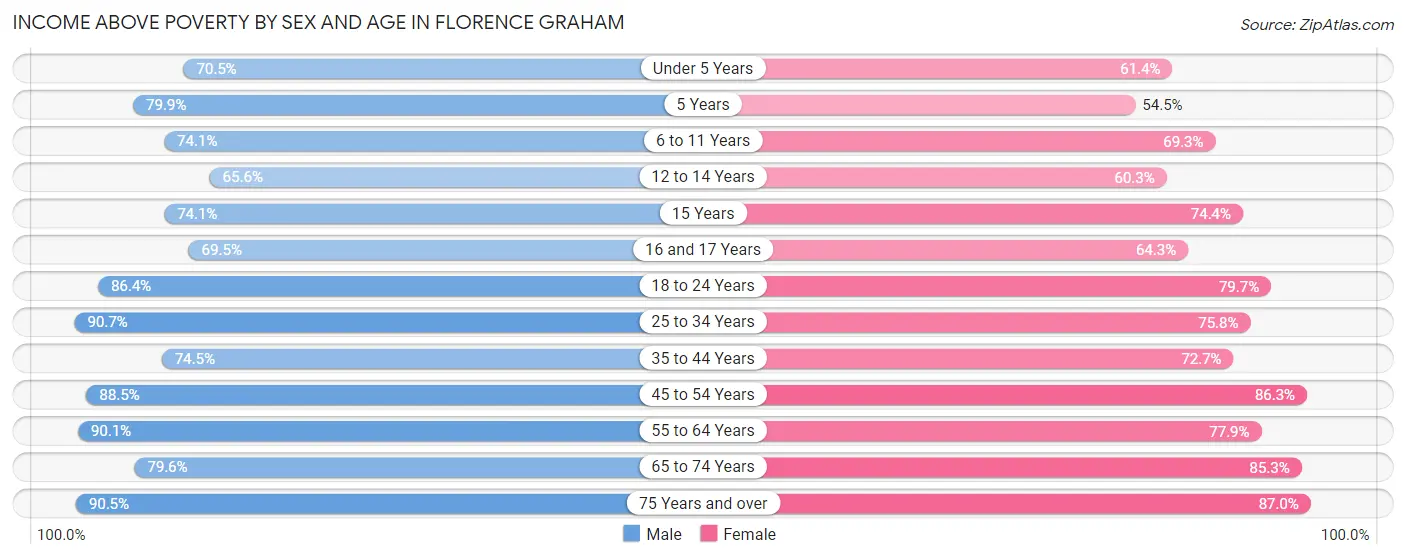
According to the poverty statistics in Florence Graham, males aged 25 to 34 years and females aged 75 years and over are the age groups that are most secure financially, with 90.7% of males and 87.0% of females in these age groups living above the poverty line.
| Age Bracket | Male | Female |
| Under 5 Years | 1,449 (70.5%) | 1,480 (61.4%) |
| 5 Years | 456 (79.9%) | 206 (54.5%) |
| 6 to 11 Years | 2,366 (74.1%) | 2,152 (69.3%) |
| 12 to 14 Years | 1,125 (65.6%) | 854 (60.3%) |
| 15 Years | 383 (74.1%) | 466 (74.4%) |
| 16 and 17 Years | 726 (69.5%) | 820 (64.3%) |
| 18 to 24 Years | 3,400 (86.4%) | 2,777 (79.7%) |
| 25 to 34 Years | 4,793 (90.7%) | 3,673 (75.8%) |
| 35 to 44 Years | 2,943 (74.5%) | 3,154 (72.7%) |
| 45 to 54 Years | 3,723 (88.5%) | 3,018 (86.3%) |
| 55 to 64 Years | 2,748 (90.1%) | 2,407 (77.9%) |
| 65 to 74 Years | 1,371 (79.6%) | 1,432 (85.3%) |
| 75 Years and over | 637 (90.5%) | 805 (87.0%) |
| Total | 26,120 (81.8%) | 23,244 (74.8%) |
Income Below Poverty Among Married-Couple Families in Florence Graham
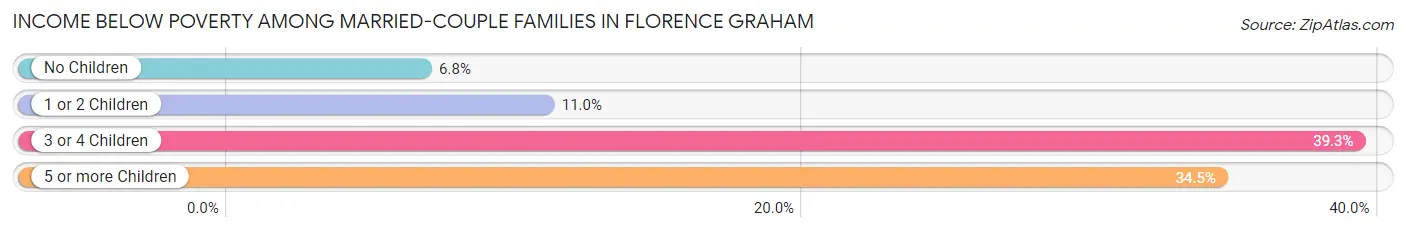
The poverty statistics for married-couple families in Florence Graham show that 14.1% or 996 of the total 7,080 families live below the poverty line. Families with 3 or 4 children have the highest poverty rate of 39.3%, comprising of 358 families. On the other hand, families with no children have the lowest poverty rate of 6.8%, which includes 166 families.
| Children | Above Poverty | Below Poverty |
| No Children | 2,289 (93.2%) | 166 (6.8%) |
| 1 or 2 Children | 3,066 (89.0%) | 380 (11.0%) |
| 3 or 4 Children | 554 (60.8%) | 358 (39.3%) |
| 5 or more Children | 175 (65.5%) | 92 (34.5%) |
| Total | 6,084 (85.9%) | 996 (14.1%) |
Income Below Poverty Among Single-Parent Households in Florence Graham
According to the poverty data in Florence Graham, 19.0% or 413 single-father households and 27.8% or 918 single-mother households are living below the poverty line. Among single-father households, those with 5 or more children have the highest poverty rate, with 28 households (36.8%) experiencing poverty. Likewise, among single-mother households, those with 3 or 4 children have the highest poverty rate, with 361 households (58.4%) falling below the poverty line.
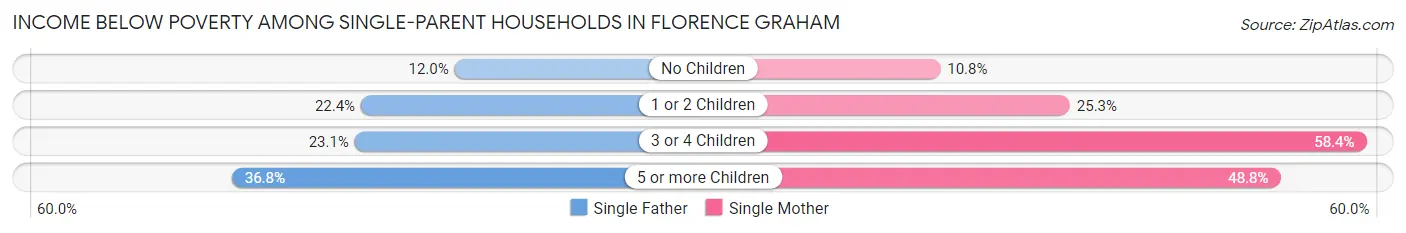
| Children | Single Father | Single Mother |
| No Children | 98 (11.9%) | 112 (10.8%) |
| 1 or 2 Children | 229 (22.4%) | 384 (25.3%) |
| 3 or 4 Children | 58 (23.1%) | 361 (58.4%) |
| 5 or more Children | 28 (36.8%) | 61 (48.8%) |
| Total | 413 (19.0%) | 918 (27.8%) |
Income Below Poverty Among Married-Couple vs Single-Parent Households in Florence Graham
The poverty data for Florence Graham shows that 996 of the married-couple family households (14.1%) and 1,331 of the single-parent households (24.3%) are living below the poverty level. Within the married-couple family households, those with 3 or 4 children have the highest poverty rate, with 358 households (39.3%) falling below the poverty line. Among the single-parent households, those with 3 or 4 children have the highest poverty rate, with 419 household (48.2%) living below poverty.
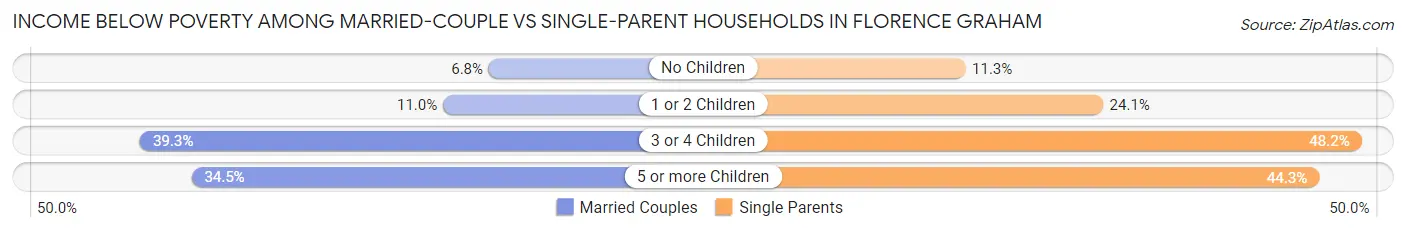
| Children | Married-Couple Families | Single-Parent Households |
| No Children | 166 (6.8%) | 210 (11.3%) |
| 1 or 2 Children | 380 (11.0%) | 613 (24.1%) |
| 3 or 4 Children | 358 (39.3%) | 419 (48.2%) |
| 5 or more Children | 92 (34.5%) | 89 (44.3%) |
| Total | 996 (14.1%) | 1,331 (24.3%) |
Race in Florence Graham
The most populous races in Florence Graham are Hispanic or Latino (59,099 | 93.6%), Some other Race (27,021 | 42.8%), and White / Caucasian (17,619 | 27.9%).
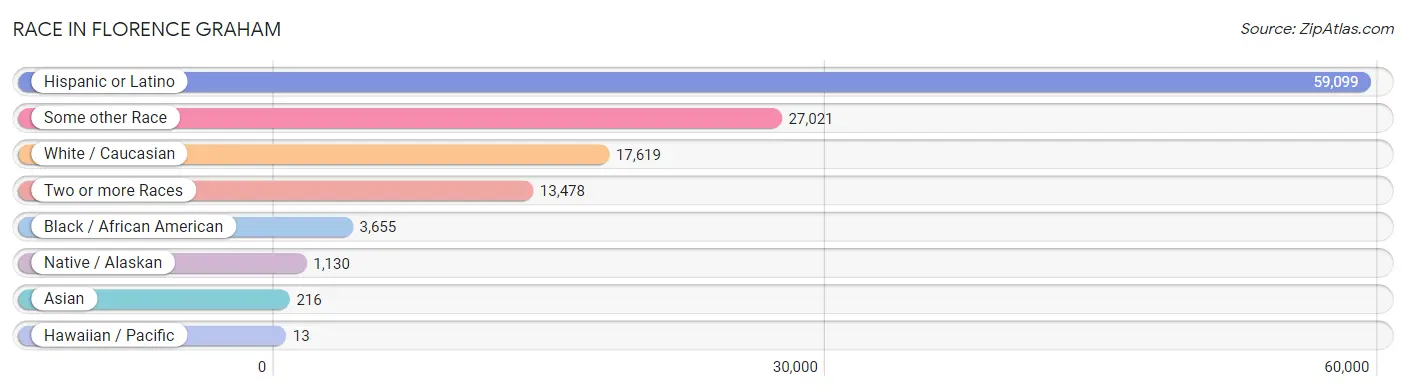
| Race | # Population | % Population |
| Asian | 216 | 0.3% |
| Black / African American | 3,655 | 5.8% |
| Hawaiian / Pacific | 13 | 0.0% |
| Hispanic or Latino | 59,099 | 93.6% |
| Native / Alaskan | 1,130 | 1.8% |
| White / Caucasian | 17,619 | 27.9% |
| Two or more Races | 13,478 | 21.3% |
| Some other Race | 27,021 | 42.8% |
| Total | 63,132 | 100.0% |
Ancestry in Florence Graham
The most populous ancestries reported in Florence Graham are Mexican (48,154 | 76.3%), Central American (9,383 | 14.9%), Salvadoran (5,711 | 9.0%), Guatemalan (2,298 | 3.6%), and American (1,515 | 2.4%), together accounting for 106.2% of all Florence Graham residents.
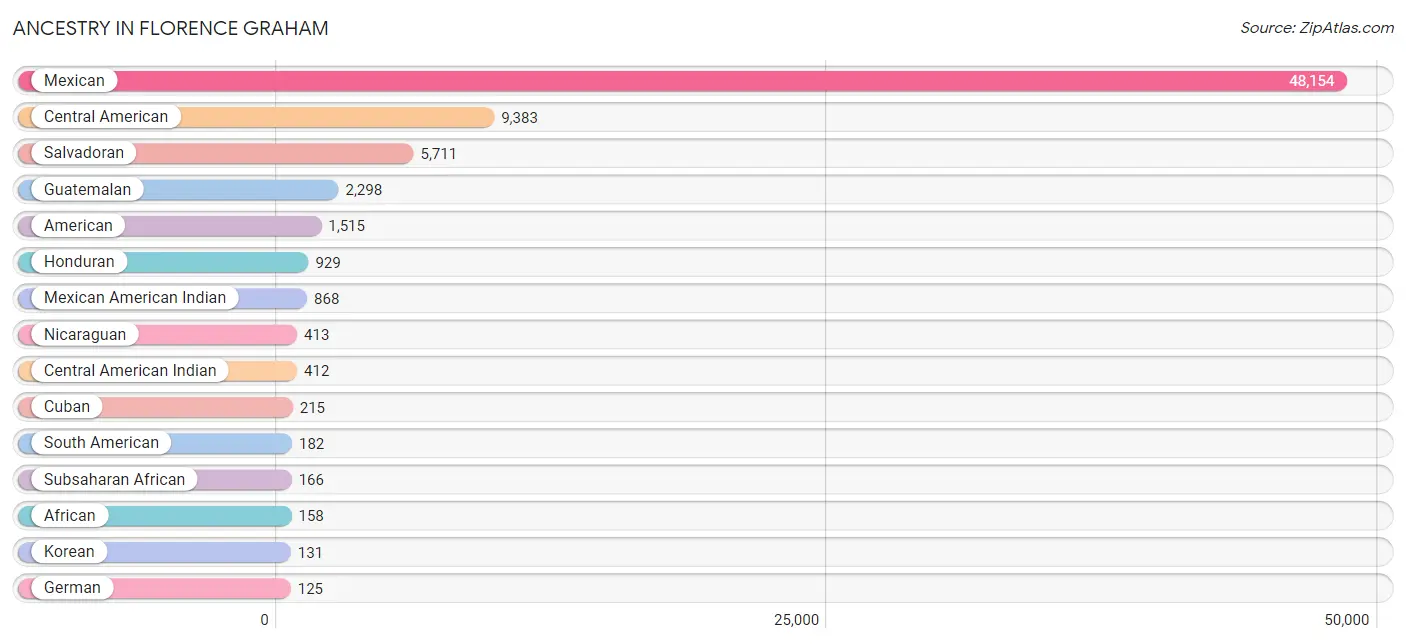
| Ancestry | # Population | % Population |
| African | 158 | 0.3% |
| American | 1,515 | 2.4% |
| Arab | 31 | 0.1% |
| Argentinean | 10 | 0.0% |
| Belizean | 113 | 0.2% |
| Bhutanese | 25 | 0.0% |
| British | 5 | 0.0% |
| Burmese | 42 | 0.1% |
| Canadian | 43 | 0.1% |
| Central American | 9,383 | 14.9% |
| Central American Indian | 412 | 0.6% |
| Cherokee | 6 | 0.0% |
| Colombian | 82 | 0.1% |
| Croatian | 26 | 0.0% |
| Cuban | 215 | 0.3% |
| Dominican | 39 | 0.1% |
| Ecuadorian | 13 | 0.0% |
| Egyptian | 31 | 0.1% |
| English | 7 | 0.0% |
| European | 59 | 0.1% |
| French | 77 | 0.1% |
| German | 125 | 0.2% |
| Greek | 50 | 0.1% |
| Guatemalan | 2,298 | 3.6% |
| Honduran | 929 | 1.5% |
| Indian (Asian) | 42 | 0.1% |
| Iranian | 31 | 0.1% |
| Irish | 93 | 0.2% |
| Israeli | 3 | 0.0% |
| Italian | 73 | 0.1% |
| Japanese | 57 | 0.1% |
| Kenyan | 8 | 0.0% |
| Korean | 131 | 0.2% |
| Laotian | 15 | 0.0% |
| Mexican | 48,154 | 76.3% |
| Mexican American Indian | 868 | 1.4% |
| Native Hawaiian | 68 | 0.1% |
| Nicaraguan | 413 | 0.6% |
| Norwegian | 6 | 0.0% |
| Panamanian | 10 | 0.0% |
| Peruvian | 47 | 0.1% |
| Polish | 1 | 0.0% |
| Portuguese | 119 | 0.2% |
| Puerto Rican | 60 | 0.1% |
| Salvadoran | 5,711 | 9.0% |
| Scottish | 42 | 0.1% |
| Sierra Leonean | 8 | 0.0% |
| Sioux | 25 | 0.0% |
| South American | 182 | 0.3% |
| Spaniard | 54 | 0.1% |
| Spanish | 27 | 0.0% |
| Sri Lankan | 20 | 0.0% |
| Subsaharan African | 166 | 0.3% |
| Swiss | 7 | 0.0% |
| Thai | 24 | 0.0% |
| Tongan | 13 | 0.0% |
| Venezuelan | 30 | 0.1% | View All 57 Rows |
Immigrants in Florence Graham
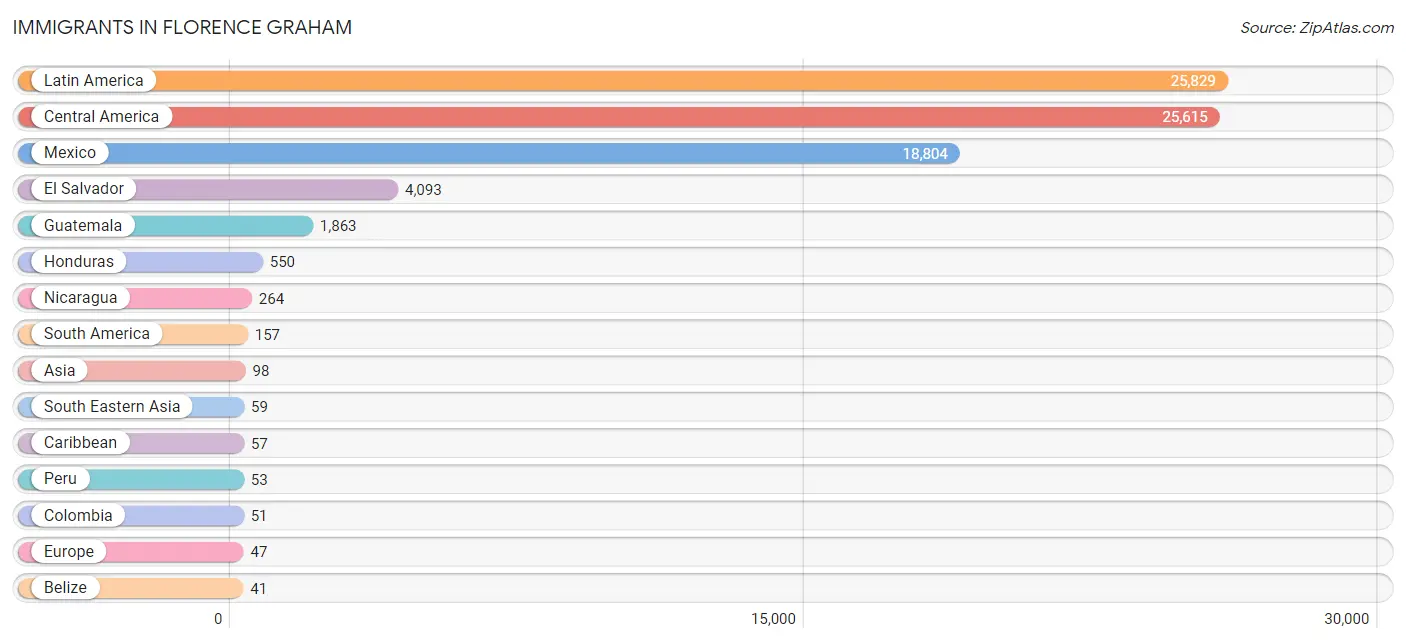
The most numerous immigrant groups reported in Florence Graham came from Latin America (25,829 | 40.9%), Central America (25,615 | 40.6%), Mexico (18,804 | 29.8%), El Salvador (4,093 | 6.5%), and Guatemala (1,863 | 2.9%), together accounting for 120.7% of all Florence Graham residents.
| Immigration Origin | # Population | % Population |
| Africa | 9 | 0.0% |
| Argentina | 10 | 0.0% |
| Asia | 98 | 0.2% |
| Belize | 41 | 0.1% |
| Canada | 14 | 0.0% |
| Caribbean | 57 | 0.1% |
| Central America | 25,615 | 40.6% |
| China | 12 | 0.0% |
| Colombia | 51 | 0.1% |
| Cuba | 12 | 0.0% |
| Dominican Republic | 36 | 0.1% |
| Eastern Asia | 29 | 0.1% |
| Eastern Europe | 22 | 0.0% |
| Ecuador | 13 | 0.0% |
| Egypt | 9 | 0.0% |
| El Salvador | 4,093 | 6.5% |
| Europe | 47 | 0.1% |
| Germany | 24 | 0.0% |
| Guatemala | 1,863 | 2.9% |
| Honduras | 550 | 0.9% |
| Indonesia | 7 | 0.0% |
| Iran | 10 | 0.0% |
| Jamaica | 9 | 0.0% |
| Korea | 17 | 0.0% |
| Latin America | 25,829 | 40.9% |
| Mexico | 18,804 | 29.8% |
| Nicaragua | 264 | 0.4% |
| Northern Africa | 9 | 0.0% |
| Peru | 53 | 0.1% |
| Philippines | 18 | 0.0% |
| South America | 157 | 0.3% |
| South Central Asia | 10 | 0.0% |
| South Eastern Asia | 59 | 0.1% |
| Southern Europe | 1 | 0.0% |
| Spain | 1 | 0.0% |
| Thailand | 14 | 0.0% |
| Venezuela | 30 | 0.1% |
| Vietnam | 20 | 0.0% |
| Western Europe | 24 | 0.0% | View All 39 Rows |
Sex and Age in Florence Graham
Sex and Age in Florence Graham
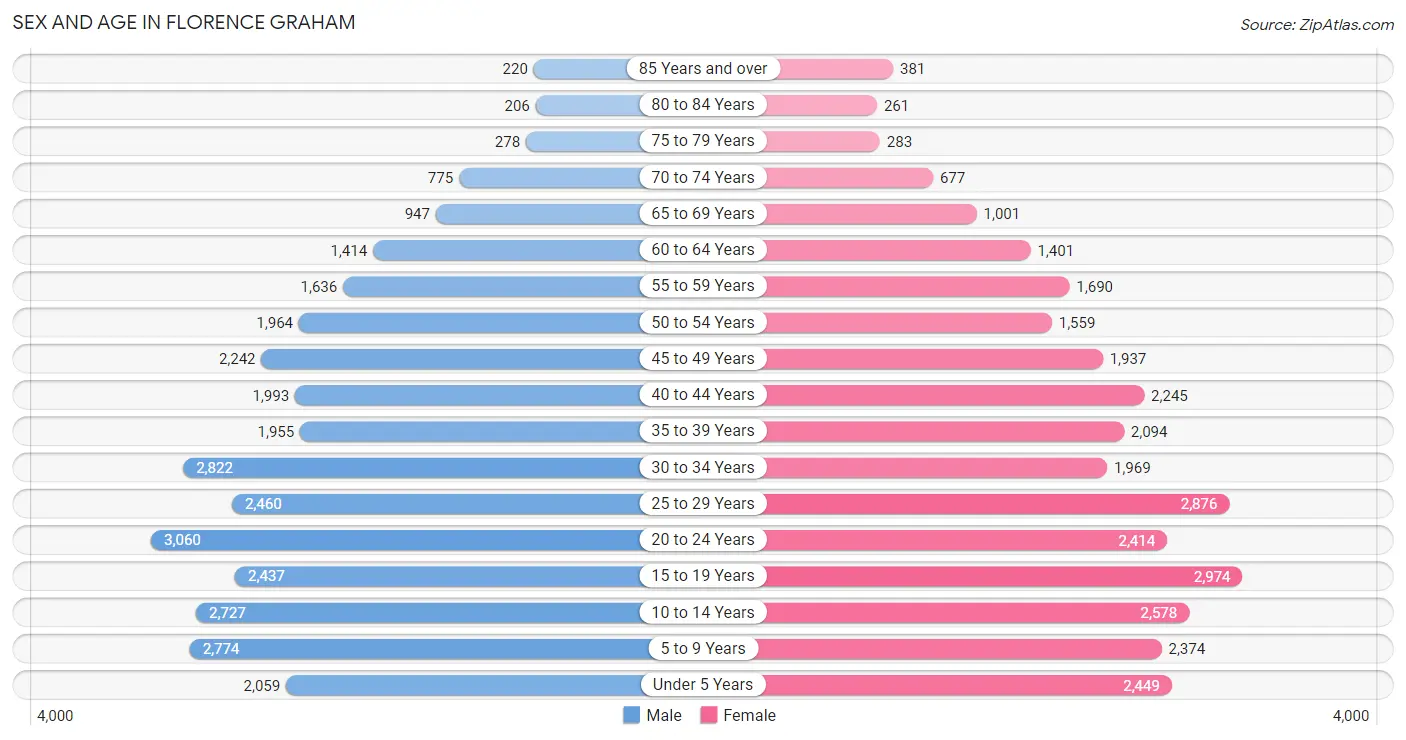
The most populous age groups in Florence Graham are 20 to 24 Years (3,060 | 9.6%) for men and 15 to 19 Years (2,974 | 9.5%) for women.
| Age Bracket | Male | Female |
| Under 5 Years | 2,059 (6.4%) | 2,449 (7.9%) |
| 5 to 9 Years | 2,774 (8.7%) | 2,374 (7.6%) |
| 10 to 14 Years | 2,727 (8.5%) | 2,578 (8.3%) |
| 15 to 19 Years | 2,437 (7.6%) | 2,974 (9.5%) |
| 20 to 24 Years | 3,060 (9.6%) | 2,414 (7.7%) |
| 25 to 29 Years | 2,460 (7.7%) | 2,876 (9.2%) |
| 30 to 34 Years | 2,822 (8.8%) | 1,969 (6.3%) |
| 35 to 39 Years | 1,955 (6.1%) | 2,094 (6.7%) |
| 40 to 44 Years | 1,993 (6.2%) | 2,245 (7.2%) |
| 45 to 49 Years | 2,242 (7.0%) | 1,937 (6.2%) |
| 50 to 54 Years | 1,964 (6.1%) | 1,559 (5.0%) |
| 55 to 59 Years | 1,636 (5.1%) | 1,690 (5.4%) |
| 60 to 64 Years | 1,414 (4.4%) | 1,401 (4.5%) |
| 65 to 69 Years | 947 (3.0%) | 1,001 (3.2%) |
| 70 to 74 Years | 775 (2.4%) | 677 (2.2%) |
| 75 to 79 Years | 278 (0.9%) | 283 (0.9%) |
| 80 to 84 Years | 206 (0.6%) | 261 (0.8%) |
| 85 Years and over | 220 (0.7%) | 381 (1.2%) |
| Total | 31,969 (100.0%) | 31,163 (100.0%) |
Families and Households in Florence Graham
Median Family Size in Florence Graham
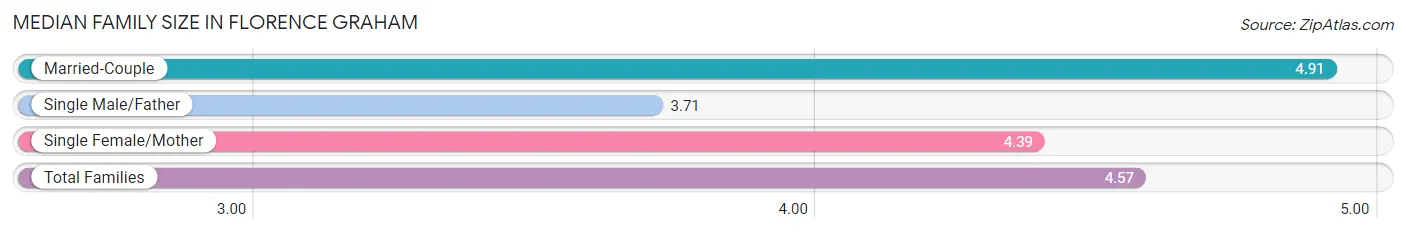
The median family size in Florence Graham is 4.57 persons per family, with married-couple families (7,080 | 56.4%) accounting for the largest median family size of 4.91 persons per family. On the other hand, single male/father families (2,169 | 17.3%) represent the smallest median family size with 3.71 persons per family.
| Family Type | # Families | Family Size |
| Married-Couple | 7,080 (56.4%) | 4.91 |
| Single Male/Father | 2,169 (17.3%) | 3.71 |
| Single Female/Mother | 3,299 (26.3%) | 4.39 |
| Total Families | 12,548 (100.0%) | 4.57 |
Median Household Size in Florence Graham
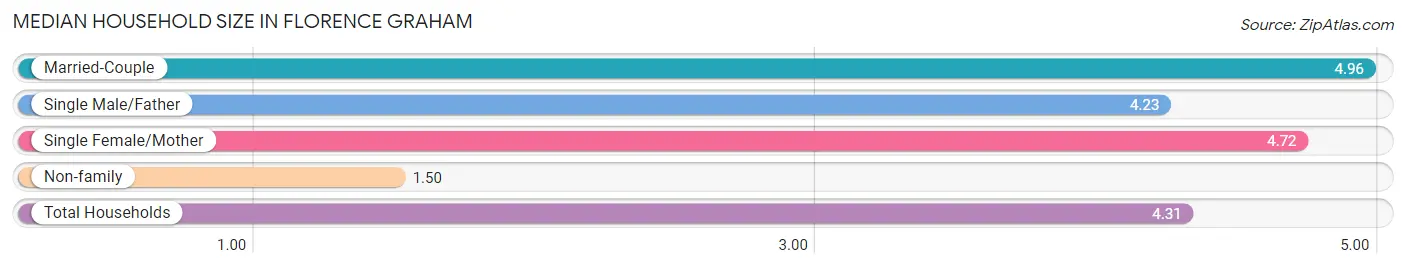
The median household size in Florence Graham is 4.31 persons per household, with married-couple households (7,080 | 48.4%) accounting for the largest median household size of 4.96 persons per household. non-family households (2,082 | 14.2%) represent the smallest median household size with 1.50 persons per household.
| Household Type | # Households | Household Size |
| Married-Couple | 7,080 (48.4%) | 4.96 |
| Single Male/Father | 2,169 (14.8%) | 4.23 |
| Single Female/Mother | 3,299 (22.6%) | 4.72 |
| Non-family | 2,082 (14.2%) | 1.50 |
| Total Households | 14,630 (100.0%) | 4.31 |
Household Size by Marriage Status in Florence Graham
Out of a total of 14,630 households in Florence Graham, 12,548 (85.8%) are family households, while 2,082 (14.2%) are nonfamily households. The most numerous type of family households are 4-person households, comprising 2,876, and the most common type of nonfamily households are 1-person households, comprising 1,440.
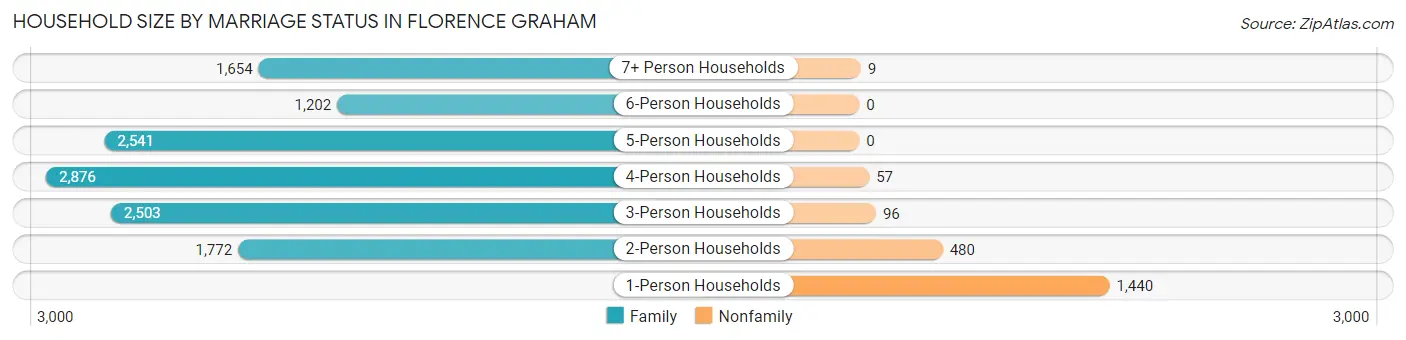
| Household Size | Family Households | Nonfamily Households |
| 1-Person Households | - | 1,440 (9.8%) |
| 2-Person Households | 1,772 (12.1%) | 480 (3.3%) |
| 3-Person Households | 2,503 (17.1%) | 96 (0.7%) |
| 4-Person Households | 2,876 (19.7%) | 57 (0.4%) |
| 5-Person Households | 2,541 (17.4%) | 0 (0.0%) |
| 6-Person Households | 1,202 (8.2%) | 0 (0.0%) |
| 7+ Person Households | 1,654 (11.3%) | 9 (0.1%) |
| Total | 12,548 (85.8%) | 2,082 (14.2%) |
Female Fertility in Florence Graham
Fertility by Age in Florence Graham
Average fertility rate in Florence Graham is 50.0 births per 1,000 women. Women in the age bracket of 20 to 34 years have the highest fertility rate with 78.0 births per 1,000 women. Women in the age bracket of 20 to 34 years acount for 66.4% of all women with births.
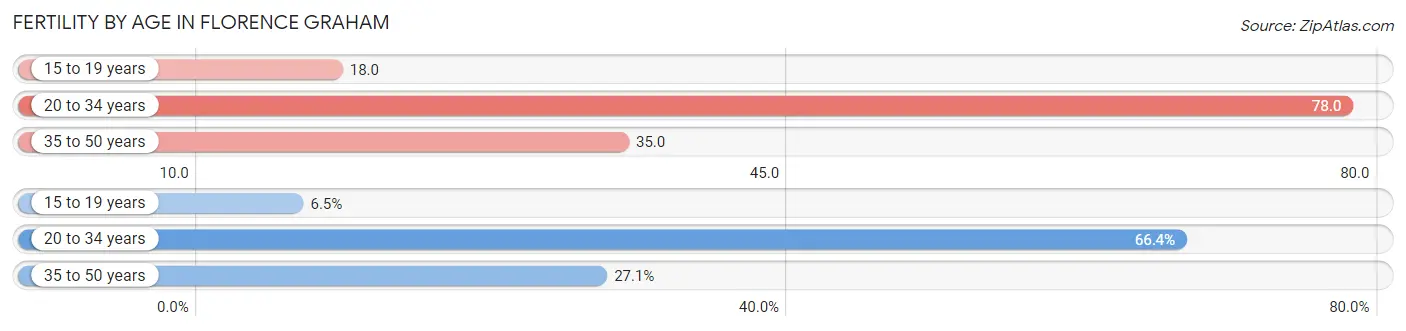
| Age Bracket | Women with Births | Births / 1,000 Women |
| 15 to 19 years | 55 (6.5%) | 18.0 |
| 20 to 34 years | 564 (66.4%) | 78.0 |
| 35 to 50 years | 230 (27.1%) | 35.0 |
| Total | 849 (100.0%) | 50.0 |
Fertility by Age by Marriage Status in Florence Graham
54.4% of women with births (849) in Florence Graham are married. The highest percentage of unmarried women with births falls into 15 to 19 years age bracket with 60.0% of them unmarried at the time of birth, while the lowest percentage of unmarried women with births belong to 35 to 50 years age bracket with 40.9% of them unmarried.
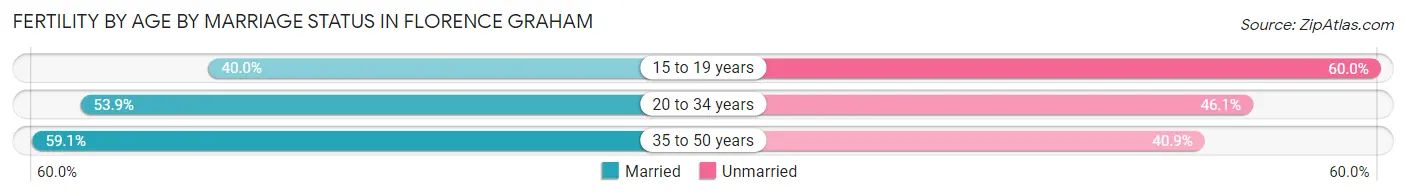
| Age Bracket | Married | Unmarried |
| 15 to 19 years | 22 (40.0%) | 33 (60.0%) |
| 20 to 34 years | 304 (53.9%) | 260 (46.1%) |
| 35 to 50 years | 136 (59.1%) | 94 (40.9%) |
| Total | 462 (54.4%) | 387 (45.6%) |
Fertility by Education in Florence Graham
Average fertility rate in Florence Graham is 50.0 births per 1,000 women. Women with the education attainment of graduate degree have the highest fertility rate of 141.0 births per 1,000 women, while women with the education attainment of bachelor's degree have the lowest fertility at 29.0 births per 1,000 women. Women with the education attainment of less than high school represent 45.5% of all women with births.
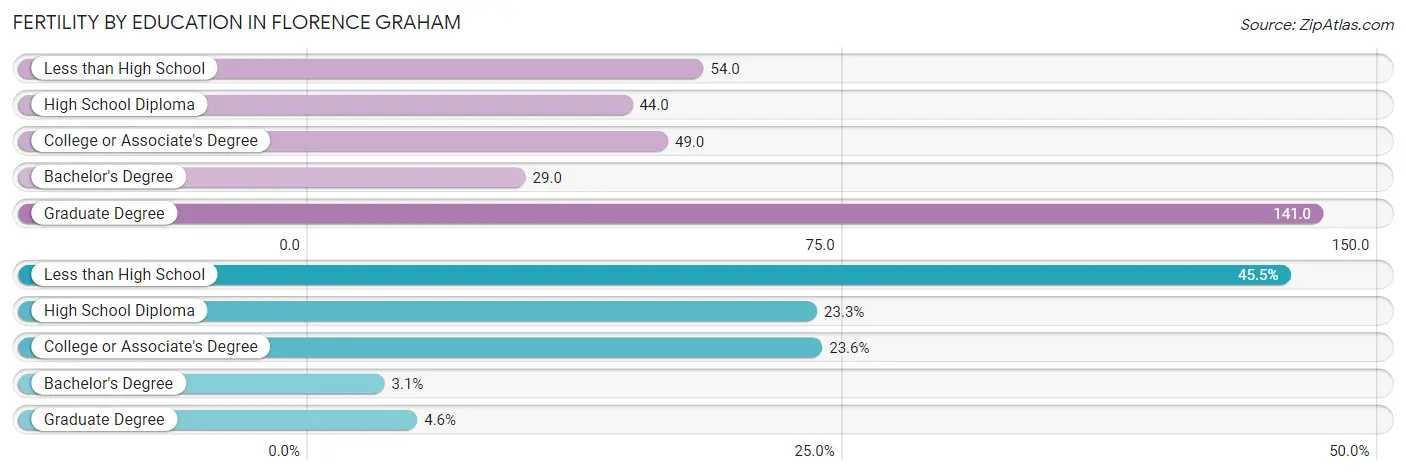
| Educational Attainment | Women with Births | Births / 1,000 Women |
| Less than High School | 386 (45.5%) | 54.0 |
| High School Diploma | 198 (23.3%) | 44.0 |
| College or Associate's Degree | 200 (23.6%) | 49.0 |
| Bachelor's Degree | 26 (3.1%) | 29.0 |
| Graduate Degree | 39 (4.6%) | 141.0 |
| Total | 849 (100.0%) | 50.0 |
Fertility by Education by Marriage Status in Florence Graham
45.6% of women with births in Florence Graham are unmarried. Women with the educational attainment of bachelor's degree are most likely to be married with 100.0% of them married at childbirth, while women with the educational attainment of high school diploma are least likely to be married with 66.7% of them unmarried at childbirth.
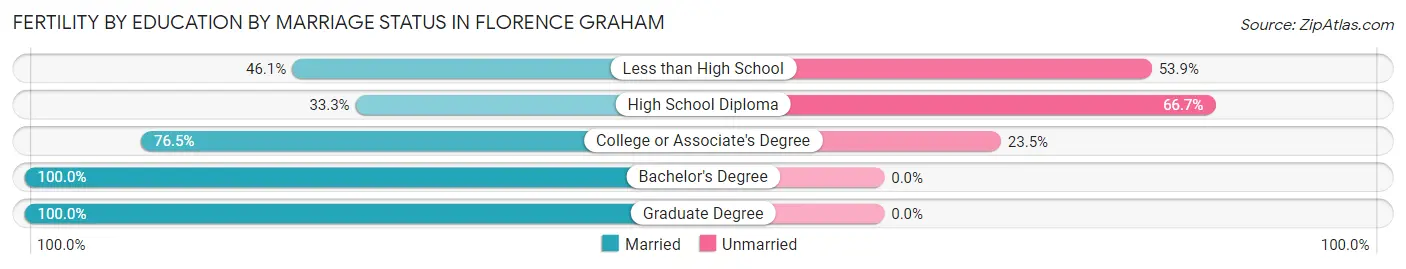
| Educational Attainment | Married | Unmarried |
| Less than High School | 178 (46.1%) | 208 (53.9%) |
| High School Diploma | 66 (33.3%) | 132 (66.7%) |
| College or Associate's Degree | 153 (76.5%) | 47 (23.5%) |
| Bachelor's Degree | 26 (100.0%) | 0 (0.0%) |
| Graduate Degree | 39 (100.0%) | 0 (0.0%) |
| Total | 462 (54.4%) | 387 (45.6%) |
Employment Characteristics in Florence Graham
Employment by Class of Employer in Florence Graham
Among the 25,253 employed individuals in Florence Graham, private company employees (19,275 | 76.3%), self-employed (not incorporated) (2,558 | 10.1%), and local government employees (1,226 | 4.9%) make up the most common classes of employment.
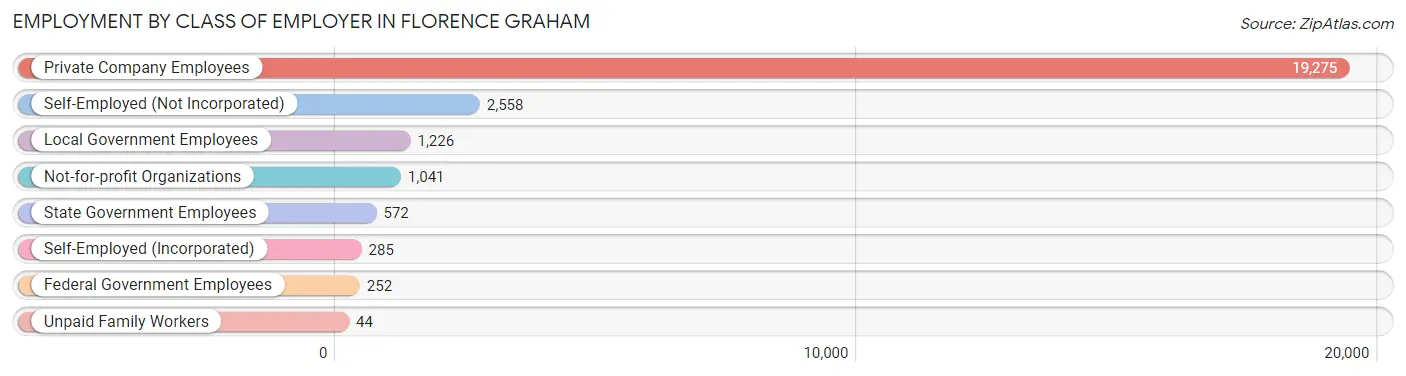
| Employer Class | # Employees | % Employees |
| Private Company Employees | 19,275 | 76.3% |
| Self-Employed (Incorporated) | 285 | 1.1% |
| Self-Employed (Not Incorporated) | 2,558 | 10.1% |
| Not-for-profit Organizations | 1,041 | 4.1% |
| Local Government Employees | 1,226 | 4.9% |
| State Government Employees | 572 | 2.3% |
| Federal Government Employees | 252 | 1.0% |
| Unpaid Family Workers | 44 | 0.2% |
| Total | 25,253 | 100.0% |
Employment Status by Age in Florence Graham
According to the labor force statistics for Florence Graham, out of the total population over 16 years of age (47,028), 62.3% or 29,298 individuals are in the labor force, with 10.2% or 2,988 of them unemployed. The age group with the highest labor force participation rate is 45 to 54 years, with 79.0% or 6,085 individuals in the labor force. Within the labor force, the 16 to 19 years age range has the highest percentage of unemployed individuals, with 30.6% or 302 of them being unemployed.
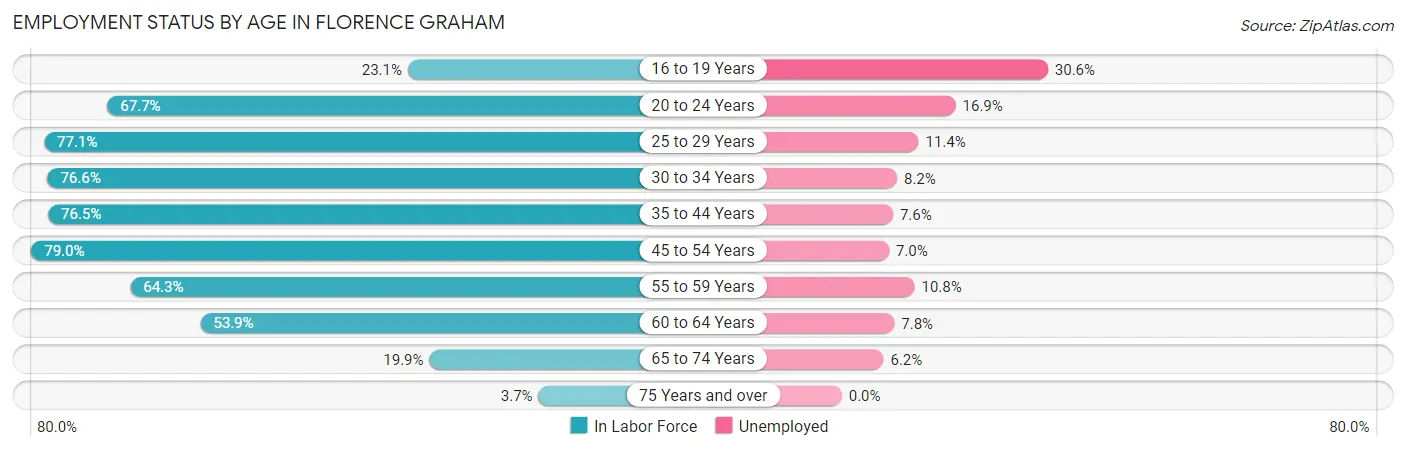
| Age Bracket | In Labor Force | Unemployed |
| 16 to 19 Years | 986 (23.1%) | 302 (30.6%) |
| 20 to 24 Years | 3,706 (67.7%) | 626 (16.9%) |
| 25 to 29 Years | 4,114 (77.1%) | 469 (11.4%) |
| 30 to 34 Years | 3,670 (76.6%) | 301 (8.2%) |
| 35 to 44 Years | 6,340 (76.5%) | 482 (7.6%) |
| 45 to 54 Years | 6,085 (79.0%) | 426 (7.0%) |
| 55 to 59 Years | 2,139 (64.3%) | 231 (10.8%) |
| 60 to 64 Years | 1,517 (53.9%) | 118 (7.8%) |
| 65 to 74 Years | 677 (19.9%) | 42 (6.2%) |
| 75 Years and over | 60 (3.7%) | 0 (0.0%) |
| Total | 29,298 (62.3%) | 2,988 (10.2%) |
Employment Status by Educational Attainment in Florence Graham
According to labor force statistics for Florence Graham, 74.0% of individuals (23,870) out of the total population between 25 and 64 years of age (32,257) are in the labor force, with 8.5% or 2,029 of them being unemployed. The group with the highest labor force participation rate are those with the educational attainment of college / associate degree, with 83.7% or 4,840 individuals in the labor force. Within the labor force, individuals with high school diploma education have the highest percentage of unemployment, with 10.5% or 649 of them being unemployed.
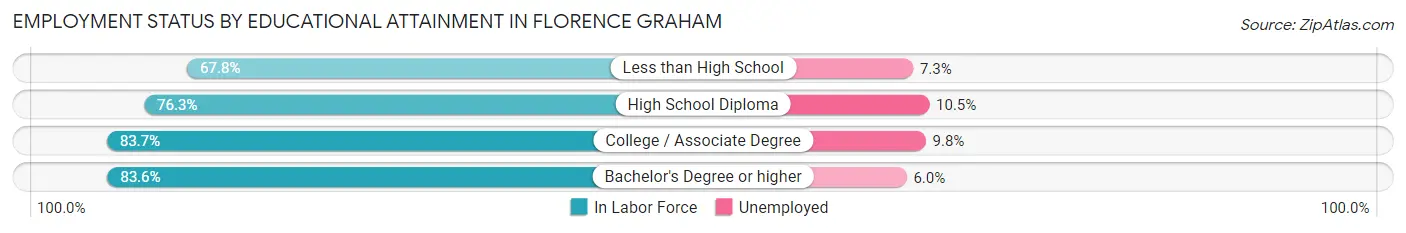
| Educational Attainment | In Labor Force | Unemployed |
| Less than High School | 10,841 (67.8%) | 1,167 (7.3%) |
| High School Diploma | 6,185 (76.3%) | 851 (10.5%) |
| College / Associate Degree | 4,840 (83.7%) | 567 (9.8%) |
| Bachelor's Degree or higher | 1,989 (83.6%) | 143 (6.0%) |
| Total | 23,870 (74.0%) | 2,742 (8.5%) |
Employment Occupations by Sex in Florence Graham
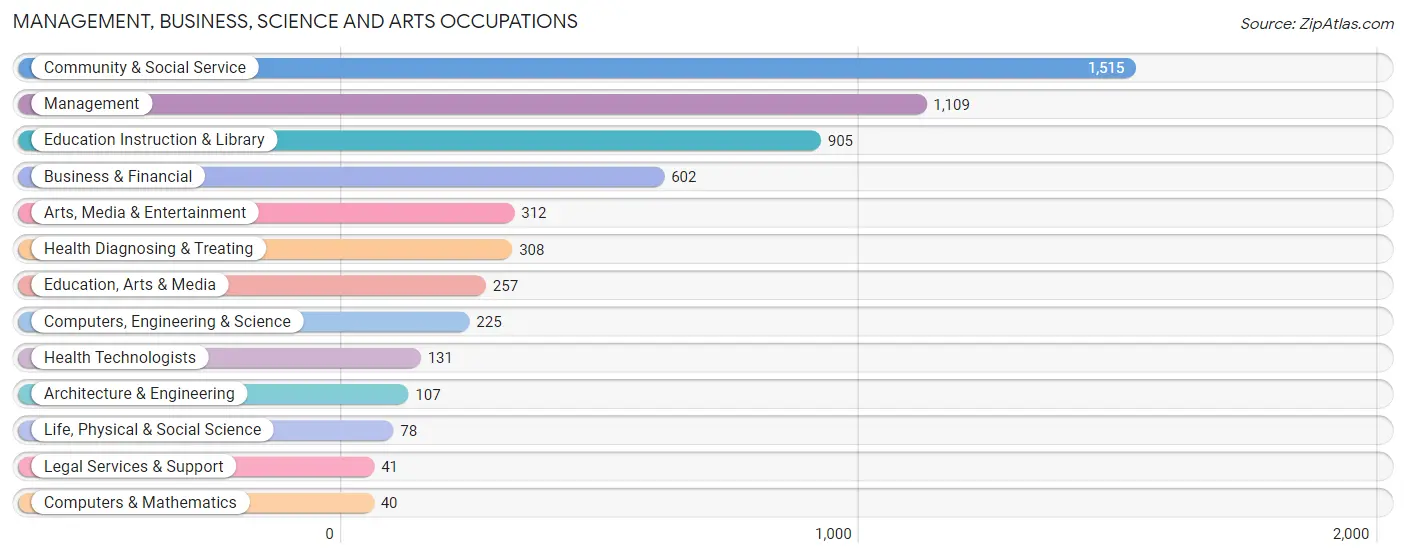
Management, Business, Science and Arts Occupations
The most common Management, Business, Science and Arts occupations in Florence Graham are Community & Social Service (1,515 | 5.8%), Management (1,109 | 4.2%), Education Instruction & Library (905 | 3.4%), Business & Financial (602 | 2.3%), and Arts, Media & Entertainment (312 | 1.2%).
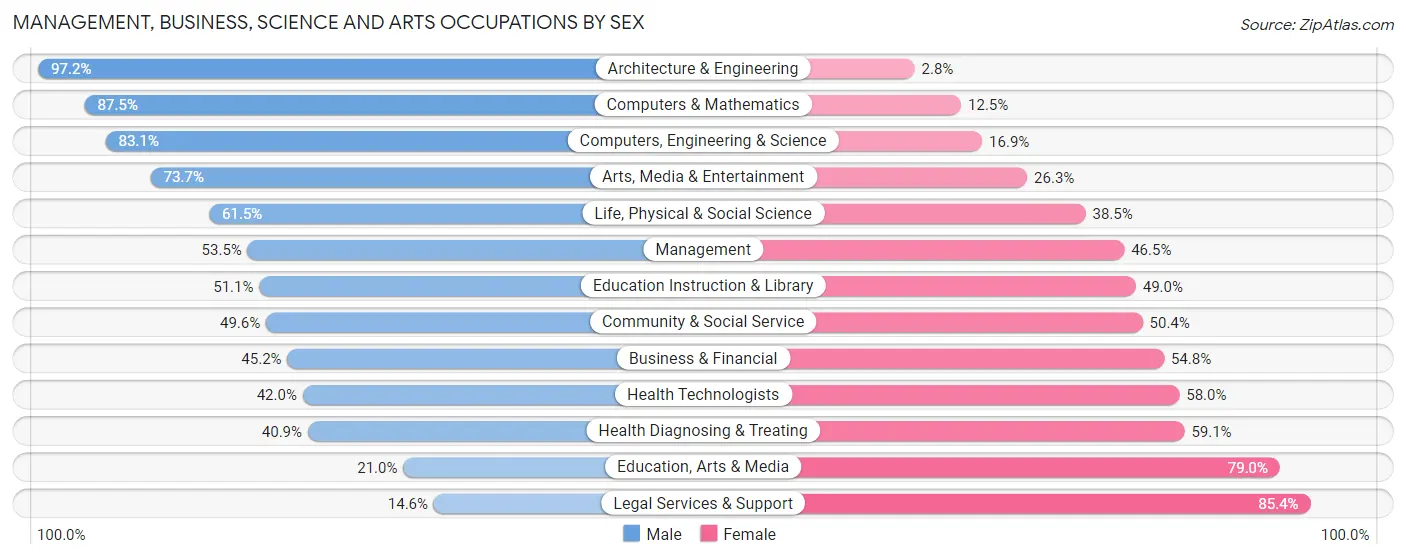
Management, Business, Science and Arts Occupations by Sex
Within the Management, Business, Science and Arts occupations in Florence Graham, the most male-oriented occupations are Architecture & Engineering (97.2%), Computers & Mathematics (87.5%), and Computers, Engineering & Science (83.1%), while the most female-oriented occupations are Legal Services & Support (85.4%), Education, Arts & Media (79.0%), and Health Diagnosing & Treating (59.1%).
| Occupation | Male | Female |
| Management | 593 (53.5%) | 516 (46.5%) |
| Business & Financial | 272 (45.2%) | 330 (54.8%) |
| Computers, Engineering & Science | 187 (83.1%) | 38 (16.9%) |
| Computers & Mathematics | 35 (87.5%) | 5 (12.5%) |
| Architecture & Engineering | 104 (97.2%) | 3 (2.8%) |
| Life, Physical & Social Science | 48 (61.5%) | 30 (38.5%) |
| Community & Social Service | 752 (49.6%) | 763 (50.4%) |
| Education, Arts & Media | 54 (21.0%) | 203 (79.0%) |
| Legal Services & Support | 6 (14.6%) | 35 (85.4%) |
| Education Instruction & Library | 462 (51.0%) | 443 (48.9%) |
| Arts, Media & Entertainment | 230 (73.7%) | 82 (26.3%) |
| Health Diagnosing & Treating | 126 (40.9%) | 182 (59.1%) |
| Health Technologists | 55 (42.0%) | 76 (58.0%) |
| Total (Category) | 1,930 (51.3%) | 1,829 (48.7%) |
| Total (Overall) | 15,681 (59.7%) | 10,605 (40.3%) |
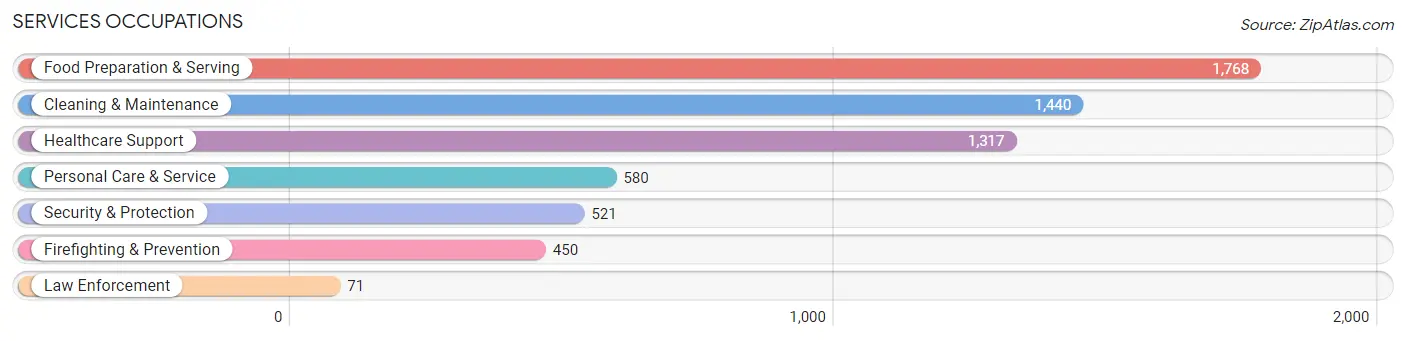
Services Occupations
The most common Services occupations in Florence Graham are Food Preparation & Serving (1,768 | 6.7%), Cleaning & Maintenance (1,440 | 5.5%), Healthcare Support (1,317 | 5.0%), Personal Care & Service (580 | 2.2%), and Security & Protection (521 | 2.0%).
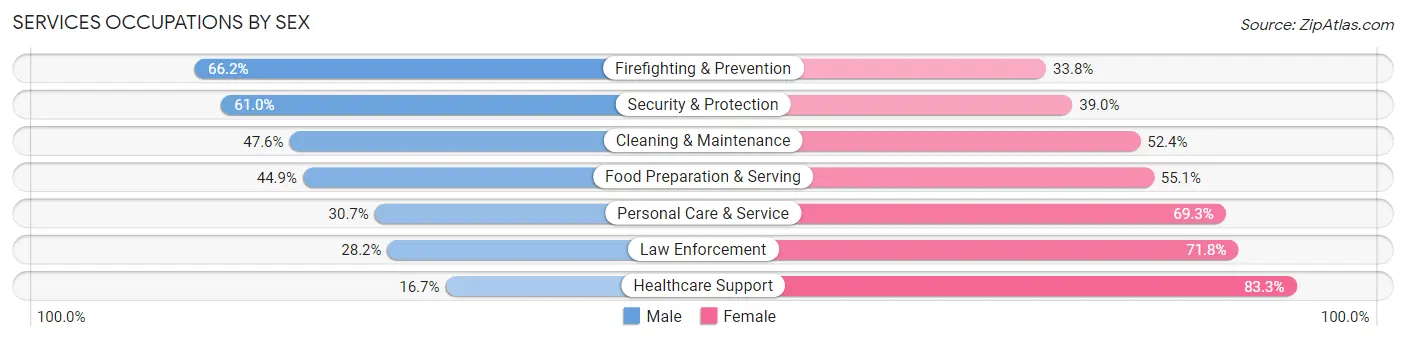
Services Occupations by Sex
Within the Services occupations in Florence Graham, the most male-oriented occupations are Firefighting & Prevention (66.2%), Security & Protection (61.0%), and Cleaning & Maintenance (47.6%), while the most female-oriented occupations are Healthcare Support (83.3%), Law Enforcement (71.8%), and Personal Care & Service (69.3%).
| Occupation | Male | Female |
| Healthcare Support | 220 (16.7%) | 1,097 (83.3%) |
| Security & Protection | 318 (61.0%) | 203 (39.0%) |
| Firefighting & Prevention | 298 (66.2%) | 152 (33.8%) |
| Law Enforcement | 20 (28.2%) | 51 (71.8%) |
| Food Preparation & Serving | 794 (44.9%) | 974 (55.1%) |
| Cleaning & Maintenance | 685 (47.6%) | 755 (52.4%) |
| Personal Care & Service | 178 (30.7%) | 402 (69.3%) |
| Total (Category) | 2,195 (39.0%) | 3,431 (61.0%) |
| Total (Overall) | 15,681 (59.7%) | 10,605 (40.3%) |
Sales and Office Occupations
The most common Sales and Office occupations in Florence Graham are Office & Administration (2,783 | 10.6%), and Sales & Related (2,422 | 9.2%).
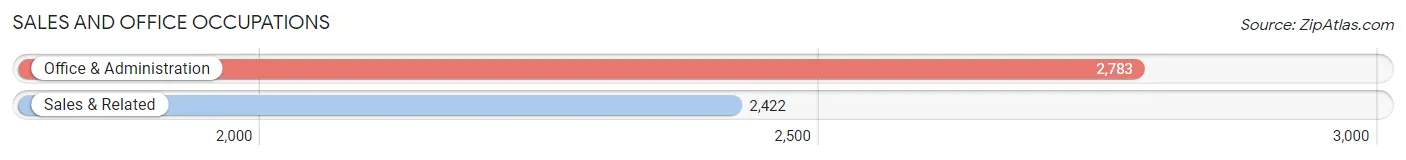
Sales and Office Occupations by Sex
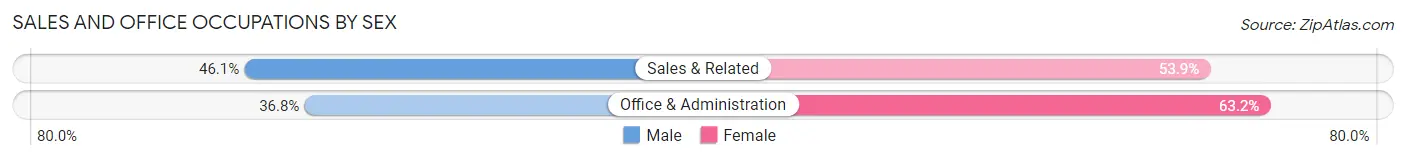
| Occupation | Male | Female |
| Sales & Related | 1,116 (46.1%) | 1,306 (53.9%) |
| Office & Administration | 1,025 (36.8%) | 1,758 (63.2%) |
| Total (Category) | 2,141 (41.1%) | 3,064 (58.9%) |
| Total (Overall) | 15,681 (59.7%) | 10,605 (40.3%) |
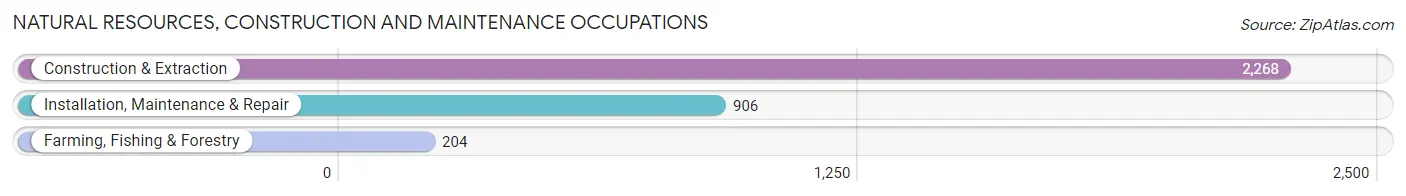
Natural Resources, Construction and Maintenance Occupations
The most common Natural Resources, Construction and Maintenance occupations in Florence Graham are Construction & Extraction (2,268 | 8.6%), Installation, Maintenance & Repair (906 | 3.5%), and Farming, Fishing & Forestry (204 | 0.8%).
Natural Resources, Construction and Maintenance Occupations by Sex
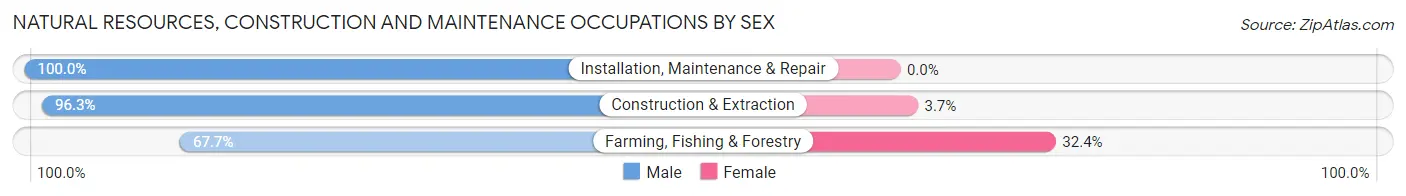
| Occupation | Male | Female |
| Farming, Fishing & Forestry | 138 (67.6%) | 66 (32.4%) |
| Construction & Extraction | 2,185 (96.3%) | 83 (3.7%) |
| Installation, Maintenance & Repair | 906 (100.0%) | 0 (0.0%) |
| Total (Category) | 3,229 (95.6%) | 149 (4.4%) |
| Total (Overall) | 15,681 (59.7%) | 10,605 (40.3%) |
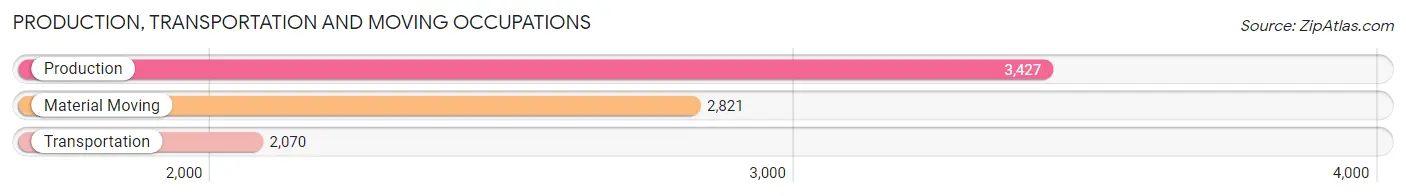
Production, Transportation and Moving Occupations
The most common Production, Transportation and Moving occupations in Florence Graham are Production (3,427 | 13.0%), Material Moving (2,821 | 10.7%), and Transportation (2,070 | 7.9%).
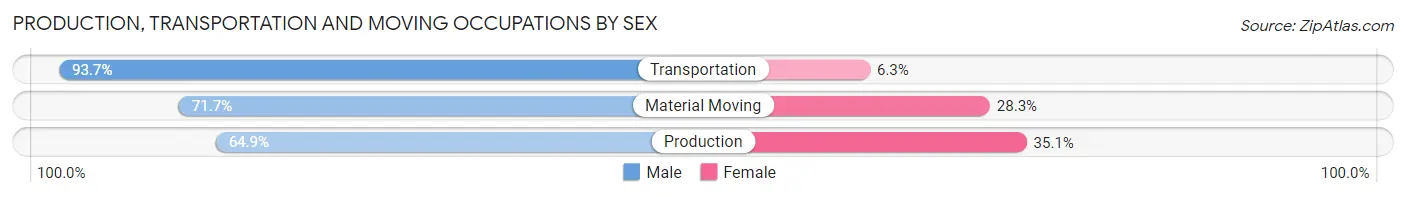
Production, Transportation and Moving Occupations by Sex
| Occupation | Male | Female |
| Production | 2,225 (64.9%) | 1,202 (35.1%) |
| Transportation | 1,939 (93.7%) | 131 (6.3%) |
| Material Moving | 2,022 (71.7%) | 799 (28.3%) |
| Total (Category) | 6,186 (74.4%) | 2,132 (25.6%) |
| Total (Overall) | 15,681 (59.7%) | 10,605 (40.3%) |
Employment Industries by Sex in Florence Graham
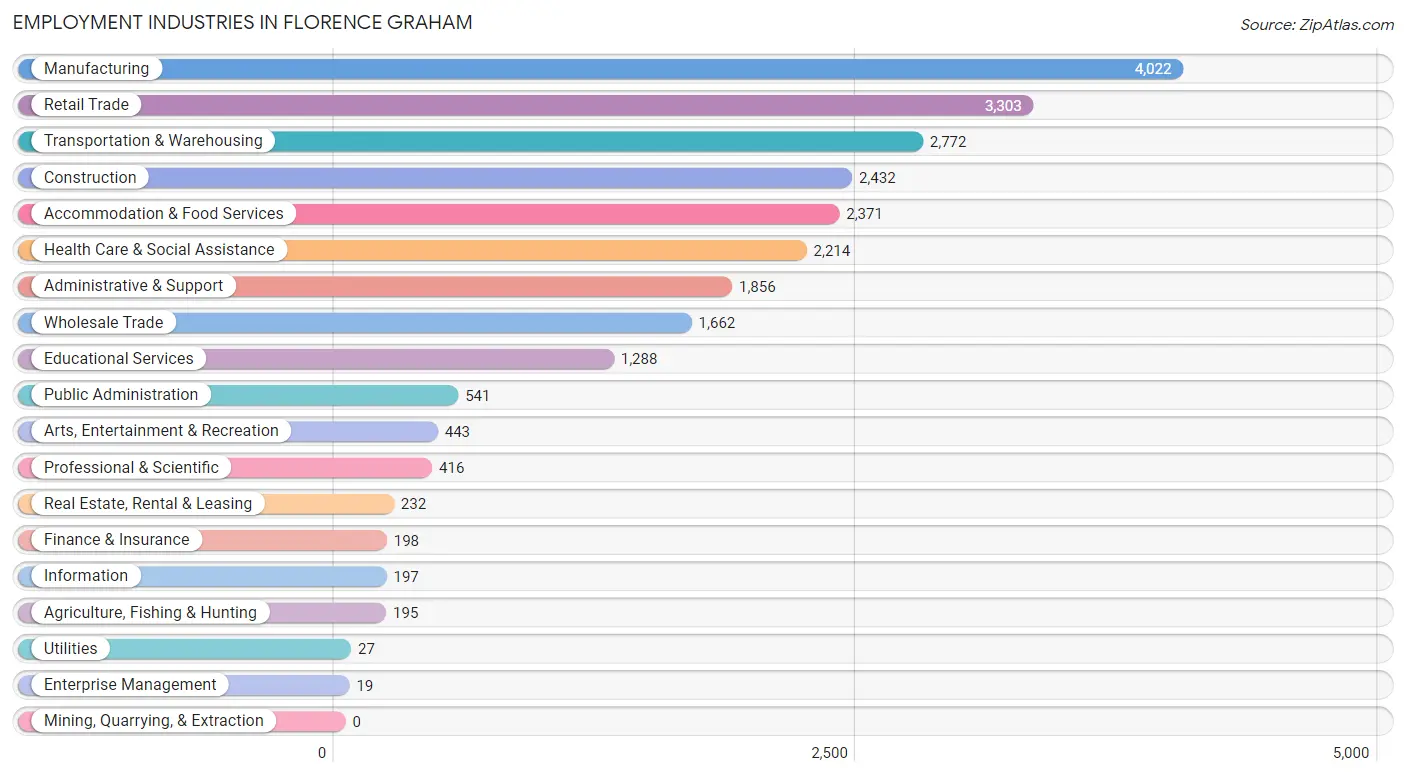
Employment Industries in Florence Graham
The major employment industries in Florence Graham include Manufacturing (4,022 | 15.3%), Retail Trade (3,303 | 12.6%), Transportation & Warehousing (2,772 | 10.5%), Construction (2,432 | 9.2%), and Accommodation & Food Services (2,371 | 9.0%).
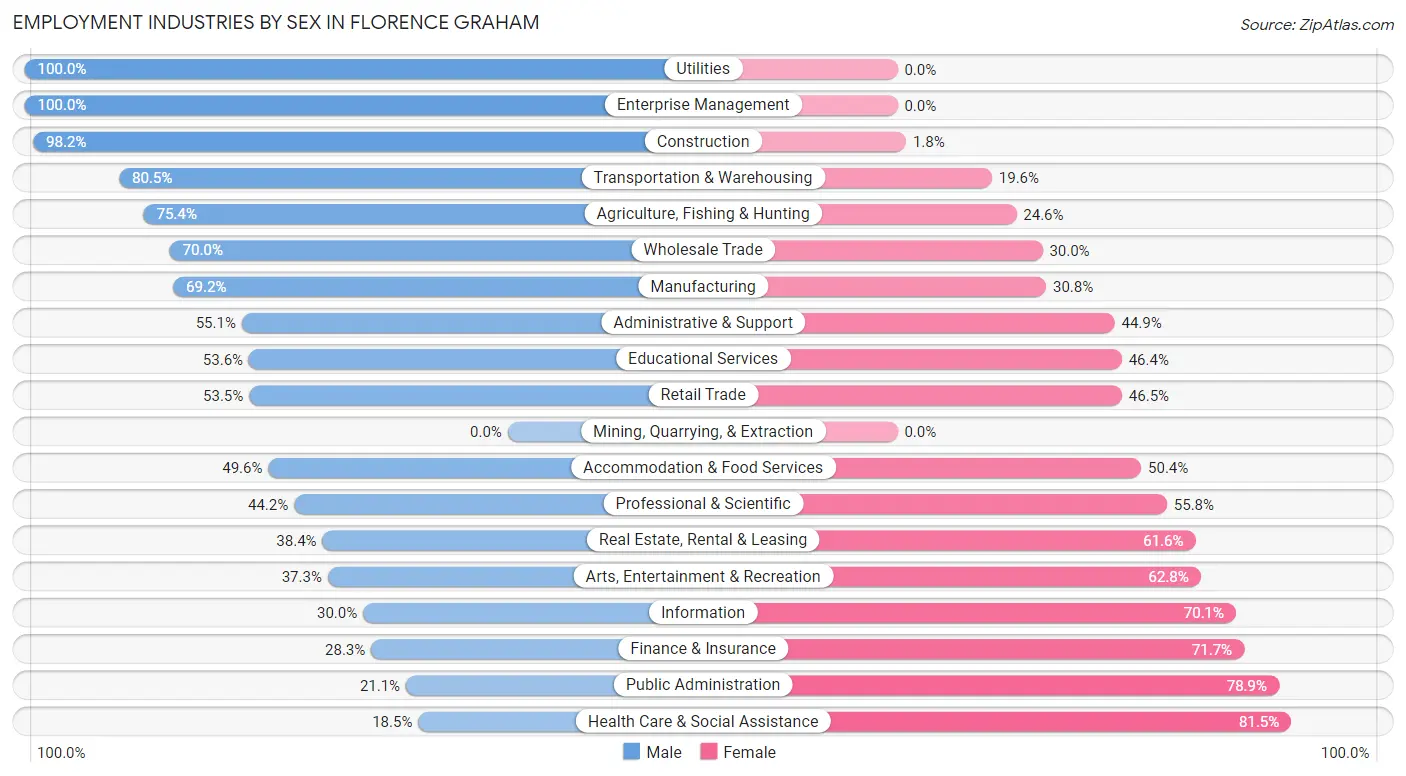
Employment Industries by Sex in Florence Graham
The Florence Graham industries that see more men than women are Utilities (100.0%), Enterprise Management (100.0%), and Construction (98.2%), whereas the industries that tend to have a higher number of women are Health Care & Social Assistance (81.5%), Public Administration (78.9%), and Finance & Insurance (71.7%).
| Industry | Male | Female |
| Agriculture, Fishing & Hunting | 147 (75.4%) | 48 (24.6%) |
| Mining, Quarrying, & Extraction | 0 (0.0%) | 0 (0.0%) |
| Construction | 2,389 (98.2%) | 43 (1.8%) |
| Manufacturing | 2,785 (69.2%) | 1,237 (30.8%) |
| Wholesale Trade | 1,163 (70.0%) | 499 (30.0%) |
| Retail Trade | 1,768 (53.5%) | 1,535 (46.5%) |
| Transportation & Warehousing | 2,230 (80.4%) | 542 (19.6%) |
| Utilities | 27 (100.0%) | 0 (0.0%) |
| Information | 59 (29.9%) | 138 (70.1%) |
| Finance & Insurance | 56 (28.3%) | 142 (71.7%) |
| Real Estate, Rental & Leasing | 89 (38.4%) | 143 (61.6%) |
| Professional & Scientific | 184 (44.2%) | 232 (55.8%) |
| Enterprise Management | 19 (100.0%) | 0 (0.0%) |
| Administrative & Support | 1,022 (55.1%) | 834 (44.9%) |
| Educational Services | 690 (53.6%) | 598 (46.4%) |
| Health Care & Social Assistance | 410 (18.5%) | 1,804 (81.5%) |
| Arts, Entertainment & Recreation | 165 (37.2%) | 278 (62.7%) |
| Accommodation & Food Services | 1,175 (49.6%) | 1,196 (50.4%) |
| Public Administration | 114 (21.1%) | 427 (78.9%) |
| Total | 15,681 (59.7%) | 10,605 (40.3%) |
Education in Florence Graham
School Enrollment in Florence Graham
The most common levels of schooling among the 18,593 students in Florence Graham are high school (4,848 | 26.1%), middle school (3,991 | 21.5%), and elementary school (3,915 | 21.1%).
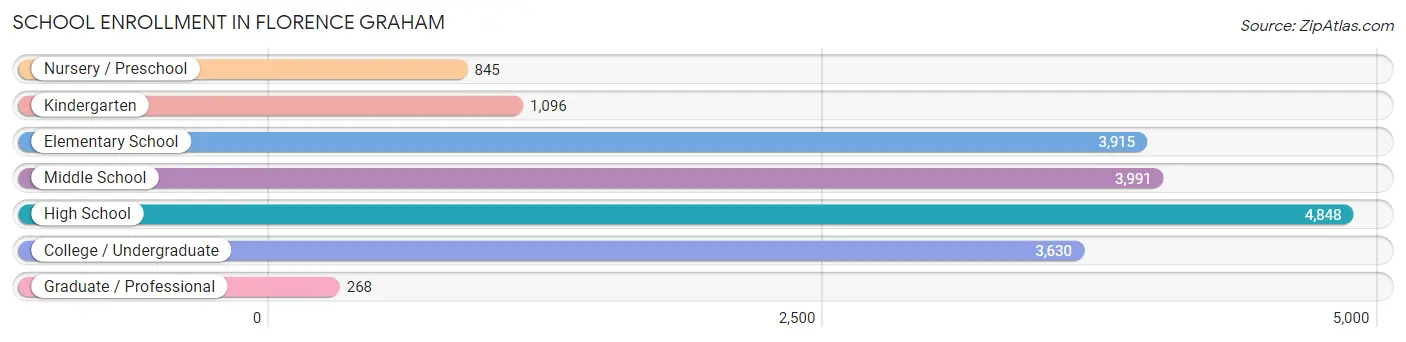
| School Level | # Students | % Students |
| Nursery / Preschool | 845 | 4.5% |
| Kindergarten | 1,096 | 5.9% |
| Elementary School | 3,915 | 21.1% |
| Middle School | 3,991 | 21.5% |
| High School | 4,848 | 26.1% |
| College / Undergraduate | 3,630 | 19.5% |
| Graduate / Professional | 268 | 1.4% |
| Total | 18,593 | 100.0% |
School Enrollment by Age by Funding Source in Florence Graham
Out of a total of 18,593 students who are enrolled in schools in Florence Graham, 930 (5.0%) attend a private institution, while the remaining 17,663 (95.0%) are enrolled in public schools. The age group of 35 years and over has the highest likelihood of being enrolled in private schools, with 84 (16.9% in the age bracket) enrolled. Conversely, the age group of 15 to 17 year olds has the lowest likelihood of being enrolled in a private school, with 3,224 (97.5% in the age bracket) attending a public institution.
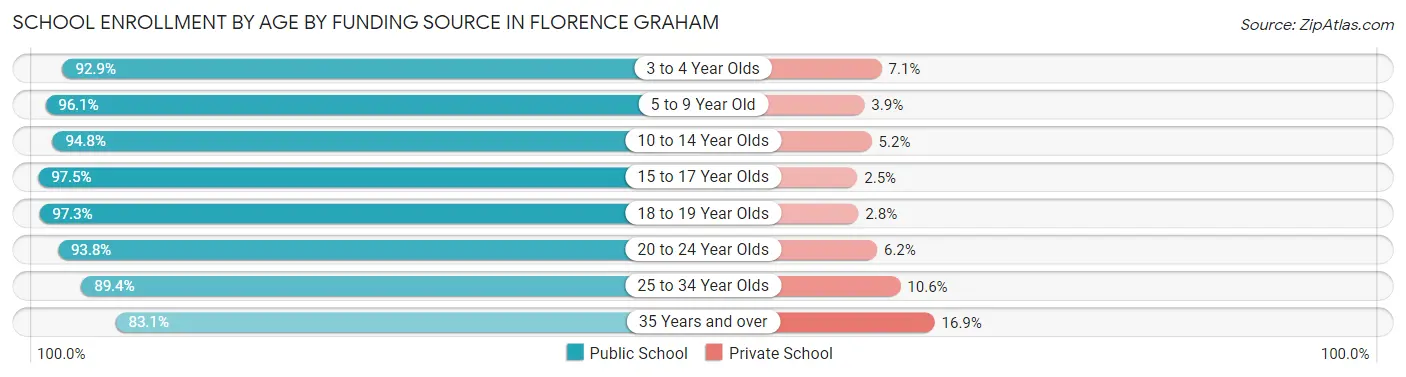
| Age Bracket | Public School | Private School |
| 3 to 4 Year Olds | 737 (92.9%) | 56 (7.1%) |
| 5 to 9 Year Old | 4,485 (96.1%) | 180 (3.9%) |
| 10 to 14 Year Olds | 4,782 (94.8%) | 263 (5.2%) |
| 15 to 17 Year Olds | 3,224 (97.5%) | 84 (2.5%) |
| 18 to 19 Year Olds | 1,272 (97.3%) | 36 (2.8%) |
| 20 to 24 Year Olds | 1,870 (93.8%) | 124 (6.2%) |
| 25 to 34 Year Olds | 880 (89.4%) | 104 (10.6%) |
| 35 Years and over | 412 (83.1%) | 84 (16.9%) |
| Total | 17,663 (95.0%) | 930 (5.0%) |
Educational Attainment by Field of Study in Florence Graham
Business (597 | 22.7%), social sciences (337 | 12.8%), arts & humanities (263 | 10.0%), education (191 | 7.3%), and visual & performing arts (187 | 7.1%) are the most common fields of study among 2,630 individuals in Florence Graham who have obtained a bachelor's degree or higher.
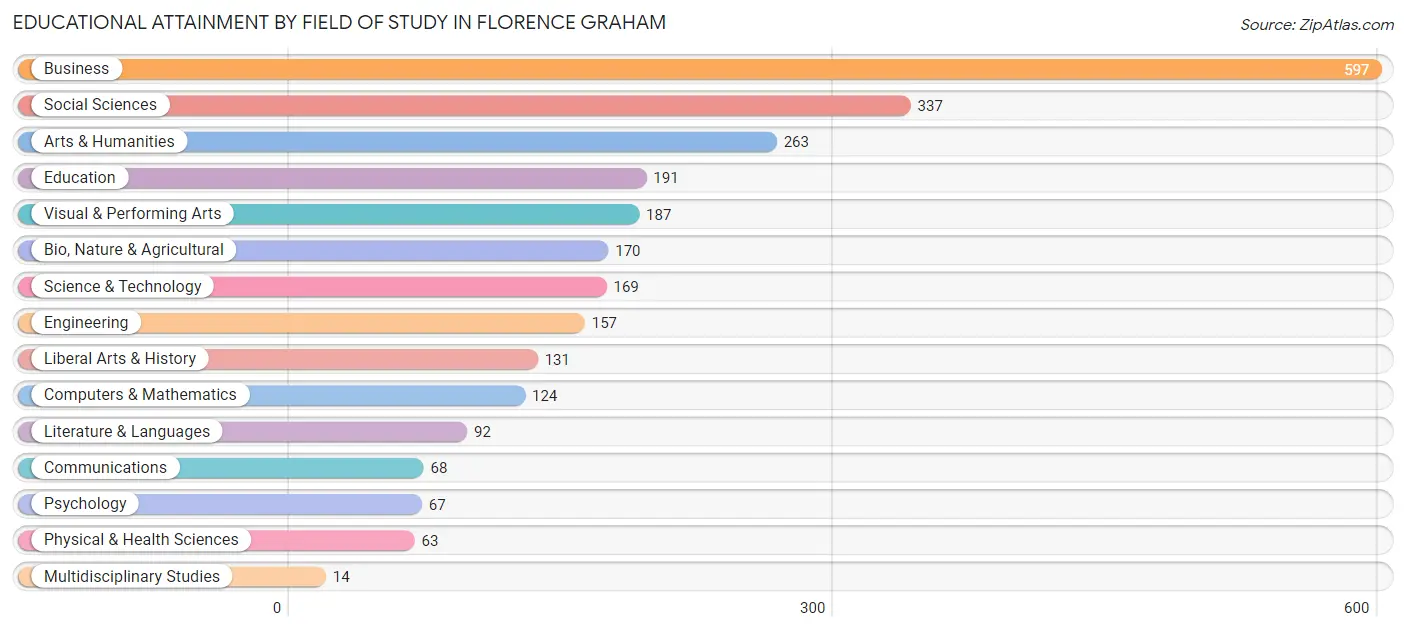
| Field of Study | # Graduates | % Graduates |
| Computers & Mathematics | 124 | 4.7% |
| Bio, Nature & Agricultural | 170 | 6.5% |
| Physical & Health Sciences | 63 | 2.4% |
| Psychology | 67 | 2.5% |
| Social Sciences | 337 | 12.8% |
| Engineering | 157 | 6.0% |
| Multidisciplinary Studies | 14 | 0.5% |
| Science & Technology | 169 | 6.4% |
| Business | 597 | 22.7% |
| Education | 191 | 7.3% |
| Literature & Languages | 92 | 3.5% |
| Liberal Arts & History | 131 | 5.0% |
| Visual & Performing Arts | 187 | 7.1% |
| Communications | 68 | 2.6% |
| Arts & Humanities | 263 | 10.0% |
| Total | 2,630 | 100.0% |
Transportation & Commute in Florence Graham
Vehicle Availability by Sex in Florence Graham
The most prevalent vehicle ownership categories in Florence Graham are males with 2 vehicles (5,156, accounting for 33.5%) and females with 2 vehicles (3,474, making up 52.3%).
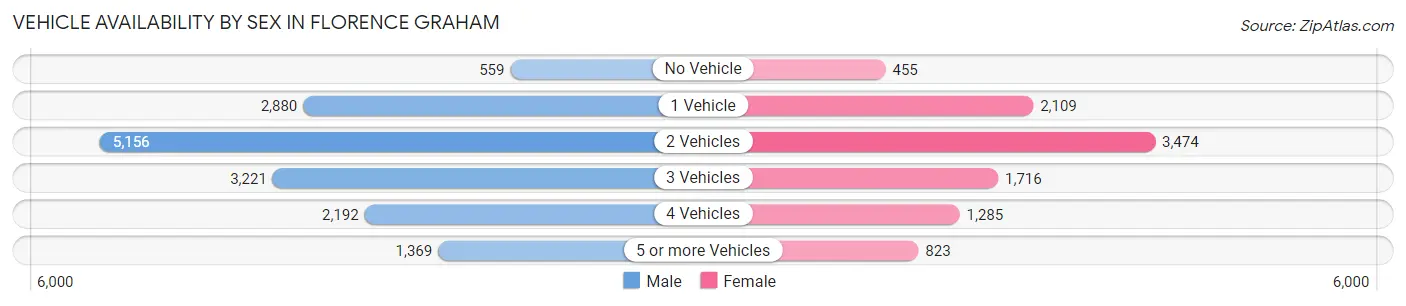
| Vehicles Available | Male | Female |
| No Vehicle | 559 (3.6%) | 455 (4.6%) |
| 1 Vehicle | 2,880 (18.7%) | 2,109 (21.4%) |
| 2 Vehicles | 5,156 (33.5%) | 3,474 (35.2%) |
| 3 Vehicles | 3,221 (20.9%) | 1,716 (17.4%) |
| 4 Vehicles | 2,192 (14.3%) | 1,285 (13.0%) |
| 5 or more Vehicles | 1,369 (8.9%) | 823 (8.4%) |
| Total | 15,377 (100.0%) | 9,862 (100.0%) |
Commute Time in Florence Graham
The most frequently occuring commute durations in Florence Graham are 30 to 34 minutes (5,400 commuters, 22.4%), 20 to 24 minutes (3,492 commuters, 14.5%), and 45 to 59 minutes (2,652 commuters, 11.0%).
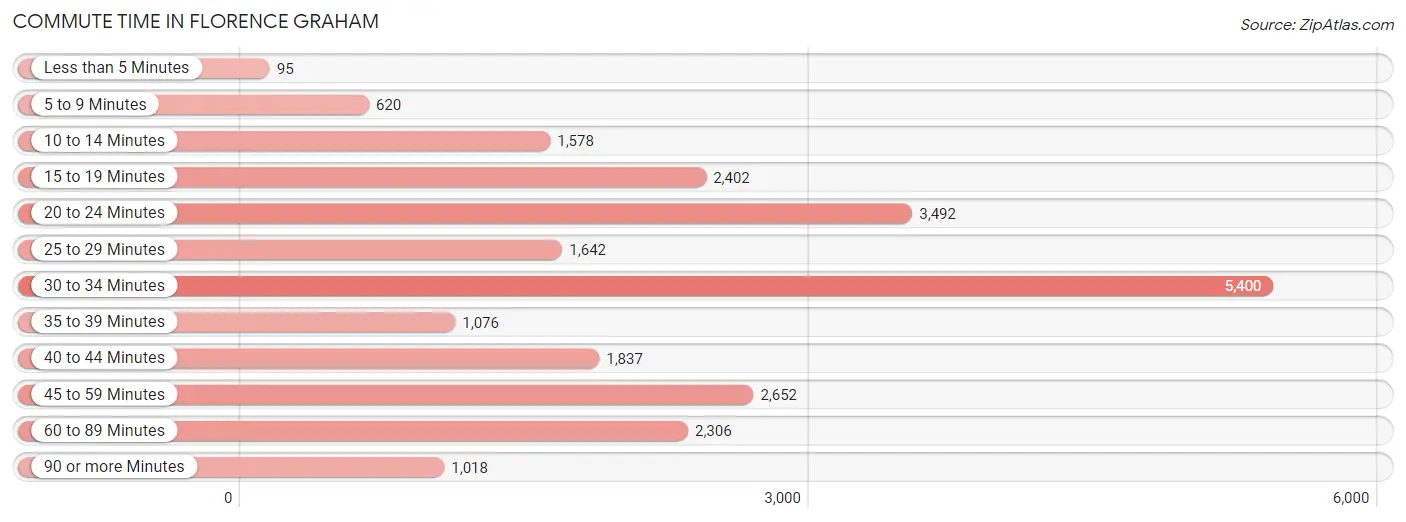
| Commute Time | # Commuters | % Commuters |
| Less than 5 Minutes | 95 | 0.4% |
| 5 to 9 Minutes | 620 | 2.6% |
| 10 to 14 Minutes | 1,578 | 6.5% |
| 15 to 19 Minutes | 2,402 | 10.0% |
| 20 to 24 Minutes | 3,492 | 14.5% |
| 25 to 29 Minutes | 1,642 | 6.8% |
| 30 to 34 Minutes | 5,400 | 22.4% |
| 35 to 39 Minutes | 1,076 | 4.5% |
| 40 to 44 Minutes | 1,837 | 7.6% |
| 45 to 59 Minutes | 2,652 | 11.0% |
| 60 to 89 Minutes | 2,306 | 9.6% |
| 90 or more Minutes | 1,018 | 4.2% |
Commute Time by Sex in Florence Graham
The most common commute times in Florence Graham are 30 to 34 minutes (3,549 commuters, 23.8%) for males and 30 to 34 minutes (1,851 commuters, 20.1%) for females.
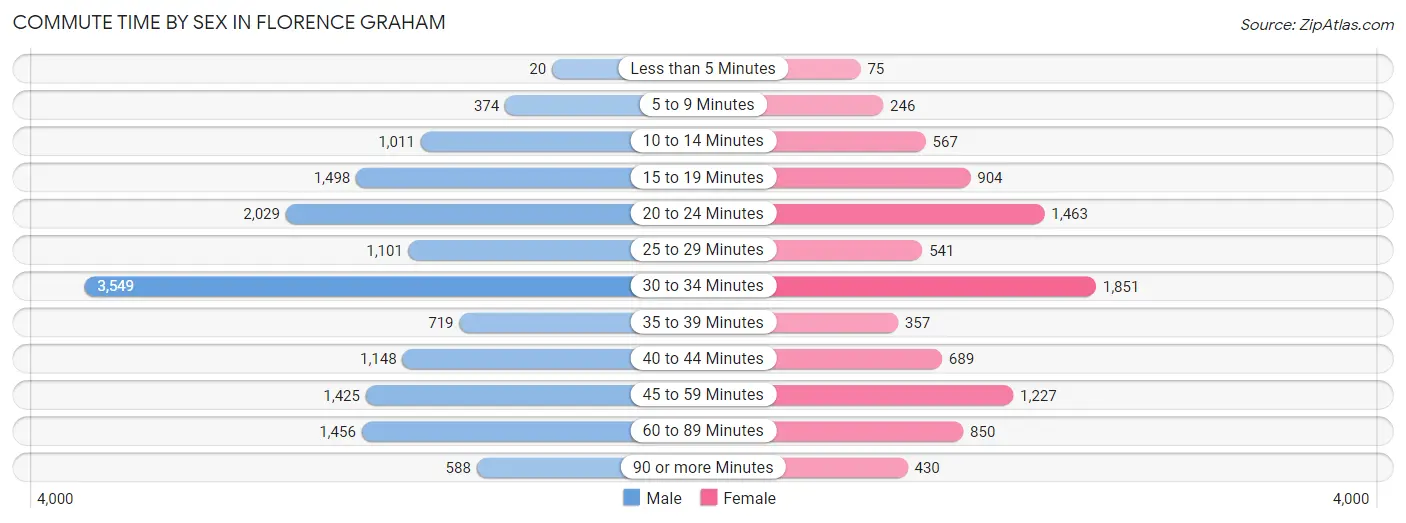
| Commute Time | Male | Female |
| Less than 5 Minutes | 20 (0.1%) | 75 (0.8%) |
| 5 to 9 Minutes | 374 (2.5%) | 246 (2.7%) |
| 10 to 14 Minutes | 1,011 (6.8%) | 567 (6.2%) |
| 15 to 19 Minutes | 1,498 (10.0%) | 904 (9.8%) |
| 20 to 24 Minutes | 2,029 (13.6%) | 1,463 (15.9%) |
| 25 to 29 Minutes | 1,101 (7.4%) | 541 (5.9%) |
| 30 to 34 Minutes | 3,549 (23.8%) | 1,851 (20.1%) |
| 35 to 39 Minutes | 719 (4.8%) | 357 (3.9%) |
| 40 to 44 Minutes | 1,148 (7.7%) | 689 (7.5%) |
| 45 to 59 Minutes | 1,425 (9.6%) | 1,227 (13.3%) |
| 60 to 89 Minutes | 1,456 (9.8%) | 850 (9.2%) |
| 90 or more Minutes | 588 (3.9%) | 430 (4.7%) |
Time of Departure to Work by Sex in Florence Graham
The most frequent times of departure to work in Florence Graham are 6:00 AM to 6:29 AM (2,020, 13.5%) for males and 7:00 AM to 7:29 AM (1,432, 15.6%) for females.
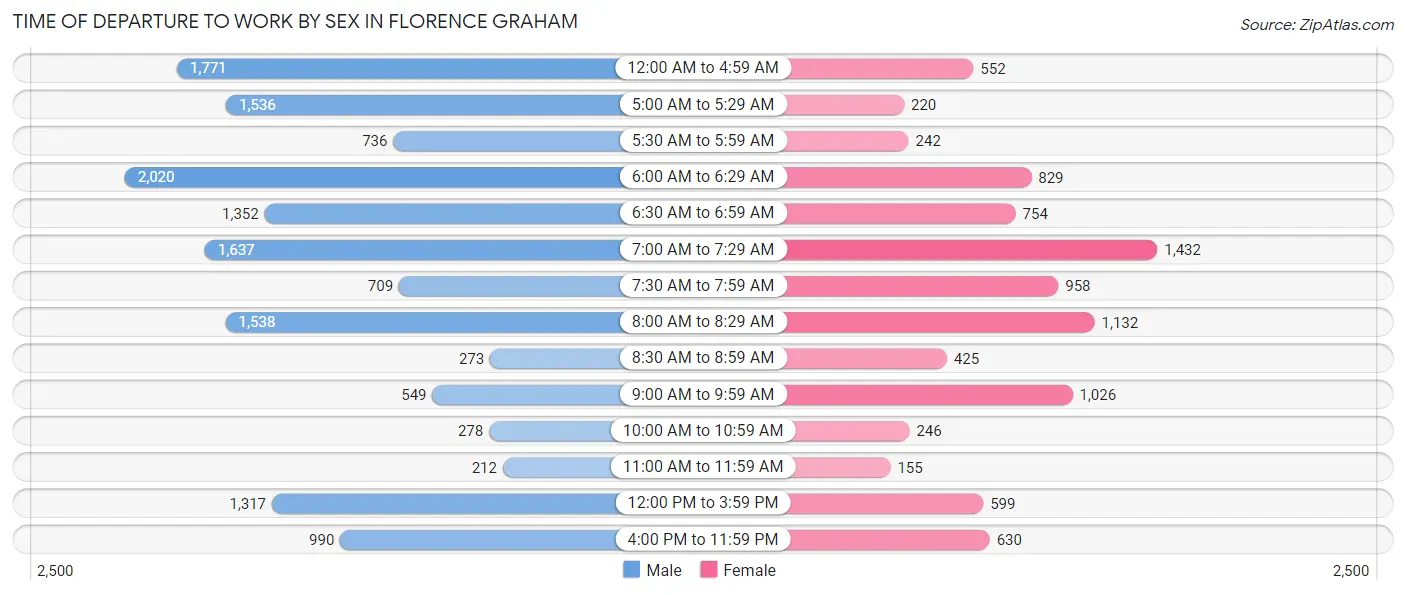
| Time of Departure | Male | Female |
| 12:00 AM to 4:59 AM | 1,771 (11.9%) | 552 (6.0%) |
| 5:00 AM to 5:29 AM | 1,536 (10.3%) | 220 (2.4%) |
| 5:30 AM to 5:59 AM | 736 (4.9%) | 242 (2.6%) |
| 6:00 AM to 6:29 AM | 2,020 (13.5%) | 829 (9.0%) |
| 6:30 AM to 6:59 AM | 1,352 (9.1%) | 754 (8.2%) |
| 7:00 AM to 7:29 AM | 1,637 (11.0%) | 1,432 (15.6%) |
| 7:30 AM to 7:59 AM | 709 (4.8%) | 958 (10.4%) |
| 8:00 AM to 8:29 AM | 1,538 (10.3%) | 1,132 (12.3%) |
| 8:30 AM to 8:59 AM | 273 (1.8%) | 425 (4.6%) |
| 9:00 AM to 9:59 AM | 549 (3.7%) | 1,026 (11.2%) |
| 10:00 AM to 10:59 AM | 278 (1.9%) | 246 (2.7%) |
| 11:00 AM to 11:59 AM | 212 (1.4%) | 155 (1.7%) |
| 12:00 PM to 3:59 PM | 1,317 (8.8%) | 599 (6.5%) |
| 4:00 PM to 11:59 PM | 990 (6.6%) | 630 (6.9%) |
| Total | 14,918 (100.0%) | 9,200 (100.0%) |
Housing Occupancy in Florence Graham
Occupancy by Ownership in Florence Graham
Of the total 14,630 dwellings in Florence Graham, owner-occupied units account for 5,396 (36.9%), while renter-occupied units make up 9,234 (63.1%).
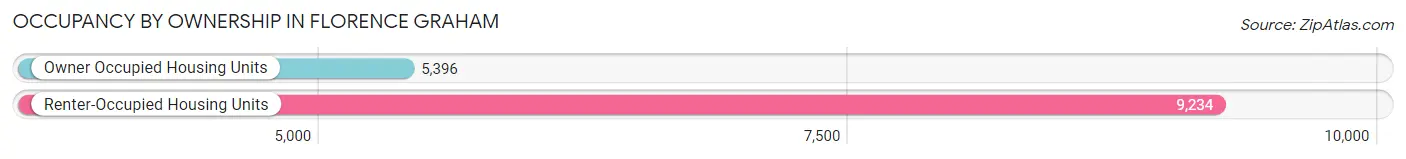
| Occupancy | # Housing Units | % Housing Units |
| Owner Occupied Housing Units | 5,396 | 36.9% |
| Renter-Occupied Housing Units | 9,234 | 63.1% |
| Total Occupied Housing Units | 14,630 | 100.0% |
Occupancy by Household Size in Florence Graham
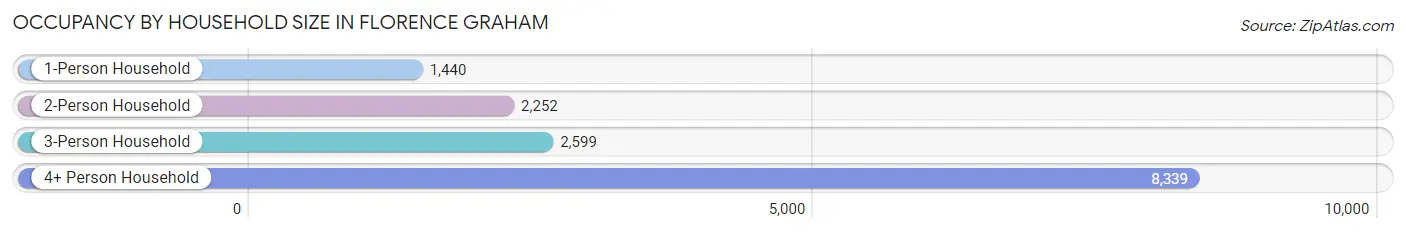
| Household Size | # Housing Units | % Housing Units |
| 1-Person Household | 1,440 | 9.8% |
| 2-Person Household | 2,252 | 15.4% |
| 3-Person Household | 2,599 | 17.8% |
| 4+ Person Household | 8,339 | 57.0% |
| Total Housing Units | 14,630 | 100.0% |
Occupancy by Ownership by Household Size in Florence Graham
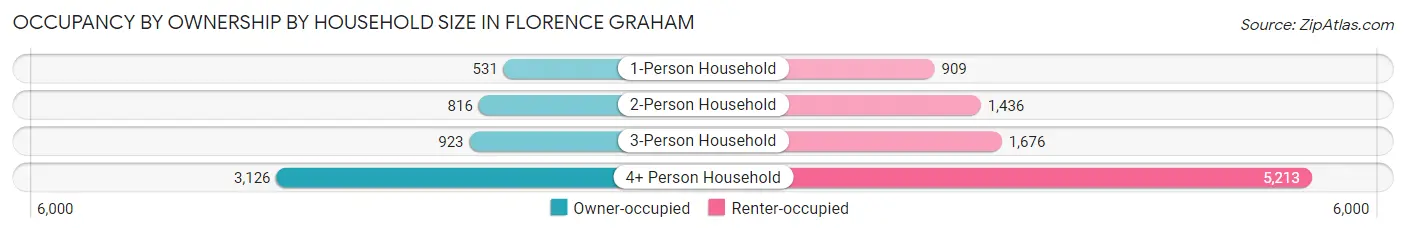
| Household Size | Owner-occupied | Renter-occupied |
| 1-Person Household | 531 (36.9%) | 909 (63.1%) |
| 2-Person Household | 816 (36.2%) | 1,436 (63.8%) |
| 3-Person Household | 923 (35.5%) | 1,676 (64.5%) |
| 4+ Person Household | 3,126 (37.5%) | 5,213 (62.5%) |
| Total Housing Units | 5,396 (36.9%) | 9,234 (63.1%) |
Occupancy by Educational Attainment in Florence Graham
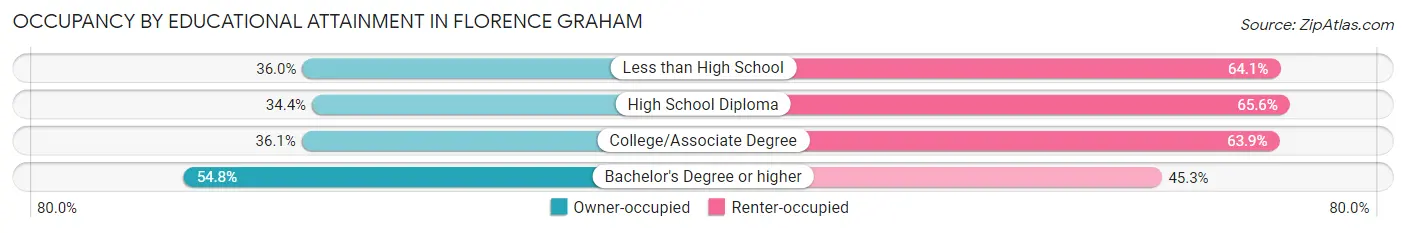
| Household Size | Owner-occupied | Renter-occupied |
| Less than High School | 2,824 (35.9%) | 5,031 (64.0%) |
| High School Diploma | 1,099 (34.4%) | 2,093 (65.6%) |
| College/Associate Degree | 943 (36.1%) | 1,672 (63.9%) |
| Bachelor's Degree or higher | 530 (54.7%) | 438 (45.3%) |
Occupancy by Age of Householder in Florence Graham
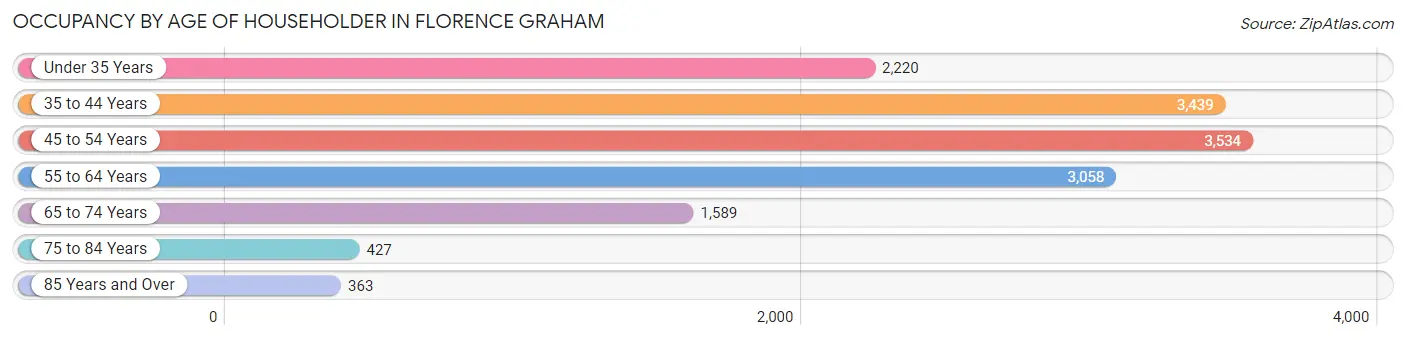
| Age Bracket | # Households | % Households |
| Under 35 Years | 2,220 | 15.2% |
| 35 to 44 Years | 3,439 | 23.5% |
| 45 to 54 Years | 3,534 | 24.2% |
| 55 to 64 Years | 3,058 | 20.9% |
| 65 to 74 Years | 1,589 | 10.9% |
| 75 to 84 Years | 427 | 2.9% |
| 85 Years and Over | 363 | 2.5% |
| Total | 14,630 | 100.0% |
Housing Finances in Florence Graham
Median Income by Occupancy in Florence Graham
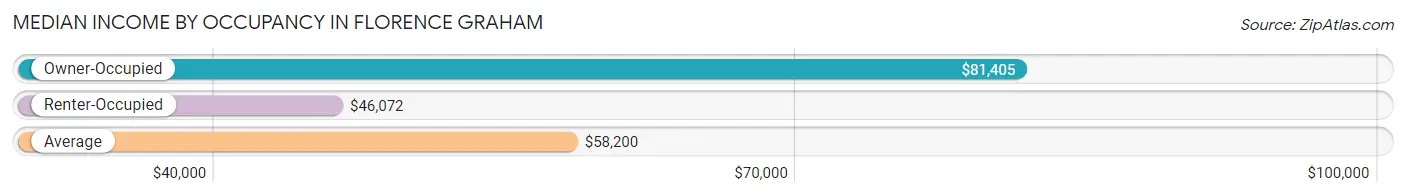
| Occupancy Type | # Households | Median Income |
| Owner-Occupied | 5,396 (36.9%) | $81,405 |
| Renter-Occupied | 9,234 (63.1%) | $46,072 |
| Average | 14,630 (100.0%) | $58,200 |
Occupancy by Householder Income Bracket in Florence Graham
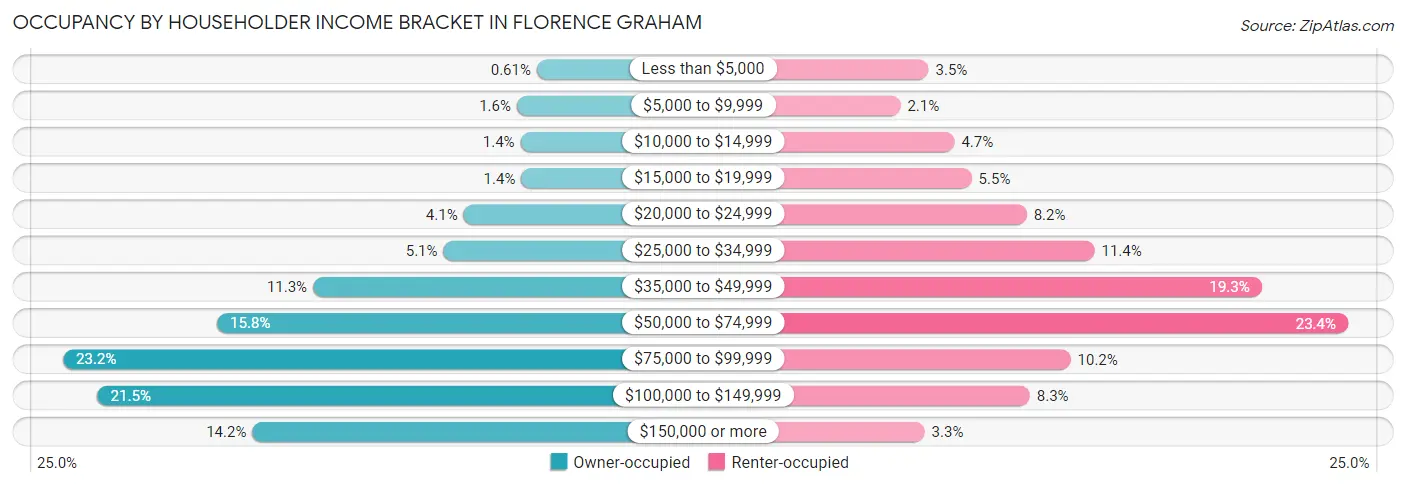
| Income Bracket | Owner-occupied | Renter-occupied |
| Less than $5,000 | 33 (0.6%) | 321 (3.5%) |
| $5,000 to $9,999 | 84 (1.6%) | 198 (2.1%) |
| $10,000 to $14,999 | 75 (1.4%) | 435 (4.7%) |
| $15,000 to $19,999 | 73 (1.3%) | 511 (5.5%) |
| $20,000 to $24,999 | 221 (4.1%) | 753 (8.2%) |
| $25,000 to $34,999 | 273 (5.1%) | 1,051 (11.4%) |
| $35,000 to $49,999 | 608 (11.3%) | 1,785 (19.3%) |
| $50,000 to $74,999 | 854 (15.8%) | 2,164 (23.4%) |
| $75,000 to $99,999 | 1,250 (23.2%) | 946 (10.2%) |
| $100,000 to $149,999 | 1,161 (21.5%) | 766 (8.3%) |
| $150,000 or more | 764 (14.2%) | 304 (3.3%) |
| Total | 5,396 (100.0%) | 9,234 (100.0%) |
Monthly Housing Cost Tiers in Florence Graham
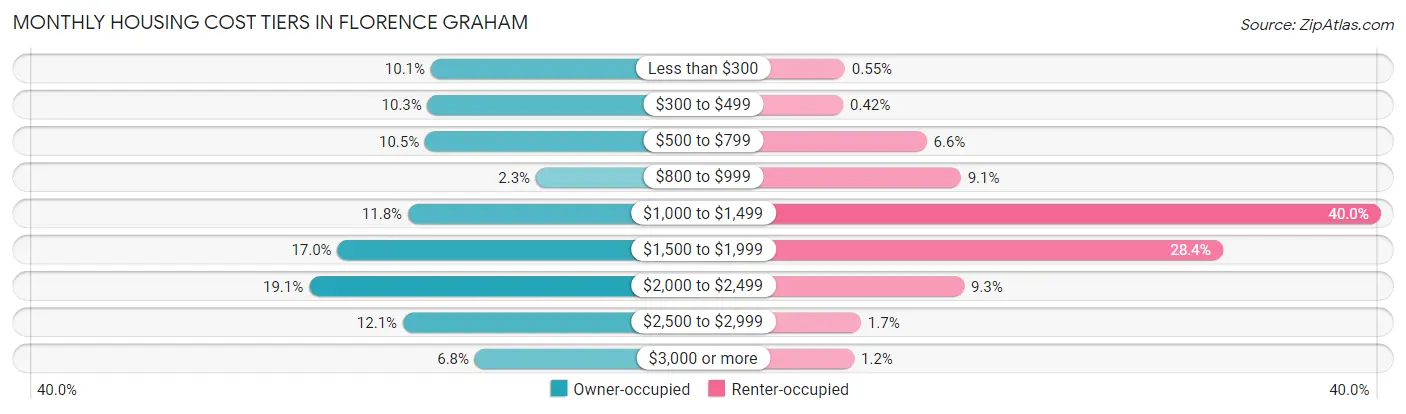
| Monthly Cost | Owner-occupied | Renter-occupied |
| Less than $300 | 544 (10.1%) | 51 (0.5%) |
| $300 to $499 | 557 (10.3%) | 39 (0.4%) |
| $500 to $799 | 567 (10.5%) | 607 (6.6%) |
| $800 to $999 | 126 (2.3%) | 838 (9.1%) |
| $1,000 to $1,499 | 635 (11.8%) | 3,694 (40.0%) |
| $1,500 to $1,999 | 915 (17.0%) | 2,619 (28.4%) |
| $2,000 to $2,499 | 1,028 (19.1%) | 861 (9.3%) |
| $2,500 to $2,999 | 655 (12.1%) | 160 (1.7%) |
| $3,000 or more | 369 (6.8%) | 114 (1.2%) |
| Total | 5,396 (100.0%) | 9,234 (100.0%) |
Physical Housing Characteristics in Florence Graham
Housing Structures in Florence Graham
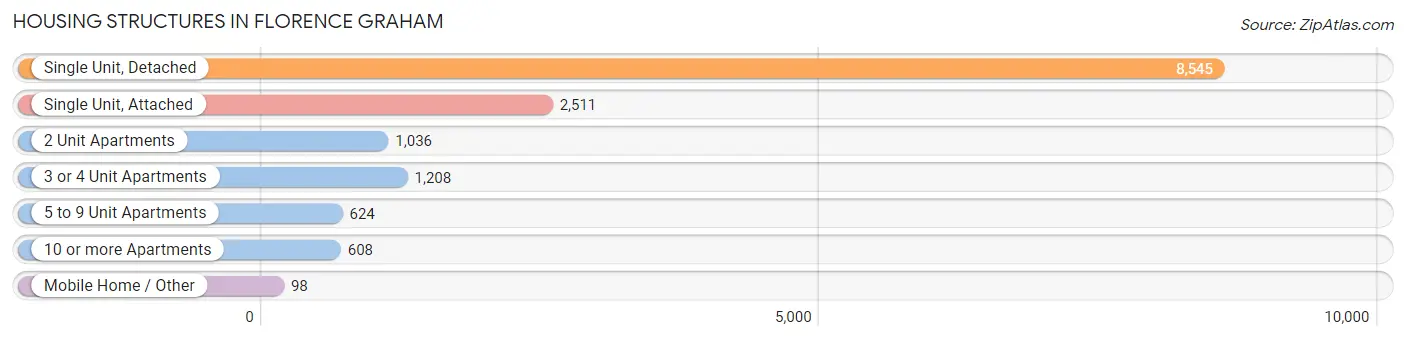
| Structure Type | # Housing Units | % Housing Units |
| Single Unit, Detached | 8,545 | 58.4% |
| Single Unit, Attached | 2,511 | 17.2% |
| 2 Unit Apartments | 1,036 | 7.1% |
| 3 or 4 Unit Apartments | 1,208 | 8.3% |
| 5 to 9 Unit Apartments | 624 | 4.3% |
| 10 or more Apartments | 608 | 4.2% |
| Mobile Home / Other | 98 | 0.7% |
| Total | 14,630 | 100.0% |
Housing Structures by Occupancy in Florence Graham
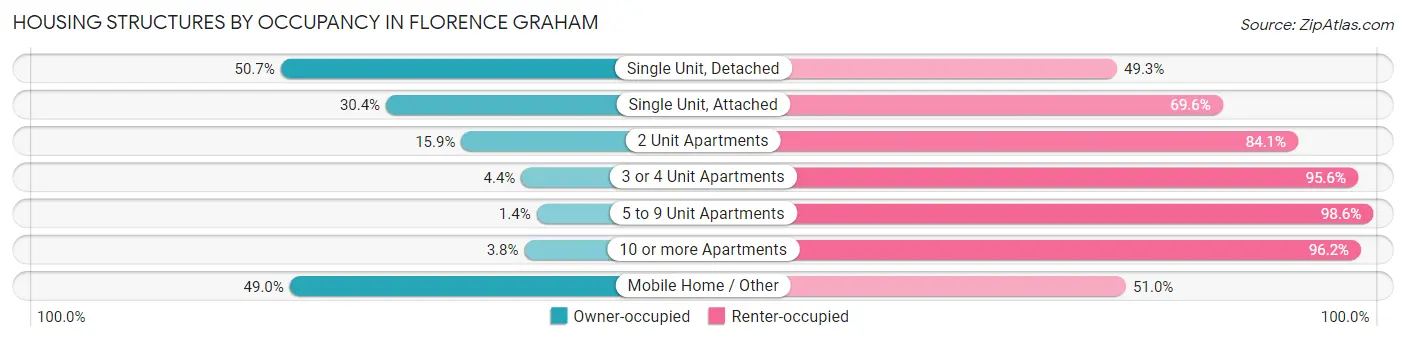
| Structure Type | Owner-occupied | Renter-occupied |
| Single Unit, Detached | 4,334 (50.7%) | 4,211 (49.3%) |
| Single Unit, Attached | 764 (30.4%) | 1,747 (69.6%) |
| 2 Unit Apartments | 165 (15.9%) | 871 (84.1%) |
| 3 or 4 Unit Apartments | 53 (4.4%) | 1,155 (95.6%) |
| 5 to 9 Unit Apartments | 9 (1.4%) | 615 (98.6%) |
| 10 or more Apartments | 23 (3.8%) | 585 (96.2%) |
| Mobile Home / Other | 48 (49.0%) | 50 (51.0%) |
| Total | 5,396 (36.9%) | 9,234 (63.1%) |
Housing Structures by Number of Rooms in Florence Graham
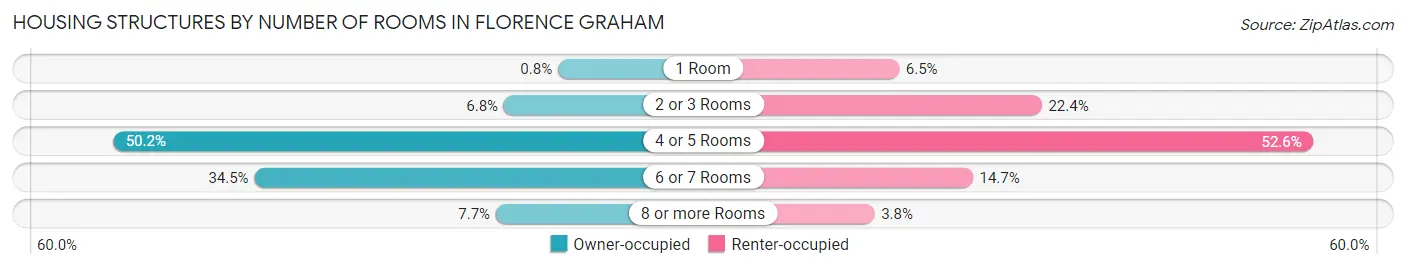
| Number of Rooms | Owner-occupied | Renter-occupied |
| 1 Room | 43 (0.8%) | 604 (6.5%) |
| 2 or 3 Rooms | 367 (6.8%) | 2,066 (22.4%) |
| 4 or 5 Rooms | 2,710 (50.2%) | 4,853 (52.6%) |
| 6 or 7 Rooms | 1,861 (34.5%) | 1,359 (14.7%) |
| 8 or more Rooms | 415 (7.7%) | 352 (3.8%) |
| Total | 5,396 (100.0%) | 9,234 (100.0%) |
Housing Structure by Heating Type in Florence Graham
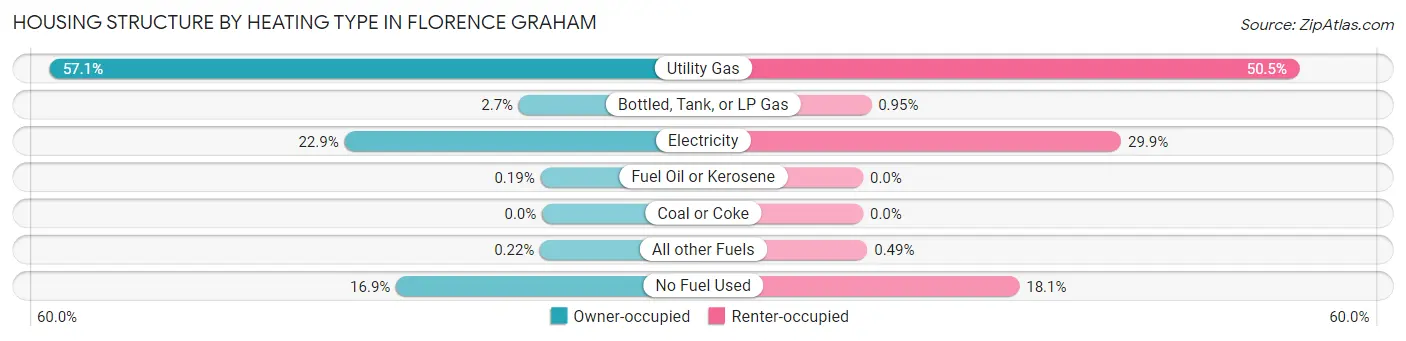
| Heating Type | Owner-occupied | Renter-occupied |
| Utility Gas | 3,080 (57.1%) | 4,665 (50.5%) |
| Bottled, Tank, or LP Gas | 145 (2.7%) | 88 (0.9%) |
| Electricity | 1,236 (22.9%) | 2,763 (29.9%) |
| Fuel Oil or Kerosene | 10 (0.2%) | 0 (0.0%) |
| Coal or Coke | 0 (0.0%) | 0 (0.0%) |
| All other Fuels | 12 (0.2%) | 45 (0.5%) |
| No Fuel Used | 913 (16.9%) | 1,673 (18.1%) |
| Total | 5,396 (100.0%) | 9,234 (100.0%) |
Household Vehicle Usage in Florence Graham
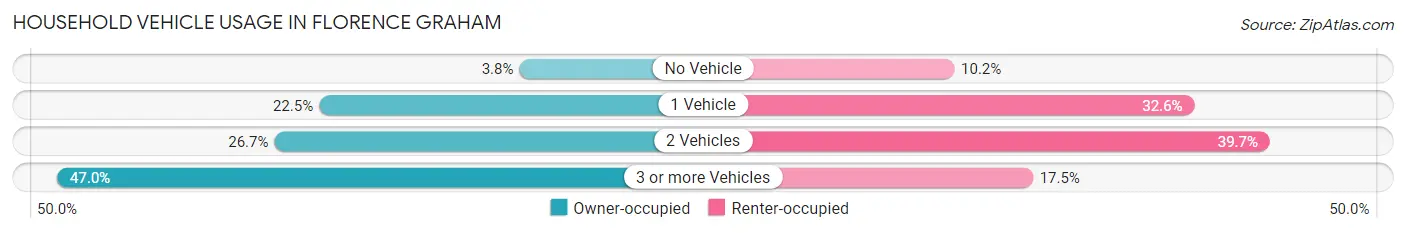
| Vehicles per Household | Owner-occupied | Renter-occupied |
| No Vehicle | 206 (3.8%) | 941 (10.2%) |
| 1 Vehicle | 1,215 (22.5%) | 3,012 (32.6%) |
| 2 Vehicles | 1,440 (26.7%) | 3,662 (39.7%) |
| 3 or more Vehicles | 2,535 (47.0%) | 1,619 (17.5%) |
| Total | 5,396 (100.0%) | 9,234 (100.0%) |
Real Estate & Mortgages in Florence Graham
Real Estate and Mortgage Overview in Florence Graham
| Characteristic | Without Mortgage | With Mortgage |
| Housing Units | 1,834 | 3,562 |
| Median Property Value | $484,400 | $478,600 |
| Median Household Income | $77,589 | $544 |
| Monthly Housing Costs | $439 | $369 |
| Real Estate Taxes | $2,388 | $71 |
Property Value by Mortgage Status in Florence Graham
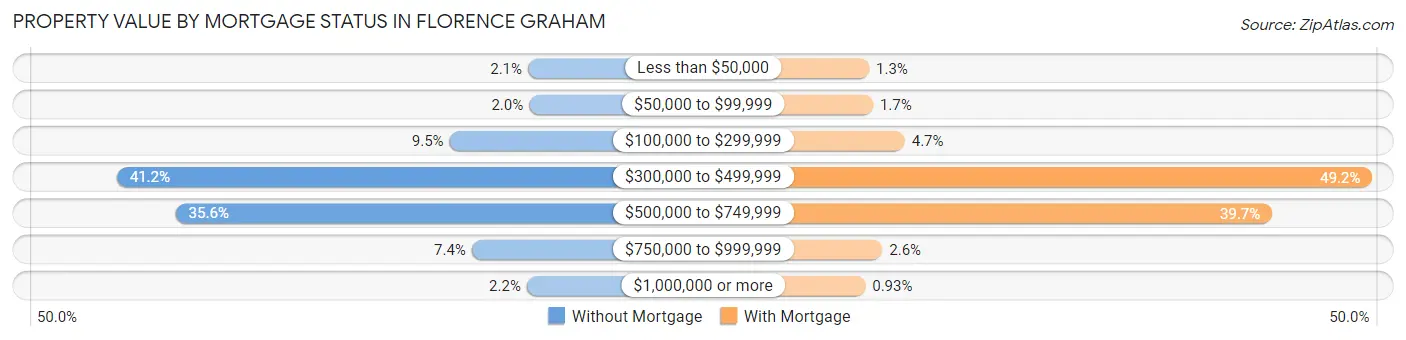
| Property Value | Without Mortgage | With Mortgage |
| Less than $50,000 | 38 (2.1%) | 46 (1.3%) |
| $50,000 to $99,999 | 36 (2.0%) | 59 (1.7%) |
| $100,000 to $299,999 | 175 (9.5%) | 167 (4.7%) |
| $300,000 to $499,999 | 756 (41.2%) | 1,753 (49.2%) |
| $500,000 to $749,999 | 653 (35.6%) | 1,413 (39.7%) |
| $750,000 to $999,999 | 136 (7.4%) | 91 (2.5%) |
| $1,000,000 or more | 40 (2.2%) | 33 (0.9%) |
| Total | 1,834 (100.0%) | 3,562 (100.0%) |
Household Income by Mortgage Status in Florence Graham
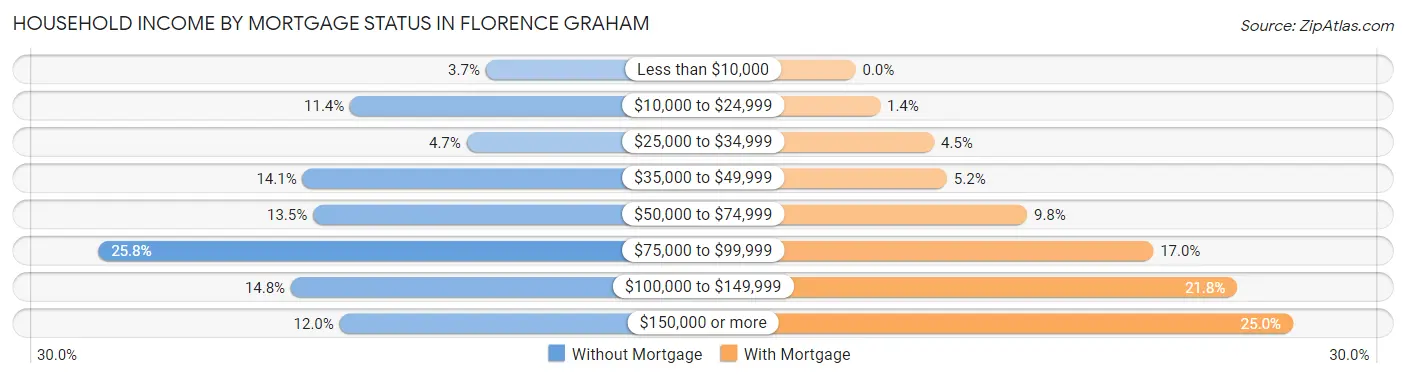
| Household Income | Without Mortgage | With Mortgage |
| Less than $10,000 | 67 (3.6%) | 0 (0.0%) |
| $10,000 to $24,999 | 209 (11.4%) | 50 (1.4%) |
| $25,000 to $34,999 | 87 (4.7%) | 160 (4.5%) |
| $35,000 to $49,999 | 259 (14.1%) | 186 (5.2%) |
| $50,000 to $74,999 | 248 (13.5%) | 349 (9.8%) |
| $75,000 to $99,999 | 473 (25.8%) | 606 (17.0%) |
| $100,000 to $149,999 | 271 (14.8%) | 777 (21.8%) |
| $150,000 or more | 220 (12.0%) | 890 (25.0%) |
| Total | 1,834 (100.0%) | 3,562 (100.0%) |
Property Value to Household Income Ratio in Florence Graham
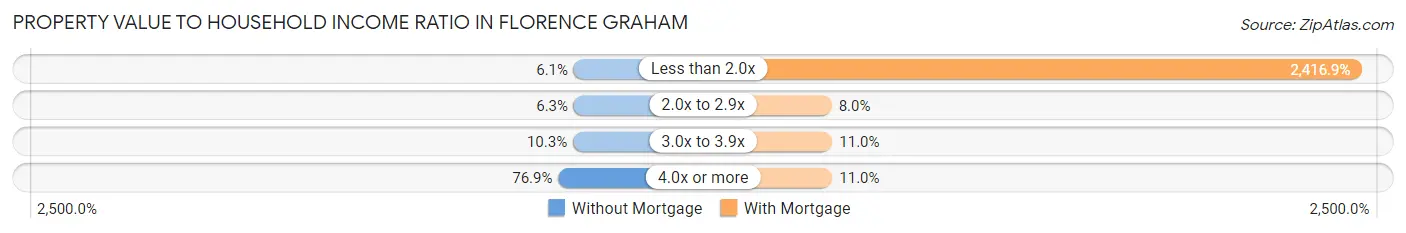
| Value-to-Income Ratio | Without Mortgage | With Mortgage |
| Less than 2.0x | 112 (6.1%) | 86,091 (2,416.9%) |
| 2.0x to 2.9x | 115 (6.3%) | 285 (8.0%) |
| 3.0x to 3.9x | 188 (10.2%) | 393 (11.0%) |
| 4.0x or more | 1,411 (76.9%) | 393 (11.0%) |
| Total | 1,834 (100.0%) | 3,562 (100.0%) |
Real Estate Taxes by Mortgage Status in Florence Graham
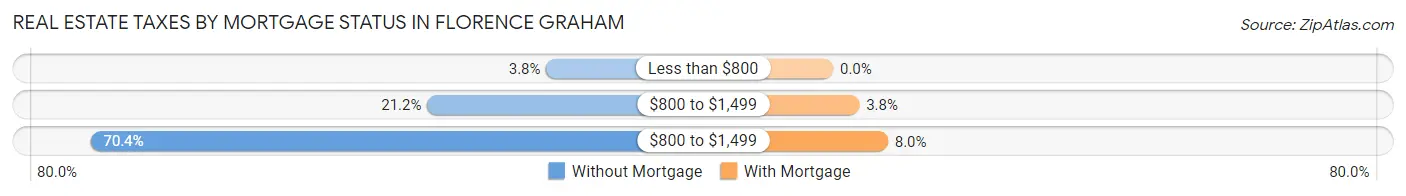
| Property Taxes | Without Mortgage | With Mortgage |
| Less than $800 | 69 (3.8%) | 0 (0.0%) |
| $800 to $1,499 | 388 (21.2%) | 136 (3.8%) |
| $800 to $1,499 | 1,291 (70.4%) | 285 (8.0%) |
| Total | 1,834 (100.0%) | 3,562 (100.0%) |
Health & Disability in Florence Graham
Health Insurance Coverage by Age in Florence Graham
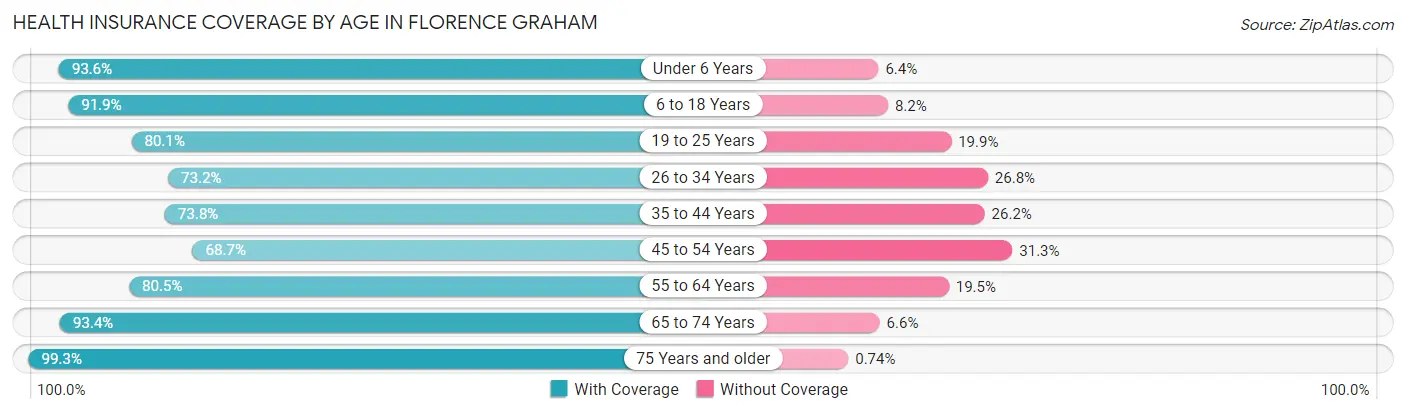
| Age Bracket | With Coverage | Without Coverage |
| Under 6 Years | 5,109 (93.6%) | 348 (6.4%) |
| 6 to 18 Years | 12,785 (91.8%) | 1,134 (8.2%) |
| 19 to 25 Years | 6,037 (80.1%) | 1,504 (19.9%) |
| 26 to 34 Years | 6,625 (73.2%) | 2,423 (26.8%) |
| 35 to 44 Years | 6,118 (73.8%) | 2,169 (26.2%) |
| 45 to 54 Years | 5,288 (68.7%) | 2,414 (31.3%) |
| 55 to 64 Years | 4,944 (80.5%) | 1,197 (19.5%) |
| 65 to 74 Years | 3,176 (93.4%) | 224 (6.6%) |
| 75 Years and older | 1,617 (99.3%) | 12 (0.7%) |
| Total | 51,699 (81.9%) | 11,425 (18.1%) |
Health Insurance Coverage by Citizenship Status in Florence Graham
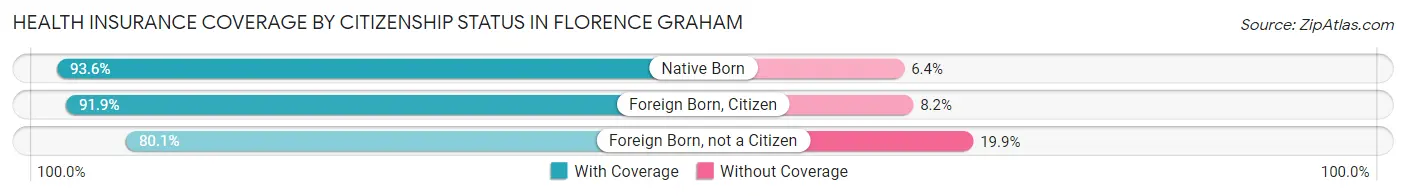
| Citizenship Status | With Coverage | Without Coverage |
| Native Born | 5,109 (93.6%) | 348 (6.4%) |
| Foreign Born, Citizen | 12,785 (91.8%) | 1,134 (8.2%) |
| Foreign Born, not a Citizen | 6,037 (80.1%) | 1,504 (19.9%) |
Health Insurance Coverage by Household Income in Florence Graham
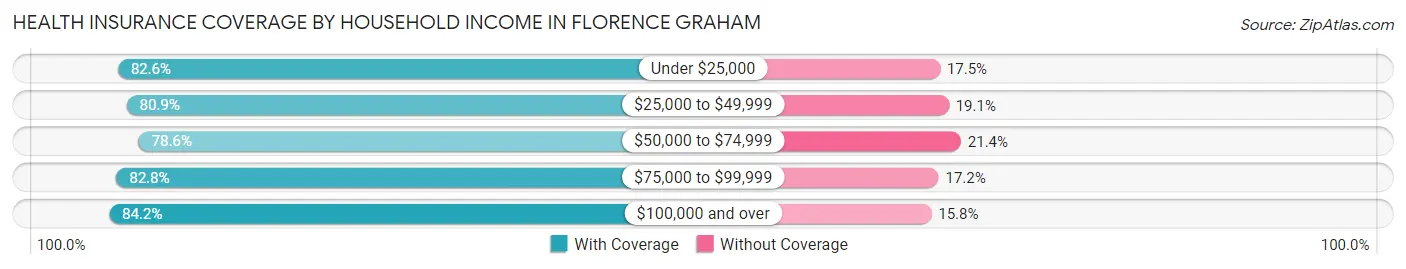
| Household Income | With Coverage | Without Coverage |
| Under $25,000 | 6,504 (82.6%) | 1,375 (17.4%) |
| $25,000 to $49,999 | 11,753 (80.9%) | 2,774 (19.1%) |
| $50,000 to $74,999 | 9,811 (78.6%) | 2,667 (21.4%) |
| $75,000 to $99,999 | 8,684 (82.8%) | 1,803 (17.2%) |
| $100,000 and over | 14,856 (84.2%) | 2,794 (15.8%) |
Public vs Private Health Insurance Coverage by Age in Florence Graham
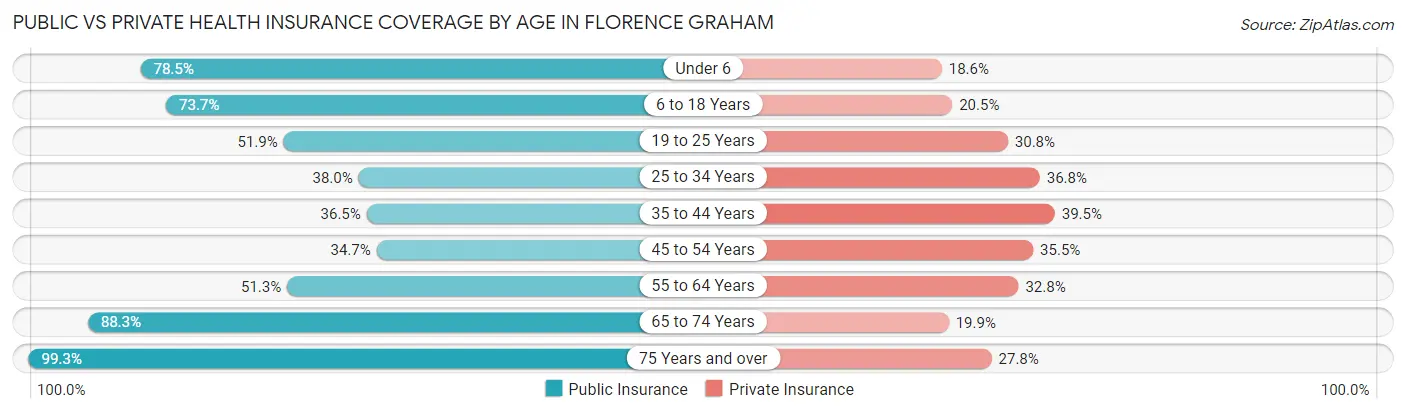
| Age Bracket | Public Insurance | Private Insurance |
| Under 6 | 4,282 (78.5%) | 1,013 (18.6%) |
| 6 to 18 Years | 10,263 (73.7%) | 2,853 (20.5%) |
| 19 to 25 Years | 3,916 (51.9%) | 2,324 (30.8%) |
| 25 to 34 Years | 3,439 (38.0%) | 3,325 (36.7%) |
| 35 to 44 Years | 3,026 (36.5%) | 3,277 (39.5%) |
| 45 to 54 Years | 2,670 (34.7%) | 2,736 (35.5%) |
| 55 to 64 Years | 3,150 (51.3%) | 2,014 (32.8%) |
| 65 to 74 Years | 3,001 (88.3%) | 675 (19.9%) |
| 75 Years and over | 1,617 (99.3%) | 453 (27.8%) |
| Total | 35,364 (56.0%) | 18,670 (29.6%) |
Disability Status by Sex by Age in Florence Graham
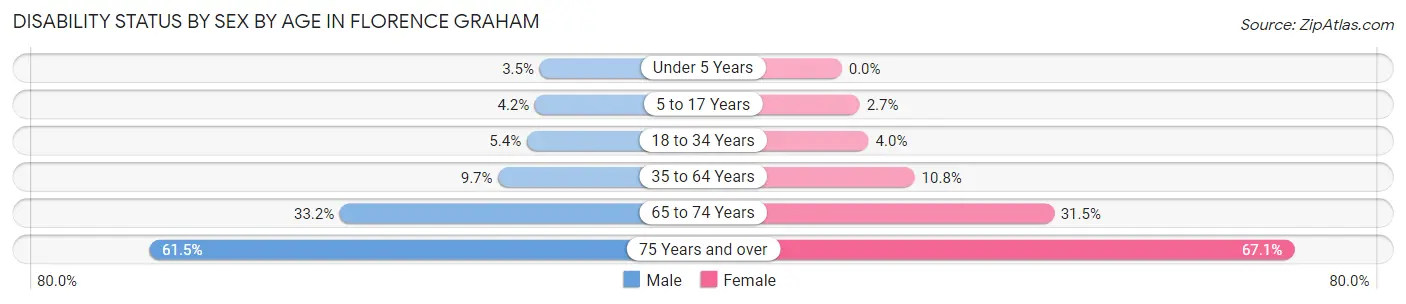
| Age Bracket | Male | Female |
| Under 5 Years | 72 (3.5%) | 0 (0.0%) |
| 5 to 17 Years | 296 (4.2%) | 182 (2.7%) |
| 18 to 34 Years | 497 (5.4%) | 332 (4.0%) |
| 35 to 64 Years | 1,081 (9.7%) | 1,182 (10.8%) |
| 65 to 74 Years | 571 (33.2%) | 528 (31.5%) |
| 75 Years and over | 433 (61.5%) | 621 (67.1%) |
Disability Class by Sex by Age in Florence Graham
Disability Class: Hearing Difficulty
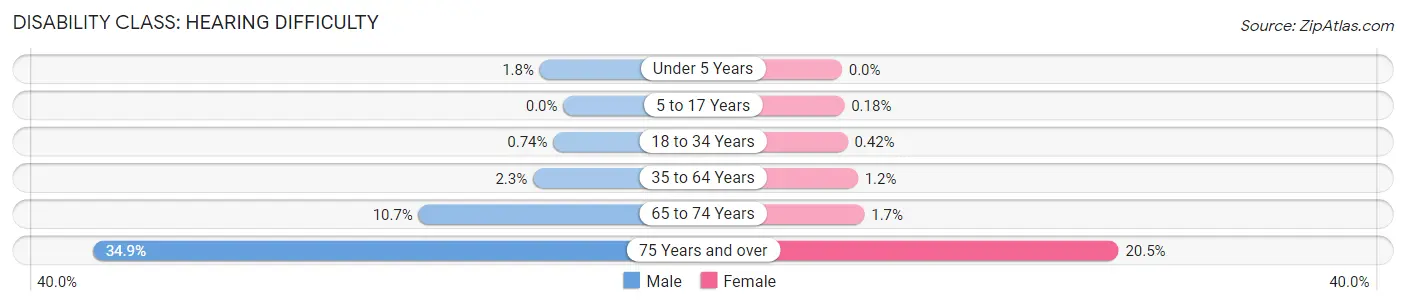
| Age Bracket | Male | Female |
| Under 5 Years | 36 (1.8%) | 0 (0.0%) |
| 5 to 17 Years | 0 (0.0%) | 12 (0.2%) |
| 18 to 34 Years | 68 (0.7%) | 35 (0.4%) |
| 35 to 64 Years | 252 (2.2%) | 129 (1.2%) |
| 65 to 74 Years | 185 (10.7%) | 28 (1.7%) |
| 75 Years and over | 246 (34.9%) | 190 (20.5%) |
Disability Class: Vision Difficulty
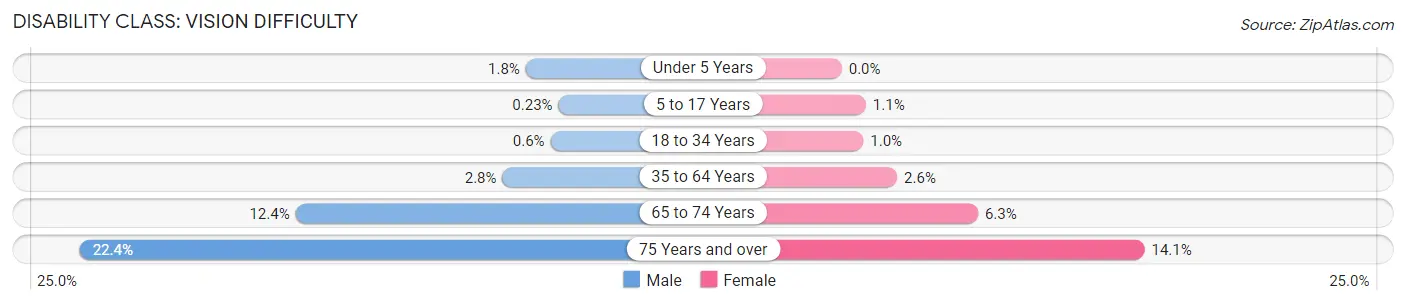
| Age Bracket | Male | Female |
| Under 5 Years | 36 (1.8%) | 0 (0.0%) |
| 5 to 17 Years | 16 (0.2%) | 77 (1.1%) |
| 18 to 34 Years | 55 (0.6%) | 83 (1.0%) |
| 35 to 64 Years | 317 (2.8%) | 281 (2.6%) |
| 65 to 74 Years | 214 (12.4%) | 106 (6.3%) |
| 75 Years and over | 158 (22.4%) | 130 (14.1%) |
Disability Class: Cognitive Difficulty
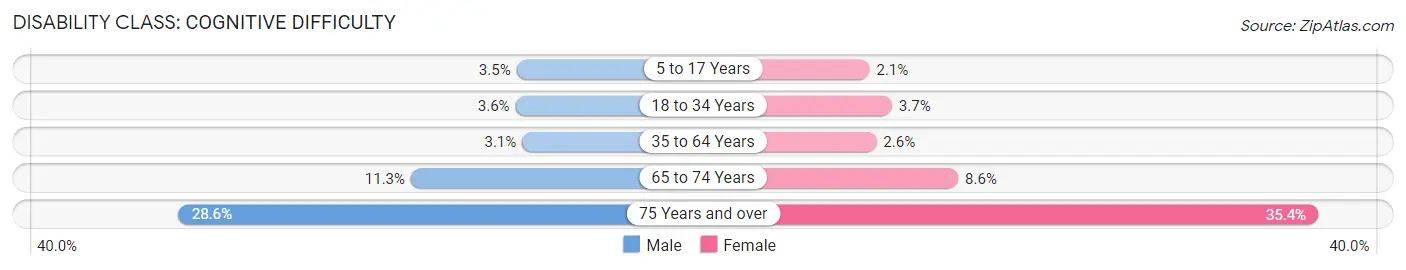
| Age Bracket | Male | Female |
| 5 to 17 Years | 246 (3.5%) | 141 (2.1%) |
| 18 to 34 Years | 328 (3.6%) | 310 (3.7%) |
| 35 to 64 Years | 343 (3.1%) | 281 (2.6%) |
| 65 to 74 Years | 195 (11.3%) | 145 (8.6%) |
| 75 Years and over | 201 (28.5%) | 327 (35.3%) |
Disability Class: Ambulatory Difficulty
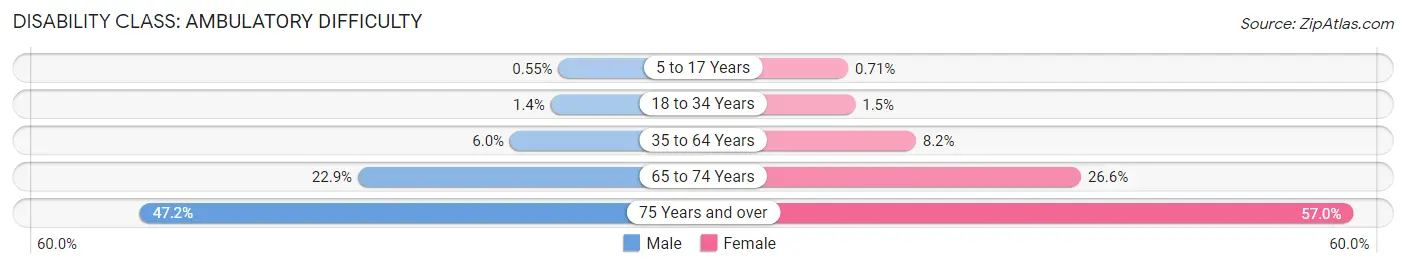
| Age Bracket | Male | Female |
| 5 to 17 Years | 39 (0.5%) | 49 (0.7%) |
| 18 to 34 Years | 131 (1.4%) | 125 (1.5%) |
| 35 to 64 Years | 667 (5.9%) | 900 (8.2%) |
| 65 to 74 Years | 394 (22.9%) | 447 (26.6%) |
| 75 Years and over | 332 (47.2%) | 527 (57.0%) |
Disability Class: Self-Care Difficulty
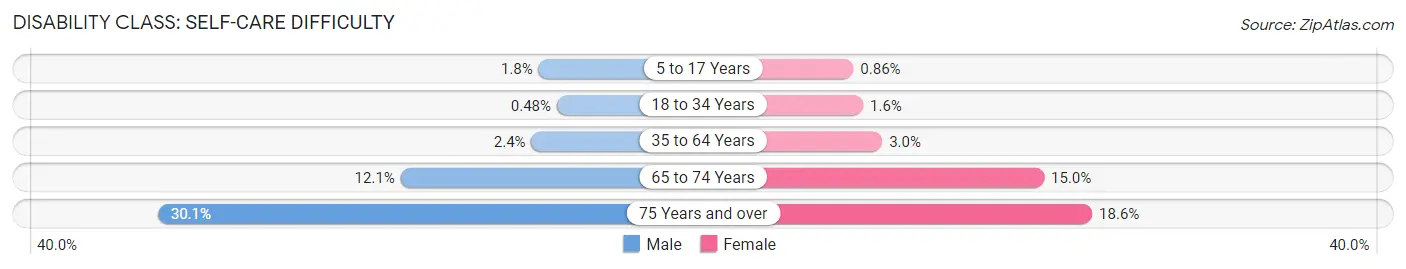
| Age Bracket | Male | Female |
| 5 to 17 Years | 130 (1.8%) | 59 (0.9%) |
| 18 to 34 Years | 44 (0.5%) | 132 (1.6%) |
| 35 to 64 Years | 266 (2.4%) | 328 (3.0%) |
| 65 to 74 Years | 208 (12.1%) | 252 (15.0%) |
| 75 Years and over | 212 (30.1%) | 172 (18.6%) |
Technology Access in Florence Graham
Computing Device Access in Florence Graham
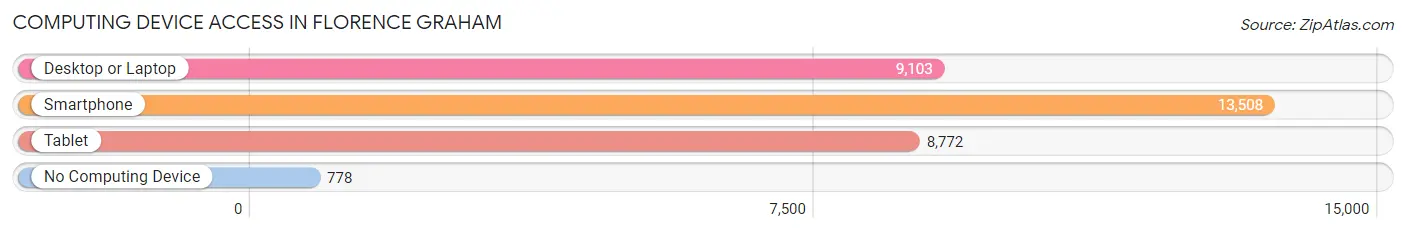
| Device Type | # Households | % Households |
| Desktop or Laptop | 9,103 | 62.2% |
| Smartphone | 13,508 | 92.3% |
| Tablet | 8,772 | 60.0% |
| No Computing Device | 778 | 5.3% |
| Total | 14,630 | 100.0% |
Internet Access in Florence Graham
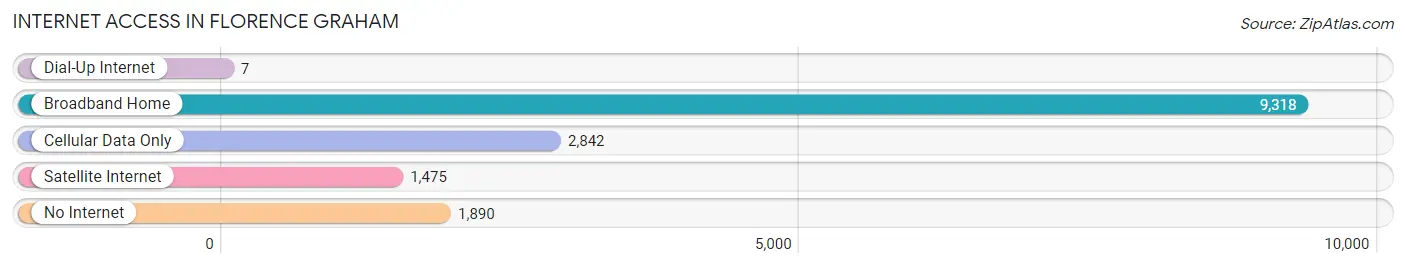
| Internet Type | # Households | % Households |
| Dial-Up Internet | 7 | 0.1% |
| Broadband Home | 9,318 | 63.7% |
| Cellular Data Only | 2,842 | 19.4% |
| Satellite Internet | 1,475 | 10.1% |
| No Internet | 1,890 | 12.9% |
| Total | 14,630 | 100.0% |
Florence Graham Summary
Florence Graham is a census-designated place (CDP) located in Los Angeles County, California. It is located in the South Bay region of the Greater Los Angeles Area, and is bordered by the cities of Bell, Bell Gardens, and South Gate. As of the 2010 census, the population of Florence Graham was 24,553.
Geography
Florence Graham is located at 33°58'25"N 118°10'45"W (33.973611, -118.179167). It has an area of 1.7 square miles (4.4 km2), all of it land.
History
Florence Graham was originally part of the Rancho Los Nietos Mexican land grant. The area was settled in the late 19th century by farmers and ranchers. In the early 20th century, the area was annexed by the City of Bell. In the 1950s, the area was developed as a residential neighborhood.
Economy
Florence Graham is primarily a residential community, with most of its residents employed in the nearby cities of Bell, Bell Gardens, and South Gate. The area is home to several small businesses, including restaurants, convenience stores, and auto repair shops.
Demographics
As of the 2010 census, the population of Florence Graham was 24,553. The racial makeup of the CDP was 63.2% Hispanic or Latino, 24.3% White (non-Hispanic), 8.2% African American, 0.7% Native American, 0.7% Asian, 0.1% Pacific Islander, and 2.9% from other races. The median household income was $37,845, and the median family income was $41,945.
Conclusion
Florence Graham is a census-designated place located in Los Angeles County, California. It is located in the South Bay region of the Greater Los Angeles Area, and is bordered by the cities of Bell, Bell Gardens, and South Gate. As of the 2010 census, the population of Florence Graham was 24,553. The area is primarily residential, with most of its residents employed in the nearby cities. The racial makeup of the CDP was 63.2% Hispanic or Latino, 24.3% White (non-Hispanic), 8.2% African American, 0.7% Native American, 0.7% Asian, 0.1% Pacific Islander, and 2.9% from other races. The median household income was $37,845, and the median family income was $41,945.
Common Questions
What is Per Capita Income in Florence Graham?
Per Capita income in Florence Graham is $17,607.
What is the Median Family Income in Florence Graham?
Median Family Income in Florence Graham is $58,896.
What is the Median Household income in Florence Graham?
Median Household Income in Florence Graham is $58,200.
What is Income or Wage Gap in Florence Graham?
Income or Wage Gap in Florence Graham is 26.9%.
Women in Florence Graham earn 73.1 cents for every dollar earned by a man.
What is Family Income Deficit in Florence Graham?
Family Income Deficit in Florence Graham is $12,051.
Families that are below poverty line in Florence Graham earn $12,051 less on average than the poverty threshold level.
What is Inequality or Gini Index in Florence Graham?
Inequality or Gini Index in Florence Graham is 0.40.
What is the Total Population of Florence Graham?
Total Population of Florence Graham is 63,132.
What is the Total Male Population of Florence Graham?
Total Male Population of Florence Graham is 31,969.
What is the Total Female Population of Florence Graham?
Total Female Population of Florence Graham is 31,163.
What is the Ratio of Males per 100 Females in Florence Graham?
There are 102.59 Males per 100 Females in Florence Graham.
What is the Ratio of Females per 100 Males in Florence Graham?
There are 97.48 Females per 100 Males in Florence Graham.
What is the Median Population Age in Florence Graham?
Median Population Age in Florence Graham is 30.4 Years.
What is the Average Family Size in Florence Graham
Average Family Size in Florence Graham is 4.6 People.
What is the Average Household Size in Florence Graham
Average Household Size in Florence Graham is 4.3 People.
How Large is the Labor Force in Florence Graham?
There are 29,298 People in the Labor Forcein in Florence Graham.
What is the Percentage of People in the Labor Force in Florence Graham?
62.3% of People are in the Labor Force in Florence Graham.
What is the Unemployment Rate in Florence Graham?
Unemployment Rate in Florence Graham is 10.2%.