Los Angeles, CA Map & Demographics
Los Angeles Map
Los Angeles Overview
$43,527
PER CAPITA INCOME
$87,117
AVG FAMILY INCOME
$76,244
AVG HOUSEHOLD INCOME
16.8%
WAGE / INCOME GAP [ % ]
83.2¢/ $1
WAGE / INCOME GAP [ $ ]
$10,805
FAMILY INCOME DEFICIT
0.53
INEQUALITY / GINI INDEX
3,881,041
TOTAL POPULATION
1,941,047
MALE POPULATION
1,939,994
FEMALE POPULATION
100.05
MALES / 100 FEMALES
99.95
FEMALES / 100 MALES
36.5
MEDIAN AGE
3.5
AVG FAMILY SIZE
2.7
AVG HOUSEHOLD SIZE
2,128,884
LABOR FORCE [ PEOPLE ]
66.5%
PERCENT IN LABOR FORCE
7.7%
UNEMPLOYMENT RATE
Los Angeles Zip Codes
Income in Los Angeles
Income Overview in Los Angeles
Per Capita Income in Los Angeles is $43,527, while median incomes of families and households are $87,117 and $76,244 respectively.
| Characteristic | Number | Measure |
| Per Capita Income | 3,881,041 | $43,527 |
| Median Family Income | 819,802 | $87,117 |
| Mean Family Income | 819,802 | $133,803 |
| Median Household Income | 1,399,442 | $76,244 |
| Mean Household Income | 1,399,442 | $116,961 |
| Income Deficit | 819,802 | $10,805 |
| Wage / Income Gap (%) | 3,881,041 | 16.81% |
| Wage / Income Gap ($) | 3,881,041 | 83.19¢ per $1 |
| Gini / Inequality Index | 3,881,041 | 0.53 |
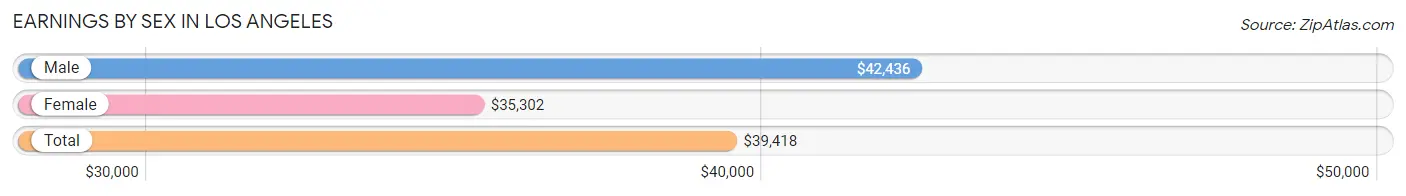
Earnings by Sex in Los Angeles
Average Earnings in Los Angeles are $39,418, $42,436 for men and $35,302 for women, a difference of 16.8%.
| Sex | Number | Average Earnings |
| Male | 1,165,461 (53.9%) | $42,436 |
| Female | 998,395 (46.1%) | $35,302 |
| Total | 2,163,856 (100.0%) | $39,418 |
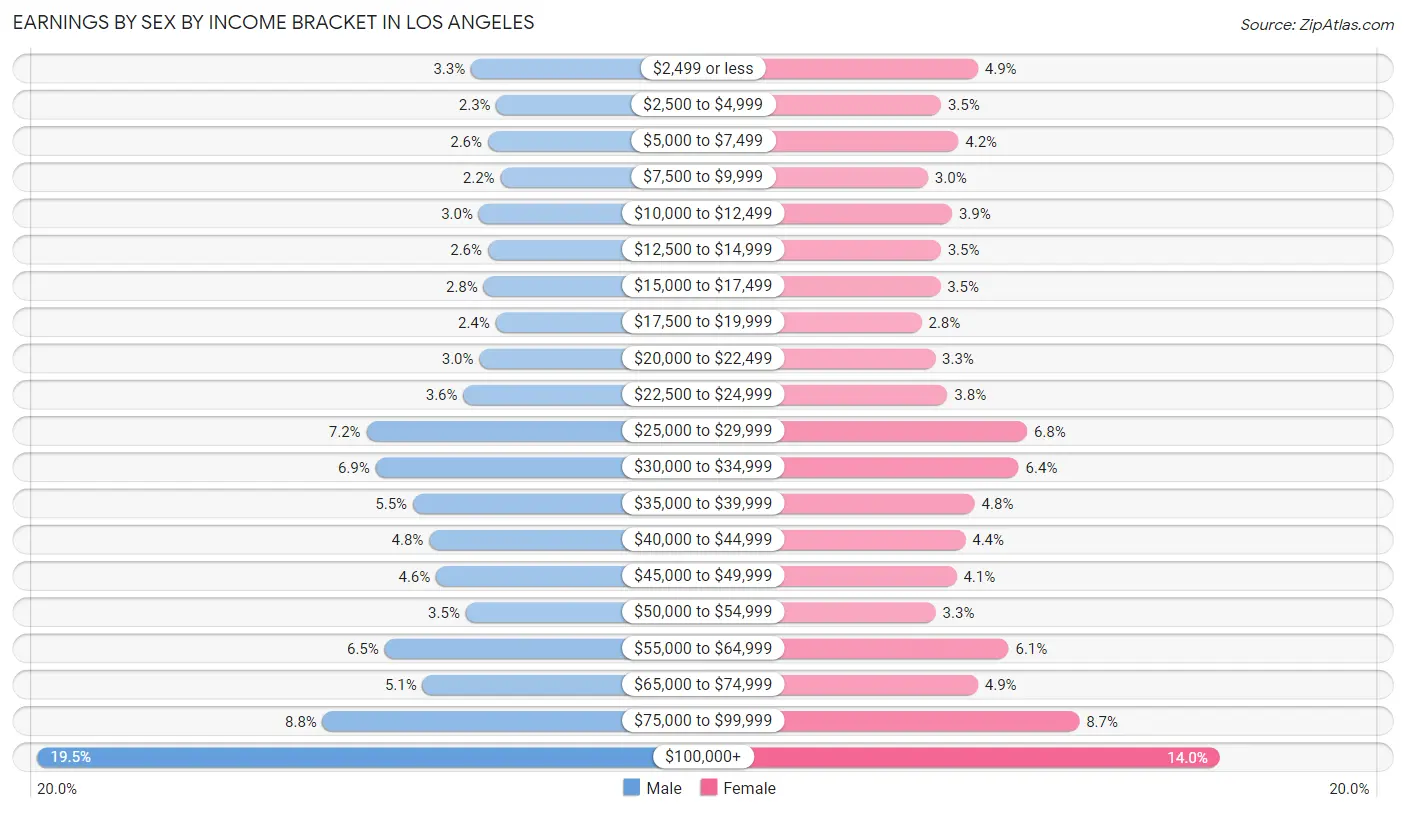
Earnings by Sex by Income Bracket in Los Angeles
The most common earnings brackets in Los Angeles are $100,000+ for men (227,406 | 19.5%) and $100,000+ for women (139,480 | 14.0%).
| Income | Male | Female |
| $2,499 or less | 38,145 (3.3%) | 48,973 (4.9%) |
| $2,500 to $4,999 | 27,037 (2.3%) | 35,249 (3.5%) |
| $5,000 to $7,499 | 30,751 (2.6%) | 41,702 (4.2%) |
| $7,500 to $9,999 | 25,292 (2.2%) | 30,366 (3.0%) |
| $10,000 to $12,499 | 34,674 (3.0%) | 39,340 (3.9%) |
| $12,500 to $14,999 | 30,758 (2.6%) | 35,185 (3.5%) |
| $15,000 to $17,499 | 32,614 (2.8%) | 34,985 (3.5%) |
| $17,500 to $19,999 | 27,401 (2.4%) | 27,917 (2.8%) |
| $20,000 to $22,499 | 34,491 (3.0%) | 33,009 (3.3%) |
| $22,500 to $24,999 | 41,485 (3.6%) | 37,626 (3.8%) |
| $25,000 to $29,999 | 83,758 (7.2%) | 67,344 (6.8%) |
| $30,000 to $34,999 | 79,836 (6.9%) | 64,327 (6.4%) |
| $35,000 to $39,999 | 63,540 (5.4%) | 47,830 (4.8%) |
| $40,000 to $44,999 | 56,353 (4.8%) | 44,311 (4.4%) |
| $45,000 to $49,999 | 53,346 (4.6%) | 41,042 (4.1%) |
| $50,000 to $54,999 | 40,409 (3.5%) | 33,280 (3.3%) |
| $55,000 to $64,999 | 75,909 (6.5%) | 60,470 (6.1%) |
| $65,000 to $74,999 | 59,340 (5.1%) | 48,982 (4.9%) |
| $75,000 to $99,999 | 102,916 (8.8%) | 86,977 (8.7%) |
| $100,000+ | 227,406 (19.5%) | 139,480 (14.0%) |
| Total | 1,165,461 (100.0%) | 998,395 (100.0%) |
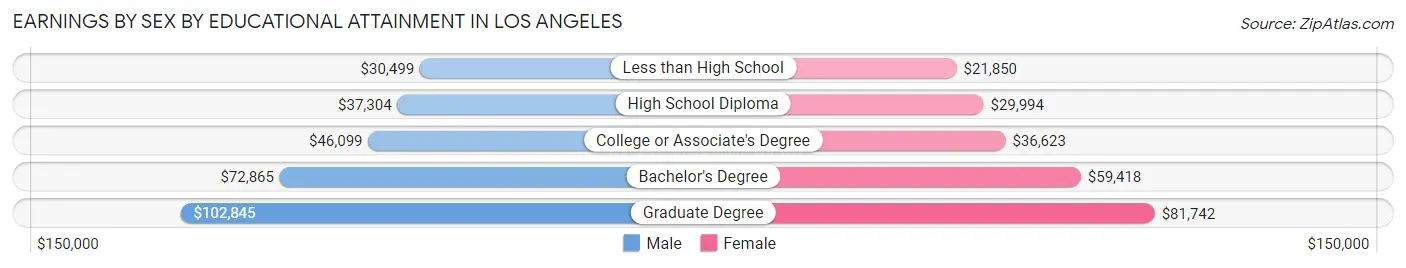
Earnings by Sex by Educational Attainment in Los Angeles
Average earnings in Los Angeles are $47,081 for men and $40,759 for women, a difference of 13.4%. Men with an educational attainment of graduate degree enjoy the highest average annual earnings of $102,845, while those with less than high school education earn the least with $30,499. Women with an educational attainment of graduate degree earn the most with the average annual earnings of $81,742, while those with less than high school education have the smallest earnings of $21,850.
| Educational Attainment | Male Income | Female Income |
| Less than High School | $30,499 | $21,850 |
| High School Diploma | $37,304 | $29,994 |
| College or Associate's Degree | $46,099 | $36,623 |
| Bachelor's Degree | $72,865 | $59,418 |
| Graduate Degree | $102,845 | $81,742 |
| Total | $47,081 | $40,759 |
Family Income in Los Angeles
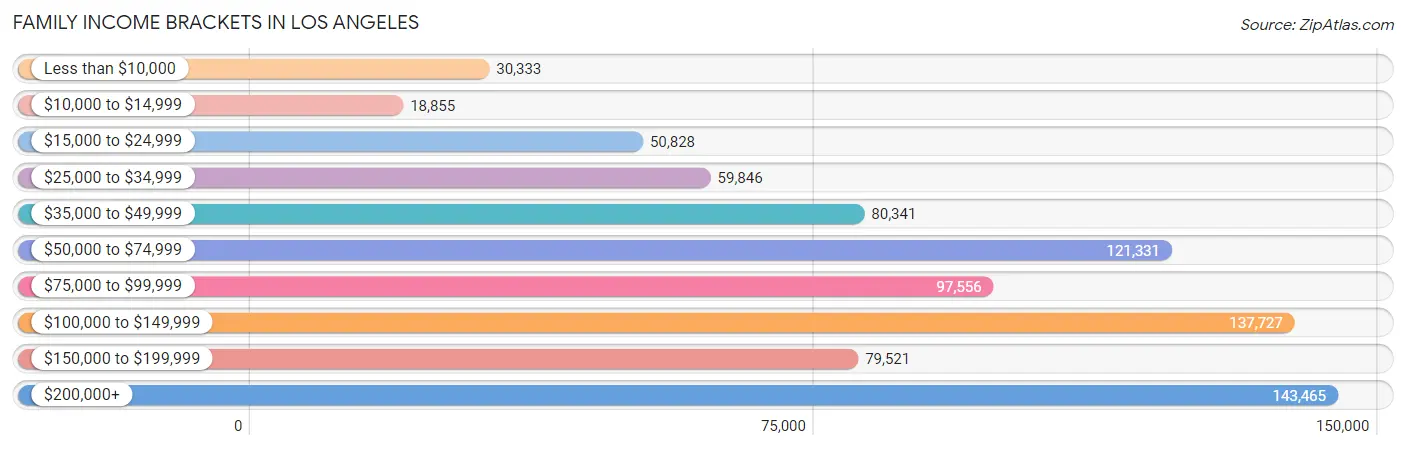
Family Income Brackets in Los Angeles
According to the Los Angeles family income data, there are 143,465 families falling into the $200,000+ income range, which is the most common income bracket and makes up 17.5% of all families. Conversely, the $10,000 to $14,999 income bracket is the least frequent group with only 18,855 families (2.3%) belonging to this category.
| Income Bracket | # Families | % Families |
| Less than $10,000 | 30,333 | 3.7% |
| $10,000 to $14,999 | 18,855 | 2.3% |
| $15,000 to $24,999 | 50,828 | 6.2% |
| $25,000 to $34,999 | 59,846 | 7.3% |
| $35,000 to $49,999 | 80,341 | 9.8% |
| $50,000 to $74,999 | 121,331 | 14.8% |
| $75,000 to $99,999 | 97,556 | 11.9% |
| $100,000 to $149,999 | 137,727 | 16.8% |
| $150,000 to $199,999 | 79,521 | 9.7% |
| $200,000+ | 143,465 | 17.5% |
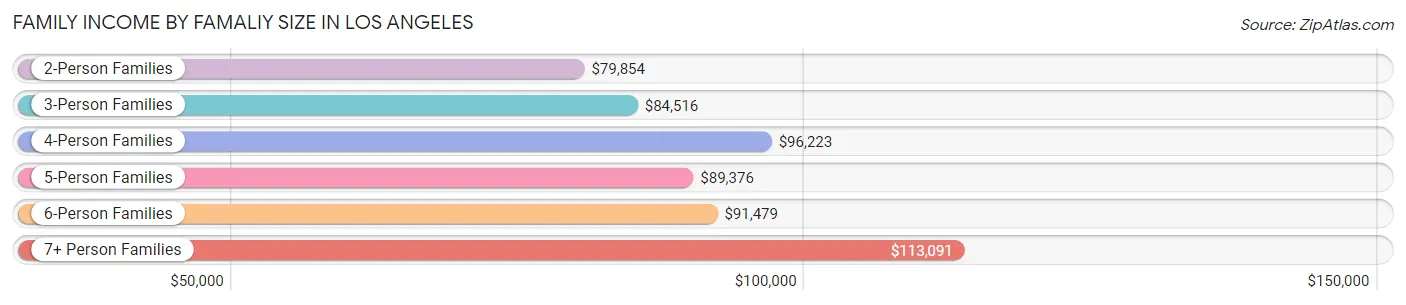
Family Income by Famaliy Size in Los Angeles
7+ person families (28,129 | 3.4%) account for the highest median family income in Los Angeles with $113,091 per family, while 2-person families (319,448 | 39.0%) have the highest median income of $39,927 per family member.
| Income Bracket | # Families | Median Income |
| 2-Person Families | 319,448 (39.0%) | $79,854 |
| 3-Person Families | 194,849 (23.8%) | $84,516 |
| 4-Person Families | 163,750 (20.0%) | $96,223 |
| 5-Person Families | 81,171 (9.9%) | $89,376 |
| 6-Person Families | 32,455 (4.0%) | $91,479 |
| 7+ Person Families | 28,129 (3.4%) | $113,091 |
| Total | 819,802 (100.0%) | $87,117 |
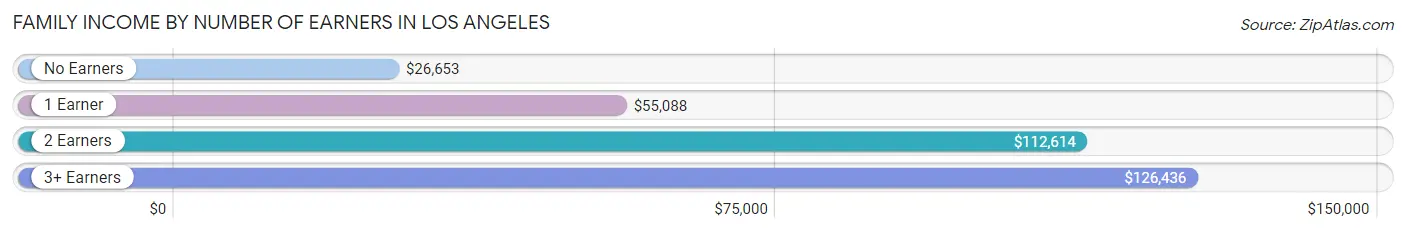
Family Income by Number of Earners in Los Angeles
The median family income in Los Angeles is $87,117, with families comprising 3+ earners (132,133) having the highest median family income of $126,436, while families with no earners (83,354) have the lowest median family income of $26,653, accounting for 16.1% and 10.2% of families, respectively.
| Number of Earners | # Families | Median Income |
| No Earners | 83,354 (10.2%) | $26,653 |
| 1 Earner | 265,382 (32.4%) | $55,088 |
| 2 Earners | 338,933 (41.3%) | $112,614 |
| 3+ Earners | 132,133 (16.1%) | $126,436 |
| Total | 819,802 (100.0%) | $87,117 |
Household Income in Los Angeles
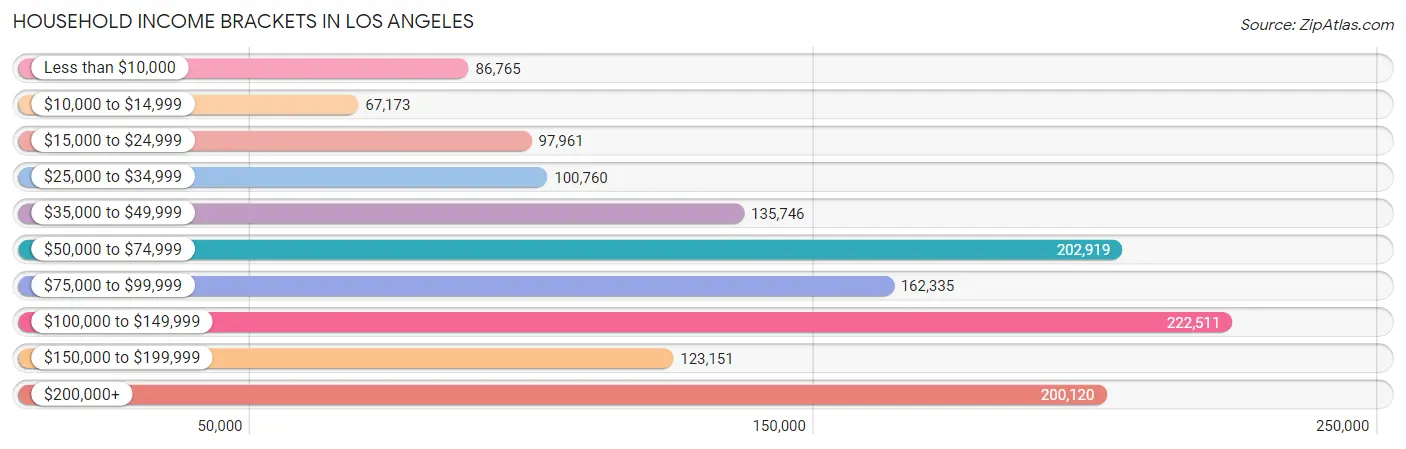
Household Income Brackets in Los Angeles
With 222,511 households falling in the category, the $100,000 to $149,999 income range is the most frequent in Los Angeles, accounting for 15.9% of all households. In contrast, only 67,173 households (4.8%) fall into the $10,000 to $14,999 income bracket, making it the least populous group.
| Income Bracket | # Households | % Households |
| Less than $10,000 | 86,765 | 6.2% |
| $10,000 to $14,999 | 67,173 | 4.8% |
| $15,000 to $24,999 | 97,961 | 7.0% |
| $25,000 to $34,999 | 100,760 | 7.2% |
| $35,000 to $49,999 | 135,746 | 9.7% |
| $50,000 to $74,999 | 202,919 | 14.5% |
| $75,000 to $99,999 | 162,335 | 11.6% |
| $100,000 to $149,999 | 222,511 | 15.9% |
| $150,000 to $199,999 | 123,151 | 8.8% |
| $200,000+ | 200,120 | 14.3% |
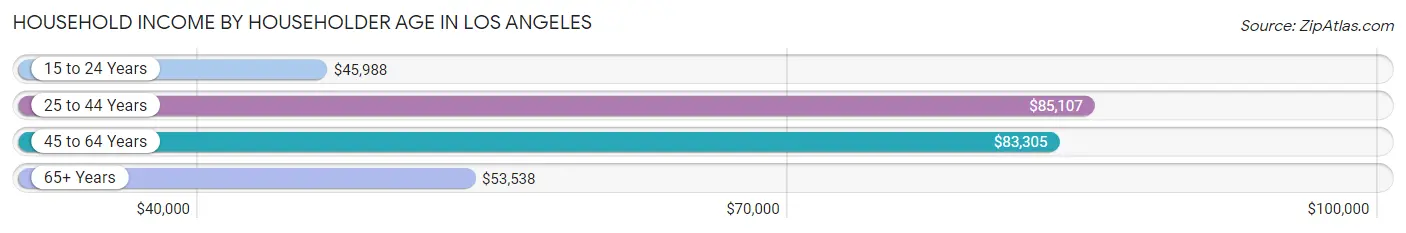
Household Income by Householder Age in Los Angeles
The median household income in Los Angeles is $76,244, with the highest median household income of $85,107 found in the 25 to 44 years age bracket for the primary householder. A total of 550,054 households (39.3%) fall into this category. Meanwhile, the 15 to 24 years age bracket for the primary householder has the lowest median household income of $45,988, with 46,887 households (3.4%) in this group.
| Income Bracket | # Households | Median Income |
| 15 to 24 Years | 46,887 (3.4%) | $45,988 |
| 25 to 44 Years | 550,054 (39.3%) | $85,107 |
| 45 to 64 Years | 507,239 (36.2%) | $83,305 |
| 65+ Years | 295,262 (21.1%) | $53,538 |
| Total | 1,399,442 (100.0%) | $76,244 |
Poverty in Los Angeles
Income Below Poverty by Sex and Age in Los Angeles
With 15.2% poverty level for males and 18.1% for females among the residents of Los Angeles, 6 to 11 year old males and 18 to 24 year old females are the most vulnerable to poverty, with 29,641 males (22.9%) and 41,774 females (24.3%) in their respective age groups living below the poverty level.
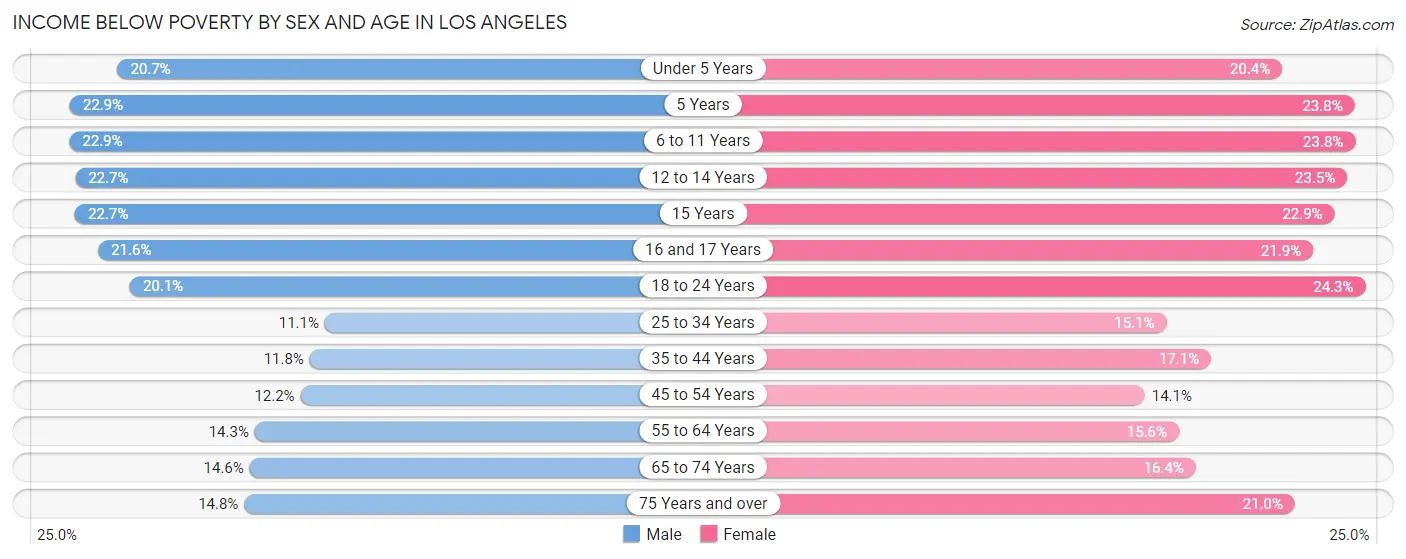
| Age Bracket | Male | Female |
| Under 5 Years | 21,758 (20.7%) | 19,899 (20.4%) |
| 5 Years | 4,489 (22.9%) | 4,556 (23.8%) |
| 6 to 11 Years | 29,641 (22.9%) | 28,973 (23.8%) |
| 12 to 14 Years | 15,577 (22.7%) | 14,695 (23.4%) |
| 15 Years | 5,088 (22.7%) | 5,097 (22.9%) |
| 16 and 17 Years | 9,360 (21.6%) | 9,056 (21.9%) |
| 18 to 24 Years | 35,420 (20.1%) | 41,774 (24.3%) |
| 25 to 34 Years | 38,876 (11.1%) | 51,029 (15.1%) |
| 35 to 44 Years | 34,393 (11.8%) | 46,711 (17.1%) |
| 45 to 54 Years | 31,002 (12.2%) | 34,450 (14.1%) |
| 55 to 64 Years | 31,157 (14.3%) | 35,140 (15.6%) |
| 65 to 74 Years | 20,208 (14.6%) | 26,338 (16.4%) |
| 75 Years and over | 12,319 (14.8%) | 26,696 (21.0%) |
| Total | 289,288 (15.2%) | 344,414 (18.1%) |
Income Above Poverty by Sex and Age in Los Angeles
According to the poverty statistics in Los Angeles, males aged 25 to 34 years and females aged 45 to 54 years are the age groups that are most secure financially, with 88.9% of males and 85.9% of females in these age groups living above the poverty line.
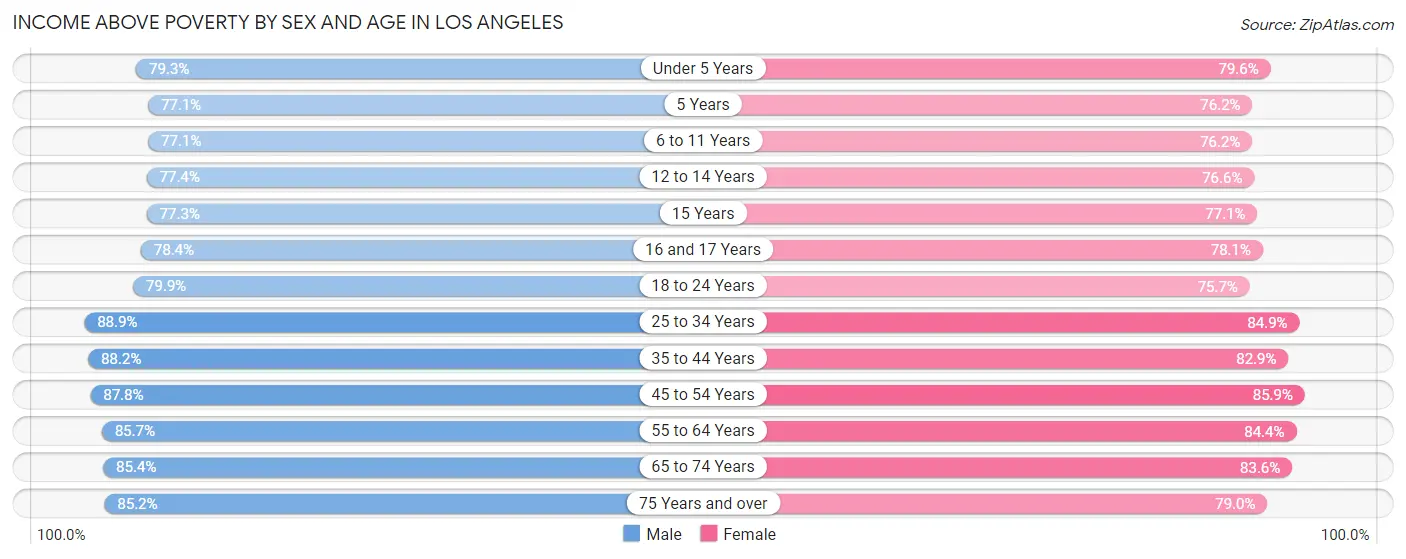
| Age Bracket | Male | Female |
| Under 5 Years | 83,418 (79.3%) | 77,515 (79.6%) |
| 5 Years | 15,117 (77.1%) | 14,593 (76.2%) |
| 6 to 11 Years | 99,665 (77.1%) | 92,649 (76.2%) |
| 12 to 14 Years | 53,194 (77.3%) | 47,961 (76.5%) |
| 15 Years | 17,365 (77.3%) | 17,198 (77.1%) |
| 16 and 17 Years | 33,994 (78.4%) | 32,354 (78.1%) |
| 18 to 24 Years | 140,733 (79.9%) | 130,190 (75.7%) |
| 25 to 34 Years | 312,437 (88.9%) | 287,729 (84.9%) |
| 35 to 44 Years | 257,874 (88.2%) | 225,957 (82.9%) |
| 45 to 54 Years | 223,033 (87.8%) | 210,536 (85.9%) |
| 55 to 64 Years | 186,383 (85.7%) | 189,525 (84.4%) |
| 65 to 74 Years | 118,625 (85.4%) | 134,086 (83.6%) |
| 75 Years and over | 70,858 (85.2%) | 100,326 (79.0%) |
| Total | 1,612,696 (84.8%) | 1,560,619 (81.9%) |
Income Below Poverty Among Married-Couple Families in Los Angeles
The poverty statistics for married-couple families in Los Angeles show that 7.5% or 40,044 of the total 530,750 families live below the poverty line. Families with 5 or more children have the highest poverty rate of 26.2%, comprising of 838 families. On the other hand, families with no children have the lowest poverty rate of 5.3%, which includes 15,598 families.
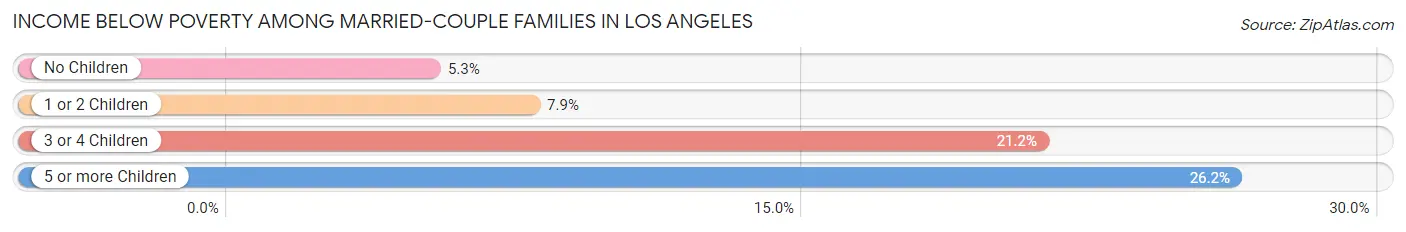
| Children | Above Poverty | Below Poverty |
| No Children | 278,980 (94.7%) | 15,598 (5.3%) |
| 1 or 2 Children | 178,406 (92.1%) | 15,292 (7.9%) |
| 3 or 4 Children | 30,961 (78.8%) | 8,316 (21.2%) |
| 5 or more Children | 2,359 (73.8%) | 838 (26.2%) |
| Total | 490,706 (92.5%) | 40,044 (7.5%) |
Income Below Poverty Among Single-Parent Households in Los Angeles
According to the poverty data in Los Angeles, 13.8% or 13,229 single-father households and 23.3% or 45,032 single-mother households are living below the poverty line. Among single-father households, those with 5 or more children have the highest poverty rate, with 344 households (53.7%) experiencing poverty. Likewise, among single-mother households, those with 5 or more children have the highest poverty rate, with 1,289 households (70.4%) falling below the poverty line.
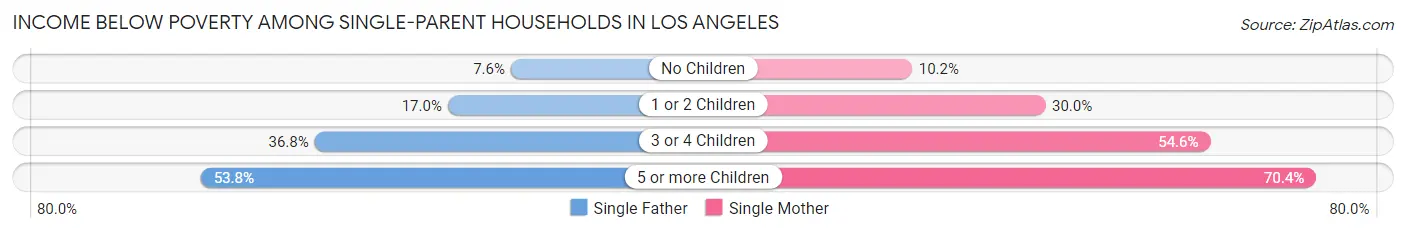
| Children | Single Father | Single Mother |
| No Children | 3,809 (7.5%) | 9,250 (10.2%) |
| 1 or 2 Children | 6,311 (17.0%) | 24,677 (30.0%) |
| 3 or 4 Children | 2,765 (36.8%) | 9,816 (54.6%) |
| 5 or more Children | 344 (53.7%) | 1,289 (70.4%) |
| Total | 13,229 (13.8%) | 45,032 (23.3%) |
Income Below Poverty Among Married-Couple vs Single-Parent Households in Los Angeles
The poverty data for Los Angeles shows that 40,044 of the married-couple family households (7.5%) and 58,261 of the single-parent households (20.2%) are living below the poverty level. Within the married-couple family households, those with 5 or more children have the highest poverty rate, with 838 households (26.2%) falling below the poverty line. Among the single-parent households, those with 5 or more children have the highest poverty rate, with 1,633 household (66.1%) living below poverty.
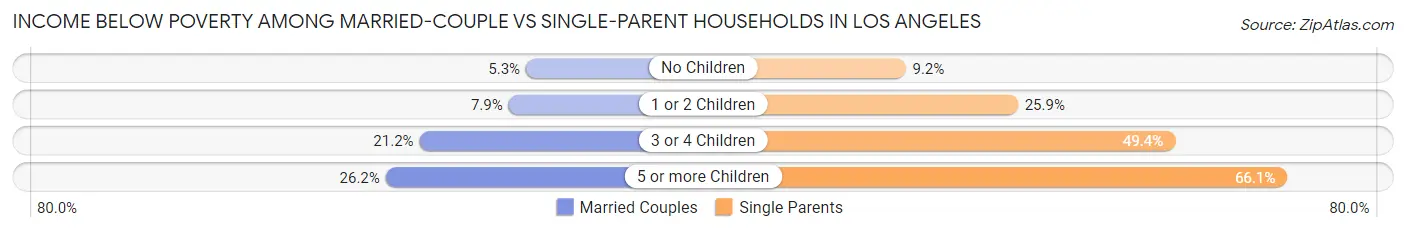
| Children | Married-Couple Families | Single-Parent Households |
| No Children | 15,598 (5.3%) | 13,059 (9.2%) |
| 1 or 2 Children | 15,292 (7.9%) | 30,988 (25.9%) |
| 3 or 4 Children | 8,316 (21.2%) | 12,581 (49.4%) |
| 5 or more Children | 838 (26.2%) | 1,633 (66.1%) |
| Total | 40,044 (7.5%) | 58,261 (20.2%) |
Race in Los Angeles
The most populous races in Los Angeles are Hispanic or Latino (1,865,763 | 48.1%), White / Caucasian (1,597,875 | 41.2%), and Some other Race (952,377 | 24.5%).
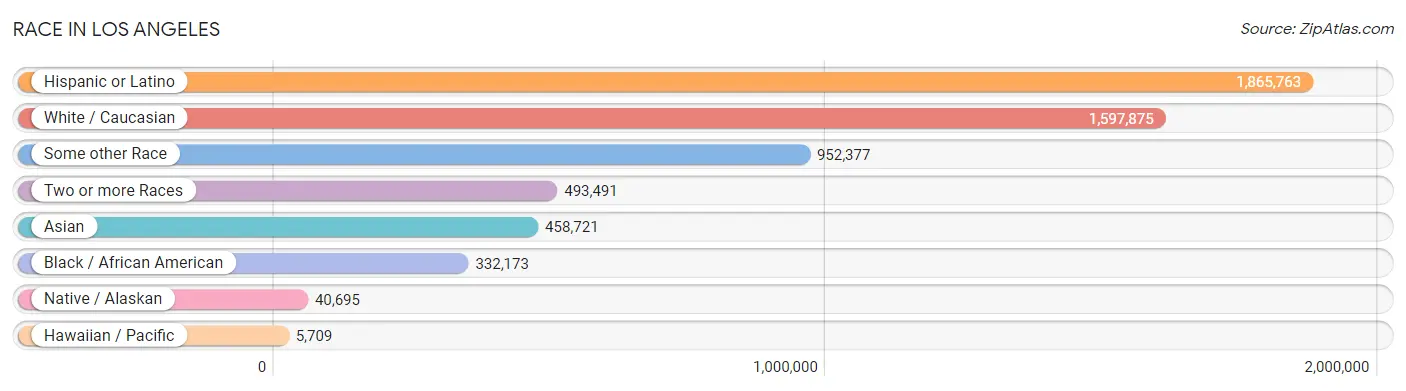
| Race | # Population | % Population |
| Asian | 458,721 | 11.8% |
| Black / African American | 332,173 | 8.6% |
| Hawaiian / Pacific | 5,709 | 0.2% |
| Hispanic or Latino | 1,865,763 | 48.1% |
| Native / Alaskan | 40,695 | 1.1% |
| White / Caucasian | 1,597,875 | 41.2% |
| Two or more Races | 493,491 | 12.7% |
| Some other Race | 952,377 | 24.5% |
| Total | 3,881,041 | 100.0% |
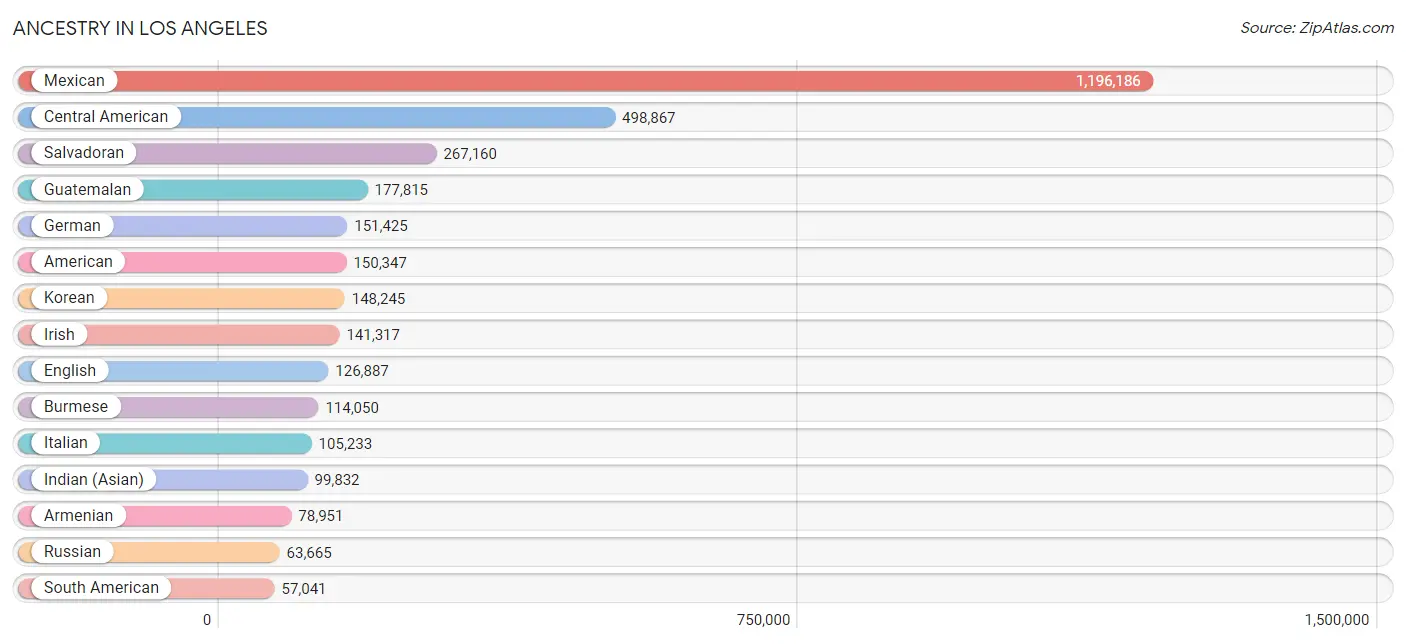
Ancestry in Los Angeles
The most populous ancestries reported in Los Angeles are Mexican (1,196,186 | 30.8%), Central American (498,867 | 12.9%), Salvadoran (267,160 | 6.9%), Guatemalan (177,815 | 4.6%), and German (151,425 | 3.9%), together accounting for 59.0% of all Los Angeles residents.
| Ancestry | # Population | % Population |
| Afghan | 2,965 | 0.1% |
| African | 22,522 | 0.6% |
| Alaska Native | 174 | 0.0% |
| Alaskan Athabascan | 30 | 0.0% |
| Albanian | 352 | 0.0% |
| Aleut | 36 | 0.0% |
| Alsatian | 30 | 0.0% |
| American | 150,347 | 3.9% |
| Apache | 2,123 | 0.1% |
| Arab | 31,610 | 0.8% |
| Arapaho | 7 | 0.0% |
| Argentinean | 8,567 | 0.2% |
| Armenian | 78,951 | 2.0% |
| Assyrian / Chaldean / Syriac | 1,593 | 0.0% |
| Australian | 2,720 | 0.1% |
| Austrian | 8,386 | 0.2% |
| Bahamian | 447 | 0.0% |
| Bangladeshi | 428 | 0.0% |
| Barbadian | 222 | 0.0% |
| Basque | 970 | 0.0% |
| Belgian | 1,698 | 0.0% |
| Belizean | 8,198 | 0.2% |
| Bermudan | 31 | 0.0% |
| Bhutanese | 45,377 | 1.2% |
| Blackfeet | 1,873 | 0.1% |
| Bolivian | 2,347 | 0.1% |
| Brazilian | 5,906 | 0.2% |
| British | 18,310 | 0.5% |
| British West Indian | 516 | 0.0% |
| Bulgarian | 1,594 | 0.0% |
| Burmese | 114,050 | 2.9% |
| Cajun | 190 | 0.0% |
| Cambodian | 2,204 | 0.1% |
| Canadian | 6,139 | 0.2% |
| Cape Verdean | 533 | 0.0% |
| Carpatho Rusyn | 67 | 0.0% |
| Celtic | 255 | 0.0% |
| Central American | 498,867 | 12.9% |
| Central American Indian | 15,400 | 0.4% |
| Cherokee | 7,188 | 0.2% |
| Cheyenne | 149 | 0.0% |
| Chickasaw | 472 | 0.0% |
| Chilean | 4,132 | 0.1% |
| Chinese | 219 | 0.0% |
| Chippewa | 608 | 0.0% |
| Choctaw | 1,655 | 0.0% |
| Colombian | 15,228 | 0.4% |
| Colville | 32 | 0.0% |
| Comanche | 198 | 0.0% |
| Costa Rican | 2,869 | 0.1% |
| Cree | 93 | 0.0% |
| Creek | 412 | 0.0% |
| Croatian | 5,951 | 0.2% |
| Cuban | 14,257 | 0.4% |
| Cypriot | 86 | 0.0% |
| Czech | 5,928 | 0.2% |
| Czechoslovakian | 1,549 | 0.0% |
| Danish | 7,366 | 0.2% |
| Delaware | 295 | 0.0% |
| Dominican | 3,450 | 0.1% |
| Dutch | 14,788 | 0.4% |
| Dutch West Indian | 8 | 0.0% |
| Eastern European | 22,951 | 0.6% |
| Ecuadorian | 7,850 | 0.2% |
| Egyptian | 6,416 | 0.2% |
| English | 126,887 | 3.3% |
| Estonian | 243 | 0.0% |
| Ethiopian | 6,288 | 0.2% |
| European | 49,940 | 1.3% |
| Fijian | 11 | 0.0% |
| Filipino | 7,926 | 0.2% |
| Finnish | 3,342 | 0.1% |
| French | 41,647 | 1.1% |
| French American Indian | 173 | 0.0% |
| French Canadian | 6,018 | 0.2% |
| German | 151,425 | 3.9% |
| German Russian | 84 | 0.0% |
| Ghanaian | 2,203 | 0.1% |
| Greek | 11,620 | 0.3% |
| Guamanian / Chamorro | 2,111 | 0.1% |
| Guatemalan | 177,815 | 4.6% |
| Guyanese | 362 | 0.0% |
| Haitian | 2,391 | 0.1% |
| Hmong | 41 | 0.0% |
| Honduran | 29,091 | 0.7% |
| Hopi | 122 | 0.0% |
| Hungarian | 14,079 | 0.4% |
| Icelander | 456 | 0.0% |
| Indian (Asian) | 99,832 | 2.6% |
| Indonesian | 1,366 | 0.0% |
| Inupiat | 100 | 0.0% |
| Iranian | 53,261 | 1.4% |
| Iraqi | 1,416 | 0.0% |
| Irish | 141,317 | 3.6% |
| Iroquois | 456 | 0.0% |
| Israeli | 10,661 | 0.3% |
| Italian | 105,233 | 2.7% |
| Jamaican | 7,848 | 0.2% |
| Japanese | 5,191 | 0.1% |
| Jordanian | 809 | 0.0% |
| Kenyan | 755 | 0.0% |
| Kiowa | 82 | 0.0% |
| Korean | 148,245 | 3.8% |
| Laotian | 5,803 | 0.2% |
| Latvian | 1,481 | 0.0% |
| Lebanese | 7,986 | 0.2% |
| Liberian | 271 | 0.0% |
| Lithuanian | 5,322 | 0.1% |
| Lumbee | 51 | 0.0% |
| Luxembourger | 157 | 0.0% |
| Macedonian | 310 | 0.0% |
| Malaysian | 868 | 0.0% |
| Maltese | 348 | 0.0% |
| Menominee | 42 | 0.0% |
| Mexican | 1,196,186 | 30.8% |
| Mexican American Indian | 24,074 | 0.6% |
| Mongolian | 519 | 0.0% |
| Moroccan | 2,552 | 0.1% |
| Native Hawaiian | 4,893 | 0.1% |
| Navajo | 2,468 | 0.1% |
| Nepalese | 121 | 0.0% |
| New Zealander | 723 | 0.0% |
| Nicaraguan | 15,334 | 0.4% |
| Nigerian | 6,804 | 0.2% |
| Northern European | 4,240 | 0.1% |
| Norwegian | 16,532 | 0.4% |
| Okinawan | 278 | 0.0% |
| Osage | 245 | 0.0% |
| Ottawa | 24 | 0.0% |
| Paiute | 92 | 0.0% |
| Pakistani | 12,803 | 0.3% |
| Palestinian | 1,861 | 0.1% |
| Panamanian | 2,303 | 0.1% |
| Paraguayan | 176 | 0.0% |
| Pennsylvania German | 242 | 0.0% |
| Peruvian | 13,670 | 0.4% |
| Pima | 99 | 0.0% |
| Polish | 51,595 | 1.3% |
| Portuguese | 9,077 | 0.2% |
| Potawatomi | 127 | 0.0% |
| Pueblo | 608 | 0.0% |
| Puerto Rican | 19,200 | 0.5% |
| Puget Sound Salish | 67 | 0.0% |
| Romanian | 8,213 | 0.2% |
| Russian | 63,665 | 1.6% |
| Salvadoran | 267,160 | 6.9% |
| Samoan | 2,536 | 0.1% |
| Scandinavian | 4,927 | 0.1% |
| Scotch-Irish | 11,368 | 0.3% |
| Scottish | 26,508 | 0.7% |
| Seminole | 279 | 0.0% |
| Senegalese | 256 | 0.0% |
| Serbian | 2,627 | 0.1% |
| Shoshone | 52 | 0.0% |
| Sierra Leonean | 438 | 0.0% |
| Sioux | 752 | 0.0% |
| Slavic | 1,375 | 0.0% |
| Slovak | 1,915 | 0.1% |
| Slovene | 1,281 | 0.0% |
| Somali | 129 | 0.0% |
| South African | 1,852 | 0.1% |
| South American | 57,041 | 1.5% |
| South American Indian | 1,267 | 0.0% |
| Soviet Union | 219 | 0.0% |
| Spaniard | 12,182 | 0.3% |
| Spanish | 9,395 | 0.2% |
| Spanish American | 582 | 0.0% |
| Spanish American Indian | 491 | 0.0% |
| Sri Lankan | 31,548 | 0.8% |
| Subsaharan African | 44,311 | 1.1% |
| Sudanese | 279 | 0.0% |
| Swedish | 19,381 | 0.5% |
| Swiss | 5,020 | 0.1% |
| Syrian | 1,897 | 0.1% |
| Taiwanese | 241 | 0.0% |
| Thai | 46,428 | 1.2% |
| Tlingit-Haida | 72 | 0.0% |
| Tohono O'Odham | 146 | 0.0% |
| Tongan | 940 | 0.0% |
| Trinidadian and Tobagonian | 1,170 | 0.0% |
| Turkish | 4,250 | 0.1% |
| U.S. Virgin Islander | 219 | 0.0% |
| Ugandan | 309 | 0.0% |
| Ukrainian | 16,819 | 0.4% |
| Uruguayan | 1,266 | 0.0% |
| Ute | 58 | 0.0% |
| Venezuelan | 3,164 | 0.1% |
| Vietnamese | 4,789 | 0.1% |
| Welsh | 8,395 | 0.2% |
| West Indian | 1,440 | 0.0% |
| Yaqui | 1,405 | 0.0% |
| Yugoslavian | 1,294 | 0.0% |
| Yuman | 56 | 0.0% |
| Zimbabwean | 79 | 0.0% | View All 194 Rows |
Immigrants in Los Angeles
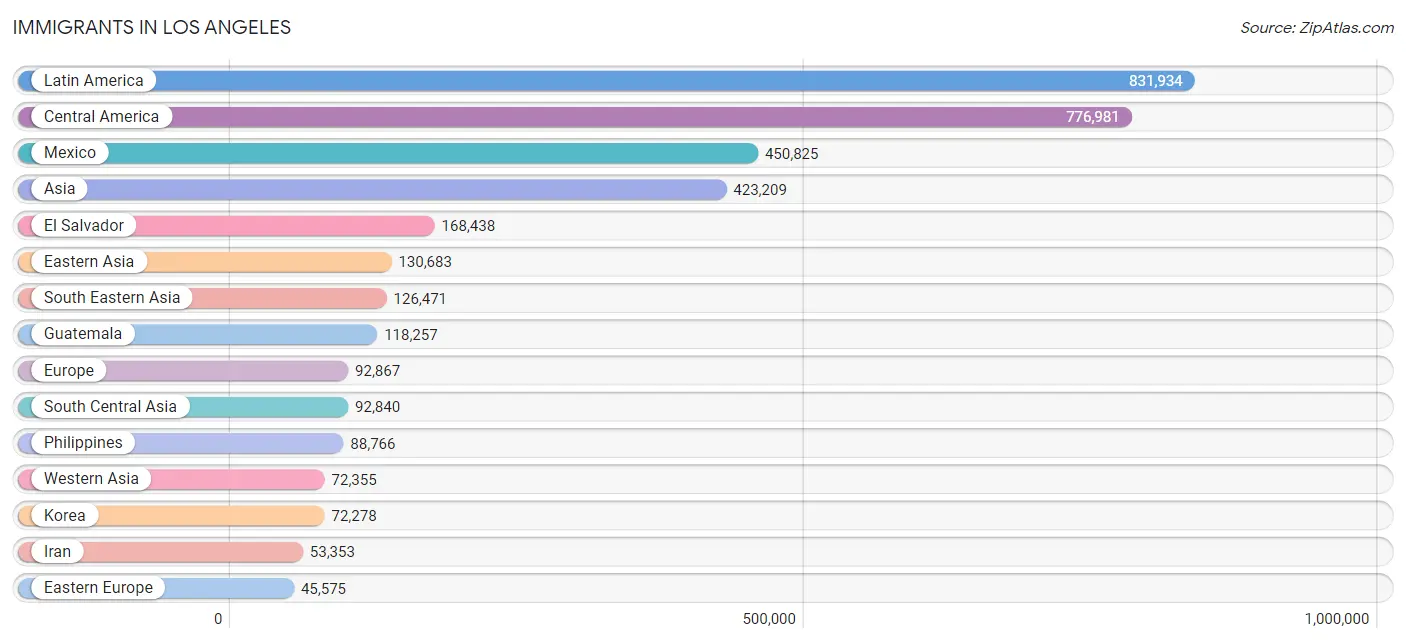
The most numerous immigrant groups reported in Los Angeles came from Latin America (831,934 | 21.4%), Central America (776,981 | 20.0%), Mexico (450,825 | 11.6%), Asia (423,209 | 10.9%), and El Salvador (168,438 | 4.3%), together accounting for 68.3% of all Los Angeles residents.
| Immigration Origin | # Population | % Population |
| Afghanistan | 2,186 | 0.1% |
| Africa | 27,752 | 0.7% |
| Albania | 69 | 0.0% |
| Argentina | 5,915 | 0.2% |
| Armenia | 38,218 | 1.0% |
| Asia | 423,209 | 10.9% |
| Australia | 4,141 | 0.1% |
| Austria | 1,153 | 0.0% |
| Azores | 13 | 0.0% |
| Bahamas | 189 | 0.0% |
| Bangladesh | 6,001 | 0.2% |
| Barbados | 87 | 0.0% |
| Belarus | 1,664 | 0.0% |
| Belgium | 694 | 0.0% |
| Belize | 7,463 | 0.2% |
| Bolivia | 1,872 | 0.1% |
| Bosnia and Herzegovina | 569 | 0.0% |
| Brazil | 6,427 | 0.2% |
| Bulgaria | 1,582 | 0.0% |
| Cambodia | 2,910 | 0.1% |
| Cameroon | 188 | 0.0% |
| Canada | 13,423 | 0.4% |
| Caribbean | 12,266 | 0.3% |
| Central America | 776,981 | 20.0% |
| Chile | 2,372 | 0.1% |
| China | 45,494 | 1.2% |
| Colombia | 7,908 | 0.2% |
| Congo | 221 | 0.0% |
| Costa Rica | 1,354 | 0.0% |
| Croatia | 1,063 | 0.0% |
| Cuba | 4,783 | 0.1% |
| Czechoslovakia | 1,113 | 0.0% |
| Denmark | 640 | 0.0% |
| Dominica | 180 | 0.0% |
| Dominican Republic | 897 | 0.0% |
| Eastern Africa | 7,915 | 0.2% |
| Eastern Asia | 130,683 | 3.4% |
| Eastern Europe | 45,575 | 1.2% |
| Ecuador | 4,496 | 0.1% |
| Egypt | 5,261 | 0.1% |
| El Salvador | 168,438 | 4.3% |
| England | 6,510 | 0.2% |
| Eritrea | 956 | 0.0% |
| Ethiopia | 4,092 | 0.1% |
| Europe | 92,867 | 2.4% |
| Fiji | 366 | 0.0% |
| France | 6,756 | 0.2% |
| Germany | 6,988 | 0.2% |
| Ghana | 1,775 | 0.1% |
| Greece | 1,397 | 0.0% |
| Grenada | 227 | 0.0% |
| Guatemala | 118,257 | 3.0% |
| Guyana | 281 | 0.0% |
| Haiti | 764 | 0.0% |
| Honduras | 19,625 | 0.5% |
| Hong Kong | 3,557 | 0.1% |
| Hungary | 1,965 | 0.1% |
| India | 22,337 | 0.6% |
| Indonesia | 3,995 | 0.1% |
| Iran | 53,353 | 1.4% |
| Iraq | 2,531 | 0.1% |
| Ireland | 1,358 | 0.0% |
| Israel | 11,800 | 0.3% |
| Italy | 4,588 | 0.1% |
| Jamaica | 3,602 | 0.1% |
| Japan | 11,661 | 0.3% |
| Jordan | 1,018 | 0.0% |
| Kazakhstan | 1,554 | 0.0% |
| Kenya | 1,127 | 0.0% |
| Korea | 72,278 | 1.9% |
| Kuwait | 831 | 0.0% |
| Laos | 514 | 0.0% |
| Latin America | 831,934 | 21.4% |
| Latvia | 629 | 0.0% |
| Lebanon | 6,180 | 0.2% |
| Liberia | 199 | 0.0% |
| Lithuania | 512 | 0.0% |
| Malaysia | 1,025 | 0.0% |
| Mexico | 450,825 | 11.6% |
| Micronesia | 45 | 0.0% |
| Middle Africa | 793 | 0.0% |
| Moldova | 1,095 | 0.0% |
| Morocco | 1,389 | 0.0% |
| Nepal | 845 | 0.0% |
| Netherlands | 1,662 | 0.0% |
| Nicaragua | 8,828 | 0.2% |
| Nigeria | 3,819 | 0.1% |
| North Macedonia | 23 | 0.0% |
| Northern Africa | 7,970 | 0.2% |
| Northern Europe | 20,594 | 0.5% |
| Norway | 342 | 0.0% |
| Oceania | 6,672 | 0.2% |
| Pakistan | 2,873 | 0.1% |
| Panama | 1,260 | 0.0% |
| Peru | 9,760 | 0.3% |
| Philippines | 88,766 | 2.3% |
| Poland | 2,974 | 0.1% |
| Portugal | 363 | 0.0% |
| Romania | 3,365 | 0.1% |
| Russia | 13,504 | 0.4% |
| Saudi Arabia | 749 | 0.0% |
| Scotland | 1,065 | 0.0% |
| Senegal | 244 | 0.0% |
| Serbia | 922 | 0.0% |
| Sierra Leone | 234 | 0.0% |
| Singapore | 799 | 0.0% |
| Somalia | 12 | 0.0% |
| South Africa | 3,232 | 0.1% |
| South America | 42,687 | 1.1% |
| South Central Asia | 92,840 | 2.4% |
| South Eastern Asia | 126,471 | 3.3% |
| Southern Europe | 8,136 | 0.2% |
| Spain | 1,743 | 0.0% |
| Sri Lanka | 1,939 | 0.1% |
| St. Vincent and the Grenadines | 74 | 0.0% |
| Sudan | 306 | 0.0% |
| Sweden | 1,971 | 0.1% |
| Switzerland | 1,093 | 0.0% |
| Syria | 4,016 | 0.1% |
| Taiwan | 7,943 | 0.2% |
| Thailand | 8,348 | 0.2% |
| Trinidad and Tobago | 740 | 0.0% |
| Turkey | 3,455 | 0.1% |
| Uganda | 800 | 0.0% |
| Ukraine | 11,818 | 0.3% |
| Uruguay | 860 | 0.0% |
| Uzbekistan | 1,228 | 0.0% |
| Venezuela | 2,277 | 0.1% |
| Vietnam | 18,876 | 0.5% |
| West Indies | 311 | 0.0% |
| Western Africa | 6,732 | 0.2% |
| Western Asia | 72,355 | 1.9% |
| Western Europe | 18,395 | 0.5% |
| Yemen | 14 | 0.0% |
| Zaire | 310 | 0.0% |
| Zimbabwe | 214 | 0.0% | View All 136 Rows |
Sex and Age in Los Angeles
Sex and Age in Los Angeles
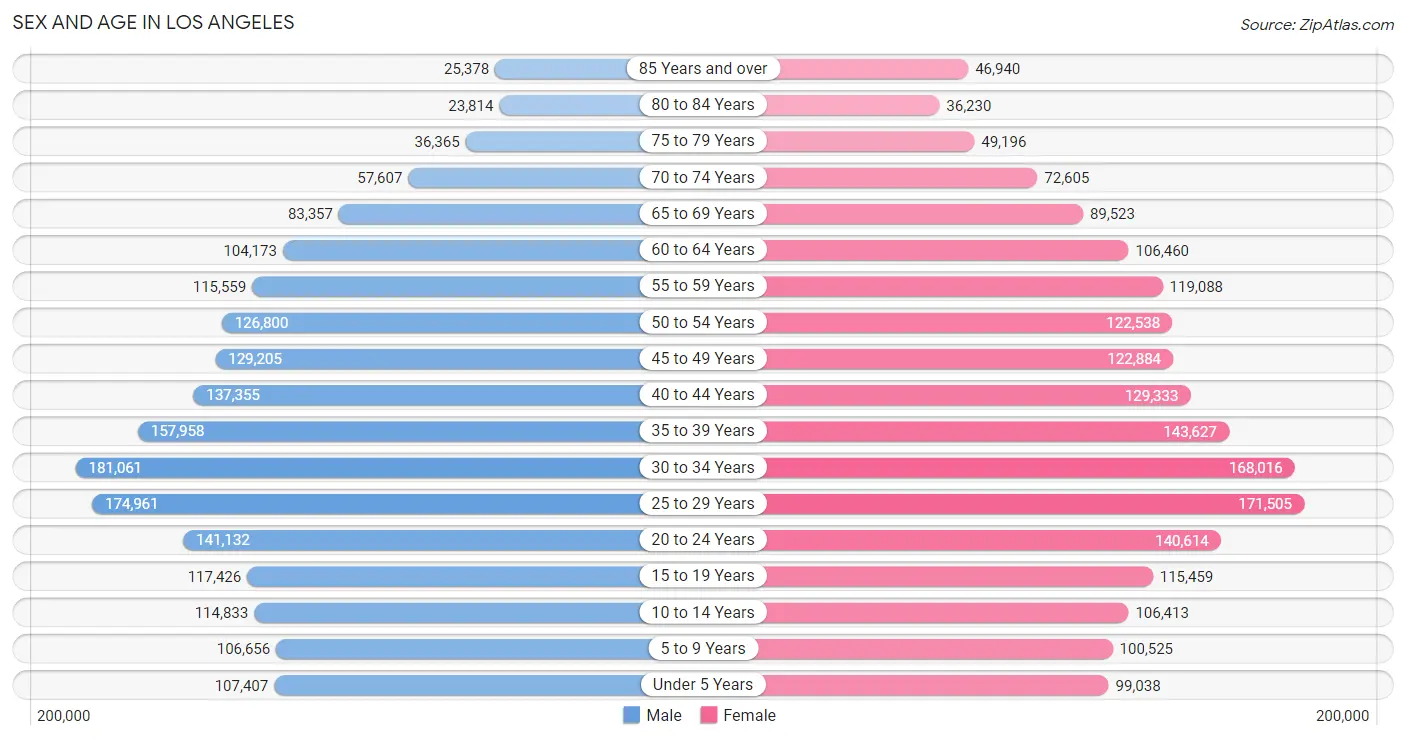
The most populous age groups in Los Angeles are 30 to 34 Years (181,061 | 9.3%) for men and 25 to 29 Years (171,505 | 8.8%) for women.
| Age Bracket | Male | Female |
| Under 5 Years | 107,407 (5.5%) | 99,038 (5.1%) |
| 5 to 9 Years | 106,656 (5.5%) | 100,525 (5.2%) |
| 10 to 14 Years | 114,833 (5.9%) | 106,413 (5.5%) |
| 15 to 19 Years | 117,426 (6.0%) | 115,459 (5.9%) |
| 20 to 24 Years | 141,132 (7.3%) | 140,614 (7.2%) |
| 25 to 29 Years | 174,961 (9.0%) | 171,505 (8.8%) |
| 30 to 34 Years | 181,061 (9.3%) | 168,016 (8.7%) |
| 35 to 39 Years | 157,958 (8.1%) | 143,627 (7.4%) |
| 40 to 44 Years | 137,355 (7.1%) | 129,333 (6.7%) |
| 45 to 49 Years | 129,205 (6.7%) | 122,884 (6.3%) |
| 50 to 54 Years | 126,800 (6.5%) | 122,538 (6.3%) |
| 55 to 59 Years | 115,559 (5.9%) | 119,088 (6.1%) |
| 60 to 64 Years | 104,173 (5.4%) | 106,460 (5.5%) |
| 65 to 69 Years | 83,357 (4.3%) | 89,523 (4.6%) |
| 70 to 74 Years | 57,607 (3.0%) | 72,605 (3.7%) |
| 75 to 79 Years | 36,365 (1.9%) | 49,196 (2.5%) |
| 80 to 84 Years | 23,814 (1.2%) | 36,230 (1.9%) |
| 85 Years and over | 25,378 (1.3%) | 46,940 (2.4%) |
| Total | 1,941,047 (100.0%) | 1,939,994 (100.0%) |
Families and Households in Los Angeles
Median Family Size in Los Angeles
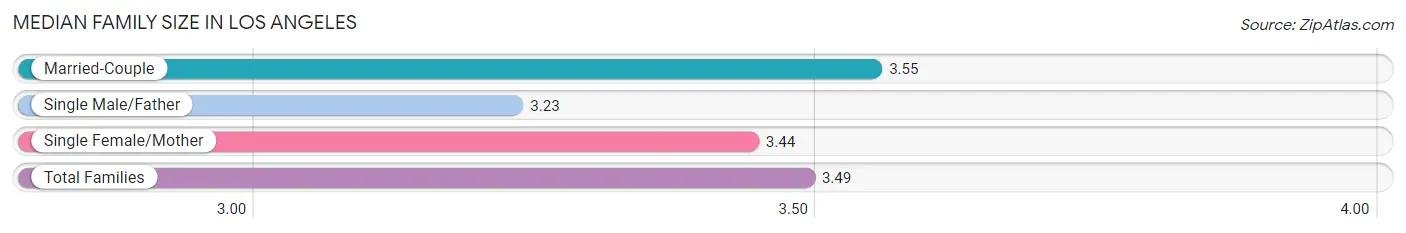
The median family size in Los Angeles is 3.49 persons per family, with married-couple families (530,750 | 64.7%) accounting for the largest median family size of 3.55 persons per family. On the other hand, single male/father families (95,851 | 11.7%) represent the smallest median family size with 3.23 persons per family.
| Family Type | # Families | Family Size |
| Married-Couple | 530,750 (64.7%) | 3.55 |
| Single Male/Father | 95,851 (11.7%) | 3.23 |
| Single Female/Mother | 193,201 (23.6%) | 3.44 |
| Total Families | 819,802 (100.0%) | 3.49 |
Median Household Size in Los Angeles
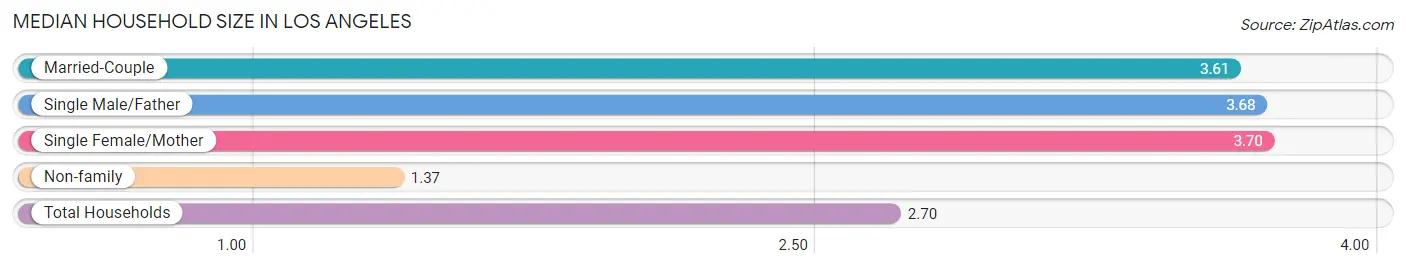
The median household size in Los Angeles is 2.70 persons per household, with single female/mother households (193,201 | 13.8%) accounting for the largest median household size of 3.7 persons per household. non-family households (579,640 | 41.4%) represent the smallest median household size with 1.37 persons per household.
| Household Type | # Households | Household Size |
| Married-Couple | 530,750 (37.9%) | 3.61 |
| Single Male/Father | 95,851 (6.9%) | 3.68 |
| Single Female/Mother | 193,201 (13.8%) | 3.70 |
| Non-family | 579,640 (41.4%) | 1.37 |
| Total Households | 1,399,442 (100.0%) | 2.70 |
Household Size by Marriage Status in Los Angeles
Out of a total of 1,399,442 households in Los Angeles, 819,802 (58.6%) are family households, while 579,640 (41.4%) are nonfamily households. The most numerous type of family households are 2-person households, comprising 285,645, and the most common type of nonfamily households are 1-person households, comprising 432,061.
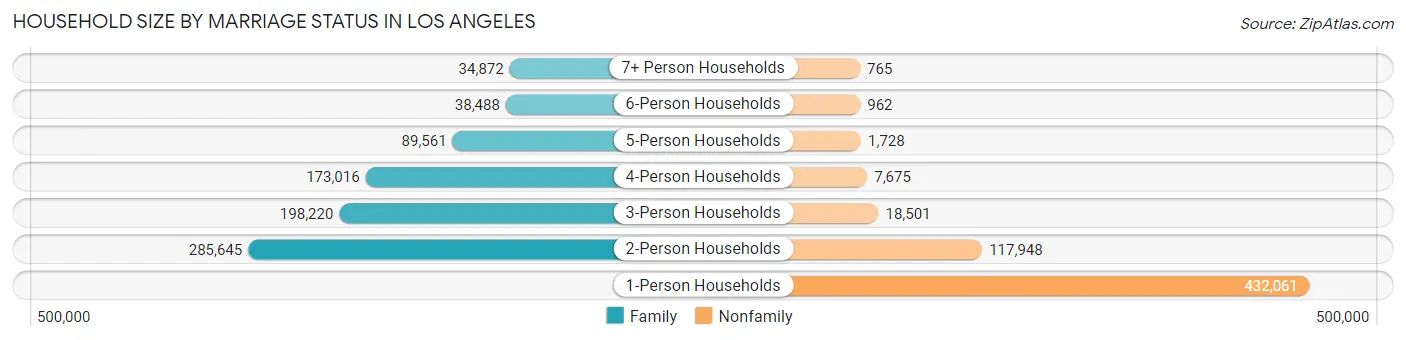
| Household Size | Family Households | Nonfamily Households |
| 1-Person Households | - | 432,061 (30.9%) |
| 2-Person Households | 285,645 (20.4%) | 117,948 (8.4%) |
| 3-Person Households | 198,220 (14.2%) | 18,501 (1.3%) |
| 4-Person Households | 173,016 (12.4%) | 7,675 (0.5%) |
| 5-Person Households | 89,561 (6.4%) | 1,728 (0.1%) |
| 6-Person Households | 38,488 (2.8%) | 962 (0.1%) |
| 7+ Person Households | 34,872 (2.5%) | 765 (0.1%) |
| Total | 819,802 (58.6%) | 579,640 (41.4%) |
Female Fertility in Los Angeles
Fertility by Age in Los Angeles
Average fertility rate in Los Angeles is 42.0 births per 1,000 women. Women in the age bracket of 20 to 34 years have the highest fertility rate with 53.0 births per 1,000 women. Women in the age bracket of 20 to 34 years acount for 59.0% of all women with births.
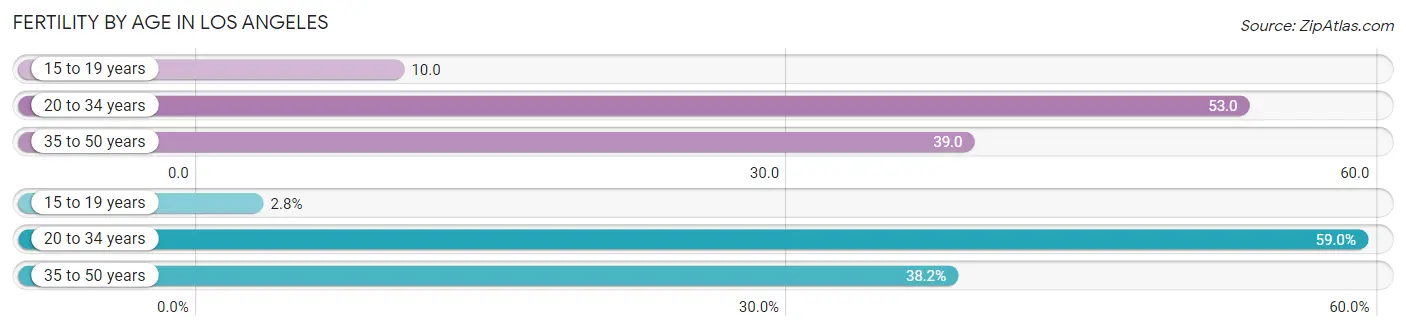
| Age Bracket | Women with Births | Births / 1,000 Women |
| 15 to 19 years | 1,210 (2.8%) | 10.0 |
| 20 to 34 years | 25,245 (59.0%) | 53.0 |
| 35 to 50 years | 16,322 (38.2%) | 39.0 |
| Total | 42,777 (100.0%) | 42.0 |
Fertility by Age by Marriage Status in Los Angeles
63.7% of women with births (42,777) in Los Angeles are married. The highest percentage of unmarried women with births falls into 15 to 19 years age bracket with 81.2% of them unmarried at the time of birth, while the lowest percentage of unmarried women with births belong to 35 to 50 years age bracket with 23.6% of them unmarried.
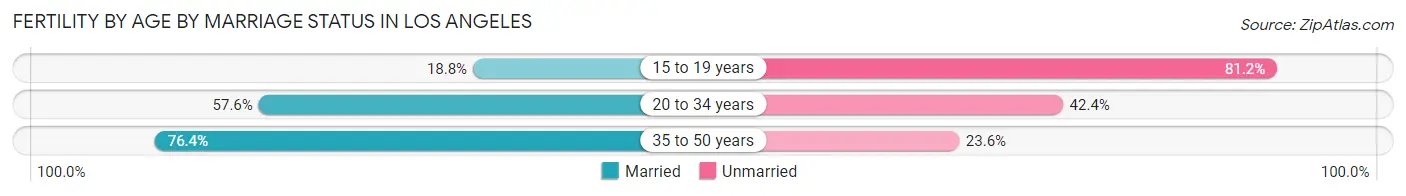
| Age Bracket | Married | Unmarried |
| 15 to 19 years | 227 (18.8%) | 983 (81.2%) |
| 20 to 34 years | 14,541 (57.6%) | 10,704 (42.4%) |
| 35 to 50 years | 12,470 (76.4%) | 3,852 (23.6%) |
| Total | 27,249 (63.7%) | 15,528 (36.3%) |
Fertility by Education in Los Angeles
Average fertility rate in Los Angeles is 42.0 births per 1,000 women. Women with the education attainment of high school diploma have the highest fertility rate of 50.0 births per 1,000 women, while women with the education attainment of less than high school have the lowest fertility at 38.0 births per 1,000 women. Women with the education attainment of college or associate's degree represent 25.5% of all women with births.
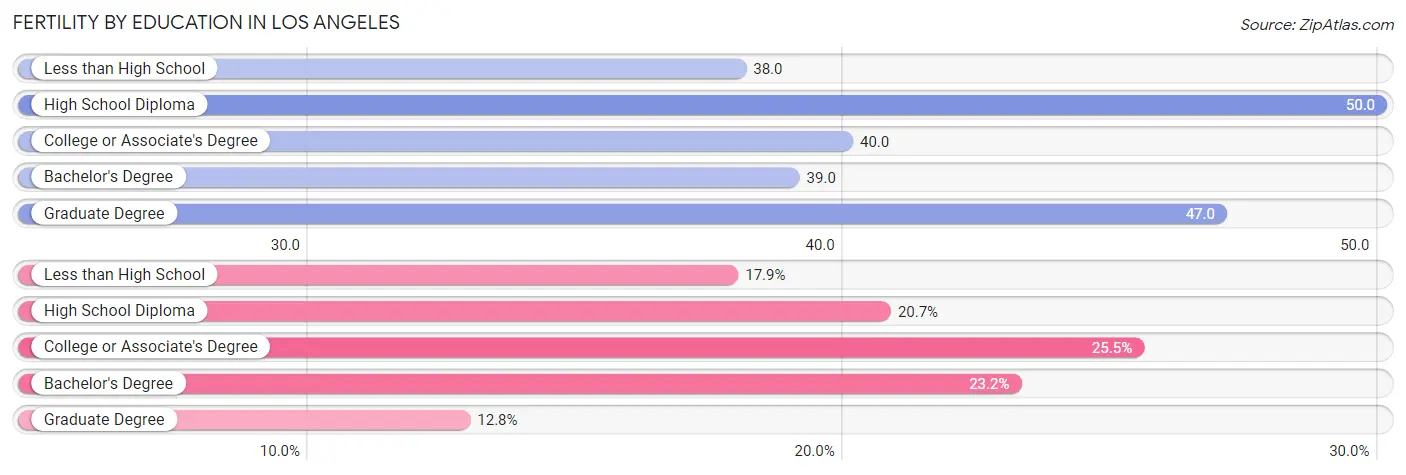
| Educational Attainment | Women with Births | Births / 1,000 Women |
| Less than High School | 7,637 (17.8%) | 38.0 |
| High School Diploma | 8,861 (20.7%) | 50.0 |
| College or Associate's Degree | 10,887 (25.5%) | 40.0 |
| Bachelor's Degree | 9,902 (23.2%) | 39.0 |
| Graduate Degree | 5,490 (12.8%) | 47.0 |
| Total | 42,777 (100.0%) | 42.0 |
Fertility by Education by Marriage Status in Los Angeles
36.3% of women with births in Los Angeles are unmarried. Women with the educational attainment of graduate degree are most likely to be married with 93.7% of them married at childbirth, while women with the educational attainment of less than high school are least likely to be married with 52.7% of them unmarried at childbirth.
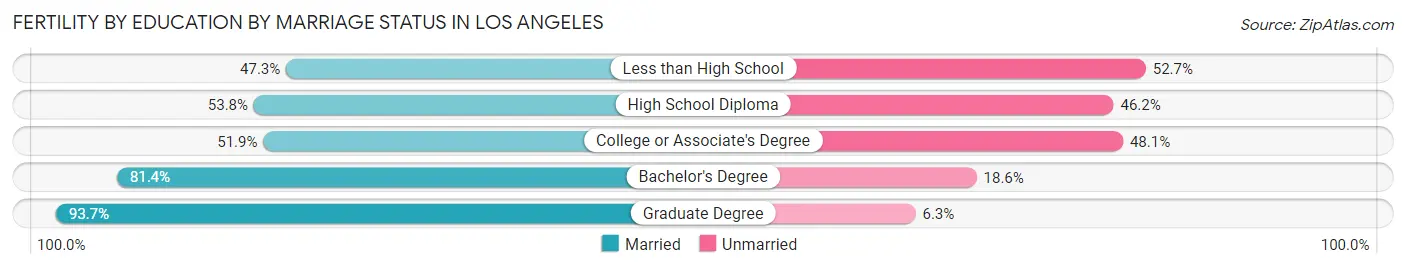
| Educational Attainment | Married | Unmarried |
| Less than High School | 3,612 (47.3%) | 4,025 (52.7%) |
| High School Diploma | 4,767 (53.8%) | 4,094 (46.2%) |
| College or Associate's Degree | 5,650 (51.9%) | 5,237 (48.1%) |
| Bachelor's Degree | 8,060 (81.4%) | 1,842 (18.6%) |
| Graduate Degree | 5,144 (93.7%) | 346 (6.3%) |
| Total | 27,249 (63.7%) | 15,528 (36.3%) |
Employment Characteristics in Los Angeles
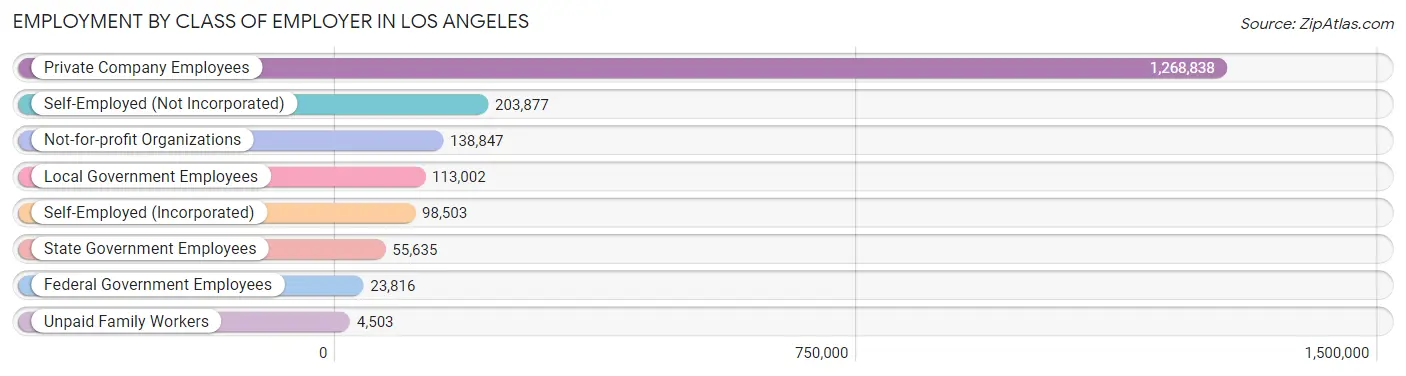
Employment by Class of Employer in Los Angeles
Among the 1,907,021 employed individuals in Los Angeles, private company employees (1,268,838 | 66.5%), self-employed (not incorporated) (203,877 | 10.7%), and not-for-profit organizations (138,847 | 7.3%) make up the most common classes of employment.
| Employer Class | # Employees | % Employees |
| Private Company Employees | 1,268,838 | 66.5% |
| Self-Employed (Incorporated) | 98,503 | 5.2% |
| Self-Employed (Not Incorporated) | 203,877 | 10.7% |
| Not-for-profit Organizations | 138,847 | 7.3% |
| Local Government Employees | 113,002 | 5.9% |
| State Government Employees | 55,635 | 2.9% |
| Federal Government Employees | 23,816 | 1.3% |
| Unpaid Family Workers | 4,503 | 0.2% |
| Total | 1,907,021 | 100.0% |
Employment Status by Age in Los Angeles
According to the labor force statistics for Los Angeles, out of the total population over 16 years of age (3,201,330), 66.5% or 2,128,884 individuals are in the labor force, with 7.7% or 163,924 of them unemployed. The age group with the highest labor force participation rate is 30 to 34 years, with 85.0% or 296,715 individuals in the labor force. Within the labor force, the 16 to 19 years age range has the highest percentage of unemployed individuals, with 22.8% or 11,319 of them being unemployed.
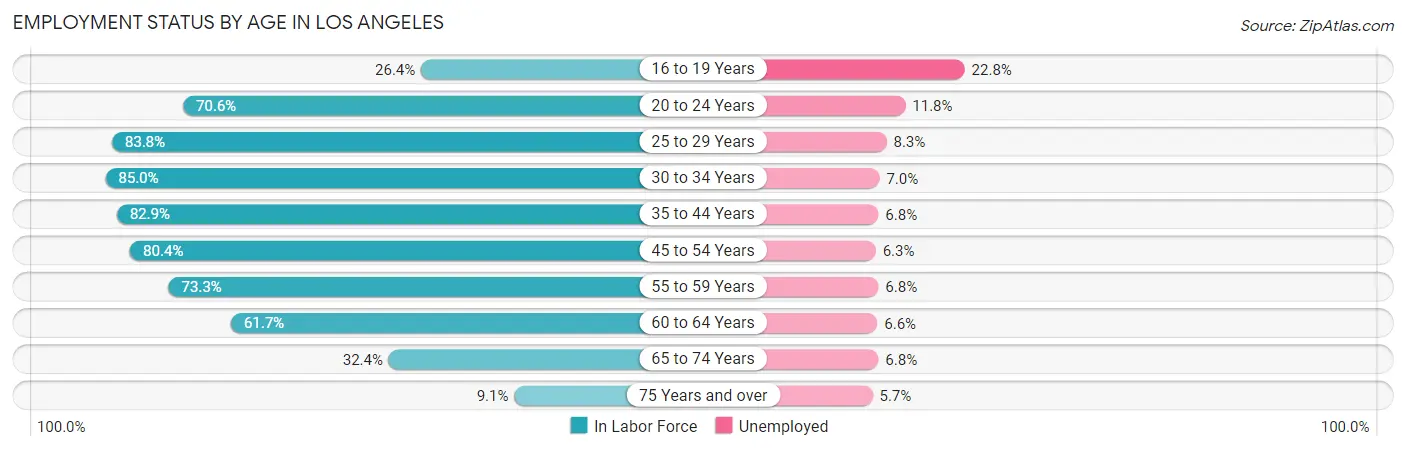
| Age Bracket | In Labor Force | Unemployed |
| 16 to 19 Years | 49,644 (26.4%) | 11,319 (22.8%) |
| 20 to 24 Years | 198,913 (70.6%) | 23,472 (11.8%) |
| 25 to 29 Years | 290,339 (83.8%) | 24,098 (8.3%) |
| 30 to 34 Years | 296,715 (85.0%) | 20,770 (7.0%) |
| 35 to 44 Years | 471,098 (82.9%) | 32,035 (6.8%) |
| 45 to 54 Years | 403,147 (80.4%) | 25,398 (6.3%) |
| 55 to 59 Years | 171,996 (73.3%) | 11,696 (6.8%) |
| 60 to 64 Years | 129,961 (61.7%) | 8,577 (6.6%) |
| 65 to 74 Years | 98,202 (32.4%) | 6,678 (6.8%) |
| 75 Years and over | 19,831 (9.1%) | 1,130 (5.7%) |
| Total | 2,128,884 (66.5%) | 163,924 (7.7%) |
Employment Status by Educational Attainment in Los Angeles
According to labor force statistics for Los Angeles, 79.8% of individuals (1,763,997) out of the total population between 25 and 64 years of age (2,210,523) are in the labor force, with 6.9% or 121,716 of them being unemployed. The group with the highest labor force participation rate are those with the educational attainment of bachelor's degree or higher, with 88.4% or 741,886 individuals in the labor force. Within the labor force, individuals with college / associate degree education have the highest percentage of unemployment, with 8.3% or 34,596 of them being unemployed.
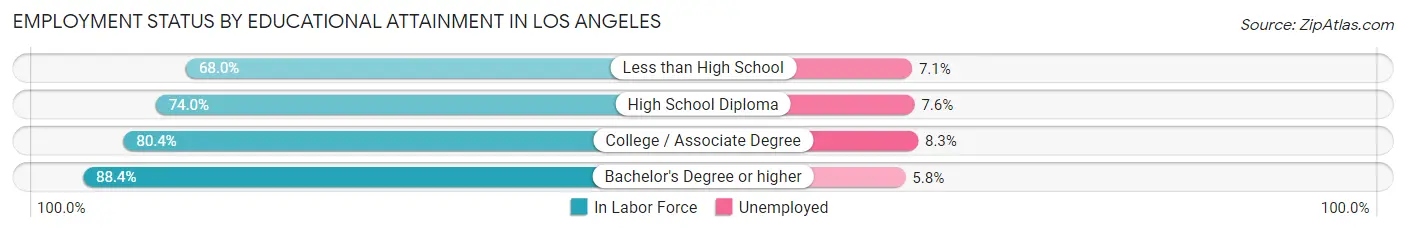
| Educational Attainment | In Labor Force | Unemployed |
| Less than High School | 299,112 (68.0%) | 31,231 (7.1%) |
| High School Diploma | 305,609 (74.0%) | 31,387 (7.6%) |
| College / Associate Degree | 416,817 (80.4%) | 43,030 (8.3%) |
| Bachelor's Degree or higher | 741,886 (88.4%) | 48,676 (5.8%) |
| Total | 1,763,997 (79.8%) | 152,526 (6.9%) |
Employment Occupations by Sex in Los Angeles
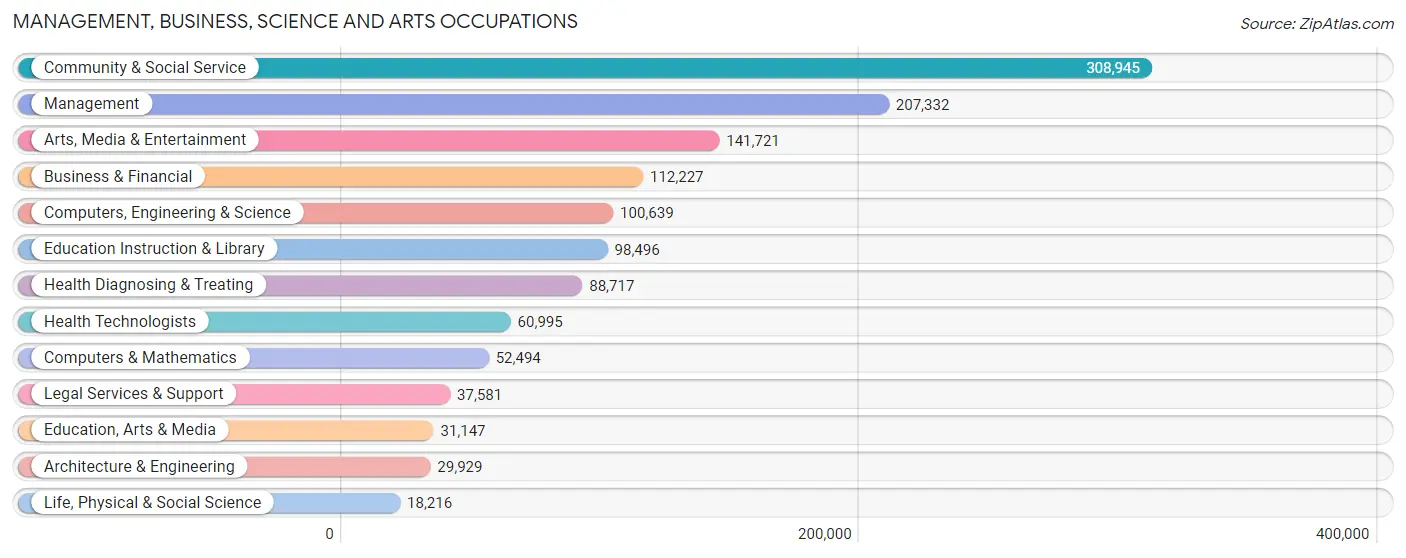
Management, Business, Science and Arts Occupations
The most common Management, Business, Science and Arts occupations in Los Angeles are Community & Social Service (308,945 | 15.7%), Management (207,332 | 10.6%), Arts, Media & Entertainment (141,721 | 7.2%), Business & Financial (112,227 | 5.7%), and Computers, Engineering & Science (100,639 | 5.1%).
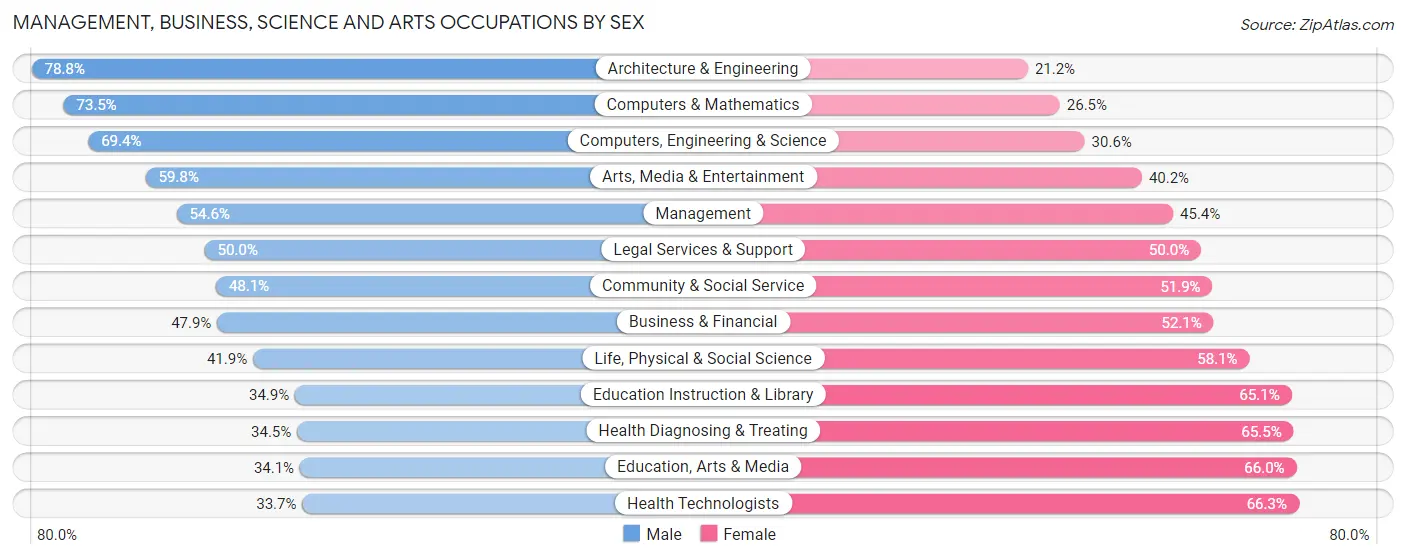
Management, Business, Science and Arts Occupations by Sex
Within the Management, Business, Science and Arts occupations in Los Angeles, the most male-oriented occupations are Architecture & Engineering (78.8%), Computers & Mathematics (73.5%), and Computers, Engineering & Science (69.4%), while the most female-oriented occupations are Health Technologists (66.3%), Education, Arts & Media (65.9%), and Health Diagnosing & Treating (65.5%).
| Occupation | Male | Female |
| Management | 113,253 (54.6%) | 94,079 (45.4%) |
| Business & Financial | 53,715 (47.9%) | 58,512 (52.1%) |
| Computers, Engineering & Science | 69,821 (69.4%) | 30,818 (30.6%) |
| Computers & Mathematics | 38,595 (73.5%) | 13,899 (26.5%) |
| Architecture & Engineering | 23,595 (78.8%) | 6,334 (21.2%) |
| Life, Physical & Social Science | 7,631 (41.9%) | 10,585 (58.1%) |
| Community & Social Service | 148,492 (48.1%) | 160,453 (51.9%) |
| Education, Arts & Media | 10,606 (34.1%) | 20,541 (65.9%) |
| Legal Services & Support | 18,776 (50.0%) | 18,805 (50.0%) |
| Education Instruction & Library | 34,338 (34.9%) | 64,158 (65.1%) |
| Arts, Media & Entertainment | 84,772 (59.8%) | 56,949 (40.2%) |
| Health Diagnosing & Treating | 30,624 (34.5%) | 58,093 (65.5%) |
| Health Technologists | 20,532 (33.7%) | 40,463 (66.3%) |
| Total (Category) | 415,905 (50.8%) | 401,955 (49.1%) |
| Total (Overall) | 1,063,835 (54.2%) | 899,698 (45.8%) |
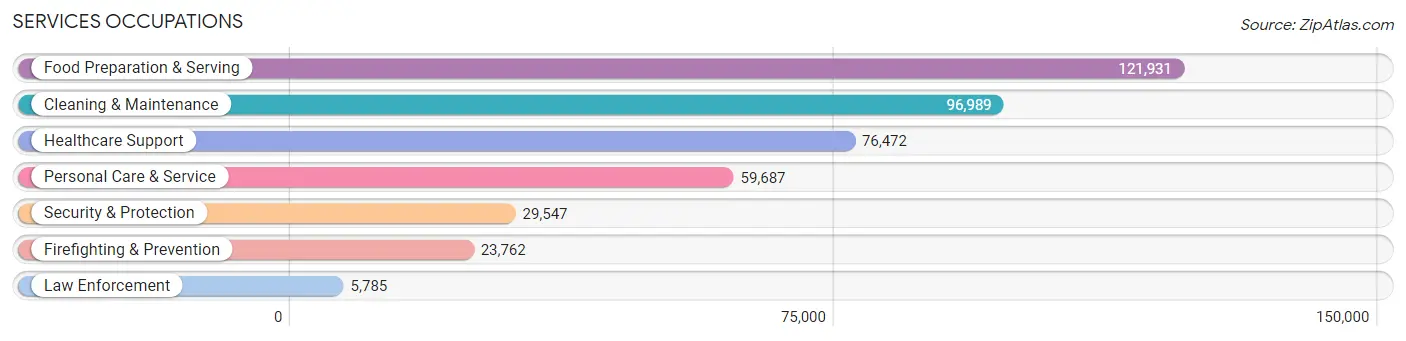
Services Occupations
The most common Services occupations in Los Angeles are Food Preparation & Serving (121,931 | 6.2%), Cleaning & Maintenance (96,989 | 4.9%), Healthcare Support (76,472 | 3.9%), Personal Care & Service (59,687 | 3.0%), and Security & Protection (29,547 | 1.5%).
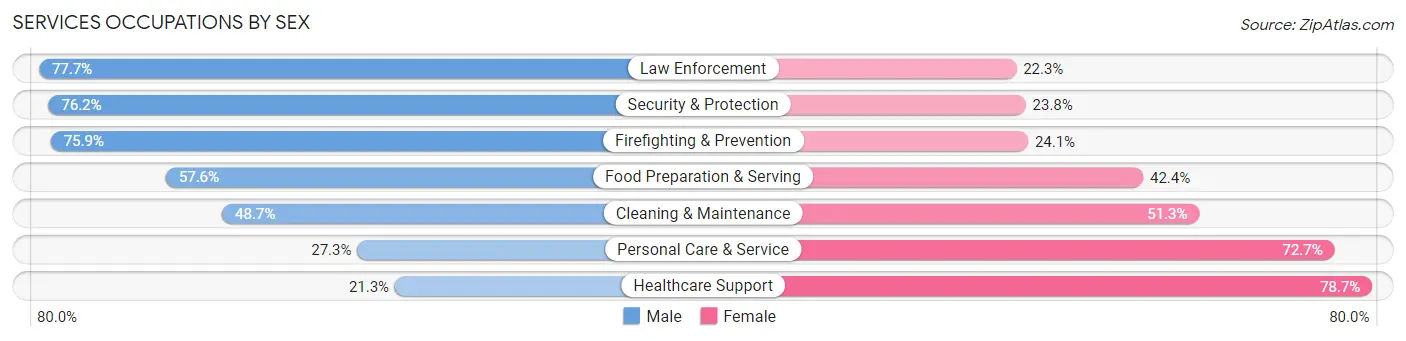
Services Occupations by Sex
Within the Services occupations in Los Angeles, the most male-oriented occupations are Law Enforcement (77.7%), Security & Protection (76.2%), and Firefighting & Prevention (75.9%), while the most female-oriented occupations are Healthcare Support (78.7%), Personal Care & Service (72.7%), and Cleaning & Maintenance (51.3%).
| Occupation | Male | Female |
| Healthcare Support | 16,310 (21.3%) | 60,162 (78.7%) |
| Security & Protection | 22,523 (76.2%) | 7,024 (23.8%) |
| Firefighting & Prevention | 18,027 (75.9%) | 5,735 (24.1%) |
| Law Enforcement | 4,496 (77.7%) | 1,289 (22.3%) |
| Food Preparation & Serving | 70,259 (57.6%) | 51,672 (42.4%) |
| Cleaning & Maintenance | 47,250 (48.7%) | 49,739 (51.3%) |
| Personal Care & Service | 16,288 (27.3%) | 43,399 (72.7%) |
| Total (Category) | 172,630 (44.9%) | 211,996 (55.1%) |
| Total (Overall) | 1,063,835 (54.2%) | 899,698 (45.8%) |
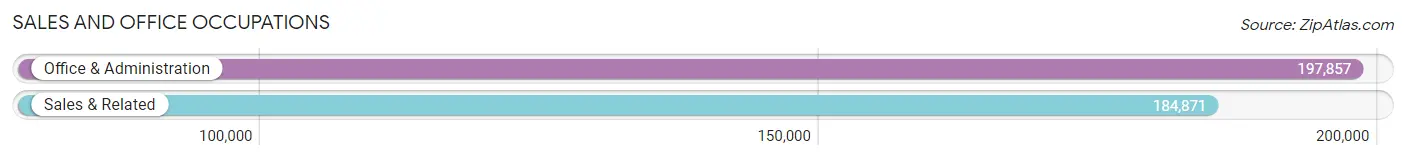
Sales and Office Occupations
The most common Sales and Office occupations in Los Angeles are Office & Administration (197,857 | 10.1%), and Sales & Related (184,871 | 9.4%).
Sales and Office Occupations by Sex
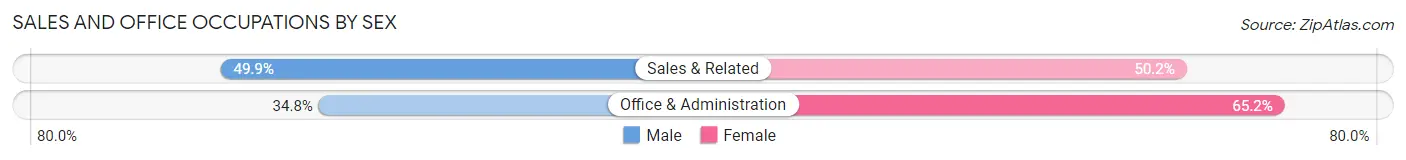
| Occupation | Male | Female |
| Sales & Related | 92,162 (49.8%) | 92,709 (50.1%) |
| Office & Administration | 68,776 (34.8%) | 129,081 (65.2%) |
| Total (Category) | 160,938 (42.0%) | 221,790 (58.0%) |
| Total (Overall) | 1,063,835 (54.2%) | 899,698 (45.8%) |
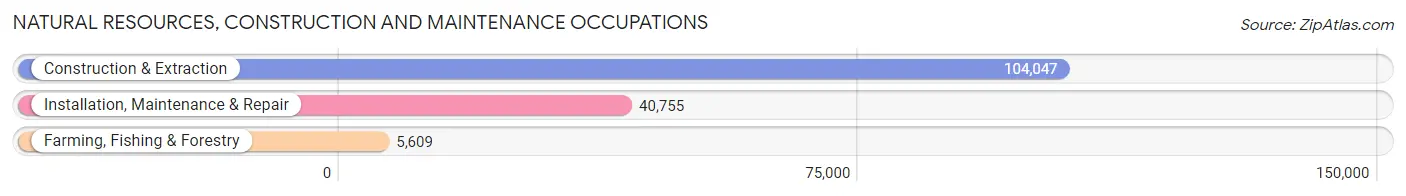
Natural Resources, Construction and Maintenance Occupations
The most common Natural Resources, Construction and Maintenance occupations in Los Angeles are Construction & Extraction (104,047 | 5.3%), Installation, Maintenance & Repair (40,755 | 2.1%), and Farming, Fishing & Forestry (5,609 | 0.3%).
Natural Resources, Construction and Maintenance Occupations by Sex
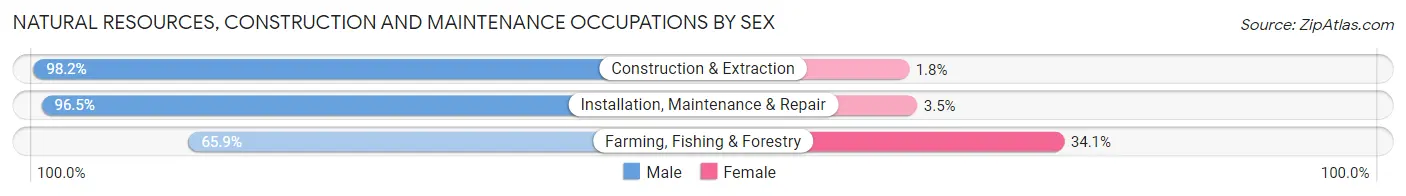
| Occupation | Male | Female |
| Farming, Fishing & Forestry | 3,696 (65.9%) | 1,913 (34.1%) |
| Construction & Extraction | 102,143 (98.2%) | 1,904 (1.8%) |
| Installation, Maintenance & Repair | 39,316 (96.5%) | 1,439 (3.5%) |
| Total (Category) | 145,155 (96.5%) | 5,256 (3.5%) |
| Total (Overall) | 1,063,835 (54.2%) | 899,698 (45.8%) |
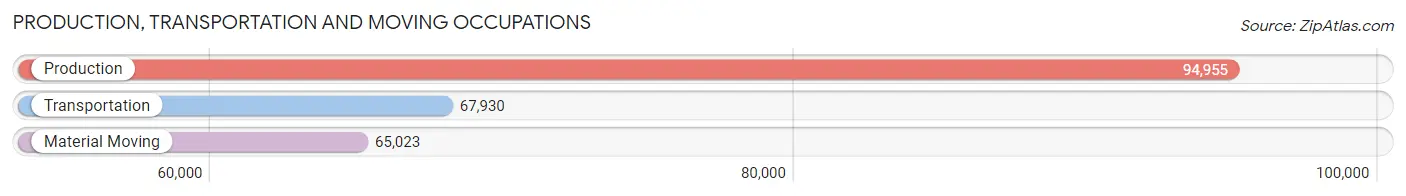
Production, Transportation and Moving Occupations
The most common Production, Transportation and Moving occupations in Los Angeles are Production (94,955 | 4.8%), Transportation (67,930 | 3.5%), and Material Moving (65,023 | 3.3%).
Production, Transportation and Moving Occupations by Sex
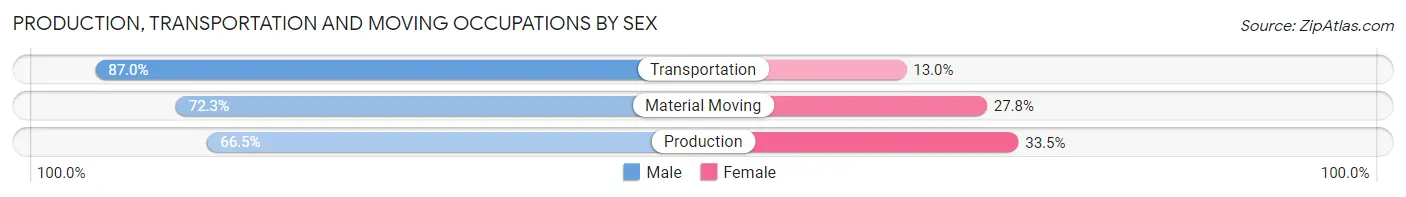
| Occupation | Male | Female |
| Production | 63,114 (66.5%) | 31,841 (33.5%) |
| Transportation | 59,115 (87.0%) | 8,815 (13.0%) |
| Material Moving | 46,978 (72.3%) | 18,045 (27.8%) |
| Total (Category) | 169,207 (74.2%) | 58,701 (25.8%) |
| Total (Overall) | 1,063,835 (54.2%) | 899,698 (45.8%) |
Employment Industries by Sex in Los Angeles
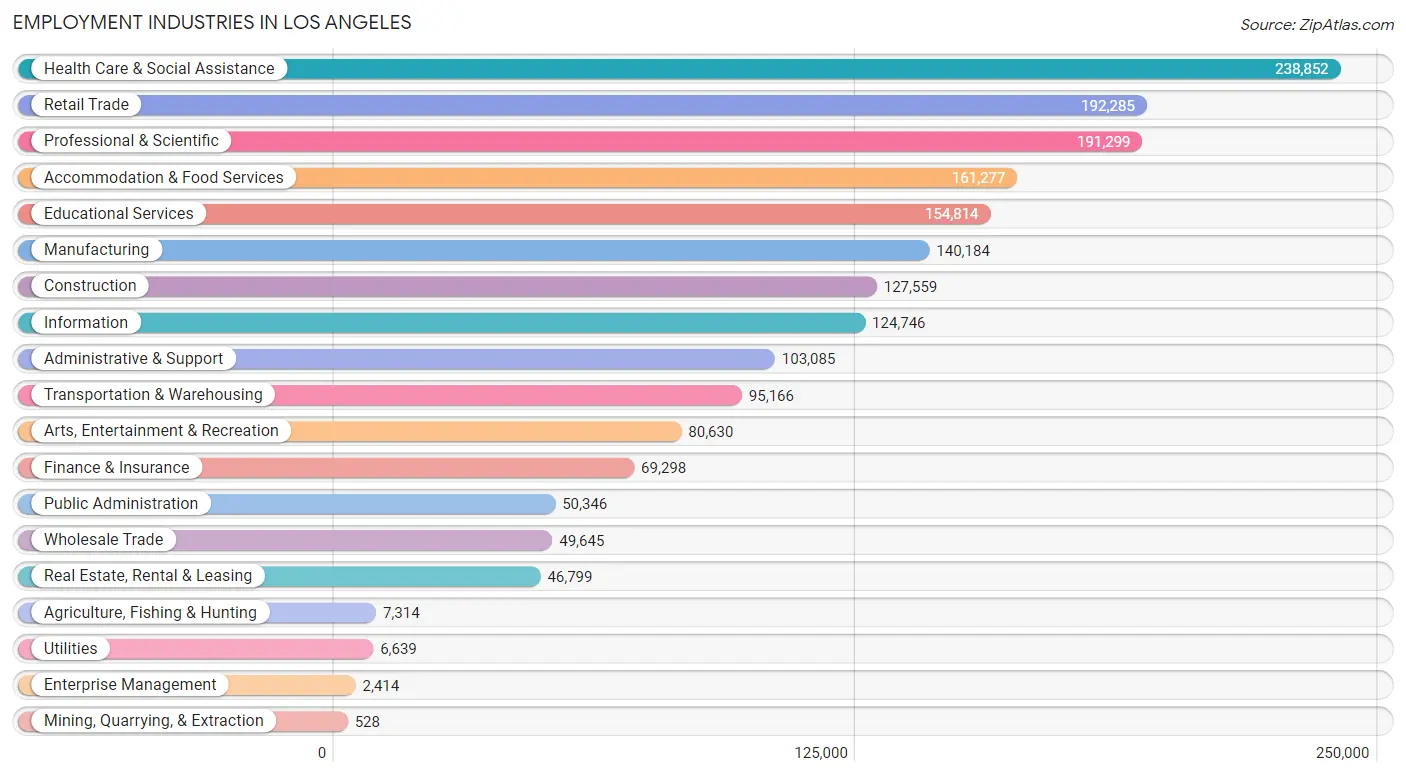
Employment Industries in Los Angeles
The major employment industries in Los Angeles include Health Care & Social Assistance (238,852 | 12.2%), Retail Trade (192,285 | 9.8%), Professional & Scientific (191,299 | 9.7%), Accommodation & Food Services (161,277 | 8.2%), and Educational Services (154,814 | 7.9%).
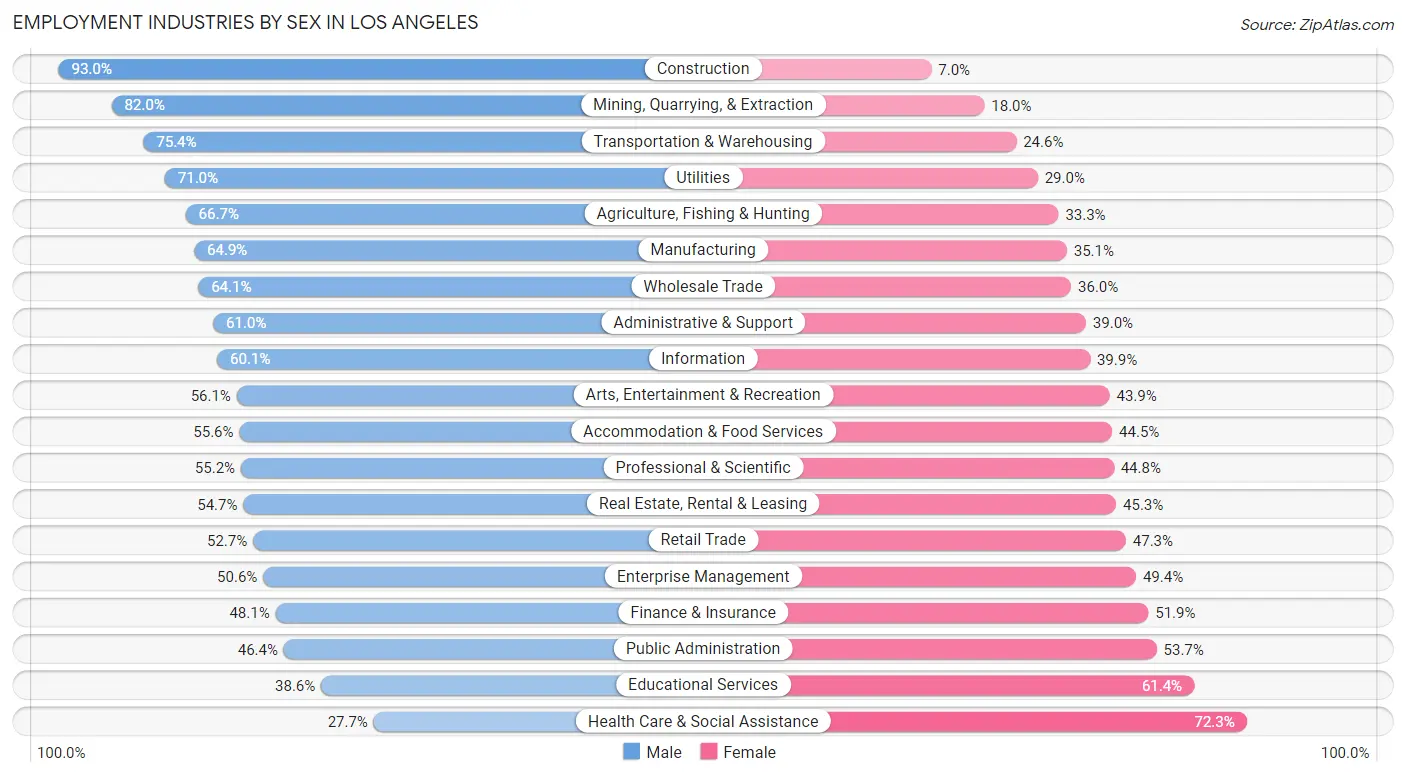
Employment Industries by Sex in Los Angeles
The Los Angeles industries that see more men than women are Construction (93.0%), Mining, Quarrying, & Extraction (82.0%), and Transportation & Warehousing (75.4%), whereas the industries that tend to have a higher number of women are Health Care & Social Assistance (72.3%), Educational Services (61.4%), and Public Administration (53.6%).
| Industry | Male | Female |
| Agriculture, Fishing & Hunting | 4,876 (66.7%) | 2,438 (33.3%) |
| Mining, Quarrying, & Extraction | 433 (82.0%) | 95 (18.0%) |
| Construction | 118,596 (93.0%) | 8,963 (7.0%) |
| Manufacturing | 91,032 (64.9%) | 49,152 (35.1%) |
| Wholesale Trade | 31,799 (64.0%) | 17,846 (35.9%) |
| Retail Trade | 101,380 (52.7%) | 90,905 (47.3%) |
| Transportation & Warehousing | 71,760 (75.4%) | 23,406 (24.6%) |
| Utilities | 4,711 (71.0%) | 1,928 (29.0%) |
| Information | 75,018 (60.1%) | 49,728 (39.9%) |
| Finance & Insurance | 33,311 (48.1%) | 35,987 (51.9%) |
| Real Estate, Rental & Leasing | 25,611 (54.7%) | 21,188 (45.3%) |
| Professional & Scientific | 105,649 (55.2%) | 85,650 (44.8%) |
| Enterprise Management | 1,222 (50.6%) | 1,192 (49.4%) |
| Administrative & Support | 62,872 (61.0%) | 40,213 (39.0%) |
| Educational Services | 59,802 (38.6%) | 95,012 (61.4%) |
| Health Care & Social Assistance | 66,269 (27.7%) | 172,583 (72.3%) |
| Arts, Entertainment & Recreation | 45,237 (56.1%) | 35,393 (43.9%) |
| Accommodation & Food Services | 89,582 (55.5%) | 71,695 (44.5%) |
| Public Administration | 23,334 (46.4%) | 27,012 (53.6%) |
| Total | 1,063,835 (54.2%) | 899,698 (45.8%) |
Education in Los Angeles
School Enrollment in Los Angeles
The most common levels of schooling among the 934,487 students in Los Angeles are college / undergraduate (254,673 | 27.3%), high school (185,505 | 19.9%), and middle school (167,799 | 18.0%).
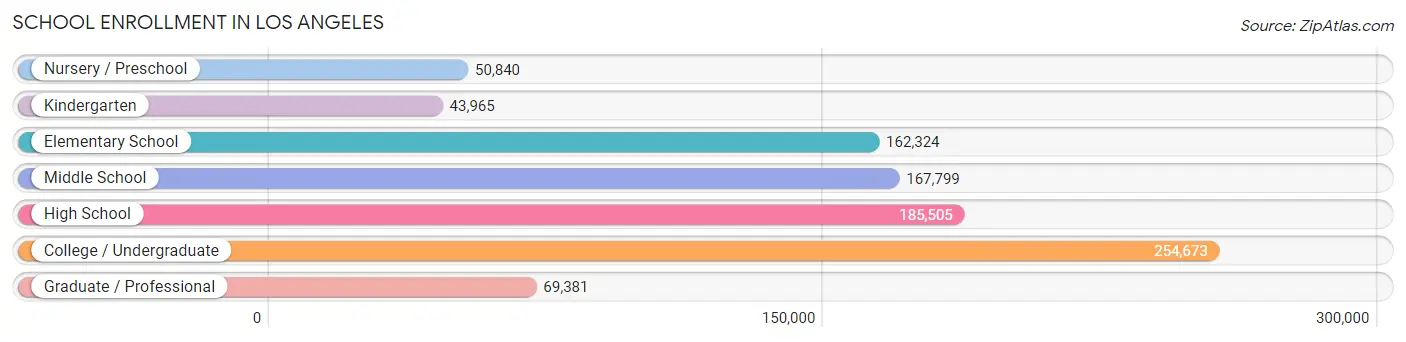
| School Level | # Students | % Students |
| Nursery / Preschool | 50,840 | 5.4% |
| Kindergarten | 43,965 | 4.7% |
| Elementary School | 162,324 | 17.4% |
| Middle School | 167,799 | 18.0% |
| High School | 185,505 | 19.9% |
| College / Undergraduate | 254,673 | 27.3% |
| Graduate / Professional | 69,381 | 7.4% |
| Total | 934,487 | 100.0% |
School Enrollment by Age by Funding Source in Los Angeles
Out of a total of 934,487 students who are enrolled in schools in Los Angeles, 177,553 (19.0%) attend a private institution, while the remaining 756,934 (81.0%) are enrolled in public schools. The age group of 3 to 4 year olds has the highest likelihood of being enrolled in private schools, with 19,576 (45.9% in the age bracket) enrolled. Conversely, the age group of 15 to 17 year olds has the lowest likelihood of being enrolled in a private school, with 111,413 (88.2% in the age bracket) attending a public institution.
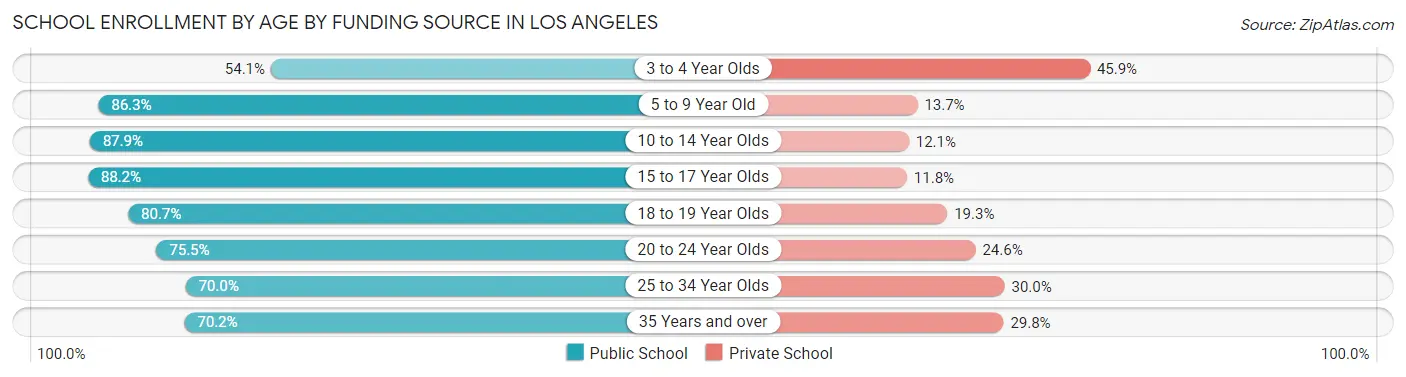
| Age Bracket | Public School | Private School |
| 3 to 4 Year Olds | 23,099 (54.1%) | 19,576 (45.9%) |
| 5 to 9 Year Old | 169,483 (86.3%) | 26,988 (13.7%) |
| 10 to 14 Year Olds | 189,568 (87.9%) | 26,177 (12.1%) |
| 15 to 17 Year Olds | 111,413 (88.2%) | 14,873 (11.8%) |
| 18 to 19 Year Olds | 65,814 (80.7%) | 15,725 (19.3%) |
| 20 to 24 Year Olds | 97,141 (75.4%) | 31,607 (24.5%) |
| 25 to 34 Year Olds | 61,497 (70.0%) | 26,314 (30.0%) |
| 35 Years and over | 38,781 (70.2%) | 16,431 (29.8%) |
| Total | 756,934 (81.0%) | 177,553 (19.0%) |
Educational Attainment by Field of Study in Los Angeles
Business (175,801 | 16.2%), visual & performing arts (135,868 | 12.5%), social sciences (129,911 | 11.9%), communications (90,055 | 8.3%), and science & technology (77,905 | 7.2%) are the most common fields of study among 1,087,728 individuals in Los Angeles who have obtained a bachelor's degree or higher.
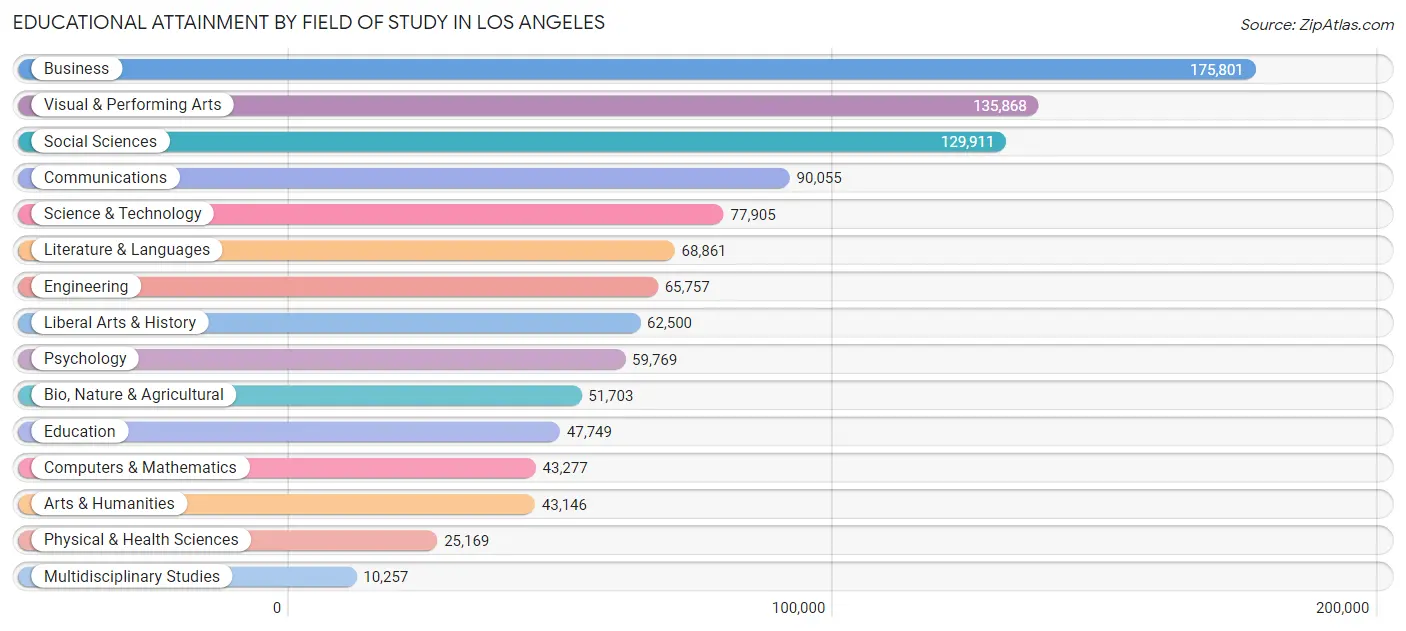
| Field of Study | # Graduates | % Graduates |
| Computers & Mathematics | 43,277 | 4.0% |
| Bio, Nature & Agricultural | 51,703 | 4.8% |
| Physical & Health Sciences | 25,169 | 2.3% |
| Psychology | 59,769 | 5.5% |
| Social Sciences | 129,911 | 11.9% |
| Engineering | 65,757 | 6.0% |
| Multidisciplinary Studies | 10,257 | 0.9% |
| Science & Technology | 77,905 | 7.2% |
| Business | 175,801 | 16.2% |
| Education | 47,749 | 4.4% |
| Literature & Languages | 68,861 | 6.3% |
| Liberal Arts & History | 62,500 | 5.8% |
| Visual & Performing Arts | 135,868 | 12.5% |
| Communications | 90,055 | 8.3% |
| Arts & Humanities | 43,146 | 4.0% |
| Total | 1,087,728 | 100.0% |
Transportation & Commute in Los Angeles
Vehicle Availability by Sex in Los Angeles
The most prevalent vehicle ownership categories in Los Angeles are males with 2 vehicles (385,166, accounting for 37.4%) and females with 2 vehicles (317,434, making up 44.9%).
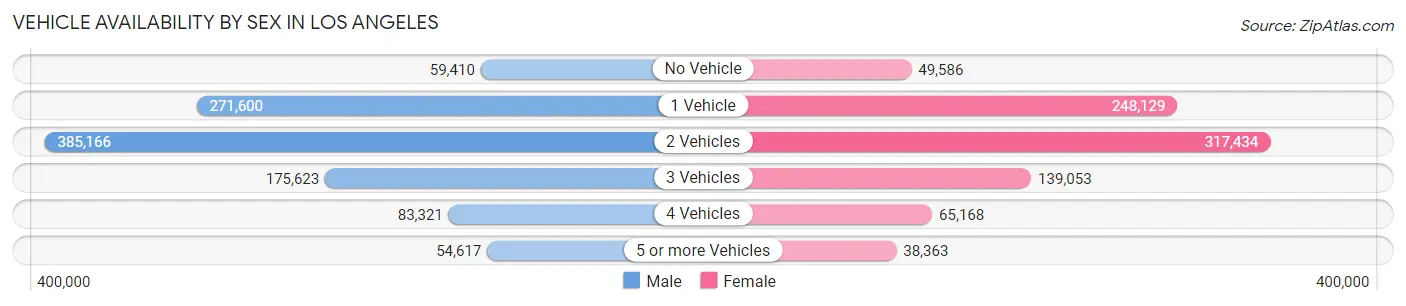
| Vehicles Available | Male | Female |
| No Vehicle | 59,410 (5.8%) | 49,586 (5.8%) |
| 1 Vehicle | 271,600 (26.4%) | 248,129 (28.9%) |
| 2 Vehicles | 385,166 (37.4%) | 317,434 (37.0%) |
| 3 Vehicles | 175,623 (17.1%) | 139,053 (16.2%) |
| 4 Vehicles | 83,321 (8.1%) | 65,168 (7.6%) |
| 5 or more Vehicles | 54,617 (5.3%) | 38,363 (4.5%) |
| Total | 1,029,737 (100.0%) | 857,733 (100.0%) |
Commute Time in Los Angeles
The most frequently occuring commute durations in Los Angeles are 30 to 34 minutes (319,470 commuters, 19.7%), 20 to 24 minutes (221,294 commuters, 13.7%), and 15 to 19 minutes (209,711 commuters, 13.0%).
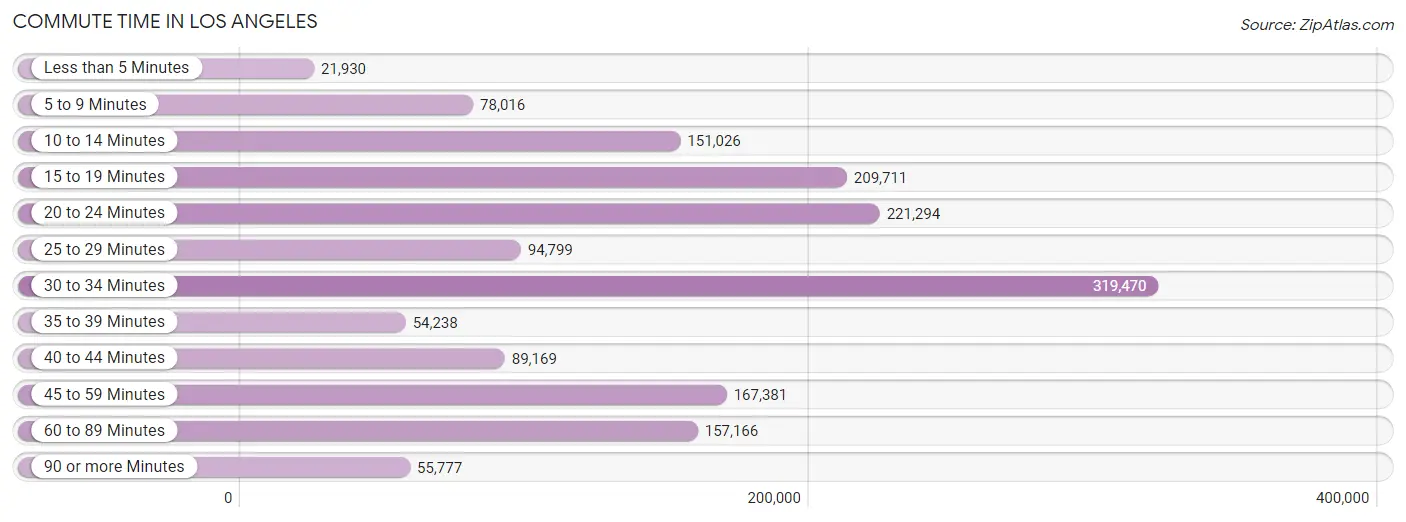
| Commute Time | # Commuters | % Commuters |
| Less than 5 Minutes | 21,930 | 1.3% |
| 5 to 9 Minutes | 78,016 | 4.8% |
| 10 to 14 Minutes | 151,026 | 9.3% |
| 15 to 19 Minutes | 209,711 | 13.0% |
| 20 to 24 Minutes | 221,294 | 13.7% |
| 25 to 29 Minutes | 94,799 | 5.9% |
| 30 to 34 Minutes | 319,470 | 19.7% |
| 35 to 39 Minutes | 54,238 | 3.4% |
| 40 to 44 Minutes | 89,169 | 5.5% |
| 45 to 59 Minutes | 167,381 | 10.3% |
| 60 to 89 Minutes | 157,166 | 9.7% |
| 90 or more Minutes | 55,777 | 3.4% |
Commute Time by Sex in Los Angeles
The most common commute times in Los Angeles are 30 to 34 minutes (186,134 commuters, 20.8%) for males and 30 to 34 minutes (133,336 commuters, 18.4%) for females.
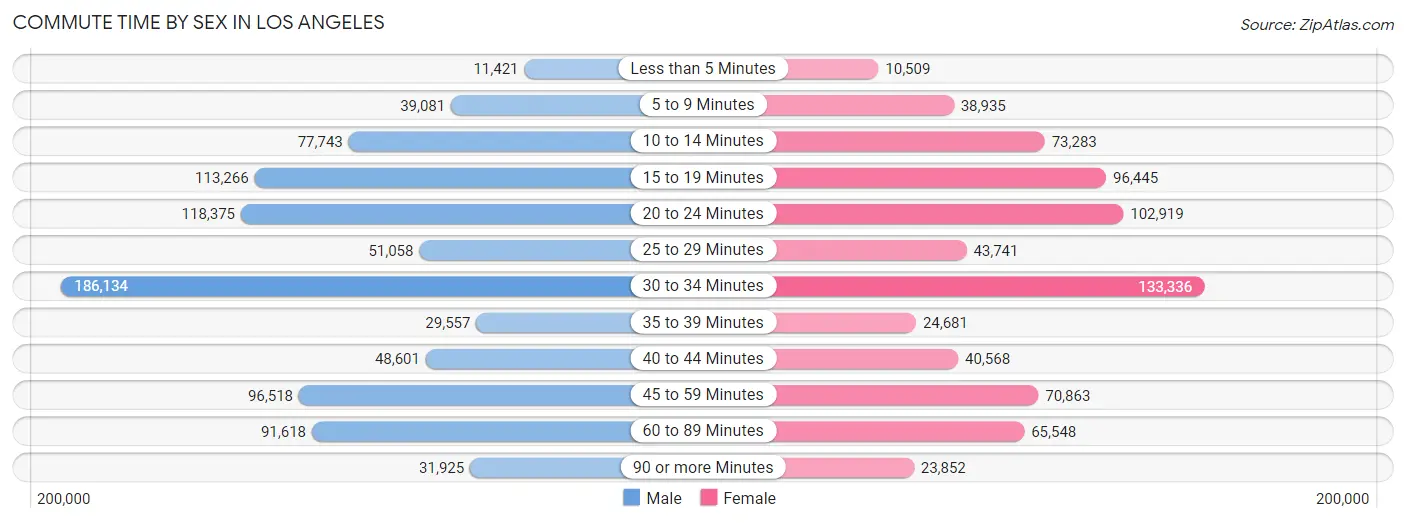
| Commute Time | Male | Female |
| Less than 5 Minutes | 11,421 (1.3%) | 10,509 (1.5%) |
| 5 to 9 Minutes | 39,081 (4.4%) | 38,935 (5.4%) |
| 10 to 14 Minutes | 77,743 (8.7%) | 73,283 (10.1%) |
| 15 to 19 Minutes | 113,266 (12.7%) | 96,445 (13.3%) |
| 20 to 24 Minutes | 118,375 (13.2%) | 102,919 (14.2%) |
| 25 to 29 Minutes | 51,058 (5.7%) | 43,741 (6.0%) |
| 30 to 34 Minutes | 186,134 (20.8%) | 133,336 (18.4%) |
| 35 to 39 Minutes | 29,557 (3.3%) | 24,681 (3.4%) |
| 40 to 44 Minutes | 48,601 (5.4%) | 40,568 (5.6%) |
| 45 to 59 Minutes | 96,518 (10.8%) | 70,863 (9.8%) |
| 60 to 89 Minutes | 91,618 (10.2%) | 65,548 (9.0%) |
| 90 or more Minutes | 31,925 (3.6%) | 23,852 (3.3%) |
Time of Departure to Work by Sex in Los Angeles
The most frequent times of departure to work in Los Angeles are 7:00 AM to 7:29 AM (119,474, 13.3%) for males and 7:00 AM to 7:29 AM (104,407, 14.4%) for females.
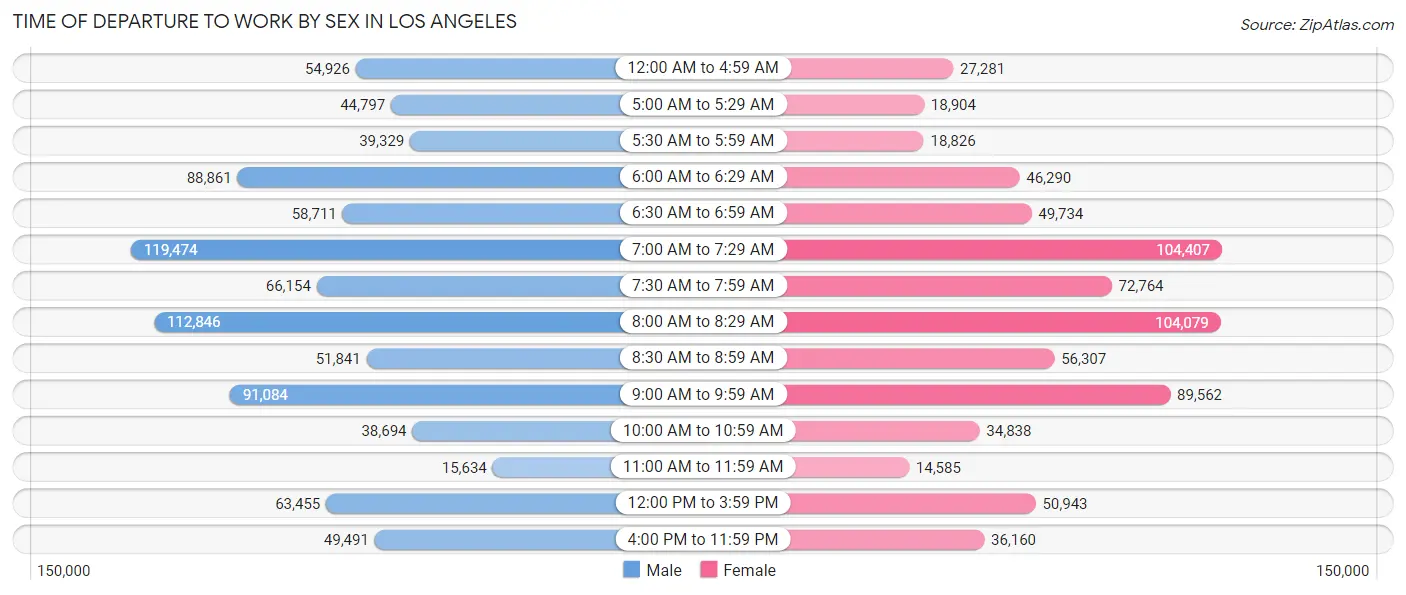
| Time of Departure | Male | Female |
| 12:00 AM to 4:59 AM | 54,926 (6.1%) | 27,281 (3.8%) |
| 5:00 AM to 5:29 AM | 44,797 (5.0%) | 18,904 (2.6%) |
| 5:30 AM to 5:59 AM | 39,329 (4.4%) | 18,826 (2.6%) |
| 6:00 AM to 6:29 AM | 88,861 (9.9%) | 46,290 (6.4%) |
| 6:30 AM to 6:59 AM | 58,711 (6.6%) | 49,734 (6.9%) |
| 7:00 AM to 7:29 AM | 119,474 (13.3%) | 104,407 (14.4%) |
| 7:30 AM to 7:59 AM | 66,154 (7.4%) | 72,764 (10.0%) |
| 8:00 AM to 8:29 AM | 112,846 (12.6%) | 104,079 (14.4%) |
| 8:30 AM to 8:59 AM | 51,841 (5.8%) | 56,307 (7.8%) |
| 9:00 AM to 9:59 AM | 91,084 (10.2%) | 89,562 (12.4%) |
| 10:00 AM to 10:59 AM | 38,694 (4.3%) | 34,838 (4.8%) |
| 11:00 AM to 11:59 AM | 15,634 (1.8%) | 14,585 (2.0%) |
| 12:00 PM to 3:59 PM | 63,455 (7.1%) | 50,943 (7.0%) |
| 4:00 PM to 11:59 PM | 49,491 (5.5%) | 36,160 (5.0%) |
| Total | 895,297 (100.0%) | 724,680 (100.0%) |
Housing Occupancy in Los Angeles
Occupancy by Ownership in Los Angeles
Of the total 1,399,442 dwellings in Los Angeles, owner-occupied units account for 512,444 (36.6%), while renter-occupied units make up 886,998 (63.4%).
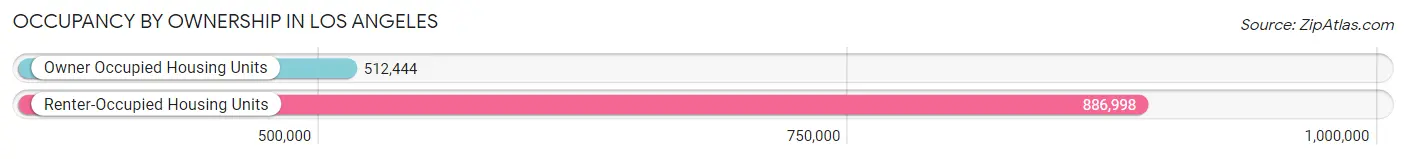
| Occupancy | # Housing Units | % Housing Units |
| Owner Occupied Housing Units | 512,444 | 36.6% |
| Renter-Occupied Housing Units | 886,998 | 63.4% |
| Total Occupied Housing Units | 1,399,442 | 100.0% |
Occupancy by Household Size in Los Angeles
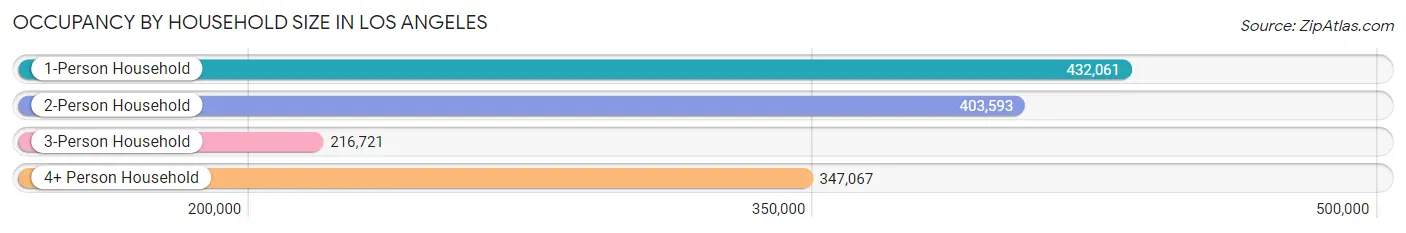
| Household Size | # Housing Units | % Housing Units |
| 1-Person Household | 432,061 | 30.9% |
| 2-Person Household | 403,593 | 28.8% |
| 3-Person Household | 216,721 | 15.5% |
| 4+ Person Household | 347,067 | 24.8% |
| Total Housing Units | 1,399,442 | 100.0% |
Occupancy by Ownership by Household Size in Los Angeles
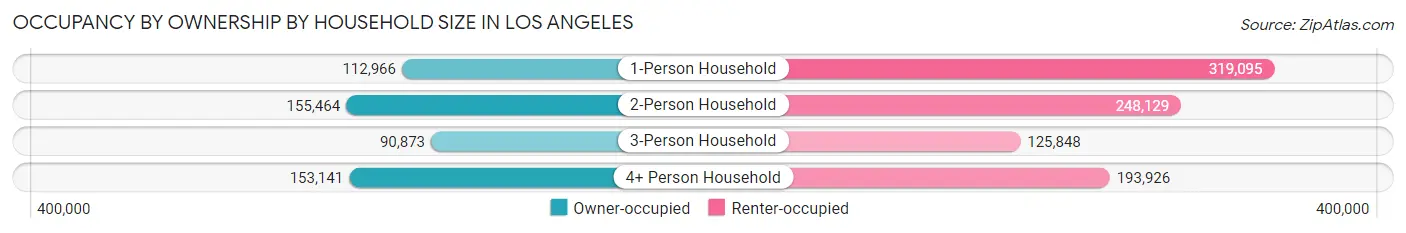
| Household Size | Owner-occupied | Renter-occupied |
| 1-Person Household | 112,966 (26.2%) | 319,095 (73.9%) |
| 2-Person Household | 155,464 (38.5%) | 248,129 (61.5%) |
| 3-Person Household | 90,873 (41.9%) | 125,848 (58.1%) |
| 4+ Person Household | 153,141 (44.1%) | 193,926 (55.9%) |
| Total Housing Units | 512,444 (36.6%) | 886,998 (63.4%) |
Occupancy by Educational Attainment in Los Angeles
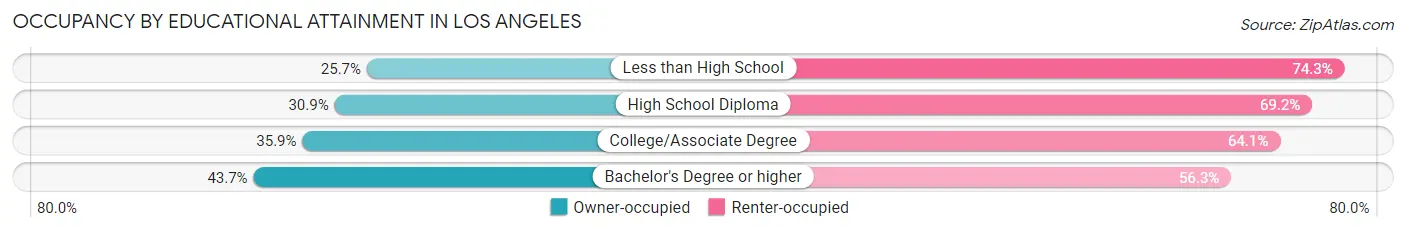
| Household Size | Owner-occupied | Renter-occupied |
| Less than High School | 63,487 (25.7%) | 183,496 (74.3%) |
| High School Diploma | 67,568 (30.8%) | 151,469 (69.2%) |
| College/Associate Degree | 122,679 (35.9%) | 218,694 (64.1%) |
| Bachelor's Degree or higher | 258,710 (43.7%) | 333,339 (56.3%) |
Occupancy by Age of Householder in Los Angeles
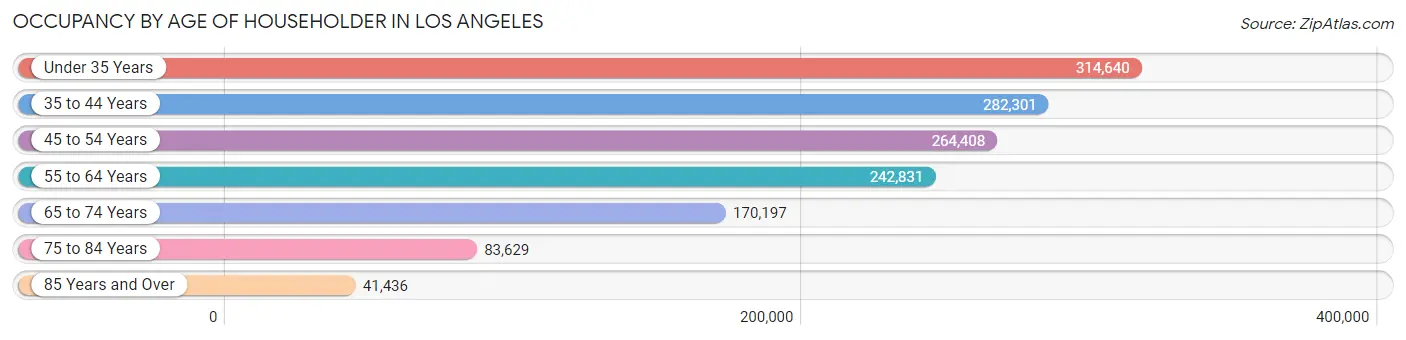
| Age Bracket | # Households | % Households |
| Under 35 Years | 314,640 | 22.5% |
| 35 to 44 Years | 282,301 | 20.2% |
| 45 to 54 Years | 264,408 | 18.9% |
| 55 to 64 Years | 242,831 | 17.3% |
| 65 to 74 Years | 170,197 | 12.2% |
| 75 to 84 Years | 83,629 | 6.0% |
| 85 Years and Over | 41,436 | 3.0% |
| Total | 1,399,442 | 100.0% |
Housing Finances in Los Angeles
Median Income by Occupancy in Los Angeles
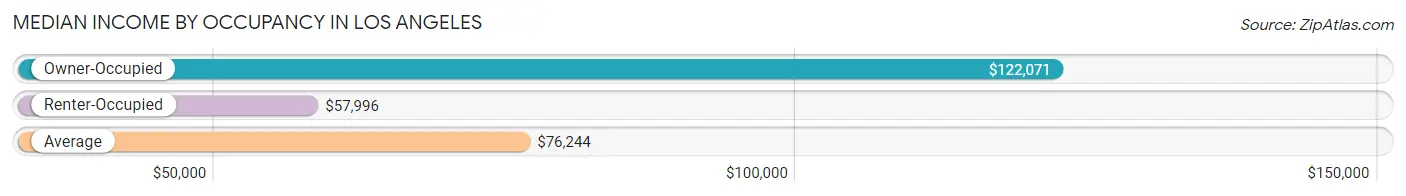
| Occupancy Type | # Households | Median Income |
| Owner-Occupied | 512,444 (36.6%) | $122,071 |
| Renter-Occupied | 886,998 (63.4%) | $57,996 |
| Average | 1,399,442 (100.0%) | $76,244 |
Occupancy by Householder Income Bracket in Los Angeles
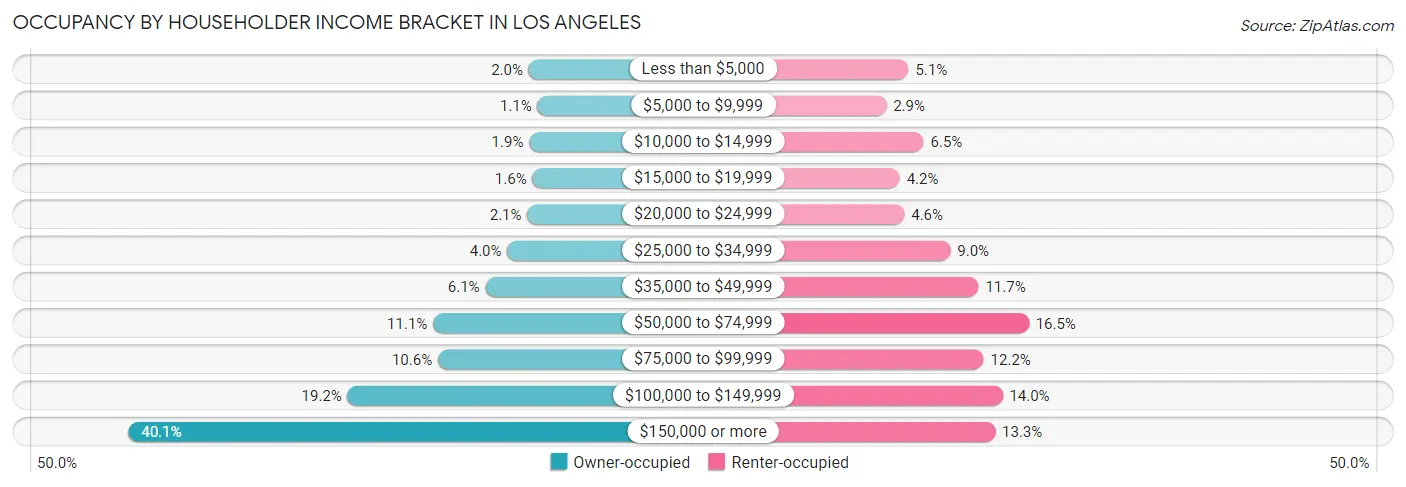
| Income Bracket | Owner-occupied | Renter-occupied |
| Less than $5,000 | 10,150 (2.0%) | 44,759 (5.1%) |
| $5,000 to $9,999 | 5,837 (1.1%) | 25,931 (2.9%) |
| $10,000 to $14,999 | 9,944 (1.9%) | 57,444 (6.5%) |
| $15,000 to $19,999 | 8,329 (1.6%) | 37,343 (4.2%) |
| $20,000 to $24,999 | 10,885 (2.1%) | 41,122 (4.6%) |
| $25,000 to $34,999 | 20,621 (4.0%) | 80,100 (9.0%) |
| $35,000 to $49,999 | 31,290 (6.1%) | 103,882 (11.7%) |
| $50,000 to $74,999 | 56,820 (11.1%) | 146,269 (16.5%) |
| $75,000 to $99,999 | 54,468 (10.6%) | 108,186 (12.2%) |
| $100,000 to $149,999 | 98,521 (19.2%) | 124,103 (14.0%) |
| $150,000 or more | 205,579 (40.1%) | 117,859 (13.3%) |
| Total | 512,444 (100.0%) | 886,998 (100.0%) |
Monthly Housing Cost Tiers in Los Angeles
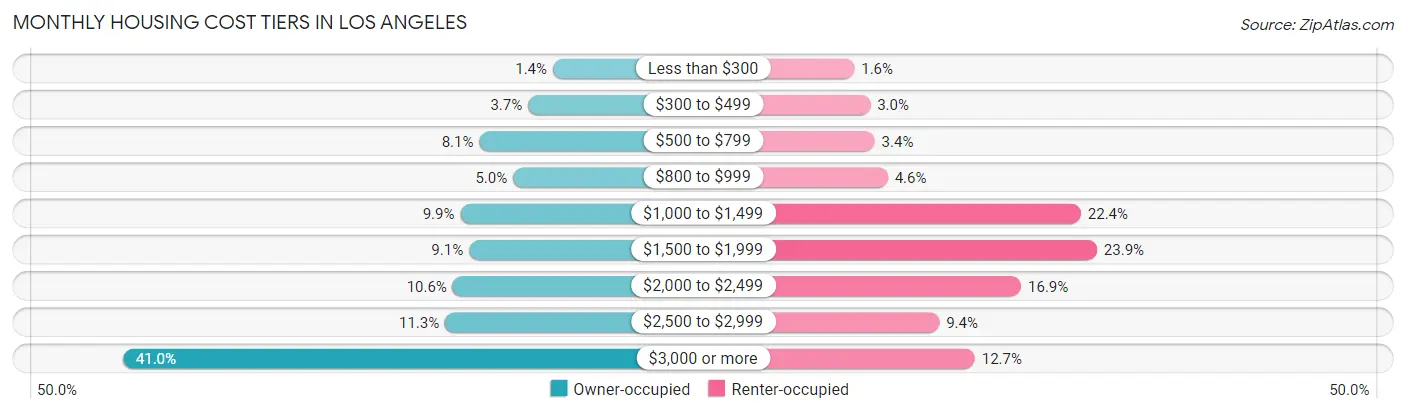
| Monthly Cost | Owner-occupied | Renter-occupied |
| Less than $300 | 7,044 (1.4%) | 13,707 (1.5%) |
| $300 to $499 | 18,727 (3.6%) | 26,748 (3.0%) |
| $500 to $799 | 41,688 (8.1%) | 30,421 (3.4%) |
| $800 to $999 | 25,764 (5.0%) | 41,024 (4.6%) |
| $1,000 to $1,499 | 50,661 (9.9%) | 198,779 (22.4%) |
| $1,500 to $1,999 | 46,595 (9.1%) | 211,876 (23.9%) |
| $2,000 to $2,499 | 54,251 (10.6%) | 149,960 (16.9%) |
| $2,500 to $2,999 | 57,864 (11.3%) | 83,106 (9.4%) |
| $3,000 or more | 209,850 (40.9%) | 112,196 (12.7%) |
| Total | 512,444 (100.0%) | 886,998 (100.0%) |
Physical Housing Characteristics in Los Angeles
Housing Structures in Los Angeles
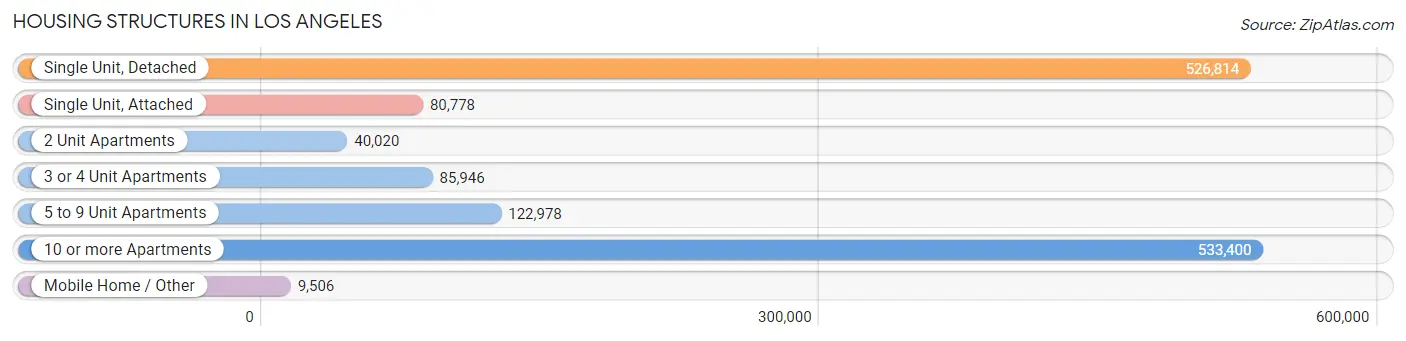
| Structure Type | # Housing Units | % Housing Units |
| Single Unit, Detached | 526,814 | 37.6% |
| Single Unit, Attached | 80,778 | 5.8% |
| 2 Unit Apartments | 40,020 | 2.9% |
| 3 or 4 Unit Apartments | 85,946 | 6.1% |
| 5 to 9 Unit Apartments | 122,978 | 8.8% |
| 10 or more Apartments | 533,400 | 38.1% |
| Mobile Home / Other | 9,506 | 0.7% |
| Total | 1,399,442 | 100.0% |
Housing Structures by Occupancy in Los Angeles
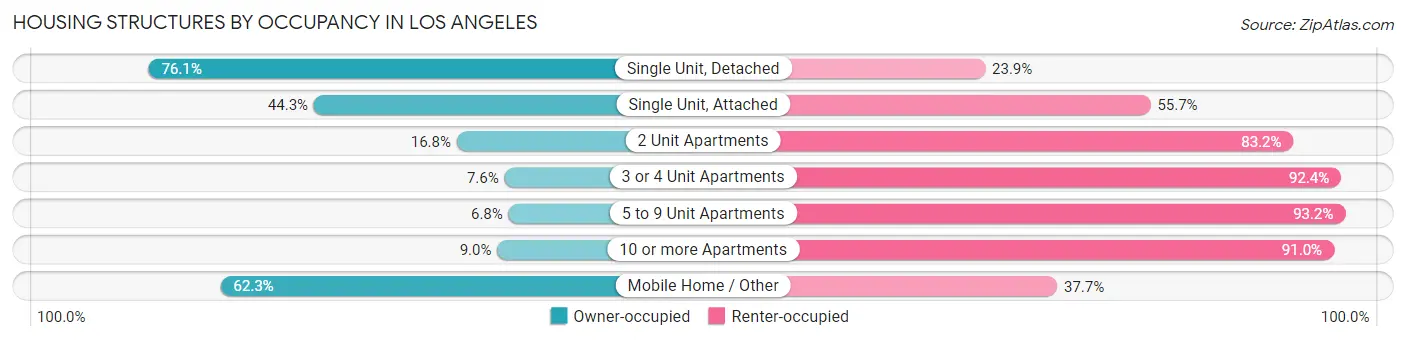
| Structure Type | Owner-occupied | Renter-occupied |
| Single Unit, Detached | 401,142 (76.1%) | 125,672 (23.9%) |
| Single Unit, Attached | 35,784 (44.3%) | 44,994 (55.7%) |
| 2 Unit Apartments | 6,719 (16.8%) | 33,301 (83.2%) |
| 3 or 4 Unit Apartments | 6,534 (7.6%) | 79,412 (92.4%) |
| 5 to 9 Unit Apartments | 8,371 (6.8%) | 114,607 (93.2%) |
| 10 or more Apartments | 47,973 (9.0%) | 485,427 (91.0%) |
| Mobile Home / Other | 5,921 (62.3%) | 3,585 (37.7%) |
| Total | 512,444 (36.6%) | 886,998 (63.4%) |
Housing Structures by Number of Rooms in Los Angeles
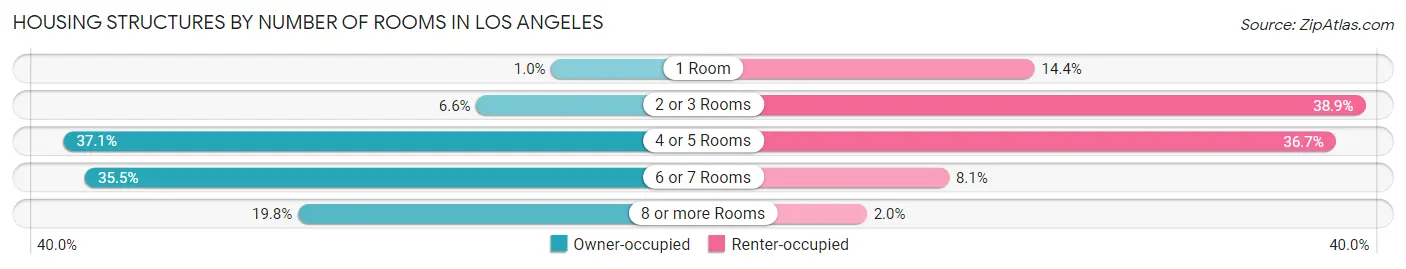
| Number of Rooms | Owner-occupied | Renter-occupied |
| 1 Room | 5,243 (1.0%) | 127,825 (14.4%) |
| 2 or 3 Rooms | 33,682 (6.6%) | 344,765 (38.9%) |
| 4 or 5 Rooms | 190,206 (37.1%) | 325,266 (36.7%) |
| 6 or 7 Rooms | 182,020 (35.5%) | 71,571 (8.1%) |
| 8 or more Rooms | 101,293 (19.8%) | 17,571 (2.0%) |
| Total | 512,444 (100.0%) | 886,998 (100.0%) |
Housing Structure by Heating Type in Los Angeles
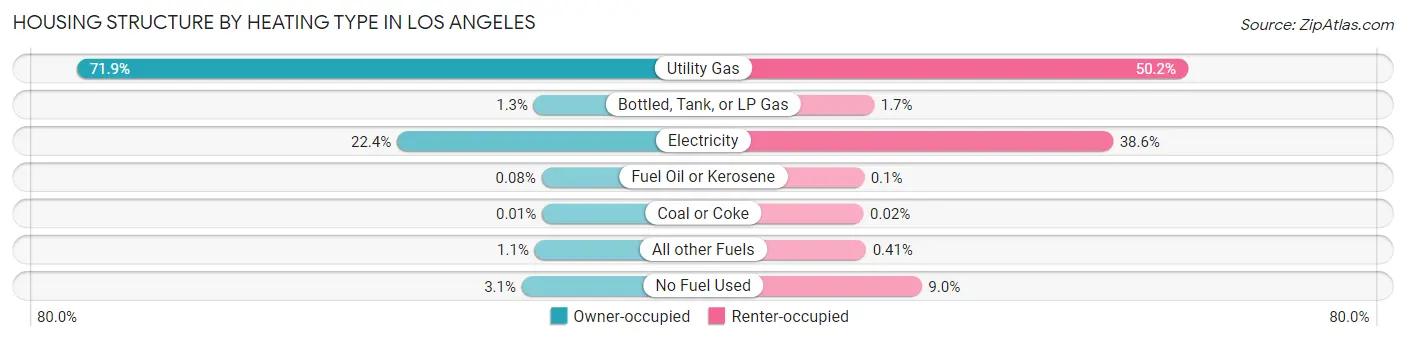
| Heating Type | Owner-occupied | Renter-occupied |
| Utility Gas | 368,638 (71.9%) | 445,280 (50.2%) |
| Bottled, Tank, or LP Gas | 6,533 (1.3%) | 14,759 (1.7%) |
| Electricity | 114,869 (22.4%) | 342,265 (38.6%) |
| Fuel Oil or Kerosene | 406 (0.1%) | 866 (0.1%) |
| Coal or Coke | 37 (0.0%) | 152 (0.0%) |
| All other Fuels | 5,853 (1.1%) | 3,626 (0.4%) |
| No Fuel Used | 16,108 (3.1%) | 80,050 (9.0%) |
| Total | 512,444 (100.0%) | 886,998 (100.0%) |
Household Vehicle Usage in Los Angeles
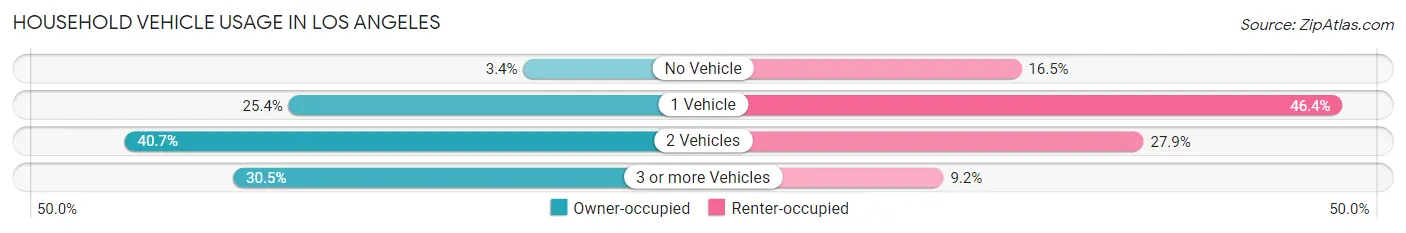
| Vehicles per Household | Owner-occupied | Renter-occupied |
| No Vehicle | 17,621 (3.4%) | 146,167 (16.5%) |
| 1 Vehicle | 129,924 (25.4%) | 411,892 (46.4%) |
| 2 Vehicles | 208,414 (40.7%) | 247,329 (27.9%) |
| 3 or more Vehicles | 156,485 (30.5%) | 81,610 (9.2%) |
| Total | 512,444 (100.0%) | 886,998 (100.0%) |
Real Estate & Mortgages in Los Angeles
Real Estate and Mortgage Overview in Los Angeles
| Characteristic | Without Mortgage | With Mortgage |
| Housing Units | 150,123 | 362,321 |
| Median Property Value | $793,300 | $833,300 |
| Median Household Income | $86,881 | $164,462 |
| Monthly Housing Costs | $891 | $203,460 |
| Real Estate Taxes | $3,742 | $6,038 |
Property Value by Mortgage Status in Los Angeles
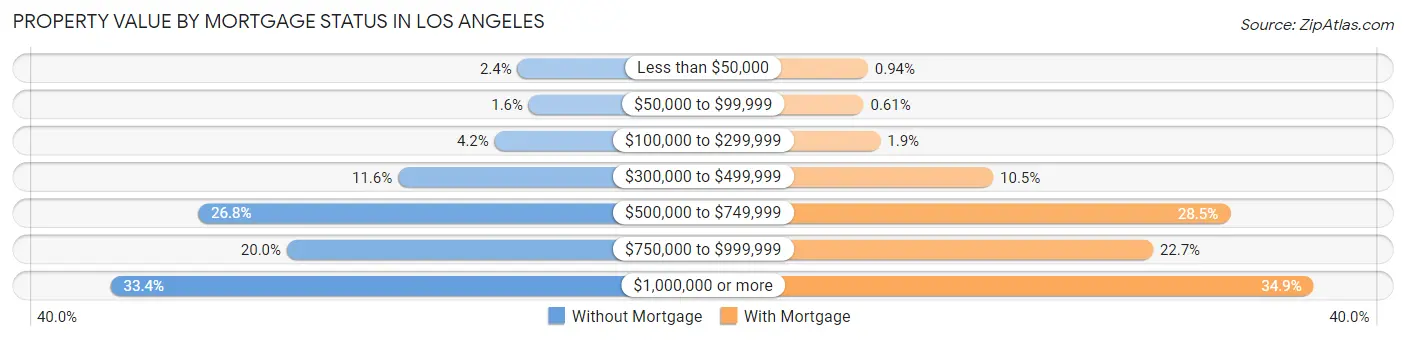
| Property Value | Without Mortgage | With Mortgage |
| Less than $50,000 | 3,660 (2.4%) | 3,399 (0.9%) |
| $50,000 to $99,999 | 2,372 (1.6%) | 2,210 (0.6%) |
| $100,000 to $299,999 | 6,283 (4.2%) | 6,843 (1.9%) |
| $300,000 to $499,999 | 17,343 (11.6%) | 37,981 (10.5%) |
| $500,000 to $749,999 | 40,200 (26.8%) | 103,376 (28.5%) |
| $750,000 to $999,999 | 30,062 (20.0%) | 82,114 (22.7%) |
| $1,000,000 or more | 50,203 (33.4%) | 126,398 (34.9%) |
| Total | 150,123 (100.0%) | 362,321 (100.0%) |
Household Income by Mortgage Status in Los Angeles
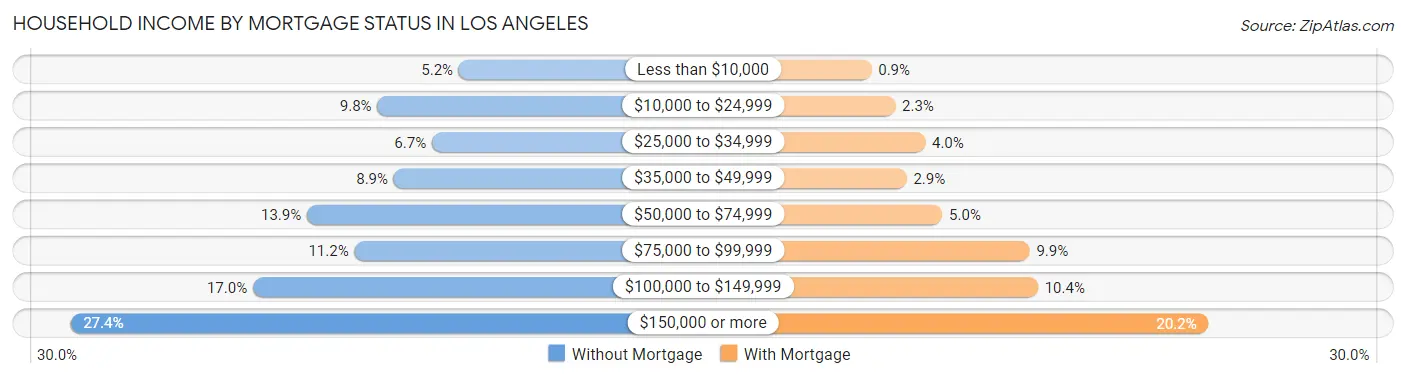
| Household Income | Without Mortgage | With Mortgage |
| Less than $10,000 | 7,781 (5.2%) | 3,274 (0.9%) |
| $10,000 to $24,999 | 14,767 (9.8%) | 8,206 (2.3%) |
| $25,000 to $34,999 | 10,093 (6.7%) | 14,391 (4.0%) |
| $35,000 to $49,999 | 13,361 (8.9%) | 10,528 (2.9%) |
| $50,000 to $74,999 | 20,814 (13.9%) | 17,929 (5.0%) |
| $75,000 to $99,999 | 16,738 (11.2%) | 36,006 (9.9%) |
| $100,000 to $149,999 | 25,452 (17.0%) | 37,730 (10.4%) |
| $150,000 or more | 41,117 (27.4%) | 73,069 (20.2%) |
| Total | 150,123 (100.0%) | 362,321 (100.0%) |
Property Value to Household Income Ratio in Los Angeles
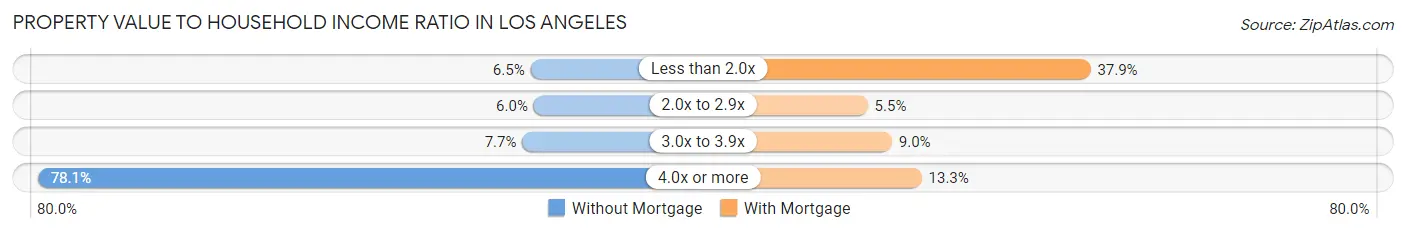
| Value-to-Income Ratio | Without Mortgage | With Mortgage |
| Less than 2.0x | 9,755 (6.5%) | 137,138 (37.9%) |
| 2.0x to 2.9x | 9,054 (6.0%) | 19,845 (5.5%) |
| 3.0x to 3.9x | 11,539 (7.7%) | 32,621 (9.0%) |
| 4.0x or more | 117,224 (78.1%) | 48,273 (13.3%) |
| Total | 150,123 (100.0%) | 362,321 (100.0%) |
Real Estate Taxes by Mortgage Status in Los Angeles
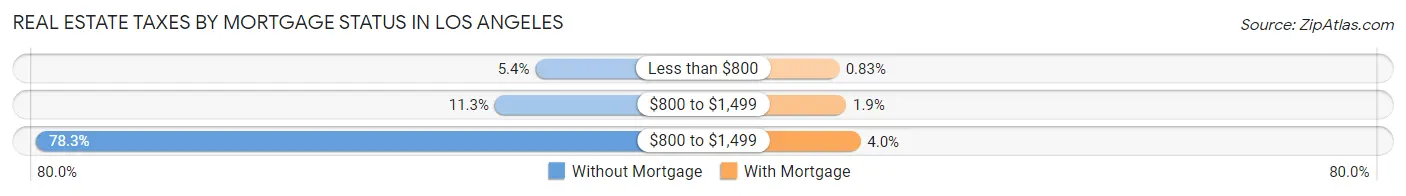
| Property Taxes | Without Mortgage | With Mortgage |
| Less than $800 | 8,074 (5.4%) | 2,998 (0.8%) |
| $800 to $1,499 | 16,949 (11.3%) | 6,901 (1.9%) |
| $800 to $1,499 | 117,563 (78.3%) | 14,474 (4.0%) |
| Total | 150,123 (100.0%) | 362,321 (100.0%) |
Health & Disability in Los Angeles
Health Insurance Coverage by Age in Los Angeles
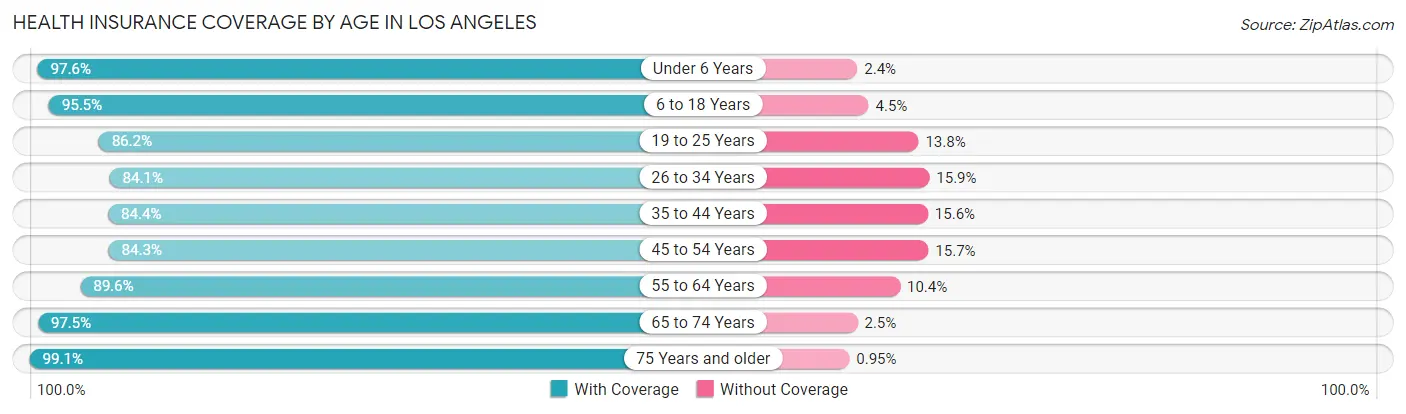
| Age Bracket | With Coverage | Without Coverage |
| Under 6 Years | 239,878 (97.6%) | 5,972 (2.4%) |
| 6 to 18 Years | 545,218 (95.5%) | 25,877 (4.5%) |
| 19 to 25 Years | 343,311 (86.2%) | 55,115 (13.8%) |
| 26 to 34 Years | 523,434 (84.1%) | 98,636 (15.9%) |
| 35 to 44 Years | 476,847 (84.4%) | 88,081 (15.6%) |
| 45 to 54 Years | 420,728 (84.3%) | 78,247 (15.7%) |
| 55 to 64 Years | 396,265 (89.6%) | 45,950 (10.4%) |
| 65 to 74 Years | 291,871 (97.5%) | 7,386 (2.5%) |
| 75 Years and older | 208,193 (99.1%) | 2,006 (0.9%) |
| Total | 3,445,745 (89.4%) | 407,270 (10.6%) |
Health Insurance Coverage by Citizenship Status in Los Angeles
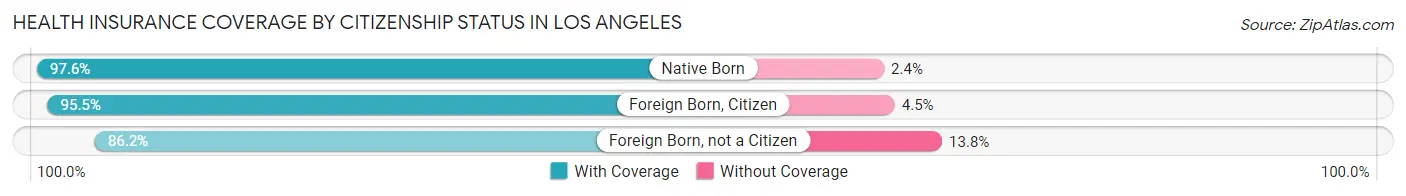
| Citizenship Status | With Coverage | Without Coverage |
| Native Born | 239,878 (97.6%) | 5,972 (2.4%) |
| Foreign Born, Citizen | 545,218 (95.5%) | 25,877 (4.5%) |
| Foreign Born, not a Citizen | 343,311 (86.2%) | 55,115 (13.8%) |
Health Insurance Coverage by Household Income in Los Angeles
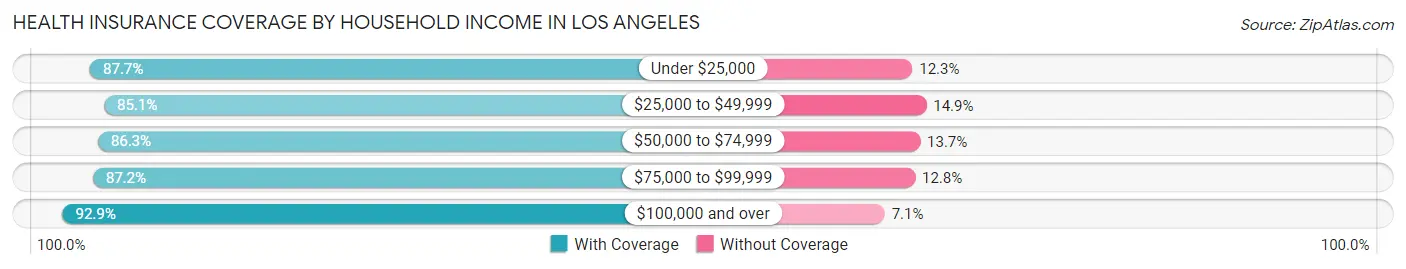
| Household Income | With Coverage | Without Coverage |
| Under $25,000 | 405,386 (87.7%) | 56,696 (12.3%) |
| $25,000 to $49,999 | 508,817 (85.1%) | 89,049 (14.9%) |
| $50,000 to $74,999 | 475,735 (86.3%) | 75,741 (13.7%) |
| $75,000 to $99,999 | 407,305 (87.2%) | 59,674 (12.8%) |
| $100,000 and over | 1,578,297 (92.9%) | 120,820 (7.1%) |
Public vs Private Health Insurance Coverage by Age in Los Angeles
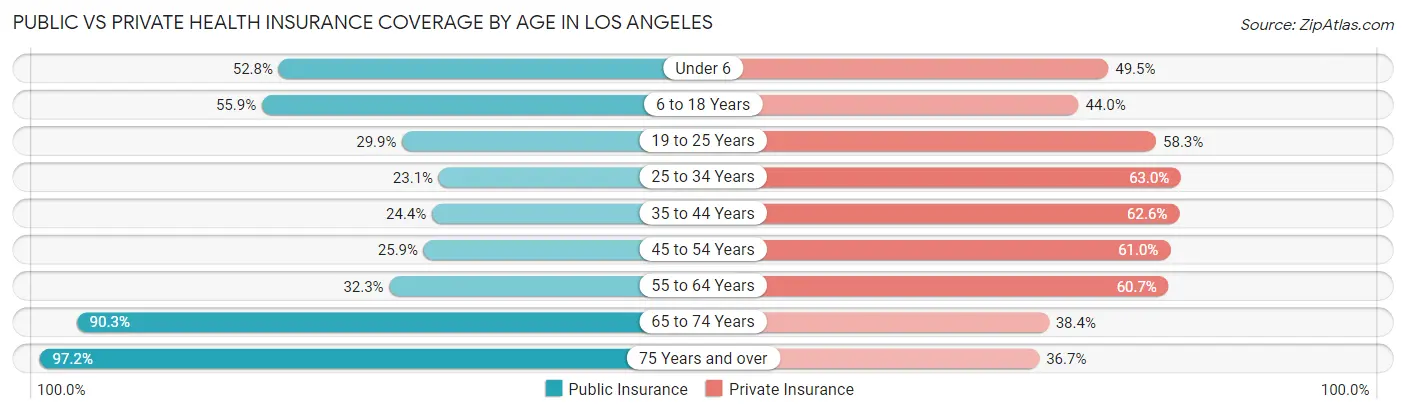
| Age Bracket | Public Insurance | Private Insurance |
| Under 6 | 129,855 (52.8%) | 121,608 (49.5%) |
| 6 to 18 Years | 319,470 (55.9%) | 251,033 (44.0%) |
| 19 to 25 Years | 119,102 (29.9%) | 232,442 (58.3%) |
| 25 to 34 Years | 143,683 (23.1%) | 391,814 (63.0%) |
| 35 to 44 Years | 137,614 (24.4%) | 353,715 (62.6%) |
| 45 to 54 Years | 129,166 (25.9%) | 304,140 (61.0%) |
| 55 to 64 Years | 142,744 (32.3%) | 268,306 (60.7%) |
| 65 to 74 Years | 270,345 (90.3%) | 114,946 (38.4%) |
| 75 Years and over | 204,385 (97.2%) | 77,037 (36.6%) |
| Total | 1,596,364 (41.4%) | 2,115,041 (54.9%) |
Disability Status by Sex by Age in Los Angeles
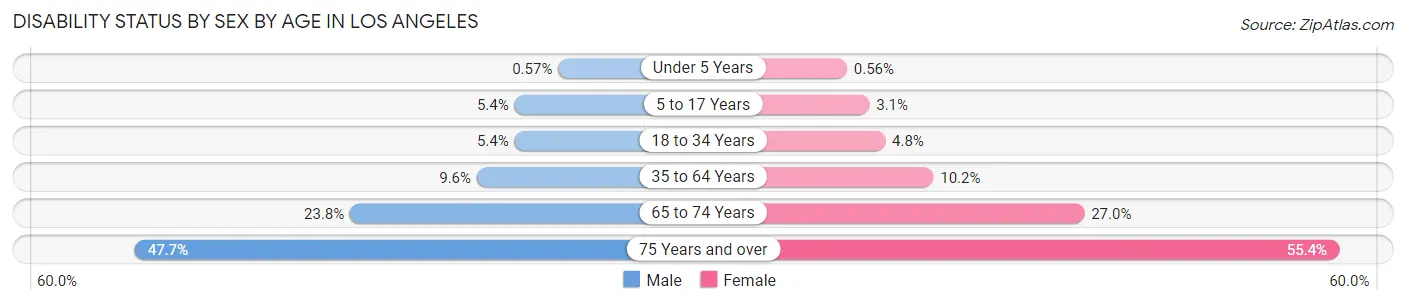
| Age Bracket | Male | Female |
| Under 5 Years | 617 (0.6%) | 552 (0.6%) |
| 5 to 17 Years | 15,637 (5.4%) | 8,287 (3.1%) |
| 18 to 34 Years | 29,464 (5.4%) | 25,579 (4.8%) |
| 35 to 64 Years | 73,578 (9.6%) | 75,623 (10.2%) |
| 65 to 74 Years | 32,968 (23.7%) | 43,322 (27.0%) |
| 75 Years and over | 39,690 (47.7%) | 70,318 (55.4%) |
Disability Class by Sex by Age in Los Angeles
Disability Class: Hearing Difficulty
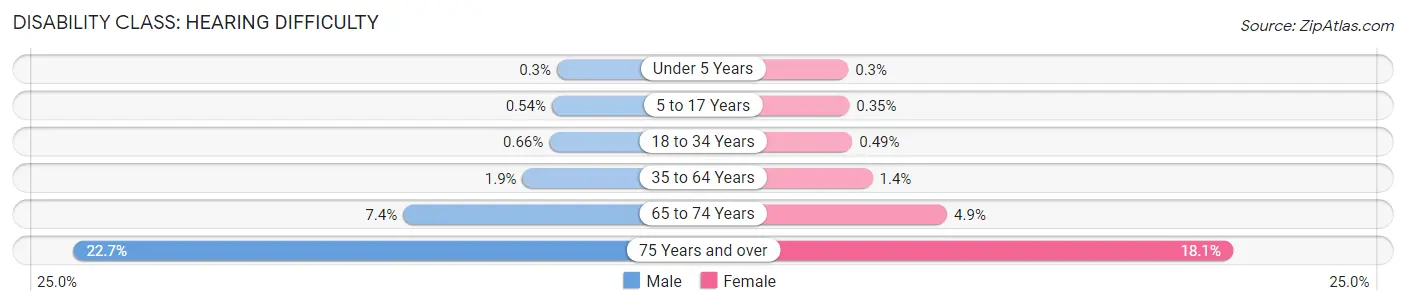
| Age Bracket | Male | Female |
| Under 5 Years | 326 (0.3%) | 302 (0.3%) |
| 5 to 17 Years | 1,564 (0.5%) | 959 (0.4%) |
| 18 to 34 Years | 3,549 (0.7%) | 2,603 (0.5%) |
| 35 to 64 Years | 14,529 (1.9%) | 10,604 (1.4%) |
| 65 to 74 Years | 10,325 (7.4%) | 7,839 (4.9%) |
| 75 Years and over | 18,907 (22.7%) | 23,039 (18.1%) |
Disability Class: Vision Difficulty
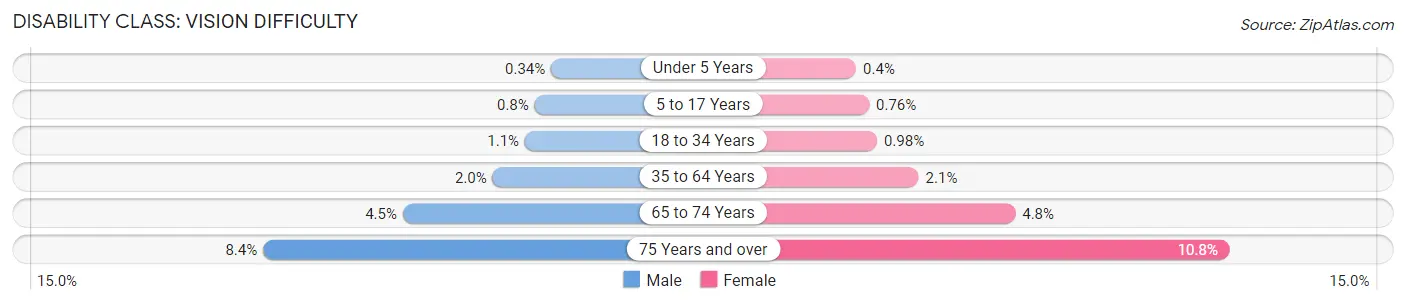
| Age Bracket | Male | Female |
| Under 5 Years | 369 (0.3%) | 398 (0.4%) |
| 5 to 17 Years | 2,285 (0.8%) | 2,062 (0.8%) |
| 18 to 34 Years | 5,802 (1.1%) | 5,228 (1.0%) |
| 35 to 64 Years | 15,051 (2.0%) | 15,877 (2.1%) |
| 65 to 74 Years | 6,209 (4.5%) | 7,748 (4.8%) |
| 75 Years and over | 6,957 (8.4%) | 13,715 (10.8%) |
Disability Class: Cognitive Difficulty
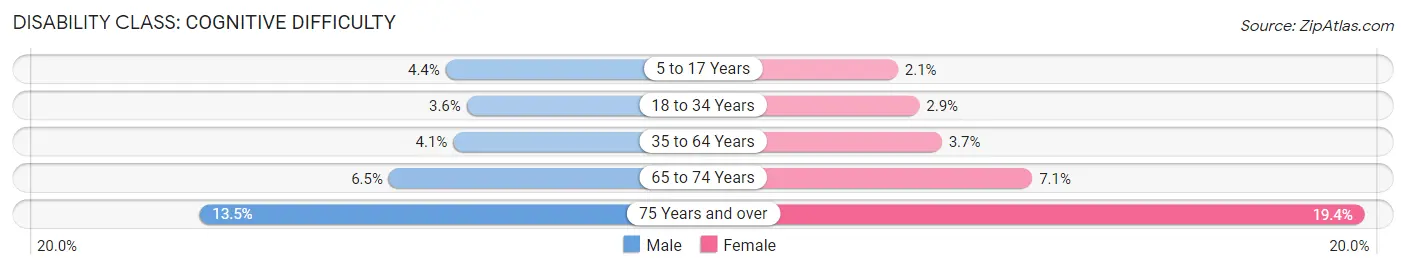
| Age Bracket | Male | Female |
| 5 to 17 Years | 12,572 (4.4%) | 5,626 (2.1%) |
| 18 to 34 Years | 19,415 (3.6%) | 15,297 (2.9%) |
| 35 to 64 Years | 31,218 (4.1%) | 27,522 (3.7%) |
| 65 to 74 Years | 9,002 (6.5%) | 11,345 (7.1%) |
| 75 Years and over | 11,241 (13.5%) | 24,660 (19.4%) |
Disability Class: Ambulatory Difficulty
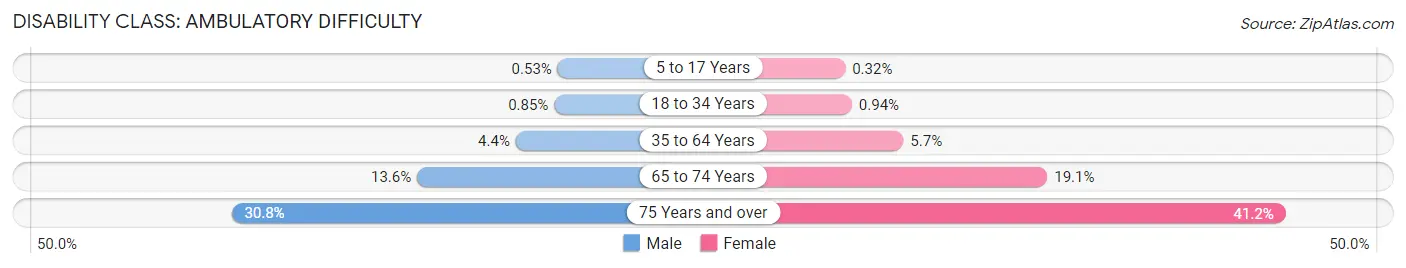
| Age Bracket | Male | Female |
| 5 to 17 Years | 1,510 (0.5%) | 858 (0.3%) |
| 18 to 34 Years | 4,630 (0.9%) | 4,998 (0.9%) |
| 35 to 64 Years | 33,777 (4.4%) | 42,474 (5.7%) |
| 65 to 74 Years | 18,860 (13.6%) | 30,590 (19.1%) |
| 75 Years and over | 25,615 (30.8%) | 52,315 (41.2%) |
Disability Class: Self-Care Difficulty
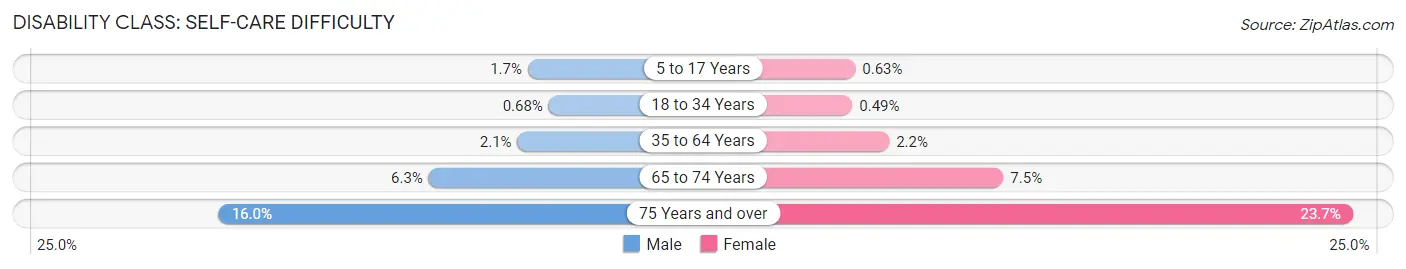
| Age Bracket | Male | Female |
| 5 to 17 Years | 4,738 (1.7%) | 1,717 (0.6%) |
| 18 to 34 Years | 3,689 (0.7%) | 2,627 (0.5%) |
| 35 to 64 Years | 16,296 (2.1%) | 16,309 (2.2%) |
| 65 to 74 Years | 8,683 (6.2%) | 12,027 (7.5%) |
| 75 Years and over | 13,296 (16.0%) | 30,107 (23.7%) |
Technology Access in Los Angeles
Computing Device Access in Los Angeles
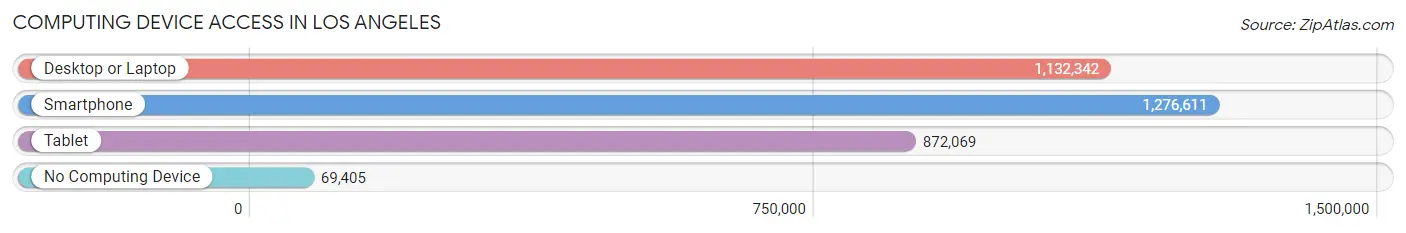
| Device Type | # Households | % Households |
| Desktop or Laptop | 1,132,342 | 80.9% |
| Smartphone | 1,276,611 | 91.2% |
| Tablet | 872,069 | 62.3% |
| No Computing Device | 69,405 | 5.0% |
| Total | 1,399,442 | 100.0% |
Internet Access in Los Angeles
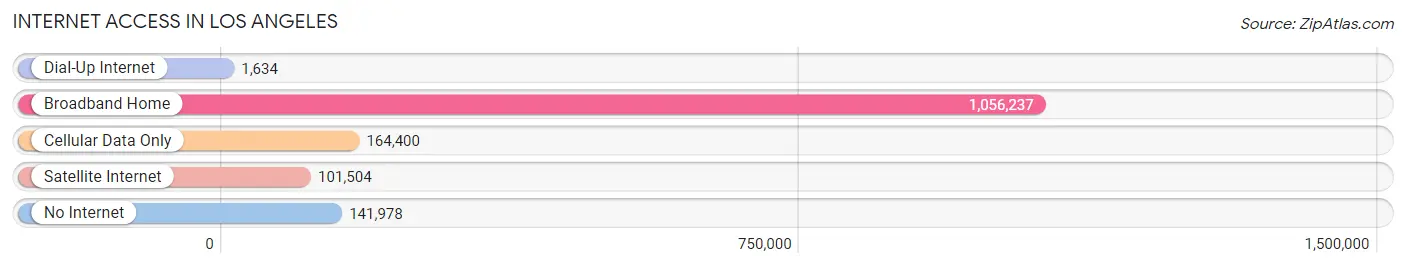
| Internet Type | # Households | % Households |
| Dial-Up Internet | 1,634 | 0.1% |
| Broadband Home | 1,056,237 | 75.5% |
| Cellular Data Only | 164,400 | 11.7% |
| Satellite Internet | 101,504 | 7.2% |
| No Internet | 141,978 | 10.2% |
| Total | 1,399,442 | 100.0% |
Los Angeles Summary
Los Angeles, California is the second largest city in the United States and the largest city in the state of California. It is located in the southern part of the state, along the Pacific Ocean. Los Angeles is a major cultural, economic, and transportation hub in the United States. It is home to Hollywood, the entertainment capital of the world, and is a major center for the motion picture, television, and music industries.
Geography
Los Angeles is located in the southwestern part of the United States, in the state of California. It is bordered by the Pacific Ocean to the west, the San Gabriel Mountains to the north, and the Santa Monica Mountains to the south. The city covers an area of 502.7 square miles, making it the second largest city in the United States by area. The city is divided into four distinct regions: the San Fernando Valley, the Westside, the South Bay, and the Harbor Area.
The San Fernando Valley is the largest region of Los Angeles and is home to many of the city’s most populous neighborhoods. It is located in the northern part of the city and is bordered by the Santa Monica Mountains to the south and the San Gabriel Mountains to the north. The Westside is located in the western part of the city and is home to many affluent neighborhoods. The South Bay is located in the southern part of the city and is home to many of the city’s beaches. The Harbor Area is located in the eastern part of the city and is home to the Port of Los Angeles.
Economy
Los Angeles is a major economic center in the United States. It is home to many Fortune 500 companies, including The Walt Disney Company, Northrop Grumman, and Occidental Petroleum. The city is also home to many major industries, including aerospace, entertainment, fashion, finance, healthcare, and technology.
Los Angeles is a major center for the motion picture, television, and music industries. It is home to many major film studios, including Universal Pictures, Warner Bros., and Paramount Pictures. The city is also home to many major television networks, including ABC, CBS, Fox, and NBC.
The Port of Los Angeles is one of the busiest ports in the world and is a major center for international trade. The port is home to many major shipping companies, including Maersk, COSCO, and Evergreen.
Demographics
As of 2019, Los Angeles had an estimated population of 4,000,000 people. The city is home to many ethnic and racial groups, including whites, African Americans, Asians, and Hispanics. The city is also home to many immigrants from around the world, including Mexico, China, and India.
Los Angeles is a major center for culture and the arts. The city is home to many museums, galleries, and theaters, including the Los Angeles County Museum of Art, the Getty Center, and the Hollywood Bowl. The city is also home to many professional sports teams, including the Los Angeles Lakers, the Los Angeles Dodgers, and the Los Angeles Kings.
Conclusion
Los Angeles is a major city in the United States and is home to many Fortune 500 companies, major industries, and professional sports teams. It is a major center for the motion picture, television, and music industries and is home to many ethnic and racial groups. The city is also home to many museums, galleries, and theaters and is a major center for culture and the arts.
Common Questions
What is Per Capita Income in Los Angeles?
Per Capita income in Los Angeles is $43,527.
What is the Median Family Income in Los Angeles?
Median Family Income in Los Angeles is $87,117.
What is the Median Household income in Los Angeles?
Median Household Income in Los Angeles is $76,244.
What is Income or Wage Gap in Los Angeles?
Income or Wage Gap in Los Angeles is 16.8%.
Women in Los Angeles earn 83.2 cents for every dollar earned by a man.
What is Family Income Deficit in Los Angeles?
Family Income Deficit in Los Angeles is $10,805.
Families that are below poverty line in Los Angeles earn $10,805 less on average than the poverty threshold level.
What is Inequality or Gini Index in Los Angeles?
Inequality or Gini Index in Los Angeles is 0.53.
What is the Total Population of Los Angeles?
Total Population of Los Angeles is 3,881,041.
What is the Total Male Population of Los Angeles?
Total Male Population of Los Angeles is 1,941,047.
What is the Total Female Population of Los Angeles?
Total Female Population of Los Angeles is 1,939,994.
What is the Ratio of Males per 100 Females in Los Angeles?
There are 100.05 Males per 100 Females in Los Angeles.
What is the Ratio of Females per 100 Males in Los Angeles?
There are 99.95 Females per 100 Males in Los Angeles.
What is the Median Population Age in Los Angeles?
Median Population Age in Los Angeles is 36.5 Years.
What is the Average Family Size in Los Angeles
Average Family Size in Los Angeles is 3.5 People.
What is the Average Household Size in Los Angeles
Average Household Size in Los Angeles is 2.7 People.
How Large is the Labor Force in Los Angeles?
There are 2,128,884 People in the Labor Forcein in Los Angeles.
What is the Percentage of People in the Labor Force in Los Angeles?
66.5% of People are in the Labor Force in Los Angeles.
What is the Unemployment Rate in Los Angeles?
Unemployment Rate in Los Angeles is 7.7%.