Hawthorne, CA Map & Demographics
Hawthorne Map
Hawthorne Overview
$32,434
PER CAPITA INCOME
$76,778
AVG FAMILY INCOME
$72,298
AVG HOUSEHOLD INCOME
21.9%
WAGE / INCOME GAP [ % ]
78.1¢/ $1
WAGE / INCOME GAP [ $ ]
$11,960
FAMILY INCOME DEFICIT
0.44
INEQUALITY / GINI INDEX
86,978
TOTAL POPULATION
42,479
MALE POPULATION
44,499
FEMALE POPULATION
95.46
MALES / 100 FEMALES
104.76
FEMALES / 100 MALES
33.3
MEDIAN AGE
3.6
AVG FAMILY SIZE
2.9
AVG HOUSEHOLD SIZE
47,010
LABOR FORCE [ PEOPLE ]
69.3%
PERCENT IN LABOR FORCE
7.5%
UNEMPLOYMENT RATE
Hawthorne Zip Codes
Income in Hawthorne
Income Overview in Hawthorne
Per Capita Income in Hawthorne is $32,434, while median incomes of families and households are $76,778 and $72,298 respectively.
| Characteristic | Number | Measure |
| Per Capita Income | 86,978 | $32,434 |
| Median Family Income | 19,551 | $76,778 |
| Mean Family Income | 19,551 | $97,741 |
| Median Household Income | 29,292 | $72,298 |
| Mean Household Income | 29,292 | $92,354 |
| Income Deficit | 19,551 | $11,960 |
| Wage / Income Gap (%) | 86,978 | 21.94% |
| Wage / Income Gap ($) | 86,978 | 78.06¢ per $1 |
| Gini / Inequality Index | 86,978 | 0.44 |
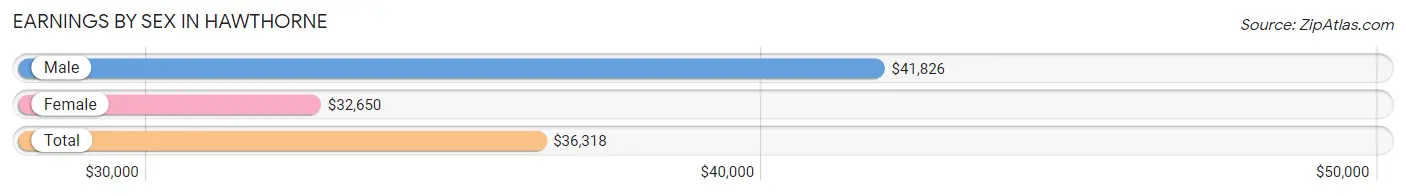
Earnings by Sex in Hawthorne
Average Earnings in Hawthorne are $36,318, $41,826 for men and $32,650 for women, a difference of 21.9%.
| Sex | Number | Average Earnings |
| Male | 24,374 (51.6%) | $41,826 |
| Female | 22,862 (48.4%) | $32,650 |
| Total | 47,236 (100.0%) | $36,318 |
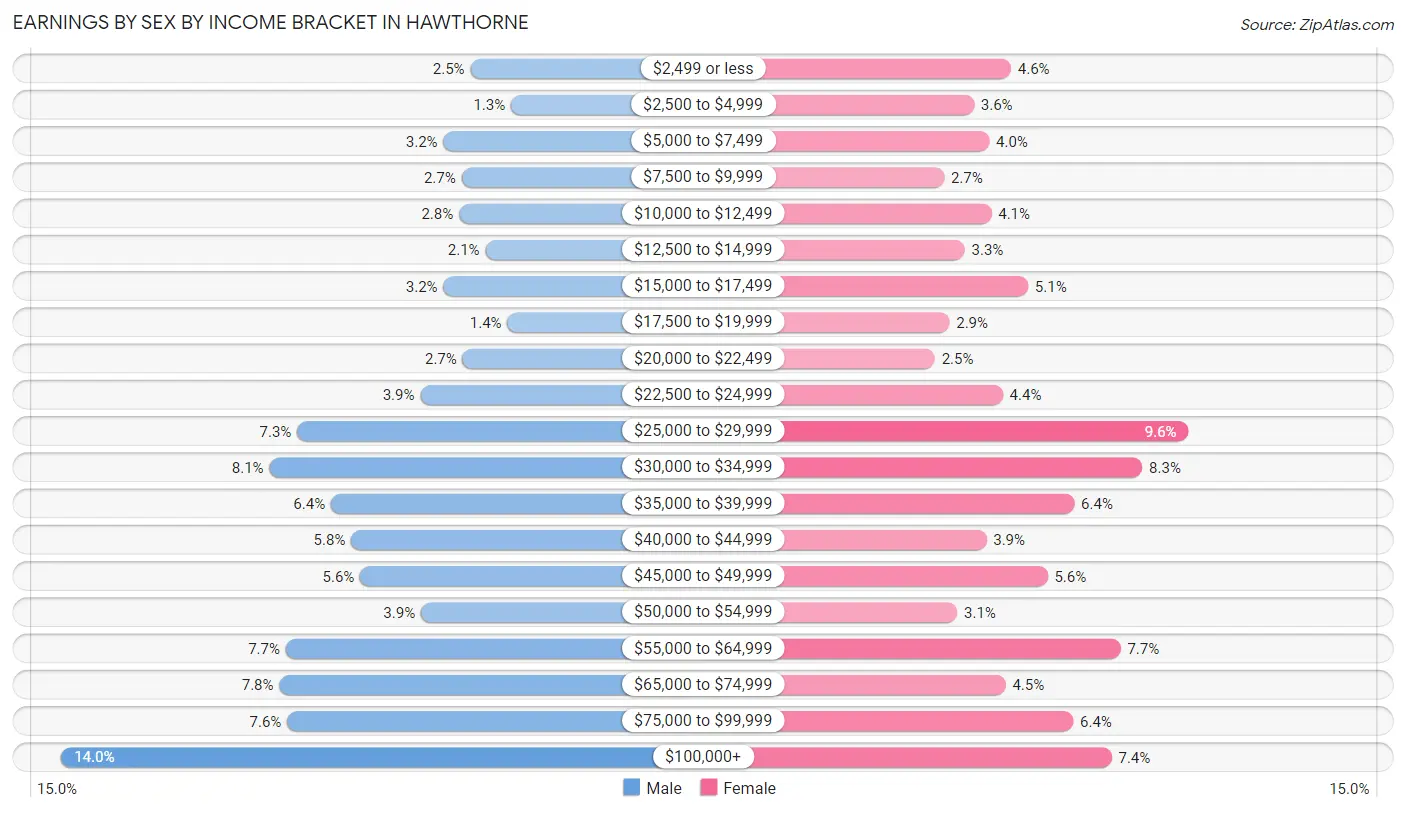
Earnings by Sex by Income Bracket in Hawthorne
The most common earnings brackets in Hawthorne are $100,000+ for men (3,405 | 14.0%) and $25,000 to $29,999 for women (2,194 | 9.6%).
| Income | Male | Female |
| $2,499 or less | 602 (2.5%) | 1,055 (4.6%) |
| $2,500 to $4,999 | 325 (1.3%) | 817 (3.6%) |
| $5,000 to $7,499 | 787 (3.2%) | 915 (4.0%) |
| $7,500 to $9,999 | 664 (2.7%) | 625 (2.7%) |
| $10,000 to $12,499 | 679 (2.8%) | 928 (4.1%) |
| $12,500 to $14,999 | 499 (2.1%) | 756 (3.3%) |
| $15,000 to $17,499 | 788 (3.2%) | 1,163 (5.1%) |
| $17,500 to $19,999 | 348 (1.4%) | 658 (2.9%) |
| $20,000 to $22,499 | 655 (2.7%) | 565 (2.5%) |
| $22,500 to $24,999 | 945 (3.9%) | 1,001 (4.4%) |
| $25,000 to $29,999 | 1,789 (7.3%) | 2,194 (9.6%) |
| $30,000 to $34,999 | 1,979 (8.1%) | 1,898 (8.3%) |
| $35,000 to $39,999 | 1,558 (6.4%) | 1,460 (6.4%) |
| $40,000 to $44,999 | 1,418 (5.8%) | 896 (3.9%) |
| $45,000 to $49,999 | 1,358 (5.6%) | 1,290 (5.6%) |
| $50,000 to $54,999 | 942 (3.9%) | 708 (3.1%) |
| $55,000 to $64,999 | 1,866 (7.7%) | 1,759 (7.7%) |
| $65,000 to $74,999 | 1,910 (7.8%) | 1,019 (4.5%) |
| $75,000 to $99,999 | 1,857 (7.6%) | 1,453 (6.4%) |
| $100,000+ | 3,405 (14.0%) | 1,702 (7.4%) |
| Total | 24,374 (100.0%) | 22,862 (100.0%) |
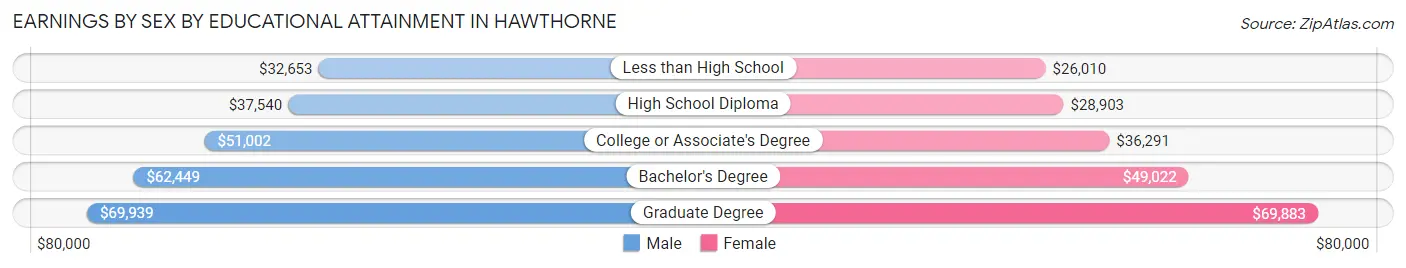
Earnings by Sex by Educational Attainment in Hawthorne
Average earnings in Hawthorne are $45,438 for men and $35,339 for women, a difference of 22.2%. Men with an educational attainment of graduate degree enjoy the highest average annual earnings of $69,939, while those with less than high school education earn the least with $32,653. Women with an educational attainment of graduate degree earn the most with the average annual earnings of $69,883, while those with less than high school education have the smallest earnings of $26,010.
| Educational Attainment | Male Income | Female Income |
| Less than High School | $32,653 | $26,010 |
| High School Diploma | $37,540 | $28,903 |
| College or Associate's Degree | $51,002 | $36,291 |
| Bachelor's Degree | $62,449 | $49,022 |
| Graduate Degree | $69,939 | $69,883 |
| Total | $45,438 | $35,339 |
Family Income in Hawthorne
Family Income Brackets in Hawthorne
According to the Hawthorne family income data, there are 3,676 families falling into the $100,000 to $149,999 income range, which is the most common income bracket and makes up 18.8% of all families. Conversely, the $10,000 to $14,999 income bracket is the least frequent group with only 606 families (3.1%) belonging to this category.
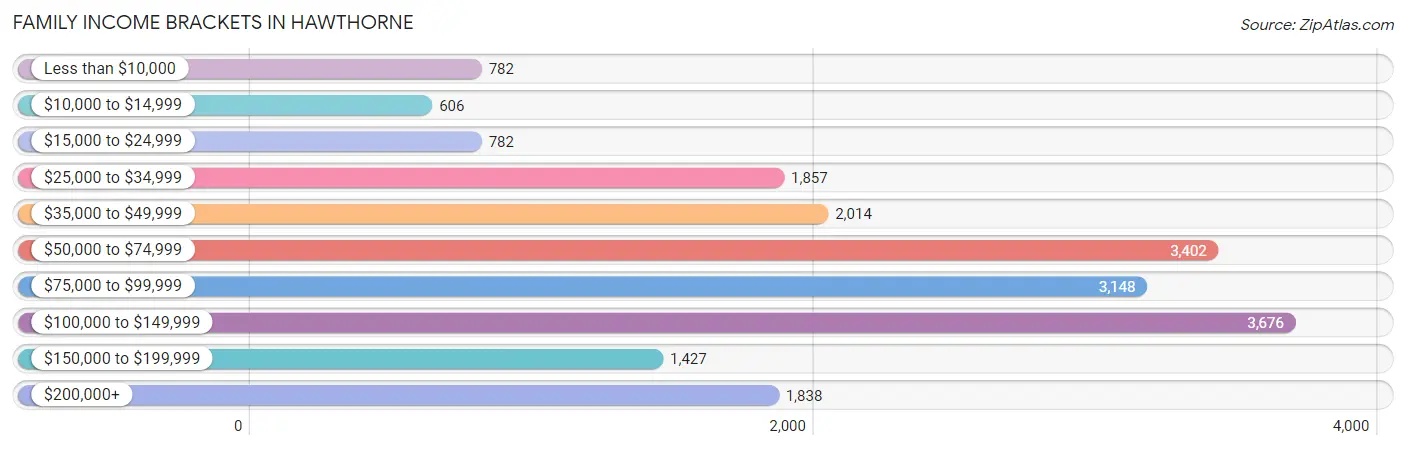
| Income Bracket | # Families | % Families |
| Less than $10,000 | 782 | 4.0% |
| $10,000 to $14,999 | 606 | 3.1% |
| $15,000 to $24,999 | 782 | 4.0% |
| $25,000 to $34,999 | 1,857 | 9.5% |
| $35,000 to $49,999 | 2,014 | 10.3% |
| $50,000 to $74,999 | 3,402 | 17.4% |
| $75,000 to $99,999 | 3,148 | 16.1% |
| $100,000 to $149,999 | 3,676 | 18.8% |
| $150,000 to $199,999 | 1,427 | 7.3% |
| $200,000+ | 1,838 | 9.4% |
Family Income by Famaliy Size in Hawthorne
7+ person families (713 | 3.6%) account for the highest median family income in Hawthorne with $112,232 per family, while 2-person families (6,690 | 34.2%) have the highest median income of $32,852 per family member.
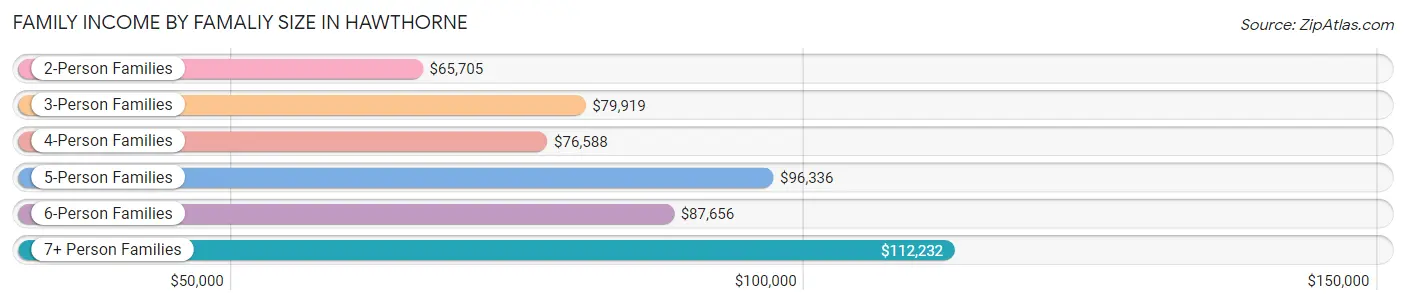
| Income Bracket | # Families | Median Income |
| 2-Person Families | 6,690 (34.2%) | $65,705 |
| 3-Person Families | 4,883 (25.0%) | $79,919 |
| 4-Person Families | 4,292 (22.0%) | $76,588 |
| 5-Person Families | 2,215 (11.3%) | $96,336 |
| 6-Person Families | 758 (3.9%) | $87,656 |
| 7+ Person Families | 713 (3.6%) | $112,232 |
| Total | 19,551 (100.0%) | $76,778 |
Family Income by Number of Earners in Hawthorne
The median family income in Hawthorne is $76,778, with families comprising 3+ earners (3,048) having the highest median family income of $110,208, while families with no earners (1,502) have the lowest median family income of $25,887, accounting for 15.6% and 7.7% of families, respectively.
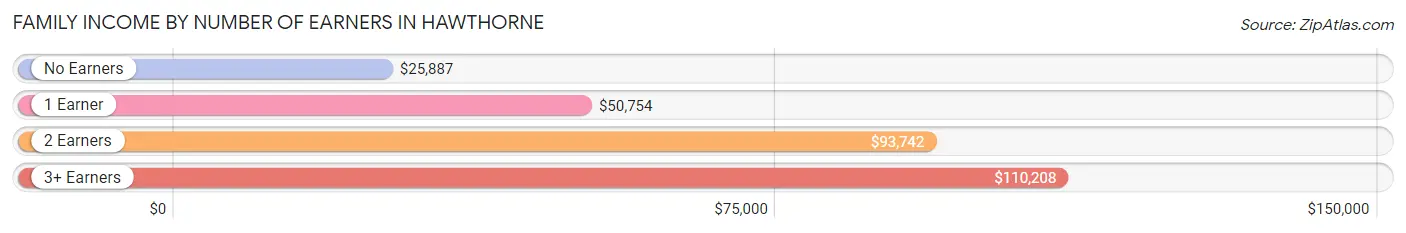
| Number of Earners | # Families | Median Income |
| No Earners | 1,502 (7.7%) | $25,887 |
| 1 Earner | 6,873 (35.1%) | $50,754 |
| 2 Earners | 8,128 (41.6%) | $93,742 |
| 3+ Earners | 3,048 (15.6%) | $110,208 |
| Total | 19,551 (100.0%) | $76,778 |
Household Income in Hawthorne
Household Income Brackets in Hawthorne
With 5,360 households falling in the category, the $100,000 to $149,999 income range is the most frequent in Hawthorne, accounting for 18.3% of all households. In contrast, only 1,260 households (4.3%) fall into the $10,000 to $14,999 income bracket, making it the least populous group.
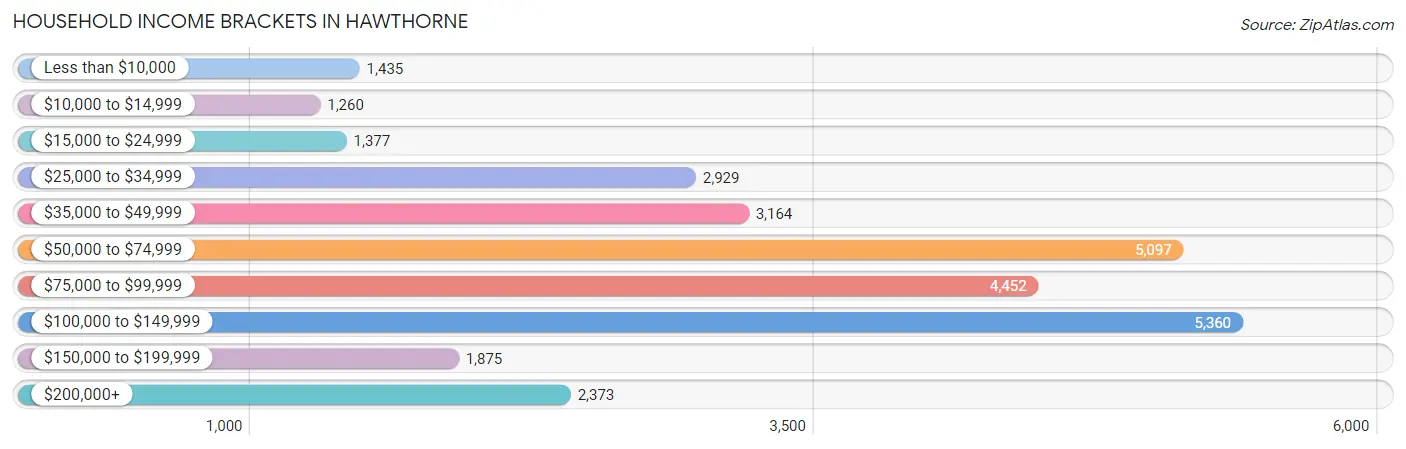
| Income Bracket | # Households | % Households |
| Less than $10,000 | 1,435 | 4.9% |
| $10,000 to $14,999 | 1,260 | 4.3% |
| $15,000 to $24,999 | 1,377 | 4.7% |
| $25,000 to $34,999 | 2,929 | 10.0% |
| $35,000 to $49,999 | 3,164 | 10.8% |
| $50,000 to $74,999 | 5,097 | 17.4% |
| $75,000 to $99,999 | 4,452 | 15.2% |
| $100,000 to $149,999 | 5,360 | 18.3% |
| $150,000 to $199,999 | 1,875 | 6.4% |
| $200,000+ | 2,373 | 8.1% |
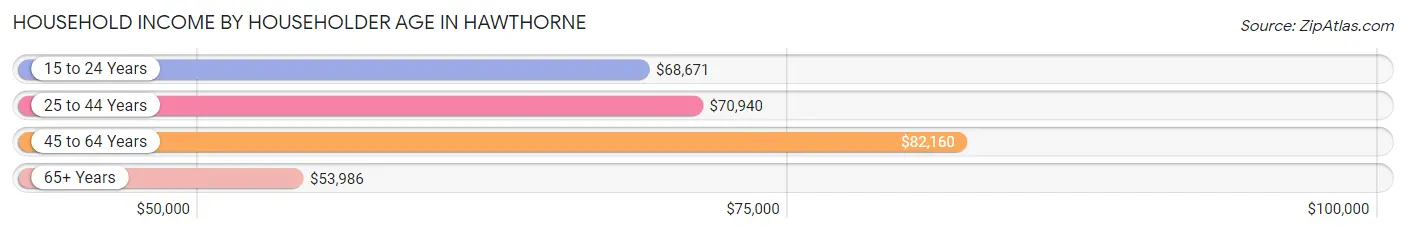
Household Income by Householder Age in Hawthorne
The median household income in Hawthorne is $72,298, with the highest median household income of $82,160 found in the 45 to 64 years age bracket for the primary householder. A total of 11,530 households (39.4%) fall into this category. Meanwhile, the 65+ years age bracket for the primary householder has the lowest median household income of $53,986, with 4,483 households (15.3%) in this group.
| Income Bracket | # Households | Median Income |
| 15 to 24 Years | 825 (2.8%) | $68,671 |
| 25 to 44 Years | 12,454 (42.5%) | $70,940 |
| 45 to 64 Years | 11,530 (39.4%) | $82,160 |
| 65+ Years | 4,483 (15.3%) | $53,986 |
| Total | 29,292 (100.0%) | $72,298 |
Poverty in Hawthorne
Income Below Poverty by Sex and Age in Hawthorne
With 15.7% poverty level for males and 15.6% for females among the residents of Hawthorne, 6 to 11 year old males and under 5 year old females are the most vulnerable to poverty, with 1,395 males (35.0%) and 593 females (24.8%) in their respective age groups living below the poverty level.
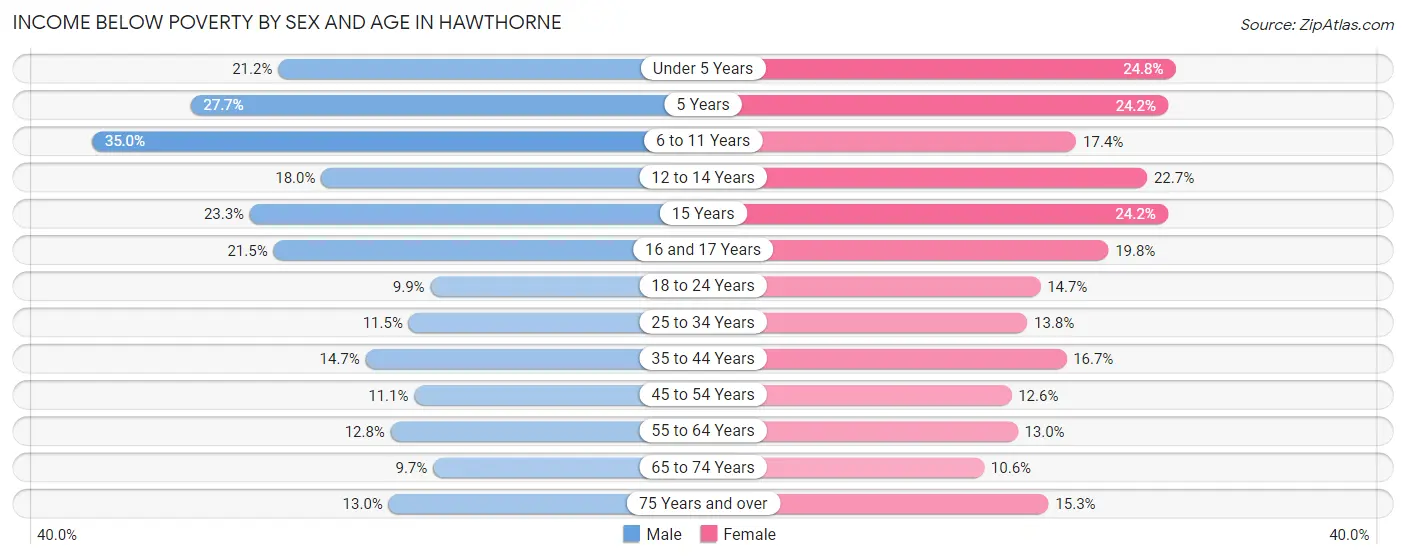
| Age Bracket | Male | Female |
| Under 5 Years | 714 (21.2%) | 593 (24.8%) |
| 5 Years | 121 (27.7%) | 152 (24.2%) |
| 6 to 11 Years | 1,395 (35.0%) | 625 (17.4%) |
| 12 to 14 Years | 325 (18.0%) | 349 (22.7%) |
| 15 Years | 74 (23.3%) | 193 (24.2%) |
| 16 and 17 Years | 277 (21.5%) | 230 (19.8%) |
| 18 to 24 Years | 367 (9.9%) | 702 (14.7%) |
| 25 to 34 Years | 860 (11.5%) | 1,178 (13.8%) |
| 35 to 44 Years | 901 (14.7%) | 994 (16.7%) |
| 45 to 54 Years | 659 (11.1%) | 719 (12.6%) |
| 55 to 64 Years | 555 (12.8%) | 625 (13.0%) |
| 65 to 74 Years | 210 (9.7%) | 257 (10.5%) |
| 75 Years and over | 155 (13.0%) | 270 (15.3%) |
| Total | 6,613 (15.7%) | 6,887 (15.6%) |
Income Above Poverty by Sex and Age in Hawthorne
According to the poverty statistics in Hawthorne, males aged 65 to 74 years and females aged 65 to 74 years are the age groups that are most secure financially, with 90.3% of males and 89.4% of females in these age groups living above the poverty line.
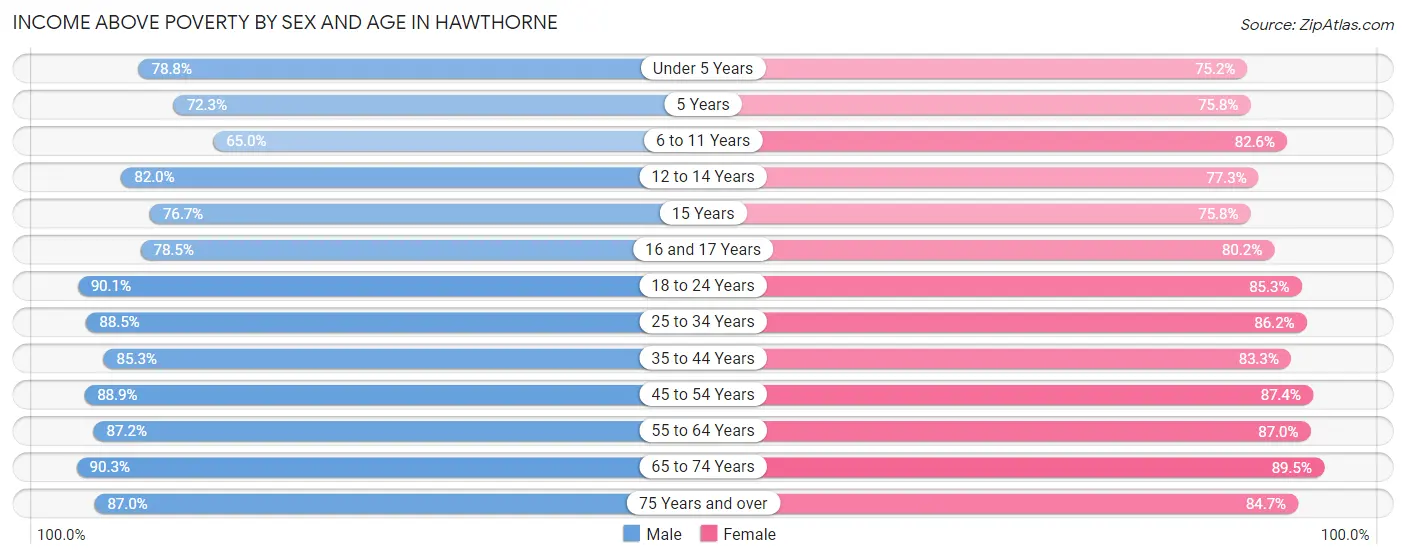
| Age Bracket | Male | Female |
| Under 5 Years | 2,659 (78.8%) | 1,802 (75.2%) |
| 5 Years | 316 (72.3%) | 476 (75.8%) |
| 6 to 11 Years | 2,590 (65.0%) | 2,966 (82.6%) |
| 12 to 14 Years | 1,484 (82.0%) | 1,191 (77.3%) |
| 15 Years | 244 (76.7%) | 605 (75.8%) |
| 16 and 17 Years | 1,010 (78.5%) | 933 (80.2%) |
| 18 to 24 Years | 3,353 (90.1%) | 4,063 (85.3%) |
| 25 to 34 Years | 6,632 (88.5%) | 7,382 (86.2%) |
| 35 to 44 Years | 5,235 (85.3%) | 4,974 (83.3%) |
| 45 to 54 Years | 5,295 (88.9%) | 4,995 (87.4%) |
| 55 to 64 Years | 3,774 (87.2%) | 4,169 (87.0%) |
| 65 to 74 Years | 1,961 (90.3%) | 2,178 (89.4%) |
| 75 Years and over | 1,040 (87.0%) | 1,490 (84.7%) |
| Total | 35,593 (84.3%) | 37,224 (84.4%) |
Income Below Poverty Among Married-Couple Families in Hawthorne
The poverty statistics for married-couple families in Hawthorne show that 11.3% or 1,231 of the total 10,893 families live below the poverty line. Families with 5 or more children have the highest poverty rate of 96.5%, comprising of 109 families. On the other hand, families with no children have the lowest poverty rate of 4.1%, which includes 195 families.
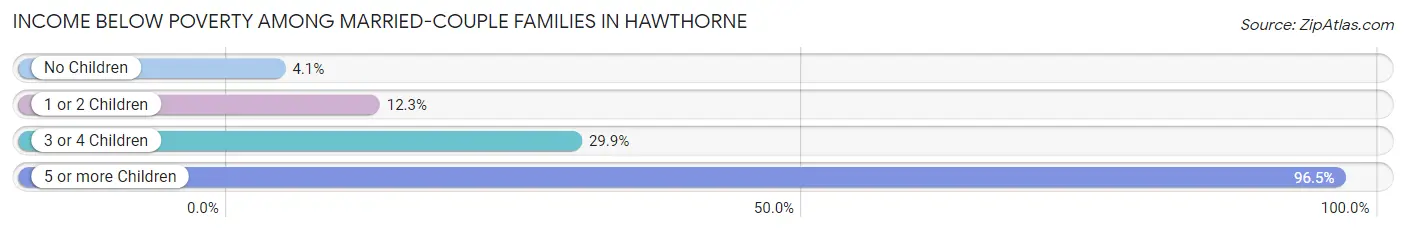
| Children | Above Poverty | Below Poverty |
| No Children | 4,532 (95.9%) | 195 (4.1%) |
| 1 or 2 Children | 4,410 (87.7%) | 621 (12.3%) |
| 3 or 4 Children | 716 (70.1%) | 306 (29.9%) |
| 5 or more Children | 4 (3.5%) | 109 (96.5%) |
| Total | 9,662 (88.7%) | 1,231 (11.3%) |
Income Below Poverty Among Single-Parent Households in Hawthorne
According to the poverty data in Hawthorne, 11.3% or 285 single-father households and 15.7% or 965 single-mother households are living below the poverty line. Among single-father households, those with 3 or 4 children have the highest poverty rate, with 35 households (32.4%) experiencing poverty. Likewise, among single-mother households, those with 3 or 4 children have the highest poverty rate, with 234 households (44.4%) falling below the poverty line.
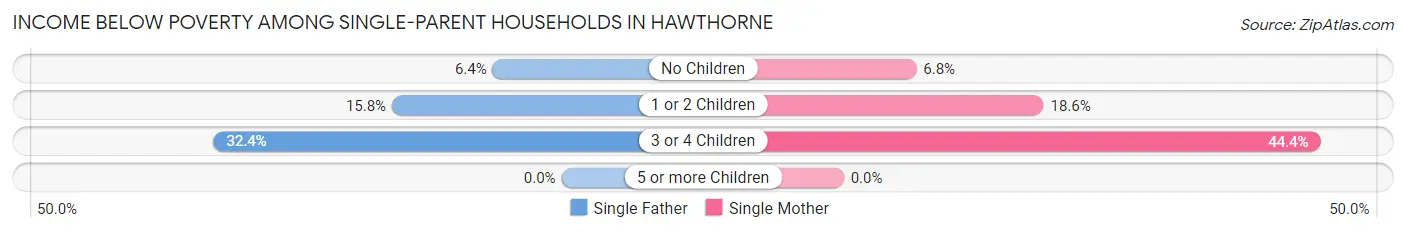
| Children | Single Father | Single Mother |
| No Children | 90 (6.4%) | 165 (6.8%) |
| 1 or 2 Children | 160 (15.8%) | 566 (18.6%) |
| 3 or 4 Children | 35 (32.4%) | 234 (44.4%) |
| 5 or more Children | 0 (0.0%) | 0 (0.0%) |
| Total | 285 (11.3%) | 965 (15.7%) |
Income Below Poverty Among Married-Couple vs Single-Parent Households in Hawthorne
The poverty data for Hawthorne shows that 1,231 of the married-couple family households (11.3%) and 1,250 of the single-parent households (14.4%) are living below the poverty level. Within the married-couple family households, those with 5 or more children have the highest poverty rate, with 109 households (96.5%) falling below the poverty line. Among the single-parent households, those with 3 or 4 children have the highest poverty rate, with 269 household (42.4%) living below poverty.
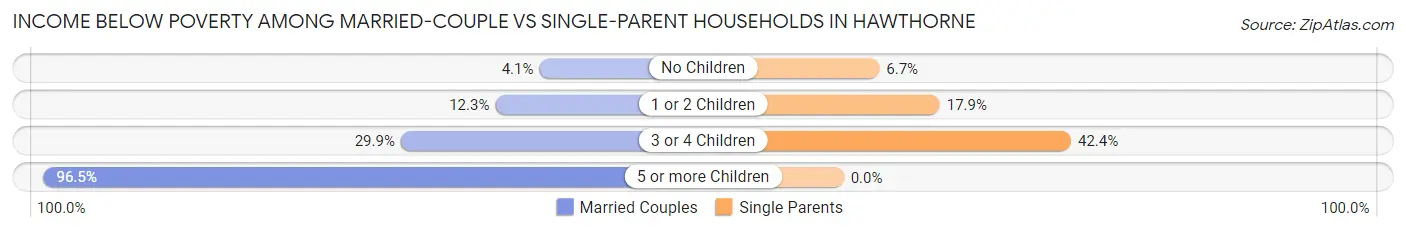
| Children | Married-Couple Families | Single-Parent Households |
| No Children | 195 (4.1%) | 255 (6.7%) |
| 1 or 2 Children | 621 (12.3%) | 726 (17.9%) |
| 3 or 4 Children | 306 (29.9%) | 269 (42.4%) |
| 5 or more Children | 109 (96.5%) | 0 (0.0%) |
| Total | 1,231 (11.3%) | 1,250 (14.4%) |
Race in Hawthorne
The most populous races in Hawthorne are Hispanic or Latino (48,001 | 55.2%), White / Caucasian (24,918 | 28.6%), and Black / African American (22,683 | 26.1%).
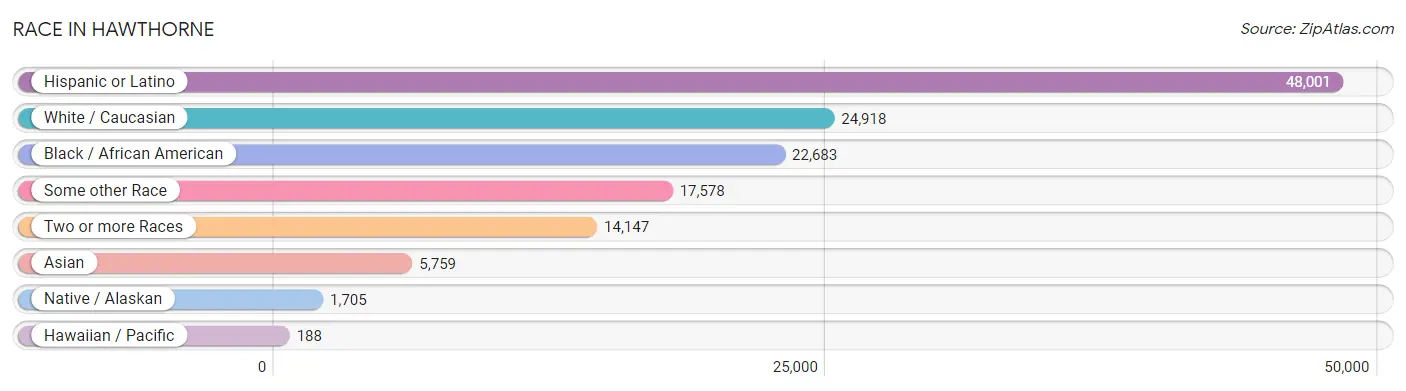
| Race | # Population | % Population |
| Asian | 5,759 | 6.6% |
| Black / African American | 22,683 | 26.1% |
| Hawaiian / Pacific | 188 | 0.2% |
| Hispanic or Latino | 48,001 | 55.2% |
| Native / Alaskan | 1,705 | 2.0% |
| White / Caucasian | 24,918 | 28.6% |
| Two or more Races | 14,147 | 16.3% |
| Some other Race | 17,578 | 20.2% |
| Total | 86,978 | 100.0% |
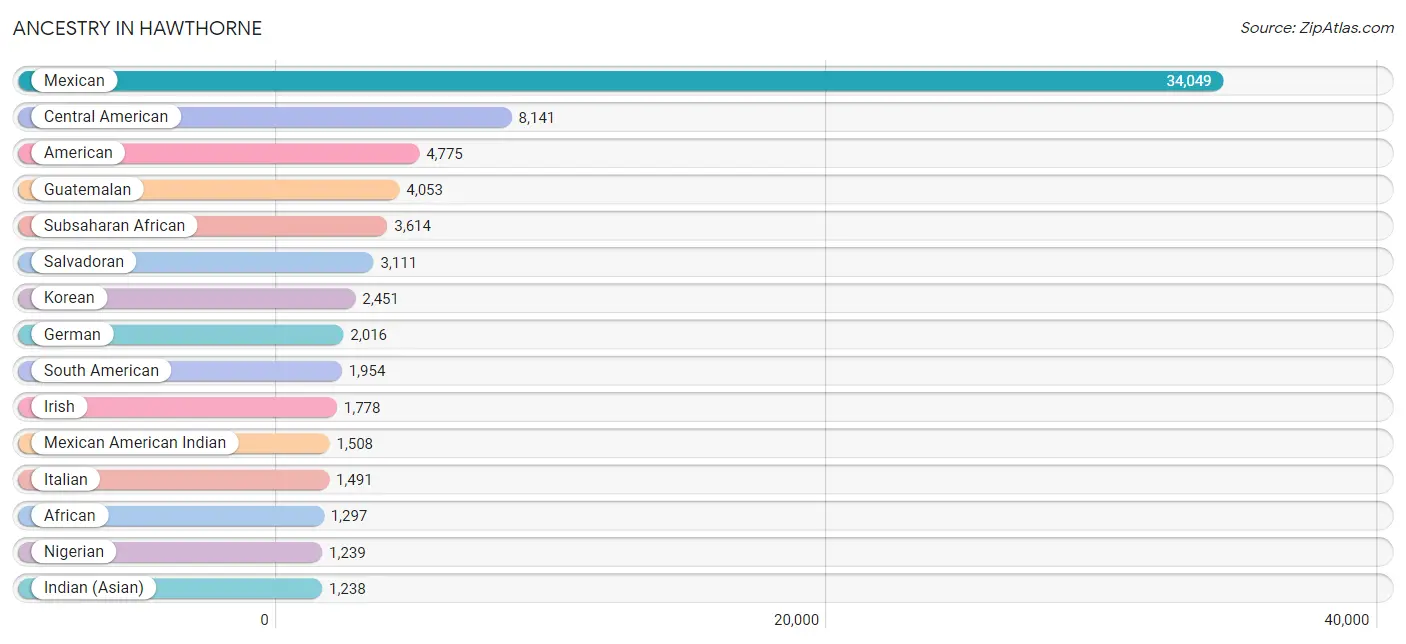
Ancestry in Hawthorne
The most populous ancestries reported in Hawthorne are Mexican (34,049 | 39.2%), Central American (8,141 | 9.4%), American (4,775 | 5.5%), Guatemalan (4,053 | 4.7%), and Subsaharan African (3,614 | 4.2%), together accounting for 62.8% of all Hawthorne residents.
| Ancestry | # Population | % Population |
| African | 1,297 | 1.5% |
| Alaska Native | 14 | 0.0% |
| American | 4,775 | 5.5% |
| Apache | 35 | 0.0% |
| Arab | 932 | 1.1% |
| Argentinean | 118 | 0.1% |
| Armenian | 55 | 0.1% |
| Austrian | 27 | 0.0% |
| Barbadian | 40 | 0.1% |
| Basque | 7 | 0.0% |
| Belgian | 22 | 0.0% |
| Belizean | 173 | 0.2% |
| Bhutanese | 683 | 0.8% |
| Blackfeet | 72 | 0.1% |
| Bolivian | 117 | 0.1% |
| Brazilian | 285 | 0.3% |
| British | 177 | 0.2% |
| British West Indian | 10 | 0.0% |
| Burmese | 276 | 0.3% |
| Canadian | 150 | 0.2% |
| Central American | 8,141 | 9.4% |
| Central American Indian | 340 | 0.4% |
| Cherokee | 57 | 0.1% |
| Chickasaw | 36 | 0.0% |
| Chilean | 144 | 0.2% |
| Choctaw | 90 | 0.1% |
| Colombian | 495 | 0.6% |
| Costa Rican | 71 | 0.1% |
| Cuban | 968 | 1.1% |
| Czech | 15 | 0.0% |
| Danish | 60 | 0.1% |
| Dominican | 426 | 0.5% |
| Dutch | 168 | 0.2% |
| Eastern European | 71 | 0.1% |
| Ecuadorian | 179 | 0.2% |
| Egyptian | 378 | 0.4% |
| English | 1,117 | 1.3% |
| Ethiopian | 644 | 0.7% |
| European | 305 | 0.4% |
| Filipino | 99 | 0.1% |
| Finnish | 3 | 0.0% |
| French | 918 | 1.1% |
| French Canadian | 50 | 0.1% |
| German | 2,016 | 2.3% |
| Ghanaian | 57 | 0.1% |
| Greek | 13 | 0.0% |
| Guatemalan | 4,053 | 4.7% |
| Haitian | 11 | 0.0% |
| Honduran | 266 | 0.3% |
| Hopi | 16 | 0.0% |
| Hungarian | 66 | 0.1% |
| Icelander | 24 | 0.0% |
| Indian (Asian) | 1,238 | 1.4% |
| Indonesian | 74 | 0.1% |
| Iranian | 95 | 0.1% |
| Iraqi | 22 | 0.0% |
| Irish | 1,778 | 2.0% |
| Israeli | 23 | 0.0% |
| Italian | 1,491 | 1.7% |
| Jamaican | 587 | 0.7% |
| Japanese | 97 | 0.1% |
| Jordanian | 155 | 0.2% |
| Kenyan | 23 | 0.0% |
| Korean | 2,451 | 2.8% |
| Laotian | 20 | 0.0% |
| Lebanese | 8 | 0.0% |
| Liberian | 35 | 0.0% |
| Lithuanian | 4 | 0.0% |
| Malaysian | 15 | 0.0% |
| Maltese | 10 | 0.0% |
| Mexican | 34,049 | 39.2% |
| Mexican American Indian | 1,508 | 1.7% |
| Moroccan | 65 | 0.1% |
| Native Hawaiian | 231 | 0.3% |
| New Zealander | 10 | 0.0% |
| Nicaraguan | 401 | 0.5% |
| Nigerian | 1,239 | 1.4% |
| Northern European | 29 | 0.0% |
| Norwegian | 94 | 0.1% |
| Pakistani | 74 | 0.1% |
| Palestinian | 78 | 0.1% |
| Panamanian | 91 | 0.1% |
| Peruvian | 724 | 0.8% |
| Pima | 16 | 0.0% |
| Polish | 504 | 0.6% |
| Portuguese | 32 | 0.0% |
| Pueblo | 12 | 0.0% |
| Puerto Rican | 1,117 | 1.3% |
| Romanian | 20 | 0.0% |
| Russian | 325 | 0.4% |
| Salvadoran | 3,111 | 3.6% |
| Samoan | 101 | 0.1% |
| Scandinavian | 33 | 0.0% |
| Scotch-Irish | 38 | 0.0% |
| Scottish | 165 | 0.2% |
| Serbian | 19 | 0.0% |
| Sierra Leonean | 118 | 0.1% |
| Slovak | 24 | 0.0% |
| South American | 1,954 | 2.2% |
| South American Indian | 21 | 0.0% |
| Spaniard | 193 | 0.2% |
| Spanish | 280 | 0.3% |
| Sri Lankan | 782 | 0.9% |
| Subsaharan African | 3,614 | 4.2% |
| Swedish | 326 | 0.4% |
| Swiss | 12 | 0.0% |
| Syrian | 12 | 0.0% |
| Thai | 482 | 0.5% |
| Tongan | 47 | 0.1% |
| Trinidadian and Tobagonian | 15 | 0.0% |
| Turkish | 21 | 0.0% |
| Ugandan | 102 | 0.1% |
| Ukrainian | 7 | 0.0% |
| Ute | 4 | 0.0% |
| Venezuelan | 177 | 0.2% |
| Vietnamese | 143 | 0.2% |
| Welsh | 149 | 0.2% |
| Yugoslavian | 24 | 0.0% | View All 118 Rows |
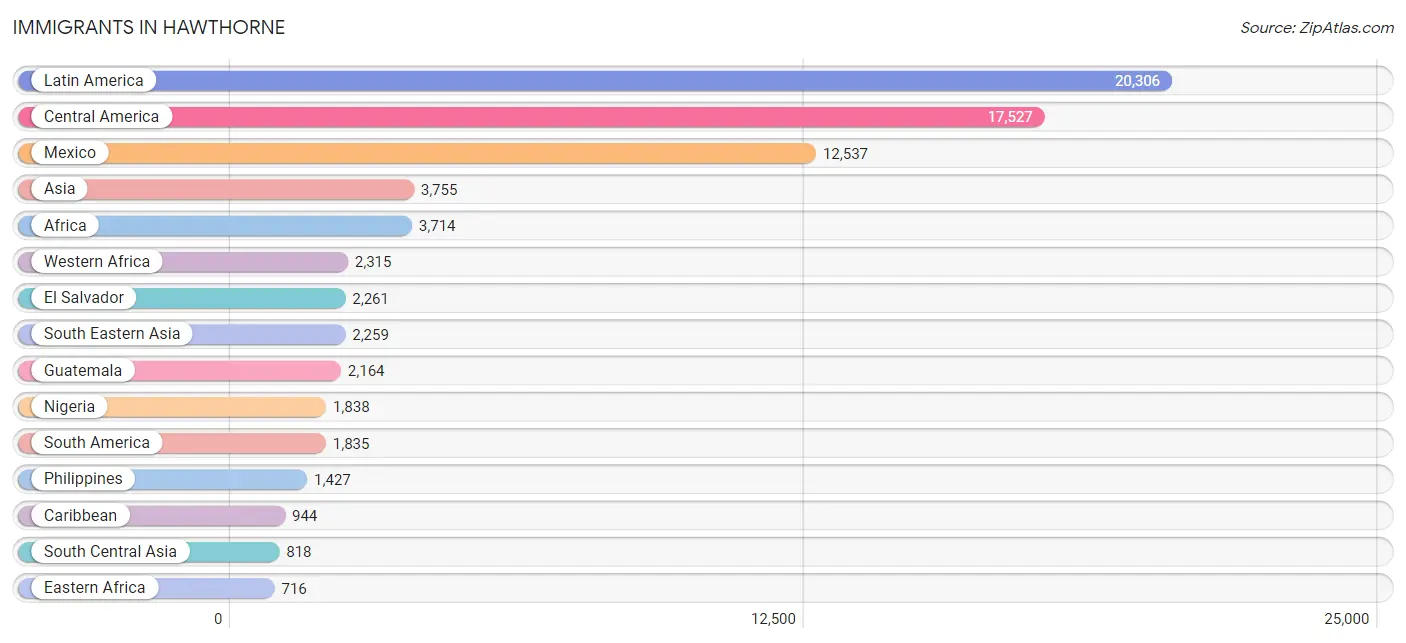
Immigrants in Hawthorne
The most numerous immigrant groups reported in Hawthorne came from Latin America (20,306 | 23.4%), Central America (17,527 | 20.2%), Mexico (12,537 | 14.4%), Asia (3,755 | 4.3%), and Africa (3,714 | 4.3%), together accounting for 66.5% of all Hawthorne residents.
| Immigration Origin | # Population | % Population |
| Afghanistan | 40 | 0.1% |
| Africa | 3,714 | 4.3% |
| Argentina | 36 | 0.0% |
| Asia | 3,755 | 4.3% |
| Bangladesh | 101 | 0.1% |
| Belarus | 9 | 0.0% |
| Belize | 191 | 0.2% |
| Bolivia | 70 | 0.1% |
| Brazil | 324 | 0.4% |
| Cambodia | 18 | 0.0% |
| Cameroon | 105 | 0.1% |
| Canada | 63 | 0.1% |
| Caribbean | 944 | 1.1% |
| Central America | 17,527 | 20.2% |
| Chile | 58 | 0.1% |
| China | 396 | 0.5% |
| Colombia | 356 | 0.4% |
| Costa Rica | 38 | 0.0% |
| Cuba | 616 | 0.7% |
| Czechoslovakia | 7 | 0.0% |
| Dominican Republic | 15 | 0.0% |
| Eastern Africa | 716 | 0.8% |
| Eastern Asia | 575 | 0.7% |
| Eastern Europe | 179 | 0.2% |
| Ecuador | 103 | 0.1% |
| Egypt | 290 | 0.3% |
| El Salvador | 2,261 | 2.6% |
| England | 72 | 0.1% |
| Eritrea | 44 | 0.1% |
| Ethiopia | 410 | 0.5% |
| Europe | 476 | 0.5% |
| Fiji | 77 | 0.1% |
| France | 69 | 0.1% |
| Germany | 6 | 0.0% |
| Ghana | 148 | 0.2% |
| Greece | 6 | 0.0% |
| Grenada | 10 | 0.0% |
| Guatemala | 2,164 | 2.5% |
| Guyana | 120 | 0.1% |
| Honduras | 63 | 0.1% |
| Hong Kong | 32 | 0.0% |
| India | 261 | 0.3% |
| Indonesia | 4 | 0.0% |
| Iran | 98 | 0.1% |
| Iraq | 11 | 0.0% |
| Israel | 7 | 0.0% |
| Italy | 47 | 0.1% |
| Jamaica | 266 | 0.3% |
| Japan | 57 | 0.1% |
| Jordan | 51 | 0.1% |
| Kenya | 23 | 0.0% |
| Korea | 122 | 0.1% |
| Laos | 22 | 0.0% |
| Latin America | 20,306 | 23.4% |
| Liberia | 42 | 0.1% |
| Malaysia | 23 | 0.0% |
| Mexico | 12,537 | 14.4% |
| Middle Africa | 151 | 0.2% |
| Morocco | 65 | 0.1% |
| Nepal | 26 | 0.0% |
| Netherlands | 11 | 0.0% |
| Nicaragua | 273 | 0.3% |
| Nigeria | 1,838 | 2.1% |
| Northern Africa | 503 | 0.6% |
| Northern Europe | 111 | 0.1% |
| Oceania | 85 | 0.1% |
| Pakistan | 292 | 0.3% |
| Peru | 571 | 0.7% |
| Philippines | 1,427 | 1.6% |
| Poland | 38 | 0.0% |
| Romania | 10 | 0.0% |
| Russia | 57 | 0.1% |
| Scotland | 19 | 0.0% |
| Sierra Leone | 217 | 0.3% |
| South America | 1,835 | 2.1% |
| South Central Asia | 818 | 0.9% |
| South Eastern Asia | 2,259 | 2.6% |
| Southern Europe | 53 | 0.1% |
| Switzerland | 47 | 0.1% |
| Taiwan | 48 | 0.1% |
| Thailand | 47 | 0.1% |
| Trinidad and Tobago | 15 | 0.0% |
| Turkey | 18 | 0.0% |
| Uganda | 221 | 0.3% |
| Venezuela | 180 | 0.2% |
| Vietnam | 660 | 0.8% |
| Western Africa | 2,315 | 2.7% |
| Western Asia | 103 | 0.1% |
| Western Europe | 133 | 0.2% |
| Zaire | 46 | 0.1% |
| Zimbabwe | 10 | 0.0% | View All 91 Rows |
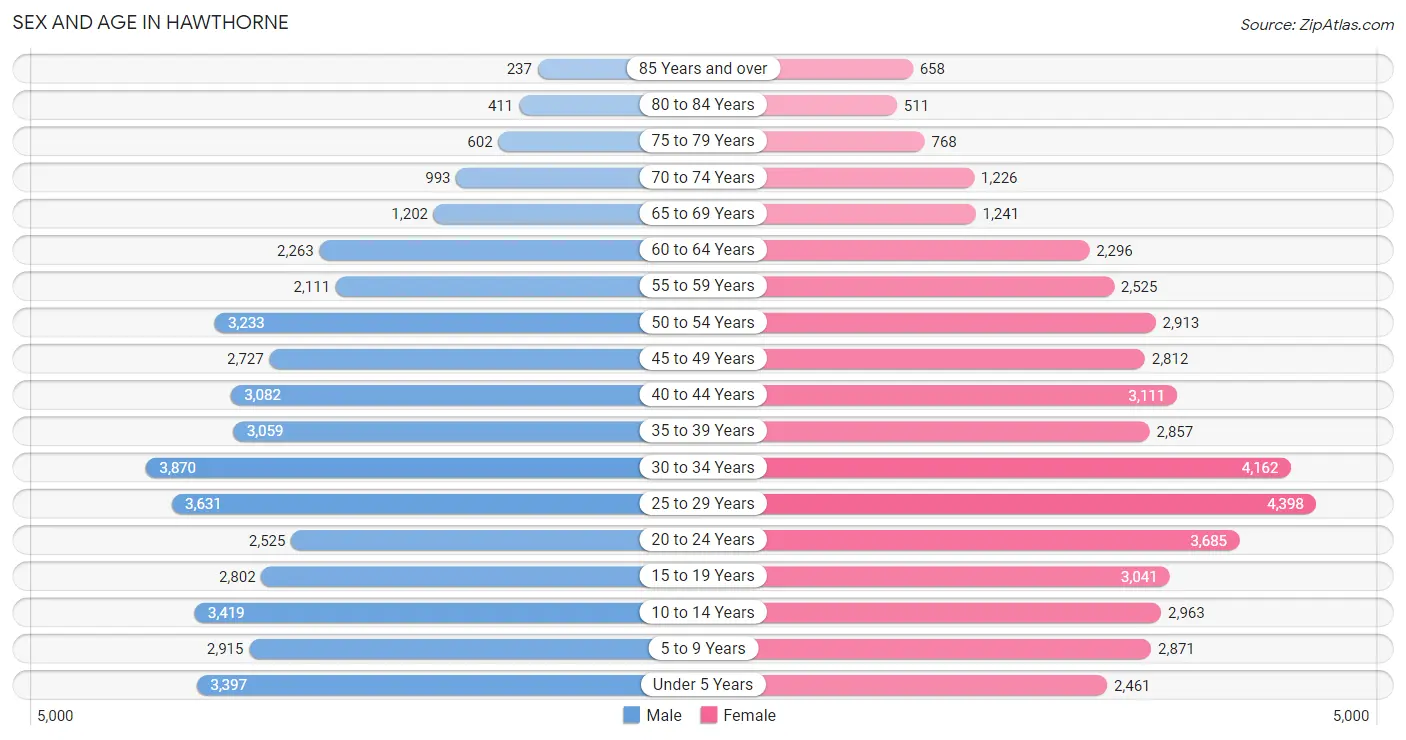
Sex and Age in Hawthorne
Sex and Age in Hawthorne
The most populous age groups in Hawthorne are 30 to 34 Years (3,870 | 9.1%) for men and 25 to 29 Years (4,398 | 9.9%) for women.
| Age Bracket | Male | Female |
| Under 5 Years | 3,397 (8.0%) | 2,461 (5.5%) |
| 5 to 9 Years | 2,915 (6.9%) | 2,871 (6.5%) |
| 10 to 14 Years | 3,419 (8.1%) | 2,963 (6.7%) |
| 15 to 19 Years | 2,802 (6.6%) | 3,041 (6.8%) |
| 20 to 24 Years | 2,525 (5.9%) | 3,685 (8.3%) |
| 25 to 29 Years | 3,631 (8.6%) | 4,398 (9.9%) |
| 30 to 34 Years | 3,870 (9.1%) | 4,162 (9.3%) |
| 35 to 39 Years | 3,059 (7.2%) | 2,857 (6.4%) |
| 40 to 44 Years | 3,082 (7.3%) | 3,111 (7.0%) |
| 45 to 49 Years | 2,727 (6.4%) | 2,812 (6.3%) |
| 50 to 54 Years | 3,233 (7.6%) | 2,913 (6.6%) |
| 55 to 59 Years | 2,111 (5.0%) | 2,525 (5.7%) |
| 60 to 64 Years | 2,263 (5.3%) | 2,296 (5.2%) |
| 65 to 69 Years | 1,202 (2.8%) | 1,241 (2.8%) |
| 70 to 74 Years | 993 (2.3%) | 1,226 (2.8%) |
| 75 to 79 Years | 602 (1.4%) | 768 (1.7%) |
| 80 to 84 Years | 411 (1.0%) | 511 (1.1%) |
| 85 Years and over | 237 (0.6%) | 658 (1.5%) |
| Total | 42,479 (100.0%) | 44,499 (100.0%) |
Families and Households in Hawthorne
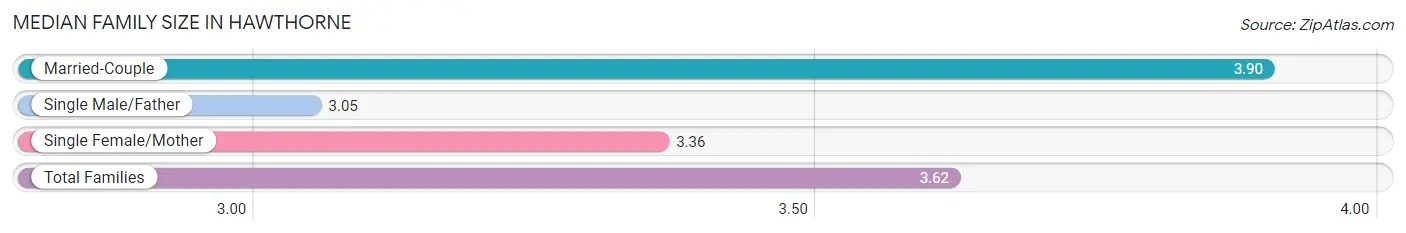
Median Family Size in Hawthorne
The median family size in Hawthorne is 3.62 persons per family, with married-couple families (10,893 | 55.7%) accounting for the largest median family size of 3.9 persons per family. On the other hand, single male/father families (2,523 | 12.9%) represent the smallest median family size with 3.05 persons per family.
| Family Type | # Families | Family Size |
| Married-Couple | 10,893 (55.7%) | 3.90 |
| Single Male/Father | 2,523 (12.9%) | 3.05 |
| Single Female/Mother | 6,135 (31.4%) | 3.36 |
| Total Families | 19,551 (100.0%) | 3.62 |
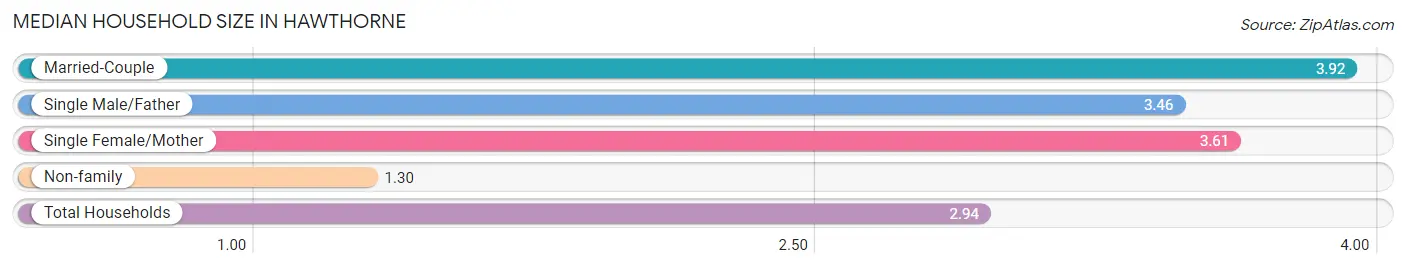
Median Household Size in Hawthorne
The median household size in Hawthorne is 2.94 persons per household, with married-couple households (10,893 | 37.2%) accounting for the largest median household size of 3.92 persons per household. non-family households (9,741 | 33.3%) represent the smallest median household size with 1.30 persons per household.
| Household Type | # Households | Household Size |
| Married-Couple | 10,893 (37.2%) | 3.92 |
| Single Male/Father | 2,523 (8.6%) | 3.46 |
| Single Female/Mother | 6,135 (20.9%) | 3.61 |
| Non-family | 9,741 (33.3%) | 1.30 |
| Total Households | 29,292 (100.0%) | 2.94 |
Household Size by Marriage Status in Hawthorne
Out of a total of 29,292 households in Hawthorne, 19,551 (66.7%) are family households, while 9,741 (33.3%) are nonfamily households. The most numerous type of family households are 2-person households, comprising 5,791, and the most common type of nonfamily households are 1-person households, comprising 7,750.
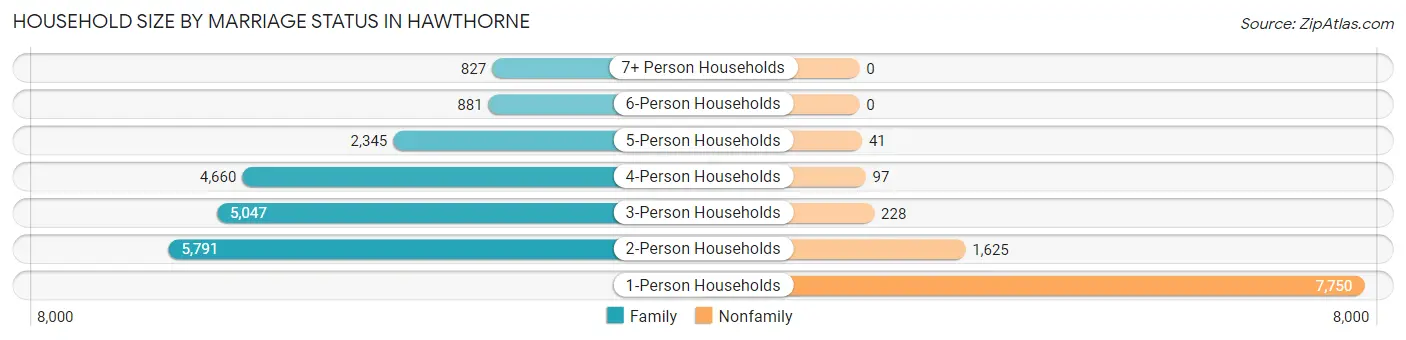
| Household Size | Family Households | Nonfamily Households |
| 1-Person Households | - | 7,750 (26.5%) |
| 2-Person Households | 5,791 (19.8%) | 1,625 (5.6%) |
| 3-Person Households | 5,047 (17.2%) | 228 (0.8%) |
| 4-Person Households | 4,660 (15.9%) | 97 (0.3%) |
| 5-Person Households | 2,345 (8.0%) | 41 (0.1%) |
| 6-Person Households | 881 (3.0%) | 0 (0.0%) |
| 7+ Person Households | 827 (2.8%) | 0 (0.0%) |
| Total | 19,551 (66.7%) | 9,741 (33.3%) |
Female Fertility in Hawthorne
Fertility by Age in Hawthorne
Average fertility rate in Hawthorne is 65.0 births per 1,000 women. Women in the age bracket of 20 to 34 years have the highest fertility rate with 105.0 births per 1,000 women. Women in the age bracket of 20 to 34 years acount for 80.5% of all women with births.
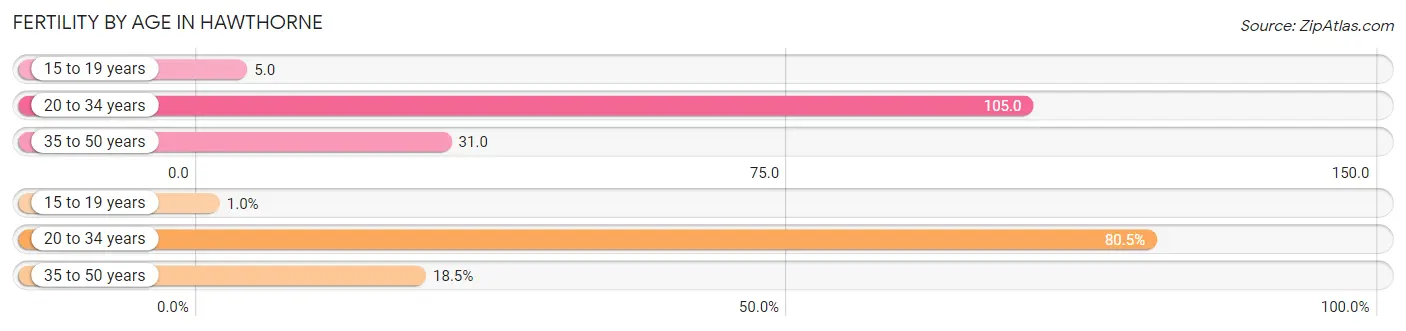
| Age Bracket | Women with Births | Births / 1,000 Women |
| 15 to 19 years | 16 (1.0%) | 5.0 |
| 20 to 34 years | 1,284 (80.5%) | 105.0 |
| 35 to 50 years | 295 (18.5%) | 31.0 |
| Total | 1,595 (100.0%) | 65.0 |
Fertility by Age by Marriage Status in Hawthorne
50.1% of women with births (1,595) in Hawthorne are married. The highest percentage of unmarried women with births falls into 15 to 19 years age bracket with 100.0% of them unmarried at the time of birth, while the lowest percentage of unmarried women with births belong to 35 to 50 years age bracket with 31.2% of them unmarried.
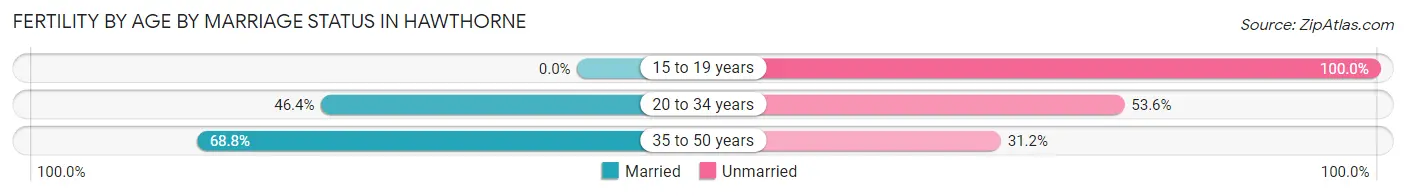
| Age Bracket | Married | Unmarried |
| 15 to 19 years | 0 (0.0%) | 16 (100.0%) |
| 20 to 34 years | 596 (46.4%) | 688 (53.6%) |
| 35 to 50 years | 203 (68.8%) | 92 (31.2%) |
| Total | 799 (50.1%) | 796 (49.9%) |
Fertility by Education in Hawthorne
Average fertility rate in Hawthorne is 65.0 births per 1,000 women. Women with the education attainment of less than high school have the highest fertility rate of 76.0 births per 1,000 women, while women with the education attainment of graduate degree have the lowest fertility at 46.0 births per 1,000 women. Women with the education attainment of college or associate's degree represent 32.4% of all women with births.
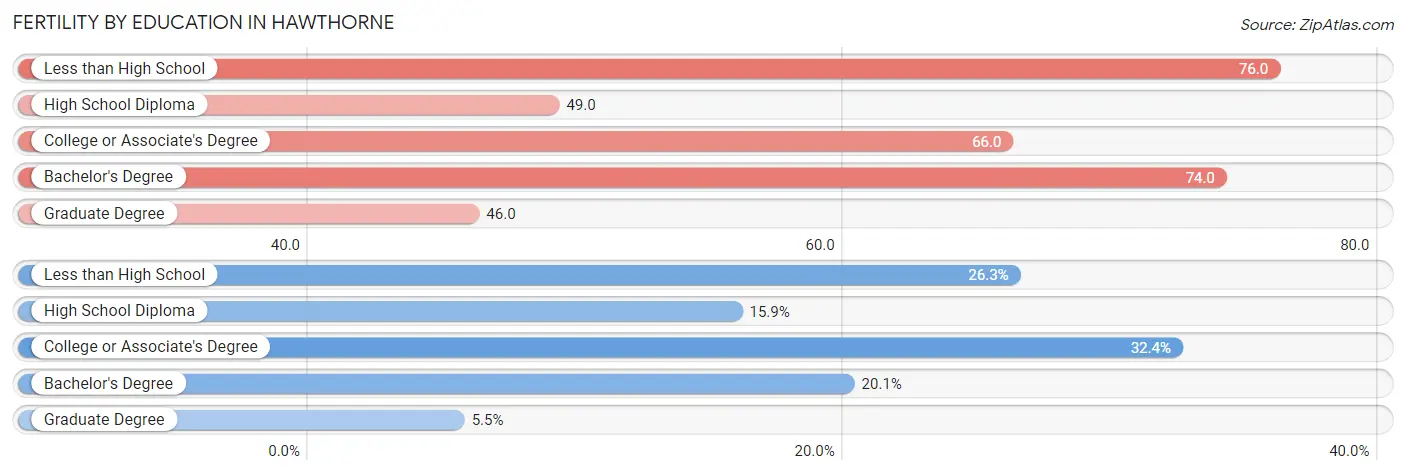
| Educational Attainment | Women with Births | Births / 1,000 Women |
| Less than High School | 419 (26.3%) | 76.0 |
| High School Diploma | 253 (15.9%) | 49.0 |
| College or Associate's Degree | 516 (32.4%) | 66.0 |
| Bachelor's Degree | 320 (20.1%) | 74.0 |
| Graduate Degree | 87 (5.4%) | 46.0 |
| Total | 1,595 (100.0%) | 65.0 |
Fertility by Education by Marriage Status in Hawthorne
49.9% of women with births in Hawthorne are unmarried. Women with the educational attainment of graduate degree are most likely to be married with 86.2% of them married at childbirth, while women with the educational attainment of less than high school are least likely to be married with 72.1% of them unmarried at childbirth.
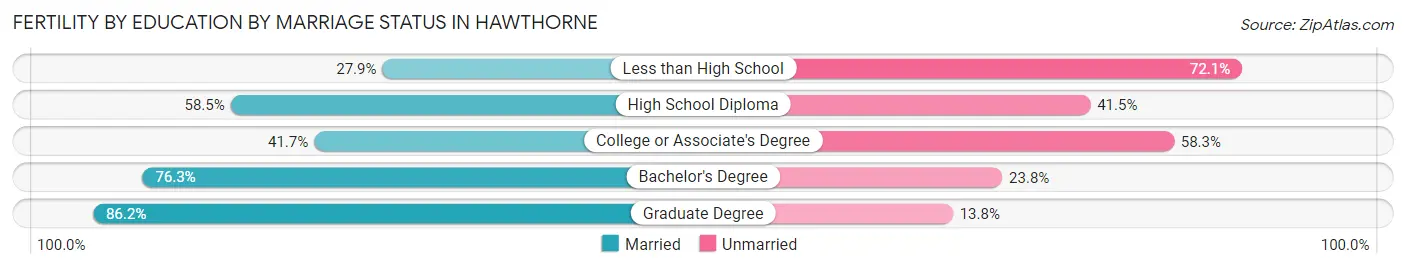
| Educational Attainment | Married | Unmarried |
| Less than High School | 117 (27.9%) | 302 (72.1%) |
| High School Diploma | 148 (58.5%) | 105 (41.5%) |
| College or Associate's Degree | 215 (41.7%) | 301 (58.3%) |
| Bachelor's Degree | 244 (76.2%) | 76 (23.7%) |
| Graduate Degree | 75 (86.2%) | 12 (13.8%) |
| Total | 799 (50.1%) | 796 (49.9%) |
Employment Characteristics in Hawthorne
Employment by Class of Employer in Hawthorne
Among the 41,772 employed individuals in Hawthorne, private company employees (29,500 | 70.6%), local government employees (3,427 | 8.2%), and self-employed (not incorporated) (3,031 | 7.3%) make up the most common classes of employment.
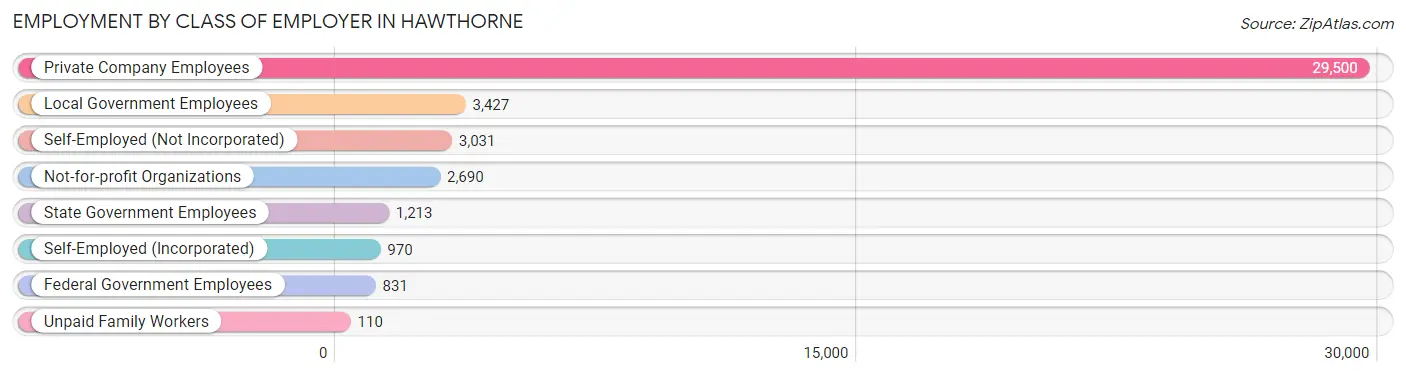
| Employer Class | # Employees | % Employees |
| Private Company Employees | 29,500 | 70.6% |
| Self-Employed (Incorporated) | 970 | 2.3% |
| Self-Employed (Not Incorporated) | 3,031 | 7.3% |
| Not-for-profit Organizations | 2,690 | 6.4% |
| Local Government Employees | 3,427 | 8.2% |
| State Government Employees | 1,213 | 2.9% |
| Federal Government Employees | 831 | 2.0% |
| Unpaid Family Workers | 110 | 0.3% |
| Total | 41,772 | 100.0% |
Employment Status by Age in Hawthorne
According to the labor force statistics for Hawthorne, out of the total population over 16 years of age (67,836), 69.3% or 47,010 individuals are in the labor force, with 7.5% or 3,526 of them unemployed. The age group with the highest labor force participation rate is 30 to 34 years, with 89.9% or 7,221 individuals in the labor force. Within the labor force, the 16 to 19 years age range has the highest percentage of unemployed individuals, with 30.0% or 352 of them being unemployed.
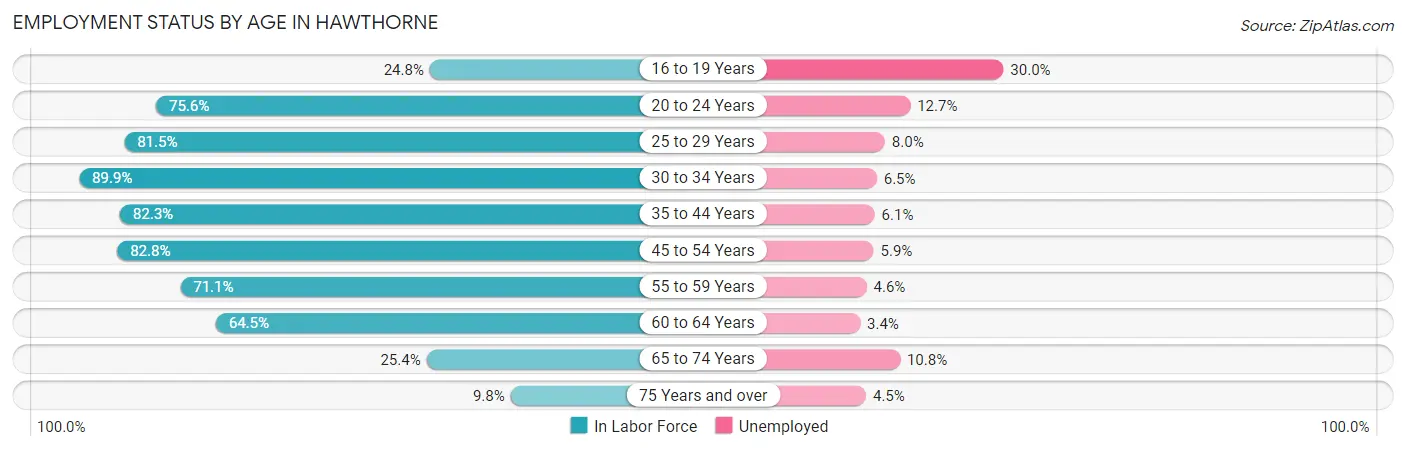
| Age Bracket | In Labor Force | Unemployed |
| 16 to 19 Years | 1,172 (24.8%) | 352 (30.0%) |
| 20 to 24 Years | 4,695 (75.6%) | 596 (12.7%) |
| 25 to 29 Years | 6,544 (81.5%) | 524 (8.0%) |
| 30 to 34 Years | 7,221 (89.9%) | 469 (6.5%) |
| 35 to 44 Years | 9,966 (82.3%) | 608 (6.1%) |
| 45 to 54 Years | 9,675 (82.8%) | 571 (5.9%) |
| 55 to 59 Years | 3,296 (71.1%) | 152 (4.6%) |
| 60 to 64 Years | 2,941 (64.5%) | 100 (3.4%) |
| 65 to 74 Years | 1,184 (25.4%) | 128 (10.8%) |
| 75 Years and over | 312 (9.8%) | 14 (4.5%) |
| Total | 47,010 (69.3%) | 3,526 (7.5%) |
Employment Status by Educational Attainment in Hawthorne
According to labor force statistics for Hawthorne, 80.8% of individuals (39,632) out of the total population between 25 and 64 years of age (49,050) are in the labor force, with 6.1% or 2,418 of them being unemployed. The group with the highest labor force participation rate are those with the educational attainment of bachelor's degree or higher, with 89.0% or 11,070 individuals in the labor force. Within the labor force, individuals with less than high school education have the highest percentage of unemployment, with 10.6% or 726 of them being unemployed.
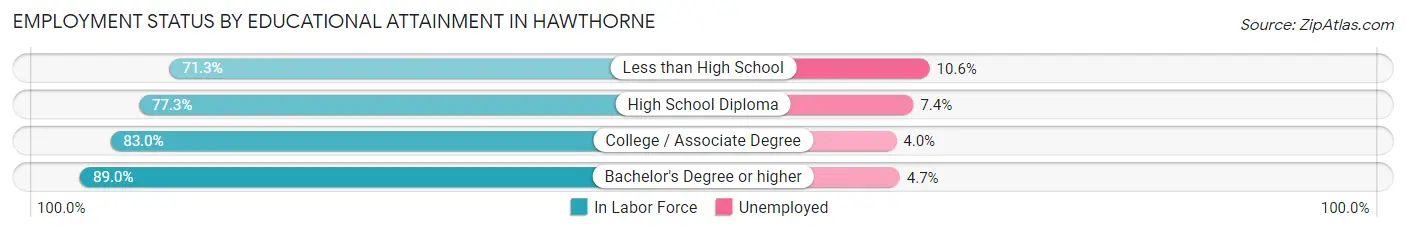
| Educational Attainment | In Labor Force | Unemployed |
| Less than High School | 6,849 (71.3%) | 1,018 (10.6%) |
| High School Diploma | 9,381 (77.3%) | 898 (7.4%) |
| College / Associate Degree | 12,342 (83.0%) | 595 (4.0%) |
| Bachelor's Degree or higher | 11,070 (89.0%) | 585 (4.7%) |
| Total | 39,632 (80.8%) | 2,992 (6.1%) |
Employment Occupations by Sex in Hawthorne
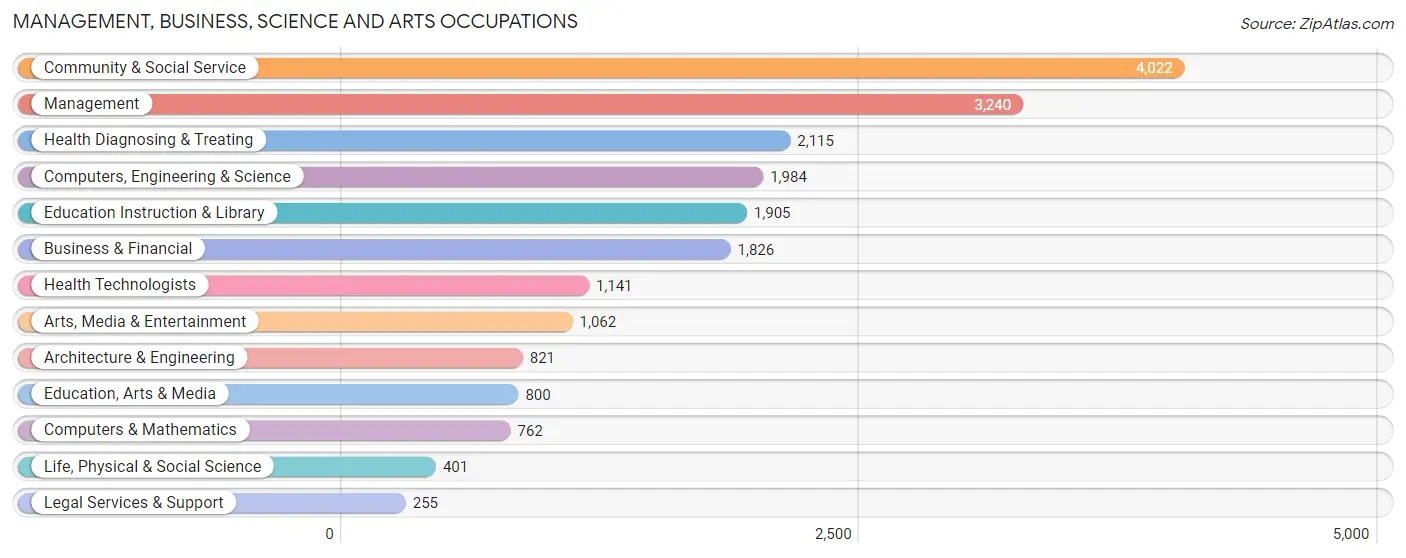
Management, Business, Science and Arts Occupations
The most common Management, Business, Science and Arts occupations in Hawthorne are Community & Social Service (4,022 | 9.3%), Management (3,240 | 7.5%), Health Diagnosing & Treating (2,115 | 4.9%), Computers, Engineering & Science (1,984 | 4.6%), and Education Instruction & Library (1,905 | 4.4%).
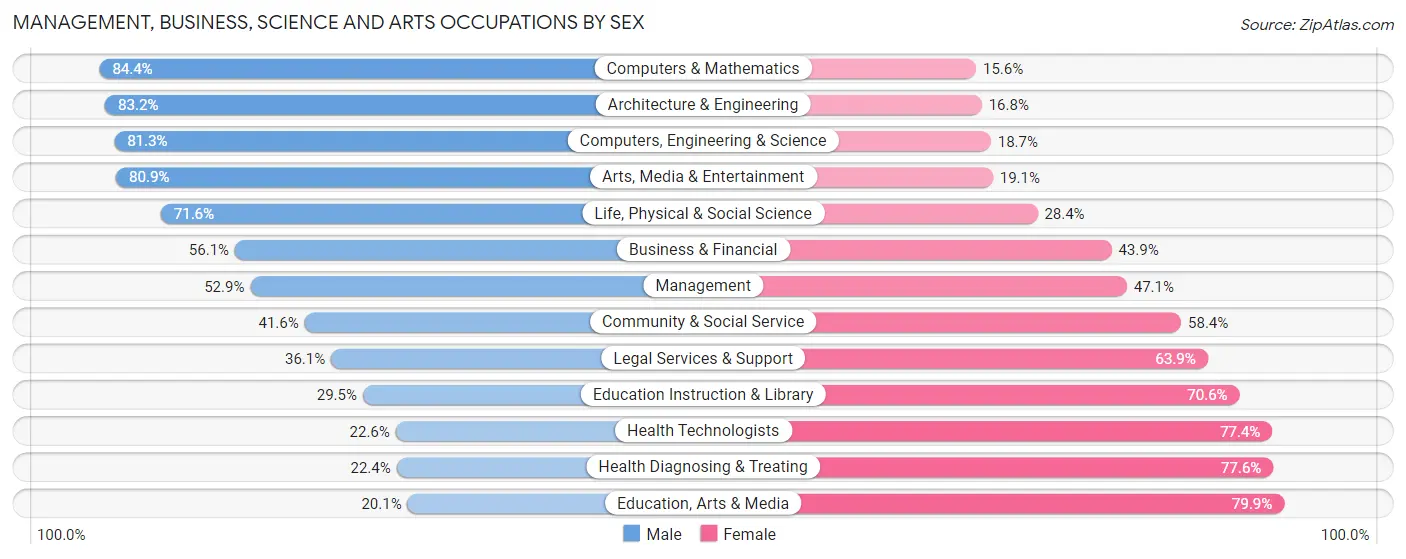
Management, Business, Science and Arts Occupations by Sex
Within the Management, Business, Science and Arts occupations in Hawthorne, the most male-oriented occupations are Computers & Mathematics (84.4%), Architecture & Engineering (83.2%), and Computers, Engineering & Science (81.3%), while the most female-oriented occupations are Education, Arts & Media (79.9%), Health Diagnosing & Treating (77.6%), and Health Technologists (77.4%).
| Occupation | Male | Female |
| Management | 1,715 (52.9%) | 1,525 (47.1%) |
| Business & Financial | 1,025 (56.1%) | 801 (43.9%) |
| Computers, Engineering & Science | 1,613 (81.3%) | 371 (18.7%) |
| Computers & Mathematics | 643 (84.4%) | 119 (15.6%) |
| Architecture & Engineering | 683 (83.2%) | 138 (16.8%) |
| Life, Physical & Social Science | 287 (71.6%) | 114 (28.4%) |
| Community & Social Service | 1,673 (41.6%) | 2,349 (58.4%) |
| Education, Arts & Media | 161 (20.1%) | 639 (79.9%) |
| Legal Services & Support | 92 (36.1%) | 163 (63.9%) |
| Education Instruction & Library | 561 (29.4%) | 1,344 (70.6%) |
| Arts, Media & Entertainment | 859 (80.9%) | 203 (19.1%) |
| Health Diagnosing & Treating | 474 (22.4%) | 1,641 (77.6%) |
| Health Technologists | 258 (22.6%) | 883 (77.4%) |
| Total (Category) | 6,500 (49.3%) | 6,687 (50.7%) |
| Total (Overall) | 22,480 (51.8%) | 20,907 (48.2%) |
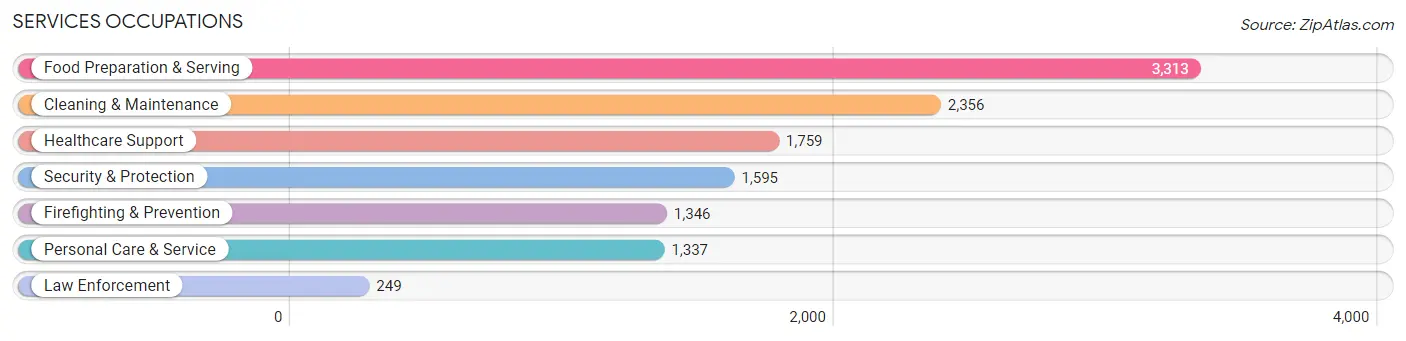
Services Occupations
The most common Services occupations in Hawthorne are Food Preparation & Serving (3,313 | 7.6%), Cleaning & Maintenance (2,356 | 5.4%), Healthcare Support (1,759 | 4.1%), Security & Protection (1,595 | 3.7%), and Firefighting & Prevention (1,346 | 3.1%).
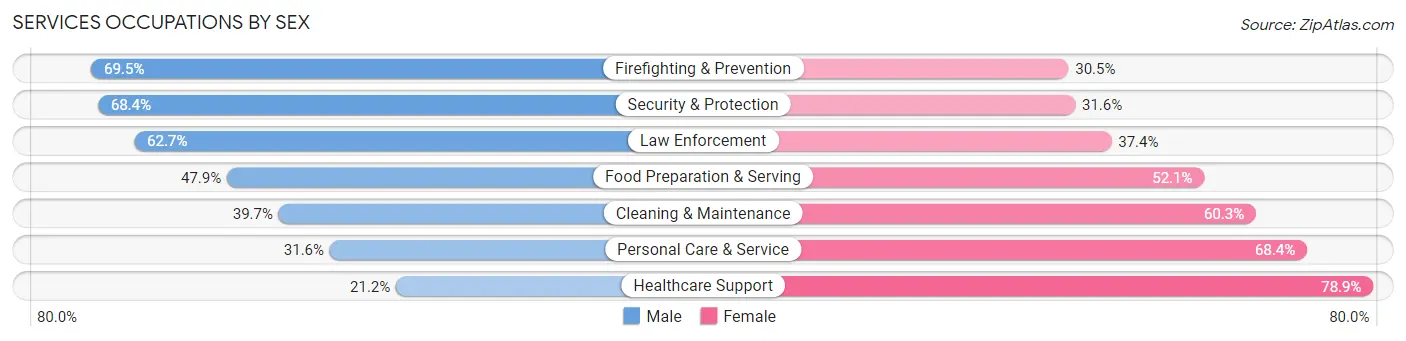
Services Occupations by Sex
Within the Services occupations in Hawthorne, the most male-oriented occupations are Firefighting & Prevention (69.5%), Security & Protection (68.4%), and Law Enforcement (62.6%), while the most female-oriented occupations are Healthcare Support (78.8%), Personal Care & Service (68.4%), and Cleaning & Maintenance (60.3%).
| Occupation | Male | Female |
| Healthcare Support | 372 (21.1%) | 1,387 (78.8%) |
| Security & Protection | 1,091 (68.4%) | 504 (31.6%) |
| Firefighting & Prevention | 935 (69.5%) | 411 (30.5%) |
| Law Enforcement | 156 (62.6%) | 93 (37.3%) |
| Food Preparation & Serving | 1,588 (47.9%) | 1,725 (52.1%) |
| Cleaning & Maintenance | 936 (39.7%) | 1,420 (60.3%) |
| Personal Care & Service | 423 (31.6%) | 914 (68.4%) |
| Total (Category) | 4,410 (42.6%) | 5,950 (57.4%) |
| Total (Overall) | 22,480 (51.8%) | 20,907 (48.2%) |
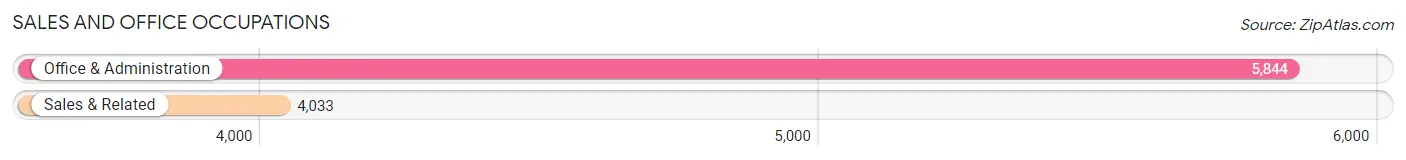
Sales and Office Occupations
The most common Sales and Office occupations in Hawthorne are Office & Administration (5,844 | 13.5%), and Sales & Related (4,033 | 9.3%).
Sales and Office Occupations by Sex
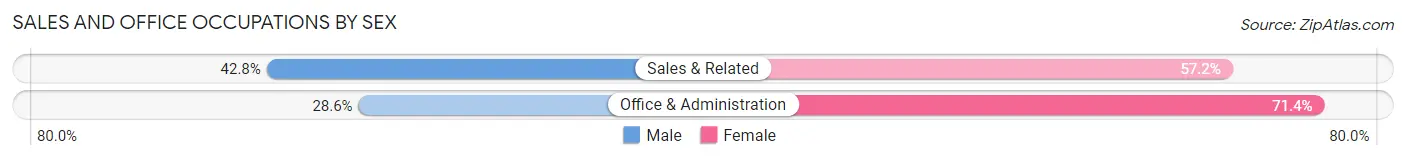
| Occupation | Male | Female |
| Sales & Related | 1,725 (42.8%) | 2,308 (57.2%) |
| Office & Administration | 1,674 (28.6%) | 4,170 (71.4%) |
| Total (Category) | 3,399 (34.4%) | 6,478 (65.6%) |
| Total (Overall) | 22,480 (51.8%) | 20,907 (48.2%) |
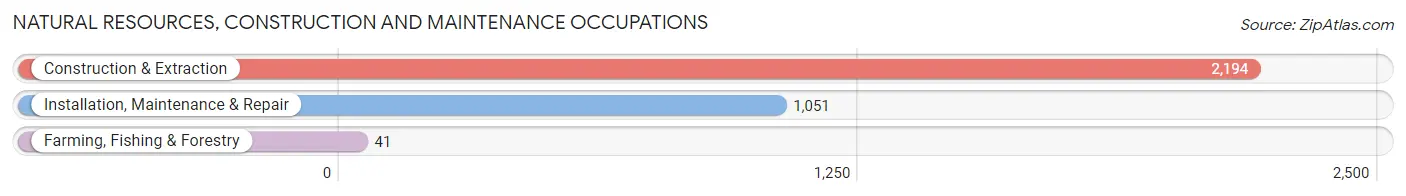
Natural Resources, Construction and Maintenance Occupations
The most common Natural Resources, Construction and Maintenance occupations in Hawthorne are Construction & Extraction (2,194 | 5.1%), Installation, Maintenance & Repair (1,051 | 2.4%), and Farming, Fishing & Forestry (41 | 0.1%).
Natural Resources, Construction and Maintenance Occupations by Sex
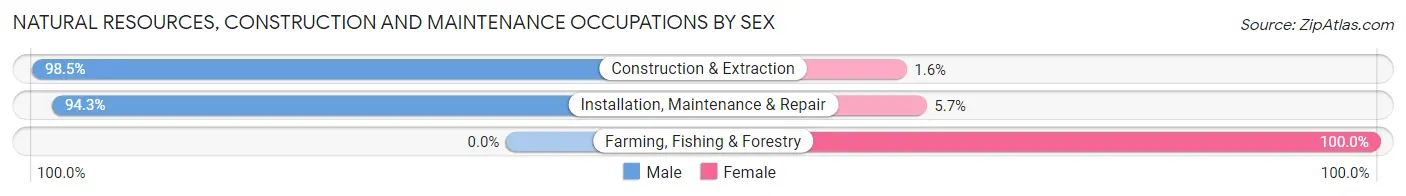
| Occupation | Male | Female |
| Farming, Fishing & Forestry | 0 (0.0%) | 41 (100.0%) |
| Construction & Extraction | 2,160 (98.5%) | 34 (1.5%) |
| Installation, Maintenance & Repair | 991 (94.3%) | 60 (5.7%) |
| Total (Category) | 3,151 (95.9%) | 135 (4.1%) |
| Total (Overall) | 22,480 (51.8%) | 20,907 (48.2%) |
Production, Transportation and Moving Occupations
The most common Production, Transportation and Moving occupations in Hawthorne are Transportation (2,658 | 6.1%), Material Moving (2,225 | 5.1%), and Production (1,794 | 4.1%).
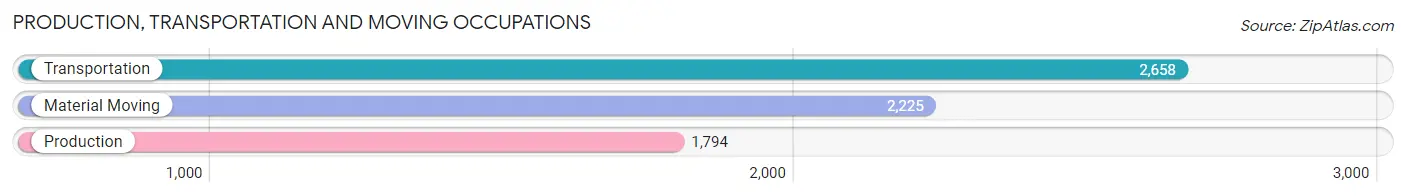
Production, Transportation and Moving Occupations by Sex
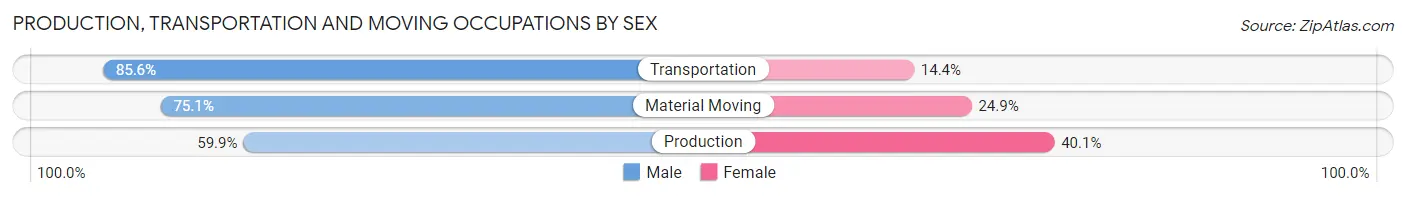
| Occupation | Male | Female |
| Production | 1,074 (59.9%) | 720 (40.1%) |
| Transportation | 2,276 (85.6%) | 382 (14.4%) |
| Material Moving | 1,670 (75.1%) | 555 (24.9%) |
| Total (Category) | 5,020 (75.2%) | 1,657 (24.8%) |
| Total (Overall) | 22,480 (51.8%) | 20,907 (48.2%) |
Employment Industries by Sex in Hawthorne
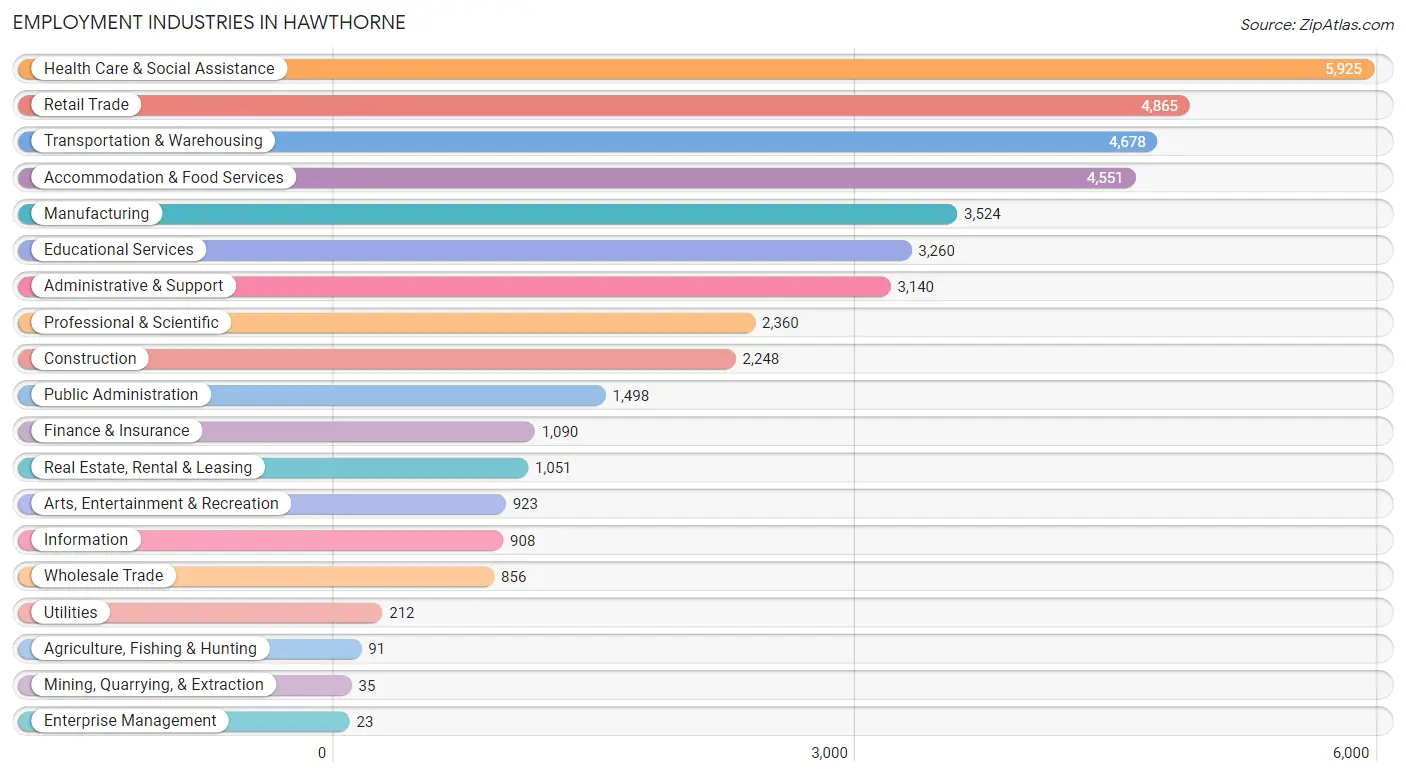
Employment Industries in Hawthorne
The major employment industries in Hawthorne include Health Care & Social Assistance (5,925 | 13.7%), Retail Trade (4,865 | 11.2%), Transportation & Warehousing (4,678 | 10.8%), Accommodation & Food Services (4,551 | 10.5%), and Manufacturing (3,524 | 8.1%).
Employment Industries by Sex in Hawthorne
The Hawthorne industries that see more men than women are Mining, Quarrying, & Extraction (100.0%), Construction (94.9%), and Utilities (92.9%), whereas the industries that tend to have a higher number of women are Health Care & Social Assistance (76.7%), Finance & Insurance (74.4%), and Agriculture, Fishing & Hunting (63.7%).
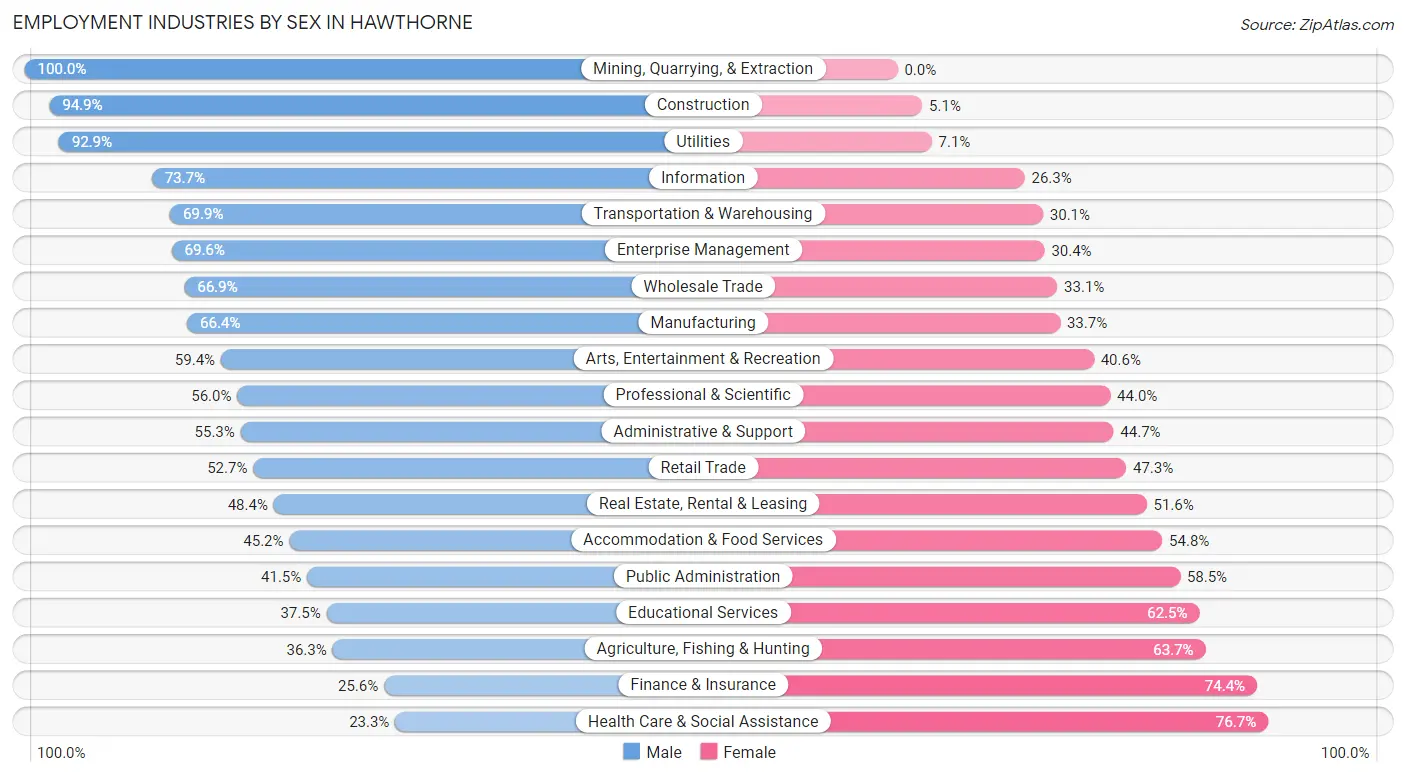
| Industry | Male | Female |
| Agriculture, Fishing & Hunting | 33 (36.3%) | 58 (63.7%) |
| Mining, Quarrying, & Extraction | 35 (100.0%) | 0 (0.0%) |
| Construction | 2,133 (94.9%) | 115 (5.1%) |
| Manufacturing | 2,338 (66.3%) | 1,186 (33.7%) |
| Wholesale Trade | 573 (66.9%) | 283 (33.1%) |
| Retail Trade | 2,563 (52.7%) | 2,302 (47.3%) |
| Transportation & Warehousing | 3,270 (69.9%) | 1,408 (30.1%) |
| Utilities | 197 (92.9%) | 15 (7.1%) |
| Information | 669 (73.7%) | 239 (26.3%) |
| Finance & Insurance | 279 (25.6%) | 811 (74.4%) |
| Real Estate, Rental & Leasing | 509 (48.4%) | 542 (51.6%) |
| Professional & Scientific | 1,321 (56.0%) | 1,039 (44.0%) |
| Enterprise Management | 16 (69.6%) | 7 (30.4%) |
| Administrative & Support | 1,736 (55.3%) | 1,404 (44.7%) |
| Educational Services | 1,223 (37.5%) | 2,037 (62.5%) |
| Health Care & Social Assistance | 1,380 (23.3%) | 4,545 (76.7%) |
| Arts, Entertainment & Recreation | 548 (59.4%) | 375 (40.6%) |
| Accommodation & Food Services | 2,057 (45.2%) | 2,494 (54.8%) |
| Public Administration | 622 (41.5%) | 876 (58.5%) |
| Total | 22,480 (51.8%) | 20,907 (48.2%) |
Education in Hawthorne
School Enrollment in Hawthorne
The most common levels of schooling among the 23,402 students in Hawthorne are college / undergraduate (5,597 | 23.9%), middle school (4,845 | 20.7%), and high school (4,836 | 20.7%).
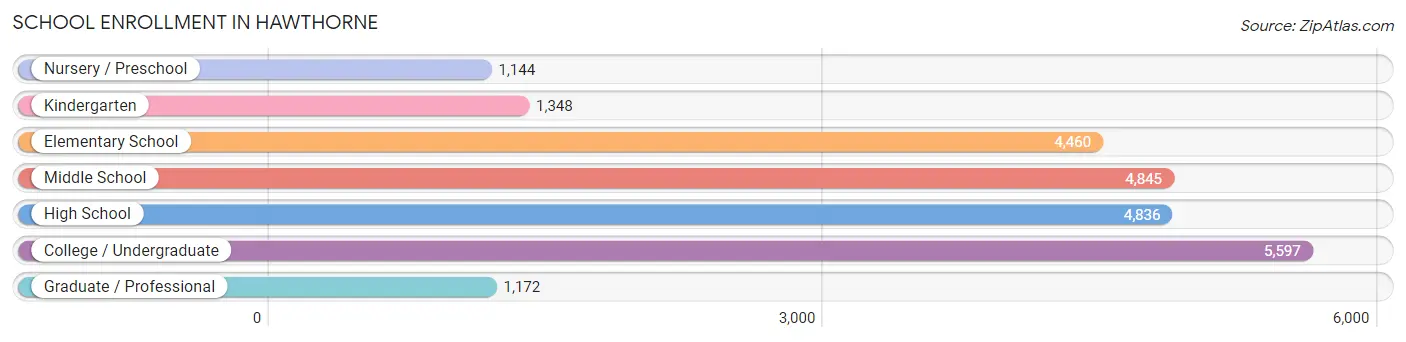
| School Level | # Students | % Students |
| Nursery / Preschool | 1,144 | 4.9% |
| Kindergarten | 1,348 | 5.8% |
| Elementary School | 4,460 | 19.1% |
| Middle School | 4,845 | 20.7% |
| High School | 4,836 | 20.7% |
| College / Undergraduate | 5,597 | 23.9% |
| Graduate / Professional | 1,172 | 5.0% |
| Total | 23,402 | 100.0% |
School Enrollment by Age by Funding Source in Hawthorne
Out of a total of 23,402 students who are enrolled in schools in Hawthorne, 2,036 (8.7%) attend a private institution, while the remaining 21,366 (91.3%) are enrolled in public schools. The age group of 25 to 34 year olds has the highest likelihood of being enrolled in private schools, with 557 (30.6% in the age bracket) enrolled. Conversely, the age group of 10 to 14 year olds has the lowest likelihood of being enrolled in a private school, with 5,957 (97.2% in the age bracket) attending a public institution.
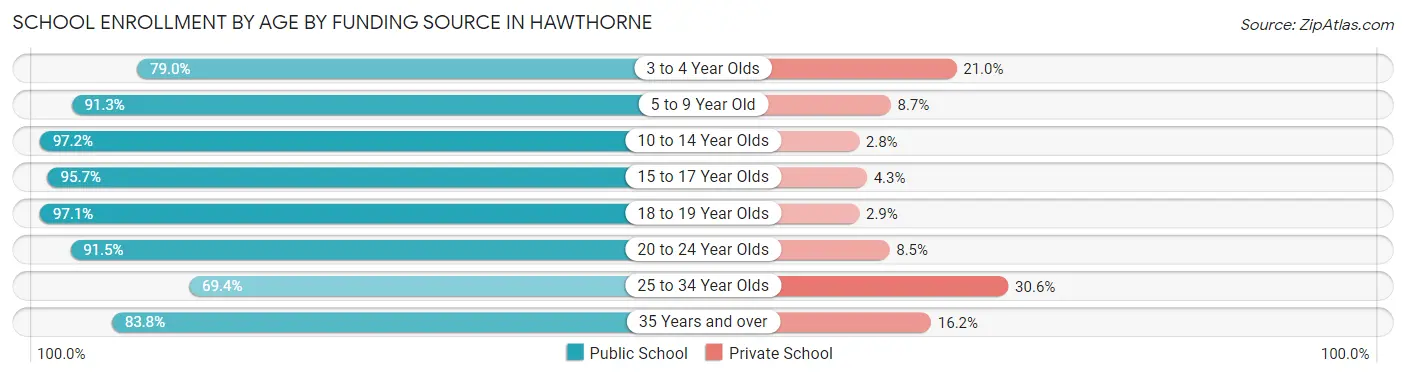
| Age Bracket | Public School | Private School |
| 3 to 4 Year Olds | 667 (79.0%) | 177 (21.0%) |
| 5 to 9 Year Old | 4,965 (91.3%) | 475 (8.7%) |
| 10 to 14 Year Olds | 5,957 (97.2%) | 173 (2.8%) |
| 15 to 17 Year Olds | 3,360 (95.7%) | 151 (4.3%) |
| 18 to 19 Year Olds | 1,631 (97.1%) | 48 (2.9%) |
| 20 to 24 Year Olds | 2,143 (91.5%) | 199 (8.5%) |
| 25 to 34 Year Olds | 1,261 (69.4%) | 557 (30.6%) |
| 35 Years and over | 1,372 (83.8%) | 266 (16.2%) |
| Total | 21,366 (91.3%) | 2,036 (8.7%) |
Educational Attainment by Field of Study in Hawthorne
Business (3,108 | 20.8%), social sciences (1,856 | 12.4%), engineering (1,233 | 8.3%), science & technology (1,084 | 7.2%), and communications (1,083 | 7.2%) are the most common fields of study among 14,954 individuals in Hawthorne who have obtained a bachelor's degree or higher.
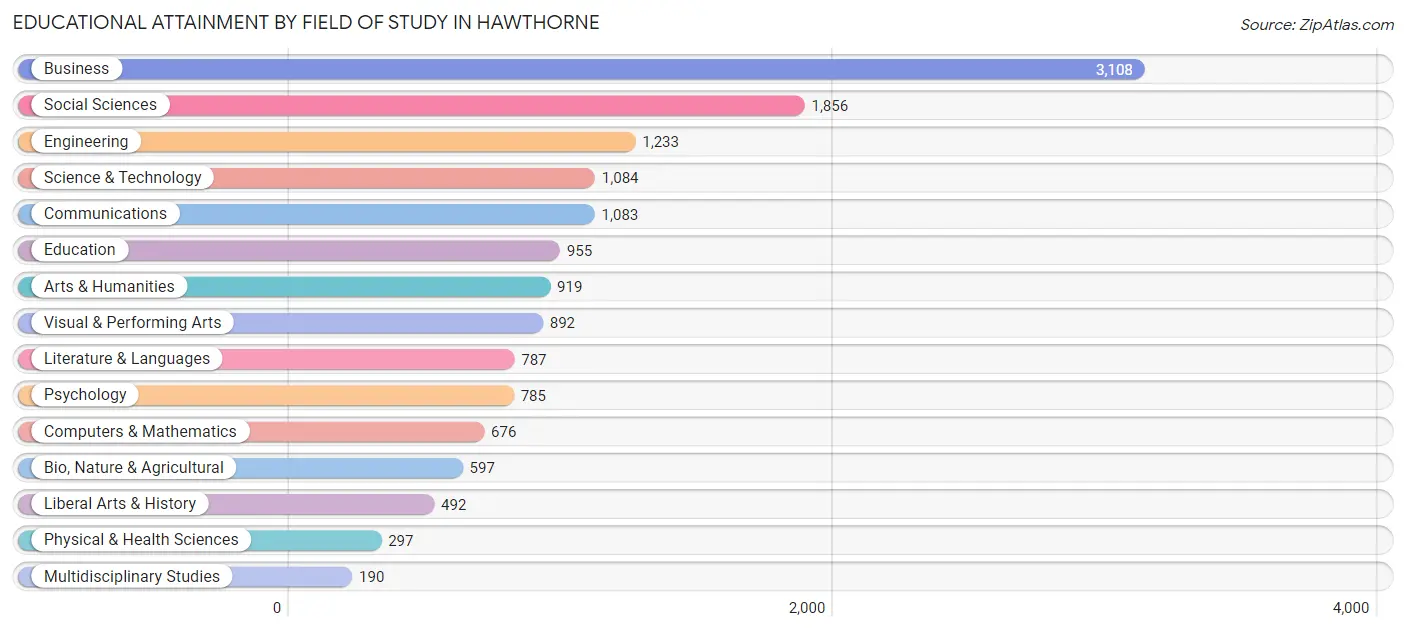
| Field of Study | # Graduates | % Graduates |
| Computers & Mathematics | 676 | 4.5% |
| Bio, Nature & Agricultural | 597 | 4.0% |
| Physical & Health Sciences | 297 | 2.0% |
| Psychology | 785 | 5.2% |
| Social Sciences | 1,856 | 12.4% |
| Engineering | 1,233 | 8.3% |
| Multidisciplinary Studies | 190 | 1.3% |
| Science & Technology | 1,084 | 7.2% |
| Business | 3,108 | 20.8% |
| Education | 955 | 6.4% |
| Literature & Languages | 787 | 5.3% |
| Liberal Arts & History | 492 | 3.3% |
| Visual & Performing Arts | 892 | 6.0% |
| Communications | 1,083 | 7.2% |
| Arts & Humanities | 919 | 6.1% |
| Total | 14,954 | 100.0% |
Transportation & Commute in Hawthorne
Vehicle Availability by Sex in Hawthorne
The most prevalent vehicle ownership categories in Hawthorne are males with 2 vehicles (8,552, accounting for 39.5%) and females with 2 vehicles (7,642, making up 42.6%).
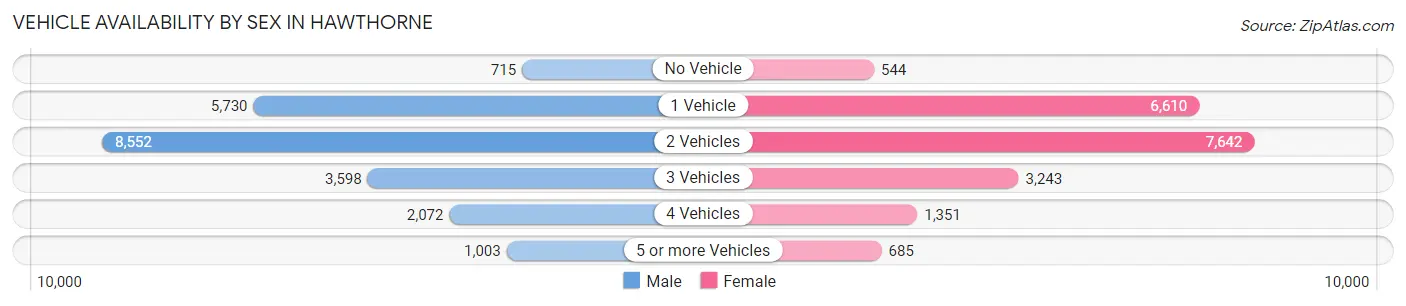
| Vehicles Available | Male | Female |
| No Vehicle | 715 (3.3%) | 544 (2.7%) |
| 1 Vehicle | 5,730 (26.4%) | 6,610 (32.9%) |
| 2 Vehicles | 8,552 (39.5%) | 7,642 (38.1%) |
| 3 Vehicles | 3,598 (16.6%) | 3,243 (16.2%) |
| 4 Vehicles | 2,072 (9.6%) | 1,351 (6.7%) |
| 5 or more Vehicles | 1,003 (4.6%) | 685 (3.4%) |
| Total | 21,670 (100.0%) | 20,075 (100.0%) |
Commute Time in Hawthorne
The most frequently occuring commute durations in Hawthorne are 20 to 24 minutes (6,425 commuters, 16.7%), 15 to 19 minutes (6,372 commuters, 16.6%), and 30 to 34 minutes (5,996 commuters, 15.6%).
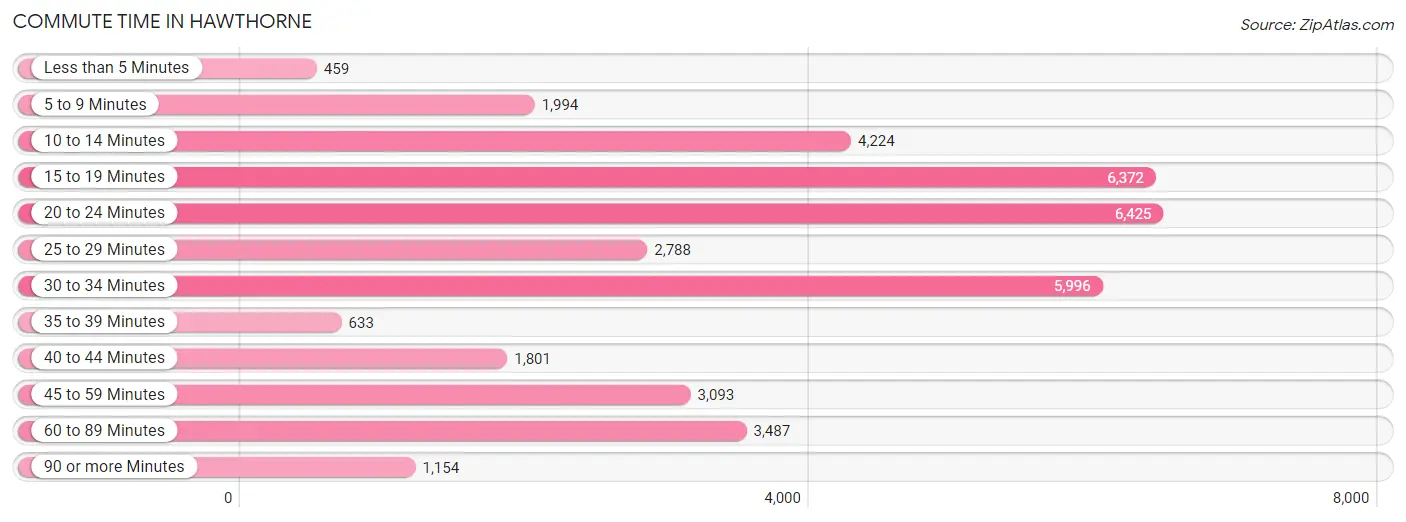
| Commute Time | # Commuters | % Commuters |
| Less than 5 Minutes | 459 | 1.2% |
| 5 to 9 Minutes | 1,994 | 5.2% |
| 10 to 14 Minutes | 4,224 | 11.0% |
| 15 to 19 Minutes | 6,372 | 16.6% |
| 20 to 24 Minutes | 6,425 | 16.7% |
| 25 to 29 Minutes | 2,788 | 7.3% |
| 30 to 34 Minutes | 5,996 | 15.6% |
| 35 to 39 Minutes | 633 | 1.7% |
| 40 to 44 Minutes | 1,801 | 4.7% |
| 45 to 59 Minutes | 3,093 | 8.1% |
| 60 to 89 Minutes | 3,487 | 9.1% |
| 90 or more Minutes | 1,154 | 3.0% |
Commute Time by Sex in Hawthorne
The most common commute times in Hawthorne are 15 to 19 minutes (3,282 commuters, 16.4%) for males and 20 to 24 minutes (3,558 commuters, 19.3%) for females.
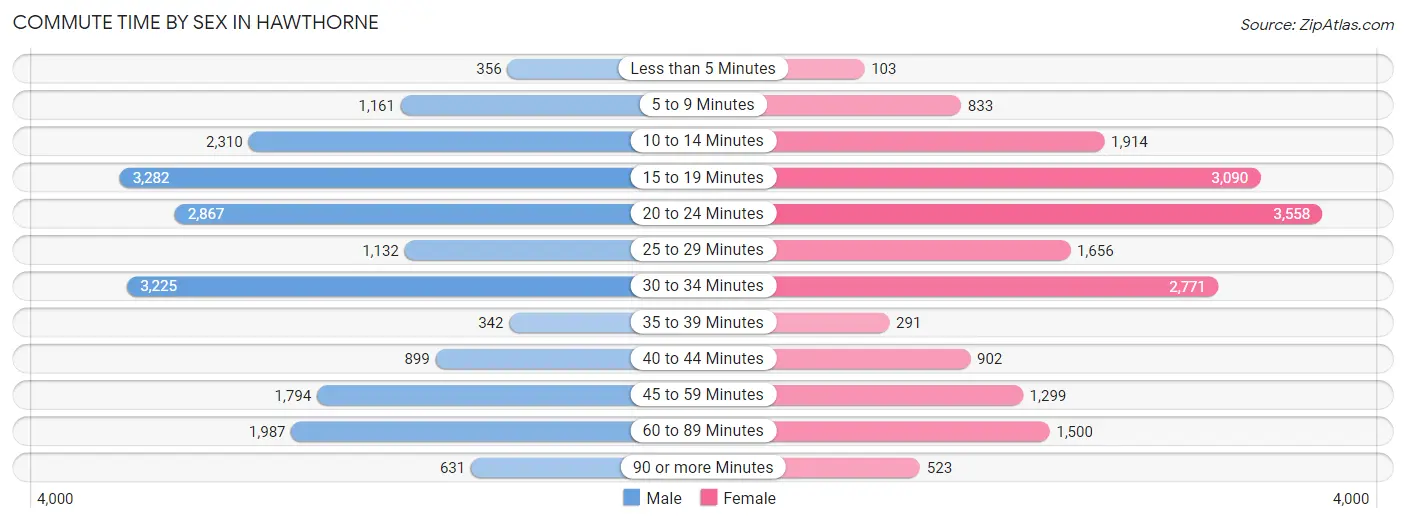
| Commute Time | Male | Female |
| Less than 5 Minutes | 356 (1.8%) | 103 (0.6%) |
| 5 to 9 Minutes | 1,161 (5.8%) | 833 (4.5%) |
| 10 to 14 Minutes | 2,310 (11.6%) | 1,914 (10.4%) |
| 15 to 19 Minutes | 3,282 (16.4%) | 3,090 (16.8%) |
| 20 to 24 Minutes | 2,867 (14.3%) | 3,558 (19.3%) |
| 25 to 29 Minutes | 1,132 (5.7%) | 1,656 (9.0%) |
| 30 to 34 Minutes | 3,225 (16.1%) | 2,771 (15.0%) |
| 35 to 39 Minutes | 342 (1.7%) | 291 (1.6%) |
| 40 to 44 Minutes | 899 (4.5%) | 902 (4.9%) |
| 45 to 59 Minutes | 1,794 (9.0%) | 1,299 (7.0%) |
| 60 to 89 Minutes | 1,987 (9.9%) | 1,500 (8.1%) |
| 90 or more Minutes | 631 (3.2%) | 523 (2.8%) |
Time of Departure to Work by Sex in Hawthorne
The most frequent times of departure to work in Hawthorne are 6:00 AM to 6:29 AM (2,261, 11.3%) for males and 7:00 AM to 7:29 AM (2,120, 11.5%) for females.
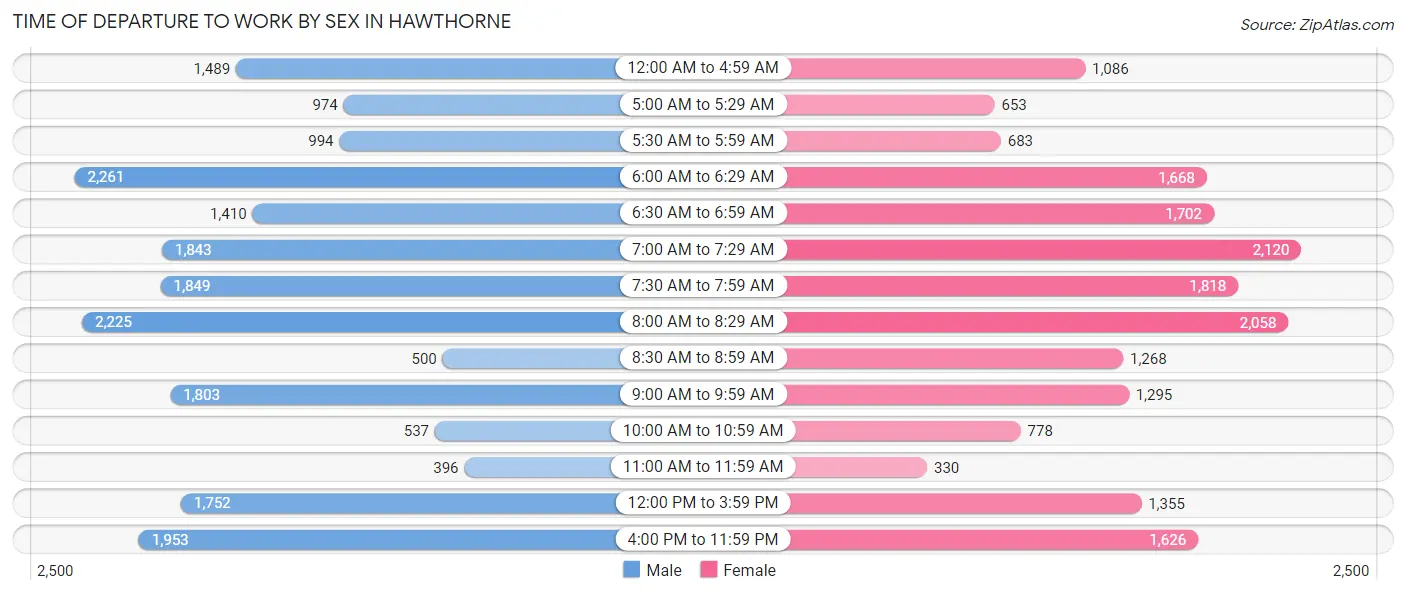
| Time of Departure | Male | Female |
| 12:00 AM to 4:59 AM | 1,489 (7.4%) | 1,086 (5.9%) |
| 5:00 AM to 5:29 AM | 974 (4.9%) | 653 (3.5%) |
| 5:30 AM to 5:59 AM | 994 (5.0%) | 683 (3.7%) |
| 6:00 AM to 6:29 AM | 2,261 (11.3%) | 1,668 (9.0%) |
| 6:30 AM to 6:59 AM | 1,410 (7.0%) | 1,702 (9.2%) |
| 7:00 AM to 7:29 AM | 1,843 (9.2%) | 2,120 (11.5%) |
| 7:30 AM to 7:59 AM | 1,849 (9.2%) | 1,818 (9.9%) |
| 8:00 AM to 8:29 AM | 2,225 (11.1%) | 2,058 (11.2%) |
| 8:30 AM to 8:59 AM | 500 (2.5%) | 1,268 (6.9%) |
| 9:00 AM to 9:59 AM | 1,803 (9.0%) | 1,295 (7.0%) |
| 10:00 AM to 10:59 AM | 537 (2.7%) | 778 (4.2%) |
| 11:00 AM to 11:59 AM | 396 (2.0%) | 330 (1.8%) |
| 12:00 PM to 3:59 PM | 1,752 (8.8%) | 1,355 (7.3%) |
| 4:00 PM to 11:59 PM | 1,953 (9.8%) | 1,626 (8.8%) |
| Total | 19,986 (100.0%) | 18,440 (100.0%) |
Housing Occupancy in Hawthorne
Occupancy by Ownership in Hawthorne
Of the total 29,292 dwellings in Hawthorne, owner-occupied units account for 8,131 (27.8%), while renter-occupied units make up 21,161 (72.2%).
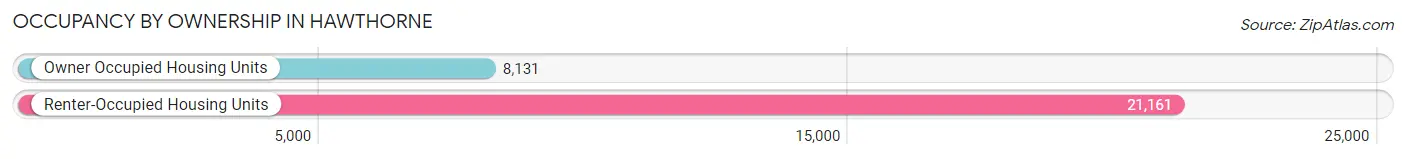
| Occupancy | # Housing Units | % Housing Units |
| Owner Occupied Housing Units | 8,131 | 27.8% |
| Renter-Occupied Housing Units | 21,161 | 72.2% |
| Total Occupied Housing Units | 29,292 | 100.0% |
Occupancy by Household Size in Hawthorne
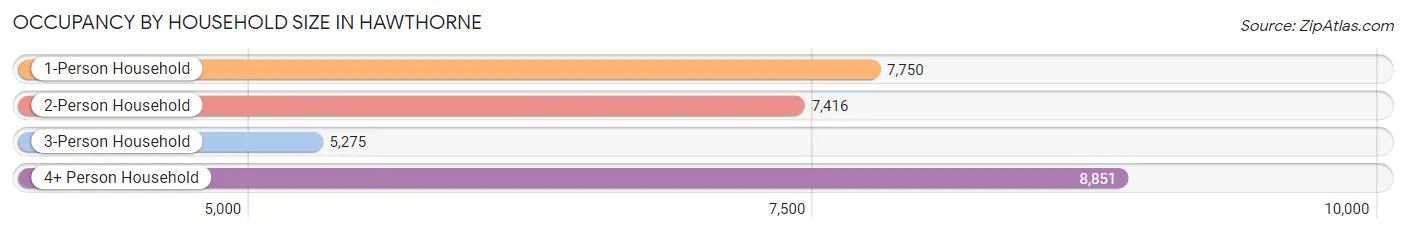
| Household Size | # Housing Units | % Housing Units |
| 1-Person Household | 7,750 | 26.5% |
| 2-Person Household | 7,416 | 25.3% |
| 3-Person Household | 5,275 | 18.0% |
| 4+ Person Household | 8,851 | 30.2% |
| Total Housing Units | 29,292 | 100.0% |
Occupancy by Ownership by Household Size in Hawthorne
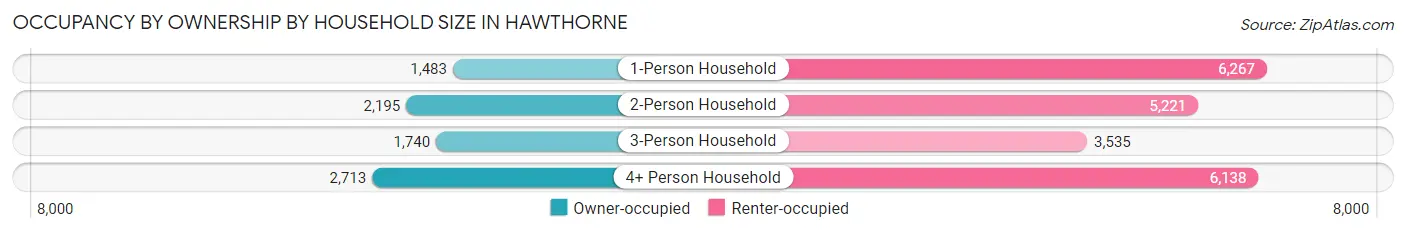
| Household Size | Owner-occupied | Renter-occupied |
| 1-Person Household | 1,483 (19.1%) | 6,267 (80.9%) |
| 2-Person Household | 2,195 (29.6%) | 5,221 (70.4%) |
| 3-Person Household | 1,740 (33.0%) | 3,535 (67.0%) |
| 4+ Person Household | 2,713 (30.6%) | 6,138 (69.4%) |
| Total Housing Units | 8,131 (27.8%) | 21,161 (72.2%) |
Occupancy by Educational Attainment in Hawthorne
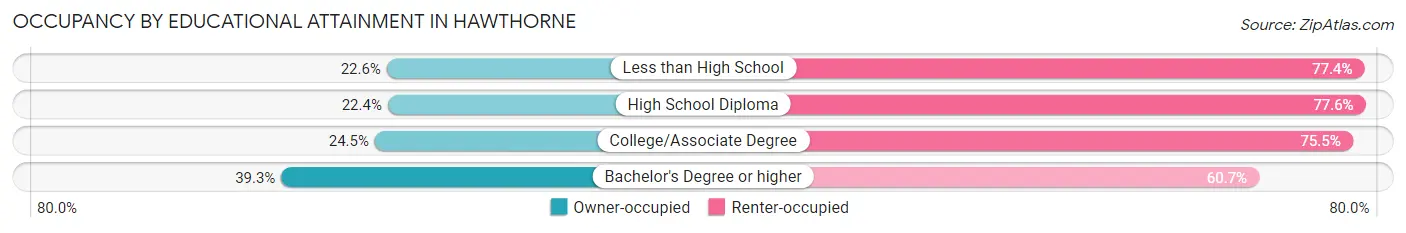
| Household Size | Owner-occupied | Renter-occupied |
| Less than High School | 1,104 (22.6%) | 3,787 (77.4%) |
| High School Diploma | 1,372 (22.4%) | 4,754 (77.6%) |
| College/Associate Degree | 2,516 (24.5%) | 7,771 (75.5%) |
| Bachelor's Degree or higher | 3,139 (39.3%) | 4,849 (60.7%) |
Occupancy by Age of Householder in Hawthorne
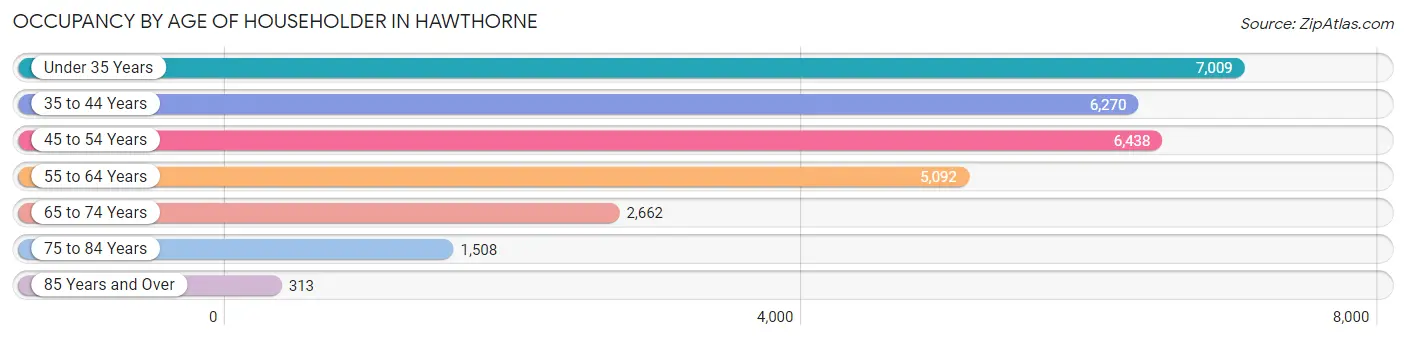
| Age Bracket | # Households | % Households |
| Under 35 Years | 7,009 | 23.9% |
| 35 to 44 Years | 6,270 | 21.4% |
| 45 to 54 Years | 6,438 | 22.0% |
| 55 to 64 Years | 5,092 | 17.4% |
| 65 to 74 Years | 2,662 | 9.1% |
| 75 to 84 Years | 1,508 | 5.1% |
| 85 Years and Over | 313 | 1.1% |
| Total | 29,292 | 100.0% |
Housing Finances in Hawthorne
Median Income by Occupancy in Hawthorne

| Occupancy Type | # Households | Median Income |
| Owner-Occupied | 8,131 (27.8%) | $111,951 |
| Renter-Occupied | 21,161 (72.2%) | $60,965 |
| Average | 29,292 (100.0%) | $72,298 |
Occupancy by Householder Income Bracket in Hawthorne
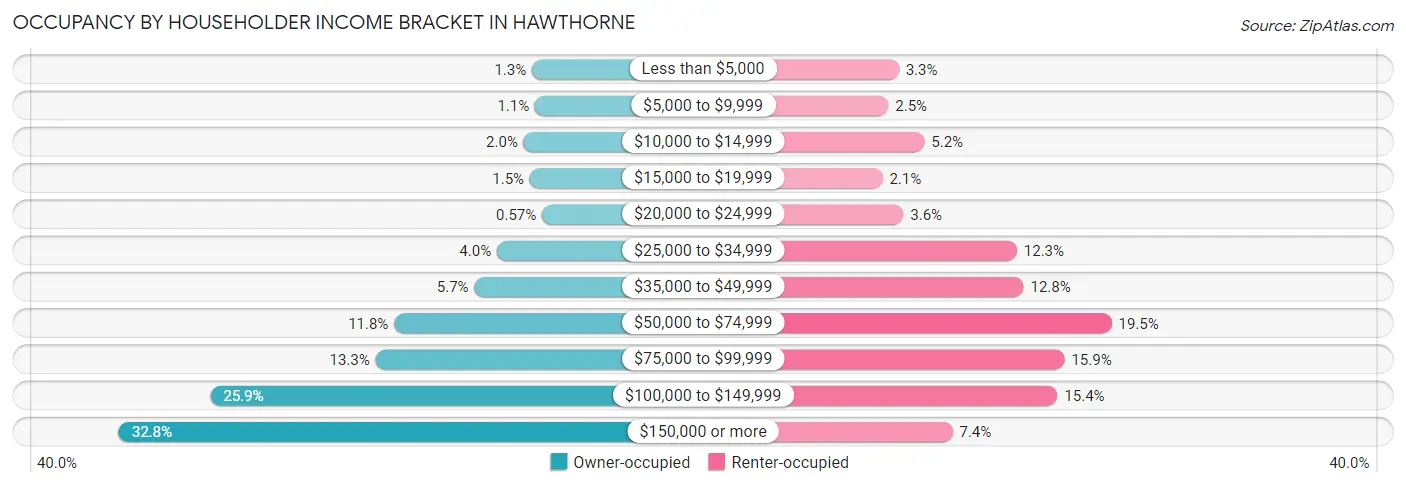
| Income Bracket | Owner-occupied | Renter-occupied |
| Less than $5,000 | 109 (1.3%) | 696 (3.3%) |
| $5,000 to $9,999 | 90 (1.1%) | 529 (2.5%) |
| $10,000 to $14,999 | 160 (2.0%) | 1,108 (5.2%) |
| $15,000 to $19,999 | 122 (1.5%) | 434 (2.1%) |
| $20,000 to $24,999 | 46 (0.6%) | 770 (3.6%) |
| $25,000 to $34,999 | 326 (4.0%) | 2,601 (12.3%) |
| $35,000 to $49,999 | 466 (5.7%) | 2,709 (12.8%) |
| $50,000 to $74,999 | 963 (11.8%) | 4,128 (19.5%) |
| $75,000 to $99,999 | 1,078 (13.3%) | 3,368 (15.9%) |
| $100,000 to $149,999 | 2,102 (25.9%) | 3,255 (15.4%) |
| $150,000 or more | 2,669 (32.8%) | 1,563 (7.4%) |
| Total | 8,131 (100.0%) | 21,161 (100.0%) |
Monthly Housing Cost Tiers in Hawthorne
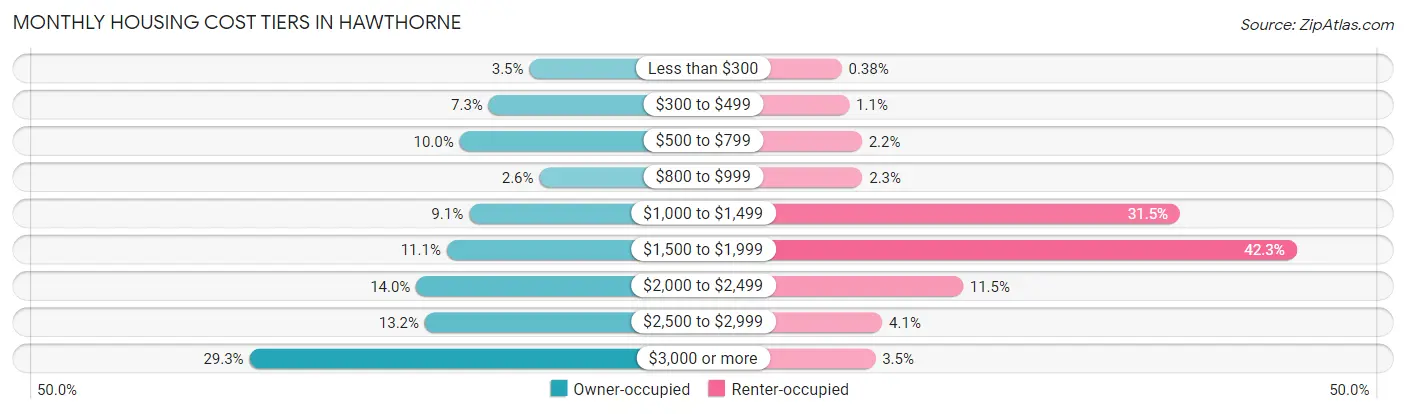
| Monthly Cost | Owner-occupied | Renter-occupied |
| Less than $300 | 287 (3.5%) | 80 (0.4%) |
| $300 to $499 | 592 (7.3%) | 229 (1.1%) |
| $500 to $799 | 810 (10.0%) | 475 (2.2%) |
| $800 to $999 | 212 (2.6%) | 485 (2.3%) |
| $1,000 to $1,499 | 739 (9.1%) | 6,673 (31.5%) |
| $1,500 to $1,999 | 906 (11.1%) | 8,943 (42.3%) |
| $2,000 to $2,499 | 1,134 (14.0%) | 2,441 (11.5%) |
| $2,500 to $2,999 | 1,069 (13.2%) | 872 (4.1%) |
| $3,000 or more | 2,382 (29.3%) | 736 (3.5%) |
| Total | 8,131 (100.0%) | 21,161 (100.0%) |
Physical Housing Characteristics in Hawthorne
Housing Structures in Hawthorne
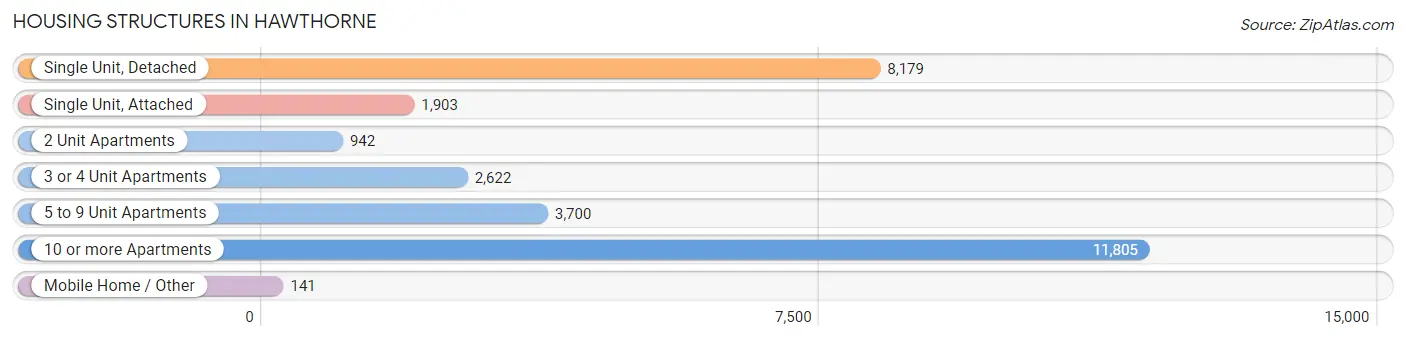
| Structure Type | # Housing Units | % Housing Units |
| Single Unit, Detached | 8,179 | 27.9% |
| Single Unit, Attached | 1,903 | 6.5% |
| 2 Unit Apartments | 942 | 3.2% |
| 3 or 4 Unit Apartments | 2,622 | 8.9% |
| 5 to 9 Unit Apartments | 3,700 | 12.6% |
| 10 or more Apartments | 11,805 | 40.3% |
| Mobile Home / Other | 141 | 0.5% |
| Total | 29,292 | 100.0% |
Housing Structures by Occupancy in Hawthorne
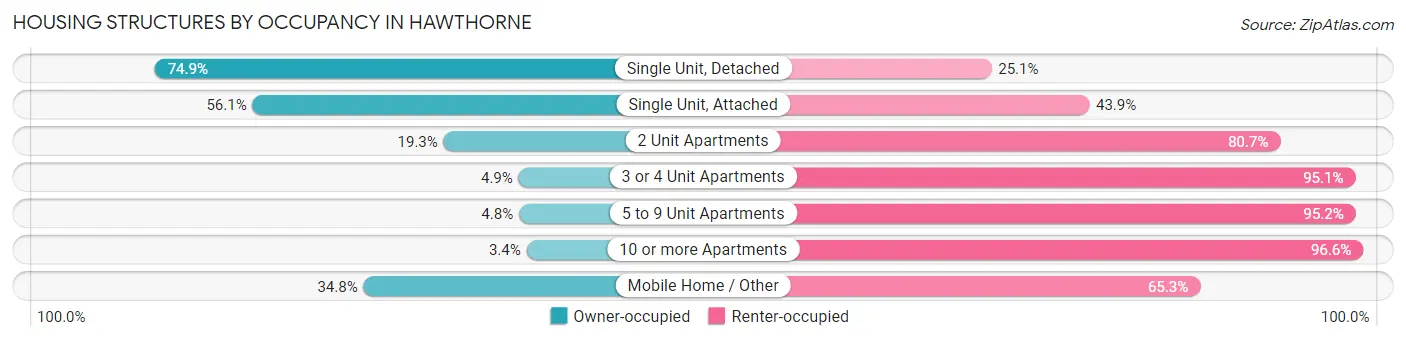
| Structure Type | Owner-occupied | Renter-occupied |
| Single Unit, Detached | 6,129 (74.9%) | 2,050 (25.1%) |
| Single Unit, Attached | 1,068 (56.1%) | 835 (43.9%) |
| 2 Unit Apartments | 182 (19.3%) | 760 (80.7%) |
| 3 or 4 Unit Apartments | 128 (4.9%) | 2,494 (95.1%) |
| 5 to 9 Unit Apartments | 178 (4.8%) | 3,522 (95.2%) |
| 10 or more Apartments | 397 (3.4%) | 11,408 (96.6%) |
| Mobile Home / Other | 49 (34.7%) | 92 (65.2%) |
| Total | 8,131 (27.8%) | 21,161 (72.2%) |
Housing Structures by Number of Rooms in Hawthorne
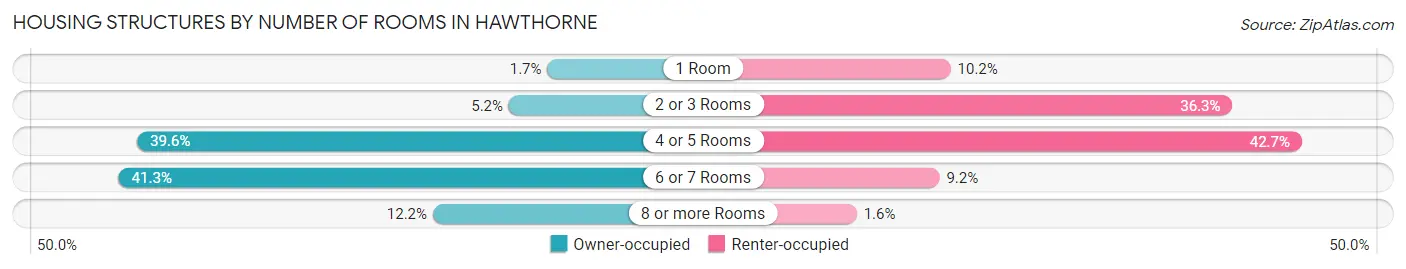
| Number of Rooms | Owner-occupied | Renter-occupied |
| 1 Room | 134 (1.7%) | 2,166 (10.2%) |
| 2 or 3 Rooms | 424 (5.2%) | 7,680 (36.3%) |
| 4 or 5 Rooms | 3,220 (39.6%) | 9,038 (42.7%) |
| 6 or 7 Rooms | 3,358 (41.3%) | 1,949 (9.2%) |
| 8 or more Rooms | 995 (12.2%) | 328 (1.5%) |
| Total | 8,131 (100.0%) | 21,161 (100.0%) |
Housing Structure by Heating Type in Hawthorne
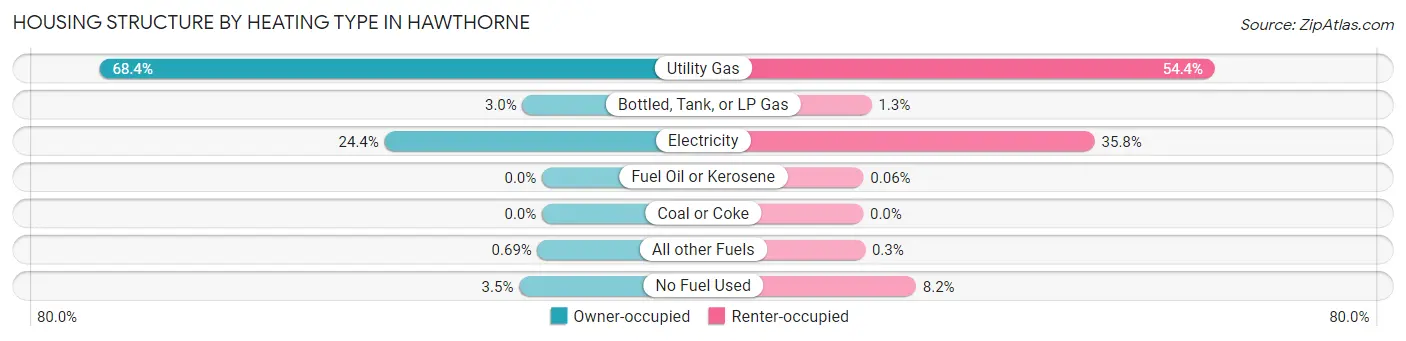
| Heating Type | Owner-occupied | Renter-occupied |
| Utility Gas | 5,563 (68.4%) | 11,507 (54.4%) |
| Bottled, Tank, or LP Gas | 245 (3.0%) | 276 (1.3%) |
| Electricity | 1,980 (24.3%) | 7,576 (35.8%) |
| Fuel Oil or Kerosene | 0 (0.0%) | 13 (0.1%) |
| Coal or Coke | 0 (0.0%) | 0 (0.0%) |
| All other Fuels | 56 (0.7%) | 63 (0.3%) |
| No Fuel Used | 287 (3.5%) | 1,726 (8.2%) |
| Total | 8,131 (100.0%) | 21,161 (100.0%) |
Household Vehicle Usage in Hawthorne
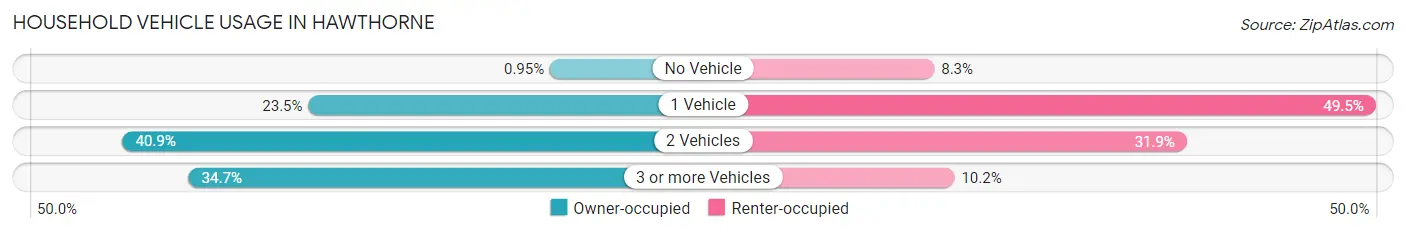
| Vehicles per Household | Owner-occupied | Renter-occupied |
| No Vehicle | 77 (0.9%) | 1,764 (8.3%) |
| 1 Vehicle | 1,912 (23.5%) | 10,483 (49.5%) |
| 2 Vehicles | 3,322 (40.9%) | 6,750 (31.9%) |
| 3 or more Vehicles | 2,820 (34.7%) | 2,164 (10.2%) |
| Total | 8,131 (100.0%) | 21,161 (100.0%) |
Real Estate & Mortgages in Hawthorne
Real Estate and Mortgage Overview in Hawthorne
| Characteristic | Without Mortgage | With Mortgage |
| Housing Units | 2,165 | 5,966 |
| Median Property Value | $720,700 | $734,500 |
| Median Household Income | $86,250 | $2,141 |
| Monthly Housing Costs | $589 | $2,382 |
| Real Estate Taxes | $3,570 | $114 |
Property Value by Mortgage Status in Hawthorne
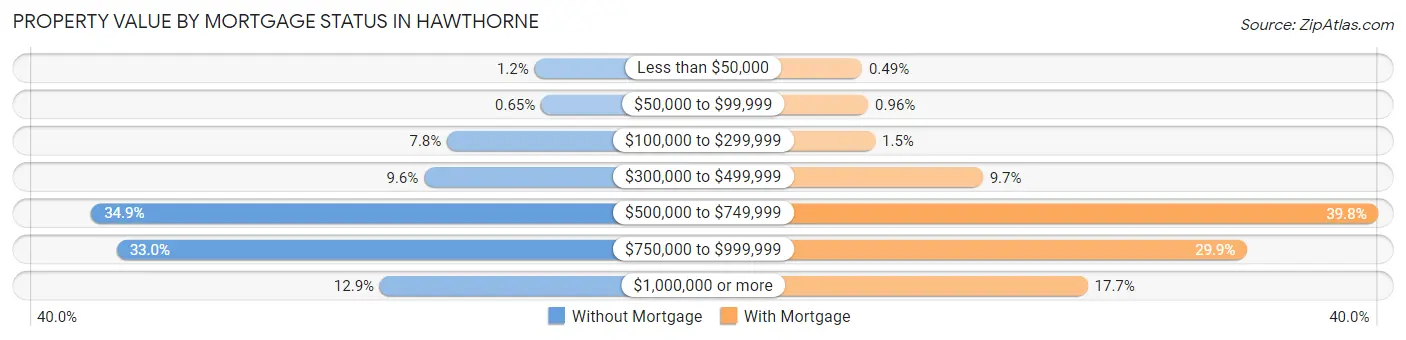
| Property Value | Without Mortgage | With Mortgage |
| Less than $50,000 | 25 (1.1%) | 29 (0.5%) |
| $50,000 to $99,999 | 14 (0.6%) | 57 (1.0%) |
| $100,000 to $299,999 | 169 (7.8%) | 89 (1.5%) |
| $300,000 to $499,999 | 207 (9.6%) | 578 (9.7%) |
| $500,000 to $749,999 | 756 (34.9%) | 2,377 (39.8%) |
| $750,000 to $999,999 | 714 (33.0%) | 1,781 (29.8%) |
| $1,000,000 or more | 280 (12.9%) | 1,055 (17.7%) |
| Total | 2,165 (100.0%) | 5,966 (100.0%) |
Household Income by Mortgage Status in Hawthorne
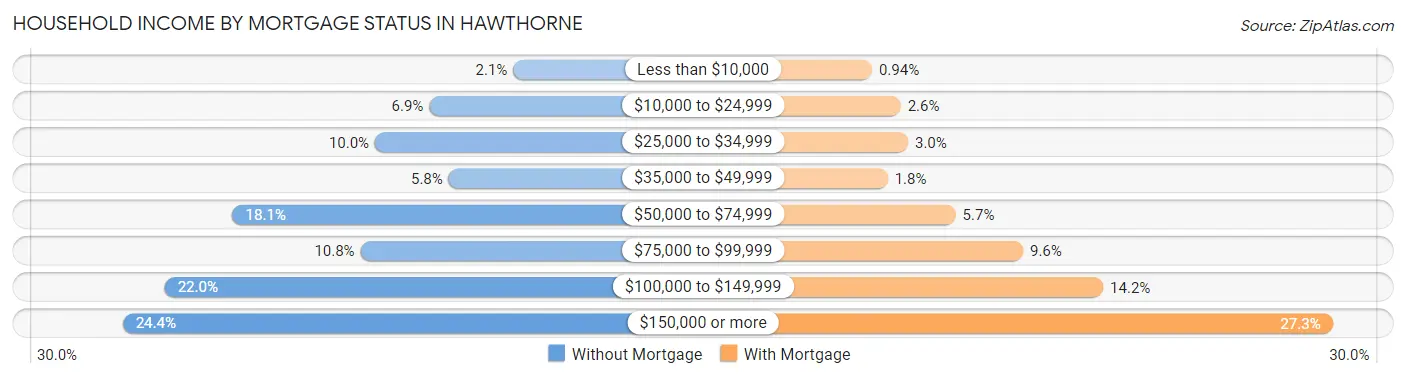
| Household Income | Without Mortgage | With Mortgage |
| Less than $10,000 | 45 (2.1%) | 56 (0.9%) |
| $10,000 to $24,999 | 149 (6.9%) | 154 (2.6%) |
| $25,000 to $34,999 | 216 (10.0%) | 179 (3.0%) |
| $35,000 to $49,999 | 125 (5.8%) | 110 (1.8%) |
| $50,000 to $74,999 | 392 (18.1%) | 341 (5.7%) |
| $75,000 to $99,999 | 234 (10.8%) | 571 (9.6%) |
| $100,000 to $149,999 | 476 (22.0%) | 844 (14.1%) |
| $150,000 or more | 528 (24.4%) | 1,626 (27.3%) |
| Total | 2,165 (100.0%) | 5,966 (100.0%) |
Property Value to Household Income Ratio in Hawthorne
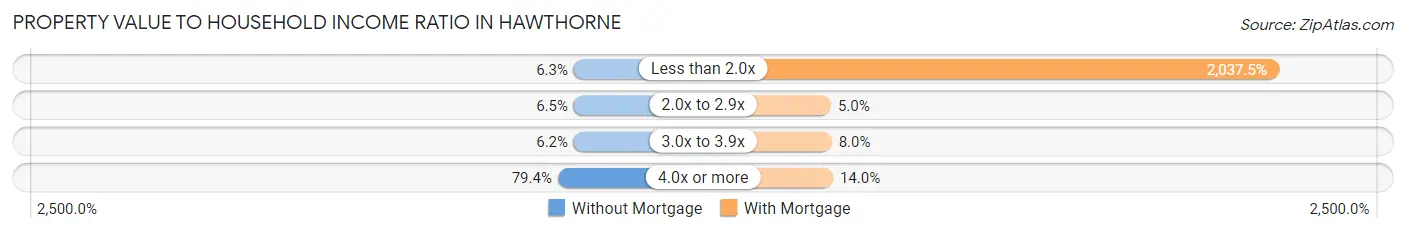
| Value-to-Income Ratio | Without Mortgage | With Mortgage |
| Less than 2.0x | 137 (6.3%) | 121,559 (2,037.5%) |
| 2.0x to 2.9x | 141 (6.5%) | 296 (5.0%) |
| 3.0x to 3.9x | 134 (6.2%) | 479 (8.0%) |
| 4.0x or more | 1,718 (79.3%) | 834 (14.0%) |
| Total | 2,165 (100.0%) | 5,966 (100.0%) |
Real Estate Taxes by Mortgage Status in Hawthorne
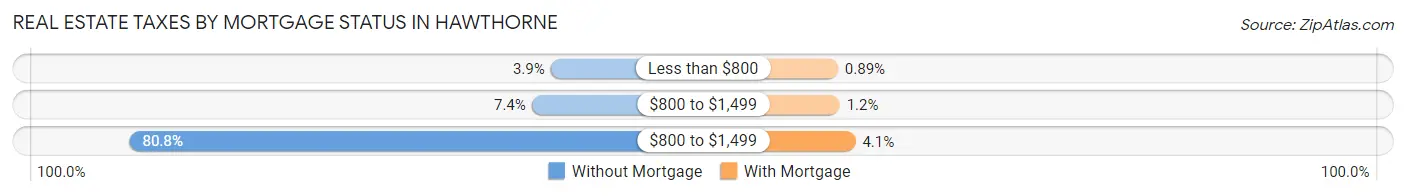
| Property Taxes | Without Mortgage | With Mortgage |
| Less than $800 | 85 (3.9%) | 53 (0.9%) |
| $800 to $1,499 | 160 (7.4%) | 73 (1.2%) |
| $800 to $1,499 | 1,750 (80.8%) | 244 (4.1%) |
| Total | 2,165 (100.0%) | 5,966 (100.0%) |
Health & Disability in Hawthorne
Health Insurance Coverage by Age in Hawthorne
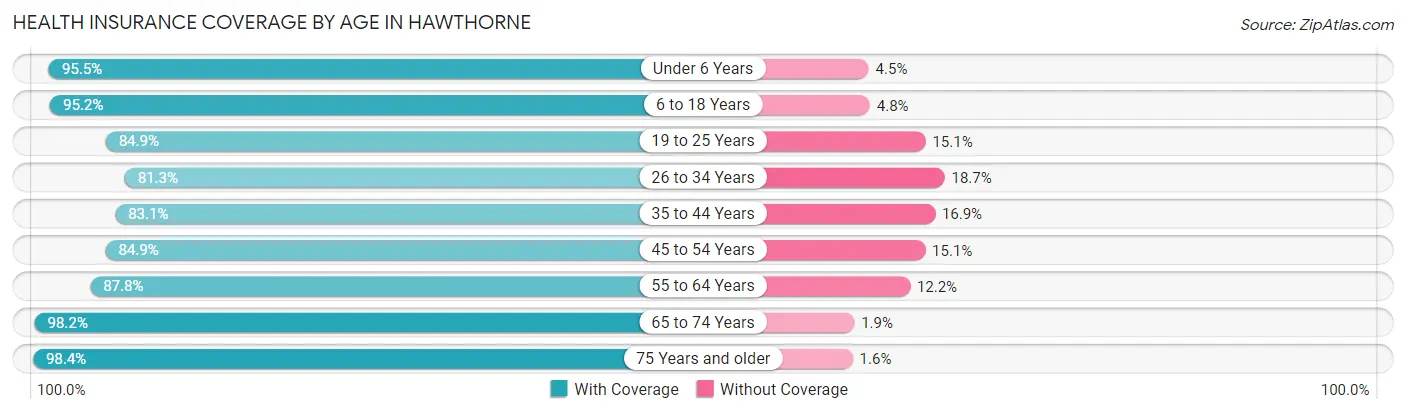
| Age Bracket | With Coverage | Without Coverage |
| Under 6 Years | 6,637 (95.5%) | 316 (4.5%) |
| 6 to 18 Years | 15,326 (95.2%) | 766 (4.8%) |
| 19 to 25 Years | 7,133 (84.9%) | 1,273 (15.1%) |
| 26 to 34 Years | 11,874 (81.3%) | 2,730 (18.7%) |
| 35 to 44 Years | 10,037 (83.1%) | 2,041 (16.9%) |
| 45 to 54 Years | 9,908 (84.9%) | 1,760 (15.1%) |
| 55 to 64 Years | 8,006 (87.8%) | 1,117 (12.2%) |
| 65 to 74 Years | 4,521 (98.2%) | 85 (1.8%) |
| 75 Years and older | 2,909 (98.4%) | 46 (1.6%) |
| Total | 76,351 (88.3%) | 10,134 (11.7%) |
Health Insurance Coverage by Citizenship Status in Hawthorne
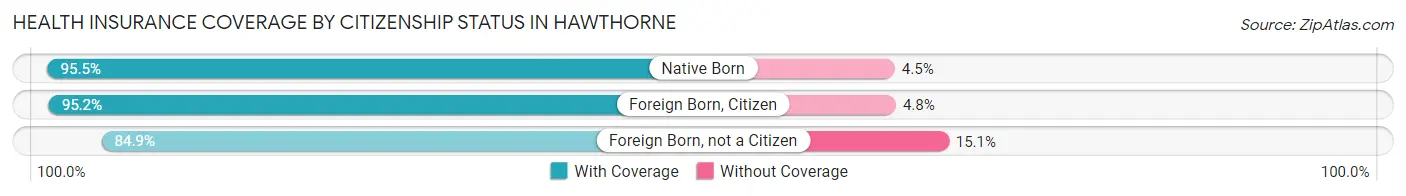
| Citizenship Status | With Coverage | Without Coverage |
| Native Born | 6,637 (95.5%) | 316 (4.5%) |
| Foreign Born, Citizen | 15,326 (95.2%) | 766 (4.8%) |
| Foreign Born, not a Citizen | 7,133 (84.9%) | 1,273 (15.1%) |
Health Insurance Coverage by Household Income in Hawthorne
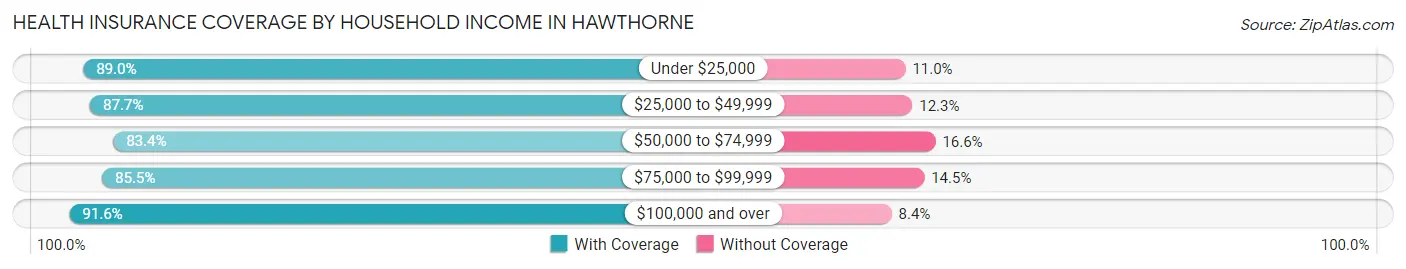
| Household Income | With Coverage | Without Coverage |
| Under $25,000 | 7,332 (89.0%) | 905 (11.0%) |
| $25,000 to $49,999 | 14,496 (87.7%) | 2,030 (12.3%) |
| $50,000 to $74,999 | 11,866 (83.4%) | 2,363 (16.6%) |
| $75,000 to $99,999 | 11,750 (85.5%) | 1,995 (14.5%) |
| $100,000 and over | 30,546 (91.6%) | 2,800 (8.4%) |
Public vs Private Health Insurance Coverage by Age in Hawthorne
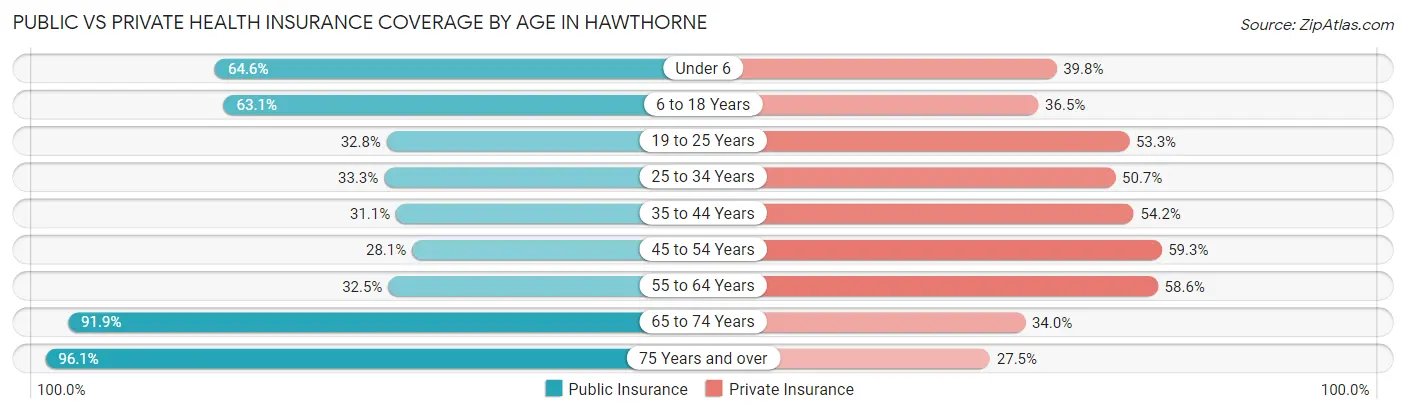
| Age Bracket | Public Insurance | Private Insurance |
| Under 6 | 4,494 (64.6%) | 2,767 (39.8%) |
| 6 to 18 Years | 10,146 (63.0%) | 5,866 (36.4%) |
| 19 to 25 Years | 2,756 (32.8%) | 4,480 (53.3%) |
| 25 to 34 Years | 4,859 (33.3%) | 7,408 (50.7%) |
| 35 to 44 Years | 3,750 (31.0%) | 6,543 (54.2%) |
| 45 to 54 Years | 3,278 (28.1%) | 6,918 (59.3%) |
| 55 to 64 Years | 2,966 (32.5%) | 5,349 (58.6%) |
| 65 to 74 Years | 4,234 (91.9%) | 1,566 (34.0%) |
| 75 Years and over | 2,841 (96.1%) | 812 (27.5%) |
| Total | 39,324 (45.5%) | 41,709 (48.2%) |
Disability Status by Sex by Age in Hawthorne
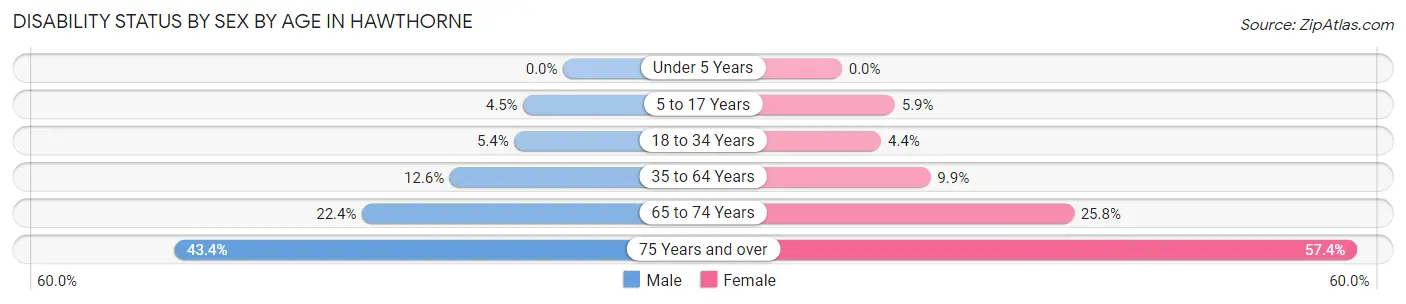
| Age Bracket | Male | Female |
| Under 5 Years | 0 (0.0%) | 0 (0.0%) |
| 5 to 17 Years | 353 (4.4%) | 460 (5.9%) |
| 18 to 34 Years | 606 (5.4%) | 583 (4.4%) |
| 35 to 64 Years | 2,067 (12.6%) | 1,626 (9.9%) |
| 65 to 74 Years | 486 (22.4%) | 629 (25.8%) |
| 75 Years and over | 518 (43.3%) | 1,010 (57.4%) |
Disability Class by Sex by Age in Hawthorne
Disability Class: Hearing Difficulty
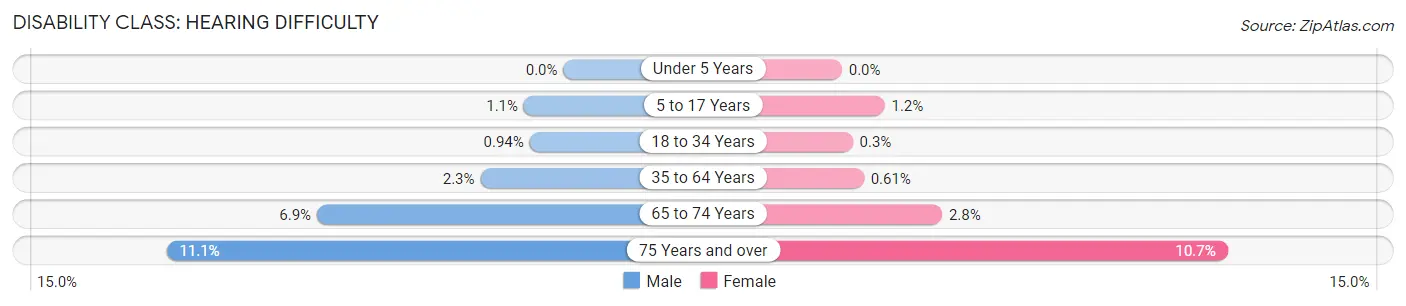
| Age Bracket | Male | Female |
| Under 5 Years | 0 (0.0%) | 0 (0.0%) |
| 5 to 17 Years | 87 (1.1%) | 93 (1.2%) |
| 18 to 34 Years | 105 (0.9%) | 40 (0.3%) |
| 35 to 64 Years | 379 (2.3%) | 101 (0.6%) |
| 65 to 74 Years | 149 (6.9%) | 68 (2.8%) |
| 75 Years and over | 132 (11.1%) | 189 (10.7%) |
Disability Class: Vision Difficulty
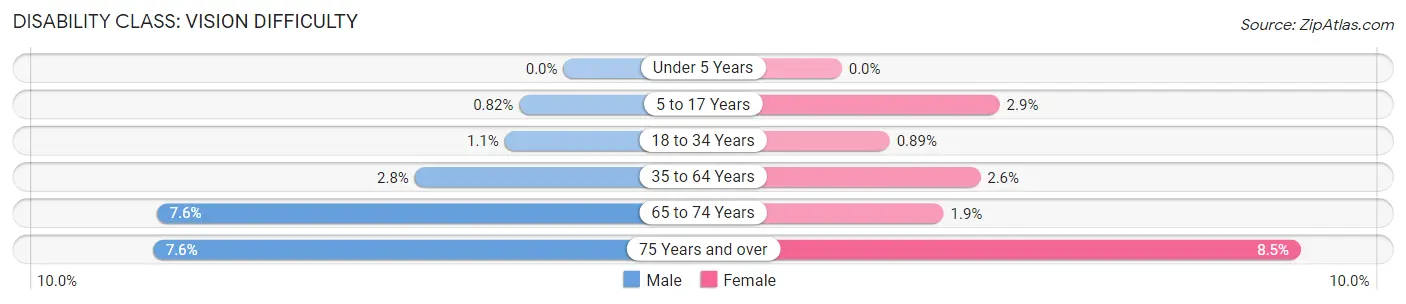
| Age Bracket | Male | Female |
| Under 5 Years | 0 (0.0%) | 0 (0.0%) |
| 5 to 17 Years | 65 (0.8%) | 228 (2.9%) |
| 18 to 34 Years | 121 (1.1%) | 119 (0.9%) |
| 35 to 64 Years | 453 (2.8%) | 424 (2.6%) |
| 65 to 74 Years | 164 (7.5%) | 46 (1.9%) |
| 75 Years and over | 91 (7.6%) | 150 (8.5%) |
Disability Class: Cognitive Difficulty
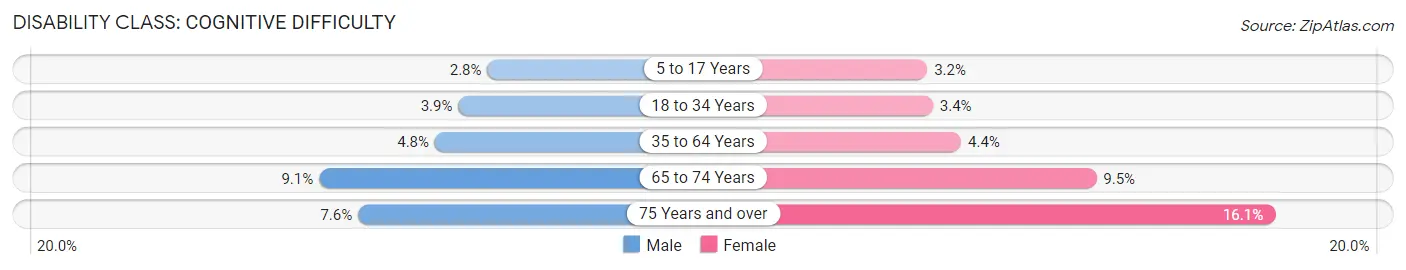
| Age Bracket | Male | Female |
| 5 to 17 Years | 224 (2.8%) | 247 (3.2%) |
| 18 to 34 Years | 435 (3.9%) | 450 (3.4%) |
| 35 to 64 Years | 782 (4.8%) | 730 (4.4%) |
| 65 to 74 Years | 197 (9.1%) | 230 (9.5%) |
| 75 Years and over | 91 (7.6%) | 283 (16.1%) |
Disability Class: Ambulatory Difficulty
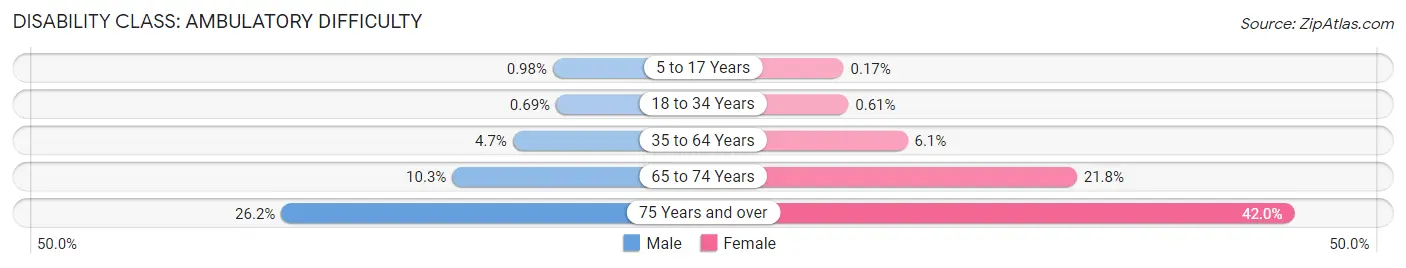
| Age Bracket | Male | Female |
| 5 to 17 Years | 78 (1.0%) | 13 (0.2%) |
| 18 to 34 Years | 77 (0.7%) | 81 (0.6%) |
| 35 to 64 Years | 770 (4.7%) | 1,005 (6.1%) |
| 65 to 74 Years | 224 (10.3%) | 531 (21.8%) |
| 75 Years and over | 313 (26.2%) | 739 (42.0%) |
Disability Class: Self-Care Difficulty
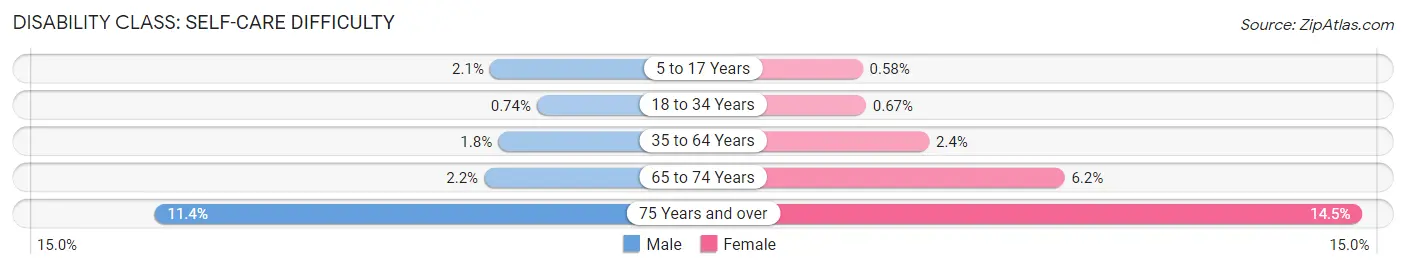
| Age Bracket | Male | Female |
| 5 to 17 Years | 163 (2.1%) | 45 (0.6%) |
| 18 to 34 Years | 83 (0.7%) | 89 (0.7%) |
| 35 to 64 Years | 299 (1.8%) | 400 (2.4%) |
| 65 to 74 Years | 48 (2.2%) | 151 (6.2%) |
| 75 Years and over | 136 (11.4%) | 255 (14.5%) |
Technology Access in Hawthorne
Computing Device Access in Hawthorne
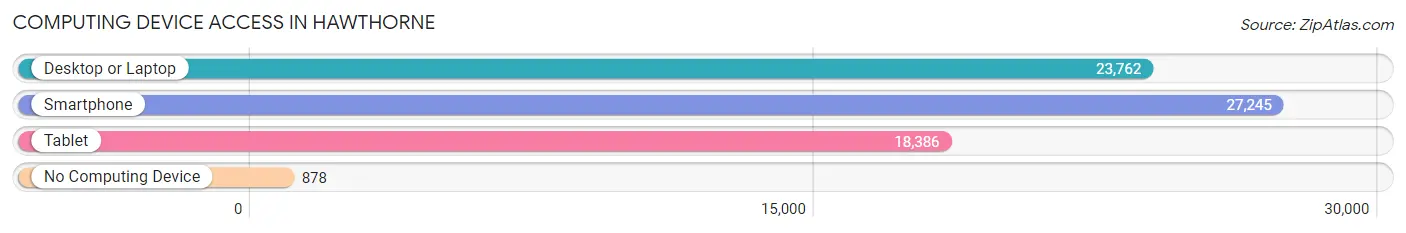
| Device Type | # Households | % Households |
| Desktop or Laptop | 23,762 | 81.1% |
| Smartphone | 27,245 | 93.0% |
| Tablet | 18,386 | 62.8% |
| No Computing Device | 878 | 3.0% |
| Total | 29,292 | 100.0% |
Internet Access in Hawthorne
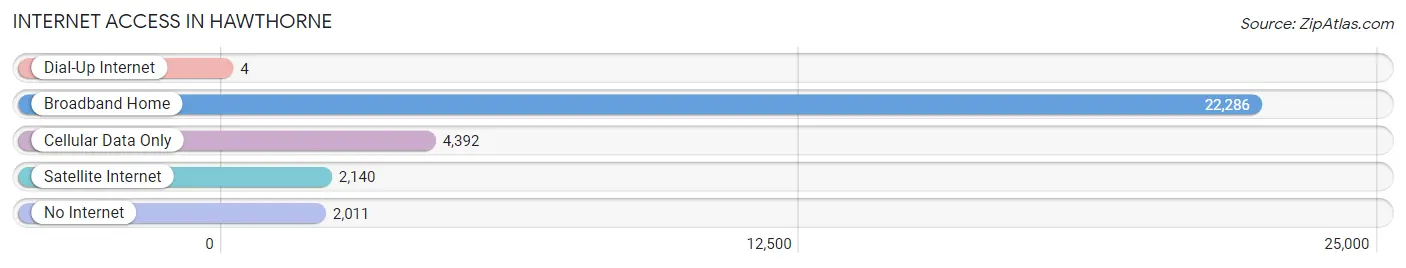
| Internet Type | # Households | % Households |
| Dial-Up Internet | 4 | 0.0% |
| Broadband Home | 22,286 | 76.1% |
| Cellular Data Only | 4,392 | 15.0% |
| Satellite Internet | 2,140 | 7.3% |
| No Internet | 2,011 | 6.9% |
| Total | 29,292 | 100.0% |
Hawthorne Summary
Hawthorne, California is a city located in the southwestern region of Los Angeles County, California. It is bordered by the cities of Lawndale, Gardena, and Inglewood. The population of Hawthorne was 84,293 at the 2010 census, making it the sixth-largest city in Los Angeles County.
History
Hawthorne was founded in 1905 by B.L. Harding and H.D. Lombard. The city was named after the Hawthorne family, who were early settlers in the area. The city was incorporated in 1922 and was the first city in the South Bay to incorporate.
Geography
Hawthorne is located at 33°53'N 118°20'W (33.88, -118.33). It is situated in the southwestern region of Los Angeles County, California. It is bordered by the cities of Lawndale, Gardena, and Inglewood. The city covers an area of 6.1 square miles and has a population density of 13,814 people per square mile.
Economy
Hawthorne is home to several major employers, including Northrop Grumman, SpaceX, and Tesla Motors. The city also has a thriving retail sector, with several shopping centers and malls. The city is also home to several industrial parks, which provide employment opportunities for many of the city's residents.
Demographics
As of the 2010 census, the population of Hawthorne was 84,293. The racial makeup of the city was 44.3% White, 25.3% African American, 0.7% Native American, 11.3% Asian, 0.3% Pacific Islander, 14.2% from other races, and 4.1% from two or more races. The median household income was $50,817, and the median family income was $54,817. The per capita income was $20,817.
Conclusion
Hawthorne, California is a city located in the southwestern region of Los Angeles County, California. It was founded in 1905 and was the first city in the South Bay to incorporate. The city covers an area of 6.1 square miles and has a population of 84,293. The economy of Hawthorne is driven by major employers such as Northrop Grumman, SpaceX, and Tesla Motors. The racial makeup of the city is 44.3% White, 25.3% African American, 0.7% Native American, 11.3% Asian, 0.3% Pacific Islander, 14.2% from other races, and 4.1% from two or more races. The median household income was $50,817, and the median family income was $54,817.
Common Questions
What is Per Capita Income in Hawthorne?
Per Capita income in Hawthorne is $32,434.
What is the Median Family Income in Hawthorne?
Median Family Income in Hawthorne is $76,778.
What is the Median Household income in Hawthorne?
Median Household Income in Hawthorne is $72,298.
What is Income or Wage Gap in Hawthorne?
Income or Wage Gap in Hawthorne is 21.9%.
Women in Hawthorne earn 78.1 cents for every dollar earned by a man.
What is Family Income Deficit in Hawthorne?
Family Income Deficit in Hawthorne is $11,960.
Families that are below poverty line in Hawthorne earn $11,960 less on average than the poverty threshold level.
What is Inequality or Gini Index in Hawthorne?
Inequality or Gini Index in Hawthorne is 0.44.
What is the Total Population of Hawthorne?
Total Population of Hawthorne is 86,978.
What is the Total Male Population of Hawthorne?
Total Male Population of Hawthorne is 42,479.
What is the Total Female Population of Hawthorne?
Total Female Population of Hawthorne is 44,499.
What is the Ratio of Males per 100 Females in Hawthorne?
There are 95.46 Males per 100 Females in Hawthorne.
What is the Ratio of Females per 100 Males in Hawthorne?
There are 104.76 Females per 100 Males in Hawthorne.
What is the Median Population Age in Hawthorne?
Median Population Age in Hawthorne is 33.3 Years.
What is the Average Family Size in Hawthorne
Average Family Size in Hawthorne is 3.6 People.
What is the Average Household Size in Hawthorne
Average Household Size in Hawthorne is 2.9 People.
How Large is the Labor Force in Hawthorne?
There are 47,010 People in the Labor Forcein in Hawthorne.
What is the Percentage of People in the Labor Force in Hawthorne?
69.3% of People are in the Labor Force in Hawthorne.
What is the Unemployment Rate in Hawthorne?
Unemployment Rate in Hawthorne is 7.5%.