Compton, CA Map & Demographics
Compton Map
Compton Overview
$22,278
PER CAPITA INCOME
$73,402
AVG FAMILY INCOME
$69,728
AVG HOUSEHOLD INCOME
13.9%
WAGE / INCOME GAP [ % ]
86.1¢/ $1
WAGE / INCOME GAP [ $ ]
$12,962
FAMILY INCOME DEFICIT
0.41
INEQUALITY / GINI INDEX
94,822
TOTAL POPULATION
46,265
MALE POPULATION
48,557
FEMALE POPULATION
95.28
MALES / 100 FEMALES
104.95
FEMALES / 100 MALES
33.4
MEDIAN AGE
4.3
AVG FAMILY SIZE
3.8
AVG HOUSEHOLD SIZE
44,138
LABOR FORCE [ PEOPLE ]
61.8%
PERCENT IN LABOR FORCE
7.9%
UNEMPLOYMENT RATE
Income in Compton
Income Overview in Compton
Per Capita Income in Compton is $22,278, while median incomes of families and households are $73,402 and $69,728 respectively.
| Characteristic | Number | Measure |
| Per Capita Income | 94,822 | $22,278 |
| Median Family Income | 19,790 | $73,402 |
| Mean Family Income | 19,790 | $84,802 |
| Median Household Income | 24,617 | $69,728 |
| Mean Household Income | 24,617 | $80,921 |
| Income Deficit | 19,790 | $12,962 |
| Wage / Income Gap (%) | 94,822 | 13.86% |
| Wage / Income Gap ($) | 94,822 | 86.14¢ per $1 |
| Gini / Inequality Index | 94,822 | 0.41 |
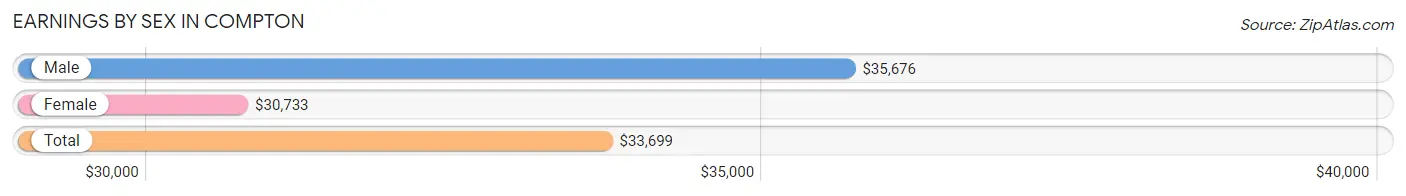
Earnings by Sex in Compton
Average Earnings in Compton are $33,699, $35,676 for men and $30,733 for women, a difference of 13.9%.
| Sex | Number | Average Earnings |
| Male | 23,265 (53.5%) | $35,676 |
| Female | 20,224 (46.5%) | $30,733 |
| Total | 43,489 (100.0%) | $33,699 |
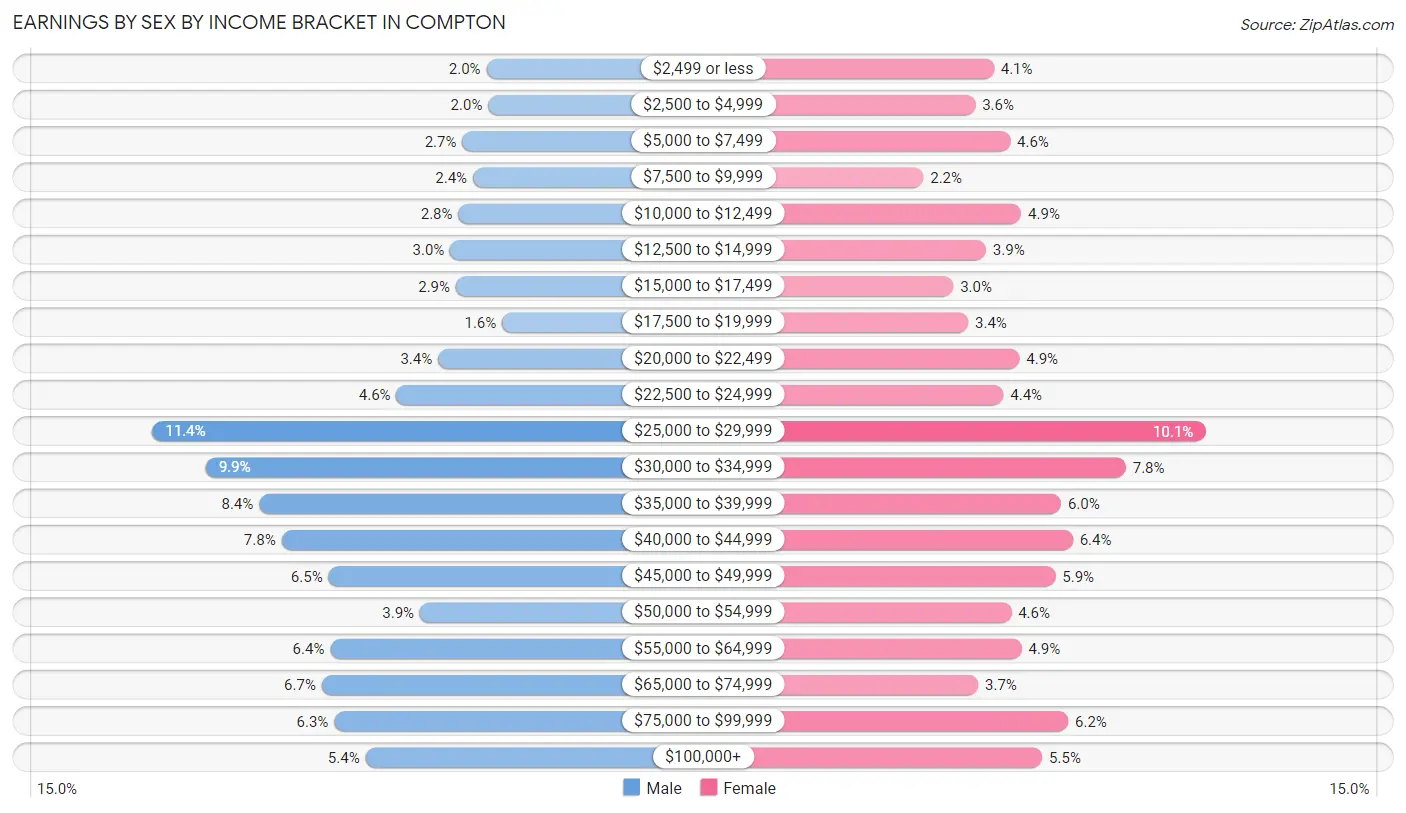
Earnings by Sex by Income Bracket in Compton
The most common earnings brackets in Compton are $25,000 to $29,999 for men (2,655 | 11.4%) and $25,000 to $29,999 for women (2,037 | 10.1%).
| Income | Male | Female |
| $2,499 or less | 471 (2.0%) | 835 (4.1%) |
| $2,500 to $4,999 | 458 (2.0%) | 730 (3.6%) |
| $5,000 to $7,499 | 629 (2.7%) | 928 (4.6%) |
| $7,500 to $9,999 | 559 (2.4%) | 434 (2.1%) |
| $10,000 to $12,499 | 654 (2.8%) | 991 (4.9%) |
| $12,500 to $14,999 | 708 (3.0%) | 791 (3.9%) |
| $15,000 to $17,499 | 669 (2.9%) | 605 (3.0%) |
| $17,500 to $19,999 | 368 (1.6%) | 689 (3.4%) |
| $20,000 to $22,499 | 787 (3.4%) | 981 (4.9%) |
| $22,500 to $24,999 | 1,058 (4.5%) | 889 (4.4%) |
| $25,000 to $29,999 | 2,655 (11.4%) | 2,037 (10.1%) |
| $30,000 to $34,999 | 2,306 (9.9%) | 1,585 (7.8%) |
| $35,000 to $39,999 | 1,957 (8.4%) | 1,217 (6.0%) |
| $40,000 to $44,999 | 1,810 (7.8%) | 1,284 (6.4%) |
| $45,000 to $49,999 | 1,504 (6.5%) | 1,186 (5.9%) |
| $50,000 to $54,999 | 906 (3.9%) | 934 (4.6%) |
| $55,000 to $64,999 | 1,492 (6.4%) | 992 (4.9%) |
| $65,000 to $74,999 | 1,548 (6.7%) | 747 (3.7%) |
| $75,000 to $99,999 | 1,466 (6.3%) | 1,258 (6.2%) |
| $100,000+ | 1,260 (5.4%) | 1,111 (5.5%) |
| Total | 23,265 (100.0%) | 20,224 (100.0%) |
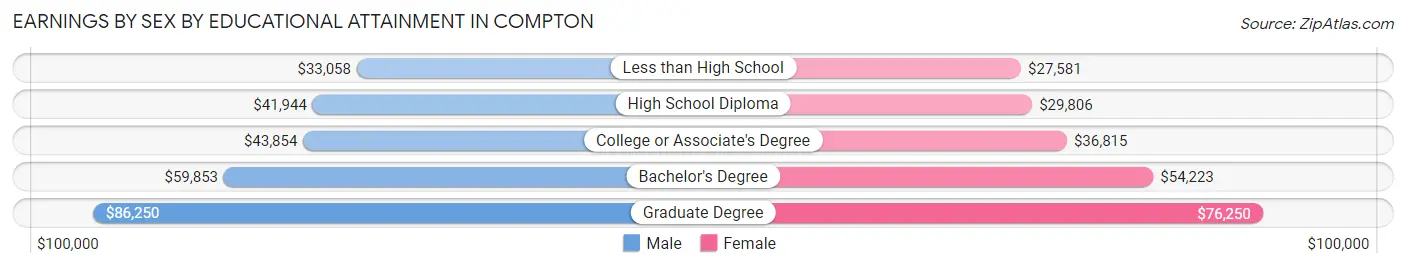
Earnings by Sex by Educational Attainment in Compton
Average earnings in Compton are $38,635 for men and $34,222 for women, a difference of 11.4%. Men with an educational attainment of graduate degree enjoy the highest average annual earnings of $86,250, while those with less than high school education earn the least with $33,058. Women with an educational attainment of graduate degree earn the most with the average annual earnings of $76,250, while those with less than high school education have the smallest earnings of $27,581.
| Educational Attainment | Male Income | Female Income |
| Less than High School | $33,058 | $27,581 |
| High School Diploma | $41,944 | $29,806 |
| College or Associate's Degree | $43,854 | $36,815 |
| Bachelor's Degree | $59,853 | $54,223 |
| Graduate Degree | $86,250 | $76,250 |
| Total | $38,635 | $34,222 |
Family Income in Compton
Family Income Brackets in Compton
According to the Compton family income data, there are 3,978 families falling into the $100,000 to $149,999 income range, which is the most common income bracket and makes up 20.1% of all families. Conversely, the $10,000 to $14,999 income bracket is the least frequent group with only 336 families (1.7%) belonging to this category.
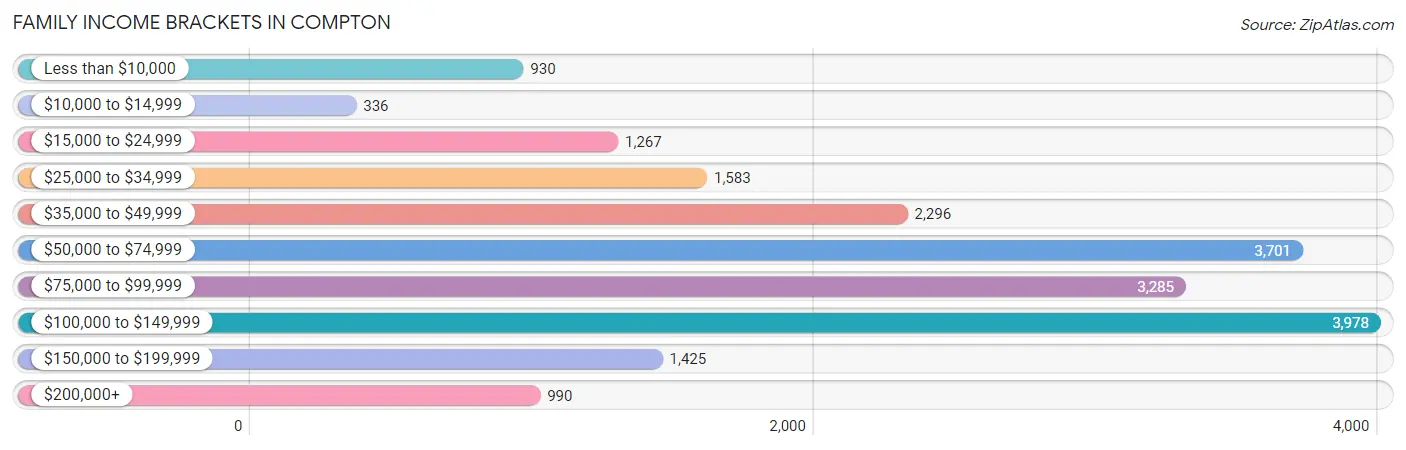
| Income Bracket | # Families | % Families |
| Less than $10,000 | 930 | 4.7% |
| $10,000 to $14,999 | 336 | 1.7% |
| $15,000 to $24,999 | 1,267 | 6.4% |
| $25,000 to $34,999 | 1,583 | 8.0% |
| $35,000 to $49,999 | 2,296 | 11.6% |
| $50,000 to $74,999 | 3,701 | 18.7% |
| $75,000 to $99,999 | 3,285 | 16.6% |
| $100,000 to $149,999 | 3,978 | 20.1% |
| $150,000 to $199,999 | 1,425 | 7.2% |
| $200,000+ | 990 | 5.0% |
Family Income by Famaliy Size in Compton
7+ person families (1,827 | 9.2%) account for the highest median family income in Compton with $108,606 per family, while 2-person families (4,767 | 24.1%) have the highest median income of $28,018 per family member.
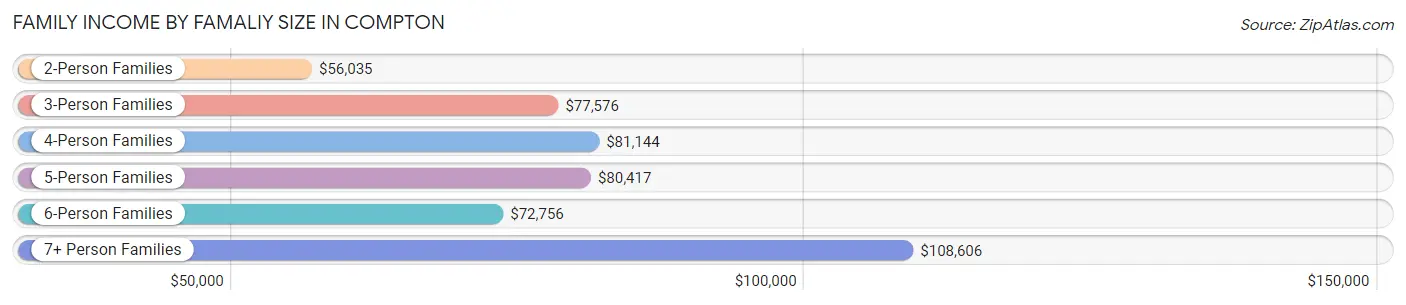
| Income Bracket | # Families | Median Income |
| 2-Person Families | 4,767 (24.1%) | $56,035 |
| 3-Person Families | 4,101 (20.7%) | $77,576 |
| 4-Person Families | 4,302 (21.7%) | $81,144 |
| 5-Person Families | 3,079 (15.6%) | $80,417 |
| 6-Person Families | 1,714 (8.7%) | $72,756 |
| 7+ Person Families | 1,827 (9.2%) | $108,606 |
| Total | 19,790 (100.0%) | $73,402 |
Family Income by Number of Earners in Compton
The median family income in Compton is $73,402, with families comprising 3+ earners (4,652) having the highest median family income of $113,472, while families with no earners (2,256) have the lowest median family income of $22,755, accounting for 23.5% and 11.4% of families, respectively.
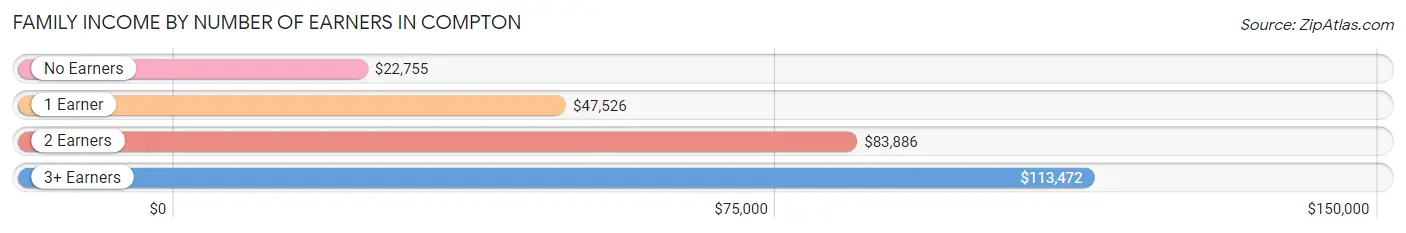
| Number of Earners | # Families | Median Income |
| No Earners | 2,256 (11.4%) | $22,755 |
| 1 Earner | 6,621 (33.5%) | $47,526 |
| 2 Earners | 6,261 (31.6%) | $83,886 |
| 3+ Earners | 4,652 (23.5%) | $113,472 |
| Total | 19,790 (100.0%) | $73,402 |
Household Income in Compton
Household Income Brackets in Compton
With 4,751 households falling in the category, the $100,000 to $149,999 income range is the most frequent in Compton, accounting for 19.3% of all households. In contrast, only 862 households (3.5%) fall into the $10,000 to $14,999 income bracket, making it the least populous group.
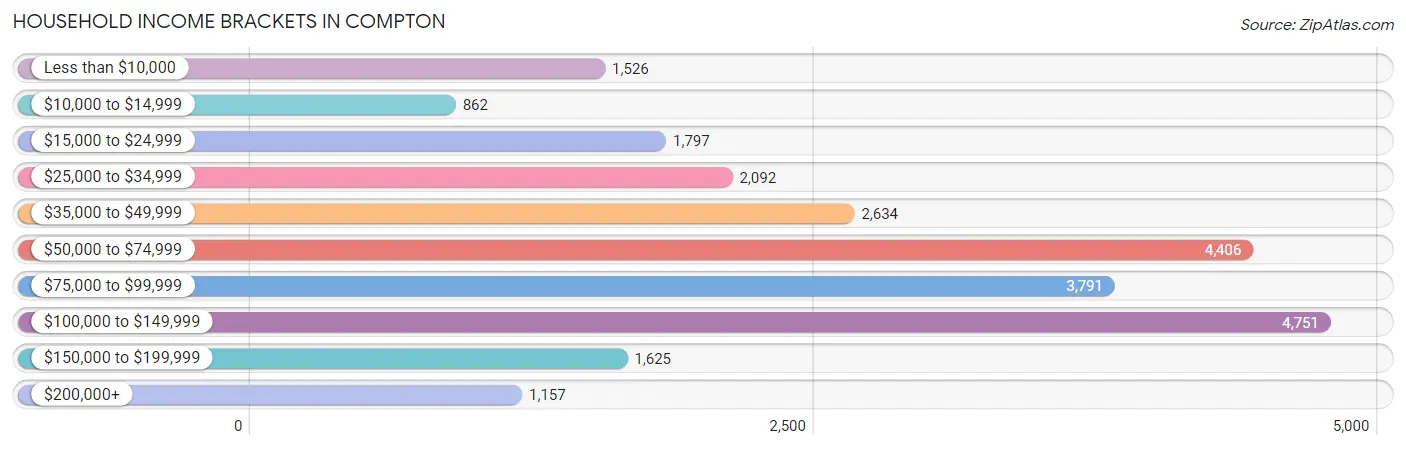
| Income Bracket | # Households | % Households |
| Less than $10,000 | 1,526 | 6.2% |
| $10,000 to $14,999 | 862 | 3.5% |
| $15,000 to $24,999 | 1,797 | 7.3% |
| $25,000 to $34,999 | 2,092 | 8.5% |
| $35,000 to $49,999 | 2,634 | 10.7% |
| $50,000 to $74,999 | 4,406 | 17.9% |
| $75,000 to $99,999 | 3,791 | 15.4% |
| $100,000 to $149,999 | 4,751 | 19.3% |
| $150,000 to $199,999 | 1,625 | 6.6% |
| $200,000+ | 1,157 | 4.7% |
Household Income by Householder Age in Compton
The median household income in Compton is $69,728, with the highest median household income of $81,053 found in the 45 to 64 years age bracket for the primary householder. A total of 10,767 households (43.7%) fall into this category. Meanwhile, the 65+ years age bracket for the primary householder has the lowest median household income of $43,902, with 4,786 households (19.4%) in this group.
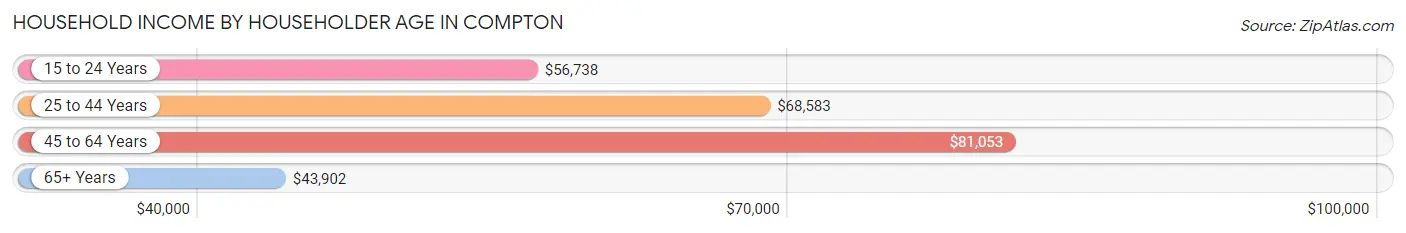
| Income Bracket | # Households | Median Income |
| 15 to 24 Years | 629 (2.6%) | $56,738 |
| 25 to 44 Years | 8,435 (34.3%) | $68,583 |
| 45 to 64 Years | 10,767 (43.7%) | $81,053 |
| 65+ Years | 4,786 (19.4%) | $43,902 |
| Total | 24,617 (100.0%) | $69,728 |
Poverty in Compton
Income Below Poverty by Sex and Age in Compton
With 15.6% poverty level for males and 19.7% for females among the residents of Compton, 6 to 11 year old males and 15 year old females are the most vulnerable to poverty, with 1,225 males (29.5%) and 215 females (36.3%) in their respective age groups living below the poverty level.
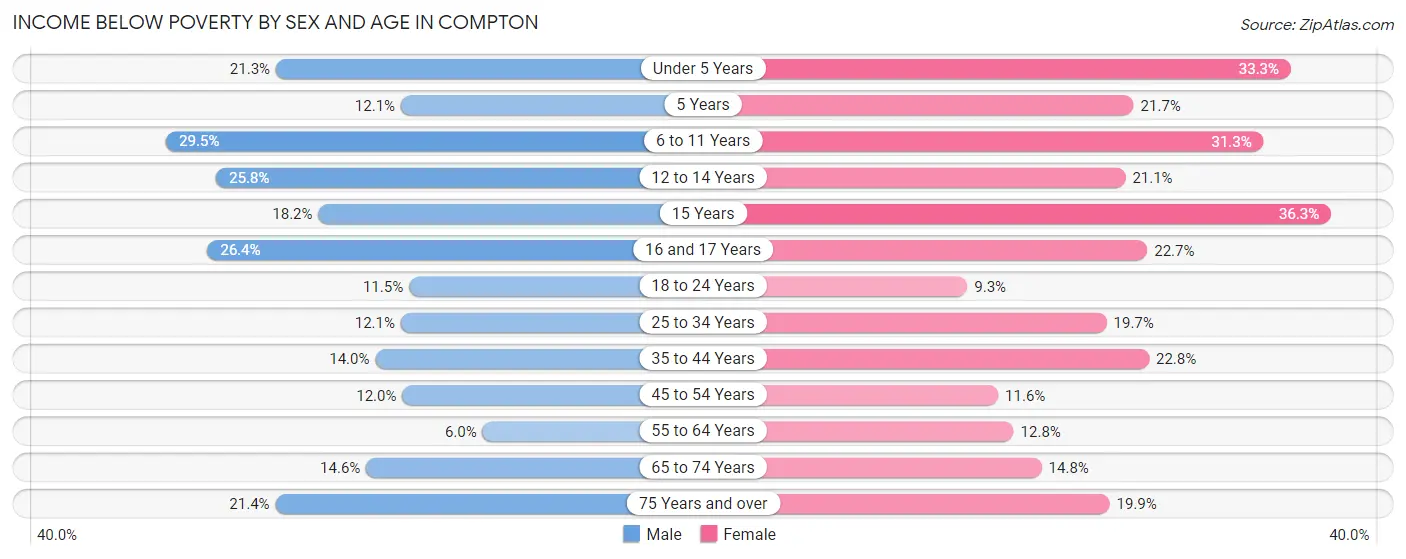
| Age Bracket | Male | Female |
| Under 5 Years | 647 (21.3%) | 1,314 (33.3%) |
| 5 Years | 92 (12.1%) | 135 (21.7%) |
| 6 to 11 Years | 1,225 (29.5%) | 1,452 (31.3%) |
| 12 to 14 Years | 642 (25.8%) | 470 (21.1%) |
| 15 Years | 139 (18.2%) | 215 (36.3%) |
| 16 and 17 Years | 482 (26.4%) | 278 (22.7%) |
| 18 to 24 Years | 552 (11.5%) | 411 (9.3%) |
| 25 to 34 Years | 764 (12.1%) | 1,435 (19.7%) |
| 35 to 44 Years | 972 (14.0%) | 1,442 (22.8%) |
| 45 to 54 Years | 696 (12.0%) | 669 (11.6%) |
| 55 to 64 Years | 312 (6.0%) | 716 (12.8%) |
| 65 to 74 Years | 395 (14.6%) | 452 (14.8%) |
| 75 Years and over | 260 (21.4%) | 550 (19.9%) |
| Total | 7,178 (15.6%) | 9,539 (19.7%) |
Income Above Poverty by Sex and Age in Compton
According to the poverty statistics in Compton, males aged 55 to 64 years and females aged 18 to 24 years are the age groups that are most secure financially, with 94.0% of males and 90.7% of females in these age groups living above the poverty line.
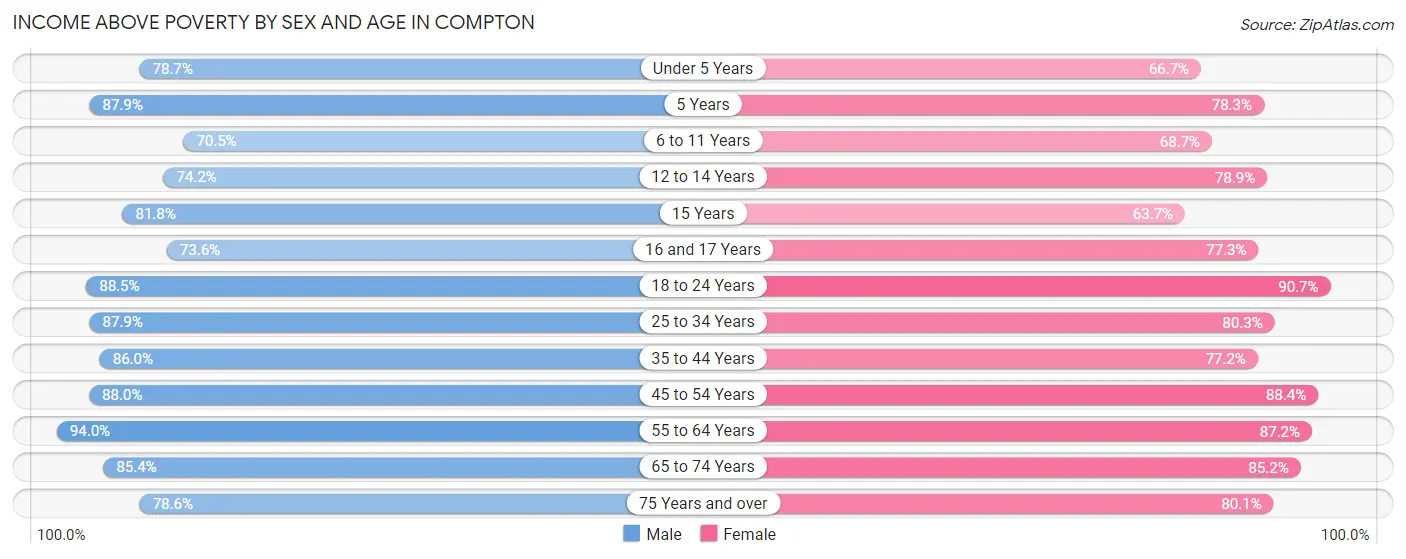
| Age Bracket | Male | Female |
| Under 5 Years | 2,385 (78.7%) | 2,627 (66.7%) |
| 5 Years | 671 (87.9%) | 488 (78.3%) |
| 6 to 11 Years | 2,929 (70.5%) | 3,186 (68.7%) |
| 12 to 14 Years | 1,848 (74.2%) | 1,762 (78.9%) |
| 15 Years | 625 (81.8%) | 377 (63.7%) |
| 16 and 17 Years | 1,342 (73.6%) | 948 (77.3%) |
| 18 to 24 Years | 4,264 (88.5%) | 4,000 (90.7%) |
| 25 to 34 Years | 5,565 (87.9%) | 5,865 (80.3%) |
| 35 to 44 Years | 5,993 (86.0%) | 4,881 (77.2%) |
| 45 to 54 Years | 5,125 (88.0%) | 5,094 (88.4%) |
| 55 to 64 Years | 4,890 (94.0%) | 4,894 (87.2%) |
| 65 to 74 Years | 2,303 (85.4%) | 2,594 (85.2%) |
| 75 Years and over | 956 (78.6%) | 2,216 (80.1%) |
| Total | 38,896 (84.4%) | 38,932 (80.3%) |
Income Below Poverty Among Married-Couple Families in Compton
The poverty statistics for married-couple families in Compton show that 11.9% or 1,315 of the total 11,037 families live below the poverty line. Families with 5 or more children have the highest poverty rate of 68.6%, comprising of 236 families. On the other hand, families with no children have the lowest poverty rate of 5.8%, which includes 258 families.
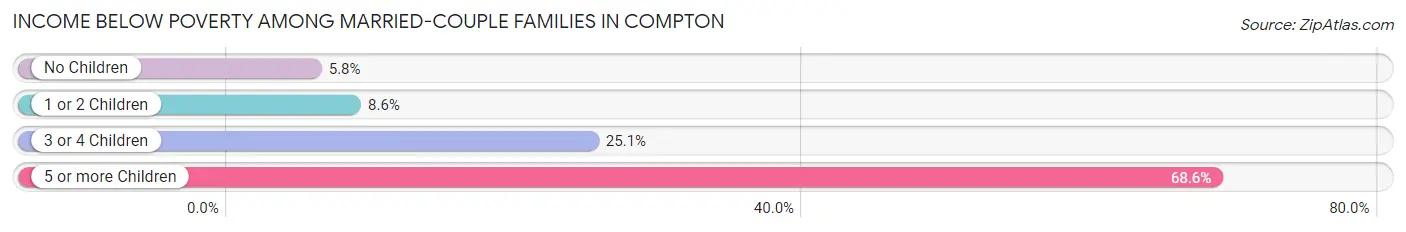
| Children | Above Poverty | Below Poverty |
| No Children | 4,167 (94.2%) | 258 (5.8%) |
| 1 or 2 Children | 4,163 (91.4%) | 390 (8.6%) |
| 3 or 4 Children | 1,284 (74.9%) | 431 (25.1%) |
| 5 or more Children | 108 (31.4%) | 236 (68.6%) |
| Total | 9,722 (88.1%) | 1,315 (11.9%) |
Income Below Poverty Among Single-Parent Households in Compton
According to the poverty data in Compton, 10.6% or 304 single-father households and 22.1% or 1,298 single-mother households are living below the poverty line. Among single-father households, those with 3 or 4 children have the highest poverty rate, with 64 households (15.3%) experiencing poverty. Likewise, among single-mother households, those with 3 or 4 children have the highest poverty rate, with 373 households (57.6%) falling below the poverty line.
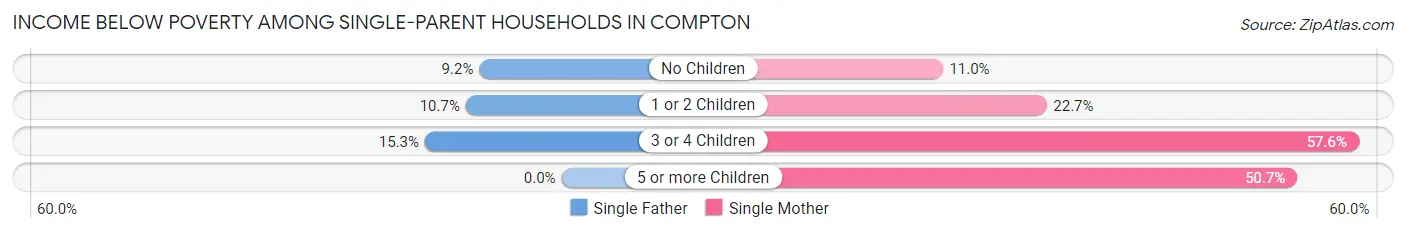
| Children | Single Father | Single Mother |
| No Children | 114 (9.2%) | 305 (11.0%) |
| 1 or 2 Children | 126 (10.7%) | 509 (22.7%) |
| 3 or 4 Children | 64 (15.3%) | 373 (57.6%) |
| 5 or more Children | 0 (0.0%) | 111 (50.7%) |
| Total | 304 (10.6%) | 1,298 (22.1%) |
Income Below Poverty Among Married-Couple vs Single-Parent Households in Compton
The poverty data for Compton shows that 1,315 of the married-couple family households (11.9%) and 1,602 of the single-parent households (18.3%) are living below the poverty level. Within the married-couple family households, those with 5 or more children have the highest poverty rate, with 236 households (68.6%) falling below the poverty line. Among the single-parent households, those with 5 or more children have the highest poverty rate, with 111 household (43.0%) living below poverty.
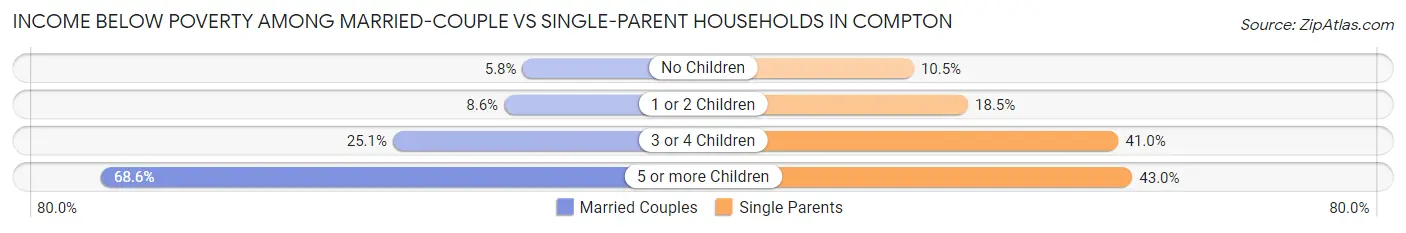
| Children | Married-Couple Families | Single-Parent Households |
| No Children | 258 (5.8%) | 419 (10.5%) |
| 1 or 2 Children | 390 (8.6%) | 635 (18.5%) |
| 3 or 4 Children | 431 (25.1%) | 437 (41.0%) |
| 5 or more Children | 236 (68.6%) | 111 (43.0%) |
| Total | 1,315 (11.9%) | 1,602 (18.3%) |
Race in Compton
The most populous races in Compton are Hispanic or Latino (67,474 | 71.2%), Some other Race (32,141 | 33.9%), and Black / African American (24,121 | 25.4%).
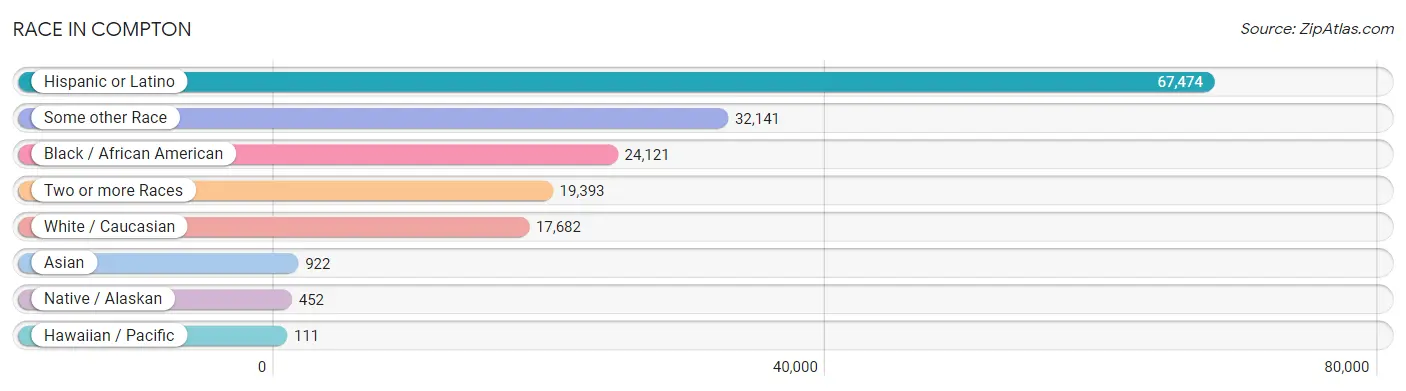
| Race | # Population | % Population |
| Asian | 922 | 1.0% |
| Black / African American | 24,121 | 25.4% |
| Hawaiian / Pacific | 111 | 0.1% |
| Hispanic or Latino | 67,474 | 71.2% |
| Native / Alaskan | 452 | 0.5% |
| White / Caucasian | 17,682 | 18.6% |
| Two or more Races | 19,393 | 20.4% |
| Some other Race | 32,141 | 33.9% |
| Total | 94,822 | 100.0% |
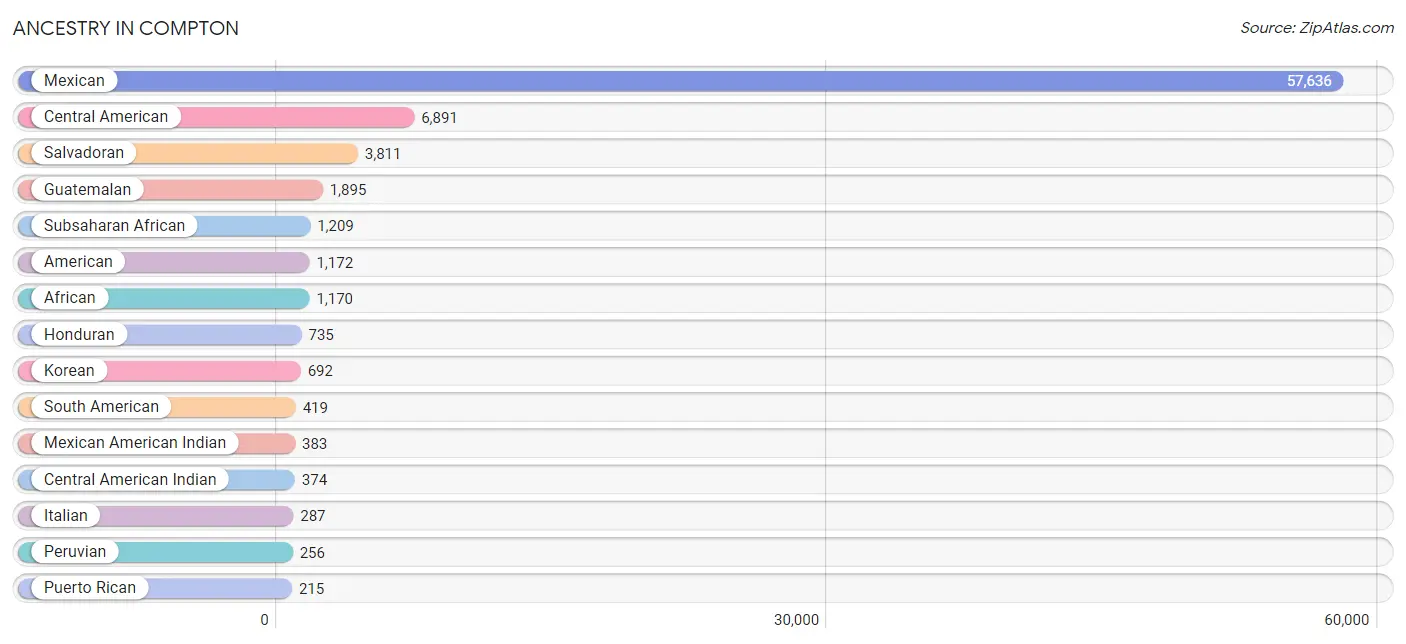
Ancestry in Compton
The most populous ancestries reported in Compton are Mexican (57,636 | 60.8%), Central American (6,891 | 7.3%), Salvadoran (3,811 | 4.0%), Guatemalan (1,895 | 2.0%), and Subsaharan African (1,209 | 1.3%), together accounting for 75.4% of all Compton residents.
| Ancestry | # Population | % Population |
| African | 1,170 | 1.2% |
| Aleut | 11 | 0.0% |
| American | 1,172 | 1.2% |
| Apache | 71 | 0.1% |
| Arab | 57 | 0.1% |
| Argentinean | 6 | 0.0% |
| Bangladeshi | 25 | 0.0% |
| Belgian | 4 | 0.0% |
| Belizean | 197 | 0.2% |
| Bhutanese | 18 | 0.0% |
| Blackfeet | 44 | 0.1% |
| Bolivian | 18 | 0.0% |
| British West Indian | 8 | 0.0% |
| Burmese | 32 | 0.0% |
| Canadian | 71 | 0.1% |
| Central American | 6,891 | 7.3% |
| Central American Indian | 374 | 0.4% |
| Cherokee | 51 | 0.1% |
| Chilean | 29 | 0.0% |
| Choctaw | 21 | 0.0% |
| Colombian | 56 | 0.1% |
| Costa Rican | 12 | 0.0% |
| Cuban | 90 | 0.1% |
| Czech | 7 | 0.0% |
| Dominican | 105 | 0.1% |
| Dutch | 16 | 0.0% |
| Ecuadorian | 54 | 0.1% |
| English | 108 | 0.1% |
| European | 30 | 0.0% |
| French | 80 | 0.1% |
| French American Indian | 13 | 0.0% |
| French Canadian | 12 | 0.0% |
| German | 149 | 0.2% |
| Greek | 14 | 0.0% |
| Guatemalan | 1,895 | 2.0% |
| Guyanese | 12 | 0.0% |
| Honduran | 735 | 0.8% |
| Indian (Asian) | 73 | 0.1% |
| Iranian | 13 | 0.0% |
| Irish | 176 | 0.2% |
| Israeli | 17 | 0.0% |
| Italian | 287 | 0.3% |
| Jamaican | 168 | 0.2% |
| Korean | 692 | 0.7% |
| Laotian | 15 | 0.0% |
| Mexican | 57,636 | 60.8% |
| Mexican American Indian | 383 | 0.4% |
| Native Hawaiian | 16 | 0.0% |
| Navajo | 28 | 0.0% |
| Nicaraguan | 78 | 0.1% |
| Nigerian | 30 | 0.0% |
| Northern European | 26 | 0.0% |
| Norwegian | 21 | 0.0% |
| Pakistani | 16 | 0.0% |
| Panamanian | 35 | 0.0% |
| Peruvian | 256 | 0.3% |
| Polish | 3 | 0.0% |
| Portuguese | 20 | 0.0% |
| Puerto Rican | 215 | 0.2% |
| Russian | 29 | 0.0% |
| Salvadoran | 3,811 | 4.0% |
| Samoan | 142 | 0.2% |
| Scotch-Irish | 10 | 0.0% |
| Scottish | 17 | 0.0% |
| Slavic | 7 | 0.0% |
| Slovak | 3 | 0.0% |
| South African | 9 | 0.0% |
| South American | 419 | 0.4% |
| Spaniard | 106 | 0.1% |
| Spanish | 35 | 0.0% |
| Sri Lankan | 184 | 0.2% |
| Subsaharan African | 1,209 | 1.3% |
| Swedish | 22 | 0.0% |
| Thai | 3 | 0.0% |
| Vietnamese | 10 | 0.0% |
| Welsh | 21 | 0.0% |
| West Indian | 22 | 0.0% |
| Yaqui | 34 | 0.0% | View All 78 Rows |
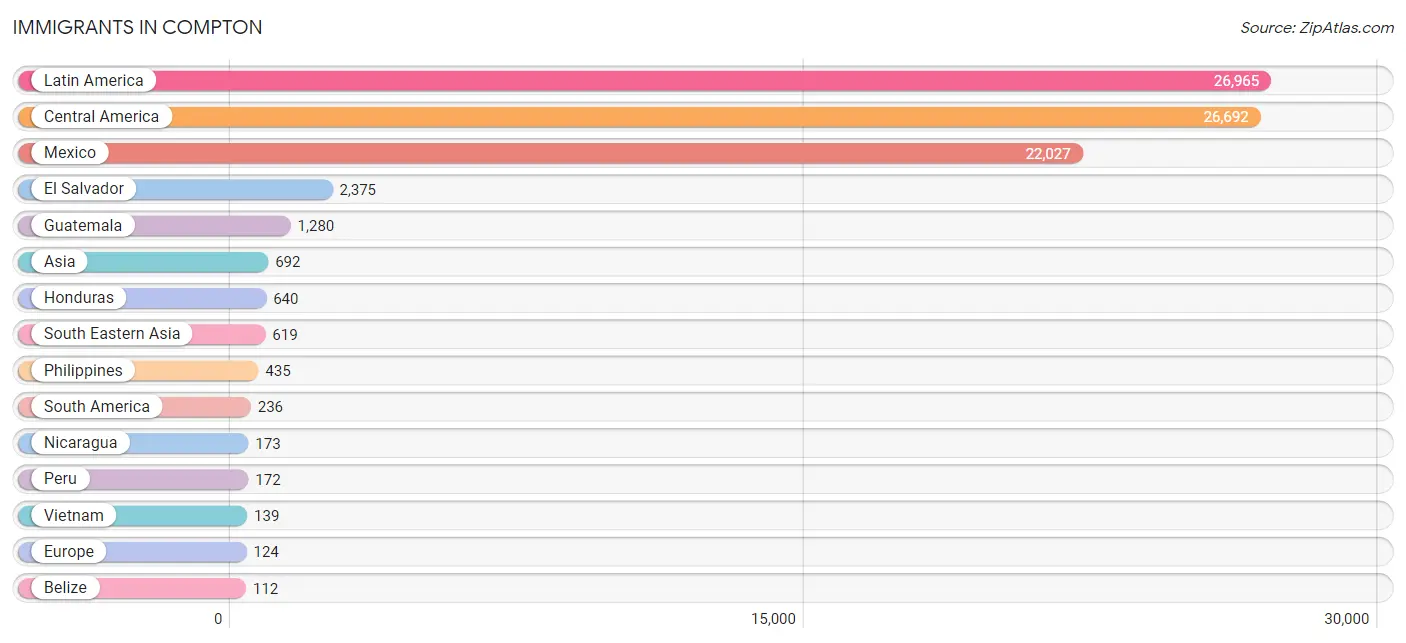
Immigrants in Compton
The most numerous immigrant groups reported in Compton came from Latin America (26,965 | 28.4%), Central America (26,692 | 28.1%), Mexico (22,027 | 23.2%), El Salvador (2,375 | 2.5%), and Guatemala (1,280 | 1.3%), together accounting for 83.7% of all Compton residents.
| Immigration Origin | # Population | % Population |
| Africa | 30 | 0.0% |
| Argentina | 12 | 0.0% |
| Asia | 692 | 0.7% |
| Belize | 112 | 0.1% |
| Bolivia | 13 | 0.0% |
| Canada | 12 | 0.0% |
| Caribbean | 37 | 0.0% |
| Central America | 26,692 | 28.1% |
| China | 46 | 0.1% |
| Colombia | 33 | 0.0% |
| Costa Rica | 12 | 0.0% |
| Cuba | 13 | 0.0% |
| Czechoslovakia | 10 | 0.0% |
| Dominican Republic | 9 | 0.0% |
| Eastern Africa | 7 | 0.0% |
| Eastern Asia | 46 | 0.1% |
| Eastern Europe | 28 | 0.0% |
| Ecuador | 6 | 0.0% |
| El Salvador | 2,375 | 2.5% |
| England | 61 | 0.1% |
| Europe | 124 | 0.1% |
| France | 30 | 0.0% |
| Germany | 5 | 0.0% |
| Ghana | 15 | 0.0% |
| Guatemala | 1,280 | 1.3% |
| Honduras | 640 | 0.7% |
| Indonesia | 16 | 0.0% |
| Iran | 11 | 0.0% |
| Jamaica | 15 | 0.0% |
| Laos | 13 | 0.0% |
| Latin America | 26,965 | 28.4% |
| Latvia | 5 | 0.0% |
| Mexico | 22,027 | 23.2% |
| Nicaragua | 173 | 0.2% |
| Nigeria | 8 | 0.0% |
| Northern Europe | 61 | 0.1% |
| Oceania | 86 | 0.1% |
| Pakistan | 16 | 0.0% |
| Panama | 73 | 0.1% |
| Peru | 172 | 0.2% |
| Philippines | 435 | 0.5% |
| Somalia | 7 | 0.0% |
| South America | 236 | 0.3% |
| South Central Asia | 27 | 0.0% |
| South Eastern Asia | 619 | 0.6% |
| Thailand | 16 | 0.0% |
| Vietnam | 139 | 0.2% |
| Western Africa | 23 | 0.0% |
| Western Europe | 35 | 0.0% | View All 49 Rows |
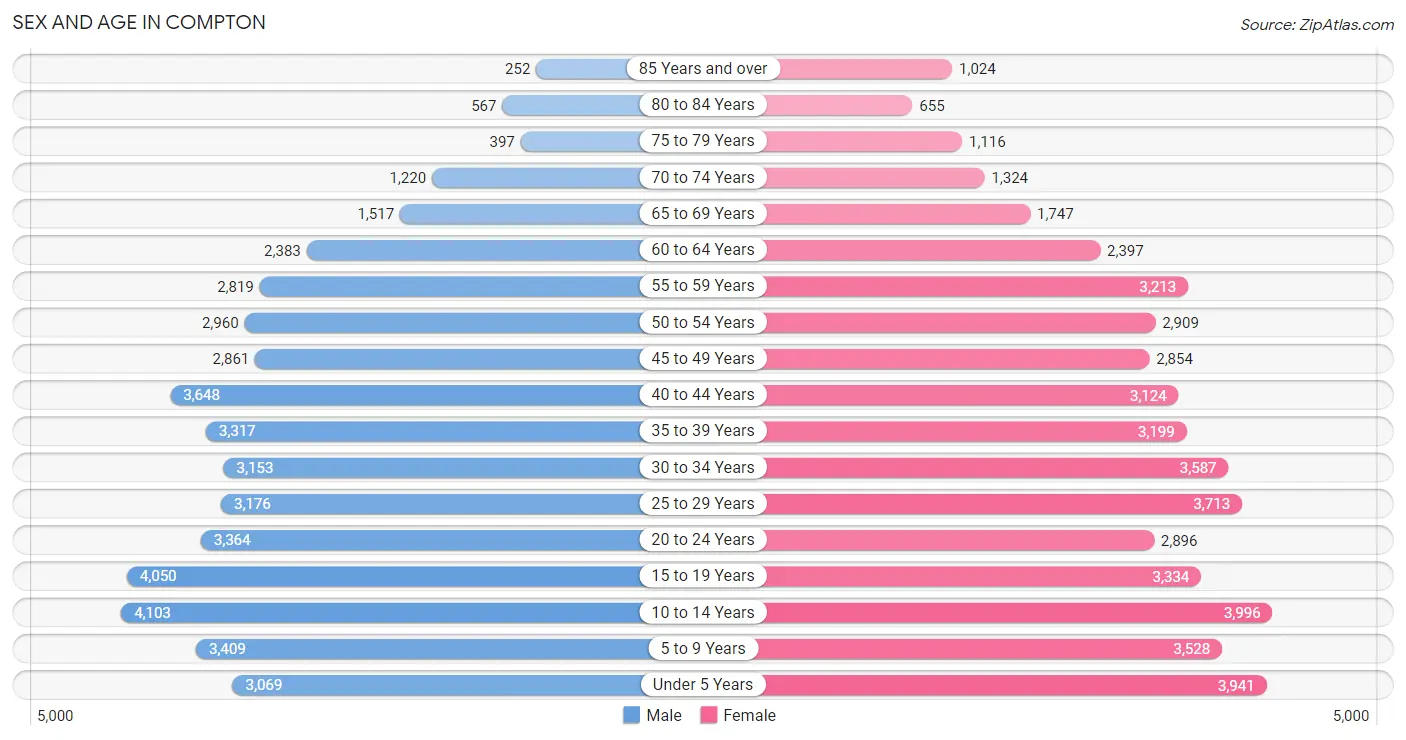
Sex and Age in Compton
Sex and Age in Compton
The most populous age groups in Compton are 10 to 14 Years (4,103 | 8.9%) for men and 10 to 14 Years (3,996 | 8.2%) for women.
| Age Bracket | Male | Female |
| Under 5 Years | 3,069 (6.6%) | 3,941 (8.1%) |
| 5 to 9 Years | 3,409 (7.4%) | 3,528 (7.3%) |
| 10 to 14 Years | 4,103 (8.9%) | 3,996 (8.2%) |
| 15 to 19 Years | 4,050 (8.7%) | 3,334 (6.9%) |
| 20 to 24 Years | 3,364 (7.3%) | 2,896 (6.0%) |
| 25 to 29 Years | 3,176 (6.9%) | 3,713 (7.6%) |
| 30 to 34 Years | 3,153 (6.8%) | 3,587 (7.4%) |
| 35 to 39 Years | 3,317 (7.2%) | 3,199 (6.6%) |
| 40 to 44 Years | 3,648 (7.9%) | 3,124 (6.4%) |
| 45 to 49 Years | 2,861 (6.2%) | 2,854 (5.9%) |
| 50 to 54 Years | 2,960 (6.4%) | 2,909 (6.0%) |
| 55 to 59 Years | 2,819 (6.1%) | 3,213 (6.6%) |
| 60 to 64 Years | 2,383 (5.1%) | 2,397 (4.9%) |
| 65 to 69 Years | 1,517 (3.3%) | 1,747 (3.6%) |
| 70 to 74 Years | 1,220 (2.6%) | 1,324 (2.7%) |
| 75 to 79 Years | 397 (0.9%) | 1,116 (2.3%) |
| 80 to 84 Years | 567 (1.2%) | 655 (1.3%) |
| 85 Years and over | 252 (0.5%) | 1,024 (2.1%) |
| Total | 46,265 (100.0%) | 48,557 (100.0%) |
Families and Households in Compton
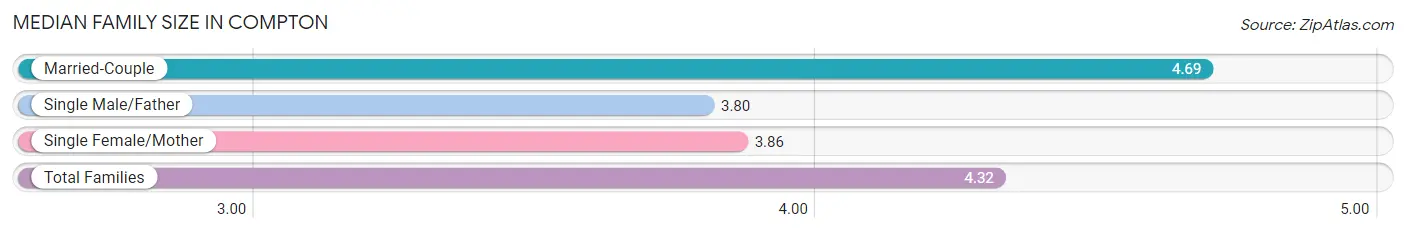
Median Family Size in Compton
The median family size in Compton is 4.32 persons per family, with married-couple families (11,037 | 55.8%) accounting for the largest median family size of 4.69 persons per family. On the other hand, single male/father families (2,876 | 14.5%) represent the smallest median family size with 3.80 persons per family.
| Family Type | # Families | Family Size |
| Married-Couple | 11,037 (55.8%) | 4.69 |
| Single Male/Father | 2,876 (14.5%) | 3.80 |
| Single Female/Mother | 5,877 (29.7%) | 3.86 |
| Total Families | 19,790 (100.0%) | 4.32 |
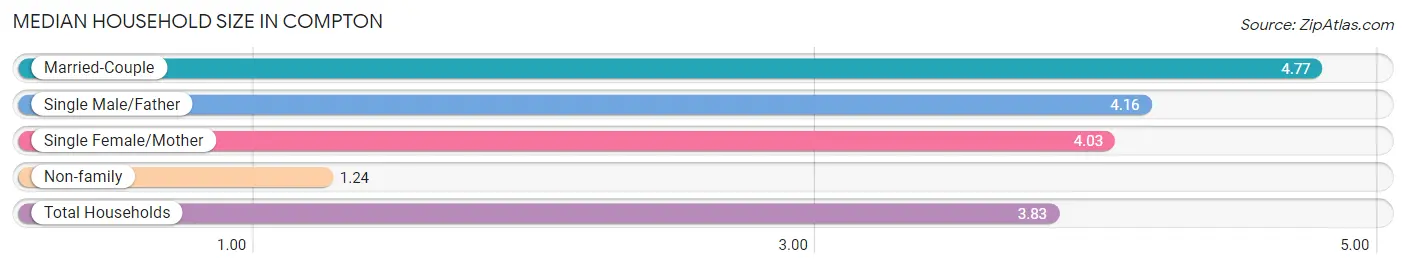
Median Household Size in Compton
The median household size in Compton is 3.83 persons per household, with married-couple households (11,037 | 44.8%) accounting for the largest median household size of 4.77 persons per household. non-family households (4,827 | 19.6%) represent the smallest median household size with 1.24 persons per household.
| Household Type | # Households | Household Size |
| Married-Couple | 11,037 (44.8%) | 4.77 |
| Single Male/Father | 2,876 (11.7%) | 4.16 |
| Single Female/Mother | 5,877 (23.9%) | 4.03 |
| Non-family | 4,827 (19.6%) | 1.24 |
| Total Households | 24,617 (100.0%) | 3.83 |
Household Size by Marriage Status in Compton
Out of a total of 24,617 households in Compton, 19,790 (80.4%) are family households, while 4,827 (19.6%) are nonfamily households. The most numerous type of family households are 2-person households, comprising 4,326, and the most common type of nonfamily households are 1-person households, comprising 4,071.
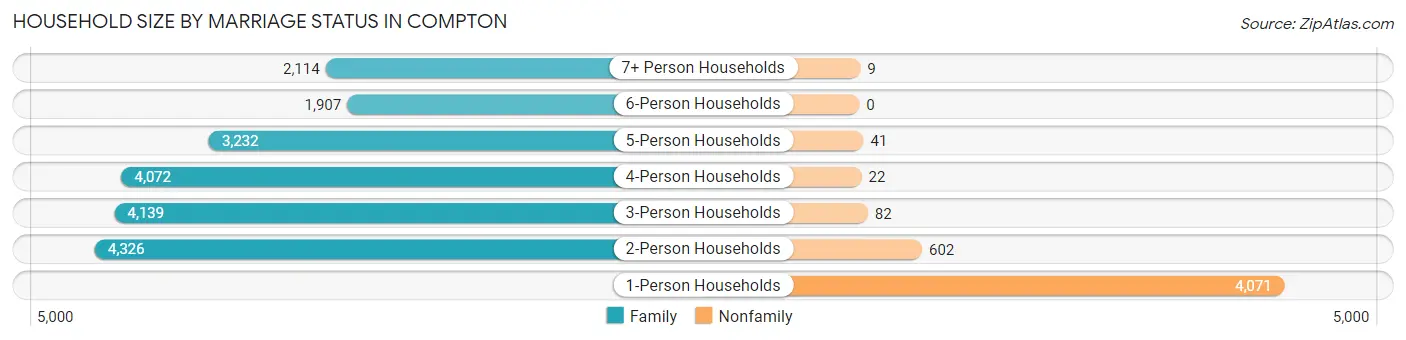
| Household Size | Family Households | Nonfamily Households |
| 1-Person Households | - | 4,071 (16.5%) |
| 2-Person Households | 4,326 (17.6%) | 602 (2.5%) |
| 3-Person Households | 4,139 (16.8%) | 82 (0.3%) |
| 4-Person Households | 4,072 (16.5%) | 22 (0.1%) |
| 5-Person Households | 3,232 (13.1%) | 41 (0.2%) |
| 6-Person Households | 1,907 (7.7%) | 0 (0.0%) |
| 7+ Person Households | 2,114 (8.6%) | 9 (0.0%) |
| Total | 19,790 (80.4%) | 4,827 (19.6%) |
Female Fertility in Compton
Fertility by Age in Compton
Average fertility rate in Compton is 60.0 births per 1,000 women. Women in the age bracket of 20 to 34 years have the highest fertility rate with 103.0 births per 1,000 women. Women in the age bracket of 20 to 34 years acount for 74.8% of all women with births.
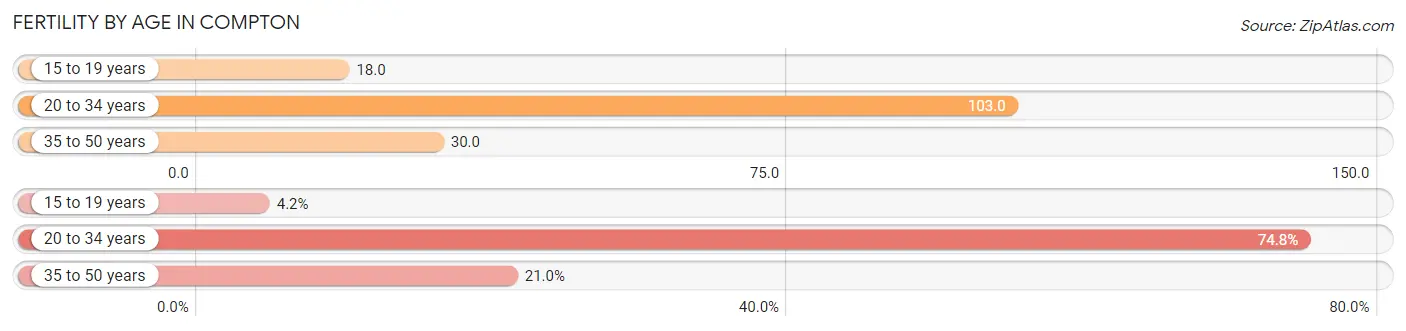
| Age Bracket | Women with Births | Births / 1,000 Women |
| 15 to 19 years | 59 (4.2%) | 18.0 |
| 20 to 34 years | 1,053 (74.8%) | 103.0 |
| 35 to 50 years | 296 (21.0%) | 30.0 |
| Total | 1,408 (100.0%) | 60.0 |
Fertility by Age by Marriage Status in Compton
46.5% of women with births (1,408) in Compton are married. The highest percentage of unmarried women with births falls into 15 to 19 years age bracket with 100.0% of them unmarried at the time of birth, while the lowest percentage of unmarried women with births belong to 35 to 50 years age bracket with 23.7% of them unmarried.
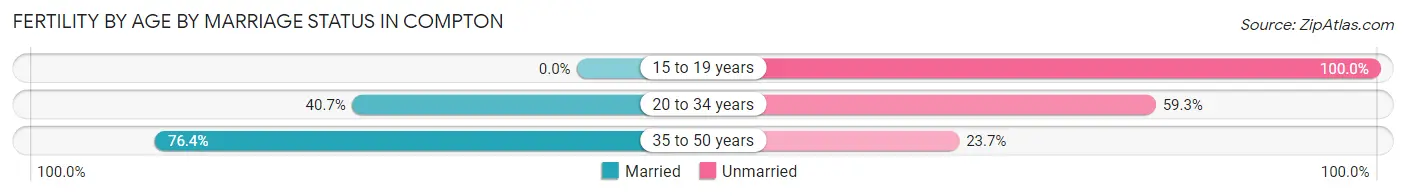
| Age Bracket | Married | Unmarried |
| 15 to 19 years | 0 (0.0%) | 59 (100.0%) |
| 20 to 34 years | 429 (40.7%) | 624 (59.3%) |
| 35 to 50 years | 226 (76.3%) | 70 (23.6%) |
| Total | 655 (46.5%) | 753 (53.5%) |
Fertility by Education in Compton
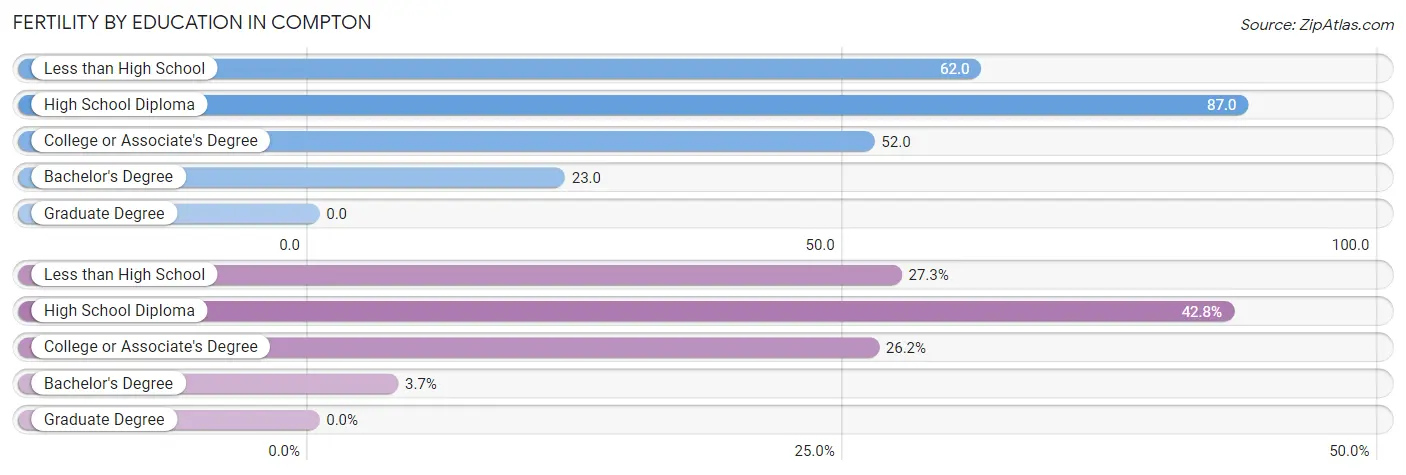
| Educational Attainment | Women with Births | Births / 1,000 Women |
| Less than High School | 384 (27.3%) | 62.0 |
| High School Diploma | 603 (42.8%) | 87.0 |
| College or Associate's Degree | 369 (26.2%) | 52.0 |
| Bachelor's Degree | 52 (3.7%) | 23.0 |
| Graduate Degree | 0 (0.0%) | 0.0 |
| Total | 1,408 (100.0%) | 60.0 |
Fertility by Education by Marriage Status in Compton
53.5% of women with births in Compton are unmarried. Women with the educational attainment of high school diploma are most likely to be married with 54.4% of them married at childbirth, while women with the educational attainment of bachelor's degree are least likely to be married with 69.2% of them unmarried at childbirth.
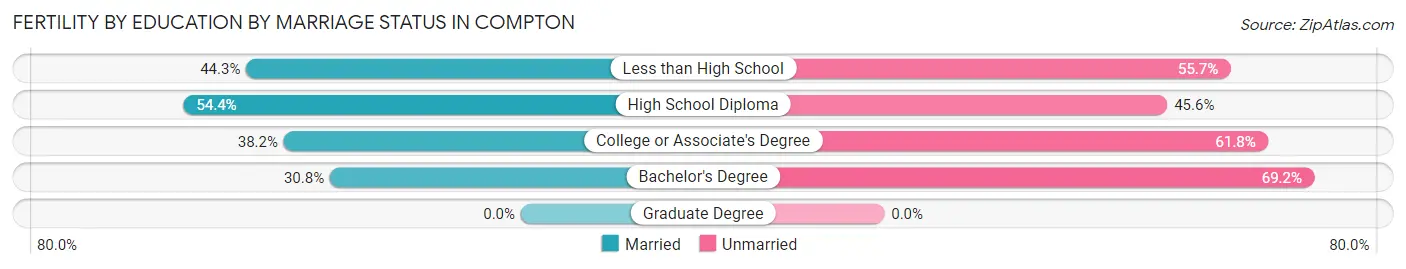
| Educational Attainment | Married | Unmarried |
| Less than High School | 170 (44.3%) | 214 (55.7%) |
| High School Diploma | 328 (54.4%) | 275 (45.6%) |
| College or Associate's Degree | 141 (38.2%) | 228 (61.8%) |
| Bachelor's Degree | 16 (30.8%) | 36 (69.2%) |
| Graduate Degree | 0 (0.0%) | 0 (0.0%) |
| Total | 655 (46.5%) | 753 (53.5%) |
Employment Characteristics in Compton
Employment by Class of Employer in Compton
Among the 39,734 employed individuals in Compton, private company employees (30,147 | 75.9%), local government employees (2,572 | 6.5%), and self-employed (not incorporated) (1,988 | 5.0%) make up the most common classes of employment.
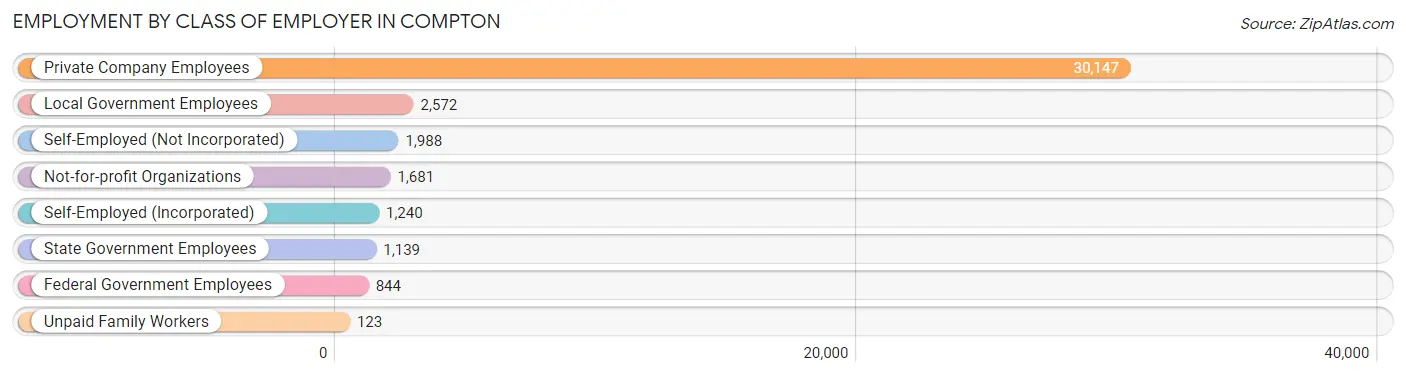
| Employer Class | # Employees | % Employees |
| Private Company Employees | 30,147 | 75.9% |
| Self-Employed (Incorporated) | 1,240 | 3.1% |
| Self-Employed (Not Incorporated) | 1,988 | 5.0% |
| Not-for-profit Organizations | 1,681 | 4.2% |
| Local Government Employees | 2,572 | 6.5% |
| State Government Employees | 1,139 | 2.9% |
| Federal Government Employees | 844 | 2.1% |
| Unpaid Family Workers | 123 | 0.3% |
| Total | 39,734 | 100.0% |
Employment Status by Age in Compton
According to the labor force statistics for Compton, out of the total population over 16 years of age (71,420), 61.8% or 44,138 individuals are in the labor force, with 7.9% or 3,487 of them unemployed. The age group with the highest labor force participation rate is 25 to 29 years, with 81.0% or 5,580 individuals in the labor force. Within the labor force, the 16 to 19 years age range has the highest percentage of unemployed individuals, with 24.2% or 413 of them being unemployed.
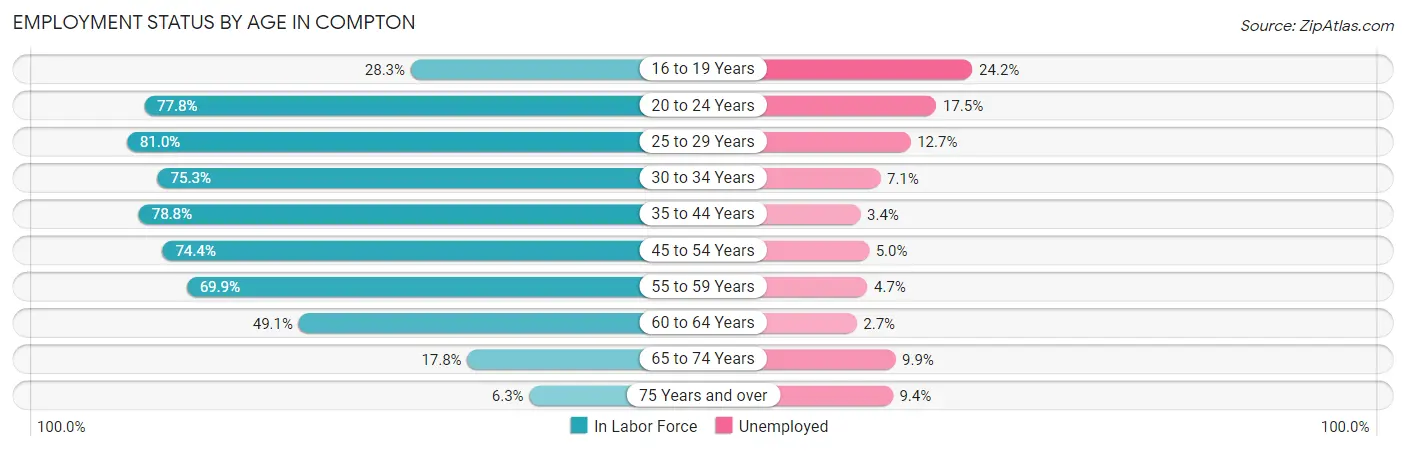
| Age Bracket | In Labor Force | Unemployed |
| 16 to 19 Years | 1,706 (28.3%) | 413 (24.2%) |
| 20 to 24 Years | 4,870 (77.8%) | 852 (17.5%) |
| 25 to 29 Years | 5,580 (81.0%) | 709 (12.7%) |
| 30 to 34 Years | 5,075 (75.3%) | 360 (7.1%) |
| 35 to 44 Years | 10,471 (78.8%) | 356 (3.4%) |
| 45 to 54 Years | 8,618 (74.4%) | 431 (5.0%) |
| 55 to 59 Years | 4,216 (69.9%) | 198 (4.7%) |
| 60 to 64 Years | 2,347 (49.1%) | 63 (2.7%) |
| 65 to 74 Years | 1,034 (17.8%) | 102 (9.9%) |
| 75 Years and over | 253 (6.3%) | 24 (9.4%) |
| Total | 44,138 (61.8%) | 3,487 (7.9%) |
Employment Status by Educational Attainment in Compton
According to labor force statistics for Compton, 73.6% of individuals (36,294) out of the total population between 25 and 64 years of age (49,313) are in the labor force, with 5.8% or 2,105 of them being unemployed. The group with the highest labor force participation rate are those with the educational attainment of bachelor's degree or higher, with 85.4% or 4,650 individuals in the labor force. Within the labor force, individuals with college / associate degree education have the highest percentage of unemployment, with 7.7% or 754 of them being unemployed.
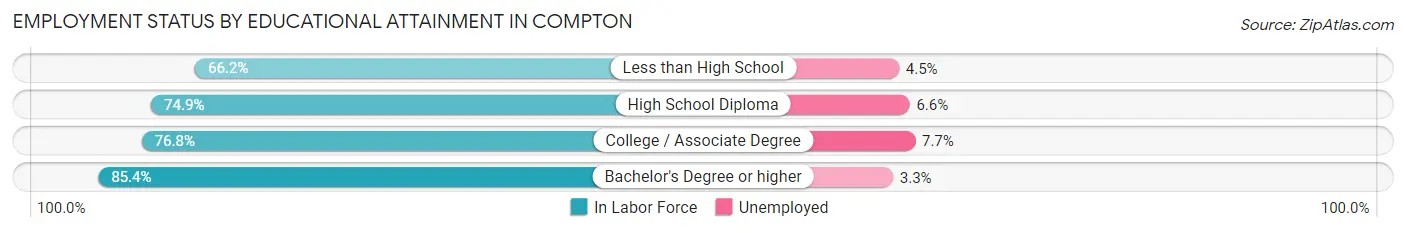
| Educational Attainment | In Labor Force | Unemployed |
| Less than High School | 11,030 (66.2%) | 750 (4.5%) |
| High School Diploma | 10,825 (74.9%) | 954 (6.6%) |
| College / Associate Degree | 9,795 (76.8%) | 982 (7.7%) |
| Bachelor's Degree or higher | 4,650 (85.4%) | 180 (3.3%) |
| Total | 36,294 (73.6%) | 2,860 (5.8%) |
Employment Occupations by Sex in Compton
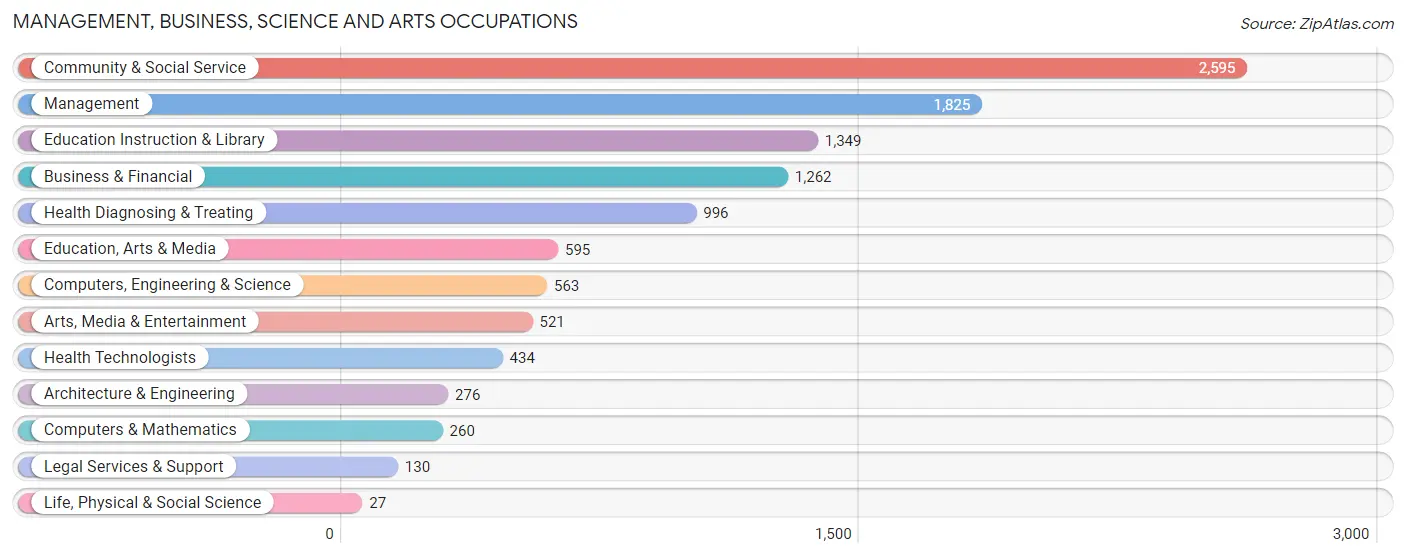
Management, Business, Science and Arts Occupations
The most common Management, Business, Science and Arts occupations in Compton are Community & Social Service (2,595 | 6.4%), Management (1,825 | 4.5%), Education Instruction & Library (1,349 | 3.3%), Business & Financial (1,262 | 3.1%), and Health Diagnosing & Treating (996 | 2.5%).
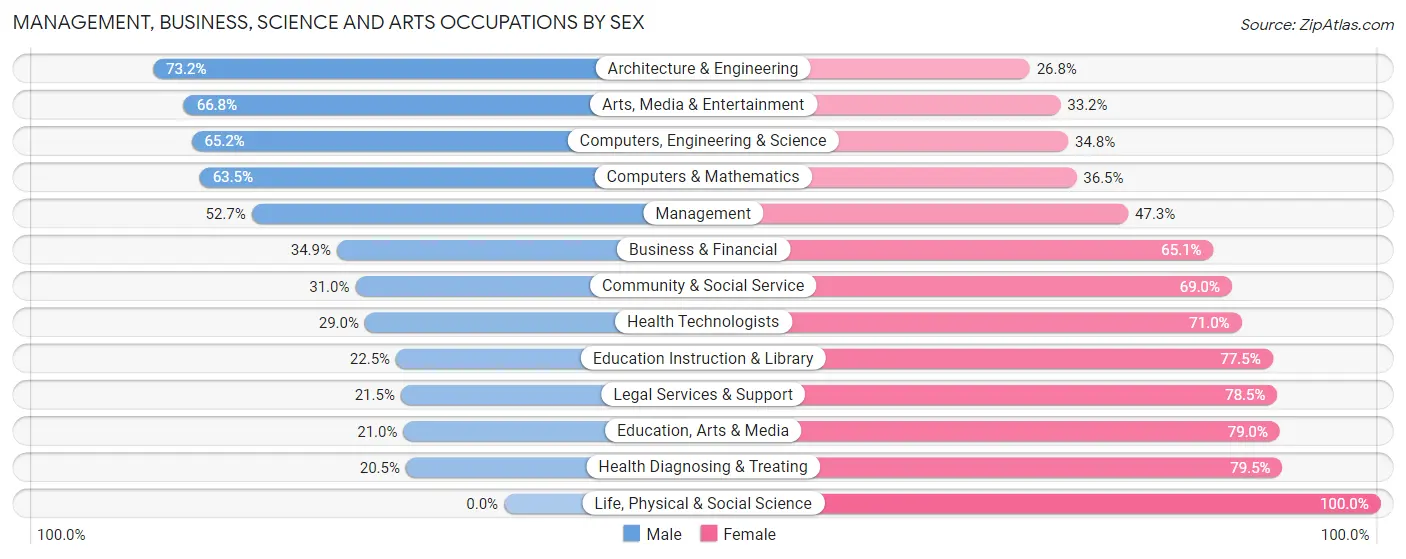
Management, Business, Science and Arts Occupations by Sex
Within the Management, Business, Science and Arts occupations in Compton, the most male-oriented occupations are Architecture & Engineering (73.2%), Arts, Media & Entertainment (66.8%), and Computers, Engineering & Science (65.2%), while the most female-oriented occupations are Life, Physical & Social Science (100.0%), Health Diagnosing & Treating (79.5%), and Education, Arts & Media (79.0%).
| Occupation | Male | Female |
| Management | 961 (52.7%) | 864 (47.3%) |
| Business & Financial | 440 (34.9%) | 822 (65.1%) |
| Computers, Engineering & Science | 367 (65.2%) | 196 (34.8%) |
| Computers & Mathematics | 165 (63.5%) | 95 (36.5%) |
| Architecture & Engineering | 202 (73.2%) | 74 (26.8%) |
| Life, Physical & Social Science | 0 (0.0%) | 27 (100.0%) |
| Community & Social Service | 805 (31.0%) | 1,790 (69.0%) |
| Education, Arts & Media | 125 (21.0%) | 470 (79.0%) |
| Legal Services & Support | 28 (21.5%) | 102 (78.5%) |
| Education Instruction & Library | 304 (22.5%) | 1,045 (77.5%) |
| Arts, Media & Entertainment | 348 (66.8%) | 173 (33.2%) |
| Health Diagnosing & Treating | 204 (20.5%) | 792 (79.5%) |
| Health Technologists | 126 (29.0%) | 308 (71.0%) |
| Total (Category) | 2,777 (38.4%) | 4,464 (61.7%) |
| Total (Overall) | 21,965 (54.1%) | 18,626 (45.9%) |
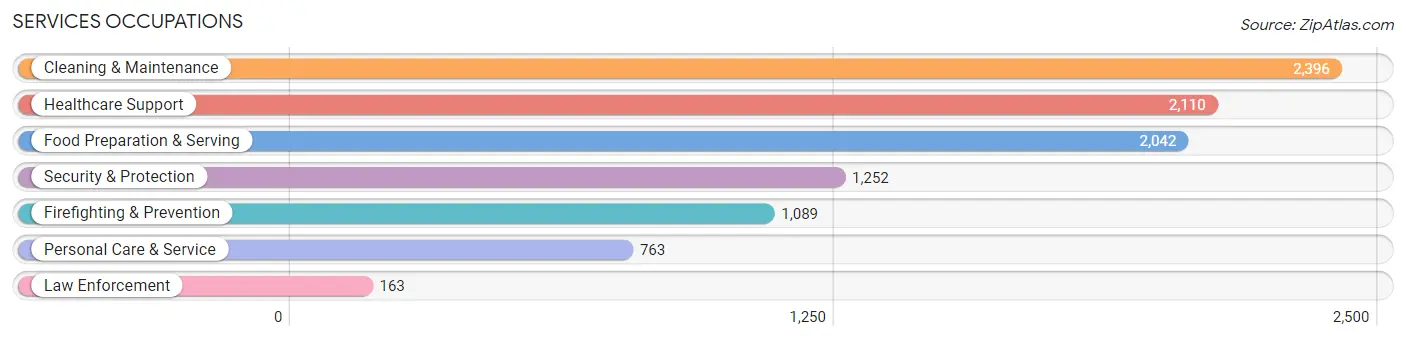
Services Occupations
The most common Services occupations in Compton are Cleaning & Maintenance (2,396 | 5.9%), Healthcare Support (2,110 | 5.2%), Food Preparation & Serving (2,042 | 5.0%), Security & Protection (1,252 | 3.1%), and Firefighting & Prevention (1,089 | 2.7%).
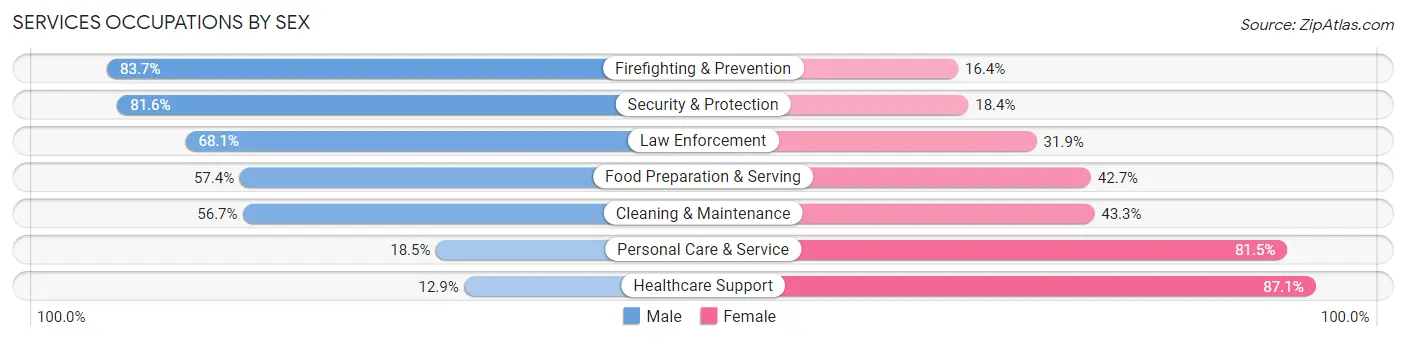
Services Occupations by Sex
Within the Services occupations in Compton, the most male-oriented occupations are Firefighting & Prevention (83.7%), Security & Protection (81.6%), and Law Enforcement (68.1%), while the most female-oriented occupations are Healthcare Support (87.1%), Personal Care & Service (81.5%), and Cleaning & Maintenance (43.3%).
| Occupation | Male | Female |
| Healthcare Support | 272 (12.9%) | 1,838 (87.1%) |
| Security & Protection | 1,022 (81.6%) | 230 (18.4%) |
| Firefighting & Prevention | 911 (83.7%) | 178 (16.4%) |
| Law Enforcement | 111 (68.1%) | 52 (31.9%) |
| Food Preparation & Serving | 1,171 (57.4%) | 871 (42.6%) |
| Cleaning & Maintenance | 1,358 (56.7%) | 1,038 (43.3%) |
| Personal Care & Service | 141 (18.5%) | 622 (81.5%) |
| Total (Category) | 3,964 (46.3%) | 4,599 (53.7%) |
| Total (Overall) | 21,965 (54.1%) | 18,626 (45.9%) |
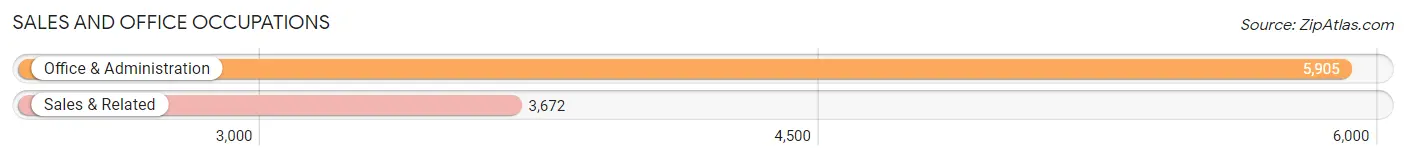
Sales and Office Occupations
The most common Sales and Office occupations in Compton are Office & Administration (5,905 | 14.5%), and Sales & Related (3,672 | 9.0%).
Sales and Office Occupations by Sex
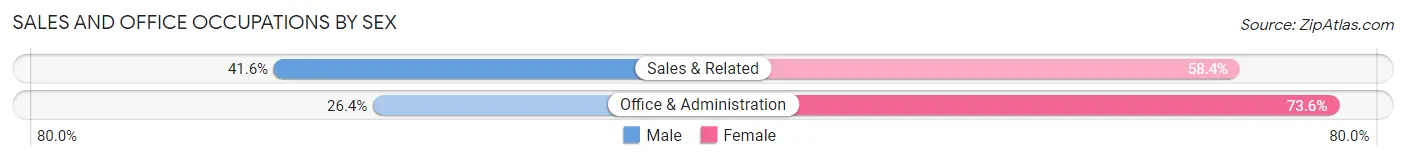
| Occupation | Male | Female |
| Sales & Related | 1,529 (41.6%) | 2,143 (58.4%) |
| Office & Administration | 1,558 (26.4%) | 4,347 (73.6%) |
| Total (Category) | 3,087 (32.2%) | 6,490 (67.8%) |
| Total (Overall) | 21,965 (54.1%) | 18,626 (45.9%) |
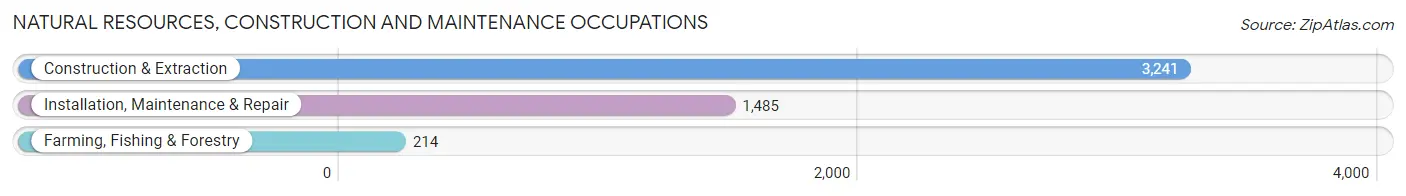
Natural Resources, Construction and Maintenance Occupations
The most common Natural Resources, Construction and Maintenance occupations in Compton are Construction & Extraction (3,241 | 8.0%), Installation, Maintenance & Repair (1,485 | 3.7%), and Farming, Fishing & Forestry (214 | 0.5%).
Natural Resources, Construction and Maintenance Occupations by Sex
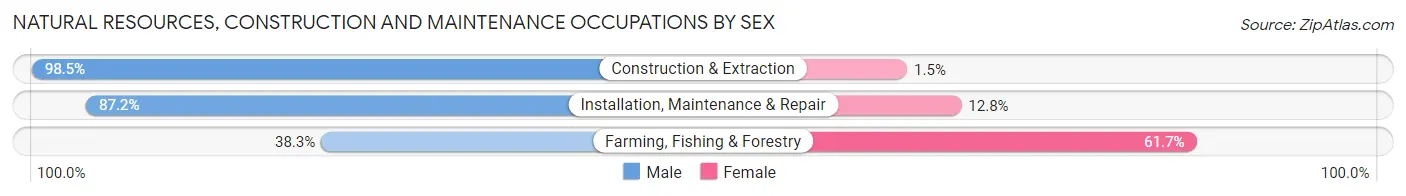
| Occupation | Male | Female |
| Farming, Fishing & Forestry | 82 (38.3%) | 132 (61.7%) |
| Construction & Extraction | 3,192 (98.5%) | 49 (1.5%) |
| Installation, Maintenance & Repair | 1,295 (87.2%) | 190 (12.8%) |
| Total (Category) | 4,569 (92.5%) | 371 (7.5%) |
| Total (Overall) | 21,965 (54.1%) | 18,626 (45.9%) |
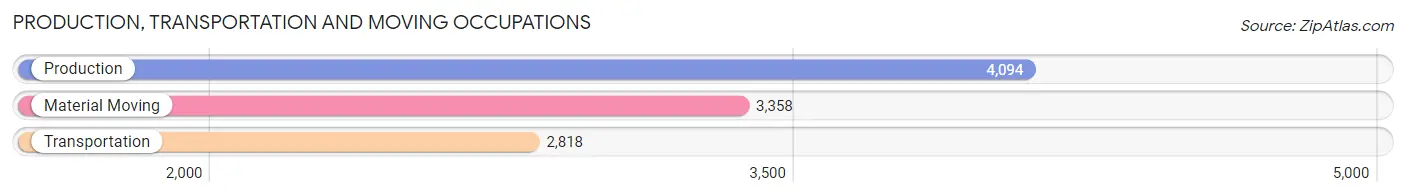
Production, Transportation and Moving Occupations
The most common Production, Transportation and Moving occupations in Compton are Production (4,094 | 10.1%), Material Moving (3,358 | 8.3%), and Transportation (2,818 | 6.9%).
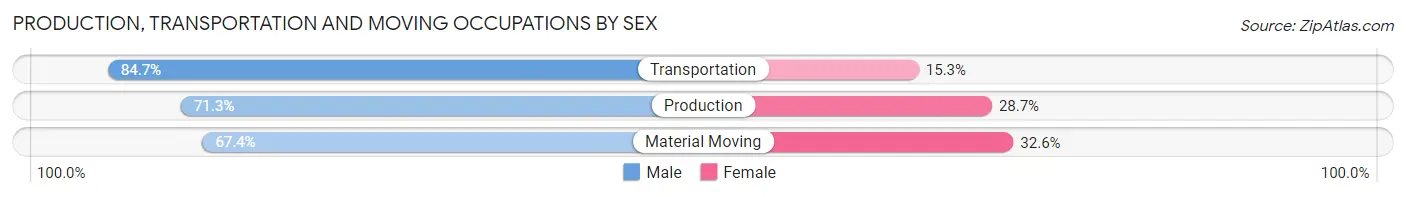
Production, Transportation and Moving Occupations by Sex
| Occupation | Male | Female |
| Production | 2,919 (71.3%) | 1,175 (28.7%) |
| Transportation | 2,387 (84.7%) | 431 (15.3%) |
| Material Moving | 2,262 (67.4%) | 1,096 (32.6%) |
| Total (Category) | 7,568 (73.7%) | 2,702 (26.3%) |
| Total (Overall) | 21,965 (54.1%) | 18,626 (45.9%) |
Employment Industries by Sex in Compton
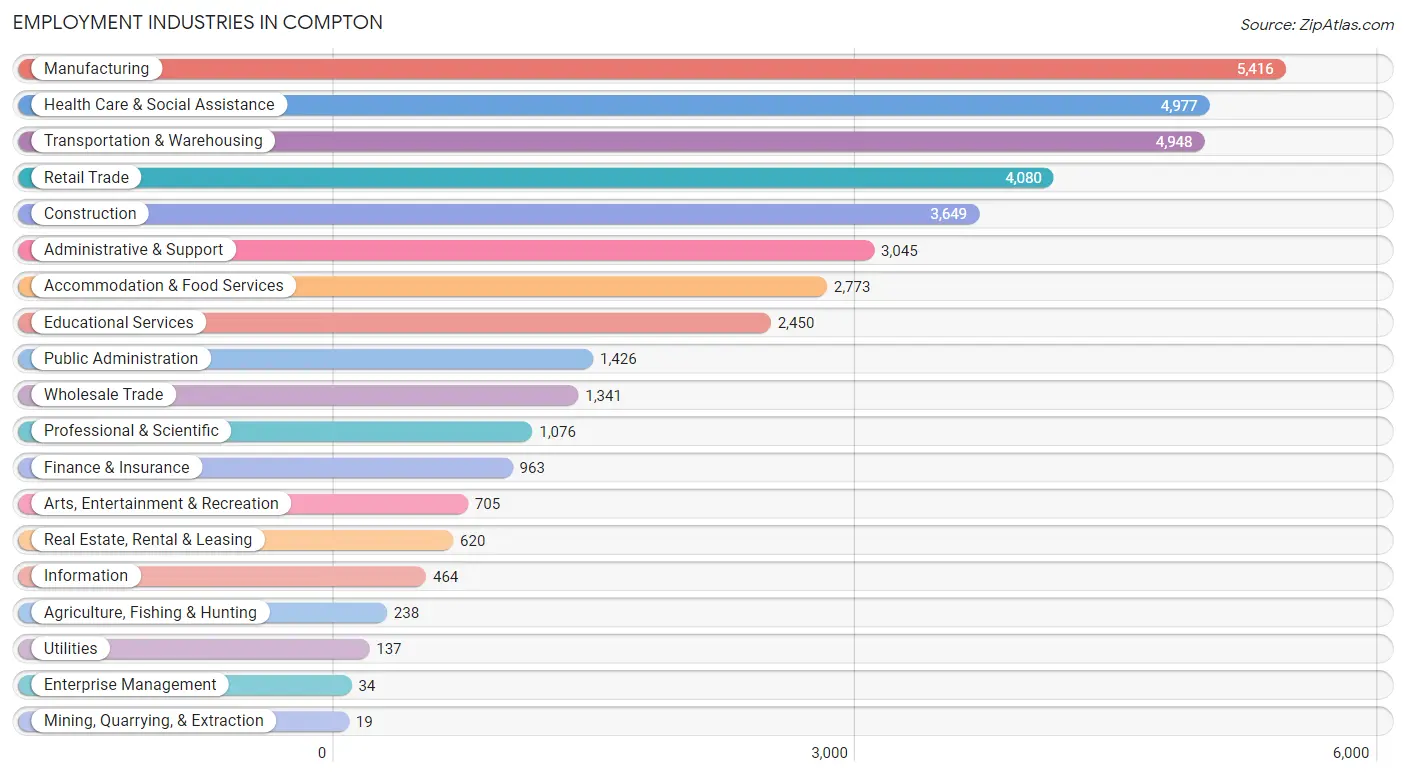
Employment Industries in Compton
The major employment industries in Compton include Manufacturing (5,416 | 13.3%), Health Care & Social Assistance (4,977 | 12.3%), Transportation & Warehousing (4,948 | 12.2%), Retail Trade (4,080 | 10.1%), and Construction (3,649 | 9.0%).
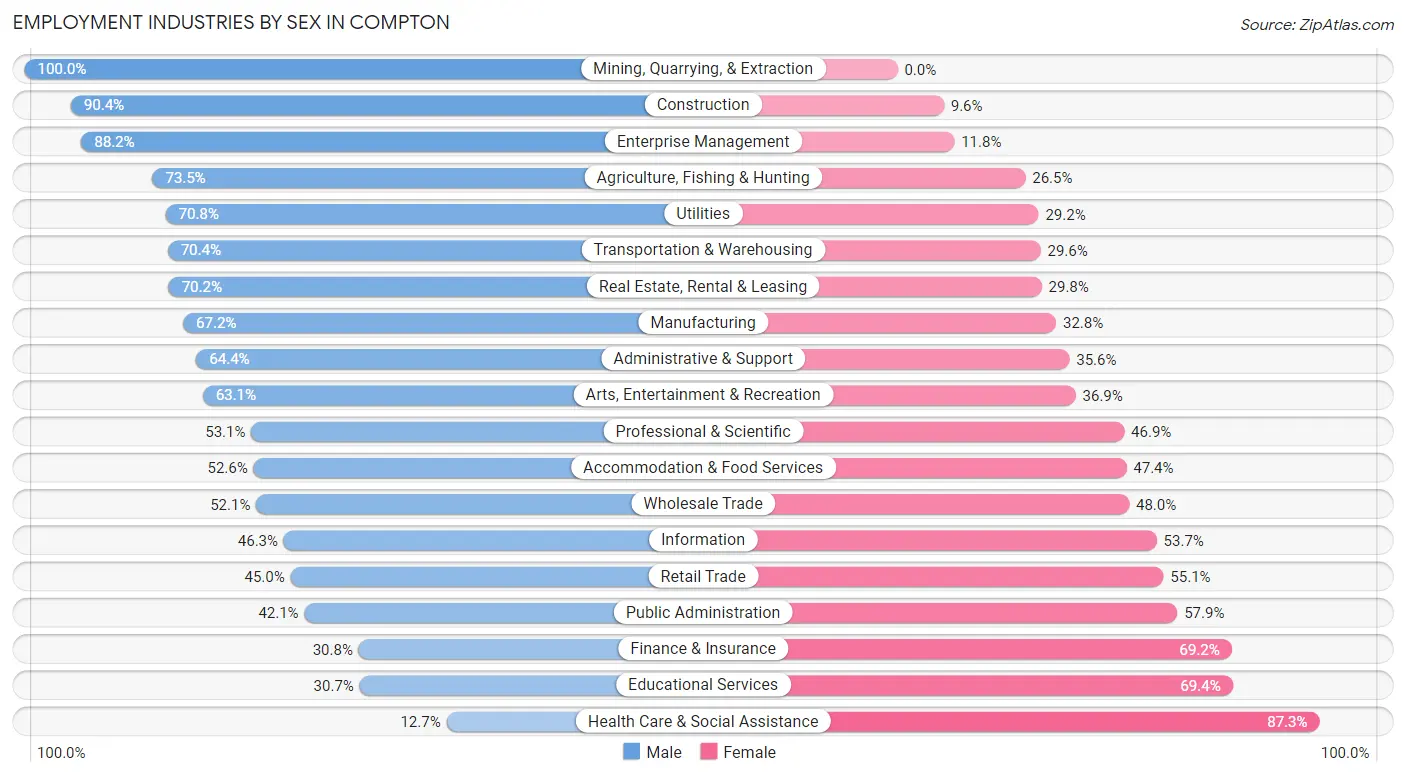
Employment Industries by Sex in Compton
The Compton industries that see more men than women are Mining, Quarrying, & Extraction (100.0%), Construction (90.4%), and Enterprise Management (88.2%), whereas the industries that tend to have a higher number of women are Health Care & Social Assistance (87.3%), Educational Services (69.4%), and Finance & Insurance (69.2%).
| Industry | Male | Female |
| Agriculture, Fishing & Hunting | 175 (73.5%) | 63 (26.5%) |
| Mining, Quarrying, & Extraction | 19 (100.0%) | 0 (0.0%) |
| Construction | 3,299 (90.4%) | 350 (9.6%) |
| Manufacturing | 3,638 (67.2%) | 1,778 (32.8%) |
| Wholesale Trade | 698 (52.0%) | 643 (47.9%) |
| Retail Trade | 1,834 (45.0%) | 2,246 (55.0%) |
| Transportation & Warehousing | 3,482 (70.4%) | 1,466 (29.6%) |
| Utilities | 97 (70.8%) | 40 (29.2%) |
| Information | 215 (46.3%) | 249 (53.7%) |
| Finance & Insurance | 297 (30.8%) | 666 (69.2%) |
| Real Estate, Rental & Leasing | 435 (70.2%) | 185 (29.8%) |
| Professional & Scientific | 571 (53.1%) | 505 (46.9%) |
| Enterprise Management | 30 (88.2%) | 4 (11.8%) |
| Administrative & Support | 1,962 (64.4%) | 1,083 (35.6%) |
| Educational Services | 751 (30.6%) | 1,699 (69.4%) |
| Health Care & Social Assistance | 631 (12.7%) | 4,346 (87.3%) |
| Arts, Entertainment & Recreation | 445 (63.1%) | 260 (36.9%) |
| Accommodation & Food Services | 1,459 (52.6%) | 1,314 (47.4%) |
| Public Administration | 600 (42.1%) | 826 (57.9%) |
| Total | 21,965 (54.1%) | 18,626 (45.9%) |
Education in Compton
School Enrollment in Compton
The most common levels of schooling among the 25,190 students in Compton are high school (6,013 | 23.9%), middle school (5,805 | 23.0%), and elementary school (5,350 | 21.2%).
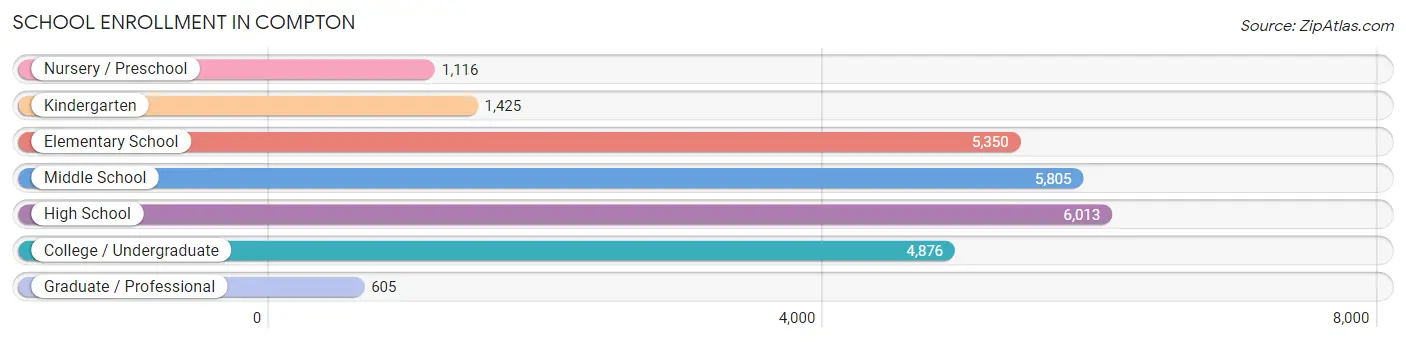
| School Level | # Students | % Students |
| Nursery / Preschool | 1,116 | 4.4% |
| Kindergarten | 1,425 | 5.7% |
| Elementary School | 5,350 | 21.2% |
| Middle School | 5,805 | 23.0% |
| High School | 6,013 | 23.9% |
| College / Undergraduate | 4,876 | 19.4% |
| Graduate / Professional | 605 | 2.4% |
| Total | 25,190 | 100.0% |
School Enrollment by Age by Funding Source in Compton
Out of a total of 25,190 students who are enrolled in schools in Compton, 1,436 (5.7%) attend a private institution, while the remaining 23,754 (94.3%) are enrolled in public schools. The age group of 25 to 34 year olds has the highest likelihood of being enrolled in private schools, with 275 (20.1% in the age bracket) enrolled. Conversely, the age group of 15 to 17 year olds has the lowest likelihood of being enrolled in a private school, with 3,944 (98.0% in the age bracket) attending a public institution.
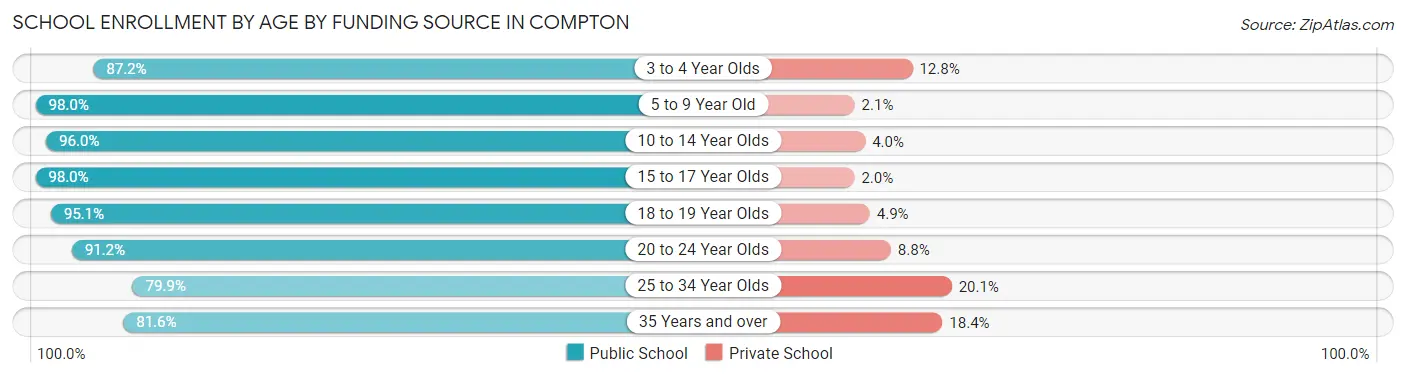
| Age Bracket | Public School | Private School |
| 3 to 4 Year Olds | 1,047 (87.2%) | 154 (12.8%) |
| 5 to 9 Year Old | 5,880 (98.0%) | 123 (2.1%) |
| 10 to 14 Year Olds | 7,353 (96.0%) | 307 (4.0%) |
| 15 to 17 Year Olds | 3,944 (98.0%) | 81 (2.0%) |
| 18 to 19 Year Olds | 1,597 (95.1%) | 82 (4.9%) |
| 20 to 24 Year Olds | 1,823 (91.2%) | 176 (8.8%) |
| 25 to 34 Year Olds | 1,092 (79.9%) | 275 (20.1%) |
| 35 Years and over | 1,025 (81.6%) | 231 (18.4%) |
| Total | 23,754 (94.3%) | 1,436 (5.7%) |
Educational Attainment by Field of Study in Compton
Business (1,266 | 19.2%), social sciences (867 | 13.2%), arts & humanities (862 | 13.1%), education (633 | 9.6%), and science & technology (556 | 8.5%) are the most common fields of study among 6,582 individuals in Compton who have obtained a bachelor's degree or higher.
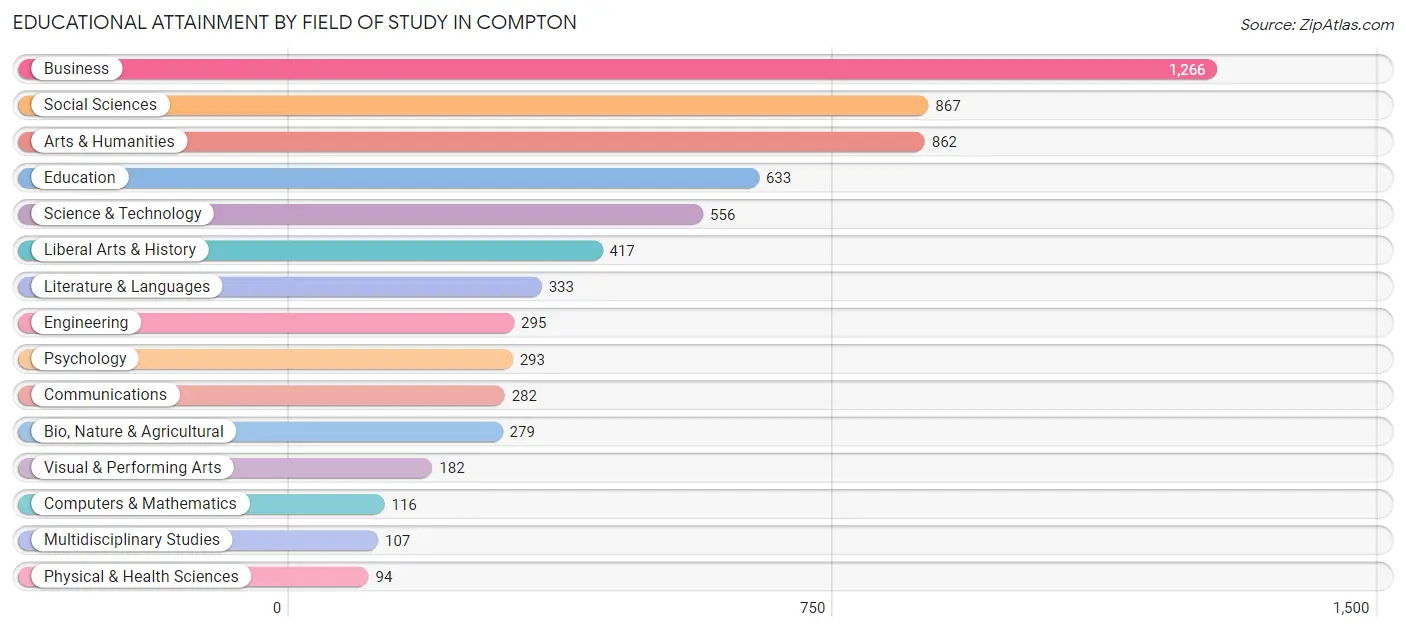
| Field of Study | # Graduates | % Graduates |
| Computers & Mathematics | 116 | 1.8% |
| Bio, Nature & Agricultural | 279 | 4.2% |
| Physical & Health Sciences | 94 | 1.4% |
| Psychology | 293 | 4.4% |
| Social Sciences | 867 | 13.2% |
| Engineering | 295 | 4.5% |
| Multidisciplinary Studies | 107 | 1.6% |
| Science & Technology | 556 | 8.5% |
| Business | 1,266 | 19.2% |
| Education | 633 | 9.6% |
| Literature & Languages | 333 | 5.1% |
| Liberal Arts & History | 417 | 6.3% |
| Visual & Performing Arts | 182 | 2.8% |
| Communications | 282 | 4.3% |
| Arts & Humanities | 862 | 13.1% |
| Total | 6,582 | 100.0% |
Transportation & Commute in Compton
Vehicle Availability by Sex in Compton
The most prevalent vehicle ownership categories in Compton are males with 2 vehicles (6,938, accounting for 32.1%) and females with 2 vehicles (5,340, making up 38.5%).
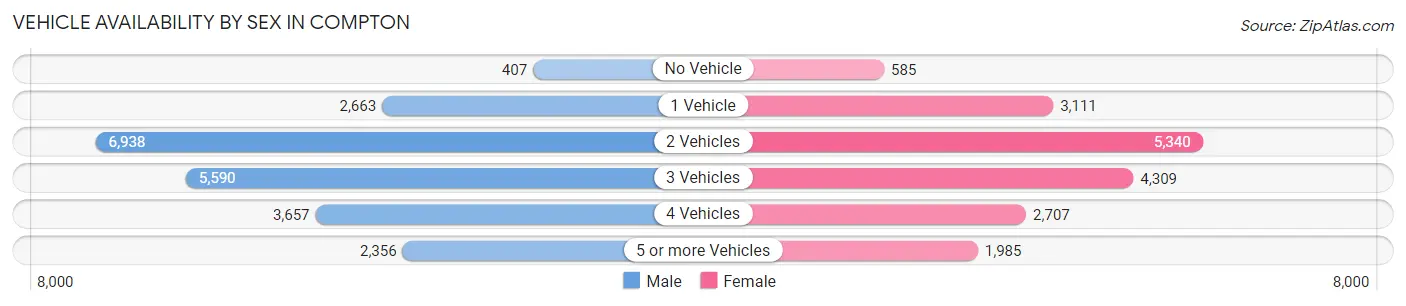
| Vehicles Available | Male | Female |
| No Vehicle | 407 (1.9%) | 585 (3.2%) |
| 1 Vehicle | 2,663 (12.3%) | 3,111 (17.2%) |
| 2 Vehicles | 6,938 (32.1%) | 5,340 (29.6%) |
| 3 Vehicles | 5,590 (25.9%) | 4,309 (23.9%) |
| 4 Vehicles | 3,657 (16.9%) | 2,707 (15.0%) |
| 5 or more Vehicles | 2,356 (10.9%) | 1,985 (11.0%) |
| Total | 21,611 (100.0%) | 18,037 (100.0%) |
Commute Time in Compton
The most frequently occuring commute durations in Compton are 30 to 34 minutes (9,809 commuters, 25.5%), 20 to 24 minutes (5,966 commuters, 15.5%), and 15 to 19 minutes (4,525 commuters, 11.8%).
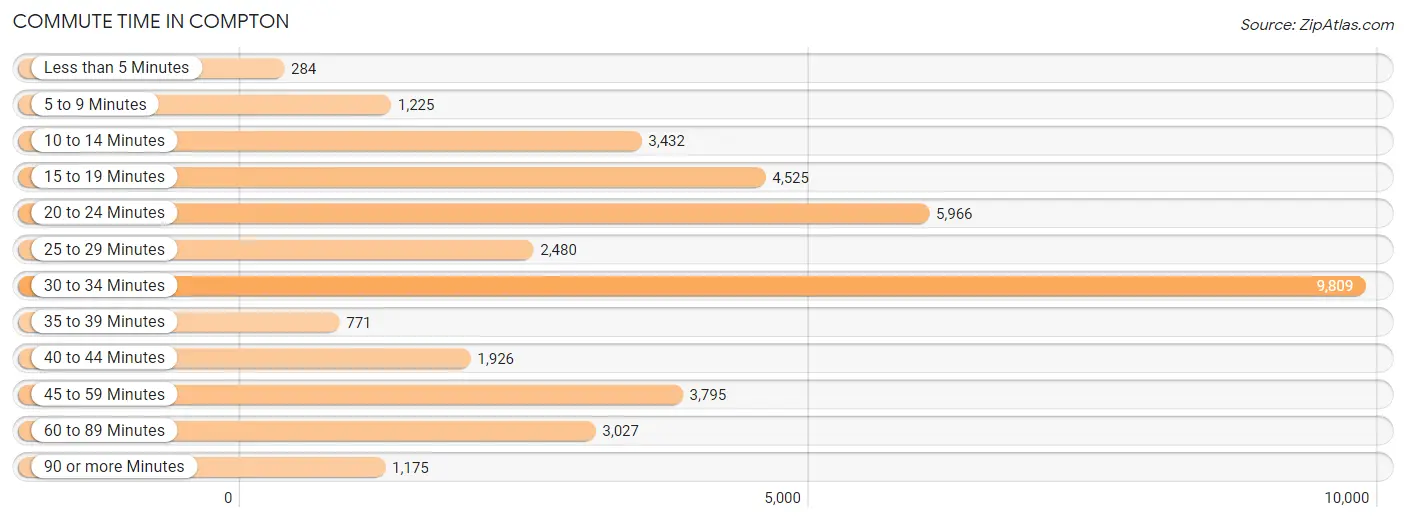
| Commute Time | # Commuters | % Commuters |
| Less than 5 Minutes | 284 | 0.7% |
| 5 to 9 Minutes | 1,225 | 3.2% |
| 10 to 14 Minutes | 3,432 | 8.9% |
| 15 to 19 Minutes | 4,525 | 11.8% |
| 20 to 24 Minutes | 5,966 | 15.5% |
| 25 to 29 Minutes | 2,480 | 6.5% |
| 30 to 34 Minutes | 9,809 | 25.5% |
| 35 to 39 Minutes | 771 | 2.0% |
| 40 to 44 Minutes | 1,926 | 5.0% |
| 45 to 59 Minutes | 3,795 | 9.9% |
| 60 to 89 Minutes | 3,027 | 7.9% |
| 90 or more Minutes | 1,175 | 3.1% |
Commute Time by Sex in Compton
The most common commute times in Compton are 30 to 34 minutes (5,483 commuters, 25.9%) for males and 30 to 34 minutes (4,326 commuters, 25.1%) for females.
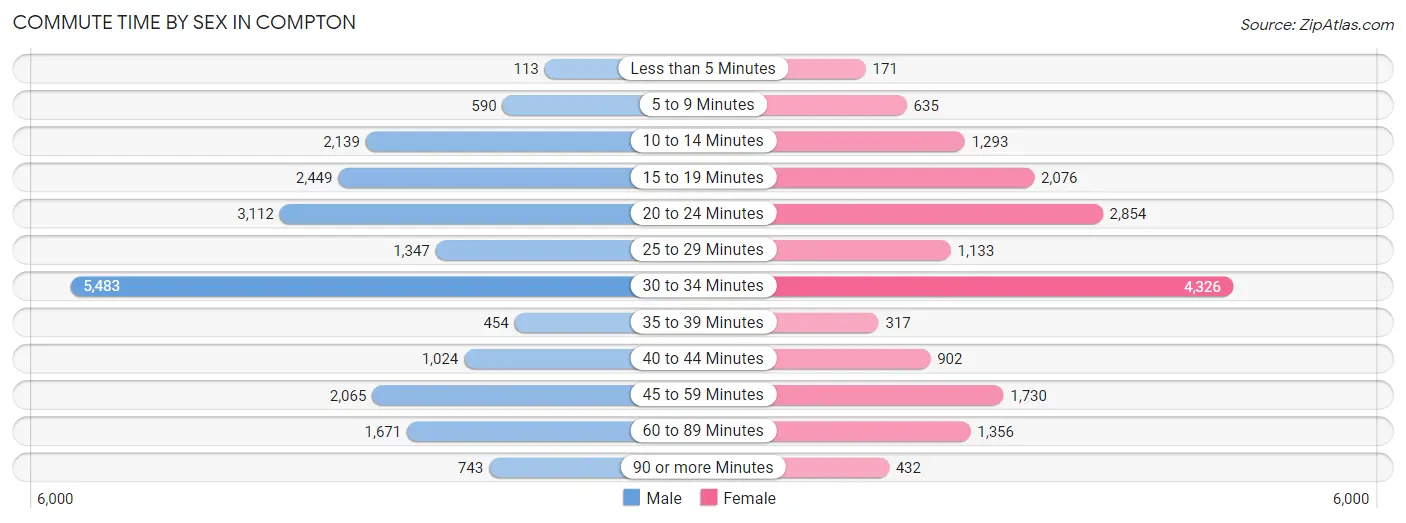
| Commute Time | Male | Female |
| Less than 5 Minutes | 113 (0.5%) | 171 (1.0%) |
| 5 to 9 Minutes | 590 (2.8%) | 635 (3.7%) |
| 10 to 14 Minutes | 2,139 (10.1%) | 1,293 (7.5%) |
| 15 to 19 Minutes | 2,449 (11.6%) | 2,076 (12.0%) |
| 20 to 24 Minutes | 3,112 (14.7%) | 2,854 (16.6%) |
| 25 to 29 Minutes | 1,347 (6.4%) | 1,133 (6.6%) |
| 30 to 34 Minutes | 5,483 (25.9%) | 4,326 (25.1%) |
| 35 to 39 Minutes | 454 (2.1%) | 317 (1.8%) |
| 40 to 44 Minutes | 1,024 (4.8%) | 902 (5.2%) |
| 45 to 59 Minutes | 2,065 (9.8%) | 1,730 (10.0%) |
| 60 to 89 Minutes | 1,671 (7.9%) | 1,356 (7.9%) |
| 90 or more Minutes | 743 (3.5%) | 432 (2.5%) |
Time of Departure to Work by Sex in Compton
The most frequent times of departure to work in Compton are 6:00 AM to 6:29 AM (3,084, 14.5%) for males and 7:00 AM to 7:29 AM (2,839, 16.5%) for females.
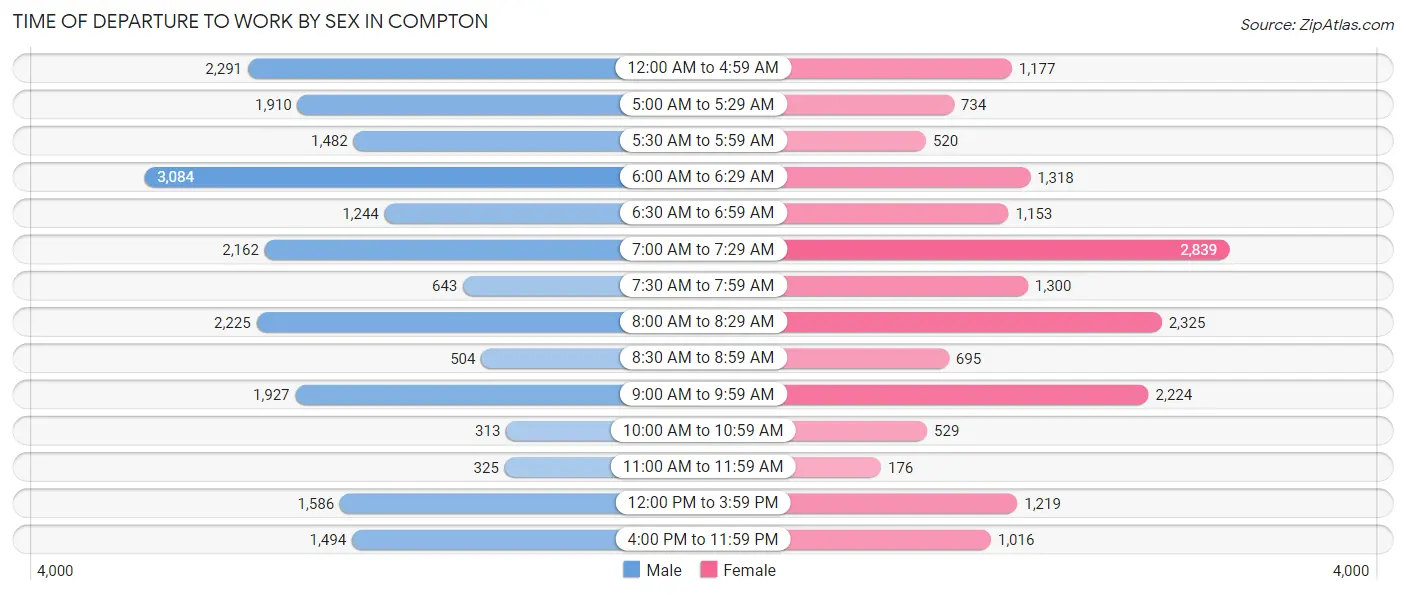
| Time of Departure | Male | Female |
| 12:00 AM to 4:59 AM | 2,291 (10.8%) | 1,177 (6.8%) |
| 5:00 AM to 5:29 AM | 1,910 (9.0%) | 734 (4.3%) |
| 5:30 AM to 5:59 AM | 1,482 (7.0%) | 520 (3.0%) |
| 6:00 AM to 6:29 AM | 3,084 (14.5%) | 1,318 (7.6%) |
| 6:30 AM to 6:59 AM | 1,244 (5.9%) | 1,153 (6.7%) |
| 7:00 AM to 7:29 AM | 2,162 (10.2%) | 2,839 (16.5%) |
| 7:30 AM to 7:59 AM | 643 (3.0%) | 1,300 (7.5%) |
| 8:00 AM to 8:29 AM | 2,225 (10.5%) | 2,325 (13.5%) |
| 8:30 AM to 8:59 AM | 504 (2.4%) | 695 (4.0%) |
| 9:00 AM to 9:59 AM | 1,927 (9.1%) | 2,224 (12.9%) |
| 10:00 AM to 10:59 AM | 313 (1.5%) | 529 (3.1%) |
| 11:00 AM to 11:59 AM | 325 (1.5%) | 176 (1.0%) |
| 12:00 PM to 3:59 PM | 1,586 (7.5%) | 1,219 (7.1%) |
| 4:00 PM to 11:59 PM | 1,494 (7.0%) | 1,016 (5.9%) |
| Total | 21,190 (100.0%) | 17,225 (100.0%) |
Housing Occupancy in Compton
Occupancy by Ownership in Compton
Of the total 24,617 dwellings in Compton, owner-occupied units account for 14,118 (57.4%), while renter-occupied units make up 10,499 (42.6%).
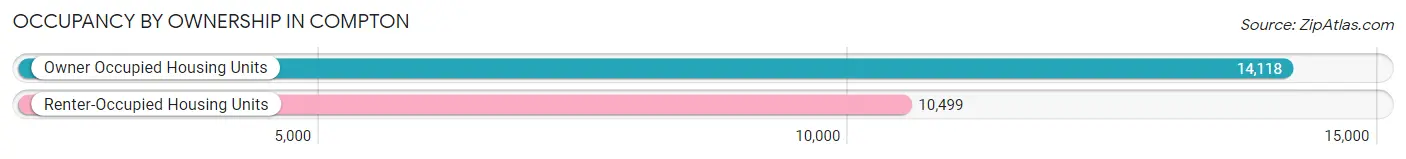
| Occupancy | # Housing Units | % Housing Units |
| Owner Occupied Housing Units | 14,118 | 57.4% |
| Renter-Occupied Housing Units | 10,499 | 42.6% |
| Total Occupied Housing Units | 24,617 | 100.0% |
Occupancy by Household Size in Compton
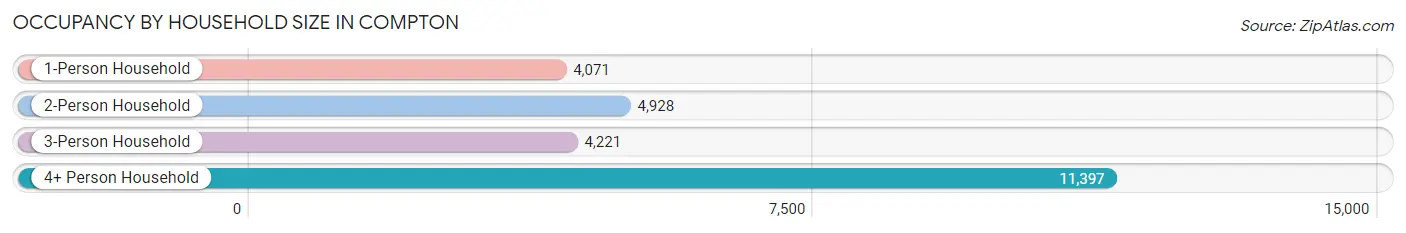
| Household Size | # Housing Units | % Housing Units |
| 1-Person Household | 4,071 | 16.5% |
| 2-Person Household | 4,928 | 20.0% |
| 3-Person Household | 4,221 | 17.2% |
| 4+ Person Household | 11,397 | 46.3% |
| Total Housing Units | 24,617 | 100.0% |
Occupancy by Ownership by Household Size in Compton
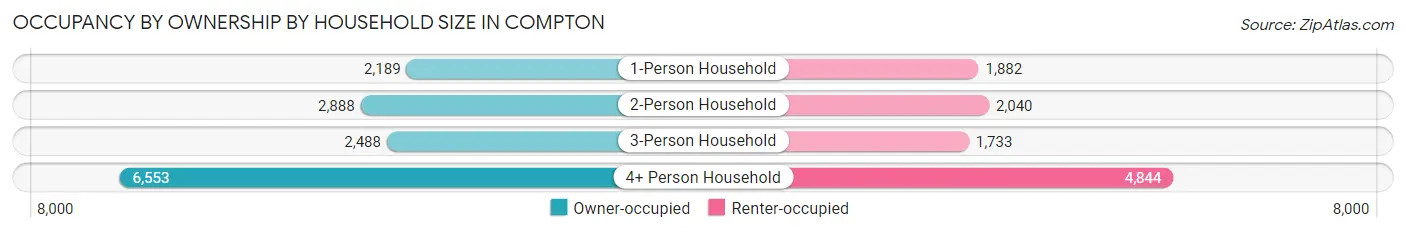
| Household Size | Owner-occupied | Renter-occupied |
| 1-Person Household | 2,189 (53.8%) | 1,882 (46.2%) |
| 2-Person Household | 2,888 (58.6%) | 2,040 (41.4%) |
| 3-Person Household | 2,488 (58.9%) | 1,733 (41.1%) |
| 4+ Person Household | 6,553 (57.5%) | 4,844 (42.5%) |
| Total Housing Units | 14,118 (57.4%) | 10,499 (42.6%) |
Occupancy by Educational Attainment in Compton
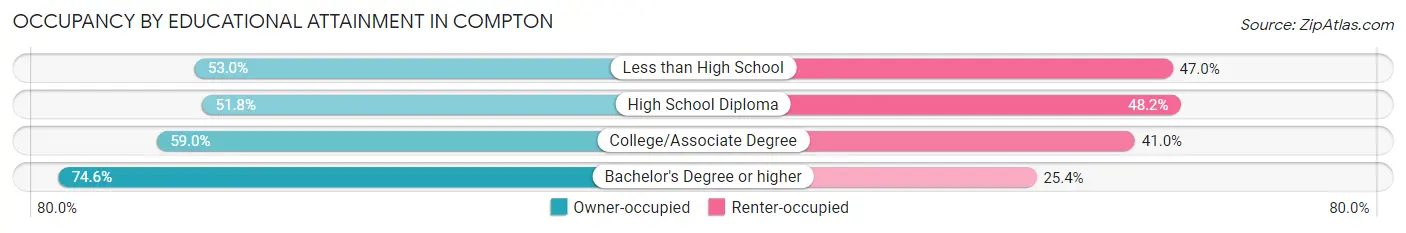
| Household Size | Owner-occupied | Renter-occupied |
| Less than High School | 4,356 (53.0%) | 3,864 (47.0%) |
| High School Diploma | 2,907 (51.8%) | 2,709 (48.2%) |
| College/Associate Degree | 4,476 (59.0%) | 3,115 (41.0%) |
| Bachelor's Degree or higher | 2,379 (74.6%) | 811 (25.4%) |
Occupancy by Age of Householder in Compton
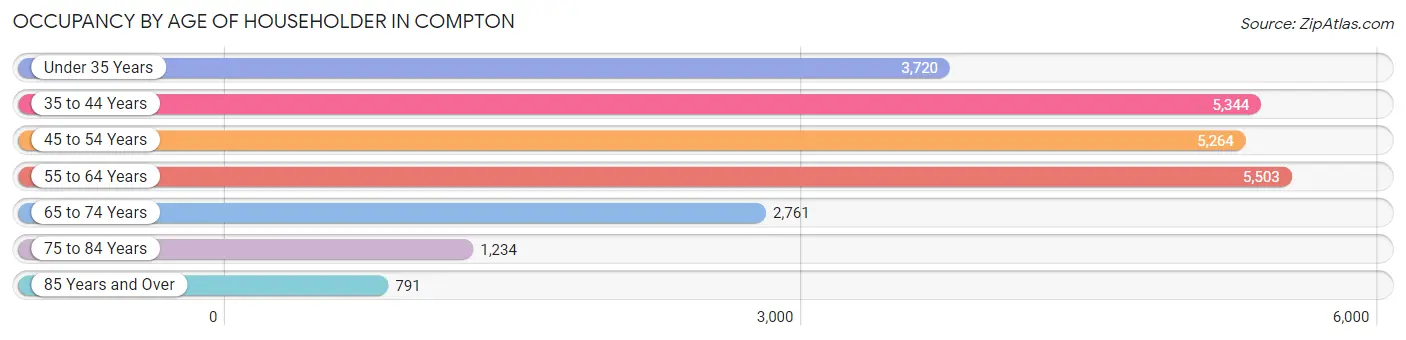
| Age Bracket | # Households | % Households |
| Under 35 Years | 3,720 | 15.1% |
| 35 to 44 Years | 5,344 | 21.7% |
| 45 to 54 Years | 5,264 | 21.4% |
| 55 to 64 Years | 5,503 | 22.4% |
| 65 to 74 Years | 2,761 | 11.2% |
| 75 to 84 Years | 1,234 | 5.0% |
| 85 Years and Over | 791 | 3.2% |
| Total | 24,617 | 100.0% |
Housing Finances in Compton
Median Income by Occupancy in Compton
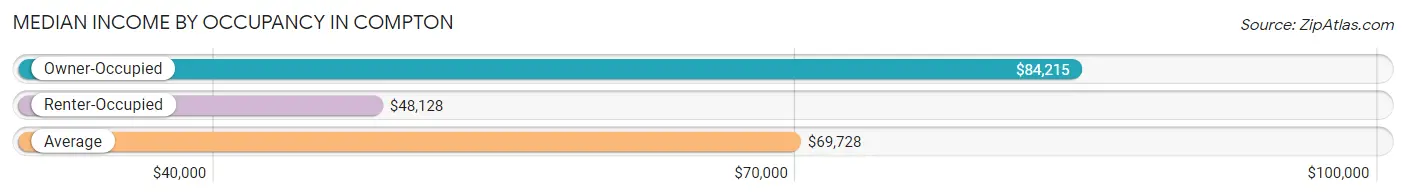
| Occupancy Type | # Households | Median Income |
| Owner-Occupied | 14,118 (57.4%) | $84,215 |
| Renter-Occupied | 10,499 (42.6%) | $48,128 |
| Average | 24,617 (100.0%) | $69,728 |
Occupancy by Householder Income Bracket in Compton
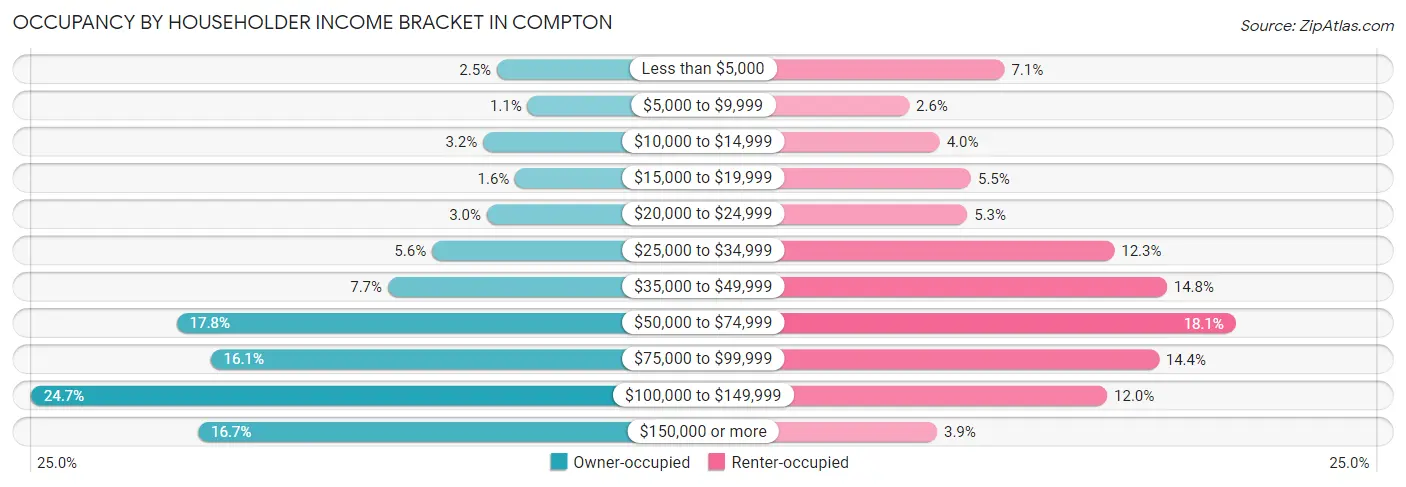
| Income Bracket | Owner-occupied | Renter-occupied |
| Less than $5,000 | 355 (2.5%) | 744 (7.1%) |
| $5,000 to $9,999 | 148 (1.1%) | 268 (2.5%) |
| $10,000 to $14,999 | 447 (3.2%) | 421 (4.0%) |
| $15,000 to $19,999 | 231 (1.6%) | 577 (5.5%) |
| $20,000 to $24,999 | 422 (3.0%) | 559 (5.3%) |
| $25,000 to $34,999 | 791 (5.6%) | 1,293 (12.3%) |
| $35,000 to $49,999 | 1,087 (7.7%) | 1,556 (14.8%) |
| $50,000 to $74,999 | 2,507 (17.8%) | 1,900 (18.1%) |
| $75,000 to $99,999 | 2,279 (16.1%) | 1,516 (14.4%) |
| $100,000 to $149,999 | 3,487 (24.7%) | 1,258 (12.0%) |
| $150,000 or more | 2,364 (16.7%) | 407 (3.9%) |
| Total | 14,118 (100.0%) | 10,499 (100.0%) |
Monthly Housing Cost Tiers in Compton
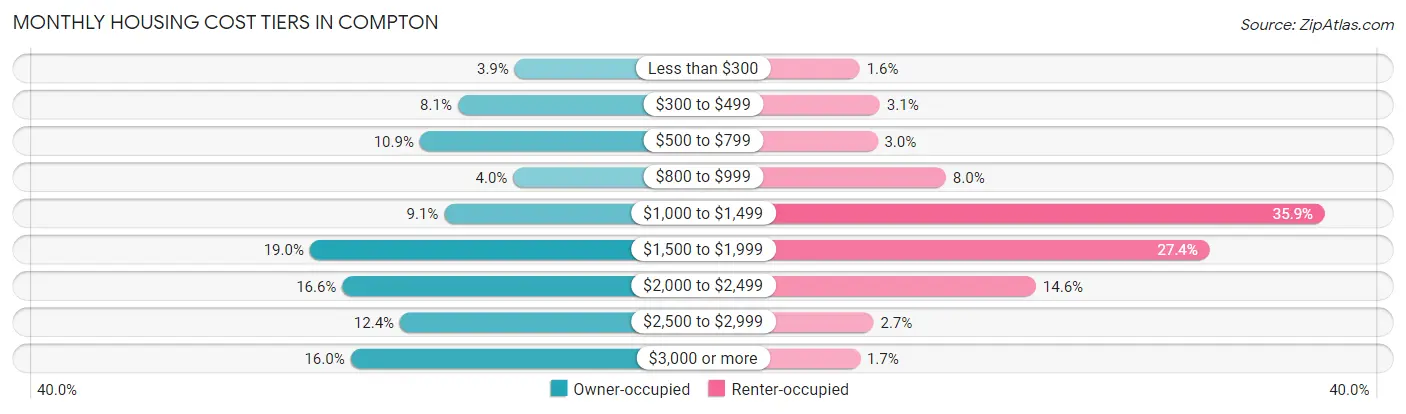
| Monthly Cost | Owner-occupied | Renter-occupied |
| Less than $300 | 552 (3.9%) | 172 (1.6%) |
| $300 to $499 | 1,143 (8.1%) | 329 (3.1%) |
| $500 to $799 | 1,539 (10.9%) | 310 (2.9%) |
| $800 to $999 | 567 (4.0%) | 839 (8.0%) |
| $1,000 to $1,499 | 1,285 (9.1%) | 3,769 (35.9%) |
| $1,500 to $1,999 | 2,683 (19.0%) | 2,878 (27.4%) |
| $2,000 to $2,499 | 2,345 (16.6%) | 1,535 (14.6%) |
| $2,500 to $2,999 | 1,745 (12.4%) | 279 (2.7%) |
| $3,000 or more | 2,259 (16.0%) | 174 (1.7%) |
| Total | 14,118 (100.0%) | 10,499 (100.0%) |
Physical Housing Characteristics in Compton
Housing Structures in Compton
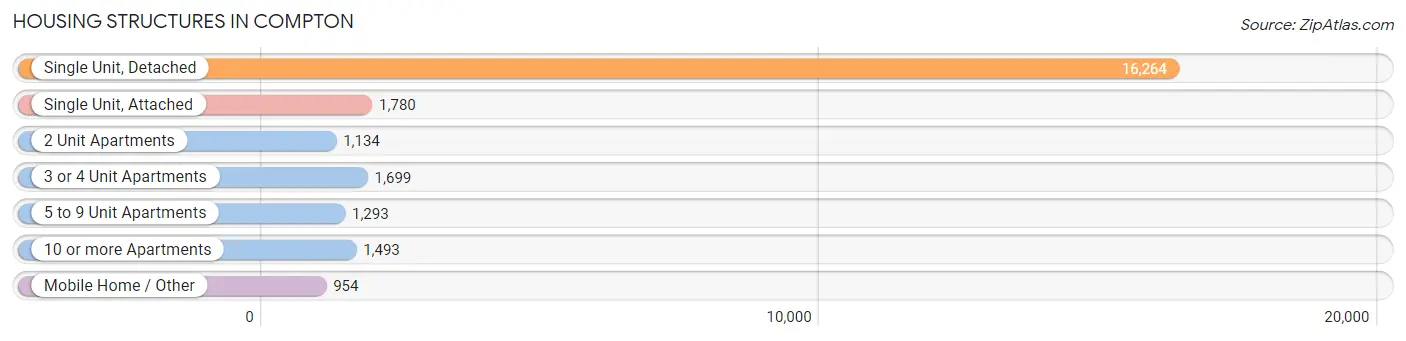
| Structure Type | # Housing Units | % Housing Units |
| Single Unit, Detached | 16,264 | 66.1% |
| Single Unit, Attached | 1,780 | 7.2% |
| 2 Unit Apartments | 1,134 | 4.6% |
| 3 or 4 Unit Apartments | 1,699 | 6.9% |
| 5 to 9 Unit Apartments | 1,293 | 5.2% |
| 10 or more Apartments | 1,493 | 6.1% |
| Mobile Home / Other | 954 | 3.9% |
| Total | 24,617 | 100.0% |
Housing Structures by Occupancy in Compton
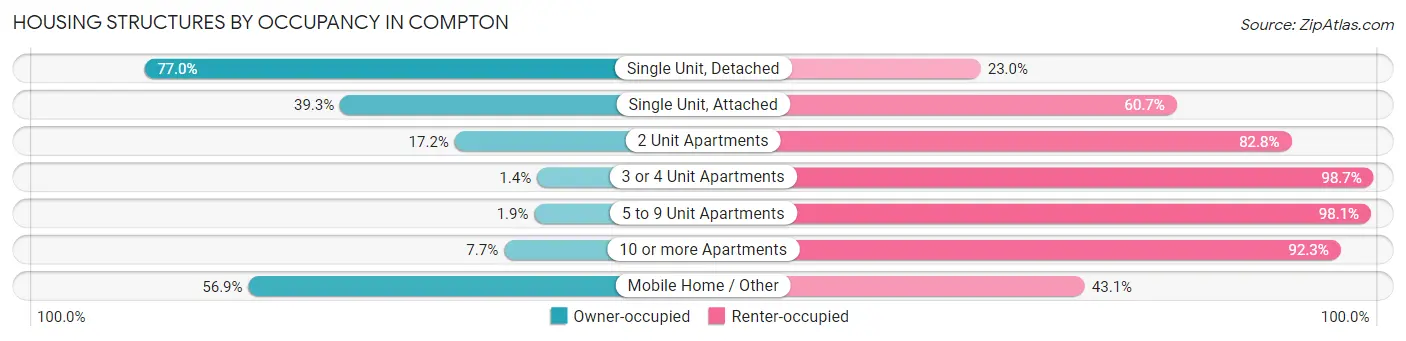
| Structure Type | Owner-occupied | Renter-occupied |
| Single Unit, Detached | 12,519 (77.0%) | 3,745 (23.0%) |
| Single Unit, Attached | 699 (39.3%) | 1,081 (60.7%) |
| 2 Unit Apartments | 195 (17.2%) | 939 (82.8%) |
| 3 or 4 Unit Apartments | 23 (1.3%) | 1,676 (98.7%) |
| 5 to 9 Unit Apartments | 24 (1.9%) | 1,269 (98.1%) |
| 10 or more Apartments | 115 (7.7%) | 1,378 (92.3%) |
| Mobile Home / Other | 543 (56.9%) | 411 (43.1%) |
| Total | 14,118 (57.4%) | 10,499 (42.6%) |
Housing Structures by Number of Rooms in Compton
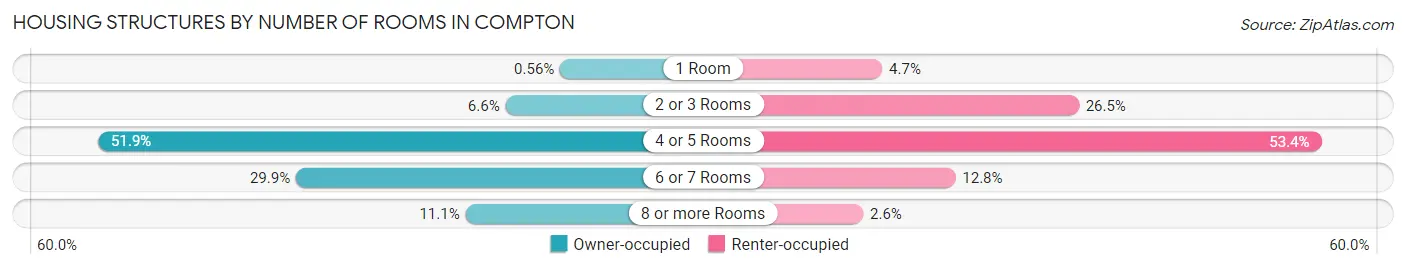
| Number of Rooms | Owner-occupied | Renter-occupied |
| 1 Room | 79 (0.6%) | 492 (4.7%) |
| 2 or 3 Rooms | 936 (6.6%) | 2,782 (26.5%) |
| 4 or 5 Rooms | 7,321 (51.9%) | 5,610 (53.4%) |
| 6 or 7 Rooms | 4,219 (29.9%) | 1,345 (12.8%) |
| 8 or more Rooms | 1,563 (11.1%) | 270 (2.6%) |
| Total | 14,118 (100.0%) | 10,499 (100.0%) |
Housing Structure by Heating Type in Compton
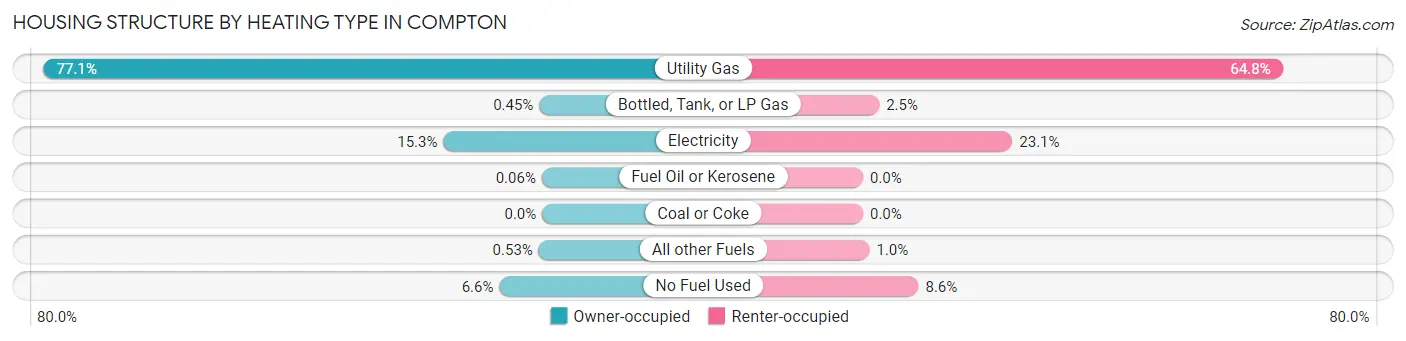
| Heating Type | Owner-occupied | Renter-occupied |
| Utility Gas | 10,880 (77.1%) | 6,808 (64.8%) |
| Bottled, Tank, or LP Gas | 64 (0.4%) | 262 (2.5%) |
| Electricity | 2,157 (15.3%) | 2,423 (23.1%) |
| Fuel Oil or Kerosene | 8 (0.1%) | 0 (0.0%) |
| Coal or Coke | 0 (0.0%) | 0 (0.0%) |
| All other Fuels | 75 (0.5%) | 105 (1.0%) |
| No Fuel Used | 934 (6.6%) | 901 (8.6%) |
| Total | 14,118 (100.0%) | 10,499 (100.0%) |
Household Vehicle Usage in Compton
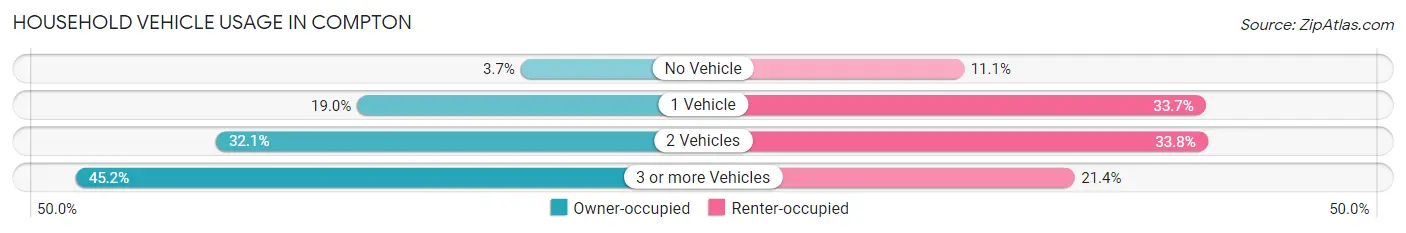
| Vehicles per Household | Owner-occupied | Renter-occupied |
| No Vehicle | 521 (3.7%) | 1,164 (11.1%) |
| 1 Vehicle | 2,677 (19.0%) | 3,534 (33.7%) |
| 2 Vehicles | 4,536 (32.1%) | 3,553 (33.8%) |
| 3 or more Vehicles | 6,384 (45.2%) | 2,248 (21.4%) |
| Total | 14,118 (100.0%) | 10,499 (100.0%) |
Real Estate & Mortgages in Compton
Real Estate and Mortgage Overview in Compton
| Characteristic | Without Mortgage | With Mortgage |
| Housing Units | 3,943 | 10,175 |
| Median Property Value | $467,200 | $499,100 |
| Median Household Income | $69,120 | $1,895 |
| Monthly Housing Costs | $548 | $2,250 |
| Real Estate Taxes | $2,407 | $192 |
Property Value by Mortgage Status in Compton
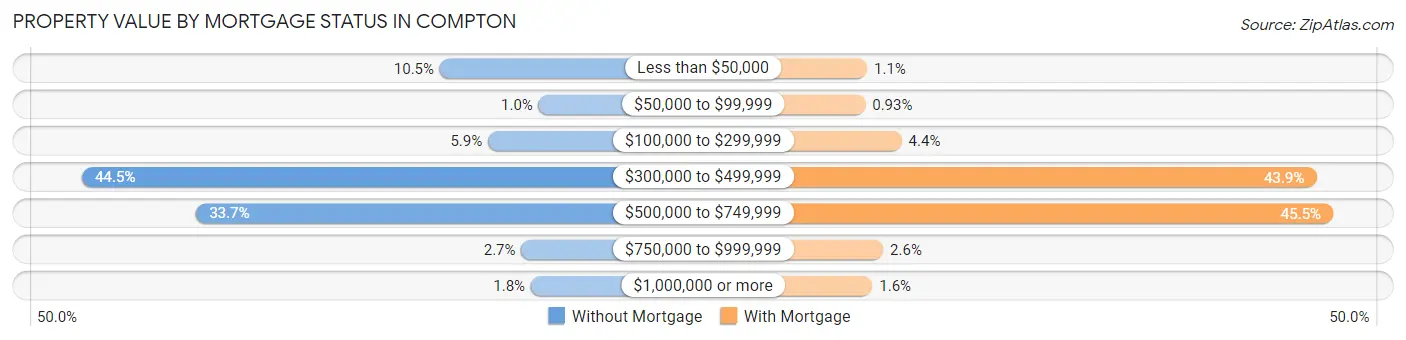
| Property Value | Without Mortgage | With Mortgage |
| Less than $50,000 | 412 (10.4%) | 112 (1.1%) |
| $50,000 to $99,999 | 41 (1.0%) | 95 (0.9%) |
| $100,000 to $299,999 | 231 (5.9%) | 447 (4.4%) |
| $300,000 to $499,999 | 1,756 (44.5%) | 4,464 (43.9%) |
| $500,000 to $749,999 | 1,327 (33.7%) | 4,626 (45.5%) |
| $750,000 to $999,999 | 106 (2.7%) | 268 (2.6%) |
| $1,000,000 or more | 70 (1.8%) | 163 (1.6%) |
| Total | 3,943 (100.0%) | 10,175 (100.0%) |
Household Income by Mortgage Status in Compton
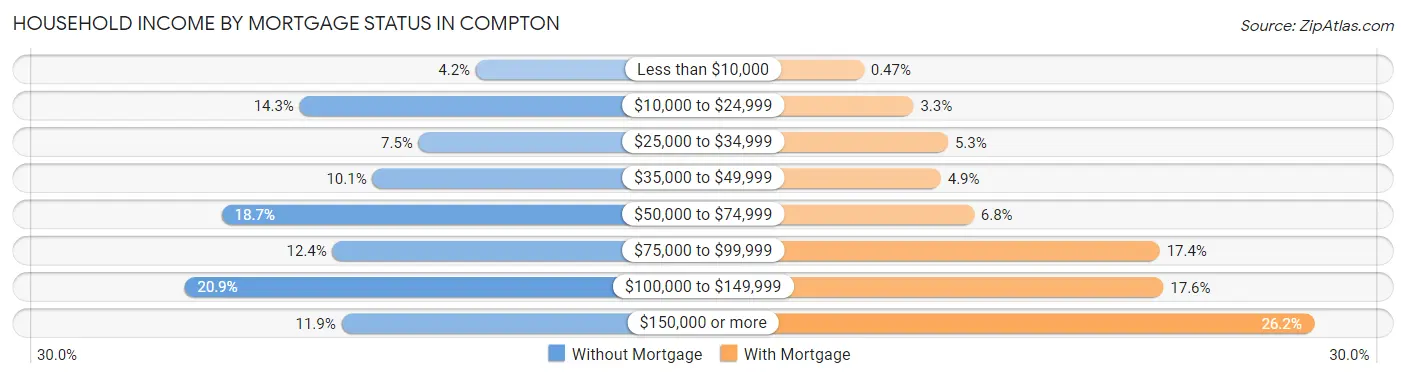
| Household Income | Without Mortgage | With Mortgage |
| Less than $10,000 | 166 (4.2%) | 48 (0.5%) |
| $10,000 to $24,999 | 563 (14.3%) | 337 (3.3%) |
| $25,000 to $34,999 | 295 (7.5%) | 537 (5.3%) |
| $35,000 to $49,999 | 399 (10.1%) | 496 (4.9%) |
| $50,000 to $74,999 | 739 (18.7%) | 688 (6.8%) |
| $75,000 to $99,999 | 489 (12.4%) | 1,768 (17.4%) |
| $100,000 to $149,999 | 823 (20.9%) | 1,790 (17.6%) |
| $150,000 or more | 469 (11.9%) | 2,664 (26.2%) |
| Total | 3,943 (100.0%) | 10,175 (100.0%) |
Property Value to Household Income Ratio in Compton
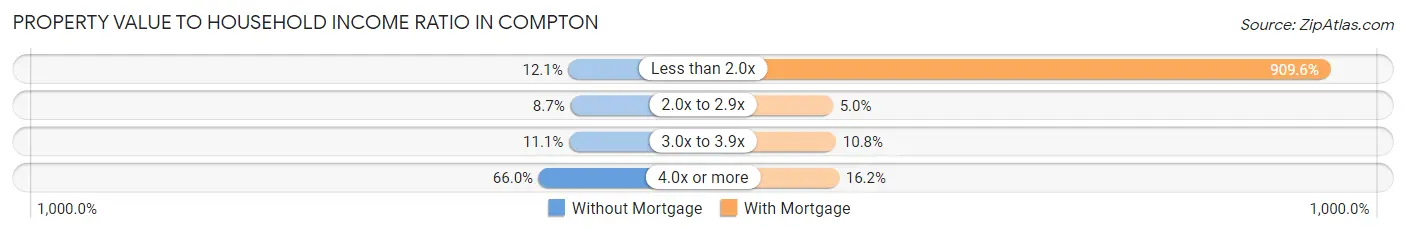
| Value-to-Income Ratio | Without Mortgage | With Mortgage |
| Less than 2.0x | 478 (12.1%) | 92,548 (909.6%) |
| 2.0x to 2.9x | 341 (8.6%) | 513 (5.0%) |
| 3.0x to 3.9x | 437 (11.1%) | 1,098 (10.8%) |
| 4.0x or more | 2,602 (66.0%) | 1,645 (16.2%) |
| Total | 3,943 (100.0%) | 10,175 (100.0%) |
Real Estate Taxes by Mortgage Status in Compton
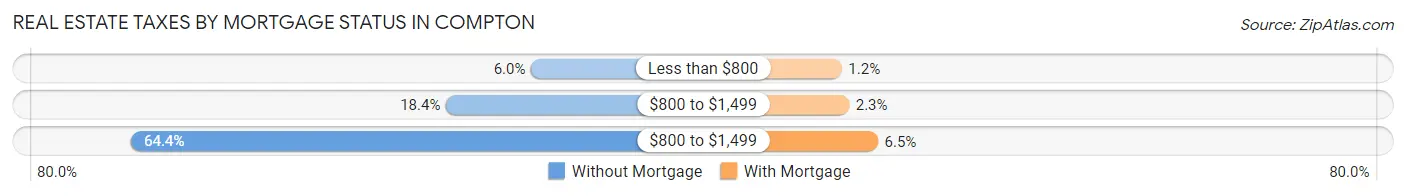
| Property Taxes | Without Mortgage | With Mortgage |
| Less than $800 | 235 (6.0%) | 124 (1.2%) |
| $800 to $1,499 | 725 (18.4%) | 234 (2.3%) |
| $800 to $1,499 | 2,541 (64.4%) | 662 (6.5%) |
| Total | 3,943 (100.0%) | 10,175 (100.0%) |
Health & Disability in Compton
Health Insurance Coverage by Age in Compton
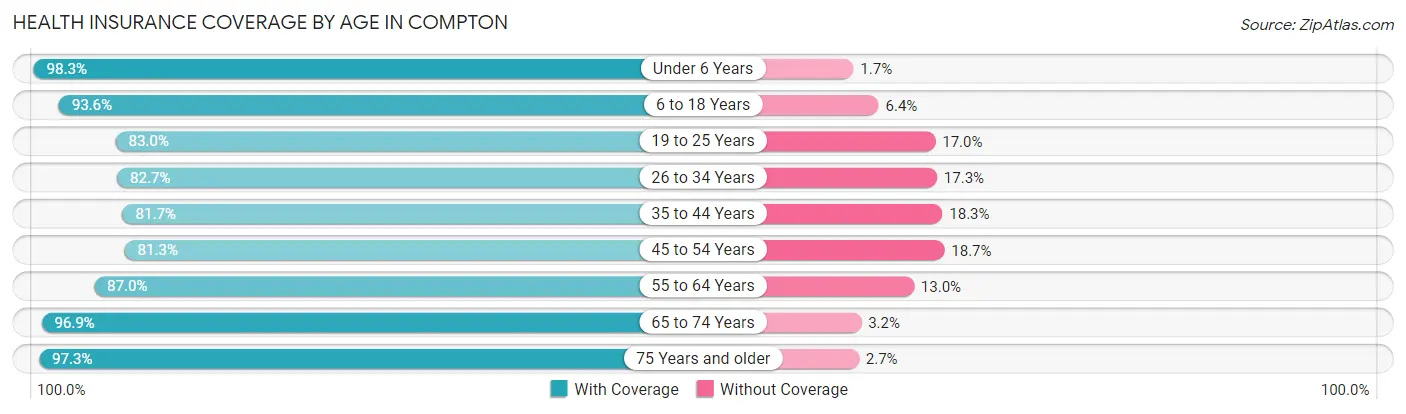
| Age Bracket | With Coverage | Without Coverage |
| Under 6 Years | 8,252 (98.3%) | 143 (1.7%) |
| 6 to 18 Years | 18,302 (93.6%) | 1,250 (6.4%) |
| 19 to 25 Years | 7,532 (83.0%) | 1,539 (17.0%) |
| 26 to 34 Years | 10,148 (82.7%) | 2,118 (17.3%) |
| 35 to 44 Years | 10,818 (81.7%) | 2,422 (18.3%) |
| 45 to 54 Years | 9,422 (81.3%) | 2,162 (18.7%) |
| 55 to 64 Years | 9,409 (87.0%) | 1,403 (13.0%) |
| 65 to 74 Years | 5,563 (96.9%) | 181 (3.2%) |
| 75 Years and older | 3,874 (97.3%) | 108 (2.7%) |
| Total | 83,320 (88.0%) | 11,326 (12.0%) |
Health Insurance Coverage by Citizenship Status in Compton
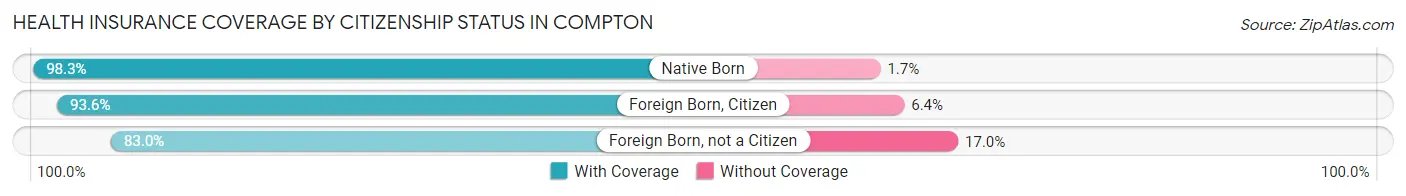
| Citizenship Status | With Coverage | Without Coverage |
| Native Born | 8,252 (98.3%) | 143 (1.7%) |
| Foreign Born, Citizen | 18,302 (93.6%) | 1,250 (6.4%) |
| Foreign Born, not a Citizen | 7,532 (83.0%) | 1,539 (17.0%) |
Health Insurance Coverage by Household Income in Compton
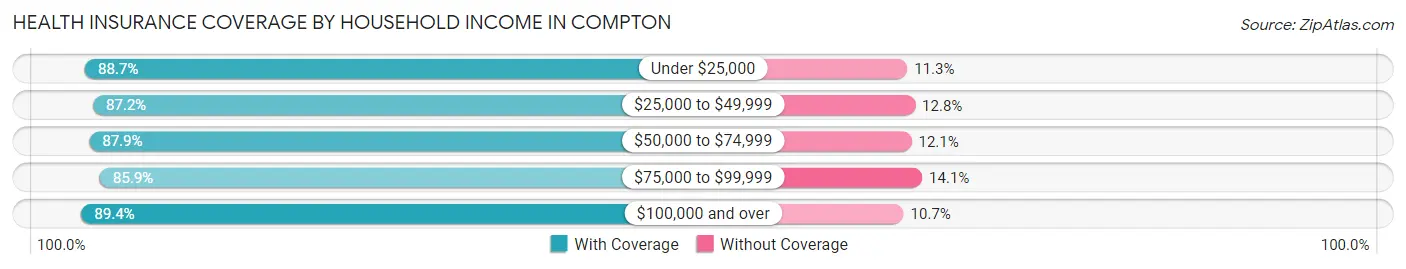
| Household Income | With Coverage | Without Coverage |
| Under $25,000 | 9,439 (88.7%) | 1,207 (11.3%) |
| $25,000 to $49,999 | 14,261 (87.2%) | 2,095 (12.8%) |
| $50,000 to $74,999 | 14,392 (87.9%) | 1,987 (12.1%) |
| $75,000 to $99,999 | 13,547 (85.9%) | 2,228 (14.1%) |
| $100,000 and over | 31,280 (89.3%) | 3,727 (10.6%) |
Public vs Private Health Insurance Coverage by Age in Compton
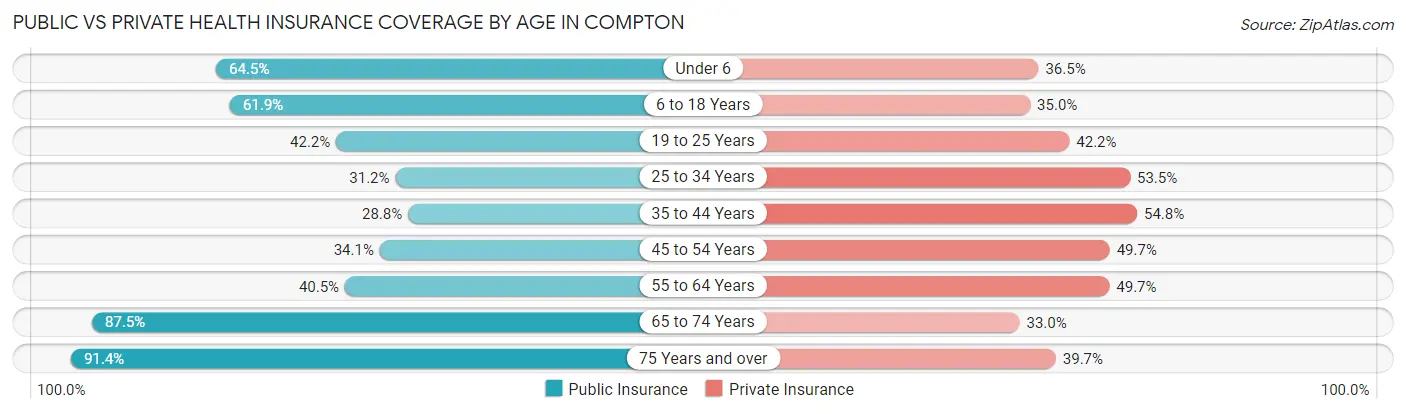
| Age Bracket | Public Insurance | Private Insurance |
| Under 6 | 5,411 (64.5%) | 3,065 (36.5%) |
| 6 to 18 Years | 12,100 (61.9%) | 6,836 (35.0%) |
| 19 to 25 Years | 3,826 (42.2%) | 3,832 (42.2%) |
| 25 to 34 Years | 3,825 (31.2%) | 6,562 (53.5%) |
| 35 to 44 Years | 3,817 (28.8%) | 7,257 (54.8%) |
| 45 to 54 Years | 3,948 (34.1%) | 5,761 (49.7%) |
| 55 to 64 Years | 4,383 (40.5%) | 5,370 (49.7%) |
| 65 to 74 Years | 5,026 (87.5%) | 1,895 (33.0%) |
| 75 Years and over | 3,639 (91.4%) | 1,582 (39.7%) |
| Total | 45,975 (48.6%) | 42,160 (44.5%) |
Disability Status by Sex by Age in Compton
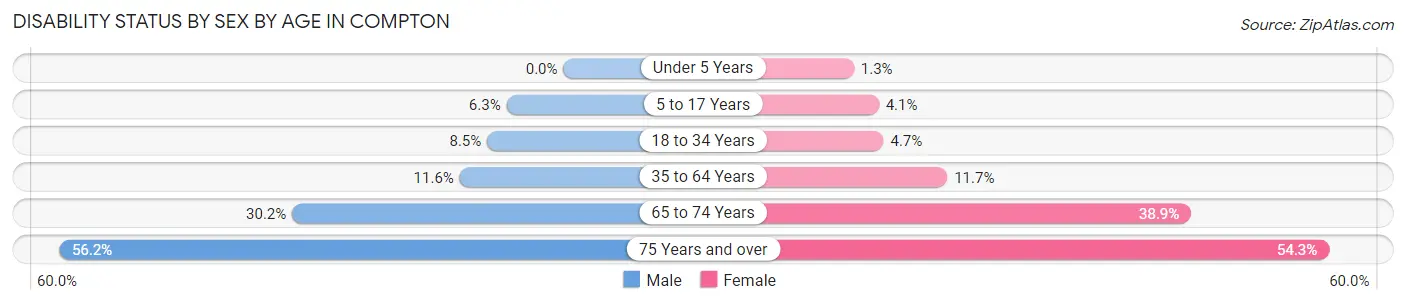
| Age Bracket | Male | Female |
| Under 5 Years | 0 (0.0%) | 53 (1.3%) |
| 5 to 17 Years | 639 (6.3%) | 384 (4.1%) |
| 18 to 34 Years | 945 (8.5%) | 544 (4.6%) |
| 35 to 64 Years | 2,072 (11.6%) | 2,078 (11.7%) |
| 65 to 74 Years | 815 (30.2%) | 1,185 (38.9%) |
| 75 Years and over | 683 (56.2%) | 1,501 (54.3%) |
Disability Class by Sex by Age in Compton
Disability Class: Hearing Difficulty
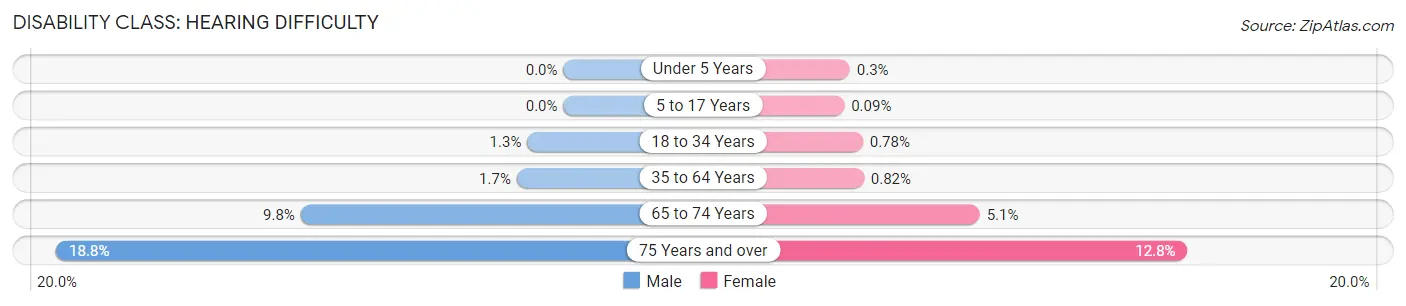
| Age Bracket | Male | Female |
| Under 5 Years | 0 (0.0%) | 12 (0.3%) |
| 5 to 17 Years | 0 (0.0%) | 8 (0.1%) |
| 18 to 34 Years | 149 (1.3%) | 91 (0.8%) |
| 35 to 64 Years | 310 (1.7%) | 145 (0.8%) |
| 65 to 74 Years | 263 (9.8%) | 156 (5.1%) |
| 75 Years and over | 229 (18.8%) | 355 (12.8%) |
Disability Class: Vision Difficulty
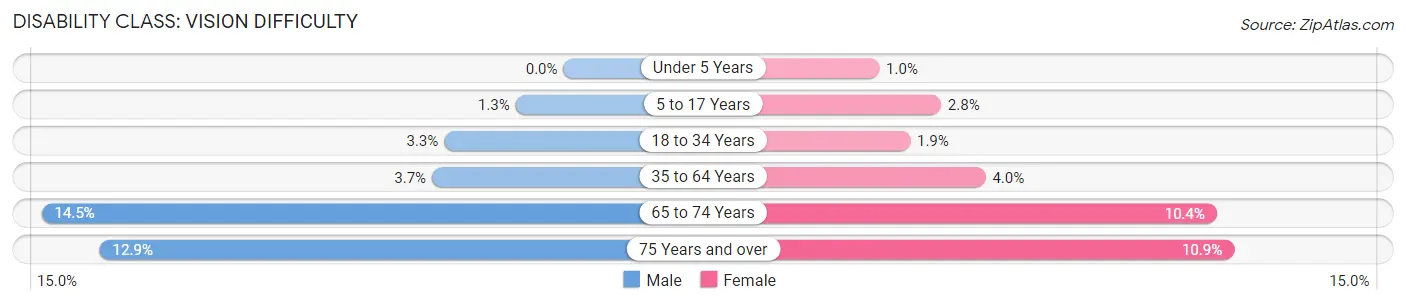
| Age Bracket | Male | Female |
| Under 5 Years | 0 (0.0%) | 41 (1.0%) |
| 5 to 17 Years | 134 (1.3%) | 258 (2.8%) |
| 18 to 34 Years | 369 (3.3%) | 222 (1.9%) |
| 35 to 64 Years | 657 (3.7%) | 708 (4.0%) |
| 65 to 74 Years | 392 (14.5%) | 318 (10.4%) |
| 75 Years and over | 157 (12.9%) | 302 (10.9%) |
Disability Class: Cognitive Difficulty
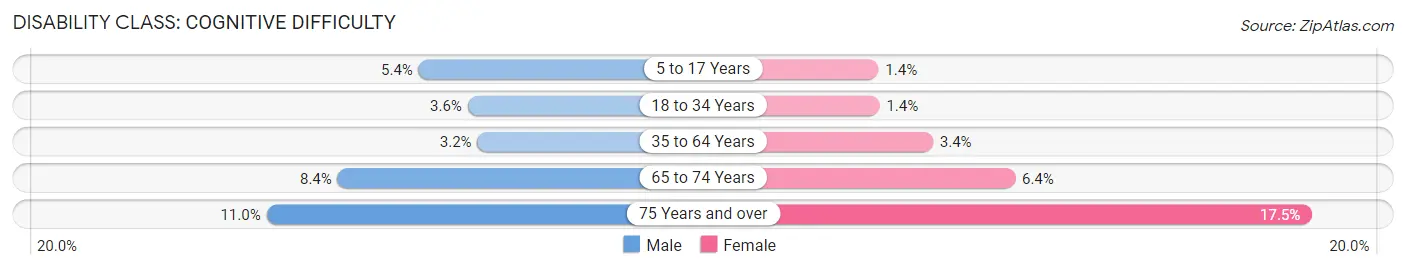
| Age Bracket | Male | Female |
| 5 to 17 Years | 542 (5.4%) | 127 (1.4%) |
| 18 to 34 Years | 395 (3.5%) | 164 (1.4%) |
| 35 to 64 Years | 573 (3.2%) | 598 (3.4%) |
| 65 to 74 Years | 226 (8.4%) | 196 (6.4%) |
| 75 Years and over | 134 (11.0%) | 483 (17.5%) |
Disability Class: Ambulatory Difficulty
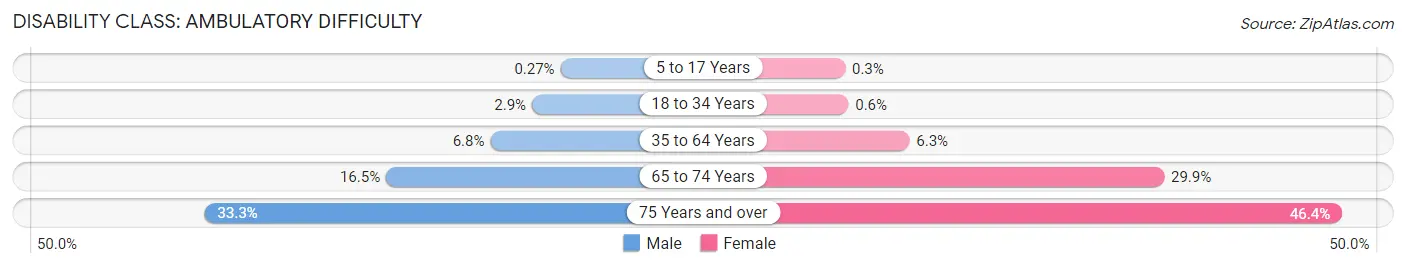
| Age Bracket | Male | Female |
| 5 to 17 Years | 27 (0.3%) | 28 (0.3%) |
| 18 to 34 Years | 325 (2.9%) | 70 (0.6%) |
| 35 to 64 Years | 1,216 (6.8%) | 1,110 (6.3%) |
| 65 to 74 Years | 444 (16.5%) | 911 (29.9%) |
| 75 Years and over | 405 (33.3%) | 1,284 (46.4%) |
Disability Class: Self-Care Difficulty
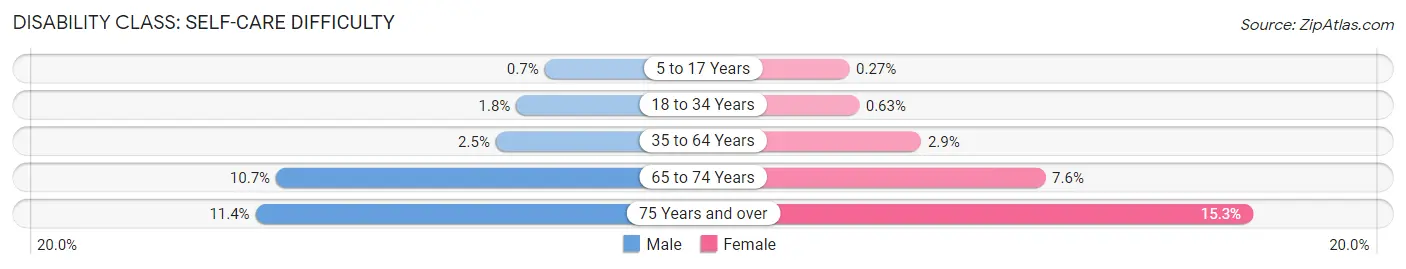
| Age Bracket | Male | Female |
| 5 to 17 Years | 71 (0.7%) | 25 (0.3%) |
| 18 to 34 Years | 195 (1.8%) | 74 (0.6%) |
| 35 to 64 Years | 450 (2.5%) | 521 (2.9%) |
| 65 to 74 Years | 288 (10.7%) | 230 (7.5%) |
| 75 Years and over | 139 (11.4%) | 422 (15.3%) |
Technology Access in Compton
Computing Device Access in Compton
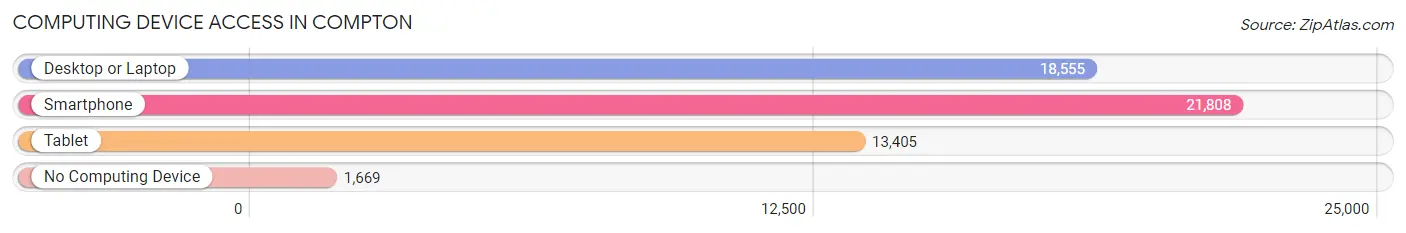
| Device Type | # Households | % Households |
| Desktop or Laptop | 18,555 | 75.4% |
| Smartphone | 21,808 | 88.6% |
| Tablet | 13,405 | 54.4% |
| No Computing Device | 1,669 | 6.8% |
| Total | 24,617 | 100.0% |
Internet Access in Compton
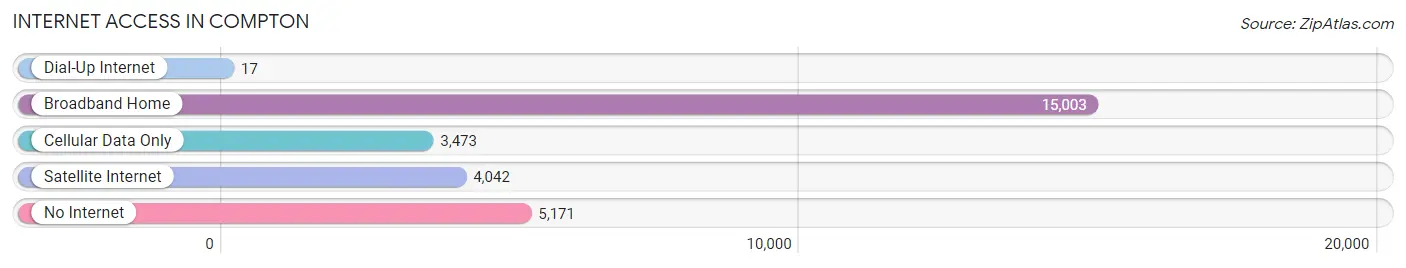
| Internet Type | # Households | % Households |
| Dial-Up Internet | 17 | 0.1% |
| Broadband Home | 15,003 | 61.0% |
| Cellular Data Only | 3,473 | 14.1% |
| Satellite Internet | 4,042 | 16.4% |
| No Internet | 5,171 | 21.0% |
| Total | 24,617 | 100.0% |
Compton Summary
Compton, California is a city located in the southern part of Los Angeles County, California. It is situated in the Gateway Cities region of the Greater Los Angeles area, and is one of the oldest cities in the county. The city has a population of approximately 97,000 people, and is known for its high crime rate and gang activity.
History
Compton was founded in 1888 by Griffith D. Compton, a wealthy landowner from the Midwest. He purchased 8,000 acres of land in the area and began to develop it into a city. The city was originally named “Gibsonville” after a local rancher, but was later changed to Compton in order to honor its founder.
In the early 1900s, Compton began to experience rapid growth due to its proximity to Los Angeles. The city was incorporated in 1922, and by the 1940s it had become a major industrial center. During this time, the city was home to several large factories, including the Ford Motor Company and the Lockheed Aircraft Corporation.
In the 1950s, Compton began to experience a population boom as African Americans moved to the area from the South. This influx of people led to a period of rapid growth and development, and by the 1960s Compton had become a major center of African American culture and music.
Geography
Compton is located in the Gateway Cities region of Los Angeles County, and is situated between the cities of Long Beach and Los Angeles. The city covers an area of approximately 10 square miles, and is bordered by the cities of Lynwood, Paramount, and South Gate.
The city is located in a coastal plain, and is surrounded by several hills. The highest point in the city is the Compton Hill, which rises to an elevation of 545 feet. The city is also home to several parks, including the Compton Creek Natural Park and the Compton Creek Regional Park.
Economy
Compton’s economy is largely based on manufacturing and retail. The city is home to several large factories, including the Ford Motor Company and the Lockheed Aircraft Corporation. The city is also home to several large retail stores, including Walmart, Target, and Home Depot.
The city’s unemployment rate is higher than the national average, and the median household income is lower than the national average. The city’s poverty rate is also higher than the national average.
Demographics
As of the 2010 census, the population of Compton was 97,000. The city is predominantly African American, with a population that is approximately 70% African American. The city is also home to a large Hispanic population, with a population that is approximately 25% Hispanic.
The median age in the city is 28.5 years, and the median household income is $41,000. The city’s poverty rate is 28.3%, which is higher than the national average.
Conclusion
Compton, California is a city located in the southern part of Los Angeles County. It was founded in 1888 by Griffith D. Compton, and has since become a major center of African American culture and music. The city covers an area of approximately 10 square miles, and is home to a population of approximately 97,000 people. The city’s economy is largely based on manufacturing and retail, and the city’s poverty rate is higher than the national average. The city is predominantly African American, with a population that is approximately 70% African American.
Common Questions
What is Per Capita Income in Compton?
Per Capita income in Compton is $22,278.
What is the Median Family Income in Compton?
Median Family Income in Compton is $73,402.
What is the Median Household income in Compton?
Median Household Income in Compton is $69,728.
What is Income or Wage Gap in Compton?
Income or Wage Gap in Compton is 13.9%.
Women in Compton earn 86.1 cents for every dollar earned by a man.
What is Family Income Deficit in Compton?
Family Income Deficit in Compton is $12,962.
Families that are below poverty line in Compton earn $12,962 less on average than the poverty threshold level.
What is Inequality or Gini Index in Compton?
Inequality or Gini Index in Compton is 0.41.
What is the Total Population of Compton?
Total Population of Compton is 94,822.
What is the Total Male Population of Compton?
Total Male Population of Compton is 46,265.
What is the Total Female Population of Compton?
Total Female Population of Compton is 48,557.
What is the Ratio of Males per 100 Females in Compton?
There are 95.28 Males per 100 Females in Compton.
What is the Ratio of Females per 100 Males in Compton?
There are 104.95 Females per 100 Males in Compton.
What is the Median Population Age in Compton?
Median Population Age in Compton is 33.4 Years.
What is the Average Family Size in Compton
Average Family Size in Compton is 4.3 People.
What is the Average Household Size in Compton
Average Household Size in Compton is 3.8 People.
How Large is the Labor Force in Compton?
There are 44,138 People in the Labor Forcein in Compton.
What is the Percentage of People in the Labor Force in Compton?
61.8% of People are in the Labor Force in Compton.
What is the Unemployment Rate in Compton?
Unemployment Rate in Compton is 7.9%.