San Pablo, CA Map & Demographics
San Pablo Map
San Pablo Overview
$27,043
PER CAPITA INCOME
$77,813
AVG FAMILY INCOME
$72,552
AVG HOUSEHOLD INCOME
20.7%
WAGE / INCOME GAP [ % ]
79.3¢/ $1
WAGE / INCOME GAP [ $ ]
$10,523
FAMILY INCOME DEFICIT
0.39
INEQUALITY / GINI INDEX
31,907
TOTAL POPULATION
16,160
MALE POPULATION
15,747
FEMALE POPULATION
102.62
MALES / 100 FEMALES
97.44
FEMALES / 100 MALES
33.2
MEDIAN AGE
3.7
AVG FAMILY SIZE
3.2
AVG HOUSEHOLD SIZE
15,779
LABOR FORCE [ PEOPLE ]
65.1%
PERCENT IN LABOR FORCE
7.9%
UNEMPLOYMENT RATE
San Pablo Zip Codes
San Pablo Area Codes
Income in San Pablo
Income Overview in San Pablo
Per Capita Income in San Pablo is $27,043, while median incomes of families and households are $77,813 and $72,552 respectively.
| Characteristic | Number | Measure |
| Per Capita Income | 31,907 | $27,043 |
| Median Family Income | 7,403 | $77,813 |
| Mean Family Income | 7,403 | $89,040 |
| Median Household Income | 9,737 | $72,552 |
| Mean Household Income | 9,737 | $84,558 |
| Income Deficit | 7,403 | $10,523 |
| Wage / Income Gap (%) | 31,907 | 20.70% |
| Wage / Income Gap ($) | 31,907 | 79.30¢ per $1 |
| Gini / Inequality Index | 31,907 | 0.39 |
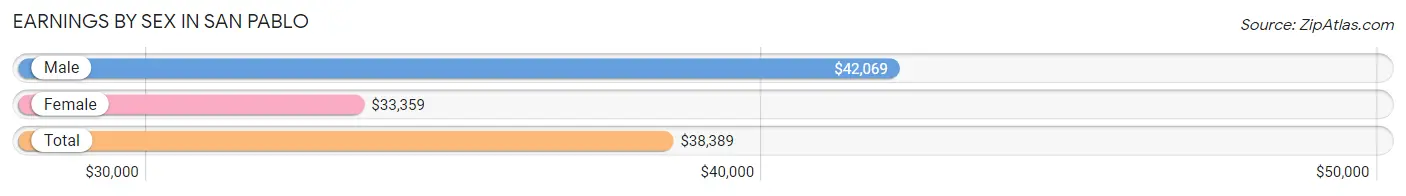
Earnings by Sex in San Pablo
Average Earnings in San Pablo are $38,389, $42,069 for men and $33,359 for women, a difference of 20.7%.
| Sex | Number | Average Earnings |
| Male | 8,801 (55.9%) | $42,069 |
| Female | 6,951 (44.1%) | $33,359 |
| Total | 15,752 (100.0%) | $38,389 |
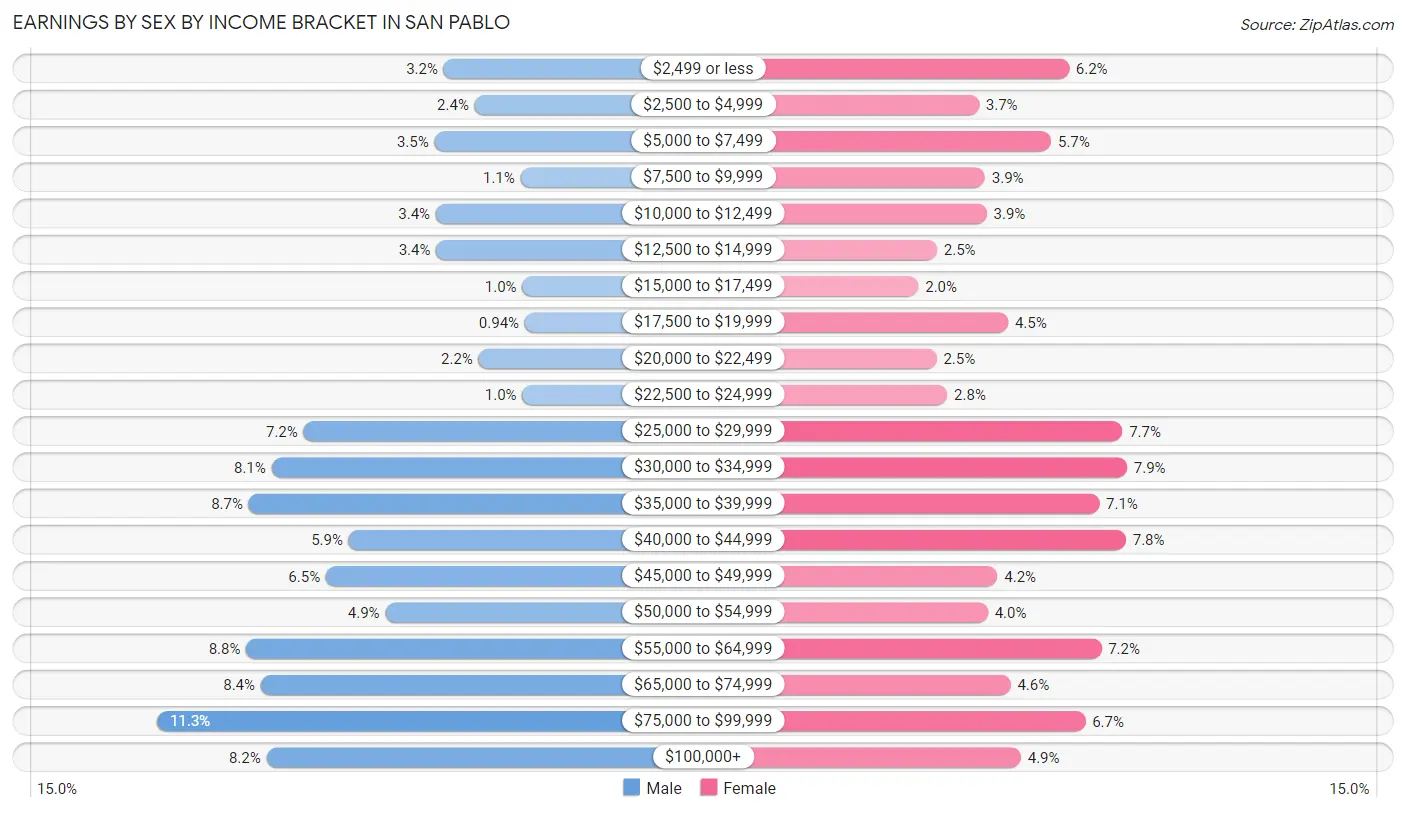
Earnings by Sex by Income Bracket in San Pablo
The most common earnings brackets in San Pablo are $75,000 to $99,999 for men (993 | 11.3%) and $30,000 to $34,999 for women (547 | 7.9%).
| Income | Male | Female |
| $2,499 or less | 283 (3.2%) | 434 (6.2%) |
| $2,500 to $4,999 | 207 (2.4%) | 258 (3.7%) |
| $5,000 to $7,499 | 306 (3.5%) | 399 (5.7%) |
| $7,500 to $9,999 | 93 (1.1%) | 270 (3.9%) |
| $10,000 to $12,499 | 303 (3.4%) | 273 (3.9%) |
| $12,500 to $14,999 | 302 (3.4%) | 176 (2.5%) |
| $15,000 to $17,499 | 89 (1.0%) | 140 (2.0%) |
| $17,500 to $19,999 | 83 (0.9%) | 315 (4.5%) |
| $20,000 to $22,499 | 197 (2.2%) | 175 (2.5%) |
| $22,500 to $24,999 | 89 (1.0%) | 196 (2.8%) |
| $25,000 to $29,999 | 630 (7.2%) | 538 (7.7%) |
| $30,000 to $34,999 | 709 (8.1%) | 547 (7.9%) |
| $35,000 to $39,999 | 766 (8.7%) | 493 (7.1%) |
| $40,000 to $44,999 | 518 (5.9%) | 545 (7.8%) |
| $45,000 to $49,999 | 575 (6.5%) | 294 (4.2%) |
| $50,000 to $54,999 | 428 (4.9%) | 275 (4.0%) |
| $55,000 to $64,999 | 772 (8.8%) | 497 (7.1%) |
| $65,000 to $74,999 | 736 (8.4%) | 320 (4.6%) |
| $75,000 to $99,999 | 993 (11.3%) | 466 (6.7%) |
| $100,000+ | 722 (8.2%) | 340 (4.9%) |
| Total | 8,801 (100.0%) | 6,951 (100.0%) |
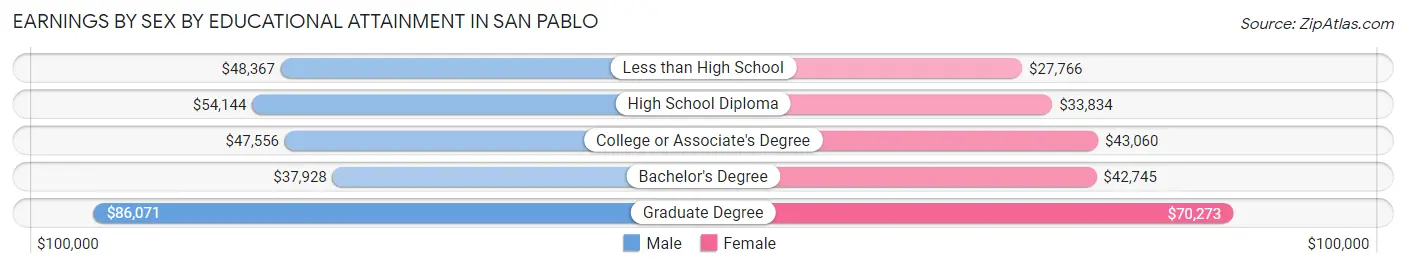
Earnings by Sex by Educational Attainment in San Pablo
Average earnings in San Pablo are $48,871 for men and $36,920 for women, a difference of 24.4%. Men with an educational attainment of graduate degree enjoy the highest average annual earnings of $86,071, while those with bachelor's degree education earn the least with $37,928. Women with an educational attainment of graduate degree earn the most with the average annual earnings of $70,273, while those with less than high school education have the smallest earnings of $27,766.
| Educational Attainment | Male Income | Female Income |
| Less than High School | $48,367 | $27,766 |
| High School Diploma | $54,144 | $33,834 |
| College or Associate's Degree | $47,556 | $43,060 |
| Bachelor's Degree | $37,928 | $42,745 |
| Graduate Degree | $86,071 | $70,273 |
| Total | $48,871 | $36,920 |
Family Income in San Pablo
Family Income Brackets in San Pablo
According to the San Pablo family income data, there are 1,636 families falling into the $50,000 to $74,999 income range, which is the most common income bracket and makes up 22.1% of all families. Conversely, the $10,000 to $14,999 income bracket is the least frequent group with only 126 families (1.7%) belonging to this category.
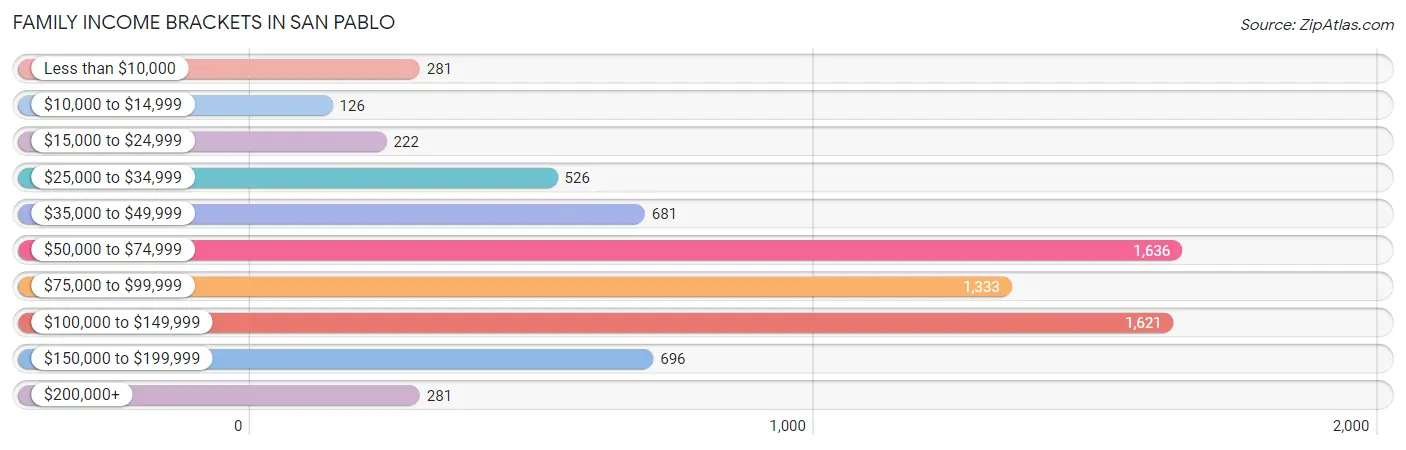
| Income Bracket | # Families | % Families |
| Less than $10,000 | 281 | 3.8% |
| $10,000 to $14,999 | 126 | 1.7% |
| $15,000 to $24,999 | 222 | 3.0% |
| $25,000 to $34,999 | 526 | 7.1% |
| $35,000 to $49,999 | 681 | 9.2% |
| $50,000 to $74,999 | 1,636 | 22.1% |
| $75,000 to $99,999 | 1,333 | 18.0% |
| $100,000 to $149,999 | 1,621 | 21.9% |
| $150,000 to $199,999 | 696 | 9.4% |
| $200,000+ | 281 | 3.8% |
Family Income by Famaliy Size in San Pablo
7+ person families (328 | 4.4%) account for the highest median family income in San Pablo with $126,364 per family, while 2-person families (2,392 | 32.3%) have the highest median income of $34,908 per family member.
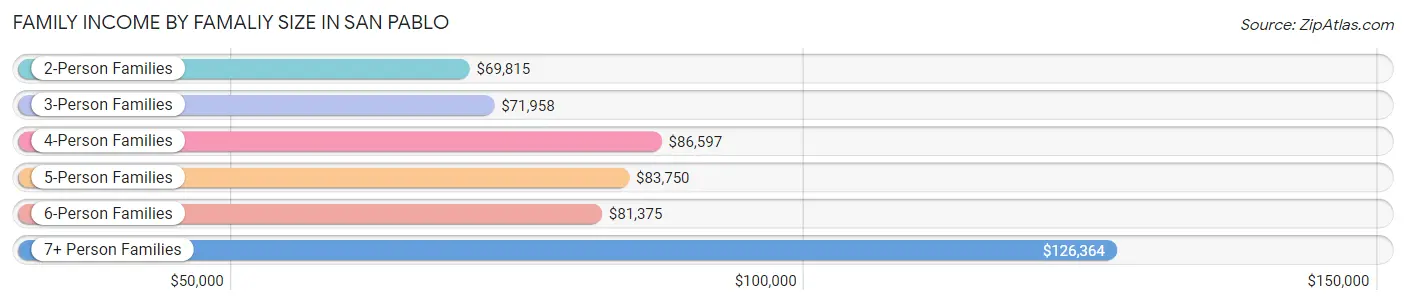
| Income Bracket | # Families | Median Income |
| 2-Person Families | 2,392 (32.3%) | $69,815 |
| 3-Person Families | 1,593 (21.5%) | $71,958 |
| 4-Person Families | 1,679 (22.7%) | $86,597 |
| 5-Person Families | 932 (12.6%) | $83,750 |
| 6-Person Families | 479 (6.5%) | $81,375 |
| 7+ Person Families | 328 (4.4%) | $126,364 |
| Total | 7,403 (100.0%) | $77,813 |
Family Income by Number of Earners in San Pablo
The median family income in San Pablo is $77,813, with families comprising 3+ earners (1,299) having the highest median family income of $116,250, while families with no earners (627) have the lowest median family income of $28,637, accounting for 17.5% and 8.5% of families, respectively.
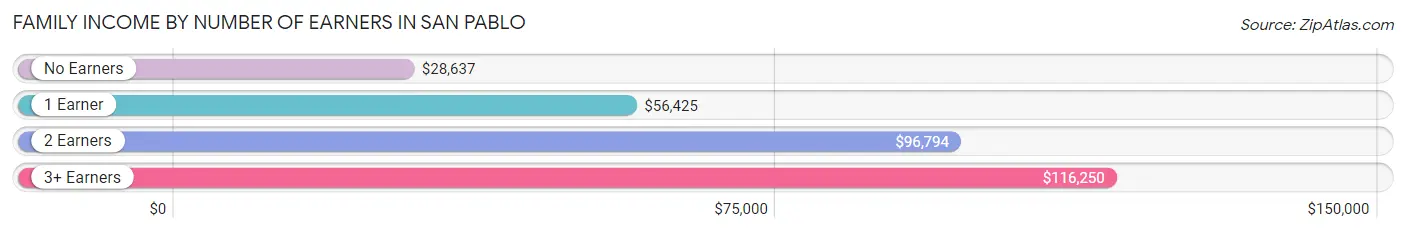
| Number of Earners | # Families | Median Income |
| No Earners | 627 (8.5%) | $28,637 |
| 1 Earner | 2,815 (38.0%) | $56,425 |
| 2 Earners | 2,662 (36.0%) | $96,794 |
| 3+ Earners | 1,299 (17.5%) | $116,250 |
| Total | 7,403 (100.0%) | $77,813 |
Household Income in San Pablo
Household Income Brackets in San Pablo
With 1,947 households falling in the category, the $50,000 to $74,999 income range is the most frequent in San Pablo, accounting for 20.0% of all households. In contrast, only 292 households (3.0%) fall into the $10,000 to $14,999 income bracket, making it the least populous group.
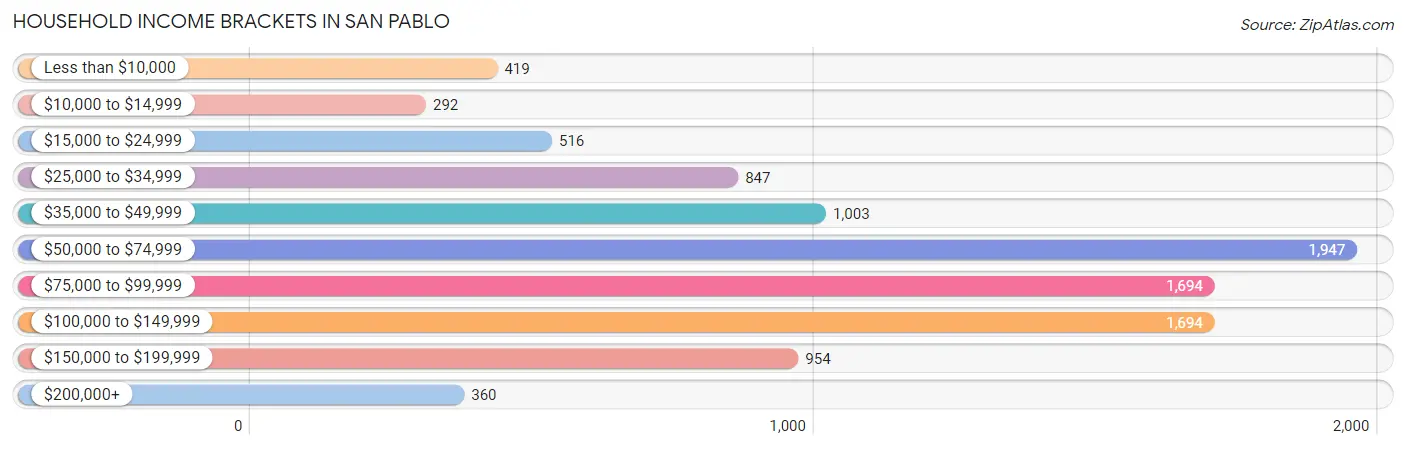
| Income Bracket | # Households | % Households |
| Less than $10,000 | 419 | 4.3% |
| $10,000 to $14,999 | 292 | 3.0% |
| $15,000 to $24,999 | 516 | 5.3% |
| $25,000 to $34,999 | 847 | 8.7% |
| $35,000 to $49,999 | 1,003 | 10.3% |
| $50,000 to $74,999 | 1,947 | 20.0% |
| $75,000 to $99,999 | 1,694 | 17.4% |
| $100,000 to $149,999 | 1,694 | 17.4% |
| $150,000 to $199,999 | 954 | 9.8% |
| $200,000+ | 360 | 3.7% |
Household Income by Householder Age in San Pablo
The median household income in San Pablo is $72,552, with the highest median household income of $85,178 found in the 45 to 64 years age bracket for the primary householder. A total of 3,937 households (40.4%) fall into this category. Meanwhile, the 15 to 24 years age bracket for the primary householder has the lowest median household income of $47,599, with 199 households (2.0%) in this group.
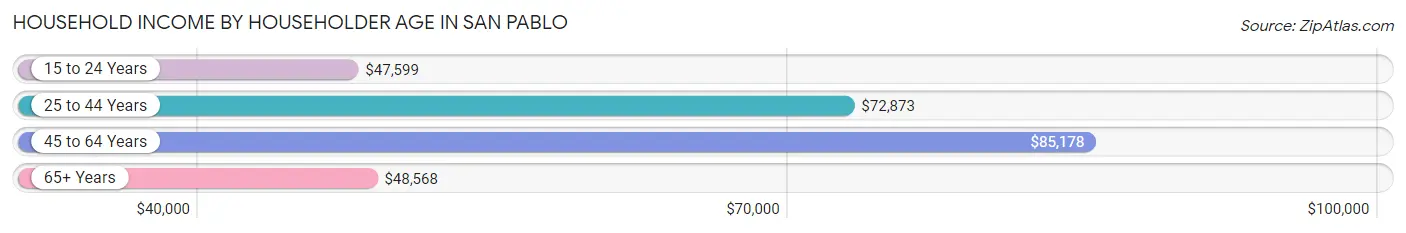
| Income Bracket | # Households | Median Income |
| 15 to 24 Years | 199 (2.0%) | $47,599 |
| 25 to 44 Years | 3,708 (38.1%) | $72,873 |
| 45 to 64 Years | 3,937 (40.4%) | $85,178 |
| 65+ Years | 1,893 (19.4%) | $48,568 |
| Total | 9,737 (100.0%) | $72,552 |
Poverty in San Pablo
Income Below Poverty by Sex and Age in San Pablo
With 11.3% poverty level for males and 12.3% for females among the residents of San Pablo, under 5 year old males and 5 year old females are the most vulnerable to poverty, with 224 males (25.8%) and 30 females (33.7%) in their respective age groups living below the poverty level.
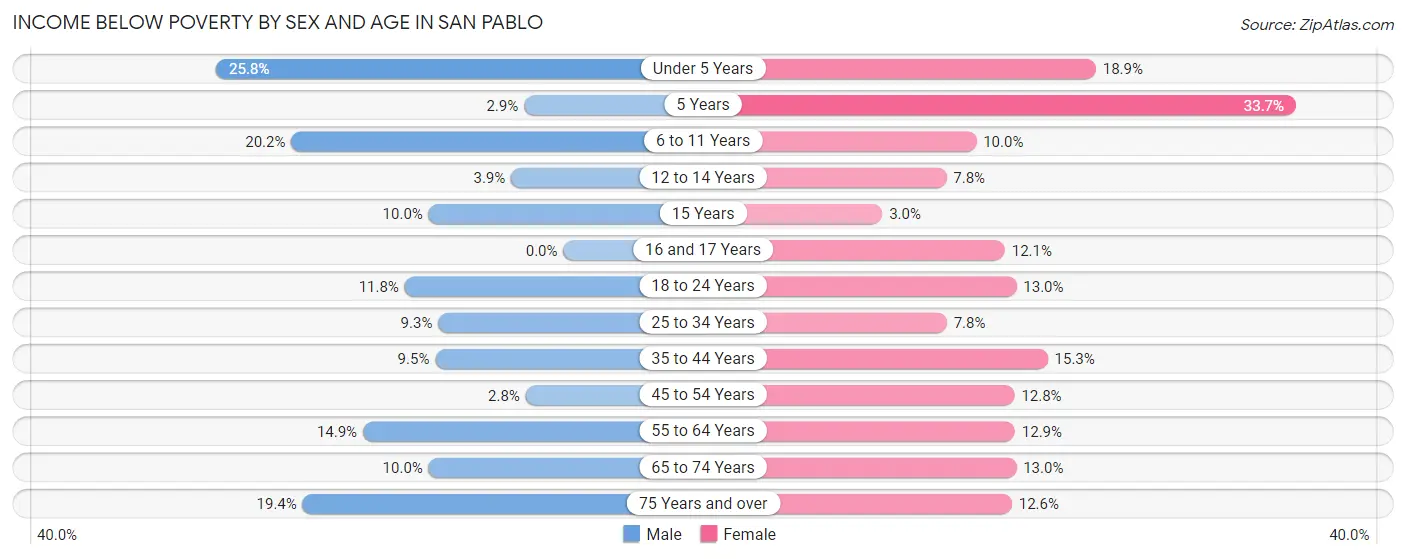
| Age Bracket | Male | Female |
| Under 5 Years | 224 (25.8%) | 146 (18.9%) |
| 5 Years | 9 (2.9%) | 30 (33.7%) |
| 6 to 11 Years | 414 (20.2%) | 126 (10.0%) |
| 12 to 14 Years | 29 (3.9%) | 67 (7.8%) |
| 15 Years | 30 (10.0%) | 8 (3.0%) |
| 16 and 17 Years | 0 (0.0%) | 64 (12.1%) |
| 18 to 24 Years | 208 (11.8%) | 215 (13.0%) |
| 25 to 34 Years | 233 (9.3%) | 162 (7.8%) |
| 35 to 44 Years | 197 (9.5%) | 393 (15.3%) |
| 45 to 54 Years | 59 (2.8%) | 222 (12.8%) |
| 55 to 64 Years | 236 (14.9%) | 227 (12.9%) |
| 65 to 74 Years | 78 (10.0%) | 139 (13.0%) |
| 75 Years and over | 79 (19.4%) | 95 (12.6%) |
| Total | 1,796 (11.3%) | 1,894 (12.3%) |
Income Above Poverty by Sex and Age in San Pablo
According to the poverty statistics in San Pablo, males aged 16 and 17 years and females aged 15 years are the age groups that are most secure financially, with 100.0% of males and 97.0% of females in these age groups living above the poverty line.
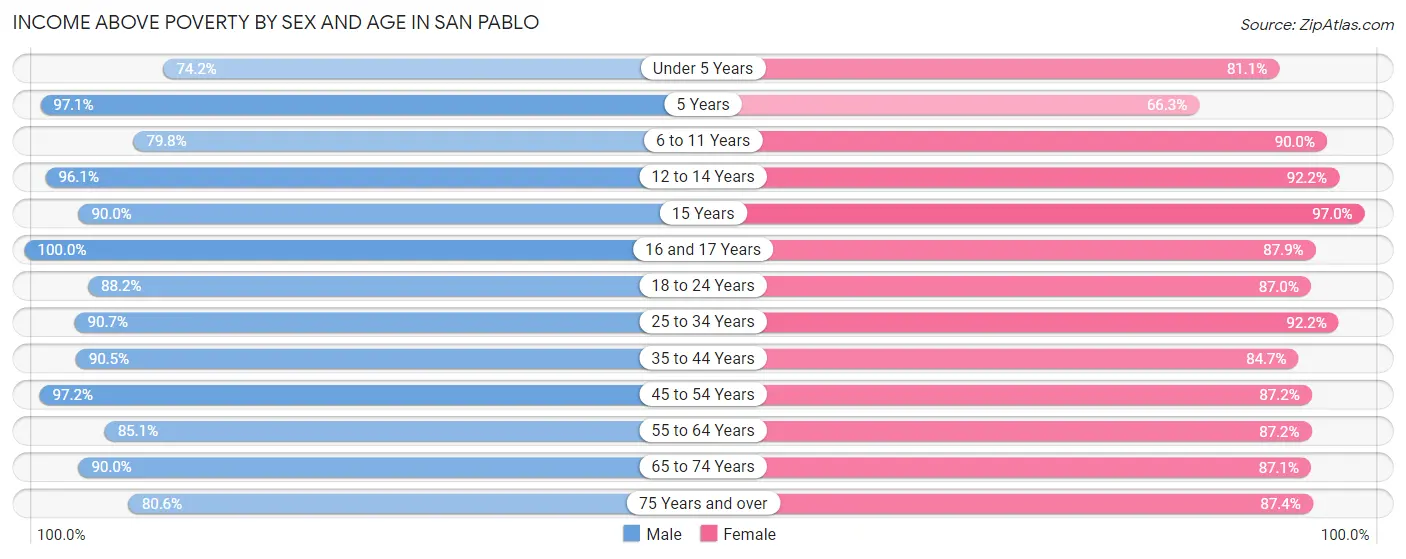
| Age Bracket | Male | Female |
| Under 5 Years | 645 (74.2%) | 628 (81.1%) |
| 5 Years | 299 (97.1%) | 59 (66.3%) |
| 6 to 11 Years | 1,636 (79.8%) | 1,137 (90.0%) |
| 12 to 14 Years | 718 (96.1%) | 796 (92.2%) |
| 15 Years | 270 (90.0%) | 259 (97.0%) |
| 16 and 17 Years | 463 (100.0%) | 465 (87.9%) |
| 18 to 24 Years | 1,558 (88.2%) | 1,444 (87.0%) |
| 25 to 34 Years | 2,274 (90.7%) | 1,917 (92.2%) |
| 35 to 44 Years | 1,875 (90.5%) | 2,179 (84.7%) |
| 45 to 54 Years | 2,045 (97.2%) | 1,509 (87.2%) |
| 55 to 64 Years | 1,350 (85.1%) | 1,539 (87.2%) |
| 65 to 74 Years | 702 (90.0%) | 934 (87.1%) |
| 75 Years and over | 329 (80.6%) | 658 (87.4%) |
| Total | 14,164 (88.7%) | 13,524 (87.7%) |
Income Below Poverty Among Married-Couple Families in San Pablo
The poverty statistics for married-couple families in San Pablo show that 3.7% or 150 of the total 4,007 families live below the poverty line. Families with 1 or 2 children have the highest poverty rate of 5.2%, comprising of 94 families. On the other hand, families with 3 or 4 children have the lowest poverty rate of 0.0%, which includes 0 families.
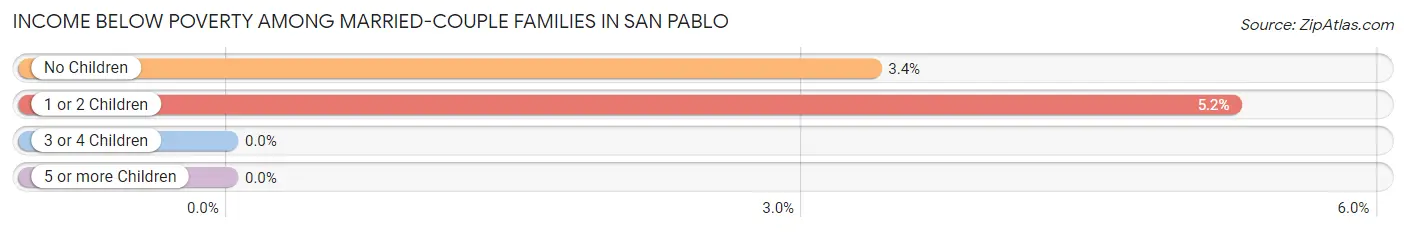
| Children | Above Poverty | Below Poverty |
| No Children | 1,613 (96.6%) | 56 (3.4%) |
| 1 or 2 Children | 1,700 (94.8%) | 94 (5.2%) |
| 3 or 4 Children | 514 (100.0%) | 0 (0.0%) |
| 5 or more Children | 30 (100.0%) | 0 (0.0%) |
| Total | 3,857 (96.3%) | 150 (3.7%) |
Income Below Poverty Among Single-Parent Households in San Pablo
According to the poverty data in San Pablo, 9.1% or 92 single-father households and 20.2% or 482 single-mother households are living below the poverty line. Among single-father households, those with 1 or 2 children have the highest poverty rate, with 78 households (14.6%) experiencing poverty. Likewise, among single-mother households, those with 3 or 4 children have the highest poverty rate, with 249 households (50.4%) falling below the poverty line.
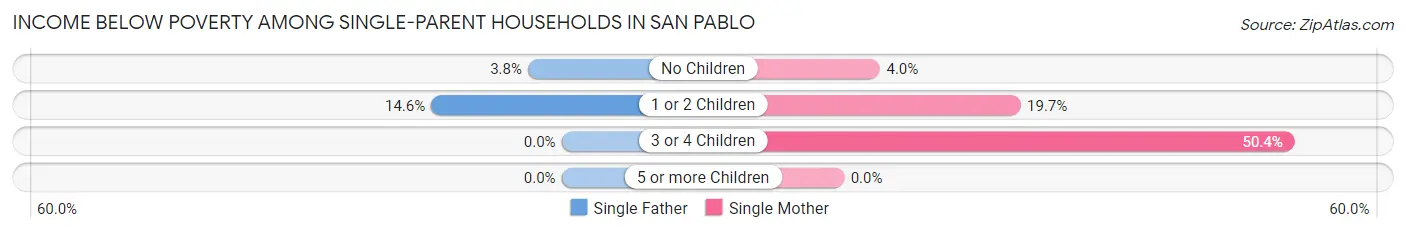
| Children | Single Father | Single Mother |
| No Children | 14 (3.8%) | 36 (4.0%) |
| 1 or 2 Children | 78 (14.6%) | 197 (19.7%) |
| 3 or 4 Children | 0 (0.0%) | 249 (50.4%) |
| 5 or more Children | 0 (0.0%) | 0 (0.0%) |
| Total | 92 (9.1%) | 482 (20.2%) |
Income Below Poverty Among Married-Couple vs Single-Parent Households in San Pablo
The poverty data for San Pablo shows that 150 of the married-couple family households (3.7%) and 574 of the single-parent households (16.9%) are living below the poverty level. Within the married-couple family households, those with 1 or 2 children have the highest poverty rate, with 94 households (5.2%) falling below the poverty line. Among the single-parent households, those with 3 or 4 children have the highest poverty rate, with 249 household (42.0%) living below poverty.
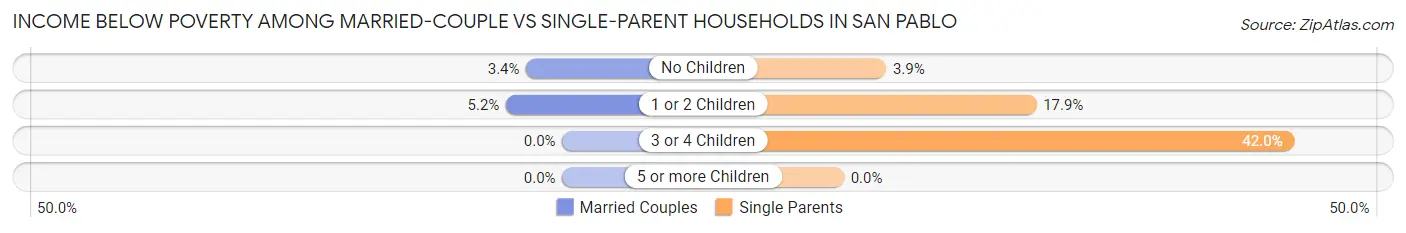
| Children | Married-Couple Families | Single-Parent Households |
| No Children | 56 (3.4%) | 50 (3.9%) |
| 1 or 2 Children | 94 (5.2%) | 275 (17.9%) |
| 3 or 4 Children | 0 (0.0%) | 249 (42.0%) |
| 5 or more Children | 0 (0.0%) | 0 (0.0%) |
| Total | 150 (3.7%) | 574 (16.9%) |
Race in San Pablo
The most populous races in San Pablo are Hispanic or Latino (18,035 | 56.5%), Some other Race (13,701 | 42.9%), and Asian (5,449 | 17.1%).
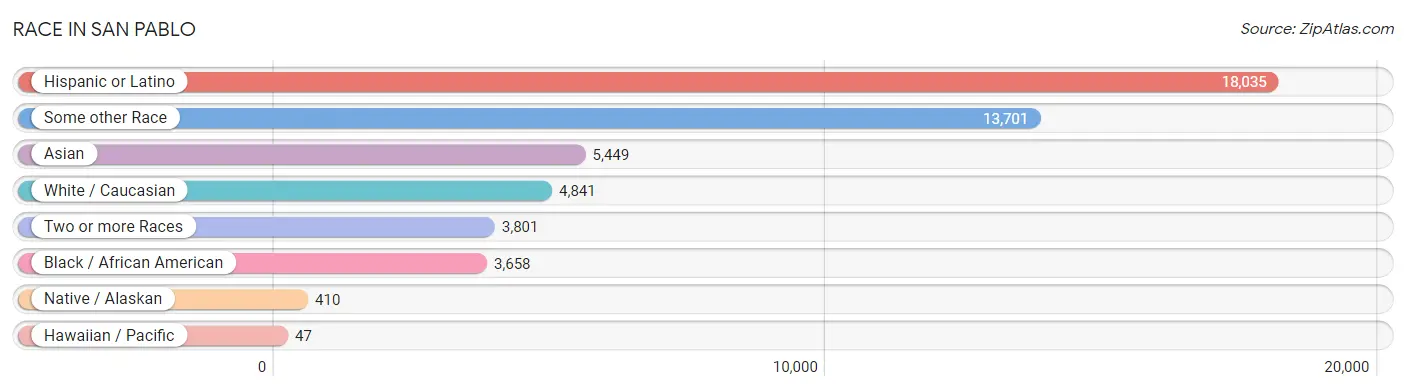
| Race | # Population | % Population |
| Asian | 5,449 | 17.1% |
| Black / African American | 3,658 | 11.5% |
| Hawaiian / Pacific | 47 | 0.2% |
| Hispanic or Latino | 18,035 | 56.5% |
| Native / Alaskan | 410 | 1.3% |
| White / Caucasian | 4,841 | 15.2% |
| Two or more Races | 3,801 | 11.9% |
| Some other Race | 13,701 | 42.9% |
| Total | 31,907 | 100.0% |
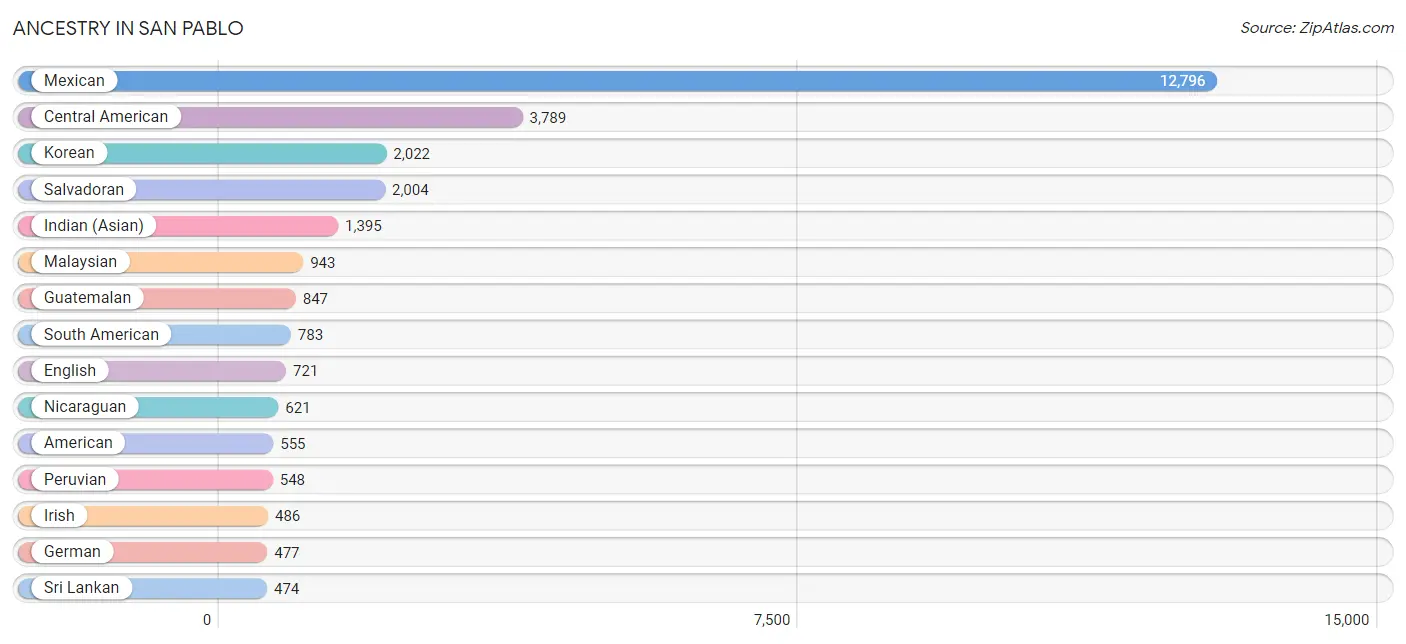
Ancestry in San Pablo
The most populous ancestries reported in San Pablo are Mexican (12,796 | 40.1%), Central American (3,789 | 11.9%), Korean (2,022 | 6.3%), Salvadoran (2,004 | 6.3%), and Indian (Asian) (1,395 | 4.4%), together accounting for 69.0% of all San Pablo residents.
| Ancestry | # Population | % Population |
| Afghan | 234 | 0.7% |
| African | 209 | 0.7% |
| American | 555 | 1.7% |
| Apache | 57 | 0.2% |
| Arab | 292 | 0.9% |
| Argentinean | 31 | 0.1% |
| Armenian | 13 | 0.0% |
| Barbadian | 2 | 0.0% |
| Bermudan | 25 | 0.1% |
| Bhutanese | 123 | 0.4% |
| Blackfeet | 278 | 0.9% |
| Brazilian | 196 | 0.6% |
| British | 12 | 0.0% |
| British West Indian | 11 | 0.0% |
| Burmese | 75 | 0.2% |
| Cambodian | 9 | 0.0% |
| Central American | 3,789 | 11.9% |
| Cherokee | 87 | 0.3% |
| Chilean | 59 | 0.2% |
| Choctaw | 94 | 0.3% |
| Costa Rican | 54 | 0.2% |
| Croatian | 24 | 0.1% |
| Cuban | 30 | 0.1% |
| Danish | 44 | 0.1% |
| Dominican | 6 | 0.0% |
| Dutch | 81 | 0.3% |
| Eastern European | 16 | 0.1% |
| Ecuadorian | 53 | 0.2% |
| English | 721 | 2.3% |
| Ethiopian | 10 | 0.0% |
| European | 421 | 1.3% |
| French | 141 | 0.4% |
| German | 477 | 1.5% |
| Greek | 73 | 0.2% |
| Guamanian / Chamorro | 47 | 0.2% |
| Guatemalan | 847 | 2.6% |
| Honduran | 263 | 0.8% |
| Hungarian | 28 | 0.1% |
| Indian (Asian) | 1,395 | 4.4% |
| Iranian | 27 | 0.1% |
| Irish | 486 | 1.5% |
| Italian | 416 | 1.3% |
| Jamaican | 65 | 0.2% |
| Japanese | 23 | 0.1% |
| Korean | 2,022 | 6.3% |
| Laotian | 43 | 0.1% |
| Lebanese | 60 | 0.2% |
| Malaysian | 943 | 3.0% |
| Mexican | 12,796 | 40.1% |
| Mexican American Indian | 287 | 0.9% |
| Native Hawaiian | 30 | 0.1% |
| Navajo | 145 | 0.4% |
| Nepalese | 299 | 0.9% |
| Nicaraguan | 621 | 1.9% |
| Nigerian | 7 | 0.0% |
| Norwegian | 89 | 0.3% |
| Okinawan | 10 | 0.0% |
| Pakistani | 40 | 0.1% |
| Peruvian | 548 | 1.7% |
| Polish | 28 | 0.1% |
| Portuguese | 215 | 0.7% |
| Puerto Rican | 34 | 0.1% |
| Salvadoran | 2,004 | 6.3% |
| Samoan | 12 | 0.0% |
| Scandinavian | 45 | 0.1% |
| Scotch-Irish | 50 | 0.2% |
| Scottish | 42 | 0.1% |
| Slovak | 11 | 0.0% |
| South American | 783 | 2.5% |
| South American Indian | 47 | 0.2% |
| Spaniard | 87 | 0.3% |
| Sri Lankan | 474 | 1.5% |
| Subsaharan African | 226 | 0.7% |
| Swedish | 42 | 0.1% |
| Swiss | 11 | 0.0% |
| Thai | 122 | 0.4% |
| Trinidadian and Tobagonian | 14 | 0.0% |
| Ukrainian | 29 | 0.1% |
| Venezuelan | 92 | 0.3% |
| Welsh | 125 | 0.4% |
| Yugoslavian | 22 | 0.1% | View All 81 Rows |
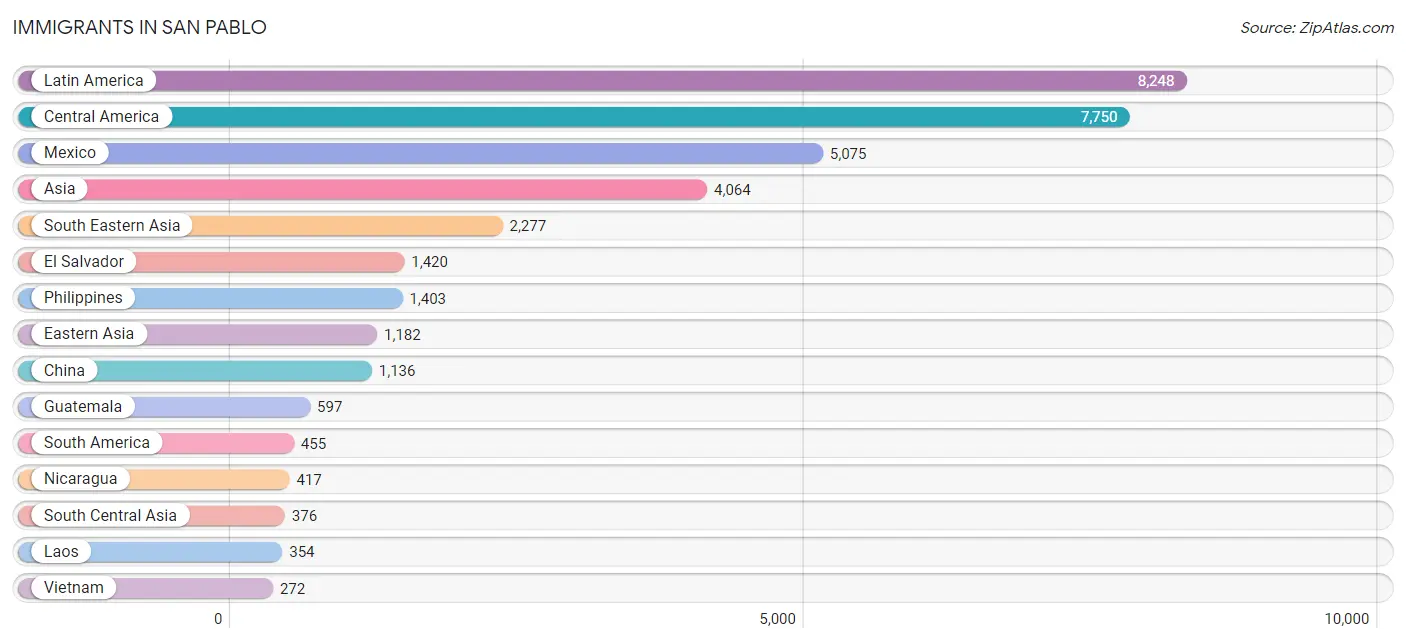
Immigrants in San Pablo
The most numerous immigrant groups reported in San Pablo came from Latin America (8,248 | 25.9%), Central America (7,750 | 24.3%), Mexico (5,075 | 15.9%), Asia (4,064 | 12.7%), and South Eastern Asia (2,277 | 7.1%), together accounting for 85.9% of all San Pablo residents.
| Immigration Origin | # Population | % Population |
| Afghanistan | 100 | 0.3% |
| Africa | 55 | 0.2% |
| Argentina | 31 | 0.1% |
| Asia | 4,064 | 12.7% |
| Azores | 8 | 0.0% |
| Barbados | 2 | 0.0% |
| Bolivia | 19 | 0.1% |
| Bosnia and Herzegovina | 22 | 0.1% |
| Brazil | 97 | 0.3% |
| Cambodia | 5 | 0.0% |
| Canada | 55 | 0.2% |
| Caribbean | 43 | 0.1% |
| Central America | 7,750 | 24.3% |
| Chile | 8 | 0.0% |
| China | 1,136 | 3.6% |
| Colombia | 8 | 0.0% |
| Cuba | 30 | 0.1% |
| Eastern Africa | 10 | 0.0% |
| Eastern Asia | 1,182 | 3.7% |
| Eastern Europe | 39 | 0.1% |
| El Salvador | 1,420 | 4.4% |
| Eritrea | 10 | 0.0% |
| Europe | 155 | 0.5% |
| Fiji | 20 | 0.1% |
| Ghana | 8 | 0.0% |
| Guatemala | 597 | 1.9% |
| Honduras | 241 | 0.8% |
| Hong Kong | 177 | 0.5% |
| Hungary | 17 | 0.1% |
| India | 81 | 0.3% |
| Indonesia | 43 | 0.1% |
| Japan | 7 | 0.0% |
| Korea | 39 | 0.1% |
| Laos | 354 | 1.1% |
| Latin America | 8,248 | 25.9% |
| Mexico | 5,075 | 15.9% |
| Nepal | 12 | 0.0% |
| Nicaragua | 417 | 1.3% |
| Nigeria | 37 | 0.1% |
| Northern Europe | 48 | 0.2% |
| Oceania | 20 | 0.1% |
| Pakistan | 183 | 0.6% |
| Peru | 270 | 0.9% |
| Philippines | 1,403 | 4.4% |
| Portugal | 68 | 0.2% |
| Singapore | 10 | 0.0% |
| South America | 455 | 1.4% |
| South Central Asia | 376 | 1.2% |
| South Eastern Asia | 2,277 | 7.1% |
| Southern Europe | 68 | 0.2% |
| Sweden | 4 | 0.0% |
| Syria | 17 | 0.1% |
| Taiwan | 37 | 0.1% |
| Thailand | 190 | 0.6% |
| Venezuela | 22 | 0.1% |
| Vietnam | 272 | 0.9% |
| Western Africa | 45 | 0.1% |
| Western Asia | 223 | 0.7% |
| Yemen | 206 | 0.6% | View All 59 Rows |
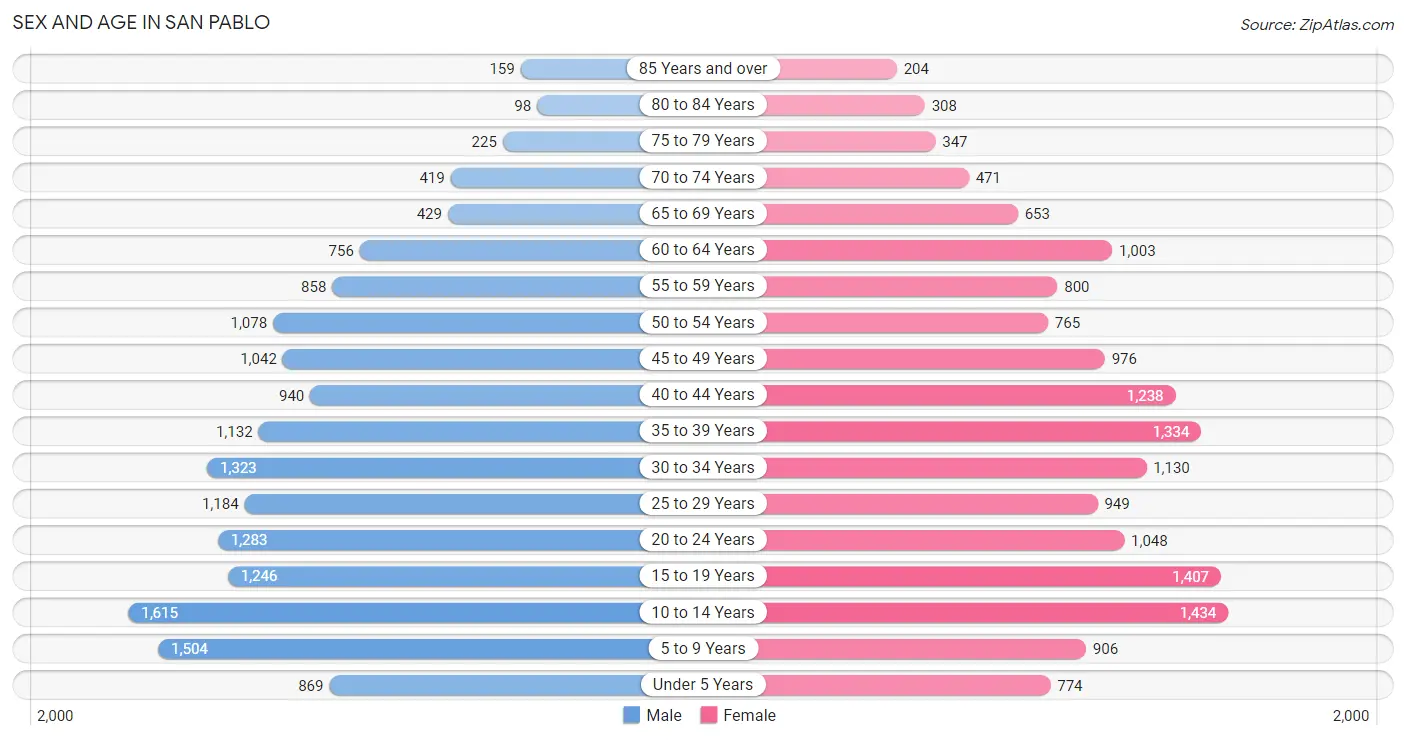
Sex and Age in San Pablo
Sex and Age in San Pablo
The most populous age groups in San Pablo are 10 to 14 Years (1,615 | 10.0%) for men and 10 to 14 Years (1,434 | 9.1%) for women.
| Age Bracket | Male | Female |
| Under 5 Years | 869 (5.4%) | 774 (4.9%) |
| 5 to 9 Years | 1,504 (9.3%) | 906 (5.8%) |
| 10 to 14 Years | 1,615 (10.0%) | 1,434 (9.1%) |
| 15 to 19 Years | 1,246 (7.7%) | 1,407 (8.9%) |
| 20 to 24 Years | 1,283 (7.9%) | 1,048 (6.7%) |
| 25 to 29 Years | 1,184 (7.3%) | 949 (6.0%) |
| 30 to 34 Years | 1,323 (8.2%) | 1,130 (7.2%) |
| 35 to 39 Years | 1,132 (7.0%) | 1,334 (8.5%) |
| 40 to 44 Years | 940 (5.8%) | 1,238 (7.9%) |
| 45 to 49 Years | 1,042 (6.5%) | 976 (6.2%) |
| 50 to 54 Years | 1,078 (6.7%) | 765 (4.9%) |
| 55 to 59 Years | 858 (5.3%) | 800 (5.1%) |
| 60 to 64 Years | 756 (4.7%) | 1,003 (6.4%) |
| 65 to 69 Years | 429 (2.6%) | 653 (4.2%) |
| 70 to 74 Years | 419 (2.6%) | 471 (3.0%) |
| 75 to 79 Years | 225 (1.4%) | 347 (2.2%) |
| 80 to 84 Years | 98 (0.6%) | 308 (2.0%) |
| 85 Years and over | 159 (1.0%) | 204 (1.3%) |
| Total | 16,160 (100.0%) | 15,747 (100.0%) |
Families and Households in San Pablo
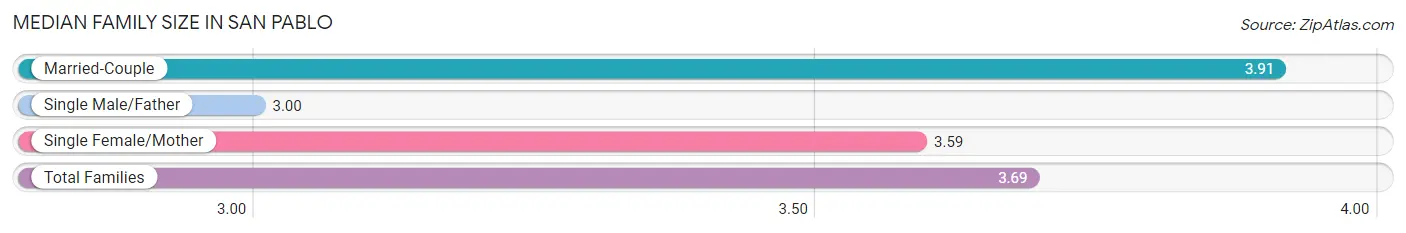
Median Family Size in San Pablo
The median family size in San Pablo is 3.69 persons per family, with married-couple families (4,007 | 54.1%) accounting for the largest median family size of 3.91 persons per family. On the other hand, single male/father families (1,006 | 13.6%) represent the smallest median family size with 3.00 persons per family.
| Family Type | # Families | Family Size |
| Married-Couple | 4,007 (54.1%) | 3.91 |
| Single Male/Father | 1,006 (13.6%) | 3.00 |
| Single Female/Mother | 2,390 (32.3%) | 3.59 |
| Total Families | 7,403 (100.0%) | 3.69 |
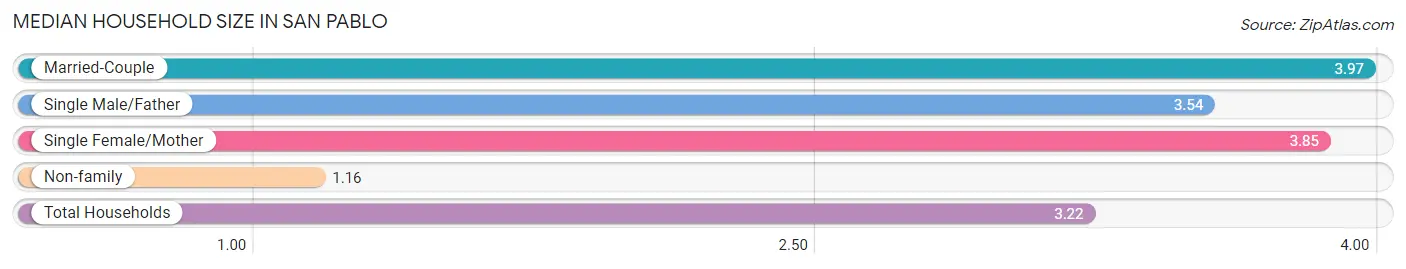
Median Household Size in San Pablo
The median household size in San Pablo is 3.22 persons per household, with married-couple households (4,007 | 41.1%) accounting for the largest median household size of 3.97 persons per household. non-family households (2,334 | 24.0%) represent the smallest median household size with 1.16 persons per household.
| Household Type | # Households | Household Size |
| Married-Couple | 4,007 (41.1%) | 3.97 |
| Single Male/Father | 1,006 (10.3%) | 3.54 |
| Single Female/Mother | 2,390 (24.5%) | 3.85 |
| Non-family | 2,334 (24.0%) | 1.16 |
| Total Households | 9,737 (100.0%) | 3.22 |
Household Size by Marriage Status in San Pablo
Out of a total of 9,737 households in San Pablo, 7,403 (76.0%) are family households, while 2,334 (24.0%) are nonfamily households. The most numerous type of family households are 2-person households, comprising 2,055, and the most common type of nonfamily households are 1-person households, comprising 1,997.
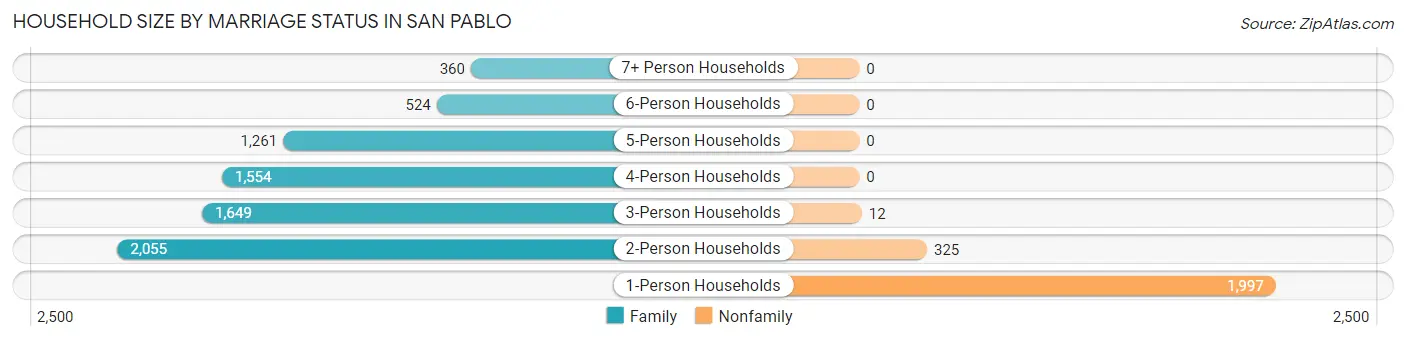
| Household Size | Family Households | Nonfamily Households |
| 1-Person Households | - | 1,997 (20.5%) |
| 2-Person Households | 2,055 (21.1%) | 325 (3.3%) |
| 3-Person Households | 1,649 (16.9%) | 12 (0.1%) |
| 4-Person Households | 1,554 (16.0%) | 0 (0.0%) |
| 5-Person Households | 1,261 (13.0%) | 0 (0.0%) |
| 6-Person Households | 524 (5.4%) | 0 (0.0%) |
| 7+ Person Households | 360 (3.7%) | 0 (0.0%) |
| Total | 7,403 (76.0%) | 2,334 (24.0%) |
Female Fertility in San Pablo
Fertility by Age in San Pablo
Average fertility rate in San Pablo is 61.0 births per 1,000 women. Women in the age bracket of 20 to 34 years have the highest fertility rate with 75.0 births per 1,000 women. Women in the age bracket of 35 to 50 years acount for 51.8% of all women with births.
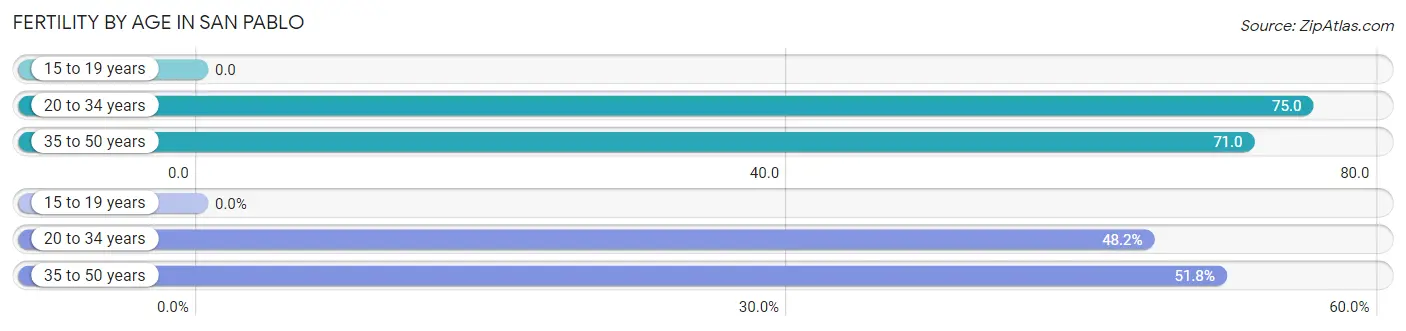
| Age Bracket | Women with Births | Births / 1,000 Women |
| 15 to 19 years | 0 (0.0%) | 0.0 |
| 20 to 34 years | 236 (48.2%) | 75.0 |
| 35 to 50 years | 254 (51.8%) | 71.0 |
| Total | 490 (100.0%) | 61.0 |
Fertility by Age by Marriage Status in San Pablo
18.2% of women with births (490) in San Pablo are married. The highest percentage of unmarried women with births falls into 35 to 50 years age bracket with 83.1% of them unmarried at the time of birth, while the lowest percentage of unmarried women with births belong to 20 to 34 years age bracket with 80.5% of them unmarried.
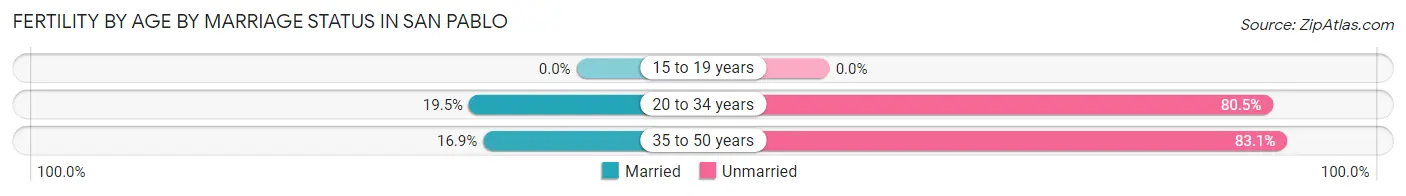
| Age Bracket | Married | Unmarried |
| 15 to 19 years | 0 (0.0%) | 0 (0.0%) |
| 20 to 34 years | 46 (19.5%) | 190 (80.5%) |
| 35 to 50 years | 43 (16.9%) | 211 (83.1%) |
| Total | 89 (18.2%) | 401 (81.8%) |
Fertility by Education in San Pablo
Average fertility rate in San Pablo is 61.0 births per 1,000 women. Women with the education attainment of less than high school have the highest fertility rate of 84.0 births per 1,000 women, while women with the education attainment of graduate degree have the lowest fertility at 36.0 births per 1,000 women. Women with the education attainment of less than high school represent 43.3% of all women with births.
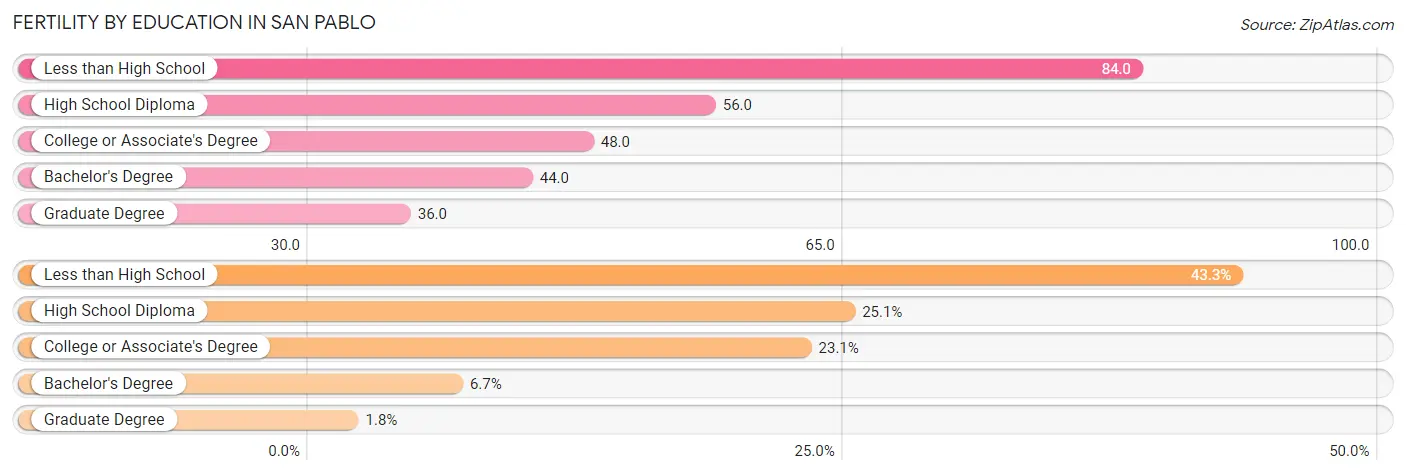
| Educational Attainment | Women with Births | Births / 1,000 Women |
| Less than High School | 212 (43.3%) | 84.0 |
| High School Diploma | 123 (25.1%) | 56.0 |
| College or Associate's Degree | 113 (23.1%) | 48.0 |
| Bachelor's Degree | 33 (6.7%) | 44.0 |
| Graduate Degree | 9 (1.8%) | 36.0 |
| Total | 490 (100.0%) | 61.0 |
Fertility by Education by Marriage Status in San Pablo
81.8% of women with births in San Pablo are unmarried. Women with the educational attainment of graduate degree are most likely to be married with 100.0% of them married at childbirth, while women with the educational attainment of college or associate's degree are least likely to be married with 91.1% of them unmarried at childbirth.
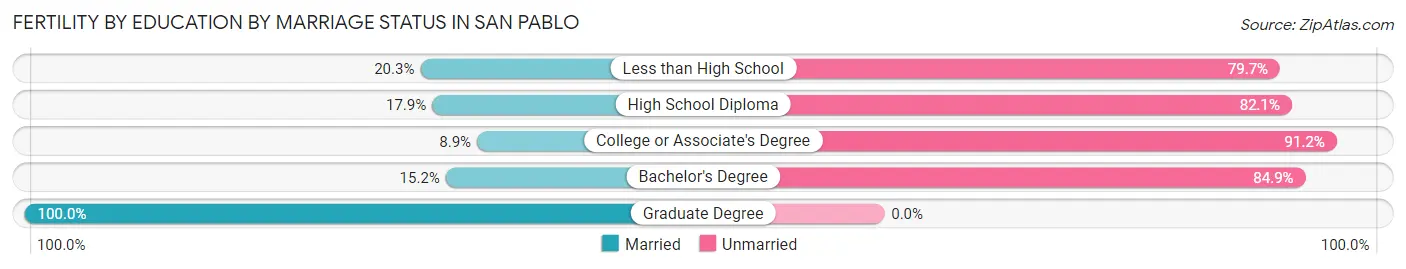
| Educational Attainment | Married | Unmarried |
| Less than High School | 43 (20.3%) | 169 (79.7%) |
| High School Diploma | 22 (17.9%) | 101 (82.1%) |
| College or Associate's Degree | 10 (8.8%) | 103 (91.1%) |
| Bachelor's Degree | 5 (15.1%) | 28 (84.9%) |
| Graduate Degree | 9 (100.0%) | 0 (0.0%) |
| Total | 89 (18.2%) | 401 (81.8%) |
Employment Characteristics in San Pablo
Employment by Class of Employer in San Pablo
Among the 13,895 employed individuals in San Pablo, private company employees (9,409 | 67.7%), local government employees (1,252 | 9.0%), and not-for-profit organizations (1,038 | 7.5%) make up the most common classes of employment.
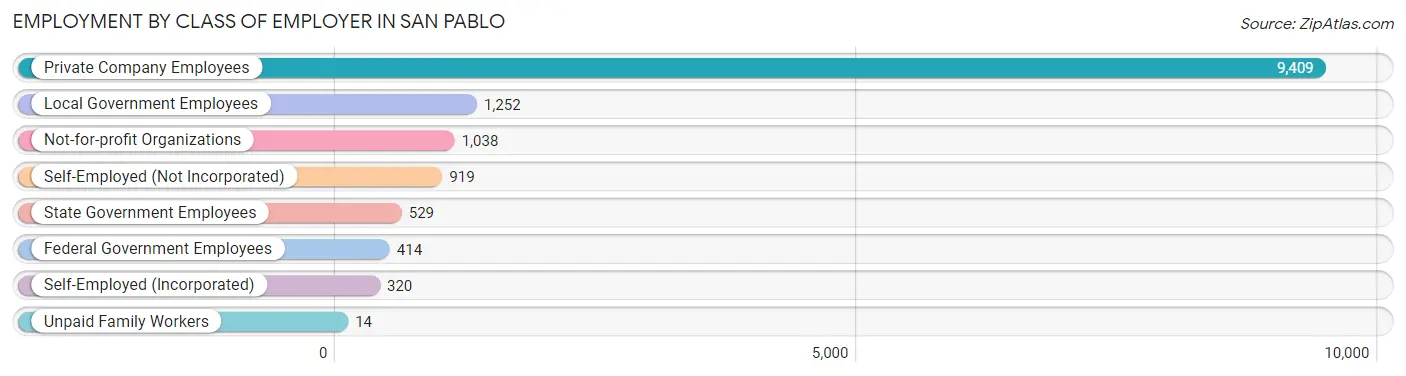
| Employer Class | # Employees | % Employees |
| Private Company Employees | 9,409 | 67.7% |
| Self-Employed (Incorporated) | 320 | 2.3% |
| Self-Employed (Not Incorporated) | 919 | 6.6% |
| Not-for-profit Organizations | 1,038 | 7.5% |
| Local Government Employees | 1,252 | 9.0% |
| State Government Employees | 529 | 3.8% |
| Federal Government Employees | 414 | 3.0% |
| Unpaid Family Workers | 14 | 0.1% |
| Total | 13,895 | 100.0% |
Employment Status by Age in San Pablo
According to the labor force statistics for San Pablo, out of the total population over 16 years of age (24,238), 65.1% or 15,779 individuals are in the labor force, with 7.9% or 1,247 of them unemployed. The age group with the highest labor force participation rate is 30 to 34 years, with 88.3% or 2,166 individuals in the labor force. Within the labor force, the 20 to 24 years age range has the highest percentage of unemployed individuals, with 17.3% or 288 of them being unemployed.
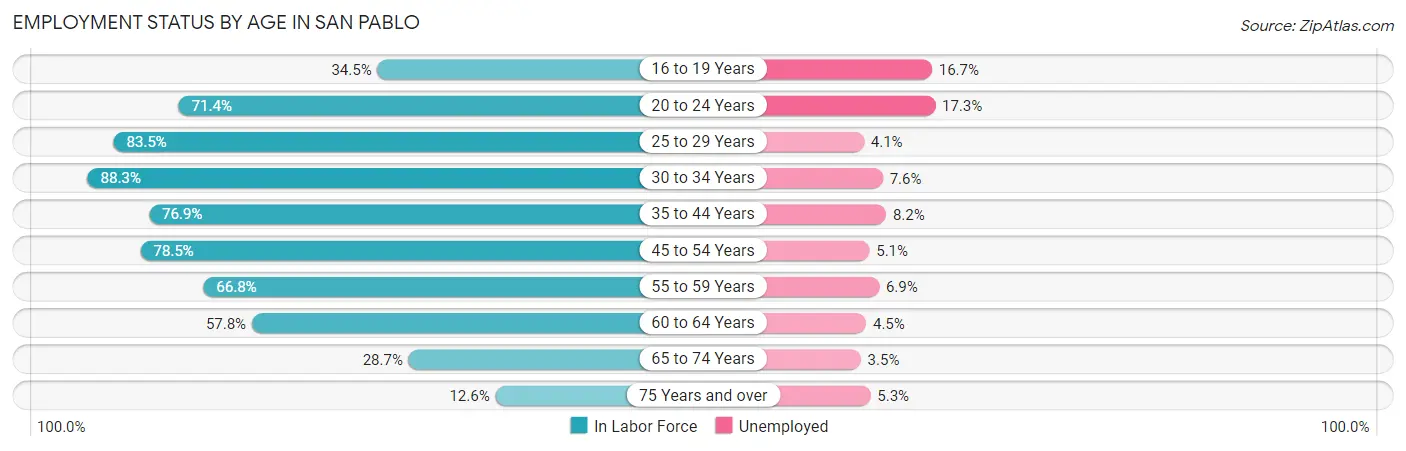
| Age Bracket | In Labor Force | Unemployed |
| 16 to 19 Years | 720 (34.5%) | 120 (16.7%) |
| 20 to 24 Years | 1,664 (71.4%) | 288 (17.3%) |
| 25 to 29 Years | 1,781 (83.5%) | 73 (4.1%) |
| 30 to 34 Years | 2,166 (88.3%) | 165 (7.6%) |
| 35 to 44 Years | 3,571 (76.9%) | 293 (8.2%) |
| 45 to 54 Years | 3,031 (78.5%) | 155 (5.1%) |
| 55 to 59 Years | 1,108 (66.8%) | 76 (6.9%) |
| 60 to 64 Years | 1,017 (57.8%) | 46 (4.5%) |
| 65 to 74 Years | 566 (28.7%) | 20 (3.5%) |
| 75 Years and over | 169 (12.6%) | 9 (5.3%) |
| Total | 15,779 (65.1%) | 1,247 (7.9%) |
Employment Status by Educational Attainment in San Pablo
According to labor force statistics for San Pablo, 76.8% of individuals (12,678) out of the total population between 25 and 64 years of age (16,508) are in the labor force, with 6.4% or 811 of them being unemployed. The group with the highest labor force participation rate are those with the educational attainment of bachelor's degree or higher, with 87.6% or 2,093 individuals in the labor force. Within the labor force, individuals with college / associate degree education have the highest percentage of unemployment, with 7.8% or 285 of them being unemployed.
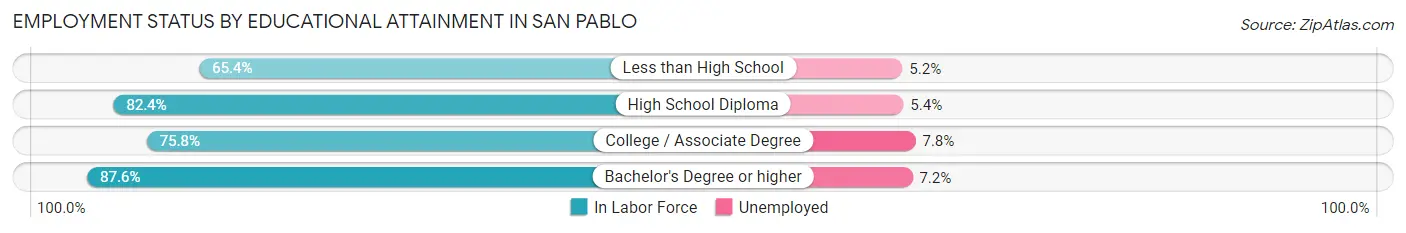
| Educational Attainment | In Labor Force | Unemployed |
| Less than High School | 2,838 (65.4%) | 226 (5.2%) |
| High School Diploma | 4,092 (82.4%) | 268 (5.4%) |
| College / Associate Degree | 3,649 (75.8%) | 375 (7.8%) |
| Bachelor's Degree or higher | 2,093 (87.6%) | 172 (7.2%) |
| Total | 12,678 (76.8%) | 1,057 (6.4%) |
Employment Occupations by Sex in San Pablo
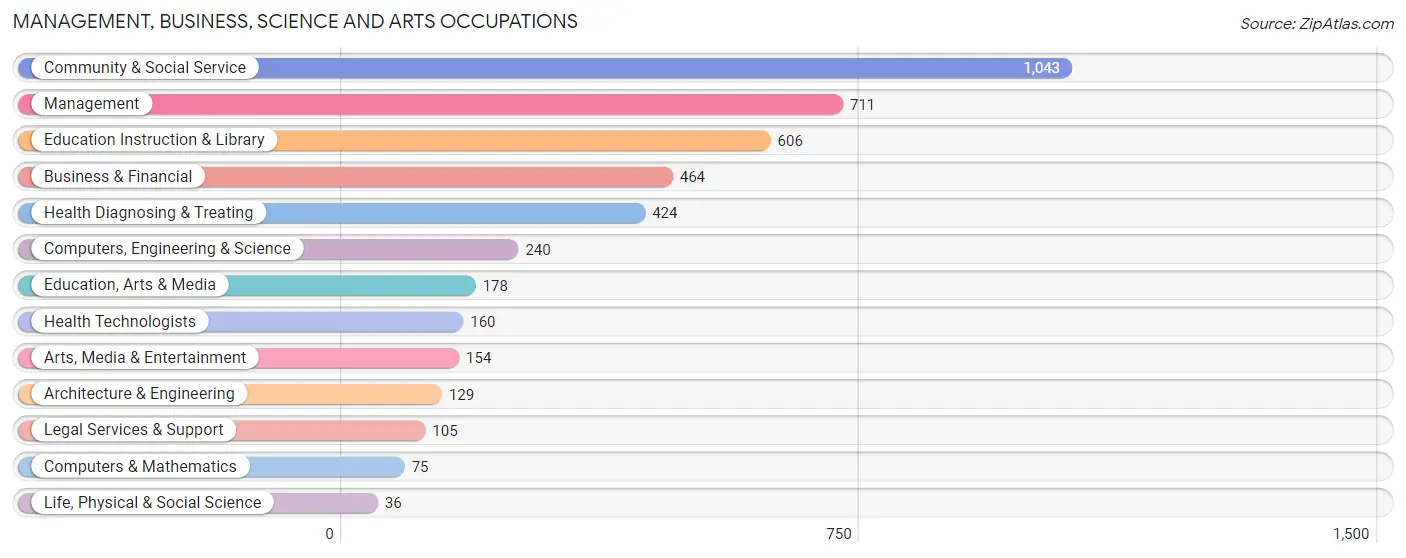
Management, Business, Science and Arts Occupations
The most common Management, Business, Science and Arts occupations in San Pablo are Community & Social Service (1,043 | 7.2%), Management (711 | 4.9%), Education Instruction & Library (606 | 4.2%), Business & Financial (464 | 3.2%), and Health Diagnosing & Treating (424 | 2.9%).
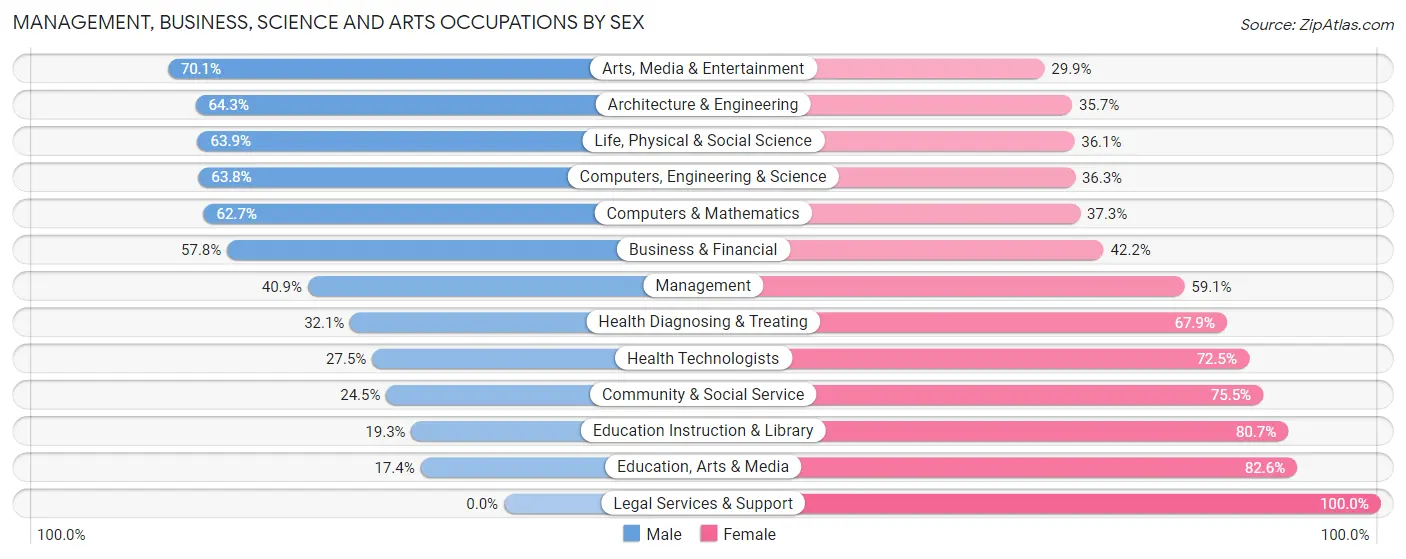
Management, Business, Science and Arts Occupations by Sex
Within the Management, Business, Science and Arts occupations in San Pablo, the most male-oriented occupations are Arts, Media & Entertainment (70.1%), Architecture & Engineering (64.3%), and Life, Physical & Social Science (63.9%), while the most female-oriented occupations are Legal Services & Support (100.0%), Education, Arts & Media (82.6%), and Education Instruction & Library (80.7%).
| Occupation | Male | Female |
| Management | 291 (40.9%) | 420 (59.1%) |
| Business & Financial | 268 (57.8%) | 196 (42.2%) |
| Computers, Engineering & Science | 153 (63.7%) | 87 (36.2%) |
| Computers & Mathematics | 47 (62.7%) | 28 (37.3%) |
| Architecture & Engineering | 83 (64.3%) | 46 (35.7%) |
| Life, Physical & Social Science | 23 (63.9%) | 13 (36.1%) |
| Community & Social Service | 256 (24.5%) | 787 (75.5%) |
| Education, Arts & Media | 31 (17.4%) | 147 (82.6%) |
| Legal Services & Support | 0 (0.0%) | 105 (100.0%) |
| Education Instruction & Library | 117 (19.3%) | 489 (80.7%) |
| Arts, Media & Entertainment | 108 (70.1%) | 46 (29.9%) |
| Health Diagnosing & Treating | 136 (32.1%) | 288 (67.9%) |
| Health Technologists | 44 (27.5%) | 116 (72.5%) |
| Total (Category) | 1,104 (38.3%) | 1,778 (61.7%) |
| Total (Overall) | 8,063 (55.4%) | 6,484 (44.6%) |
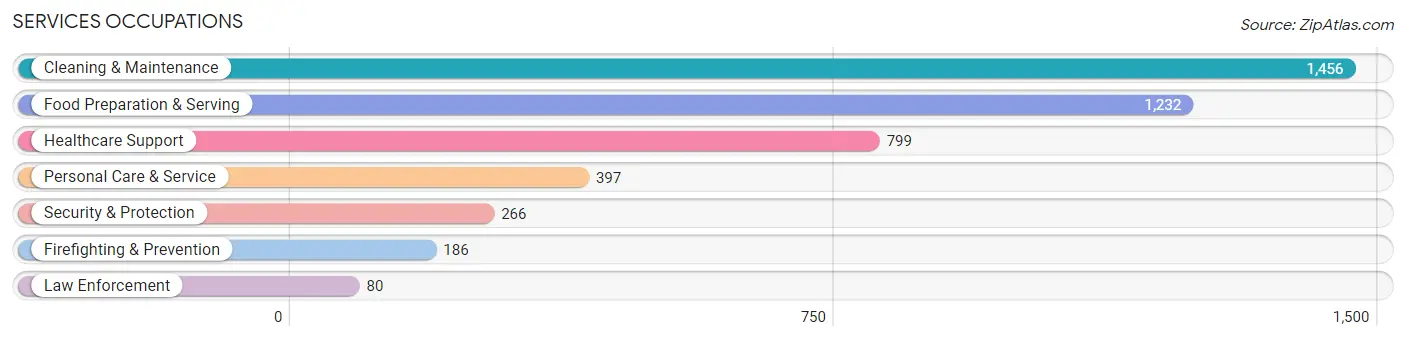
Services Occupations
The most common Services occupations in San Pablo are Cleaning & Maintenance (1,456 | 10.0%), Food Preparation & Serving (1,232 | 8.5%), Healthcare Support (799 | 5.5%), Personal Care & Service (397 | 2.7%), and Security & Protection (266 | 1.8%).
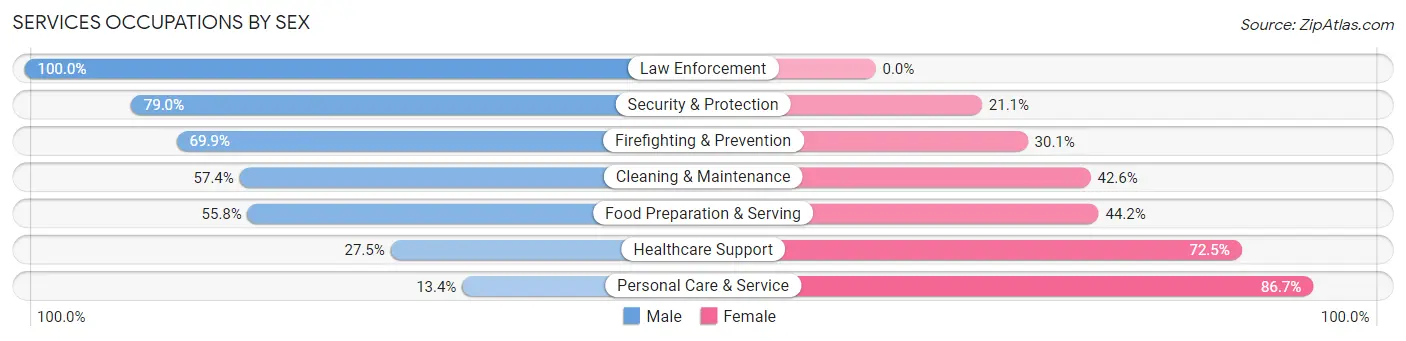
Services Occupations by Sex
Within the Services occupations in San Pablo, the most male-oriented occupations are Law Enforcement (100.0%), Security & Protection (78.9%), and Firefighting & Prevention (69.9%), while the most female-oriented occupations are Personal Care & Service (86.7%), Healthcare Support (72.5%), and Food Preparation & Serving (44.2%).
| Occupation | Male | Female |
| Healthcare Support | 220 (27.5%) | 579 (72.5%) |
| Security & Protection | 210 (78.9%) | 56 (21.0%) |
| Firefighting & Prevention | 130 (69.9%) | 56 (30.1%) |
| Law Enforcement | 80 (100.0%) | 0 (0.0%) |
| Food Preparation & Serving | 688 (55.8%) | 544 (44.2%) |
| Cleaning & Maintenance | 836 (57.4%) | 620 (42.6%) |
| Personal Care & Service | 53 (13.4%) | 344 (86.7%) |
| Total (Category) | 2,007 (48.4%) | 2,143 (51.6%) |
| Total (Overall) | 8,063 (55.4%) | 6,484 (44.6%) |
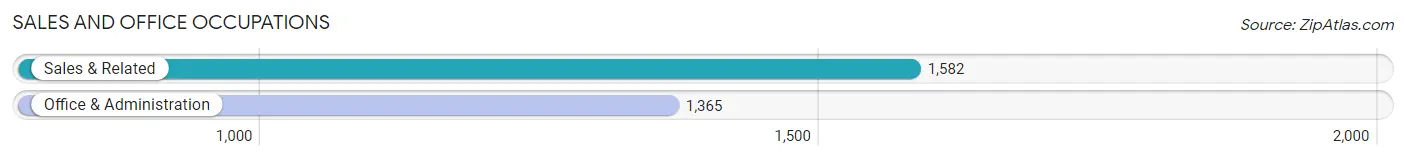
Sales and Office Occupations
The most common Sales and Office occupations in San Pablo are Sales & Related (1,582 | 10.9%), and Office & Administration (1,365 | 9.4%).
Sales and Office Occupations by Sex
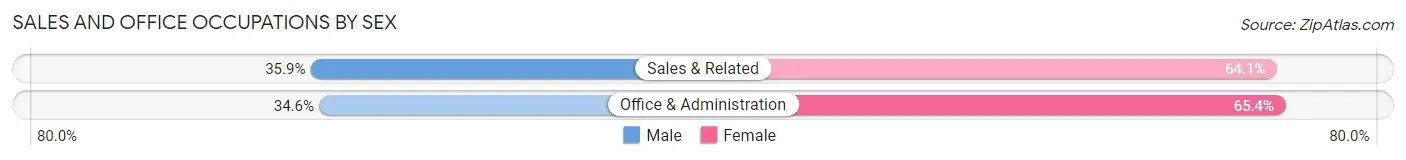
| Occupation | Male | Female |
| Sales & Related | 568 (35.9%) | 1,014 (64.1%) |
| Office & Administration | 472 (34.6%) | 893 (65.4%) |
| Total (Category) | 1,040 (35.3%) | 1,907 (64.7%) |
| Total (Overall) | 8,063 (55.4%) | 6,484 (44.6%) |
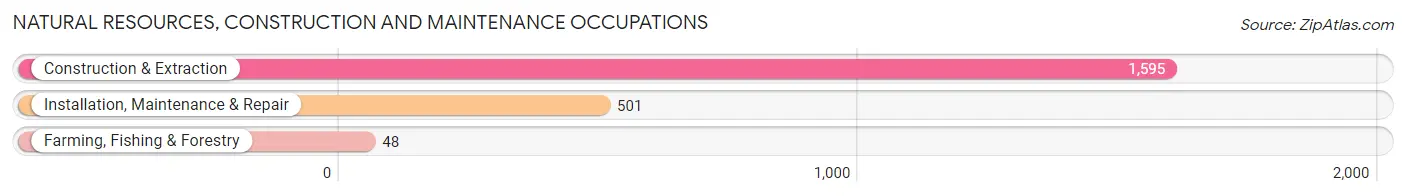
Natural Resources, Construction and Maintenance Occupations
The most common Natural Resources, Construction and Maintenance occupations in San Pablo are Construction & Extraction (1,595 | 11.0%), Installation, Maintenance & Repair (501 | 3.4%), and Farming, Fishing & Forestry (48 | 0.3%).
Natural Resources, Construction and Maintenance Occupations by Sex
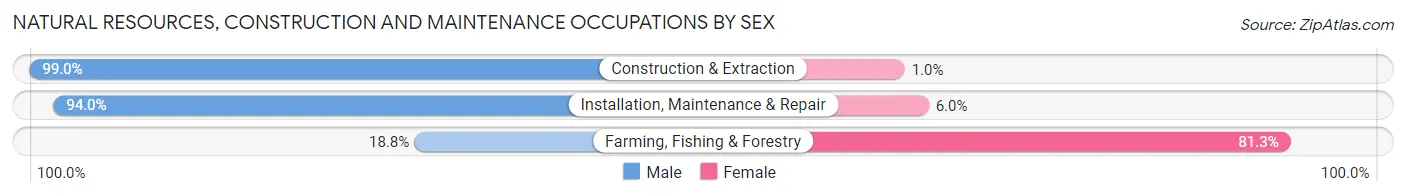
| Occupation | Male | Female |
| Farming, Fishing & Forestry | 9 (18.8%) | 39 (81.2%) |
| Construction & Extraction | 1,579 (99.0%) | 16 (1.0%) |
| Installation, Maintenance & Repair | 471 (94.0%) | 30 (6.0%) |
| Total (Category) | 2,059 (96.0%) | 85 (4.0%) |
| Total (Overall) | 8,063 (55.4%) | 6,484 (44.6%) |
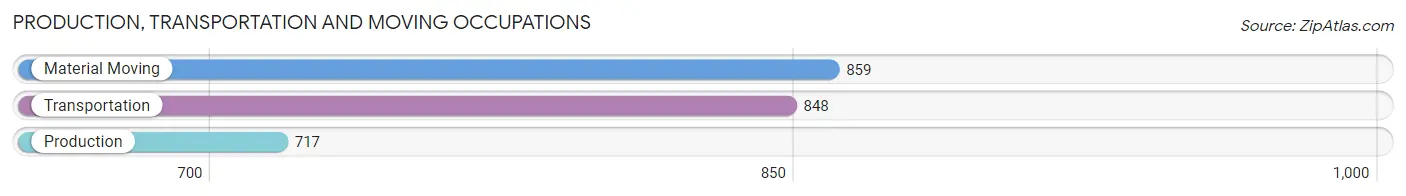
Production, Transportation and Moving Occupations
The most common Production, Transportation and Moving occupations in San Pablo are Material Moving (859 | 5.9%), Transportation (848 | 5.8%), and Production (717 | 4.9%).
Production, Transportation and Moving Occupations by Sex
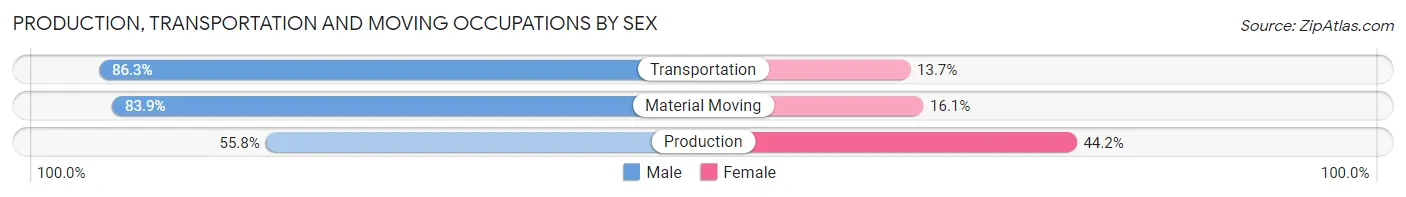
| Occupation | Male | Female |
| Production | 400 (55.8%) | 317 (44.2%) |
| Transportation | 732 (86.3%) | 116 (13.7%) |
| Material Moving | 721 (83.9%) | 138 (16.1%) |
| Total (Category) | 1,853 (76.4%) | 571 (23.6%) |
| Total (Overall) | 8,063 (55.4%) | 6,484 (44.6%) |
Employment Industries by Sex in San Pablo
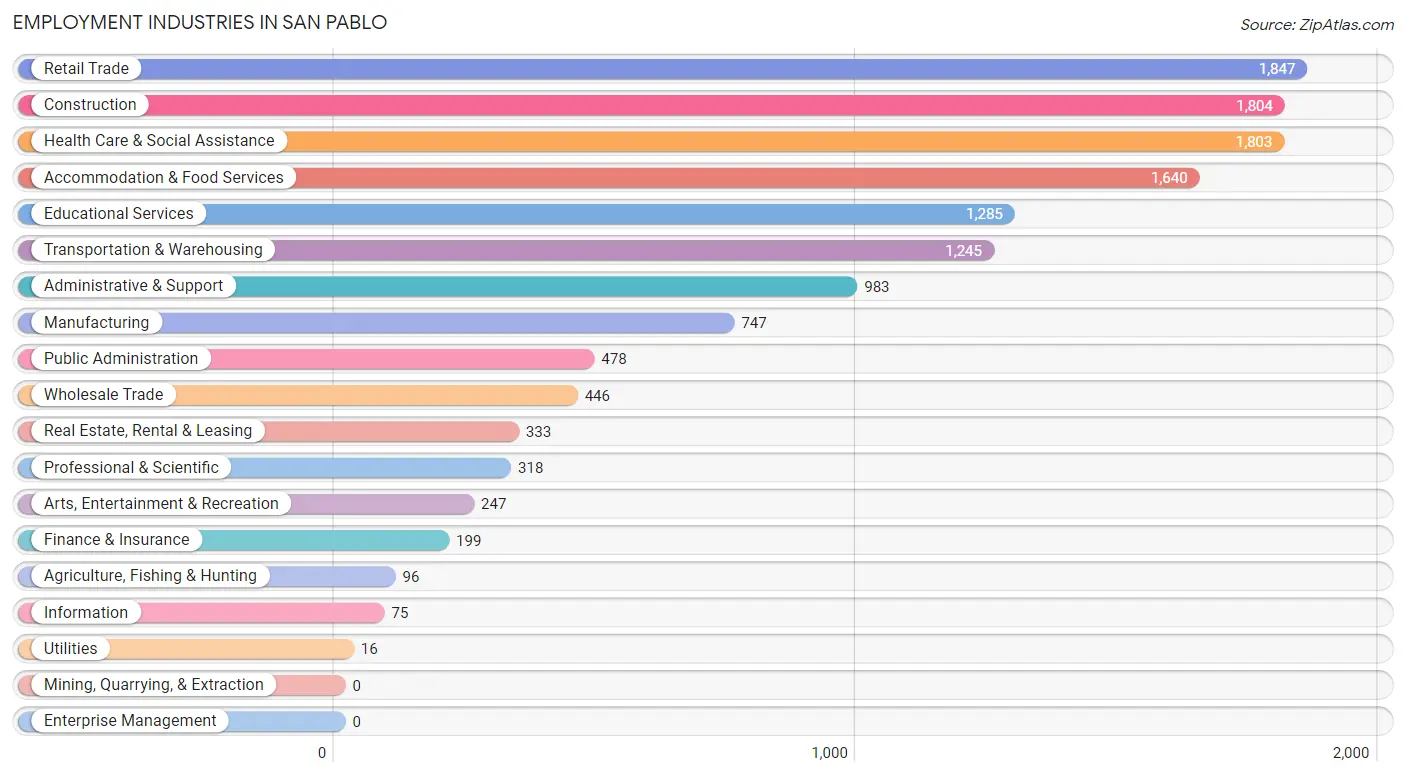
Employment Industries in San Pablo
The major employment industries in San Pablo include Retail Trade (1,847 | 12.7%), Construction (1,804 | 12.4%), Health Care & Social Assistance (1,803 | 12.4%), Accommodation & Food Services (1,640 | 11.3%), and Educational Services (1,285 | 8.8%).
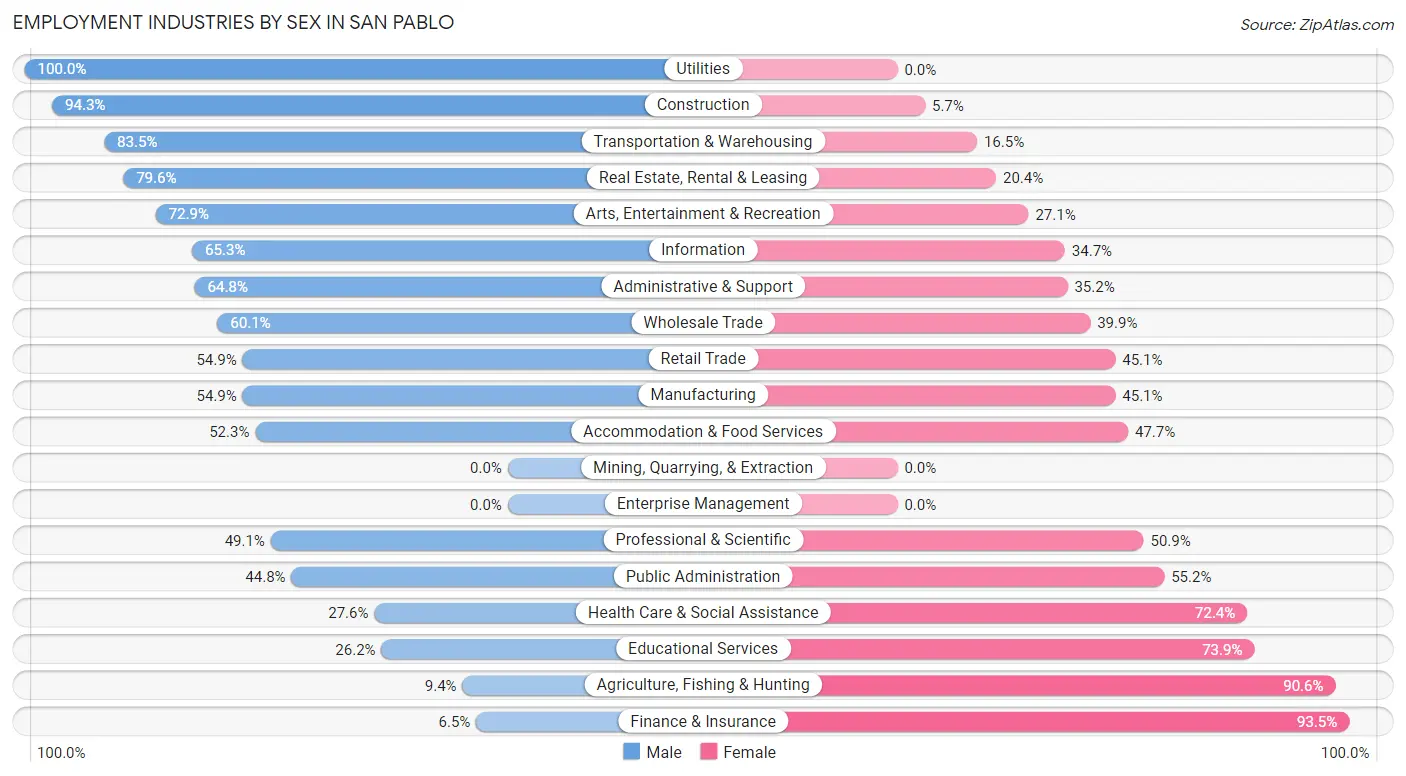
Employment Industries by Sex in San Pablo
The San Pablo industries that see more men than women are Utilities (100.0%), Construction (94.3%), and Transportation & Warehousing (83.5%), whereas the industries that tend to have a higher number of women are Finance & Insurance (93.5%), Agriculture, Fishing & Hunting (90.6%), and Educational Services (73.9%).
| Industry | Male | Female |
| Agriculture, Fishing & Hunting | 9 (9.4%) | 87 (90.6%) |
| Mining, Quarrying, & Extraction | 0 (0.0%) | 0 (0.0%) |
| Construction | 1,701 (94.3%) | 103 (5.7%) |
| Manufacturing | 410 (54.9%) | 337 (45.1%) |
| Wholesale Trade | 268 (60.1%) | 178 (39.9%) |
| Retail Trade | 1,014 (54.9%) | 833 (45.1%) |
| Transportation & Warehousing | 1,040 (83.5%) | 205 (16.5%) |
| Utilities | 16 (100.0%) | 0 (0.0%) |
| Information | 49 (65.3%) | 26 (34.7%) |
| Finance & Insurance | 13 (6.5%) | 186 (93.5%) |
| Real Estate, Rental & Leasing | 265 (79.6%) | 68 (20.4%) |
| Professional & Scientific | 156 (49.1%) | 162 (50.9%) |
| Enterprise Management | 0 (0.0%) | 0 (0.0%) |
| Administrative & Support | 637 (64.8%) | 346 (35.2%) |
| Educational Services | 336 (26.2%) | 949 (73.9%) |
| Health Care & Social Assistance | 498 (27.6%) | 1,305 (72.4%) |
| Arts, Entertainment & Recreation | 180 (72.9%) | 67 (27.1%) |
| Accommodation & Food Services | 857 (52.3%) | 783 (47.7%) |
| Public Administration | 214 (44.8%) | 264 (55.2%) |
| Total | 8,063 (55.4%) | 6,484 (44.6%) |
Education in San Pablo
School Enrollment in San Pablo
The most common levels of schooling among the 9,858 students in San Pablo are high school (2,350 | 23.8%), elementary school (2,259 | 22.9%), and college / undergraduate (2,228 | 22.6%).
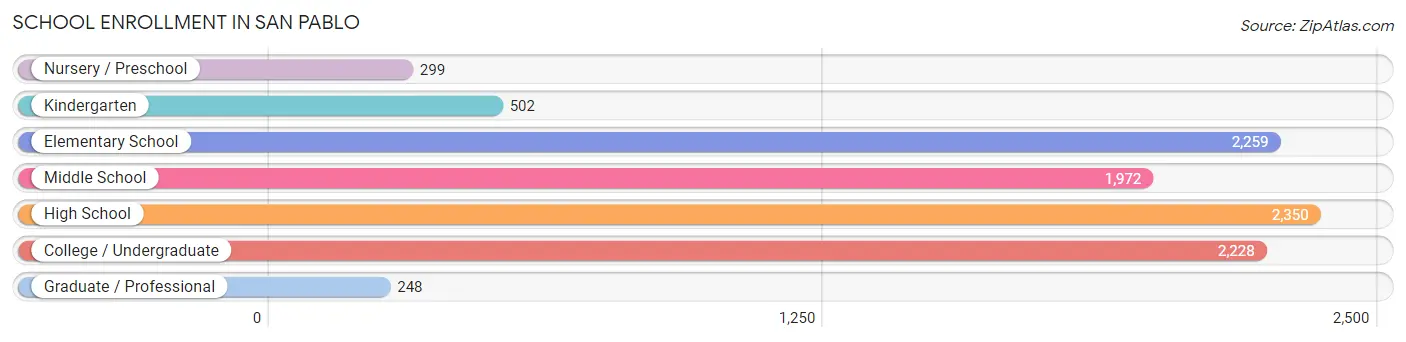
| School Level | # Students | % Students |
| Nursery / Preschool | 299 | 3.0% |
| Kindergarten | 502 | 5.1% |
| Elementary School | 2,259 | 22.9% |
| Middle School | 1,972 | 20.0% |
| High School | 2,350 | 23.8% |
| College / Undergraduate | 2,228 | 22.6% |
| Graduate / Professional | 248 | 2.5% |
| Total | 9,858 | 100.0% |
School Enrollment by Age by Funding Source in San Pablo
Out of a total of 9,858 students who are enrolled in schools in San Pablo, 897 (9.1%) attend a private institution, while the remaining 8,961 (90.9%) are enrolled in public schools. The age group of 35 years and over has the highest likelihood of being enrolled in private schools, with 97 (36.5% in the age bracket) enrolled. Conversely, the age group of 5 to 9 year old has the lowest likelihood of being enrolled in a private school, with 2,238 (97.6% in the age bracket) attending a public institution.
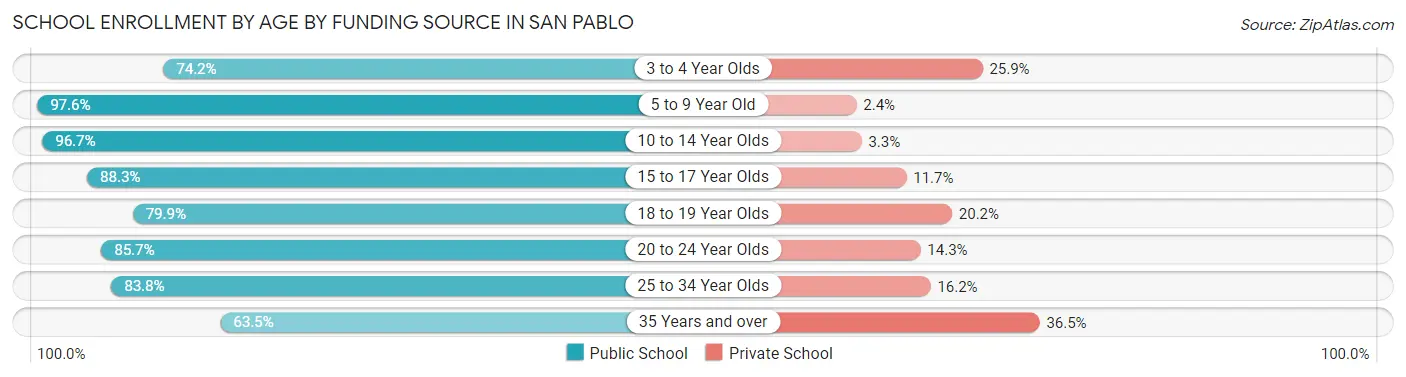
| Age Bracket | Public School | Private School |
| 3 to 4 Year Olds | 152 (74.2%) | 53 (25.9%) |
| 5 to 9 Year Old | 2,238 (97.6%) | 54 (2.4%) |
| 10 to 14 Year Olds | 2,918 (96.7%) | 100 (3.3%) |
| 15 to 17 Year Olds | 1,348 (88.3%) | 178 (11.7%) |
| 18 to 19 Year Olds | 547 (79.8%) | 138 (20.2%) |
| 20 to 24 Year Olds | 984 (85.7%) | 164 (14.3%) |
| 25 to 34 Year Olds | 602 (83.8%) | 116 (16.2%) |
| 35 Years and over | 169 (63.5%) | 97 (36.5%) |
| Total | 8,961 (90.9%) | 897 (9.1%) |
Educational Attainment by Field of Study in San Pablo
Business (554 | 16.4%), social sciences (475 | 14.0%), science & technology (475 | 14.0%), education (291 | 8.6%), and psychology (240 | 7.1%) are the most common fields of study among 3,388 individuals in San Pablo who have obtained a bachelor's degree or higher.
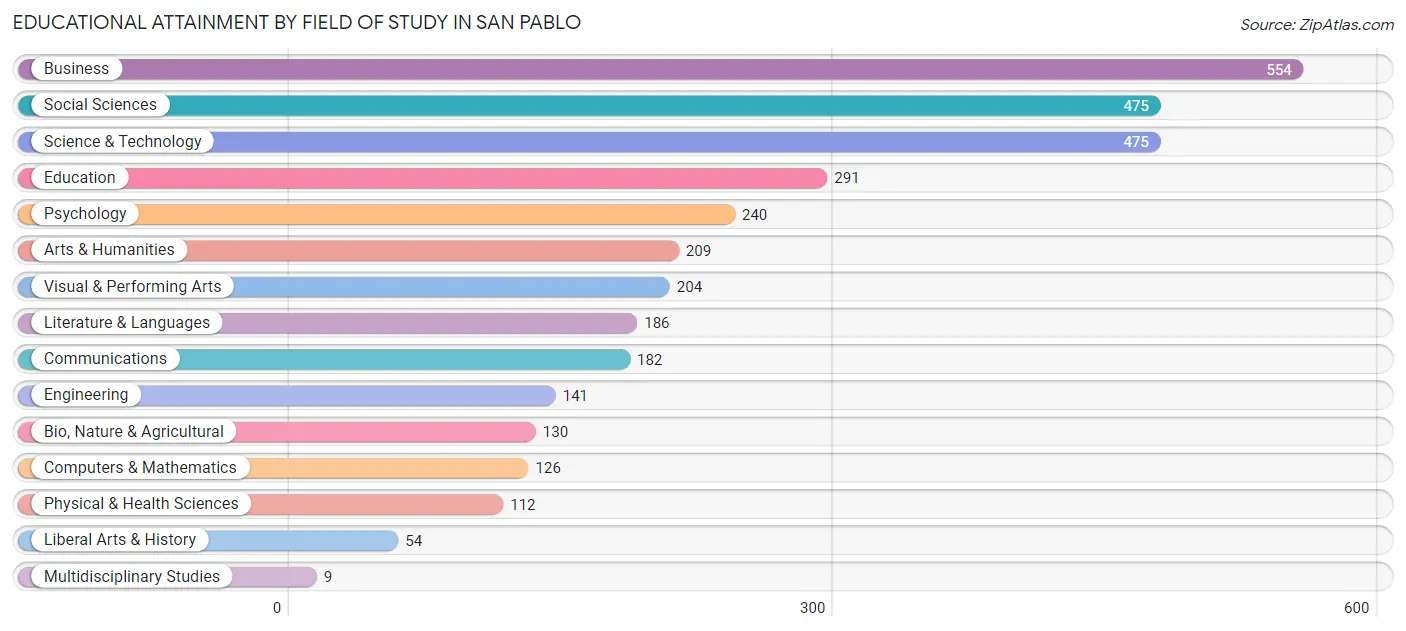
| Field of Study | # Graduates | % Graduates |
| Computers & Mathematics | 126 | 3.7% |
| Bio, Nature & Agricultural | 130 | 3.8% |
| Physical & Health Sciences | 112 | 3.3% |
| Psychology | 240 | 7.1% |
| Social Sciences | 475 | 14.0% |
| Engineering | 141 | 4.2% |
| Multidisciplinary Studies | 9 | 0.3% |
| Science & Technology | 475 | 14.0% |
| Business | 554 | 16.4% |
| Education | 291 | 8.6% |
| Literature & Languages | 186 | 5.5% |
| Liberal Arts & History | 54 | 1.6% |
| Visual & Performing Arts | 204 | 6.0% |
| Communications | 182 | 5.4% |
| Arts & Humanities | 209 | 6.2% |
| Total | 3,388 | 100.0% |
Transportation & Commute in San Pablo
Vehicle Availability by Sex in San Pablo
The most prevalent vehicle ownership categories in San Pablo are males with 2 vehicles (2,938, accounting for 37.5%) and females with 2 vehicles (2,120, making up 48.7%).
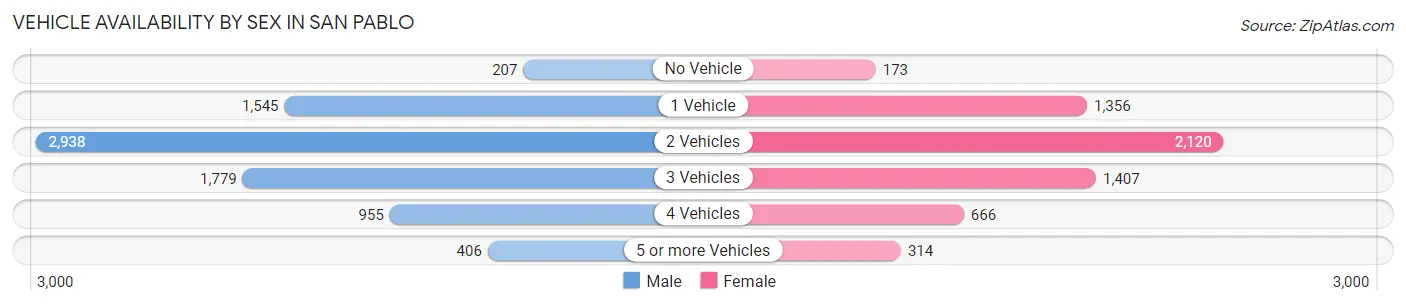
| Vehicles Available | Male | Female |
| No Vehicle | 207 (2.6%) | 173 (2.9%) |
| 1 Vehicle | 1,545 (19.7%) | 1,356 (22.5%) |
| 2 Vehicles | 2,938 (37.5%) | 2,120 (35.1%) |
| 3 Vehicles | 1,779 (22.7%) | 1,407 (23.3%) |
| 4 Vehicles | 955 (12.2%) | 666 (11.0%) |
| 5 or more Vehicles | 406 (5.2%) | 314 (5.2%) |
| Total | 7,830 (100.0%) | 6,036 (100.0%) |
Commute Time in San Pablo
The most frequently occuring commute durations in San Pablo are 30 to 34 minutes (2,287 commuters, 17.6%), 45 to 59 minutes (1,643 commuters, 12.6%), and 10 to 14 minutes (1,638 commuters, 12.6%).
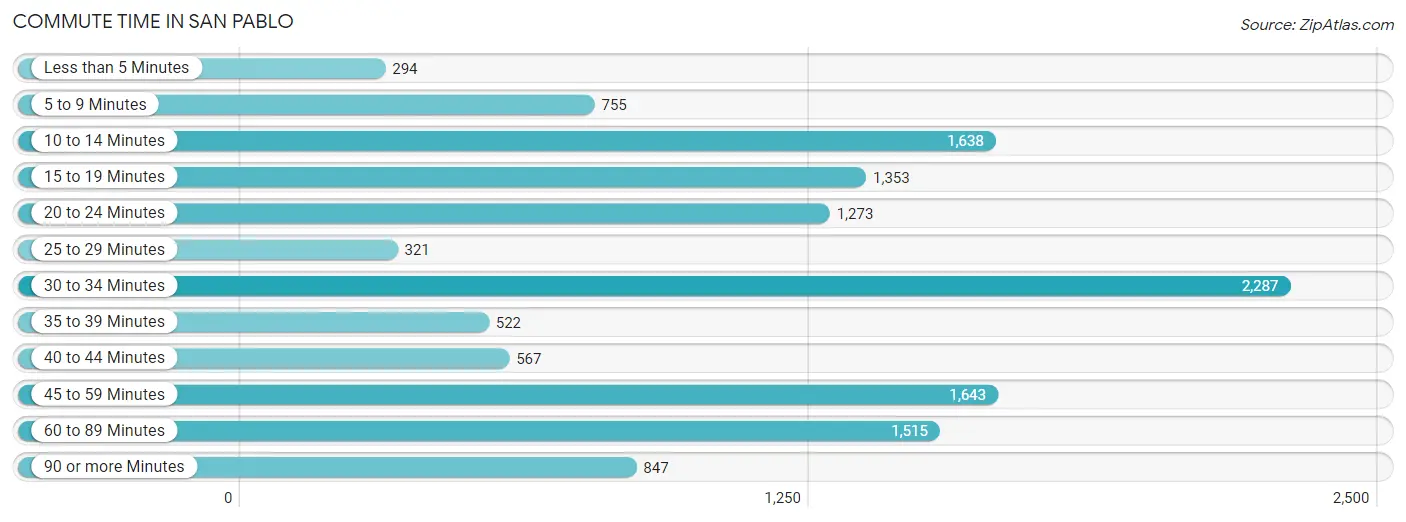
| Commute Time | # Commuters | % Commuters |
| Less than 5 Minutes | 294 | 2.3% |
| 5 to 9 Minutes | 755 | 5.8% |
| 10 to 14 Minutes | 1,638 | 12.6% |
| 15 to 19 Minutes | 1,353 | 10.4% |
| 20 to 24 Minutes | 1,273 | 9.8% |
| 25 to 29 Minutes | 321 | 2.5% |
| 30 to 34 Minutes | 2,287 | 17.6% |
| 35 to 39 Minutes | 522 | 4.0% |
| 40 to 44 Minutes | 567 | 4.4% |
| 45 to 59 Minutes | 1,643 | 12.6% |
| 60 to 89 Minutes | 1,515 | 11.6% |
| 90 or more Minutes | 847 | 6.5% |
Commute Time by Sex in San Pablo
The most common commute times in San Pablo are 30 to 34 minutes (1,557 commuters, 20.7%) for males and 10 to 14 minutes (746 commuters, 13.6%) for females.
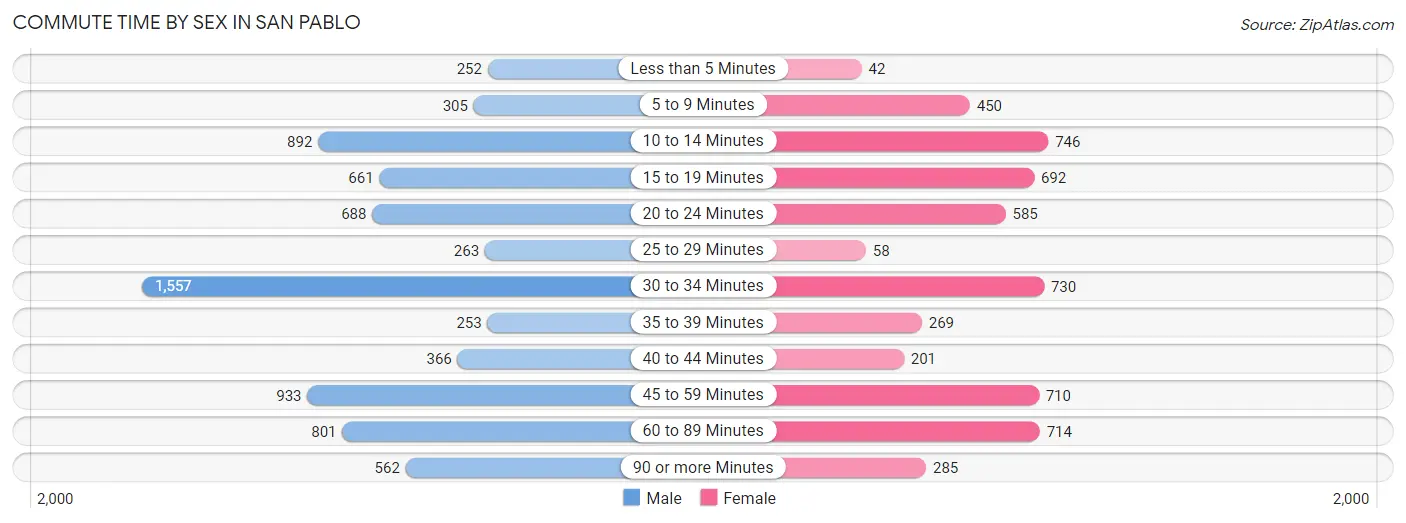
| Commute Time | Male | Female |
| Less than 5 Minutes | 252 (3.4%) | 42 (0.8%) |
| 5 to 9 Minutes | 305 (4.1%) | 450 (8.2%) |
| 10 to 14 Minutes | 892 (11.8%) | 746 (13.6%) |
| 15 to 19 Minutes | 661 (8.8%) | 692 (12.6%) |
| 20 to 24 Minutes | 688 (9.1%) | 585 (10.7%) |
| 25 to 29 Minutes | 263 (3.5%) | 58 (1.1%) |
| 30 to 34 Minutes | 1,557 (20.7%) | 730 (13.3%) |
| 35 to 39 Minutes | 253 (3.4%) | 269 (4.9%) |
| 40 to 44 Minutes | 366 (4.9%) | 201 (3.7%) |
| 45 to 59 Minutes | 933 (12.4%) | 710 (13.0%) |
| 60 to 89 Minutes | 801 (10.6%) | 714 (13.0%) |
| 90 or more Minutes | 562 (7.5%) | 285 (5.2%) |
Time of Departure to Work by Sex in San Pablo
The most frequent times of departure to work in San Pablo are 7:00 AM to 7:29 AM (1,179, 15.7%) for males and 7:00 AM to 7:29 AM (813, 14.8%) for females.
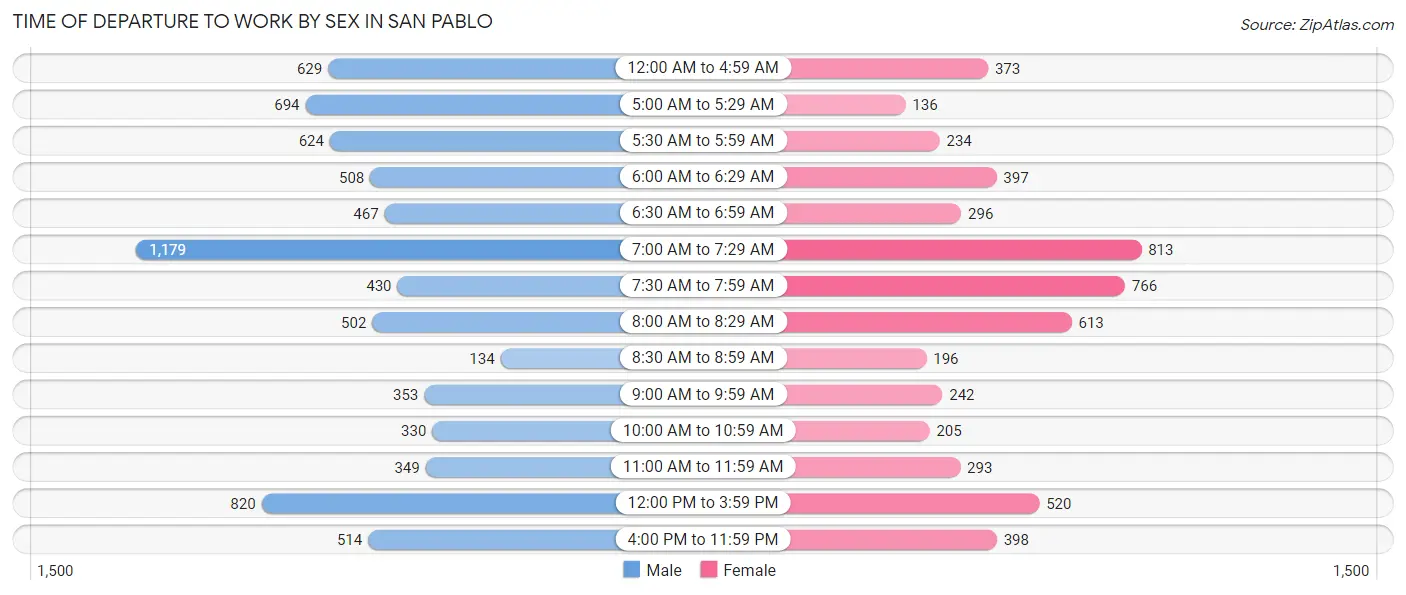
| Time of Departure | Male | Female |
| 12:00 AM to 4:59 AM | 629 (8.4%) | 373 (6.8%) |
| 5:00 AM to 5:29 AM | 694 (9.2%) | 136 (2.5%) |
| 5:30 AM to 5:59 AM | 624 (8.3%) | 234 (4.3%) |
| 6:00 AM to 6:29 AM | 508 (6.7%) | 397 (7.2%) |
| 6:30 AM to 6:59 AM | 467 (6.2%) | 296 (5.4%) |
| 7:00 AM to 7:29 AM | 1,179 (15.7%) | 813 (14.8%) |
| 7:30 AM to 7:59 AM | 430 (5.7%) | 766 (14.0%) |
| 8:00 AM to 8:29 AM | 502 (6.7%) | 613 (11.2%) |
| 8:30 AM to 8:59 AM | 134 (1.8%) | 196 (3.6%) |
| 9:00 AM to 9:59 AM | 353 (4.7%) | 242 (4.4%) |
| 10:00 AM to 10:59 AM | 330 (4.4%) | 205 (3.7%) |
| 11:00 AM to 11:59 AM | 349 (4.6%) | 293 (5.3%) |
| 12:00 PM to 3:59 PM | 820 (10.9%) | 520 (9.5%) |
| 4:00 PM to 11:59 PM | 514 (6.8%) | 398 (7.3%) |
| Total | 7,533 (100.0%) | 5,482 (100.0%) |
Housing Occupancy in San Pablo
Occupancy by Ownership in San Pablo
Of the total 9,737 dwellings in San Pablo, owner-occupied units account for 4,129 (42.4%), while renter-occupied units make up 5,608 (57.6%).
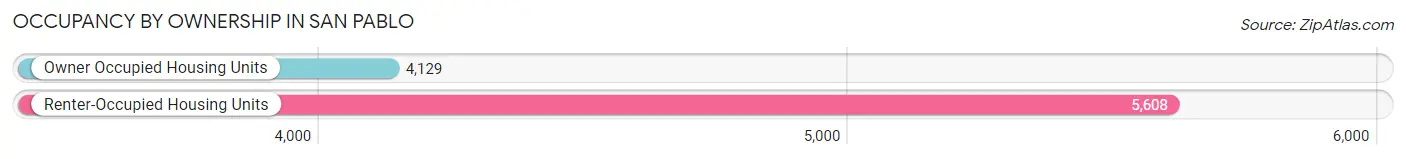
| Occupancy | # Housing Units | % Housing Units |
| Owner Occupied Housing Units | 4,129 | 42.4% |
| Renter-Occupied Housing Units | 5,608 | 57.6% |
| Total Occupied Housing Units | 9,737 | 100.0% |
Occupancy by Household Size in San Pablo
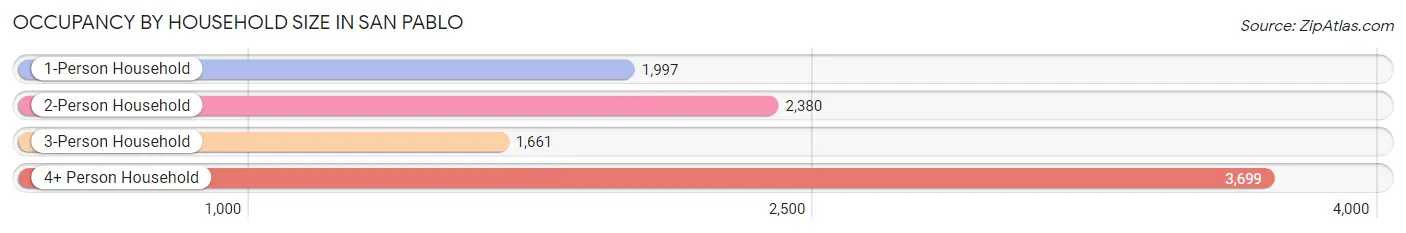
| Household Size | # Housing Units | % Housing Units |
| 1-Person Household | 1,997 | 20.5% |
| 2-Person Household | 2,380 | 24.4% |
| 3-Person Household | 1,661 | 17.1% |
| 4+ Person Household | 3,699 | 38.0% |
| Total Housing Units | 9,737 | 100.0% |
Occupancy by Ownership by Household Size in San Pablo
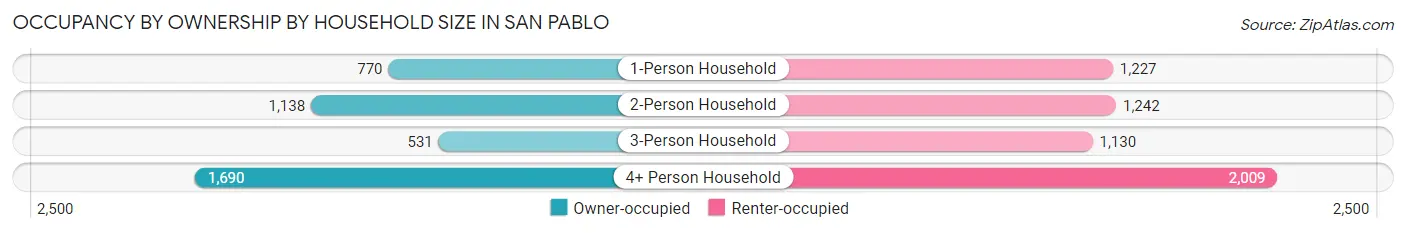
| Household Size | Owner-occupied | Renter-occupied |
| 1-Person Household | 770 (38.6%) | 1,227 (61.4%) |
| 2-Person Household | 1,138 (47.8%) | 1,242 (52.2%) |
| 3-Person Household | 531 (32.0%) | 1,130 (68.0%) |
| 4+ Person Household | 1,690 (45.7%) | 2,009 (54.3%) |
| Total Housing Units | 4,129 (42.4%) | 5,608 (57.6%) |
Occupancy by Educational Attainment in San Pablo
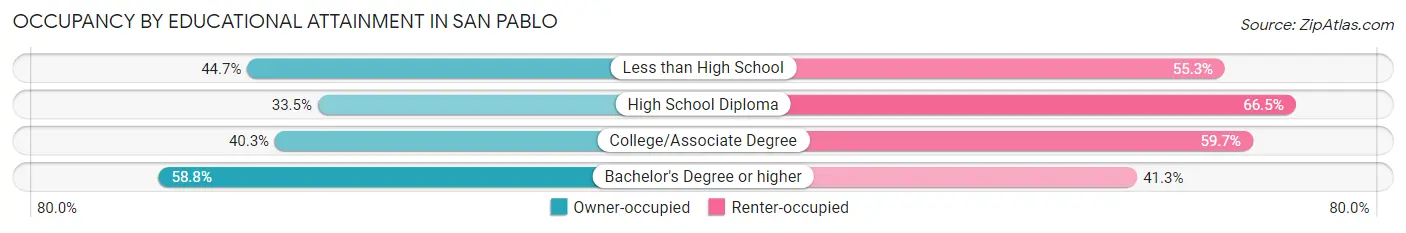
| Household Size | Owner-occupied | Renter-occupied |
| Less than High School | 1,057 (44.7%) | 1,308 (55.3%) |
| High School Diploma | 959 (33.5%) | 1,904 (66.5%) |
| College/Associate Degree | 1,170 (40.3%) | 1,734 (59.7%) |
| Bachelor's Degree or higher | 943 (58.8%) | 662 (41.2%) |
Occupancy by Age of Householder in San Pablo
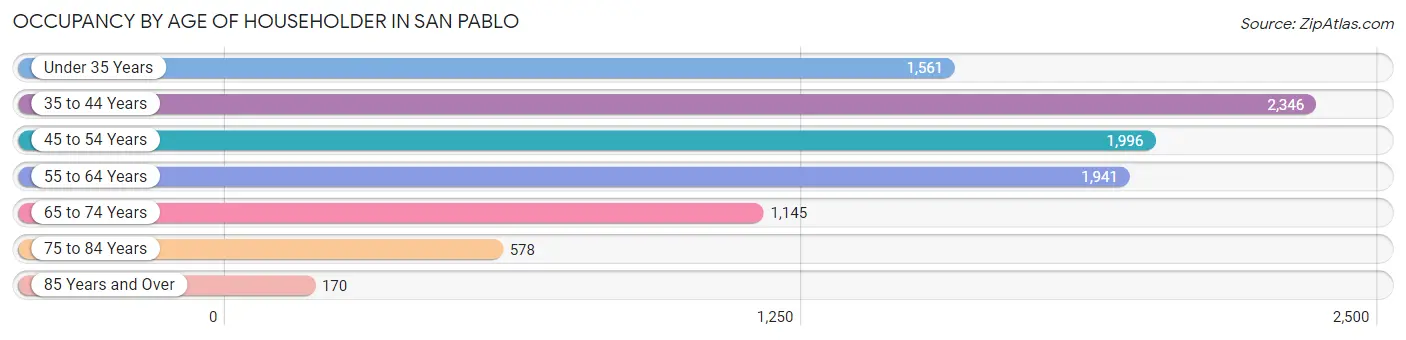
| Age Bracket | # Households | % Households |
| Under 35 Years | 1,561 | 16.0% |
| 35 to 44 Years | 2,346 | 24.1% |
| 45 to 54 Years | 1,996 | 20.5% |
| 55 to 64 Years | 1,941 | 19.9% |
| 65 to 74 Years | 1,145 | 11.8% |
| 75 to 84 Years | 578 | 5.9% |
| 85 Years and Over | 170 | 1.8% |
| Total | 9,737 | 100.0% |
Housing Finances in San Pablo
Median Income by Occupancy in San Pablo
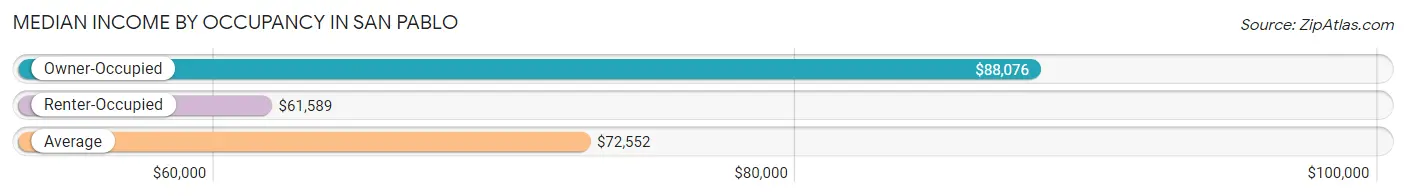
| Occupancy Type | # Households | Median Income |
| Owner-Occupied | 4,129 (42.4%) | $88,076 |
| Renter-Occupied | 5,608 (57.6%) | $61,589 |
| Average | 9,737 (100.0%) | $72,552 |
Occupancy by Householder Income Bracket in San Pablo
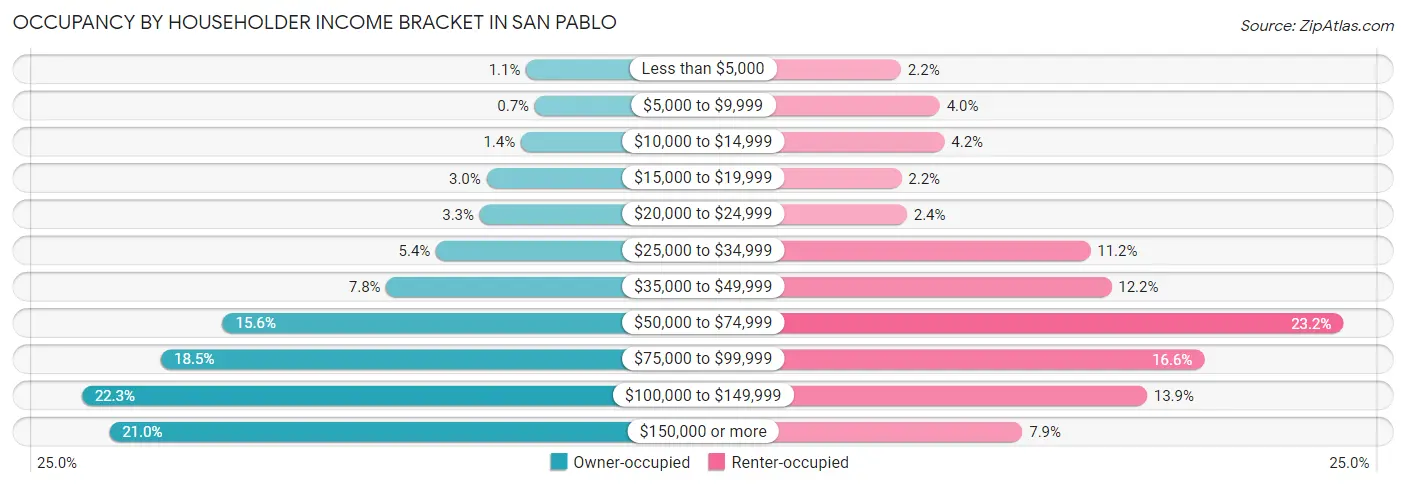
| Income Bracket | Owner-occupied | Renter-occupied |
| Less than $5,000 | 46 (1.1%) | 121 (2.2%) |
| $5,000 to $9,999 | 29 (0.7%) | 225 (4.0%) |
| $10,000 to $14,999 | 56 (1.4%) | 237 (4.2%) |
| $15,000 to $19,999 | 124 (3.0%) | 122 (2.2%) |
| $20,000 to $24,999 | 137 (3.3%) | 137 (2.4%) |
| $25,000 to $34,999 | 223 (5.4%) | 627 (11.2%) |
| $35,000 to $49,999 | 321 (7.8%) | 683 (12.2%) |
| $50,000 to $74,999 | 643 (15.6%) | 1,302 (23.2%) |
| $75,000 to $99,999 | 764 (18.5%) | 931 (16.6%) |
| $100,000 to $149,999 | 920 (22.3%) | 778 (13.9%) |
| $150,000 or more | 866 (21.0%) | 445 (7.9%) |
| Total | 4,129 (100.0%) | 5,608 (100.0%) |
Monthly Housing Cost Tiers in San Pablo
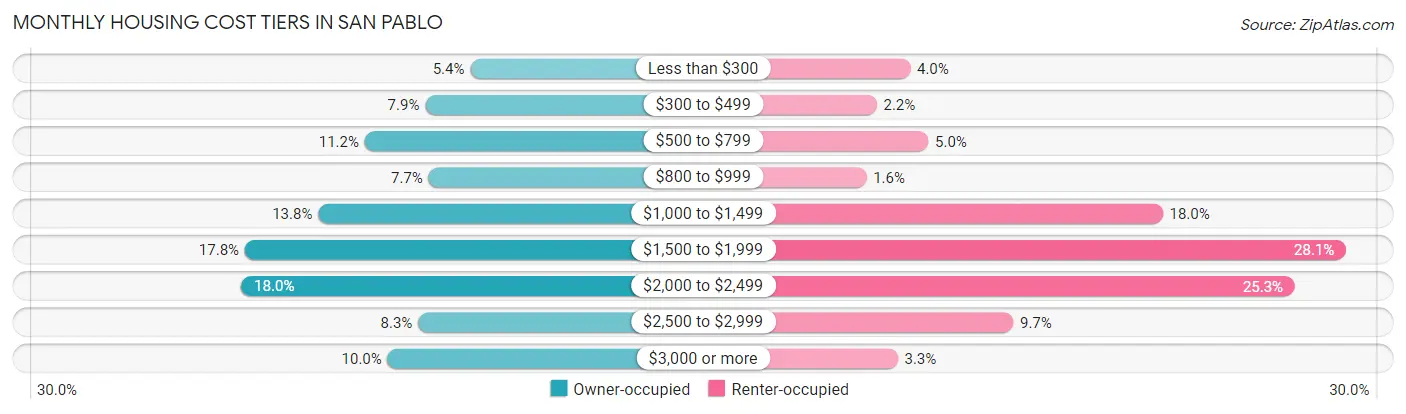
| Monthly Cost | Owner-occupied | Renter-occupied |
| Less than $300 | 222 (5.4%) | 225 (4.0%) |
| $300 to $499 | 325 (7.9%) | 121 (2.2%) |
| $500 to $799 | 463 (11.2%) | 281 (5.0%) |
| $800 to $999 | 317 (7.7%) | 89 (1.6%) |
| $1,000 to $1,499 | 569 (13.8%) | 1,007 (18.0%) |
| $1,500 to $1,999 | 736 (17.8%) | 1,576 (28.1%) |
| $2,000 to $2,499 | 745 (18.0%) | 1,417 (25.3%) |
| $2,500 to $2,999 | 341 (8.3%) | 544 (9.7%) |
| $3,000 or more | 411 (10.0%) | 186 (3.3%) |
| Total | 4,129 (100.0%) | 5,608 (100.0%) |
Physical Housing Characteristics in San Pablo
Housing Structures in San Pablo
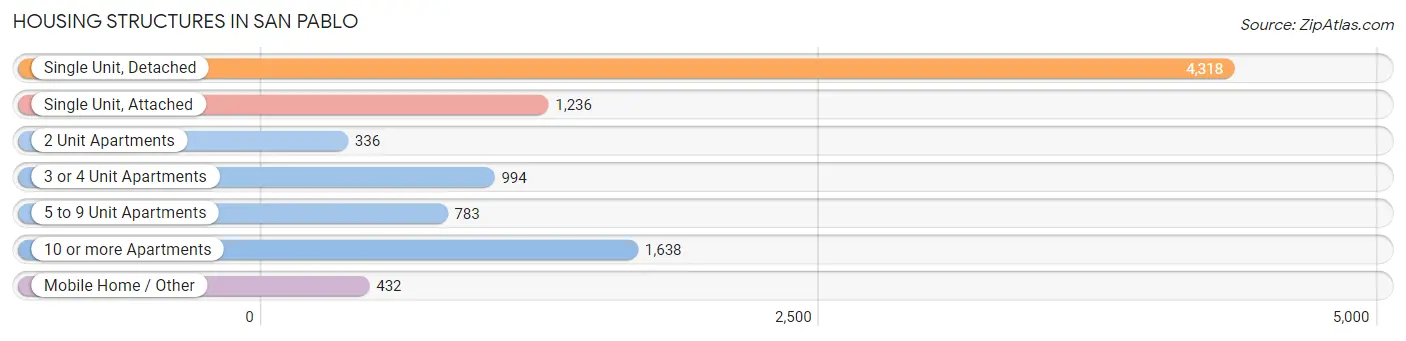
| Structure Type | # Housing Units | % Housing Units |
| Single Unit, Detached | 4,318 | 44.4% |
| Single Unit, Attached | 1,236 | 12.7% |
| 2 Unit Apartments | 336 | 3.5% |
| 3 or 4 Unit Apartments | 994 | 10.2% |
| 5 to 9 Unit Apartments | 783 | 8.0% |
| 10 or more Apartments | 1,638 | 16.8% |
| Mobile Home / Other | 432 | 4.4% |
| Total | 9,737 | 100.0% |
Housing Structures by Occupancy in San Pablo
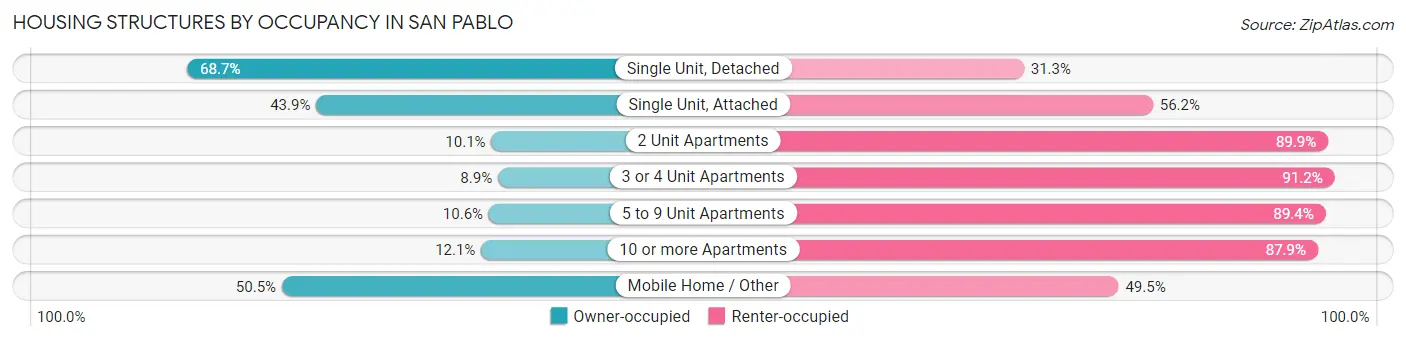
| Structure Type | Owner-occupied | Renter-occupied |
| Single Unit, Detached | 2,966 (68.7%) | 1,352 (31.3%) |
| Single Unit, Attached | 542 (43.9%) | 694 (56.1%) |
| 2 Unit Apartments | 34 (10.1%) | 302 (89.9%) |
| 3 or 4 Unit Apartments | 88 (8.8%) | 906 (91.1%) |
| 5 to 9 Unit Apartments | 83 (10.6%) | 700 (89.4%) |
| 10 or more Apartments | 198 (12.1%) | 1,440 (87.9%) |
| Mobile Home / Other | 218 (50.5%) | 214 (49.5%) |
| Total | 4,129 (42.4%) | 5,608 (57.6%) |
Housing Structures by Number of Rooms in San Pablo
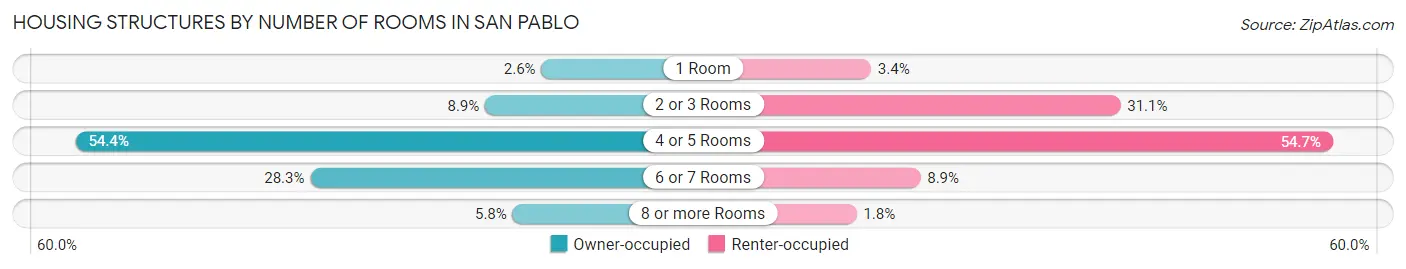
| Number of Rooms | Owner-occupied | Renter-occupied |
| 1 Room | 109 (2.6%) | 193 (3.4%) |
| 2 or 3 Rooms | 367 (8.9%) | 1,745 (31.1%) |
| 4 or 5 Rooms | 2,244 (54.3%) | 3,067 (54.7%) |
| 6 or 7 Rooms | 1,168 (28.3%) | 500 (8.9%) |
| 8 or more Rooms | 241 (5.8%) | 103 (1.8%) |
| Total | 4,129 (100.0%) | 5,608 (100.0%) |
Housing Structure by Heating Type in San Pablo
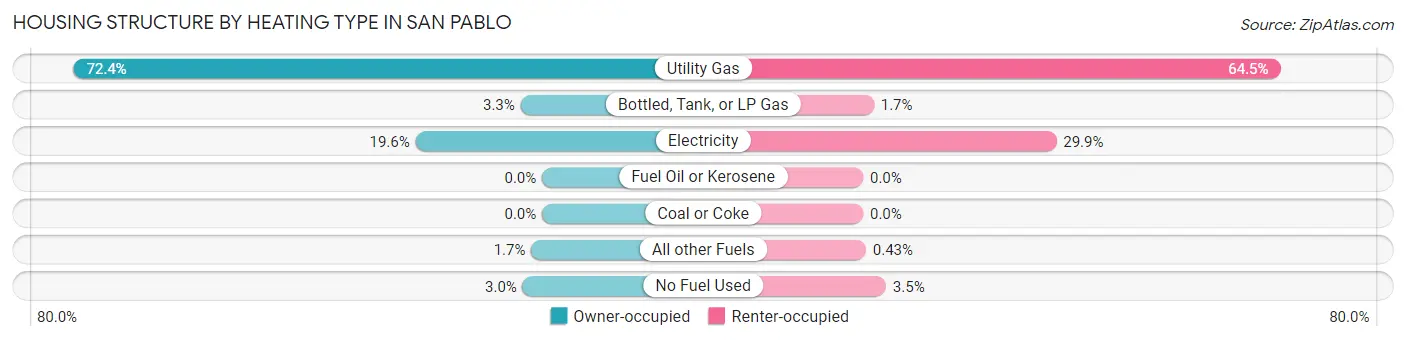
| Heating Type | Owner-occupied | Renter-occupied |
| Utility Gas | 2,991 (72.4%) | 3,618 (64.5%) |
| Bottled, Tank, or LP Gas | 137 (3.3%) | 93 (1.7%) |
| Electricity | 808 (19.6%) | 1,675 (29.9%) |
| Fuel Oil or Kerosene | 0 (0.0%) | 0 (0.0%) |
| Coal or Coke | 0 (0.0%) | 0 (0.0%) |
| All other Fuels | 69 (1.7%) | 24 (0.4%) |
| No Fuel Used | 124 (3.0%) | 198 (3.5%) |
| Total | 4,129 (100.0%) | 5,608 (100.0%) |
Household Vehicle Usage in San Pablo
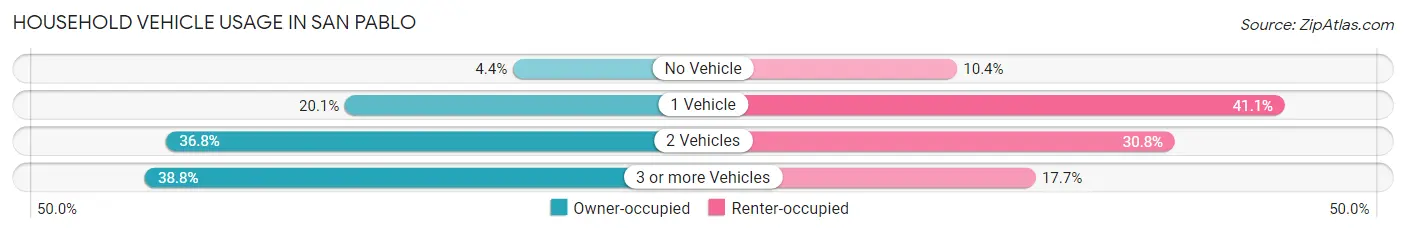
| Vehicles per Household | Owner-occupied | Renter-occupied |
| No Vehicle | 182 (4.4%) | 583 (10.4%) |
| 1 Vehicle | 829 (20.1%) | 2,303 (41.1%) |
| 2 Vehicles | 1,518 (36.8%) | 1,727 (30.8%) |
| 3 or more Vehicles | 1,600 (38.8%) | 995 (17.7%) |
| Total | 4,129 (100.0%) | 5,608 (100.0%) |
Real Estate & Mortgages in San Pablo
Real Estate and Mortgage Overview in San Pablo
| Characteristic | Without Mortgage | With Mortgage |
| Housing Units | 1,462 | 2,667 |
| Median Property Value | $502,900 | $472,900 |
| Median Household Income | $80,795 | $618 |
| Monthly Housing Costs | $640 | $411 |
| Real Estate Taxes | $3,478 | $87 |
Property Value by Mortgage Status in San Pablo
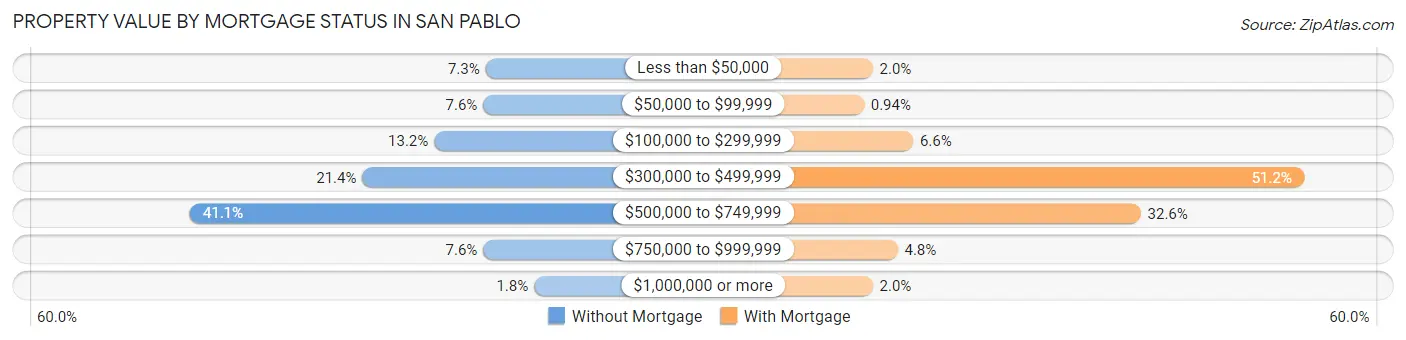
| Property Value | Without Mortgage | With Mortgage |
| Less than $50,000 | 107 (7.3%) | 52 (1.9%) |
| $50,000 to $99,999 | 111 (7.6%) | 25 (0.9%) |
| $100,000 to $299,999 | 193 (13.2%) | 175 (6.6%) |
| $300,000 to $499,999 | 313 (21.4%) | 1,366 (51.2%) |
| $500,000 to $749,999 | 601 (41.1%) | 869 (32.6%) |
| $750,000 to $999,999 | 111 (7.6%) | 128 (4.8%) |
| $1,000,000 or more | 26 (1.8%) | 52 (1.9%) |
| Total | 1,462 (100.0%) | 2,667 (100.0%) |
Household Income by Mortgage Status in San Pablo
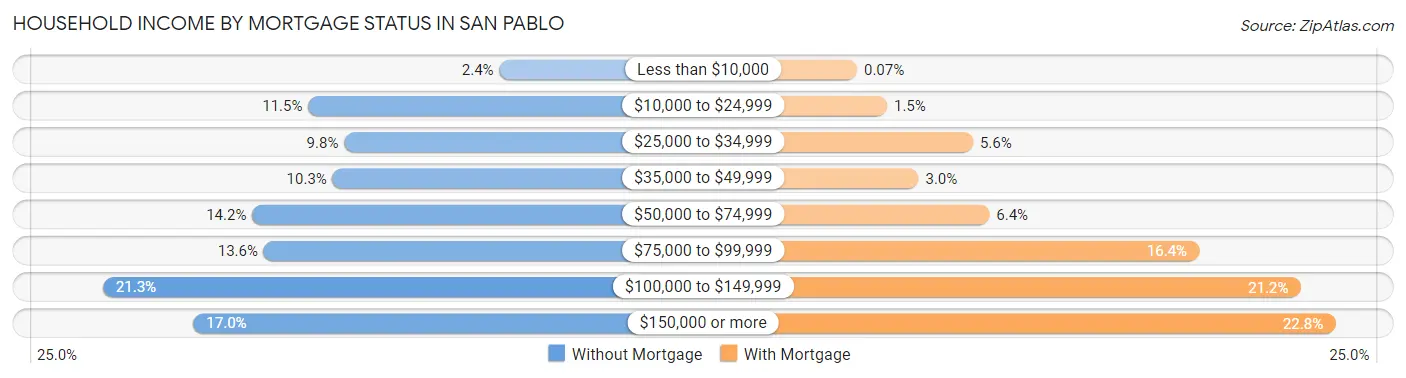
| Household Income | Without Mortgage | With Mortgage |
| Less than $10,000 | 35 (2.4%) | 2 (0.1%) |
| $10,000 to $24,999 | 168 (11.5%) | 40 (1.5%) |
| $25,000 to $34,999 | 143 (9.8%) | 149 (5.6%) |
| $35,000 to $49,999 | 151 (10.3%) | 80 (3.0%) |
| $50,000 to $74,999 | 207 (14.2%) | 170 (6.4%) |
| $75,000 to $99,999 | 199 (13.6%) | 436 (16.4%) |
| $100,000 to $149,999 | 311 (21.3%) | 565 (21.2%) |
| $150,000 or more | 248 (17.0%) | 609 (22.8%) |
| Total | 1,462 (100.0%) | 2,667 (100.0%) |
Property Value to Household Income Ratio in San Pablo
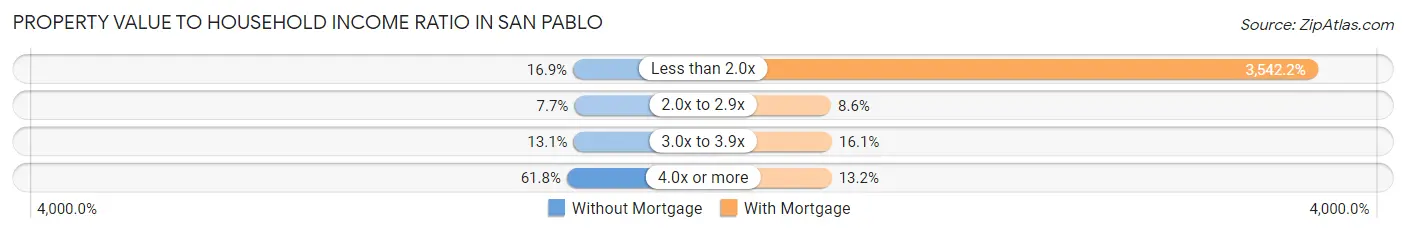
| Value-to-Income Ratio | Without Mortgage | With Mortgage |
| Less than 2.0x | 247 (16.9%) | 94,471 (3,542.2%) |
| 2.0x to 2.9x | 113 (7.7%) | 228 (8.6%) |
| 3.0x to 3.9x | 192 (13.1%) | 429 (16.1%) |
| 4.0x or more | 904 (61.8%) | 353 (13.2%) |
| Total | 1,462 (100.0%) | 2,667 (100.0%) |
Real Estate Taxes by Mortgage Status in San Pablo
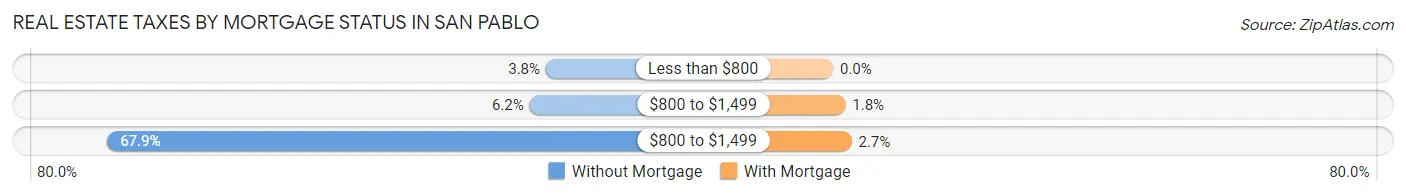
| Property Taxes | Without Mortgage | With Mortgage |
| Less than $800 | 56 (3.8%) | 0 (0.0%) |
| $800 to $1,499 | 91 (6.2%) | 48 (1.8%) |
| $800 to $1,499 | 993 (67.9%) | 72 (2.7%) |
| Total | 1,462 (100.0%) | 2,667 (100.0%) |
Health & Disability in San Pablo
Health Insurance Coverage by Age in San Pablo
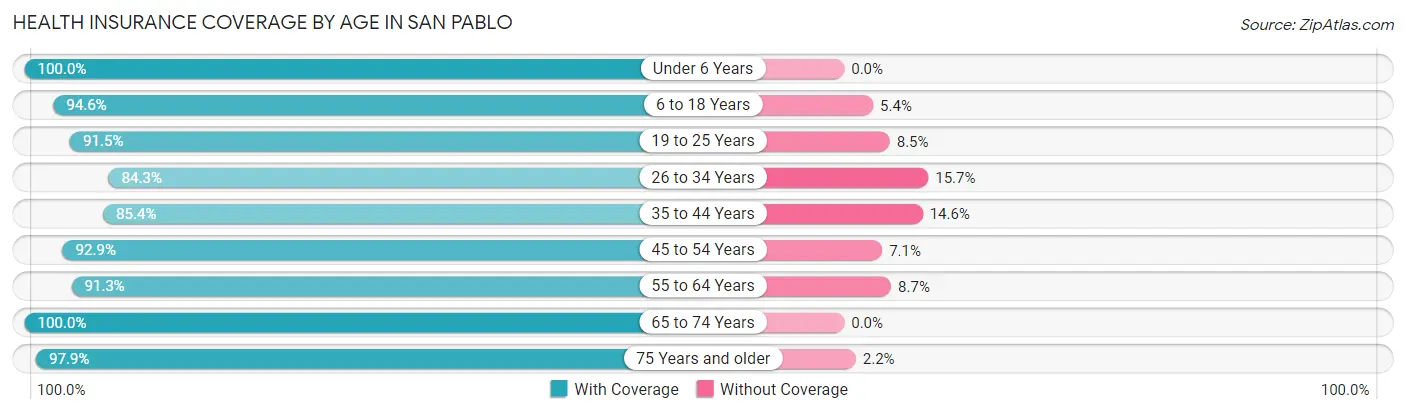
| Age Bracket | With Coverage | Without Coverage |
| Under 6 Years | 2,045 (100.0%) | 0 (0.0%) |
| 6 to 18 Years | 6,880 (94.6%) | 391 (5.4%) |
| 19 to 25 Years | 3,001 (91.5%) | 278 (8.5%) |
| 26 to 34 Years | 3,438 (84.3%) | 639 (15.7%) |
| 35 to 44 Years | 3,965 (85.4%) | 679 (14.6%) |
| 45 to 54 Years | 3,564 (92.9%) | 271 (7.1%) |
| 55 to 64 Years | 3,059 (91.3%) | 293 (8.7%) |
| 65 to 74 Years | 1,853 (100.0%) | 0 (0.0%) |
| 75 Years and older | 1,136 (97.9%) | 25 (2.1%) |
| Total | 28,941 (91.8%) | 2,576 (8.2%) |
Health Insurance Coverage by Citizenship Status in San Pablo
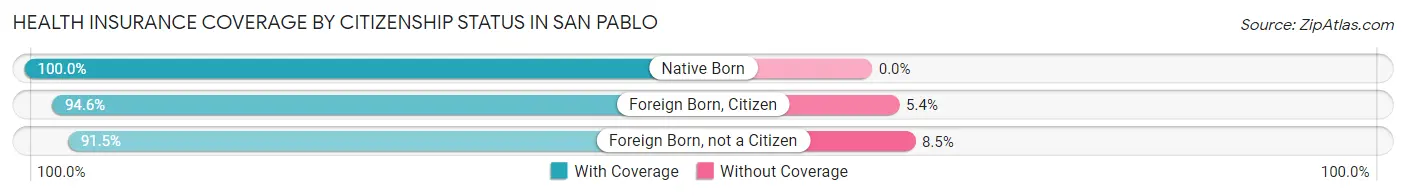
| Citizenship Status | With Coverage | Without Coverage |
| Native Born | 2,045 (100.0%) | 0 (0.0%) |
| Foreign Born, Citizen | 6,880 (94.6%) | 391 (5.4%) |
| Foreign Born, not a Citizen | 3,001 (91.5%) | 278 (8.5%) |
Health Insurance Coverage by Household Income in San Pablo
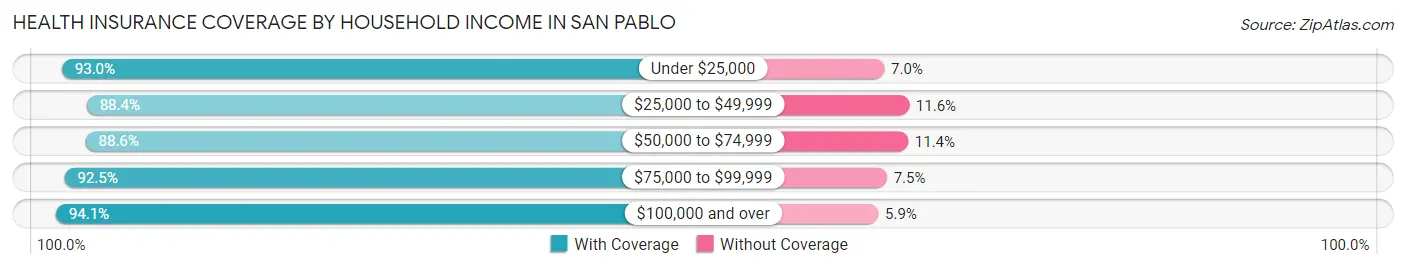
| Household Income | With Coverage | Without Coverage |
| Under $25,000 | 2,248 (93.0%) | 169 (7.0%) |
| $25,000 to $49,999 | 4,287 (88.4%) | 565 (11.6%) |
| $50,000 to $74,999 | 5,436 (88.6%) | 702 (11.4%) |
| $75,000 to $99,999 | 4,850 (92.5%) | 392 (7.5%) |
| $100,000 and over | 11,989 (94.1%) | 748 (5.9%) |
Public vs Private Health Insurance Coverage by Age in San Pablo
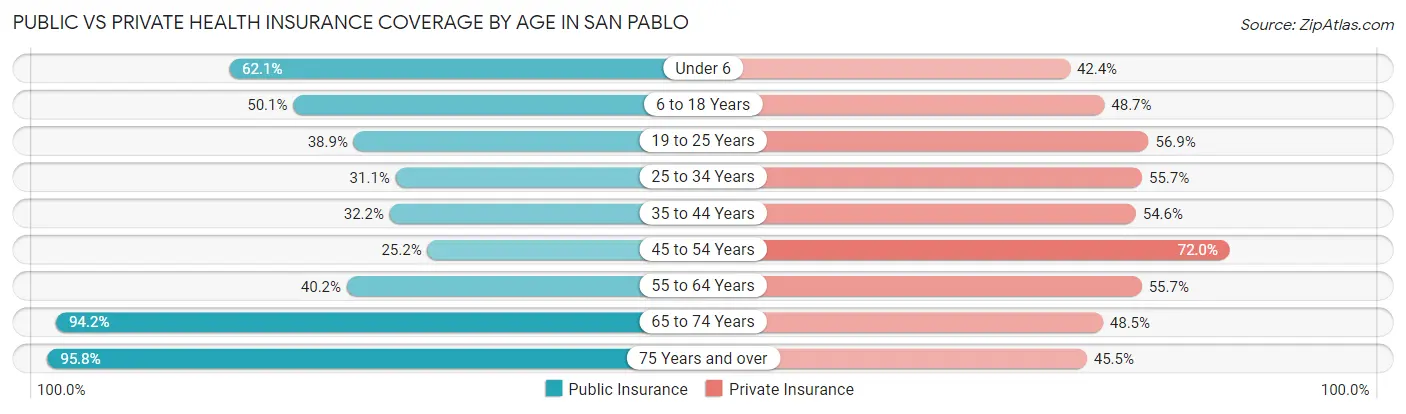
| Age Bracket | Public Insurance | Private Insurance |
| Under 6 | 1,269 (62.1%) | 866 (42.3%) |
| 6 to 18 Years | 3,644 (50.1%) | 3,544 (48.7%) |
| 19 to 25 Years | 1,276 (38.9%) | 1,867 (56.9%) |
| 25 to 34 Years | 1,269 (31.1%) | 2,272 (55.7%) |
| 35 to 44 Years | 1,496 (32.2%) | 2,534 (54.6%) |
| 45 to 54 Years | 967 (25.2%) | 2,762 (72.0%) |
| 55 to 64 Years | 1,347 (40.2%) | 1,866 (55.7%) |
| 65 to 74 Years | 1,745 (94.2%) | 898 (48.5%) |
| 75 Years and over | 1,112 (95.8%) | 528 (45.5%) |
| Total | 14,125 (44.8%) | 17,137 (54.4%) |
Disability Status by Sex by Age in San Pablo
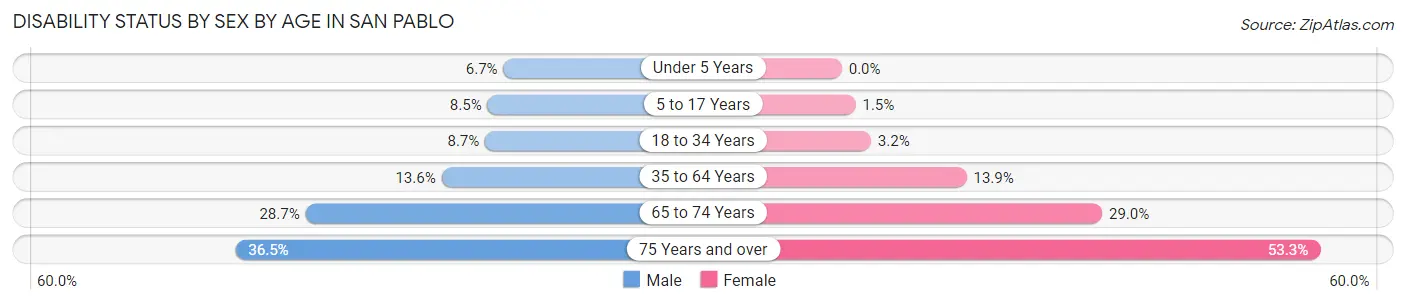
| Age Bracket | Male | Female |
| Under 5 Years | 58 (6.7%) | 0 (0.0%) |
| 5 to 17 Years | 328 (8.5%) | 48 (1.5%) |
| 18 to 34 Years | 372 (8.7%) | 121 (3.2%) |
| 35 to 64 Years | 782 (13.6%) | 843 (13.9%) |
| 65 to 74 Years | 224 (28.7%) | 311 (29.0%) |
| 75 Years and over | 149 (36.5%) | 401 (53.2%) |
Disability Class by Sex by Age in San Pablo
Disability Class: Hearing Difficulty
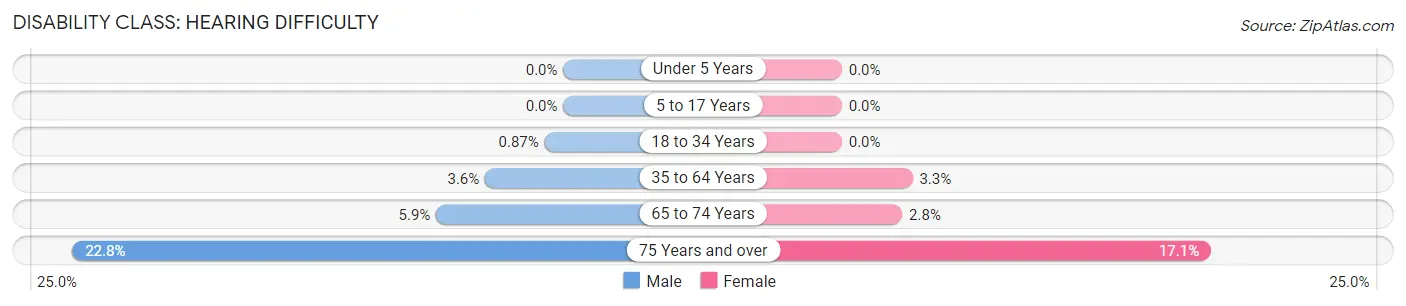
| Age Bracket | Male | Female |
| Under 5 Years | 0 (0.0%) | 0 (0.0%) |
| 5 to 17 Years | 0 (0.0%) | 0 (0.0%) |
| 18 to 34 Years | 37 (0.9%) | 0 (0.0%) |
| 35 to 64 Years | 209 (3.6%) | 199 (3.3%) |
| 65 to 74 Years | 46 (5.9%) | 30 (2.8%) |
| 75 Years and over | 93 (22.8%) | 129 (17.1%) |
Disability Class: Vision Difficulty
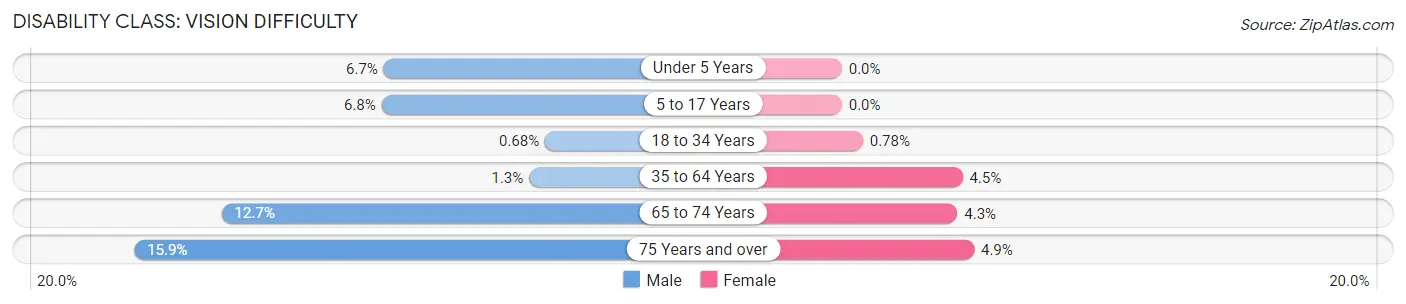
| Age Bracket | Male | Female |
| Under 5 Years | 58 (6.7%) | 0 (0.0%) |
| 5 to 17 Years | 262 (6.8%) | 0 (0.0%) |
| 18 to 34 Years | 29 (0.7%) | 29 (0.8%) |
| 35 to 64 Years | 73 (1.3%) | 272 (4.5%) |
| 65 to 74 Years | 99 (12.7%) | 46 (4.3%) |
| 75 Years and over | 65 (15.9%) | 37 (4.9%) |
Disability Class: Cognitive Difficulty
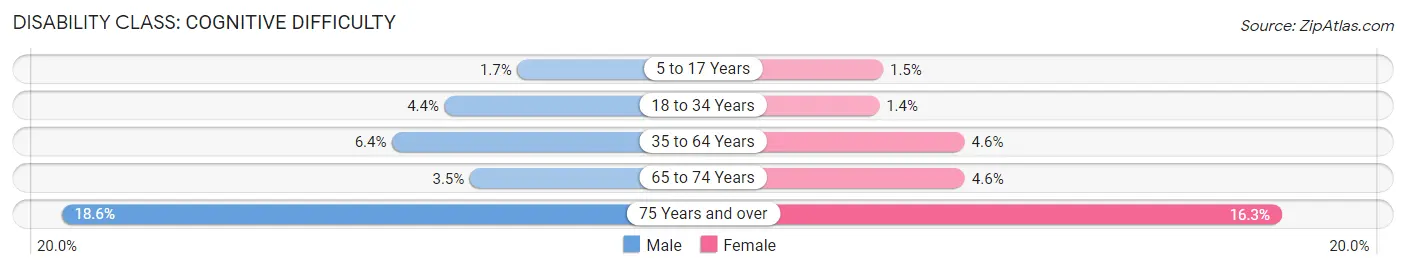
| Age Bracket | Male | Female |
| 5 to 17 Years | 66 (1.7%) | 48 (1.5%) |
| 18 to 34 Years | 188 (4.4%) | 52 (1.4%) |
| 35 to 64 Years | 366 (6.4%) | 277 (4.6%) |
| 65 to 74 Years | 27 (3.5%) | 49 (4.6%) |
| 75 Years and over | 76 (18.6%) | 123 (16.3%) |
Disability Class: Ambulatory Difficulty
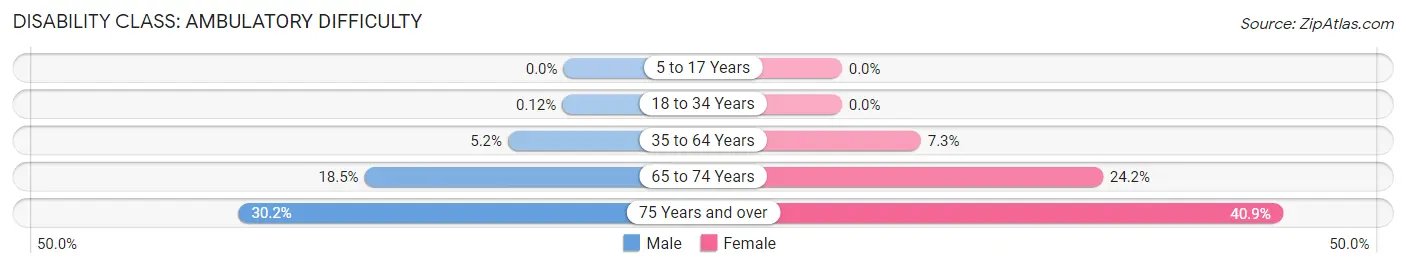
| Age Bracket | Male | Female |
| 5 to 17 Years | 0 (0.0%) | 0 (0.0%) |
| 18 to 34 Years | 5 (0.1%) | 0 (0.0%) |
| 35 to 64 Years | 297 (5.1%) | 445 (7.3%) |
| 65 to 74 Years | 144 (18.5%) | 260 (24.2%) |
| 75 Years and over | 123 (30.1%) | 308 (40.9%) |
Disability Class: Self-Care Difficulty
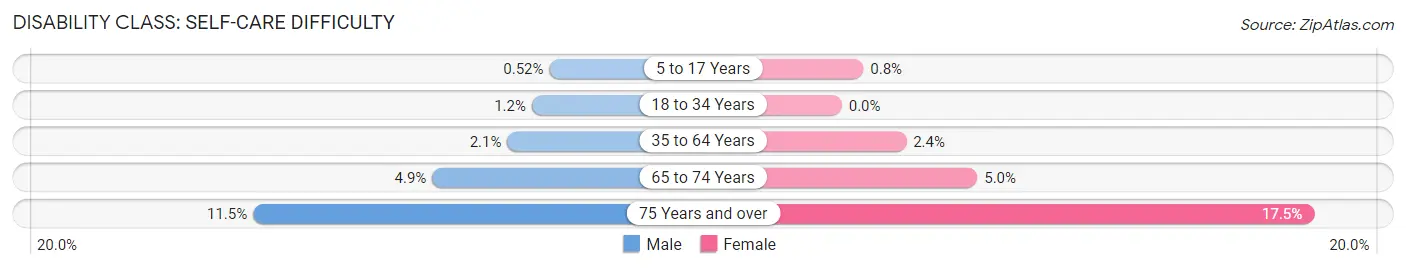
| Age Bracket | Male | Female |
| 5 to 17 Years | 20 (0.5%) | 25 (0.8%) |
| 18 to 34 Years | 50 (1.2%) | 0 (0.0%) |
| 35 to 64 Years | 120 (2.1%) | 145 (2.4%) |
| 65 to 74 Years | 38 (4.9%) | 54 (5.0%) |
| 75 Years and over | 47 (11.5%) | 132 (17.5%) |
Technology Access in San Pablo
Computing Device Access in San Pablo
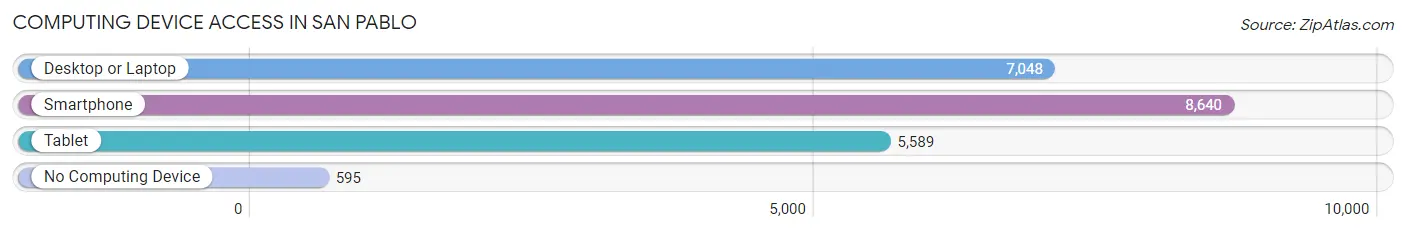
| Device Type | # Households | % Households |
| Desktop or Laptop | 7,048 | 72.4% |
| Smartphone | 8,640 | 88.7% |
| Tablet | 5,589 | 57.4% |
| No Computing Device | 595 | 6.1% |
| Total | 9,737 | 100.0% |
Internet Access in San Pablo
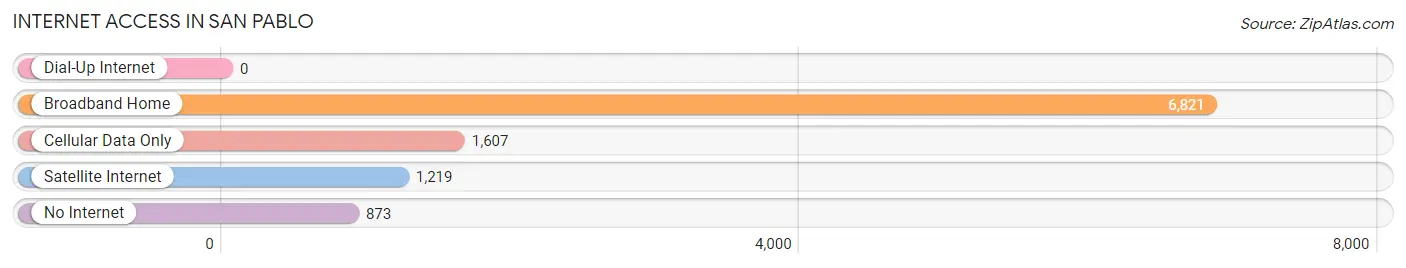
| Internet Type | # Households | % Households |
| Dial-Up Internet | 0 | 0.0% |
| Broadband Home | 6,821 | 70.1% |
| Cellular Data Only | 1,607 | 16.5% |
| Satellite Internet | 1,219 | 12.5% |
| No Internet | 873 | 9.0% |
| Total | 9,737 | 100.0% |
San Pablo Summary
Pablo, California is a small city located in Contra Costa County, California. It is situated in the San Francisco Bay Area, just east of Oakland and north of Berkeley. The city has a population of approximately 30,000 people and is known for its diverse population, vibrant culture, and strong economy.
History
San Pablo was originally inhabited by the Ohlone people, who were the first inhabitants of the area. The Ohlone people lived in the area for thousands of years before the arrival of the Spanish in the late 1700s. The Spanish established a mission in the area in 1797, which was later abandoned in 1834.
In the mid-1800s, the area was settled by Mexican ranchers and farmers. The area was then annexed by the United States in 1848, and the city of San Pablo was officially incorporated in 1948.
Geography
San Pablo is located in the San Francisco Bay Area, just east of Oakland and north of Berkeley. The city is situated on the eastern edge of the San Francisco Bay, and is bordered by the cities of Richmond, El Sobrante, Pinole, and Hercules. The city covers an area of 4.2 square miles, and has a population density of 7,092 people per square mile.
The city is located in a temperate climate zone, with mild winters and warm summers. The average temperature in the summer is around 70 degrees Fahrenheit, and the average temperature in the winter is around 50 degrees Fahrenheit.
Economy
San Pablo has a strong and diverse economy. The city is home to a variety of businesses, including retail stores, restaurants, and manufacturing companies. The city is also home to a number of medical facilities, including the Kaiser Permanente Medical Center and the San Pablo Medical Center.
The city is also home to a number of educational institutions, including Contra Costa College, the University of California, Berkeley, and the University of California, San Francisco.
Demographics
As of the 2010 census, the population of San Pablo was 29,139. The racial makeup of the city was 44.3% White, 24.3% African American, 0.7% Native American, 16.2% Asian, 0.3% Pacific Islander, 11.2% from other races, and 3.2% from two or more races. Hispanic or Latino of any race were 24.3% of the population.
The median income for a household in the city was $45,837, and the median income for a family was $51,919. The per capita income for the city was $20,945. About 16.2% of families and 19.3% of the population were below the poverty line, including 28.2% of those under age 18 and 8.2% of those age 65 or over.
San Pablo is a diverse city with a strong economy and vibrant culture. The city is home to a variety of businesses, educational institutions, and medical facilities, and has a population of approximately 30,000 people. The city is located in the San Francisco Bay Area, and is bordered by the cities of Richmond, El Sobrante, Pinole, and Hercules. The city has a temperate climate, with mild winters and warm summers. The population of San Pablo is diverse, with a variety of racial and ethnic backgrounds. The median income for a household in the city is $45,837, and the median income for a family is $51,919.
Common Questions
What is Per Capita Income in San Pablo?
Per Capita income in San Pablo is $27,043.
What is the Median Family Income in San Pablo?
Median Family Income in San Pablo is $77,813.
What is the Median Household income in San Pablo?
Median Household Income in San Pablo is $72,552.
What is Income or Wage Gap in San Pablo?
Income or Wage Gap in San Pablo is 20.7%.
Women in San Pablo earn 79.3 cents for every dollar earned by a man.
What is Family Income Deficit in San Pablo?
Family Income Deficit in San Pablo is $10,523.
Families that are below poverty line in San Pablo earn $10,523 less on average than the poverty threshold level.
What is Inequality or Gini Index in San Pablo?
Inequality or Gini Index in San Pablo is 0.39.
What is the Total Population of San Pablo?
Total Population of San Pablo is 31,907.
What is the Total Male Population of San Pablo?
Total Male Population of San Pablo is 16,160.
What is the Total Female Population of San Pablo?
Total Female Population of San Pablo is 15,747.
What is the Ratio of Males per 100 Females in San Pablo?
There are 102.62 Males per 100 Females in San Pablo.
What is the Ratio of Females per 100 Males in San Pablo?
There are 97.44 Females per 100 Males in San Pablo.
What is the Median Population Age in San Pablo?
Median Population Age in San Pablo is 33.2 Years.
What is the Average Family Size in San Pablo
Average Family Size in San Pablo is 3.7 People.
What is the Average Household Size in San Pablo
Average Household Size in San Pablo is 3.2 People.
How Large is the Labor Force in San Pablo?
There are 15,779 People in the Labor Forcein in San Pablo.
What is the Percentage of People in the Labor Force in San Pablo?
65.1% of People are in the Labor Force in San Pablo.
What is the Unemployment Rate in San Pablo?
Unemployment Rate in San Pablo is 7.9%.