Novato, CA Map & Demographics
Novato Map
Novato Overview
$62,407
PER CAPITA INCOME
$143,567
AVG FAMILY INCOME
$110,948
AVG HOUSEHOLD INCOME
29.0%
WAGE / INCOME GAP [ % ]
71.0¢/ $1
WAGE / INCOME GAP [ $ ]
0.46
INEQUALITY / GINI INDEX
53,055
TOTAL POPULATION
26,829
MALE POPULATION
26,226
FEMALE POPULATION
102.30
MALES / 100 FEMALES
97.75
FEMALES / 100 MALES
48.6
MEDIAN AGE
3.0
AVG FAMILY SIZE
2.5
AVG HOUSEHOLD SIZE
27,087
LABOR FORCE [ PEOPLE ]
61.3%
PERCENT IN LABOR FORCE
6.5%
UNEMPLOYMENT RATE
Novato Area Codes
Income in Novato
Income Overview in Novato
Per Capita Income in Novato is $62,407, while median incomes of families and households are $143,567 and $110,948 respectively.
| Characteristic | Number | Measure |
| Per Capita Income | 53,055 | $62,407 |
| Median Family Income | 14,087 | $143,567 |
| Mean Family Income | 14,087 | $180,128 |
| Median Household Income | 20,898 | $110,948 |
| Mean Household Income | 20,898 | $154,313 |
| Income Deficit | 14,087 | $0 |
| Wage / Income Gap (%) | 53,055 | 28.98% |
| Wage / Income Gap ($) | 53,055 | 71.02¢ per $1 |
| Gini / Inequality Index | 53,055 | 0.46 |
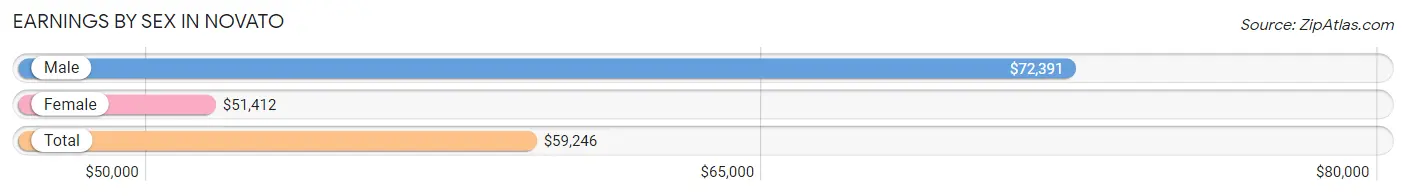
Earnings by Sex in Novato
Average Earnings in Novato are $59,246, $72,391 for men and $51,412 for women, a difference of 29.0%.
| Sex | Number | Average Earnings |
| Male | 14,744 (53.1%) | $72,391 |
| Female | 12,997 (46.9%) | $51,412 |
| Total | 27,741 (100.0%) | $59,246 |
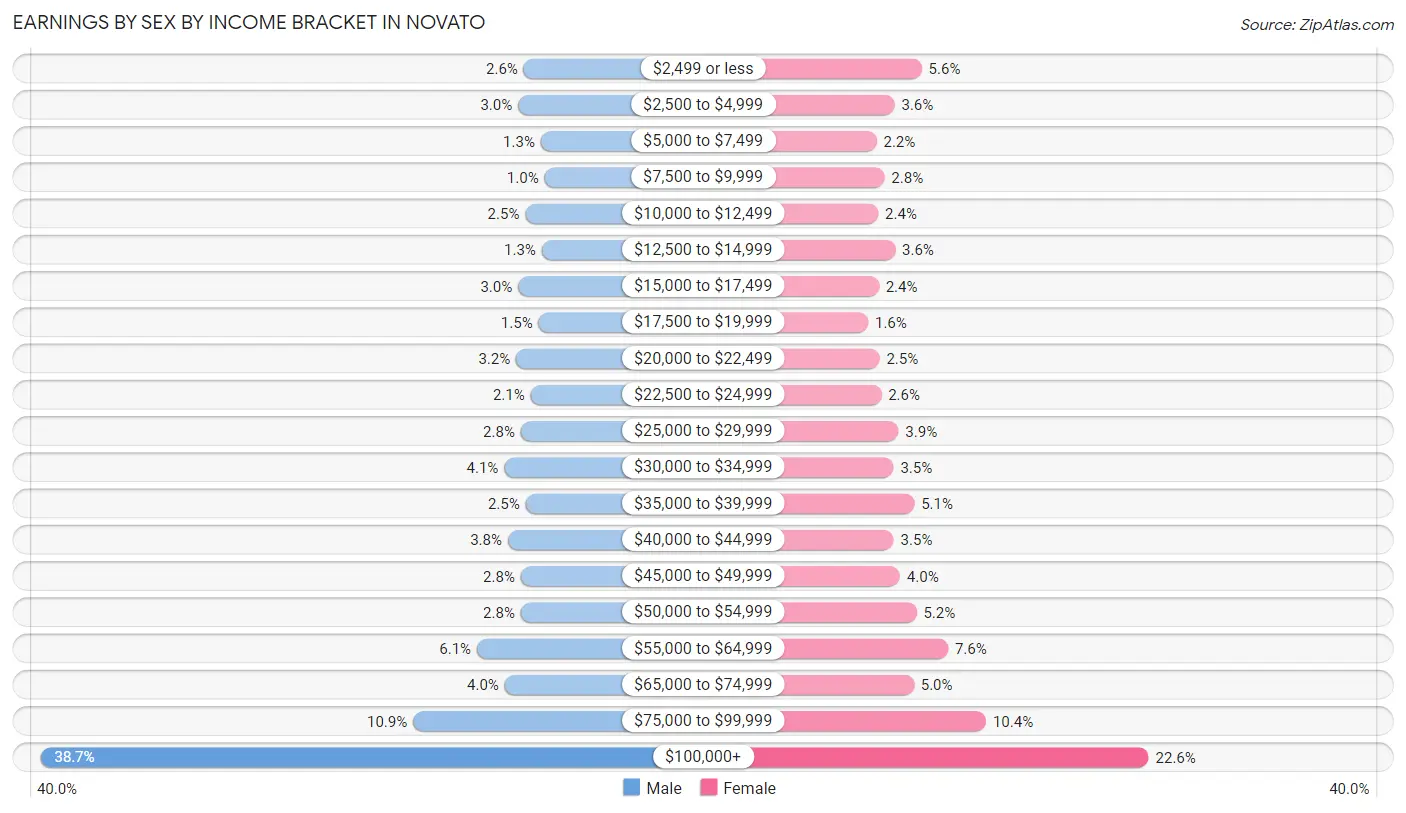
Earnings by Sex by Income Bracket in Novato
The most common earnings brackets in Novato are $100,000+ for men (5,712 | 38.7%) and $100,000+ for women (2,940 | 22.6%).
| Income | Male | Female |
| $2,499 or less | 383 (2.6%) | 729 (5.6%) |
| $2,500 to $4,999 | 446 (3.0%) | 465 (3.6%) |
| $5,000 to $7,499 | 194 (1.3%) | 290 (2.2%) |
| $7,500 to $9,999 | 153 (1.0%) | 367 (2.8%) |
| $10,000 to $12,499 | 366 (2.5%) | 306 (2.4%) |
| $12,500 to $14,999 | 185 (1.3%) | 470 (3.6%) |
| $15,000 to $17,499 | 446 (3.0%) | 311 (2.4%) |
| $17,500 to $19,999 | 220 (1.5%) | 207 (1.6%) |
| $20,000 to $22,499 | 468 (3.2%) | 318 (2.5%) |
| $22,500 to $24,999 | 306 (2.1%) | 335 (2.6%) |
| $25,000 to $29,999 | 416 (2.8%) | 503 (3.9%) |
| $30,000 to $34,999 | 598 (4.1%) | 455 (3.5%) |
| $35,000 to $39,999 | 363 (2.5%) | 656 (5.1%) |
| $40,000 to $44,999 | 559 (3.8%) | 456 (3.5%) |
| $45,000 to $49,999 | 416 (2.8%) | 517 (4.0%) |
| $50,000 to $54,999 | 416 (2.8%) | 679 (5.2%) |
| $55,000 to $64,999 | 899 (6.1%) | 985 (7.6%) |
| $65,000 to $74,999 | 593 (4.0%) | 652 (5.0%) |
| $75,000 to $99,999 | 1,605 (10.9%) | 1,356 (10.4%) |
| $100,000+ | 5,712 (38.7%) | 2,940 (22.6%) |
| Total | 14,744 (100.0%) | 12,997 (100.0%) |
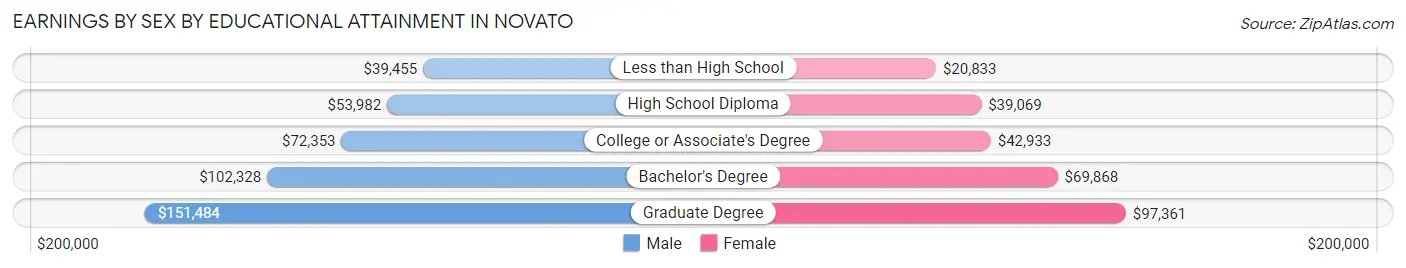
Earnings by Sex by Educational Attainment in Novato
Average earnings in Novato are $81,685 for men and $55,832 for women, a difference of 31.7%. Men with an educational attainment of graduate degree enjoy the highest average annual earnings of $151,484, while those with less than high school education earn the least with $39,455. Women with an educational attainment of graduate degree earn the most with the average annual earnings of $97,361, while those with less than high school education have the smallest earnings of $20,833.
| Educational Attainment | Male Income | Female Income |
| Less than High School | $39,455 | $20,833 |
| High School Diploma | $53,982 | $39,069 |
| College or Associate's Degree | $72,353 | $42,933 |
| Bachelor's Degree | $102,328 | $69,868 |
| Graduate Degree | $151,484 | $97,361 |
| Total | $81,685 | $55,832 |
Family Income in Novato
Family Income Brackets in Novato
According to the Novato family income data, there are 4,677 families falling into the $200,000+ income range, which is the most common income bracket and makes up 33.2% of all families. Conversely, the $10,000 to $14,999 income bracket is the least frequent group with only 141 families (1.0%) belonging to this category.
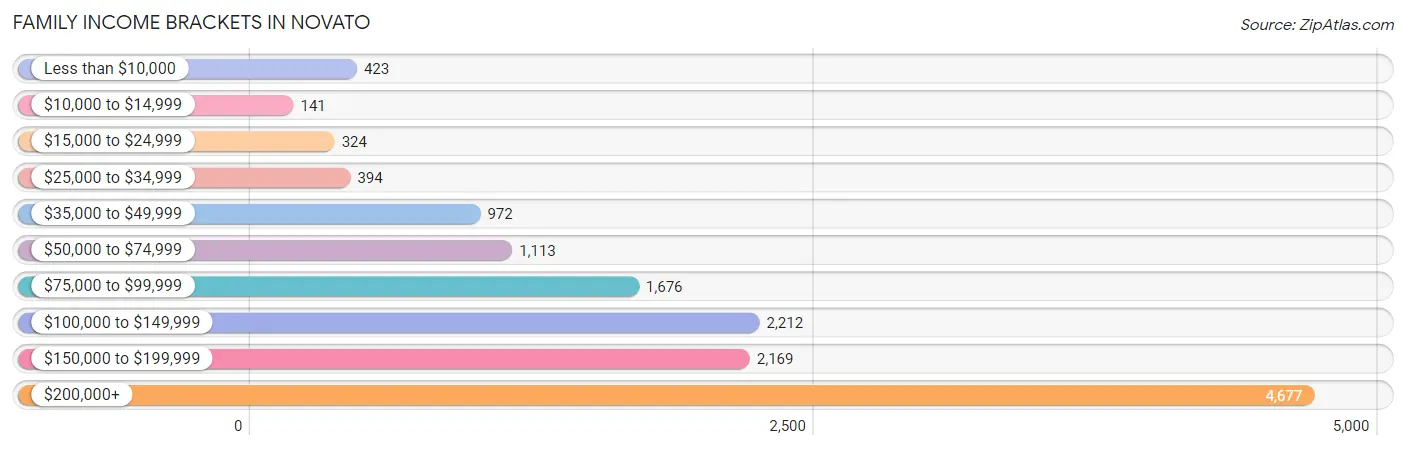
| Income Bracket | # Families | % Families |
| Less than $10,000 | 423 | 3.0% |
| $10,000 to $14,999 | 141 | 1.0% |
| $15,000 to $24,999 | 324 | 2.3% |
| $25,000 to $34,999 | 394 | 2.8% |
| $35,000 to $49,999 | 972 | 6.9% |
| $50,000 to $74,999 | 1,113 | 7.9% |
| $75,000 to $99,999 | 1,676 | 11.9% |
| $100,000 to $149,999 | 2,212 | 15.7% |
| $150,000 to $199,999 | 2,169 | 15.4% |
| $200,000+ | 4,677 | 33.2% |
Family Income by Famaliy Size in Novato
4-person families (2,486 | 17.6%) account for the highest median family income in Novato with $187,000 per family, while 2-person families (7,258 | 51.5%) have the highest median income of $63,750 per family member.
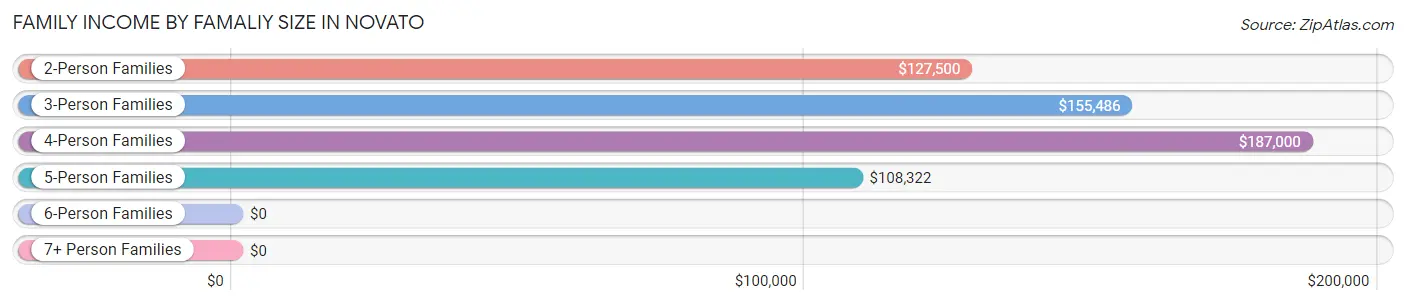
| Income Bracket | # Families | Median Income |
| 2-Person Families | 7,258 (51.5%) | $127,500 |
| 3-Person Families | 3,068 (21.8%) | $155,486 |
| 4-Person Families | 2,486 (17.6%) | $187,000 |
| 5-Person Families | 829 (5.9%) | $108,322 |
| 6-Person Families | 372 (2.6%) | $0 |
| 7+ Person Families | 74 (0.5%) | $0 |
| Total | 14,087 (100.0%) | $143,567 |
Family Income by Number of Earners in Novato
The median family income in Novato is $143,567, with families comprising 3+ earners (1,419) having the highest median family income of $233,924, while families with no earners (2,305) have the lowest median family income of $81,853, accounting for 10.1% and 16.4% of families, respectively.
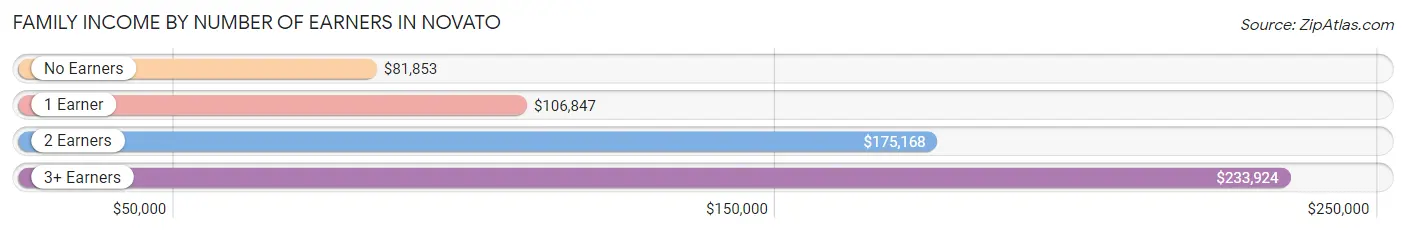
| Number of Earners | # Families | Median Income |
| No Earners | 2,305 (16.4%) | $81,853 |
| 1 Earner | 4,132 (29.3%) | $106,847 |
| 2 Earners | 6,231 (44.2%) | $175,168 |
| 3+ Earners | 1,419 (10.1%) | $233,924 |
| Total | 14,087 (100.0%) | $143,567 |
Household Income in Novato
Household Income Brackets in Novato
With 5,496 households falling in the category, the $200,000+ income range is the most frequent in Novato, accounting for 26.3% of all households. In contrast, only 439 households (2.1%) fall into the $10,000 to $14,999 income bracket, making it the least populous group.
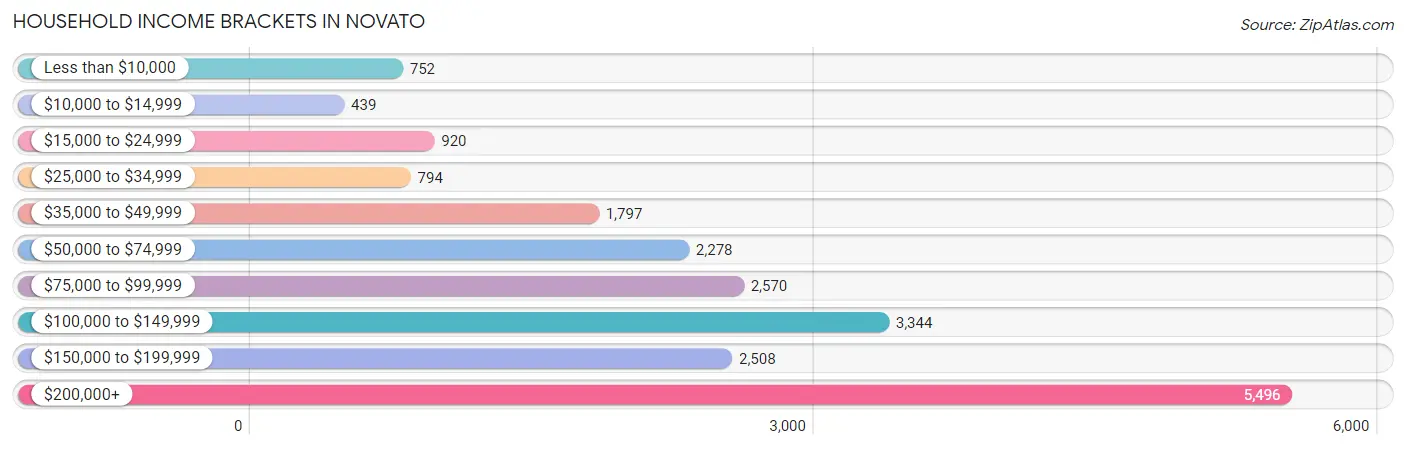
| Income Bracket | # Households | % Households |
| Less than $10,000 | 752 | 3.6% |
| $10,000 to $14,999 | 439 | 2.1% |
| $15,000 to $24,999 | 920 | 4.4% |
| $25,000 to $34,999 | 794 | 3.8% |
| $35,000 to $49,999 | 1,797 | 8.6% |
| $50,000 to $74,999 | 2,278 | 10.9% |
| $75,000 to $99,999 | 2,570 | 12.3% |
| $100,000 to $149,999 | 3,344 | 16.0% |
| $150,000 to $199,999 | 2,508 | 12.0% |
| $200,000+ | 5,496 | 26.3% |
Household Income by Householder Age in Novato
The median household income in Novato is $110,948, with the highest median household income of $133,765 found in the 45 to 64 years age bracket for the primary householder. A total of 8,611 households (41.2%) fall into this category. Meanwhile, the 15 to 24 years age bracket for the primary householder has the lowest median household income of $60,917, with 168 households (0.8%) in this group.
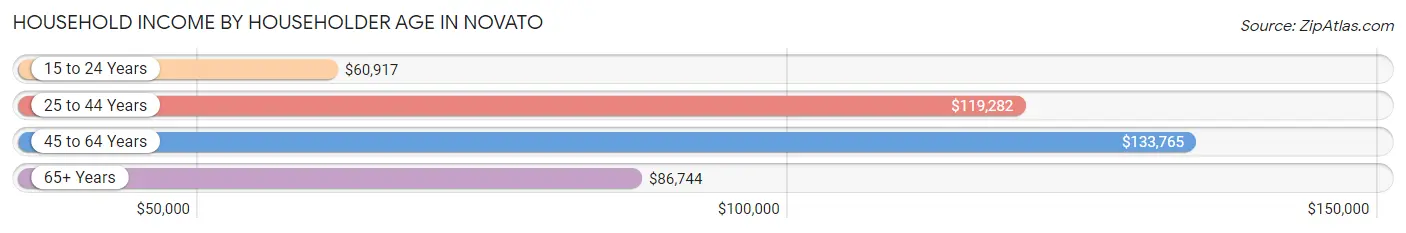
| Income Bracket | # Households | Median Income |
| 15 to 24 Years | 168 (0.8%) | $60,917 |
| 25 to 44 Years | 4,179 (20.0%) | $119,282 |
| 45 to 64 Years | 8,611 (41.2%) | $133,765 |
| 65+ Years | 7,940 (38.0%) | $86,744 |
| Total | 20,898 (100.0%) | $110,948 |
Poverty in Novato
Income Below Poverty by Sex and Age in Novato
With 9.8% poverty level for males and 7.7% for females among the residents of Novato, 5 year old males and 5 year old females are the most vulnerable to poverty, with 181 males (49.4%) and 94 females (37.4%) in their respective age groups living below the poverty level.
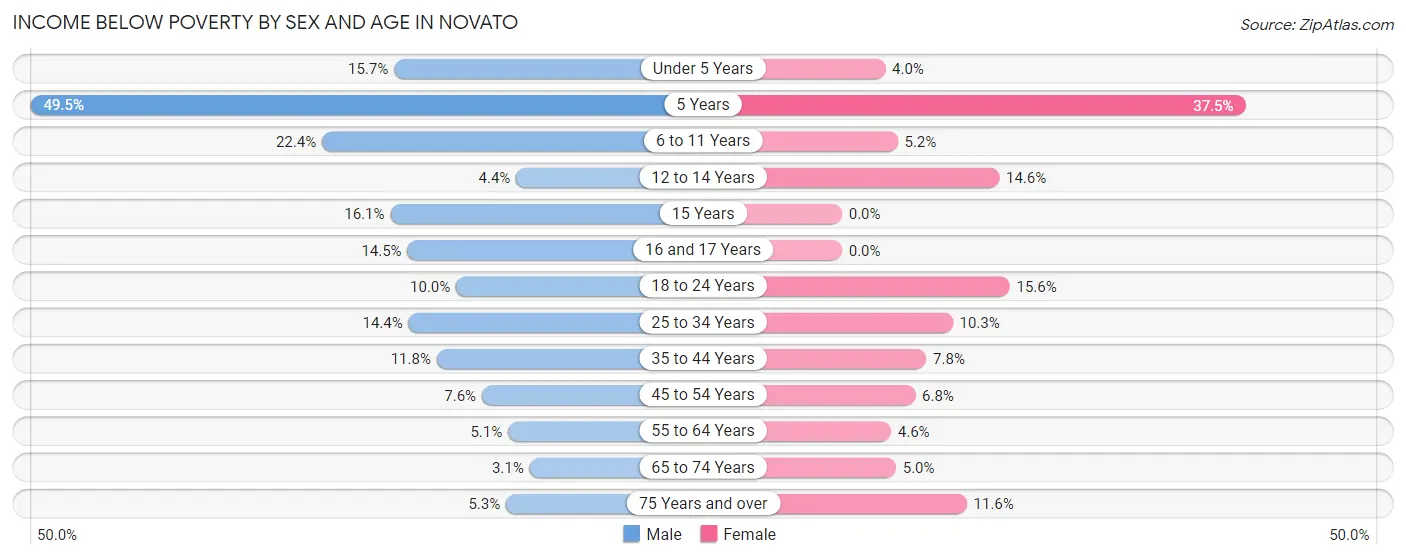
| Age Bracket | Male | Female |
| Under 5 Years | 189 (15.7%) | 49 (4.0%) |
| 5 Years | 181 (49.4%) | 94 (37.4%) |
| 6 to 11 Years | 401 (22.4%) | 80 (5.2%) |
| 12 to 14 Years | 41 (4.4%) | 136 (14.6%) |
| 15 Years | 62 (16.1%) | 0 (0.0%) |
| 16 and 17 Years | 125 (14.5%) | 0 (0.0%) |
| 18 to 24 Years | 156 (10.0%) | 272 (15.6%) |
| 25 to 34 Years | 323 (14.4%) | 216 (10.3%) |
| 35 to 44 Years | 350 (11.7%) | 232 (7.8%) |
| 45 to 54 Years | 329 (7.6%) | 223 (6.8%) |
| 55 to 64 Years | 208 (5.1%) | 182 (4.5%) |
| 65 to 74 Years | 109 (3.1%) | 224 (5.0%) |
| 75 Years and over | 134 (5.3%) | 311 (11.6%) |
| Total | 2,608 (9.8%) | 2,019 (7.7%) |
Income Above Poverty by Sex and Age in Novato
According to the poverty statistics in Novato, males aged 65 to 74 years and females aged 15 years are the age groups that are most secure financially, with 96.9% of males and 100.0% of females in these age groups living above the poverty line.
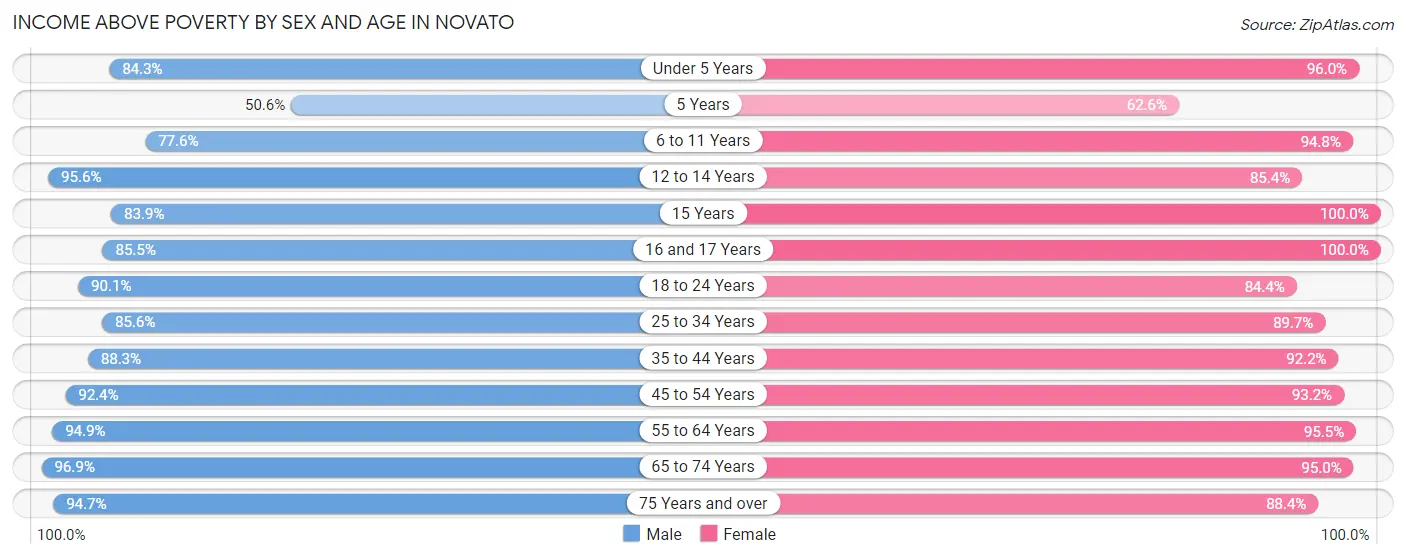
| Age Bracket | Male | Female |
| Under 5 Years | 1,014 (84.3%) | 1,170 (96.0%) |
| 5 Years | 185 (50.5%) | 157 (62.5%) |
| 6 to 11 Years | 1,389 (77.6%) | 1,467 (94.8%) |
| 12 to 14 Years | 895 (95.6%) | 796 (85.4%) |
| 15 Years | 324 (83.9%) | 207 (100.0%) |
| 16 and 17 Years | 739 (85.5%) | 736 (100.0%) |
| 18 to 24 Years | 1,412 (90.0%) | 1,475 (84.4%) |
| 25 to 34 Years | 1,925 (85.6%) | 1,886 (89.7%) |
| 35 to 44 Years | 2,628 (88.2%) | 2,732 (92.2%) |
| 45 to 54 Years | 4,025 (92.4%) | 3,055 (93.2%) |
| 55 to 64 Years | 3,846 (94.9%) | 3,816 (95.5%) |
| 65 to 74 Years | 3,361 (96.9%) | 4,250 (95.0%) |
| 75 Years and over | 2,387 (94.7%) | 2,375 (88.4%) |
| Total | 24,130 (90.2%) | 24,122 (92.3%) |
Income Below Poverty Among Married-Couple Families in Novato
The poverty statistics for married-couple families in Novato show that 2.8% or 330 of the total 11,651 families live below the poverty line. Families with 3 or 4 children have the highest poverty rate of 11.6%, comprising of 72 families. On the other hand, families with no children have the lowest poverty rate of 1.5%, which includes 107 families.
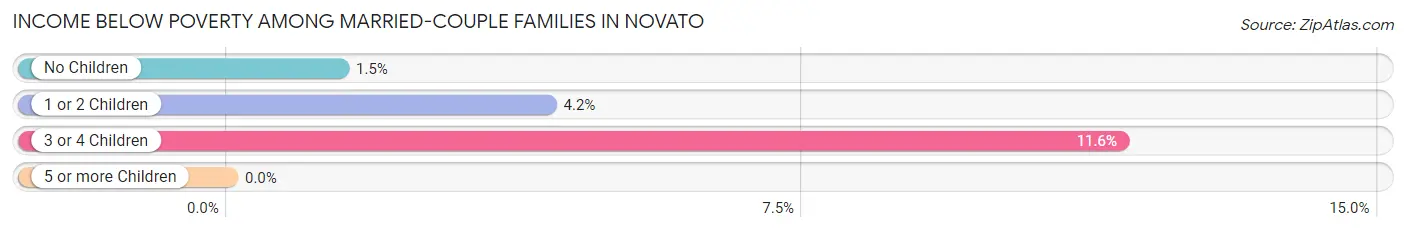
| Children | Above Poverty | Below Poverty |
| No Children | 7,294 (98.6%) | 107 (1.5%) |
| 1 or 2 Children | 3,480 (95.8%) | 151 (4.2%) |
| 3 or 4 Children | 547 (88.4%) | 72 (11.6%) |
| 5 or more Children | 0 (0.0%) | 0 (0.0%) |
| Total | 11,321 (97.2%) | 330 (2.8%) |
Income Below Poverty Among Single-Parent Households in Novato
According to the poverty data in Novato, 5.1% or 33 single-father households and 22.1% or 395 single-mother households are living below the poverty line. Among single-father households, those with 1 or 2 children have the highest poverty rate, with 21 households (7.6%) experiencing poverty. Likewise, among single-mother households, those with 3 or 4 children have the highest poverty rate, with 78 households (62.4%) falling below the poverty line.
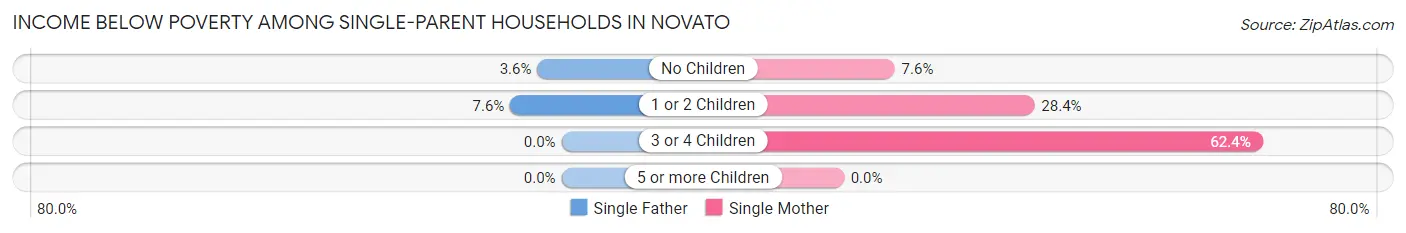
| Children | Single Father | Single Mother |
| No Children | 12 (3.6%) | 57 (7.6%) |
| 1 or 2 Children | 21 (7.6%) | 260 (28.4%) |
| 3 or 4 Children | 0 (0.0%) | 78 (62.4%) |
| 5 or more Children | 0 (0.0%) | 0 (0.0%) |
| Total | 33 (5.1%) | 395 (22.1%) |
Income Below Poverty Among Married-Couple vs Single-Parent Households in Novato
The poverty data for Novato shows that 330 of the married-couple family households (2.8%) and 428 of the single-parent households (17.6%) are living below the poverty level. Within the married-couple family households, those with 3 or 4 children have the highest poverty rate, with 72 households (11.6%) falling below the poverty line. Among the single-parent households, those with 3 or 4 children have the highest poverty rate, with 78 household (47.8%) living below poverty.
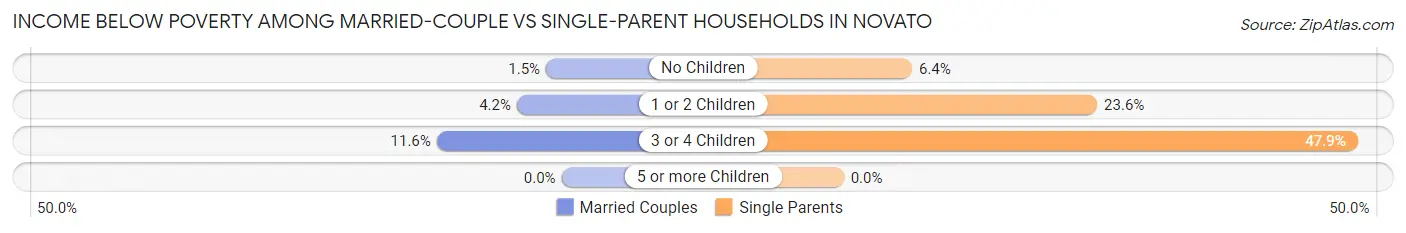
| Children | Married-Couple Families | Single-Parent Households |
| No Children | 107 (1.5%) | 69 (6.4%) |
| 1 or 2 Children | 151 (4.2%) | 281 (23.6%) |
| 3 or 4 Children | 72 (11.6%) | 78 (47.8%) |
| 5 or more Children | 0 (0.0%) | 0 (0.0%) |
| Total | 330 (2.8%) | 428 (17.6%) |
Race in Novato
The most populous races in Novato are White / Caucasian (36,126 | 68.1%), Hispanic or Latino (11,827 | 22.3%), and Two or more Races (5,794 | 10.9%).
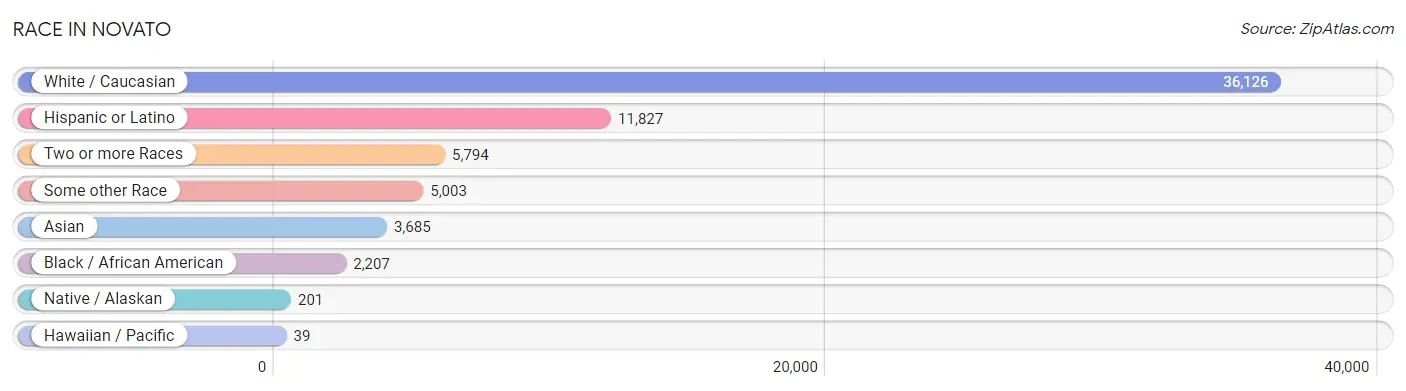
| Race | # Population | % Population |
| Asian | 3,685 | 7.0% |
| Black / African American | 2,207 | 4.2% |
| Hawaiian / Pacific | 39 | 0.1% |
| Hispanic or Latino | 11,827 | 22.3% |
| Native / Alaskan | 201 | 0.4% |
| White / Caucasian | 36,126 | 68.1% |
| Two or more Races | 5,794 | 10.9% |
| Some other Race | 5,003 | 9.4% |
| Total | 53,055 | 100.0% |
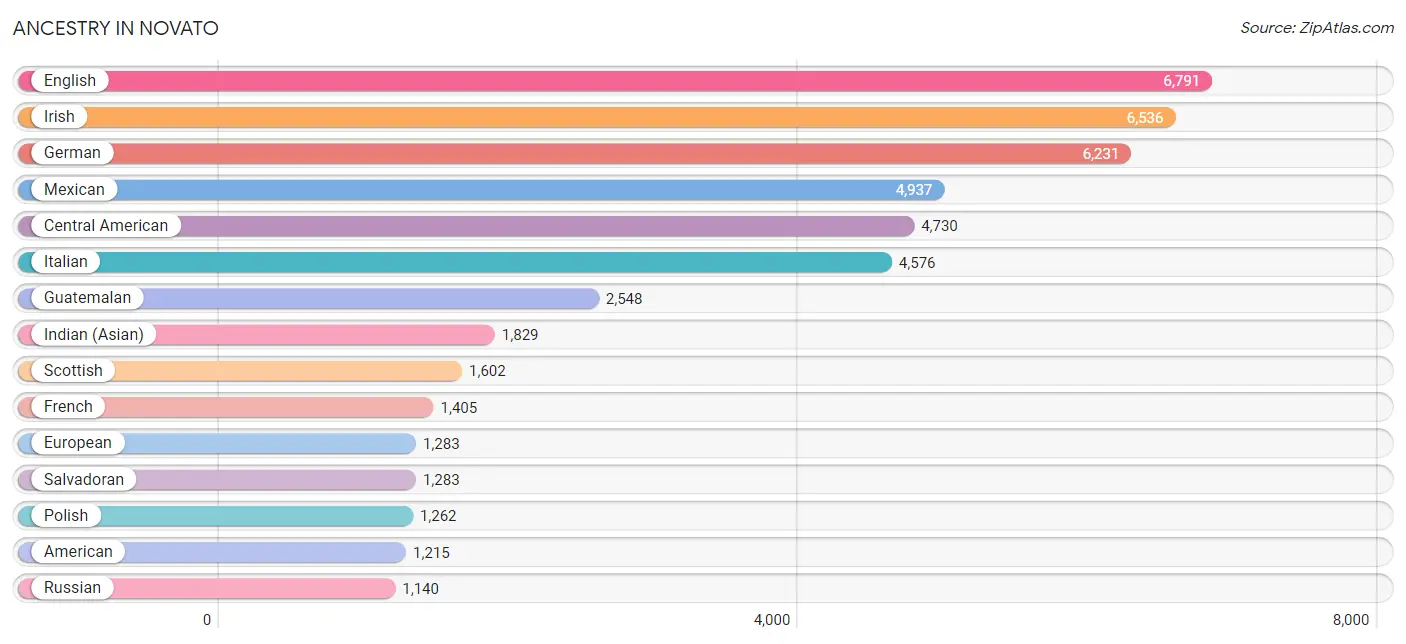
Ancestry in Novato
The most populous ancestries reported in Novato are English (6,791 | 12.8%), Irish (6,536 | 12.3%), German (6,231 | 11.7%), Mexican (4,937 | 9.3%), and Central American (4,730 | 8.9%), together accounting for 55.1% of all Novato residents.
| Ancestry | # Population | % Population |
| African | 71 | 0.1% |
| Alsatian | 17 | 0.0% |
| American | 1,215 | 2.3% |
| Apache | 164 | 0.3% |
| Arab | 581 | 1.1% |
| Argentinean | 74 | 0.1% |
| Armenian | 153 | 0.3% |
| Assyrian / Chaldean / Syriac | 23 | 0.0% |
| Australian | 53 | 0.1% |
| Austrian | 390 | 0.7% |
| Basque | 51 | 0.1% |
| Belgian | 120 | 0.2% |
| Bhutanese | 578 | 1.1% |
| Blackfeet | 118 | 0.2% |
| Brazilian | 376 | 0.7% |
| British | 564 | 1.1% |
| Bulgarian | 7 | 0.0% |
| Burmese | 243 | 0.5% |
| Canadian | 208 | 0.4% |
| Central American | 4,730 | 8.9% |
| Central American Indian | 33 | 0.1% |
| Cherokee | 247 | 0.5% |
| Chickasaw | 9 | 0.0% |
| Chilean | 94 | 0.2% |
| Chippewa | 117 | 0.2% |
| Colombian | 80 | 0.2% |
| Costa Rican | 4 | 0.0% |
| Cree | 6 | 0.0% |
| Croatian | 178 | 0.3% |
| Cuban | 8 | 0.0% |
| Czech | 244 | 0.5% |
| Czechoslovakian | 22 | 0.0% |
| Danish | 339 | 0.6% |
| Dominican | 170 | 0.3% |
| Dutch | 490 | 0.9% |
| Eastern European | 128 | 0.2% |
| English | 6,791 | 12.8% |
| Estonian | 45 | 0.1% |
| Ethiopian | 12 | 0.0% |
| European | 1,283 | 2.4% |
| Filipino | 66 | 0.1% |
| Finnish | 155 | 0.3% |
| French | 1,405 | 2.6% |
| French Canadian | 313 | 0.6% |
| German | 6,231 | 11.7% |
| Greek | 238 | 0.4% |
| Guamanian / Chamorro | 203 | 0.4% |
| Guatemalan | 2,548 | 4.8% |
| Haitian | 34 | 0.1% |
| Honduran | 78 | 0.2% |
| Hungarian | 202 | 0.4% |
| Icelander | 17 | 0.0% |
| Indian (Asian) | 1,829 | 3.5% |
| Iranian | 410 | 0.8% |
| Irish | 6,536 | 12.3% |
| Israeli | 11 | 0.0% |
| Italian | 4,576 | 8.6% |
| Jamaican | 3 | 0.0% |
| Japanese | 94 | 0.2% |
| Korean | 786 | 1.5% |
| Laotian | 25 | 0.1% |
| Lebanese | 360 | 0.7% |
| Lithuanian | 121 | 0.2% |
| Luxembourger | 19 | 0.0% |
| Macedonian | 9 | 0.0% |
| Malaysian | 29 | 0.1% |
| Maltese | 71 | 0.1% |
| Mexican | 4,937 | 9.3% |
| Mexican American Indian | 135 | 0.3% |
| Mongolian | 16 | 0.0% |
| Moroccan | 17 | 0.0% |
| Native Hawaiian | 292 | 0.5% |
| Nicaraguan | 787 | 1.5% |
| Nigerian | 683 | 1.3% |
| Northern European | 350 | 0.7% |
| Norwegian | 768 | 1.5% |
| Pakistani | 98 | 0.2% |
| Palestinian | 24 | 0.1% |
| Panamanian | 30 | 0.1% |
| Pennsylvania German | 14 | 0.0% |
| Peruvian | 756 | 1.4% |
| Polish | 1,262 | 2.4% |
| Portuguese | 848 | 1.6% |
| Potawatomi | 157 | 0.3% |
| Pueblo | 9 | 0.0% |
| Puerto Rican | 130 | 0.3% |
| Romanian | 82 | 0.2% |
| Russian | 1,140 | 2.1% |
| Salvadoran | 1,283 | 2.4% |
| Scandinavian | 227 | 0.4% |
| Scotch-Irish | 577 | 1.1% |
| Scottish | 1,602 | 3.0% |
| Serbian | 13 | 0.0% |
| Sioux | 9 | 0.0% |
| Slavic | 4 | 0.0% |
| Slovak | 58 | 0.1% |
| Slovene | 11 | 0.0% |
| South African | 22 | 0.0% |
| South American | 1,048 | 2.0% |
| South American Indian | 3 | 0.0% |
| Spaniard | 212 | 0.4% |
| Spanish | 130 | 0.3% |
| Sri Lankan | 779 | 1.5% |
| Subsaharan African | 788 | 1.5% |
| Swedish | 1,050 | 2.0% |
| Swiss | 336 | 0.6% |
| Syrian | 35 | 0.1% |
| Thai | 389 | 0.7% |
| Turkish | 63 | 0.1% |
| Ukrainian | 589 | 1.1% |
| Uruguayan | 15 | 0.0% |
| Venezuelan | 29 | 0.1% |
| Welsh | 206 | 0.4% |
| Yugoslavian | 47 | 0.1% | View All 114 Rows |
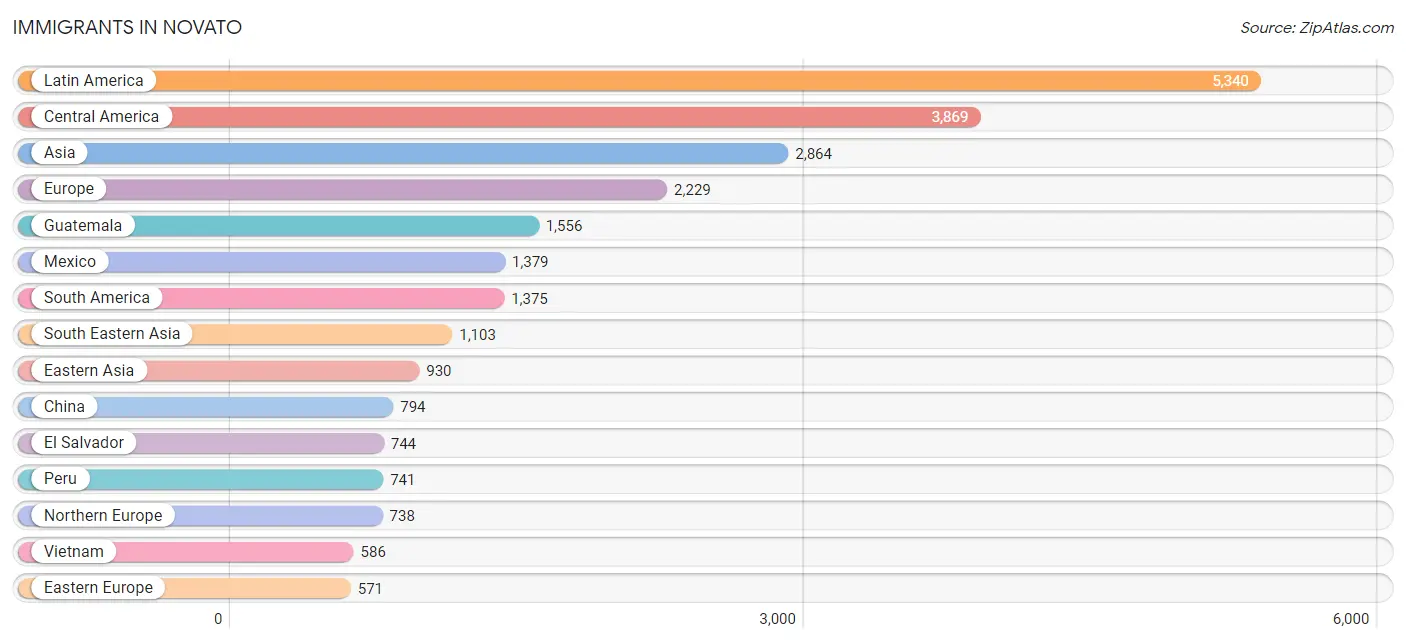
Immigrants in Novato
The most numerous immigrant groups reported in Novato came from Latin America (5,340 | 10.1%), Central America (3,869 | 7.3%), Asia (2,864 | 5.4%), Europe (2,229 | 4.2%), and Guatemala (1,556 | 2.9%), together accounting for 29.9% of all Novato residents.
| Immigration Origin | # Population | % Population |
| Africa | 220 | 0.4% |
| Argentina | 107 | 0.2% |
| Armenia | 16 | 0.0% |
| Asia | 2,864 | 5.4% |
| Australia | 21 | 0.0% |
| Azores | 201 | 0.4% |
| Belgium | 33 | 0.1% |
| Brazil | 423 | 0.8% |
| Bulgaria | 7 | 0.0% |
| Cambodia | 70 | 0.1% |
| Canada | 410 | 0.8% |
| Caribbean | 96 | 0.2% |
| Central America | 3,869 | 7.3% |
| Chile | 55 | 0.1% |
| China | 794 | 1.5% |
| Cuba | 8 | 0.0% |
| Czechoslovakia | 30 | 0.1% |
| Dominican Republic | 28 | 0.1% |
| Eastern Africa | 21 | 0.0% |
| Eastern Asia | 930 | 1.8% |
| Eastern Europe | 571 | 1.1% |
| El Salvador | 744 | 1.4% |
| England | 334 | 0.6% |
| Europe | 2,229 | 4.2% |
| Fiji | 59 | 0.1% |
| France | 183 | 0.3% |
| Germany | 188 | 0.4% |
| Guatemala | 1,556 | 2.9% |
| Haiti | 57 | 0.1% |
| Hong Kong | 54 | 0.1% |
| Hungary | 18 | 0.0% |
| India | 155 | 0.3% |
| Iran | 304 | 0.6% |
| Ireland | 142 | 0.3% |
| Italy | 110 | 0.2% |
| Jamaica | 3 | 0.0% |
| Japan | 98 | 0.2% |
| Korea | 38 | 0.1% |
| Latin America | 5,340 | 10.1% |
| Lebanon | 181 | 0.3% |
| Liberia | 46 | 0.1% |
| Malaysia | 36 | 0.1% |
| Mexico | 1,379 | 2.6% |
| Moldova | 10 | 0.0% |
| Netherlands | 35 | 0.1% |
| Nicaragua | 190 | 0.4% |
| Nigeria | 50 | 0.1% |
| Northern Africa | 72 | 0.1% |
| Northern Europe | 738 | 1.4% |
| Oceania | 161 | 0.3% |
| Pakistan | 102 | 0.2% |
| Peru | 741 | 1.4% |
| Philippines | 371 | 0.7% |
| Poland | 59 | 0.1% |
| Portugal | 201 | 0.4% |
| Romania | 17 | 0.0% |
| Russia | 140 | 0.3% |
| Scotland | 68 | 0.1% |
| Serbia | 13 | 0.0% |
| South Africa | 31 | 0.1% |
| South America | 1,375 | 2.6% |
| South Central Asia | 571 | 1.1% |
| South Eastern Asia | 1,103 | 2.1% |
| Southern Europe | 469 | 0.9% |
| Spain | 158 | 0.3% |
| Sweden | 6 | 0.0% |
| Switzerland | 12 | 0.0% |
| Taiwan | 32 | 0.1% |
| Thailand | 40 | 0.1% |
| Turkey | 10 | 0.0% |
| Ukraine | 223 | 0.4% |
| Uruguay | 33 | 0.1% |
| Uzbekistan | 10 | 0.0% |
| Venezuela | 16 | 0.0% |
| Vietnam | 586 | 1.1% |
| Western Africa | 96 | 0.2% |
| Western Asia | 260 | 0.5% |
| Western Europe | 451 | 0.9% | View All 78 Rows |
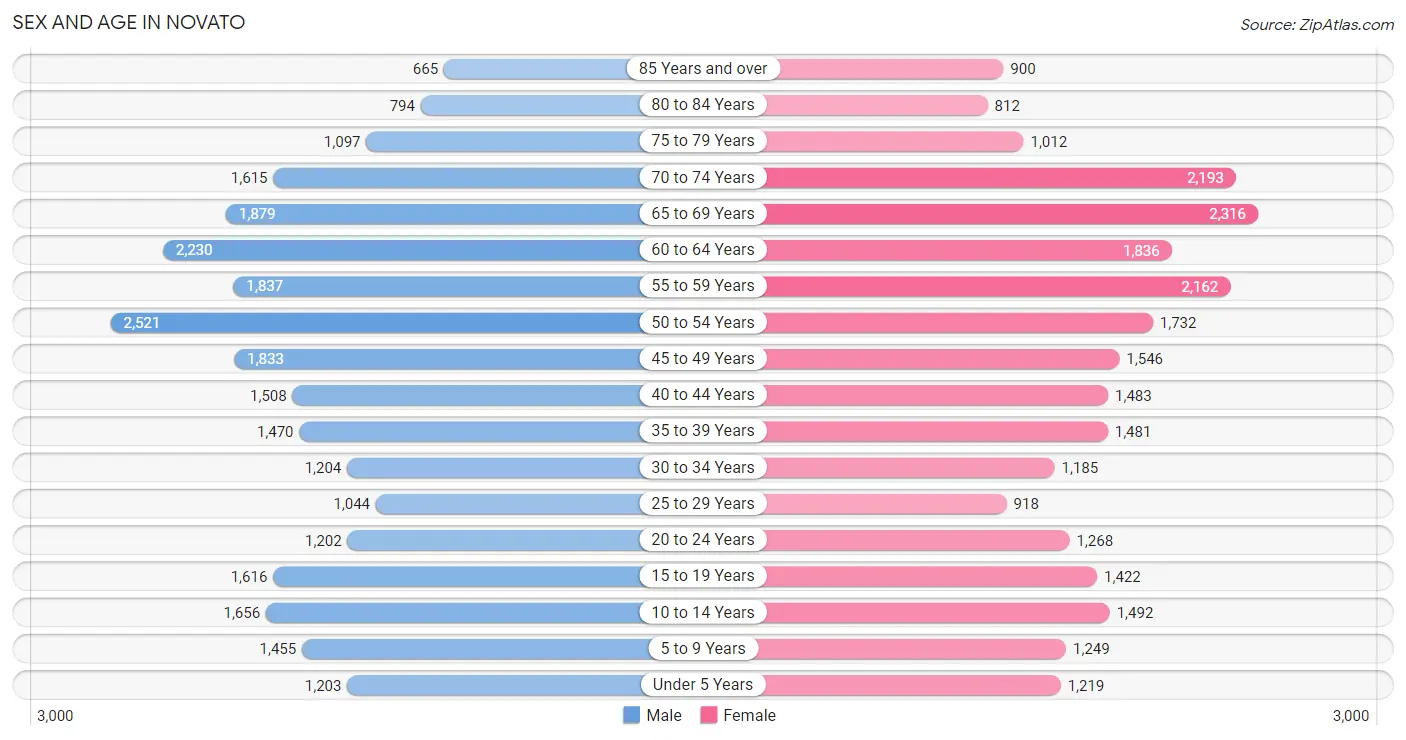
Sex and Age in Novato
Sex and Age in Novato
The most populous age groups in Novato are 50 to 54 Years (2,521 | 9.4%) for men and 65 to 69 Years (2,316 | 8.8%) for women.
| Age Bracket | Male | Female |
| Under 5 Years | 1,203 (4.5%) | 1,219 (4.6%) |
| 5 to 9 Years | 1,455 (5.4%) | 1,249 (4.8%) |
| 10 to 14 Years | 1,656 (6.2%) | 1,492 (5.7%) |
| 15 to 19 Years | 1,616 (6.0%) | 1,422 (5.4%) |
| 20 to 24 Years | 1,202 (4.5%) | 1,268 (4.8%) |
| 25 to 29 Years | 1,044 (3.9%) | 918 (3.5%) |
| 30 to 34 Years | 1,204 (4.5%) | 1,185 (4.5%) |
| 35 to 39 Years | 1,470 (5.5%) | 1,481 (5.7%) |
| 40 to 44 Years | 1,508 (5.6%) | 1,483 (5.7%) |
| 45 to 49 Years | 1,833 (6.8%) | 1,546 (5.9%) |
| 50 to 54 Years | 2,521 (9.4%) | 1,732 (6.6%) |
| 55 to 59 Years | 1,837 (6.9%) | 2,162 (8.2%) |
| 60 to 64 Years | 2,230 (8.3%) | 1,836 (7.0%) |
| 65 to 69 Years | 1,879 (7.0%) | 2,316 (8.8%) |
| 70 to 74 Years | 1,615 (6.0%) | 2,193 (8.4%) |
| 75 to 79 Years | 1,097 (4.1%) | 1,012 (3.9%) |
| 80 to 84 Years | 794 (3.0%) | 812 (3.1%) |
| 85 Years and over | 665 (2.5%) | 900 (3.4%) |
| Total | 26,829 (100.0%) | 26,226 (100.0%) |
Families and Households in Novato
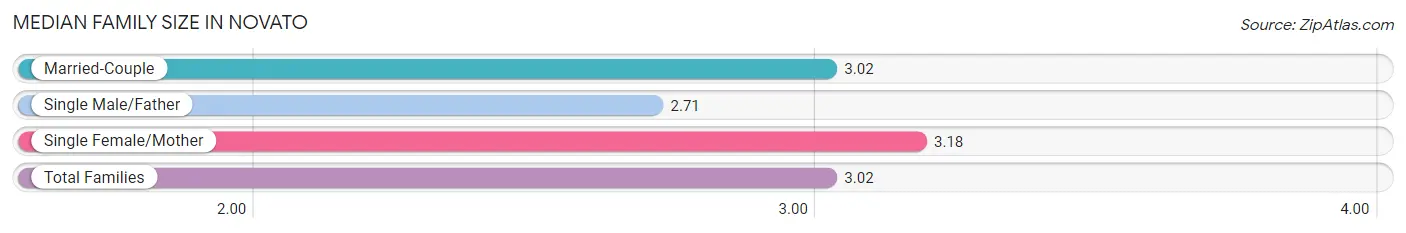
Median Family Size in Novato
The median family size in Novato is 3.02 persons per family, with single female/mother families (1,790 | 12.7%) accounting for the largest median family size of 3.18 persons per family. On the other hand, single male/father families (646 | 4.6%) represent the smallest median family size with 2.71 persons per family.
| Family Type | # Families | Family Size |
| Married-Couple | 11,651 (82.7%) | 3.02 |
| Single Male/Father | 646 (4.6%) | 2.71 |
| Single Female/Mother | 1,790 (12.7%) | 3.18 |
| Total Families | 14,087 (100.0%) | 3.02 |
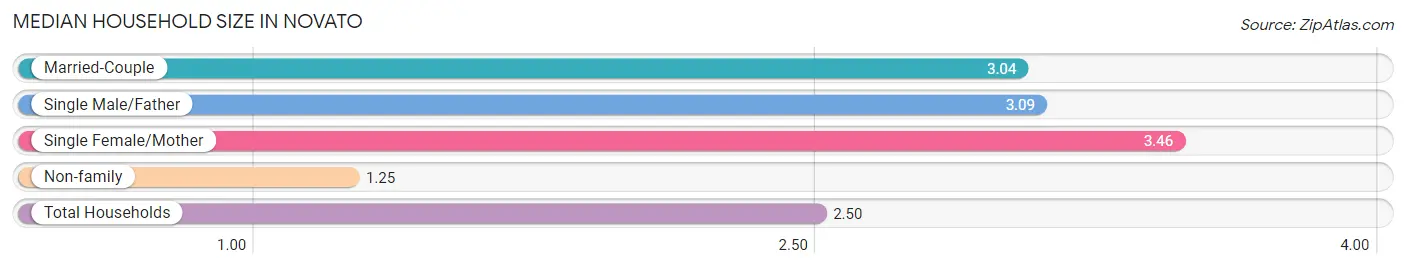
Median Household Size in Novato
The median household size in Novato is 2.50 persons per household, with single female/mother households (1,790 | 8.6%) accounting for the largest median household size of 3.46 persons per household. non-family households (6,811 | 32.6%) represent the smallest median household size with 1.25 persons per household.
| Household Type | # Households | Household Size |
| Married-Couple | 11,651 (55.7%) | 3.04 |
| Single Male/Father | 646 (3.1%) | 3.09 |
| Single Female/Mother | 1,790 (8.6%) | 3.46 |
| Non-family | 6,811 (32.6%) | 1.25 |
| Total Households | 20,898 (100.0%) | 2.50 |
Household Size by Marriage Status in Novato
Out of a total of 20,898 households in Novato, 14,087 (67.4%) are family households, while 6,811 (32.6%) are nonfamily households. The most numerous type of family households are 2-person households, comprising 6,841, and the most common type of nonfamily households are 1-person households, comprising 5,529.
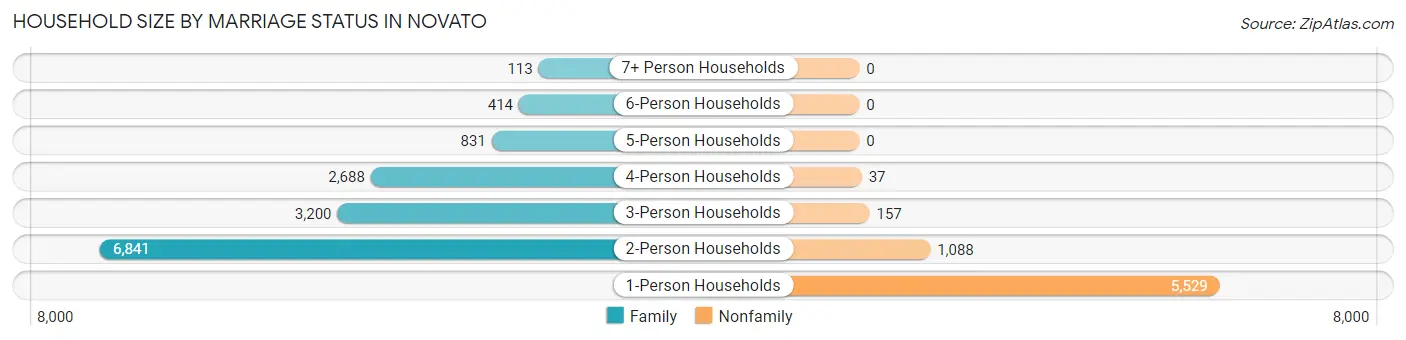
| Household Size | Family Households | Nonfamily Households |
| 1-Person Households | - | 5,529 (26.5%) |
| 2-Person Households | 6,841 (32.7%) | 1,088 (5.2%) |
| 3-Person Households | 3,200 (15.3%) | 157 (0.7%) |
| 4-Person Households | 2,688 (12.9%) | 37 (0.2%) |
| 5-Person Households | 831 (4.0%) | 0 (0.0%) |
| 6-Person Households | 414 (2.0%) | 0 (0.0%) |
| 7+ Person Households | 113 (0.5%) | 0 (0.0%) |
| Total | 14,087 (67.4%) | 6,811 (32.6%) |
Female Fertility in Novato
Fertility by Age in Novato
Average fertility rate in Novato is 53.0 births per 1,000 women. Women in the age bracket of 20 to 34 years have the highest fertility rate with 86.0 births per 1,000 women. Women in the age bracket of 20 to 34 years acount for 56.9% of all women with births.
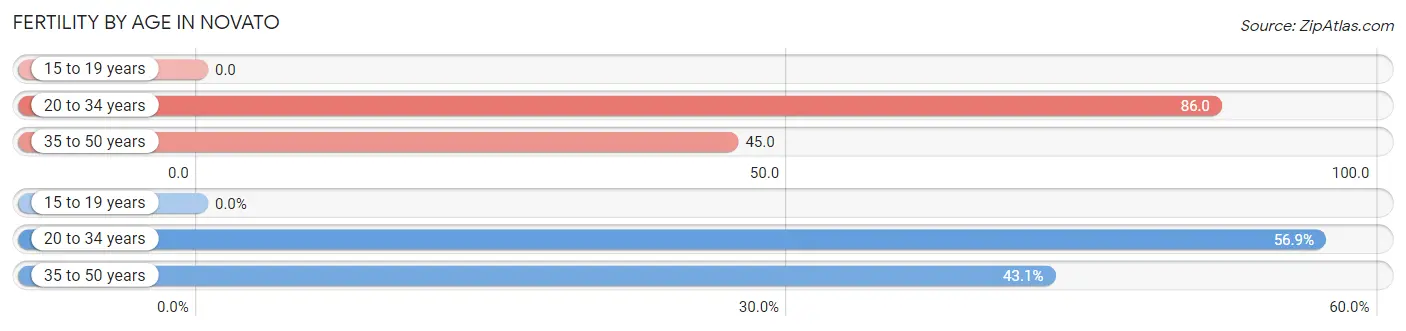
| Age Bracket | Women with Births | Births / 1,000 Women |
| 15 to 19 years | 0 (0.0%) | 0.0 |
| 20 to 34 years | 289 (56.9%) | 86.0 |
| 35 to 50 years | 219 (43.1%) | 45.0 |
| Total | 508 (100.0%) | 53.0 |
Fertility by Age by Marriage Status in Novato
99.2% of women with births (508) in Novato are married. The highest percentage of unmarried women with births falls into 20 to 34 years age bracket with 1.4% of them unmarried at the time of birth, while the lowest percentage of unmarried women with births belong to 35 to 50 years age bracket with 0.0% of them unmarried.
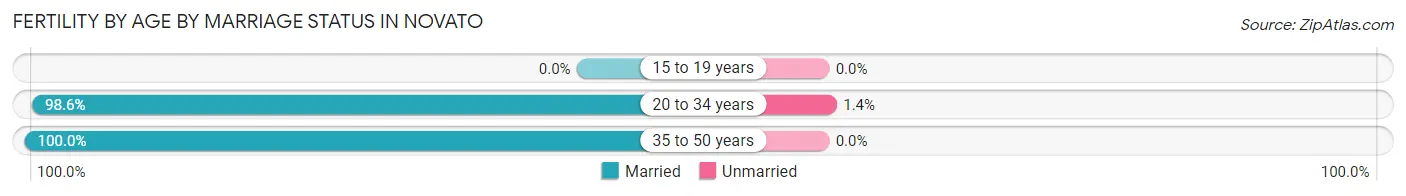
| Age Bracket | Married | Unmarried |
| 15 to 19 years | 0 (0.0%) | 0 (0.0%) |
| 20 to 34 years | 285 (98.6%) | 4 (1.4%) |
| 35 to 50 years | 219 (100.0%) | 0 (0.0%) |
| Total | 504 (99.2%) | 4 (0.8%) |
Fertility by Education in Novato
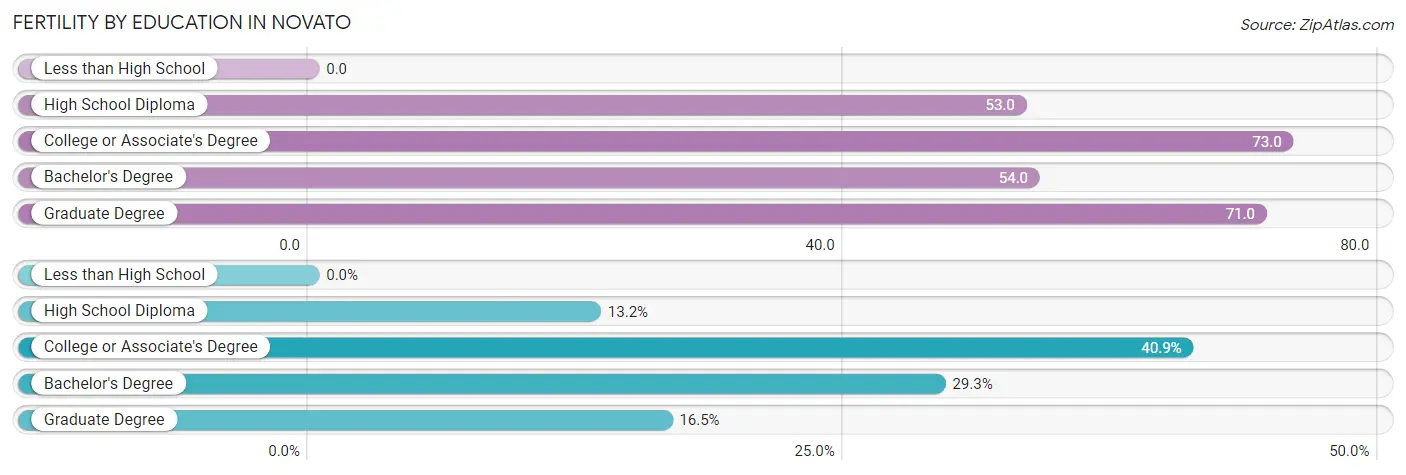
| Educational Attainment | Women with Births | Births / 1,000 Women |
| Less than High School | 0 (0.0%) | 0.0 |
| High School Diploma | 67 (13.2%) | 53.0 |
| College or Associate's Degree | 208 (40.9%) | 73.0 |
| Bachelor's Degree | 149 (29.3%) | 54.0 |
| Graduate Degree | 84 (16.5%) | 71.0 |
| Total | 508 (100.0%) | 53.0 |
Fertility by Education by Marriage Status in Novato
0.8% of women with births in Novato are unmarried. Women with the educational attainment of high school diploma are most likely to be married with 100.0% of them married at childbirth, while women with the educational attainment of bachelor's degree are least likely to be married with 1.3% of them unmarried at childbirth.
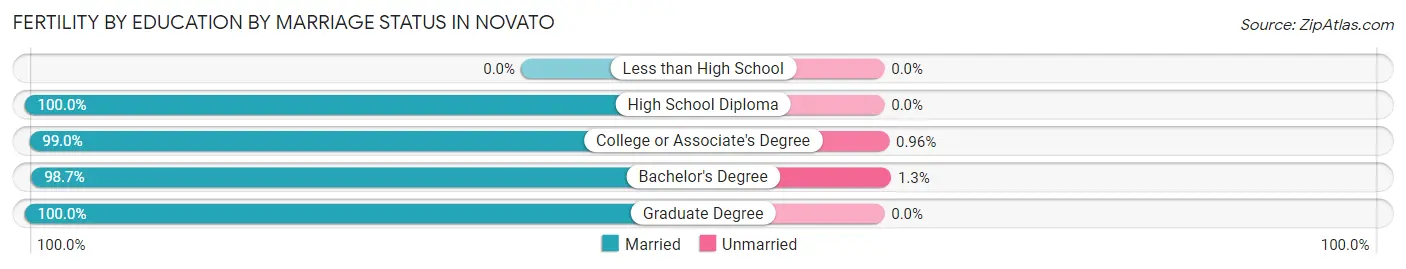
| Educational Attainment | Married | Unmarried |
| Less than High School | 0 (0.0%) | 0 (0.0%) |
| High School Diploma | 67 (100.0%) | 0 (0.0%) |
| College or Associate's Degree | 206 (99.0%) | 2 (1.0%) |
| Bachelor's Degree | 147 (98.7%) | 2 (1.3%) |
| Graduate Degree | 84 (100.0%) | 0 (0.0%) |
| Total | 504 (99.2%) | 4 (0.8%) |
Employment Characteristics in Novato
Employment by Class of Employer in Novato
Among the 24,748 employed individuals in Novato, private company employees (14,358 | 58.0%), self-employed (not incorporated) (3,019 | 12.2%), and local government employees (2,484 | 10.0%) make up the most common classes of employment.
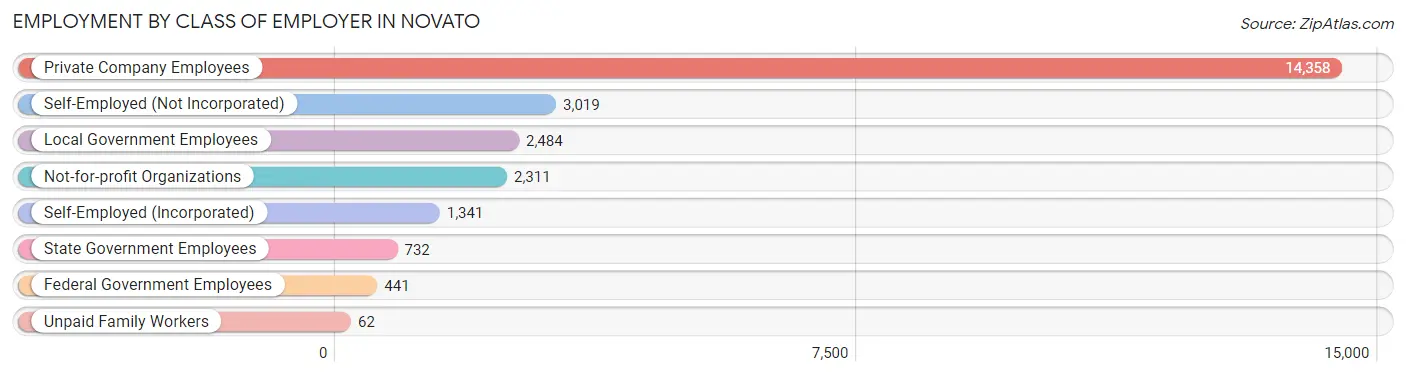
| Employer Class | # Employees | % Employees |
| Private Company Employees | 14,358 | 58.0% |
| Self-Employed (Incorporated) | 1,341 | 5.4% |
| Self-Employed (Not Incorporated) | 3,019 | 12.2% |
| Not-for-profit Organizations | 2,311 | 9.3% |
| Local Government Employees | 2,484 | 10.0% |
| State Government Employees | 732 | 3.0% |
| Federal Government Employees | 441 | 1.8% |
| Unpaid Family Workers | 62 | 0.3% |
| Total | 24,748 | 100.0% |
Employment Status by Age in Novato
According to the labor force statistics for Novato, out of the total population over 16 years of age (44,188), 61.3% or 27,087 individuals are in the labor force, with 6.5% or 1,761 of them unemployed. The age group with the highest labor force participation rate is 45 to 54 years, with 87.0% or 6,640 individuals in the labor force. Within the labor force, the 16 to 19 years age range has the highest percentage of unemployed individuals, with 23.9% or 216 of them being unemployed.

| Age Bracket | In Labor Force | Unemployed |
| 16 to 19 Years | 905 (37.0%) | 216 (23.9%) |
| 20 to 24 Years | 1,714 (69.4%) | 269 (15.7%) |
| 25 to 29 Years | 1,615 (82.3%) | 283 (17.5%) |
| 30 to 34 Years | 1,851 (77.5%) | 191 (10.3%) |
| 35 to 44 Years | 5,074 (85.4%) | 264 (5.2%) |
| 45 to 54 Years | 6,640 (87.0%) | 173 (2.6%) |
| 55 to 59 Years | 3,279 (82.0%) | 180 (5.5%) |
| 60 to 64 Years | 2,879 (70.8%) | 115 (4.0%) |
| 65 to 74 Years | 2,641 (33.0%) | 42 (1.6%) |
| 75 Years and over | 517 (9.8%) | 39 (7.5%) |
| Total | 27,087 (61.3%) | 1,761 (6.5%) |
Employment Status by Educational Attainment in Novato
According to labor force statistics for Novato, 82.1% of individuals (21,338) out of the total population between 25 and 64 years of age (25,990) are in the labor force, with 5.6% or 1,195 of them being unemployed. The group with the highest labor force participation rate are those with the educational attainment of bachelor's degree or higher, with 88.0% or 11,172 individuals in the labor force. Within the labor force, individuals with high school diploma education have the highest percentage of unemployment, with 7.6% or 224 of them being unemployed.
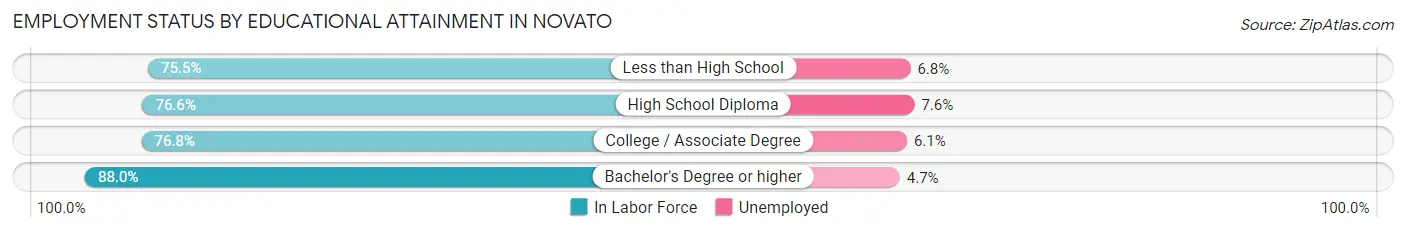
| Educational Attainment | In Labor Force | Unemployed |
| Less than High School | 1,859 (75.5%) | 167 (6.8%) |
| High School Diploma | 2,948 (76.6%) | 292 (7.6%) |
| College / Associate Degree | 5,364 (76.8%) | 426 (6.1%) |
| Bachelor's Degree or higher | 11,172 (88.0%) | 597 (4.7%) |
| Total | 21,338 (82.1%) | 1,455 (5.6%) |
Employment Occupations by Sex in Novato
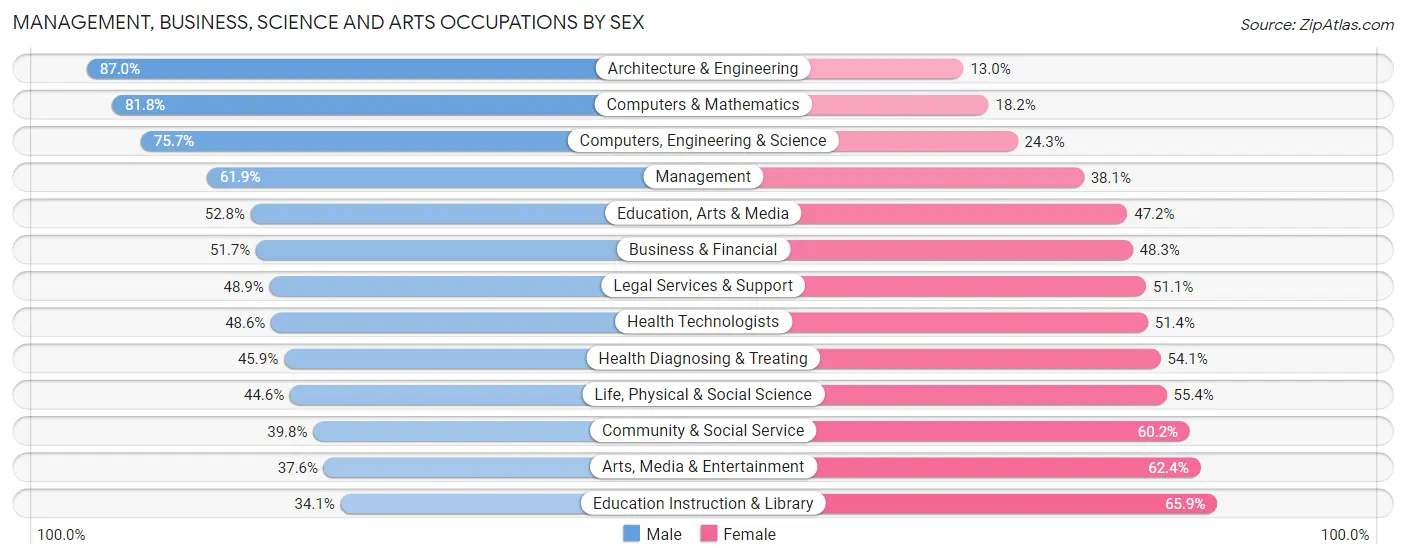
Management, Business, Science and Arts Occupations
The most common Management, Business, Science and Arts occupations in Novato are Management (3,871 | 15.3%), Community & Social Service (3,522 | 14.0%), Computers, Engineering & Science (1,751 | 6.9%), Education Instruction & Library (1,673 | 6.6%), and Business & Financial (1,462 | 5.8%).
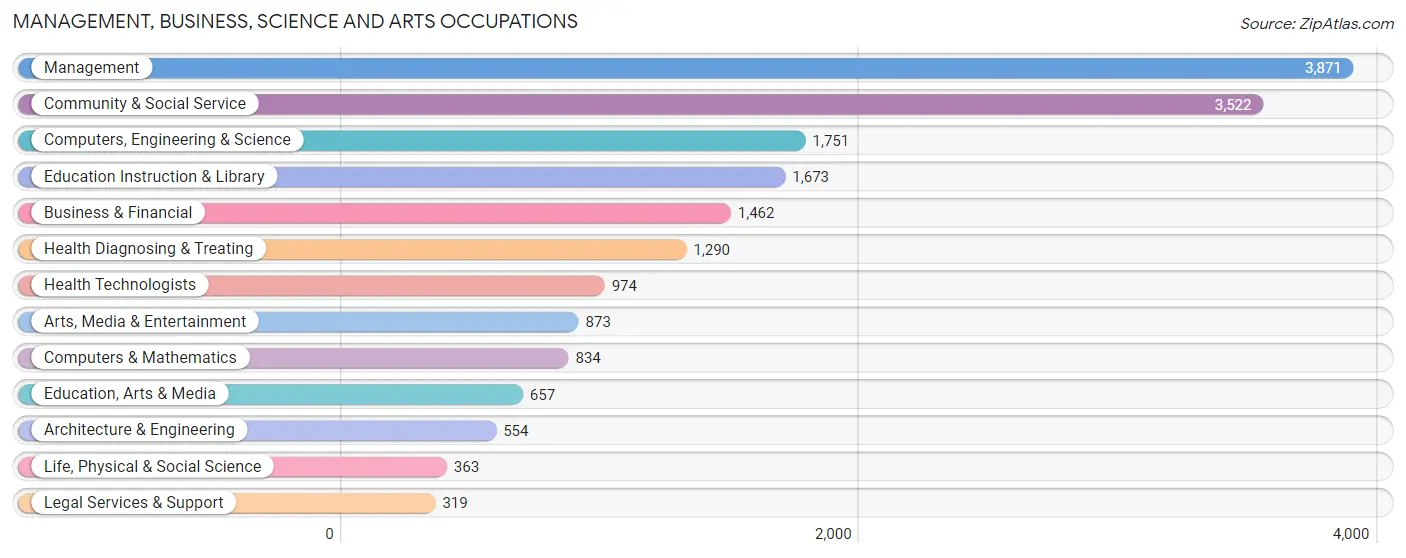
Management, Business, Science and Arts Occupations by Sex
Within the Management, Business, Science and Arts occupations in Novato, the most male-oriented occupations are Architecture & Engineering (87.0%), Computers & Mathematics (81.8%), and Computers, Engineering & Science (75.7%), while the most female-oriented occupations are Education Instruction & Library (65.9%), Arts, Media & Entertainment (62.4%), and Community & Social Service (60.2%).
| Occupation | Male | Female |
| Management | 2,397 (61.9%) | 1,474 (38.1%) |
| Business & Financial | 756 (51.7%) | 706 (48.3%) |
| Computers, Engineering & Science | 1,326 (75.7%) | 425 (24.3%) |
| Computers & Mathematics | 682 (81.8%) | 152 (18.2%) |
| Architecture & Engineering | 482 (87.0%) | 72 (13.0%) |
| Life, Physical & Social Science | 162 (44.6%) | 201 (55.4%) |
| Community & Social Service | 1,401 (39.8%) | 2,121 (60.2%) |
| Education, Arts & Media | 347 (52.8%) | 310 (47.2%) |
| Legal Services & Support | 156 (48.9%) | 163 (51.1%) |
| Education Instruction & Library | 570 (34.1%) | 1,103 (65.9%) |
| Arts, Media & Entertainment | 328 (37.6%) | 545 (62.4%) |
| Health Diagnosing & Treating | 592 (45.9%) | 698 (54.1%) |
| Health Technologists | 473 (48.6%) | 501 (51.4%) |
| Total (Category) | 6,472 (54.4%) | 5,424 (45.6%) |
| Total (Overall) | 13,501 (53.5%) | 11,746 (46.5%) |
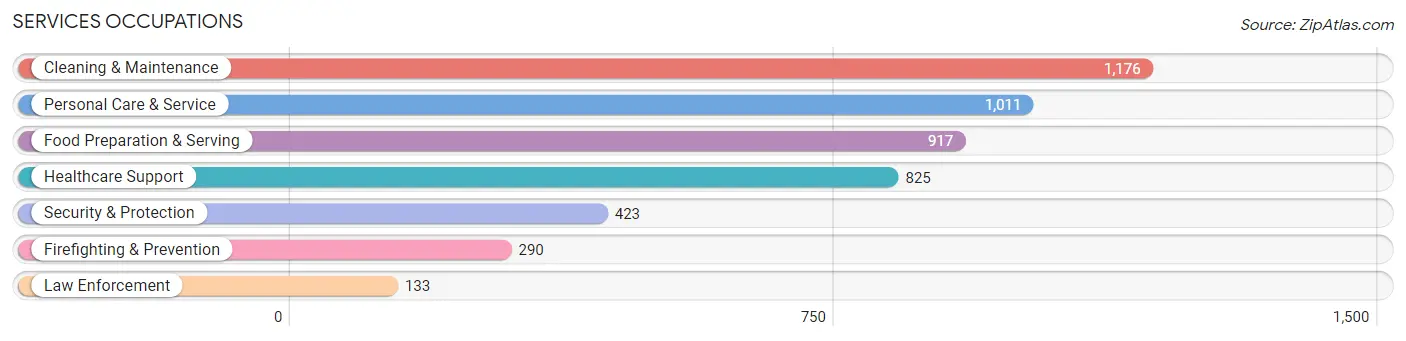
Services Occupations
The most common Services occupations in Novato are Cleaning & Maintenance (1,176 | 4.7%), Personal Care & Service (1,011 | 4.0%), Food Preparation & Serving (917 | 3.6%), Healthcare Support (825 | 3.3%), and Security & Protection (423 | 1.7%).
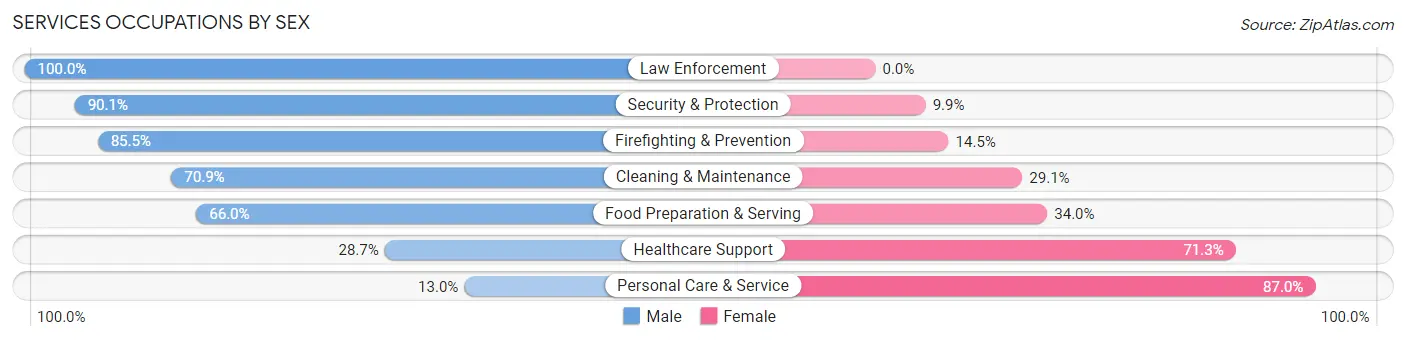
Services Occupations by Sex
Within the Services occupations in Novato, the most male-oriented occupations are Law Enforcement (100.0%), Security & Protection (90.1%), and Firefighting & Prevention (85.5%), while the most female-oriented occupations are Personal Care & Service (87.0%), Healthcare Support (71.3%), and Food Preparation & Serving (34.0%).
| Occupation | Male | Female |
| Healthcare Support | 237 (28.7%) | 588 (71.3%) |
| Security & Protection | 381 (90.1%) | 42 (9.9%) |
| Firefighting & Prevention | 248 (85.5%) | 42 (14.5%) |
| Law Enforcement | 133 (100.0%) | 0 (0.0%) |
| Food Preparation & Serving | 605 (66.0%) | 312 (34.0%) |
| Cleaning & Maintenance | 834 (70.9%) | 342 (29.1%) |
| Personal Care & Service | 131 (13.0%) | 880 (87.0%) |
| Total (Category) | 2,188 (50.3%) | 2,164 (49.7%) |
| Total (Overall) | 13,501 (53.5%) | 11,746 (46.5%) |
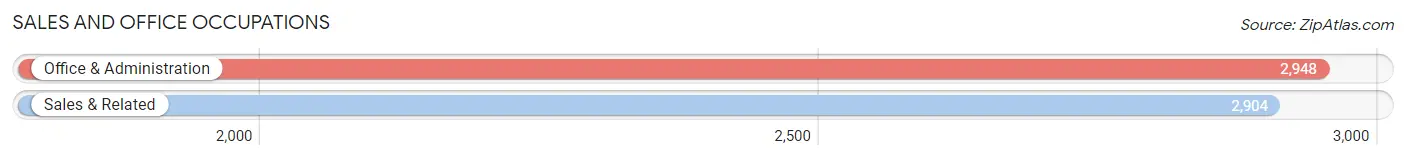
Sales and Office Occupations
The most common Sales and Office occupations in Novato are Office & Administration (2,948 | 11.7%), and Sales & Related (2,904 | 11.5%).
Sales and Office Occupations by Sex
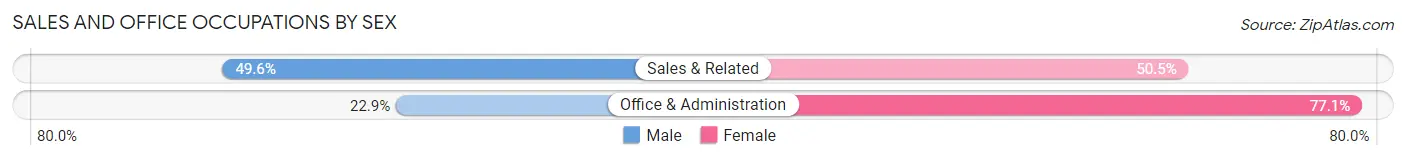
| Occupation | Male | Female |
| Sales & Related | 1,439 (49.5%) | 1,465 (50.4%) |
| Office & Administration | 674 (22.9%) | 2,274 (77.1%) |
| Total (Category) | 2,113 (36.1%) | 3,739 (63.9%) |
| Total (Overall) | 13,501 (53.5%) | 11,746 (46.5%) |
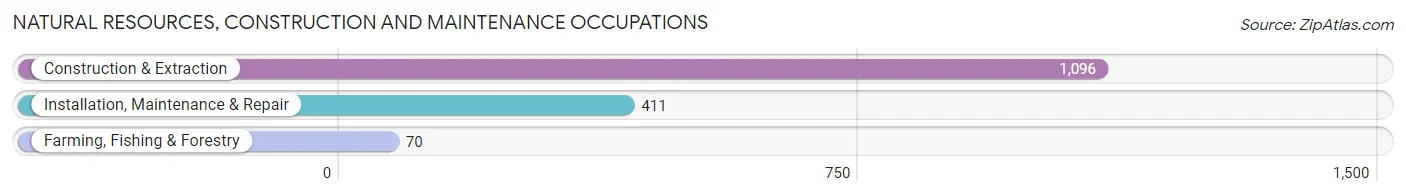
Natural Resources, Construction and Maintenance Occupations
The most common Natural Resources, Construction and Maintenance occupations in Novato are Construction & Extraction (1,096 | 4.3%), Installation, Maintenance & Repair (411 | 1.6%), and Farming, Fishing & Forestry (70 | 0.3%).
Natural Resources, Construction and Maintenance Occupations by Sex
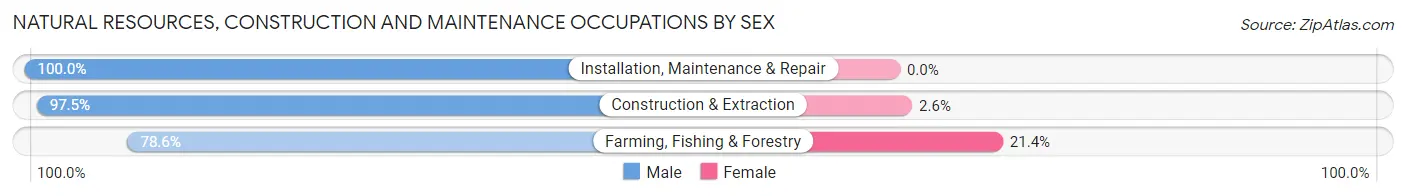
| Occupation | Male | Female |
| Farming, Fishing & Forestry | 55 (78.6%) | 15 (21.4%) |
| Construction & Extraction | 1,068 (97.5%) | 28 (2.5%) |
| Installation, Maintenance & Repair | 411 (100.0%) | 0 (0.0%) |
| Total (Category) | 1,534 (97.3%) | 43 (2.7%) |
| Total (Overall) | 13,501 (53.5%) | 11,746 (46.5%) |
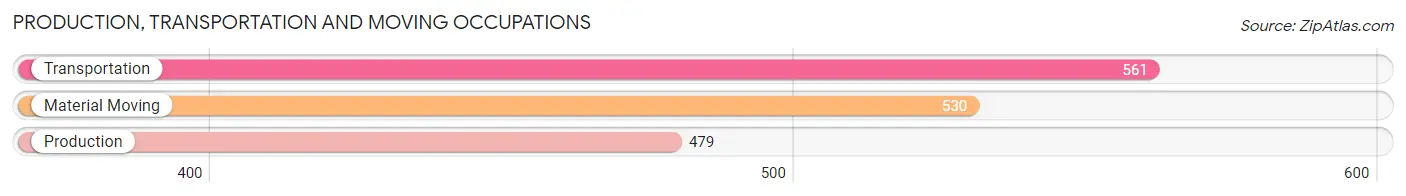
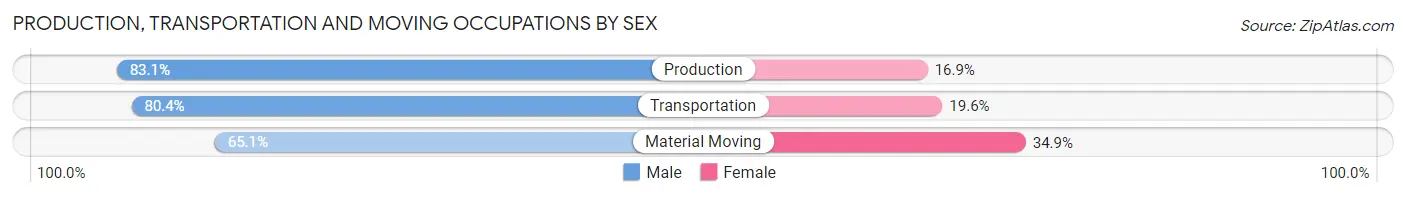
Production, Transportation and Moving Occupations
The most common Production, Transportation and Moving occupations in Novato are Transportation (561 | 2.2%), Material Moving (530 | 2.1%), and Production (479 | 1.9%).
Production, Transportation and Moving Occupations by Sex
| Occupation | Male | Female |
| Production | 398 (83.1%) | 81 (16.9%) |
| Transportation | 451 (80.4%) | 110 (19.6%) |
| Material Moving | 345 (65.1%) | 185 (34.9%) |
| Total (Category) | 1,194 (76.0%) | 376 (23.9%) |
| Total (Overall) | 13,501 (53.5%) | 11,746 (46.5%) |
Employment Industries by Sex in Novato
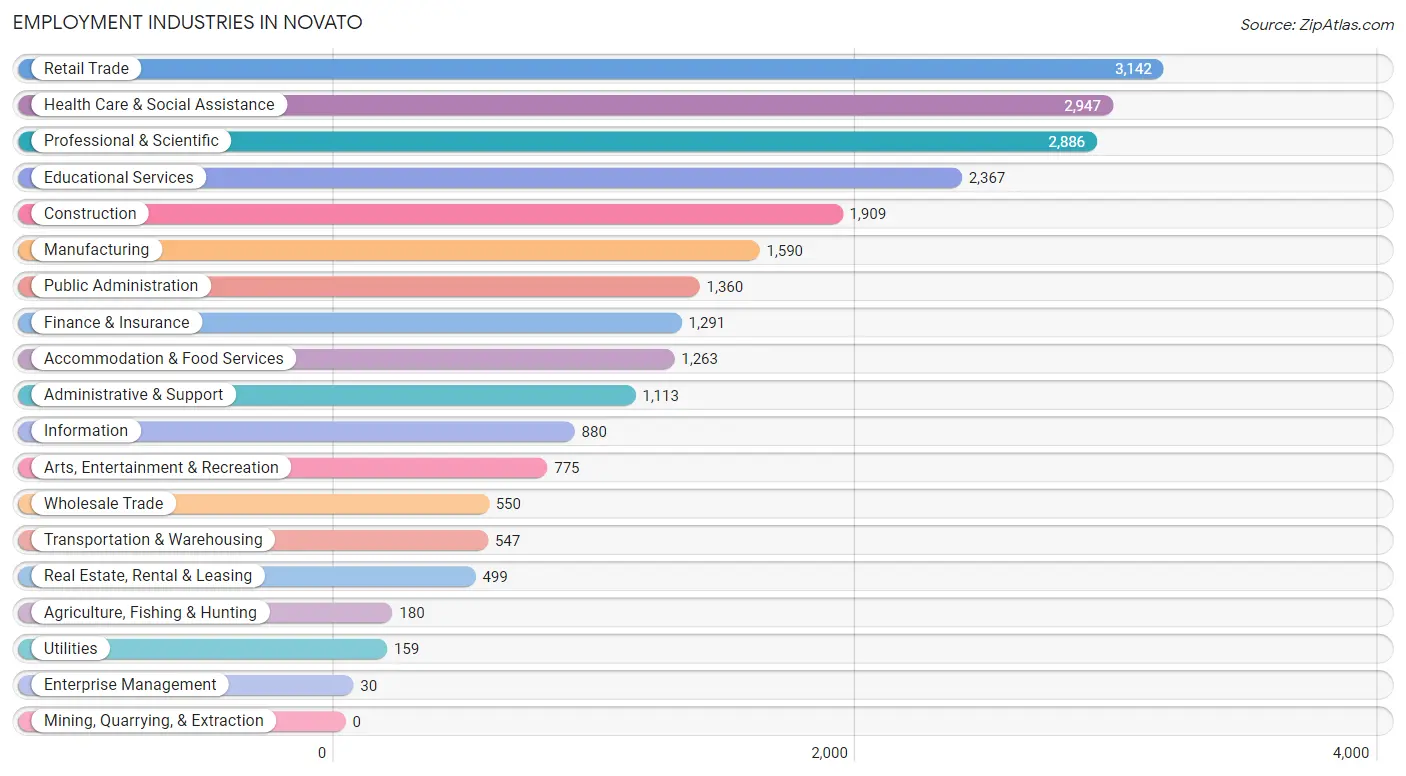
Employment Industries in Novato
The major employment industries in Novato include Retail Trade (3,142 | 12.4%), Health Care & Social Assistance (2,947 | 11.7%), Professional & Scientific (2,886 | 11.4%), Educational Services (2,367 | 9.4%), and Construction (1,909 | 7.6%).
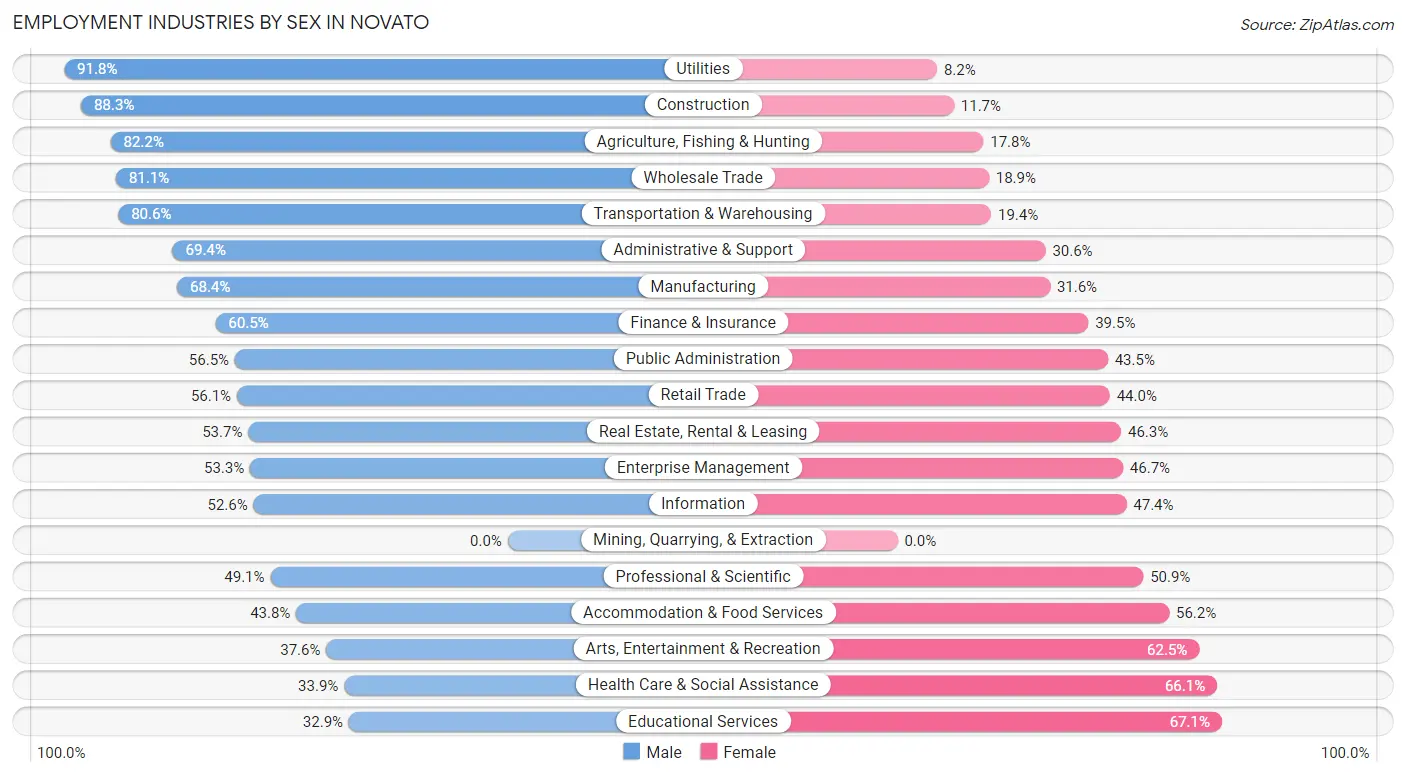
Employment Industries by Sex in Novato
The Novato industries that see more men than women are Utilities (91.8%), Construction (88.3%), and Agriculture, Fishing & Hunting (82.2%), whereas the industries that tend to have a higher number of women are Educational Services (67.1%), Health Care & Social Assistance (66.1%), and Arts, Entertainment & Recreation (62.5%).
| Industry | Male | Female |
| Agriculture, Fishing & Hunting | 148 (82.2%) | 32 (17.8%) |
| Mining, Quarrying, & Extraction | 0 (0.0%) | 0 (0.0%) |
| Construction | 1,686 (88.3%) | 223 (11.7%) |
| Manufacturing | 1,088 (68.4%) | 502 (31.6%) |
| Wholesale Trade | 446 (81.1%) | 104 (18.9%) |
| Retail Trade | 1,761 (56.0%) | 1,381 (44.0%) |
| Transportation & Warehousing | 441 (80.6%) | 106 (19.4%) |
| Utilities | 146 (91.8%) | 13 (8.2%) |
| Information | 463 (52.6%) | 417 (47.4%) |
| Finance & Insurance | 781 (60.5%) | 510 (39.5%) |
| Real Estate, Rental & Leasing | 268 (53.7%) | 231 (46.3%) |
| Professional & Scientific | 1,418 (49.1%) | 1,468 (50.9%) |
| Enterprise Management | 16 (53.3%) | 14 (46.7%) |
| Administrative & Support | 772 (69.4%) | 341 (30.6%) |
| Educational Services | 778 (32.9%) | 1,589 (67.1%) |
| Health Care & Social Assistance | 998 (33.9%) | 1,949 (66.1%) |
| Arts, Entertainment & Recreation | 291 (37.6%) | 484 (62.5%) |
| Accommodation & Food Services | 553 (43.8%) | 710 (56.2%) |
| Public Administration | 768 (56.5%) | 592 (43.5%) |
| Total | 13,501 (53.5%) | 11,746 (46.5%) |
Education in Novato
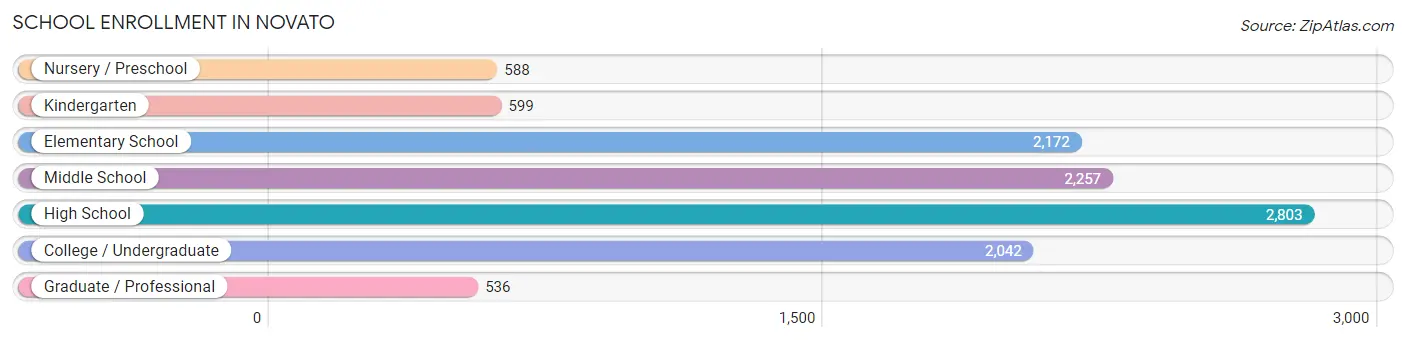
School Enrollment in Novato
The most common levels of schooling among the 10,997 students in Novato are high school (2,803 | 25.5%), middle school (2,257 | 20.5%), and elementary school (2,172 | 19.8%).
| School Level | # Students | % Students |
| Nursery / Preschool | 588 | 5.3% |
| Kindergarten | 599 | 5.4% |
| Elementary School | 2,172 | 19.8% |
| Middle School | 2,257 | 20.5% |
| High School | 2,803 | 25.5% |
| College / Undergraduate | 2,042 | 18.6% |
| Graduate / Professional | 536 | 4.9% |
| Total | 10,997 | 100.0% |
School Enrollment by Age by Funding Source in Novato
Out of a total of 10,997 students who are enrolled in schools in Novato, 1,935 (17.6%) attend a private institution, while the remaining 9,062 (82.4%) are enrolled in public schools. The age group of 3 to 4 year olds has the highest likelihood of being enrolled in private schools, with 292 (78.1% in the age bracket) enrolled. Conversely, the age group of 18 to 19 year olds has the lowest likelihood of being enrolled in a private school, with 569 (91.0% in the age bracket) attending a public institution.
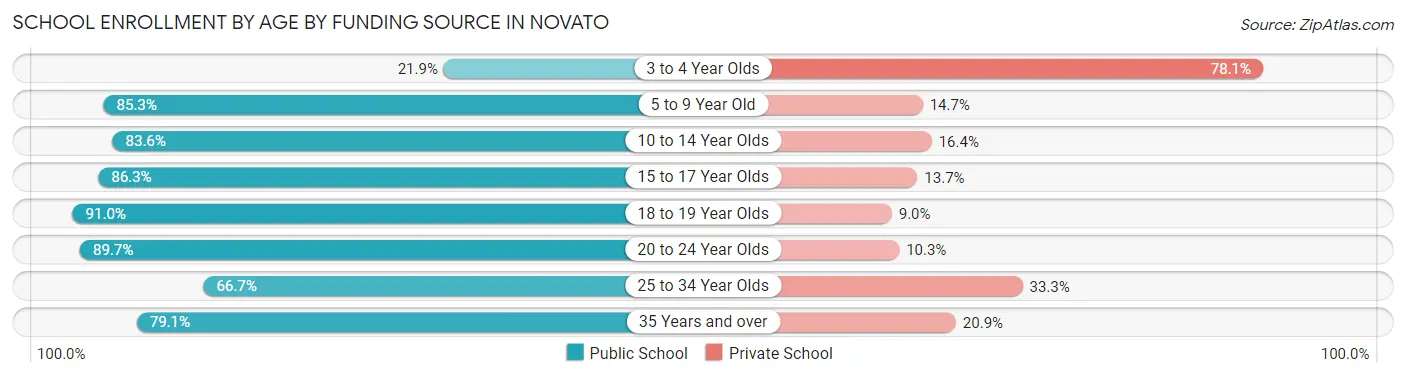
| Age Bracket | Public School | Private School |
| 3 to 4 Year Olds | 82 (21.9%) | 292 (78.1%) |
| 5 to 9 Year Old | 2,213 (85.3%) | 382 (14.7%) |
| 10 to 14 Year Olds | 2,492 (83.6%) | 489 (16.4%) |
| 15 to 17 Year Olds | 1,809 (86.3%) | 288 (13.7%) |
| 18 to 19 Year Olds | 569 (91.0%) | 56 (9.0%) |
| 20 to 24 Year Olds | 988 (89.7%) | 114 (10.3%) |
| 25 to 34 Year Olds | 286 (66.7%) | 143 (33.3%) |
| 35 Years and over | 628 (79.1%) | 166 (20.9%) |
| Total | 9,062 (82.4%) | 1,935 (17.6%) |
Educational Attainment by Field of Study in Novato
Business (3,553 | 17.2%), social sciences (1,968 | 9.6%), education (1,727 | 8.4%), bio, nature & agricultural (1,698 | 8.2%), and literature & languages (1,550 | 7.5%) are the most common fields of study among 20,601 individuals in Novato who have obtained a bachelor's degree or higher.
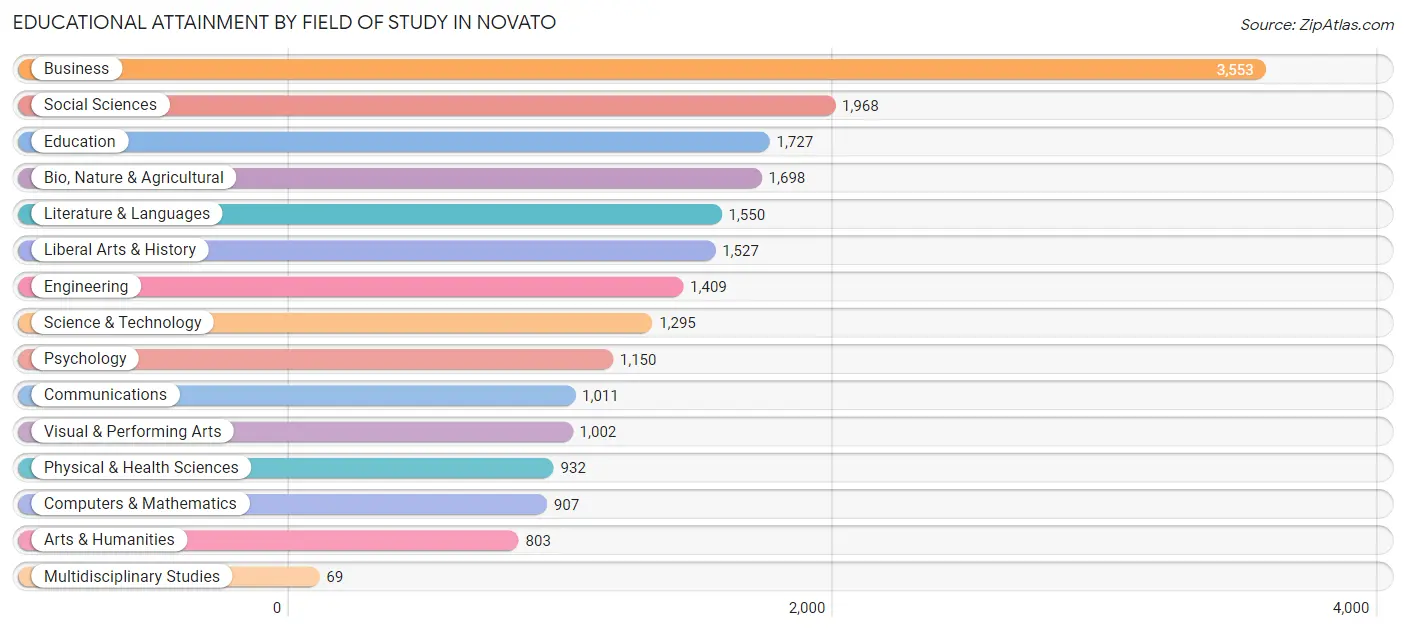
| Field of Study | # Graduates | % Graduates |
| Computers & Mathematics | 907 | 4.4% |
| Bio, Nature & Agricultural | 1,698 | 8.2% |
| Physical & Health Sciences | 932 | 4.5% |
| Psychology | 1,150 | 5.6% |
| Social Sciences | 1,968 | 9.6% |
| Engineering | 1,409 | 6.8% |
| Multidisciplinary Studies | 69 | 0.3% |
| Science & Technology | 1,295 | 6.3% |
| Business | 3,553 | 17.2% |
| Education | 1,727 | 8.4% |
| Literature & Languages | 1,550 | 7.5% |
| Liberal Arts & History | 1,527 | 7.4% |
| Visual & Performing Arts | 1,002 | 4.9% |
| Communications | 1,011 | 4.9% |
| Arts & Humanities | 803 | 3.9% |
| Total | 20,601 | 100.0% |
Transportation & Commute in Novato
Vehicle Availability by Sex in Novato
The most prevalent vehicle ownership categories in Novato are males with 2 vehicles (6,162, accounting for 46.6%) and females with 2 vehicles (5,035, making up 54.0%).
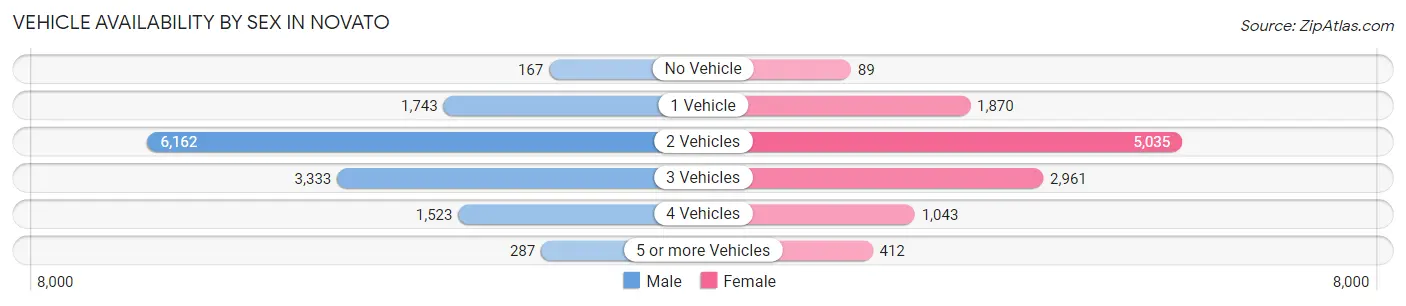
| Vehicles Available | Male | Female |
| No Vehicle | 167 (1.3%) | 89 (0.8%) |
| 1 Vehicle | 1,743 (13.2%) | 1,870 (16.4%) |
| 2 Vehicles | 6,162 (46.6%) | 5,035 (44.1%) |
| 3 Vehicles | 3,333 (25.2%) | 2,961 (26.0%) |
| 4 Vehicles | 1,523 (11.5%) | 1,043 (9.1%) |
| 5 or more Vehicles | 287 (2.2%) | 412 (3.6%) |
| Total | 13,215 (100.0%) | 11,410 (100.0%) |
Commute Time in Novato
The most frequently occuring commute durations in Novato are 20 to 24 minutes (2,736 commuters, 13.3%), 30 to 34 minutes (2,702 commuters, 13.2%), and 15 to 19 minutes (2,433 commuters, 11.9%).
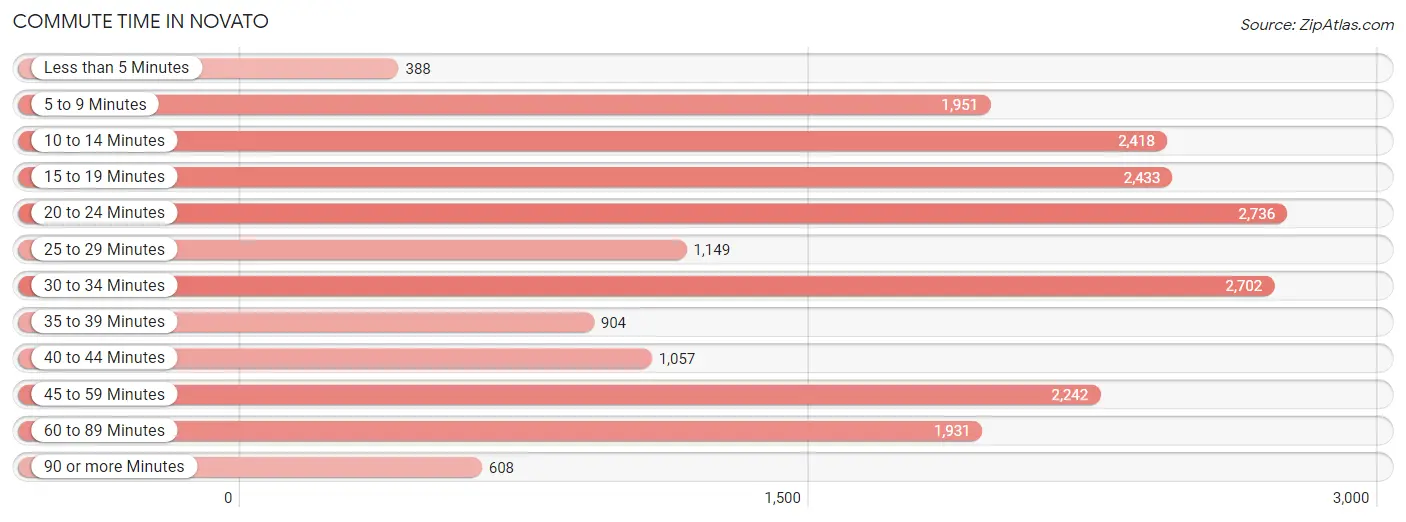
| Commute Time | # Commuters | % Commuters |
| Less than 5 Minutes | 388 | 1.9% |
| 5 to 9 Minutes | 1,951 | 9.5% |
| 10 to 14 Minutes | 2,418 | 11.8% |
| 15 to 19 Minutes | 2,433 | 11.9% |
| 20 to 24 Minutes | 2,736 | 13.3% |
| 25 to 29 Minutes | 1,149 | 5.6% |
| 30 to 34 Minutes | 2,702 | 13.2% |
| 35 to 39 Minutes | 904 | 4.4% |
| 40 to 44 Minutes | 1,057 | 5.1% |
| 45 to 59 Minutes | 2,242 | 10.9% |
| 60 to 89 Minutes | 1,931 | 9.4% |
| 90 or more Minutes | 608 | 3.0% |
Commute Time by Sex in Novato
The most common commute times in Novato are 30 to 34 minutes (1,690 commuters, 15.0%) for males and 10 to 14 minutes (1,419 commuters, 15.4%) for females.
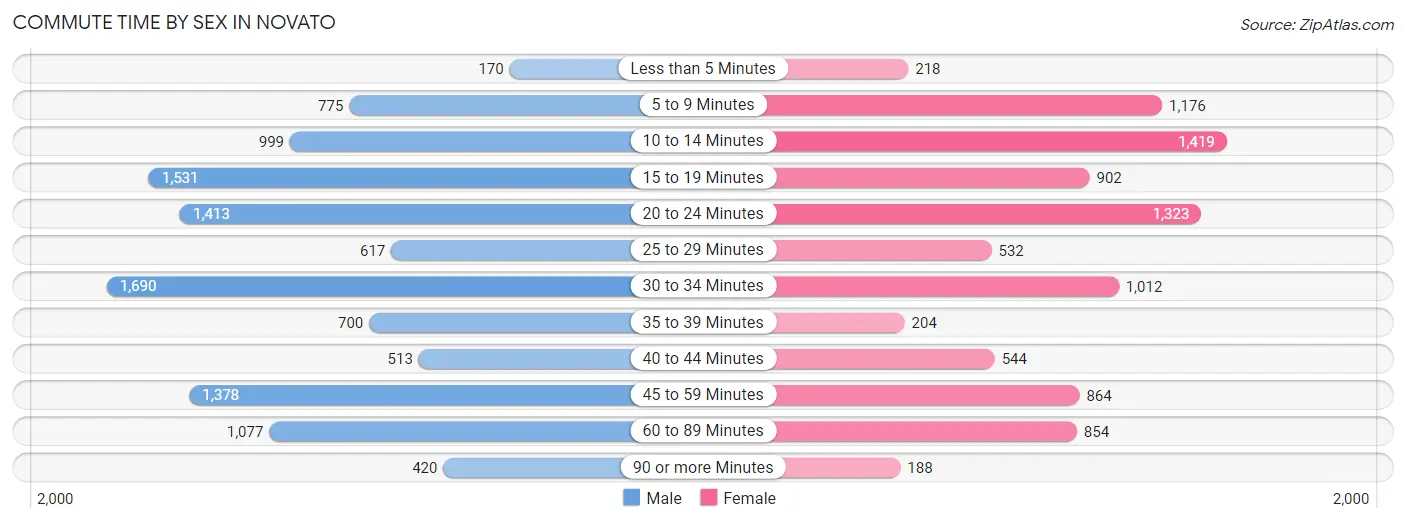
| Commute Time | Male | Female |
| Less than 5 Minutes | 170 (1.5%) | 218 (2.4%) |
| 5 to 9 Minutes | 775 (6.9%) | 1,176 (12.7%) |
| 10 to 14 Minutes | 999 (8.8%) | 1,419 (15.4%) |
| 15 to 19 Minutes | 1,531 (13.6%) | 902 (9.8%) |
| 20 to 24 Minutes | 1,413 (12.5%) | 1,323 (14.3%) |
| 25 to 29 Minutes | 617 (5.5%) | 532 (5.8%) |
| 30 to 34 Minutes | 1,690 (15.0%) | 1,012 (11.0%) |
| 35 to 39 Minutes | 700 (6.2%) | 204 (2.2%) |
| 40 to 44 Minutes | 513 (4.5%) | 544 (5.9%) |
| 45 to 59 Minutes | 1,378 (12.2%) | 864 (9.3%) |
| 60 to 89 Minutes | 1,077 (9.6%) | 854 (9.2%) |
| 90 or more Minutes | 420 (3.7%) | 188 (2.0%) |
Time of Departure to Work by Sex in Novato
The most frequent times of departure to work in Novato are 7:00 AM to 7:29 AM (2,102, 18.6%) for males and 9:00 AM to 9:59 AM (1,687, 18.3%) for females.
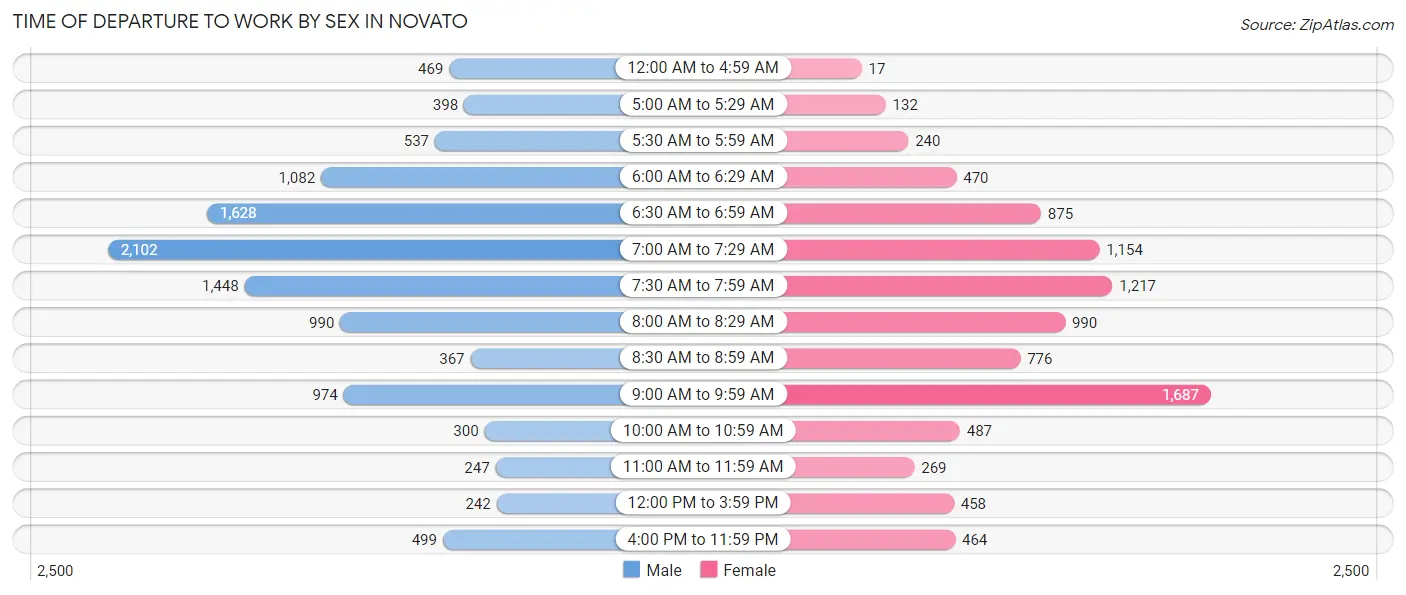
| Time of Departure | Male | Female |
| 12:00 AM to 4:59 AM | 469 (4.2%) | 17 (0.2%) |
| 5:00 AM to 5:29 AM | 398 (3.5%) | 132 (1.4%) |
| 5:30 AM to 5:59 AM | 537 (4.8%) | 240 (2.6%) |
| 6:00 AM to 6:29 AM | 1,082 (9.6%) | 470 (5.1%) |
| 6:30 AM to 6:59 AM | 1,628 (14.4%) | 875 (9.5%) |
| 7:00 AM to 7:29 AM | 2,102 (18.6%) | 1,154 (12.5%) |
| 7:30 AM to 7:59 AM | 1,448 (12.8%) | 1,217 (13.2%) |
| 8:00 AM to 8:29 AM | 990 (8.8%) | 990 (10.7%) |
| 8:30 AM to 8:59 AM | 367 (3.3%) | 776 (8.4%) |
| 9:00 AM to 9:59 AM | 974 (8.6%) | 1,687 (18.3%) |
| 10:00 AM to 10:59 AM | 300 (2.7%) | 487 (5.3%) |
| 11:00 AM to 11:59 AM | 247 (2.2%) | 269 (2.9%) |
| 12:00 PM to 3:59 PM | 242 (2.1%) | 458 (5.0%) |
| 4:00 PM to 11:59 PM | 499 (4.4%) | 464 (5.0%) |
| Total | 11,283 (100.0%) | 9,236 (100.0%) |
Housing Occupancy in Novato
Occupancy by Ownership in Novato
Of the total 20,898 dwellings in Novato, owner-occupied units account for 14,332 (68.6%), while renter-occupied units make up 6,566 (31.4%).
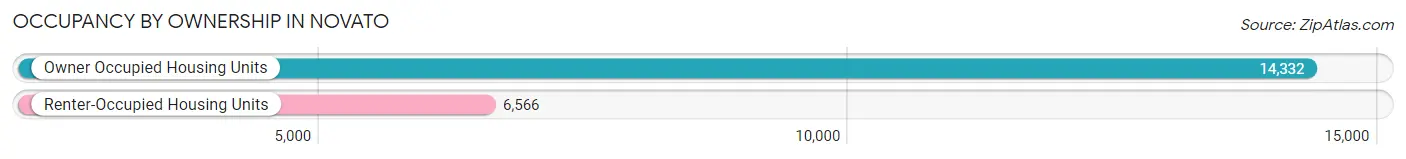
| Occupancy | # Housing Units | % Housing Units |
| Owner Occupied Housing Units | 14,332 | 68.6% |
| Renter-Occupied Housing Units | 6,566 | 31.4% |
| Total Occupied Housing Units | 20,898 | 100.0% |
Occupancy by Household Size in Novato
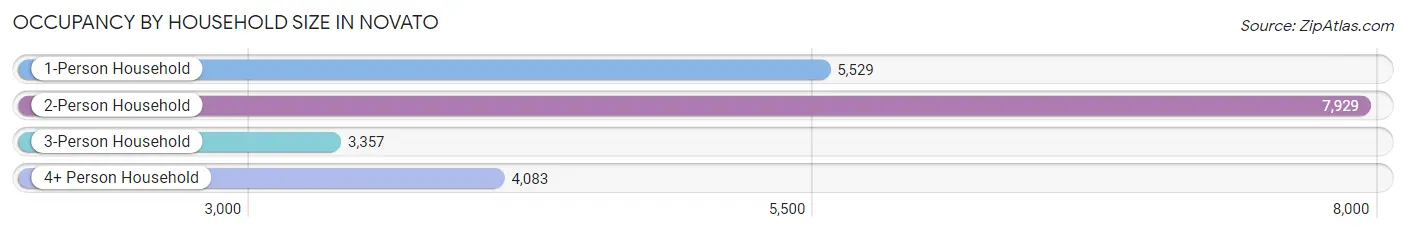
| Household Size | # Housing Units | % Housing Units |
| 1-Person Household | 5,529 | 26.5% |
| 2-Person Household | 7,929 | 37.9% |
| 3-Person Household | 3,357 | 16.1% |
| 4+ Person Household | 4,083 | 19.5% |
| Total Housing Units | 20,898 | 100.0% |
Occupancy by Ownership by Household Size in Novato
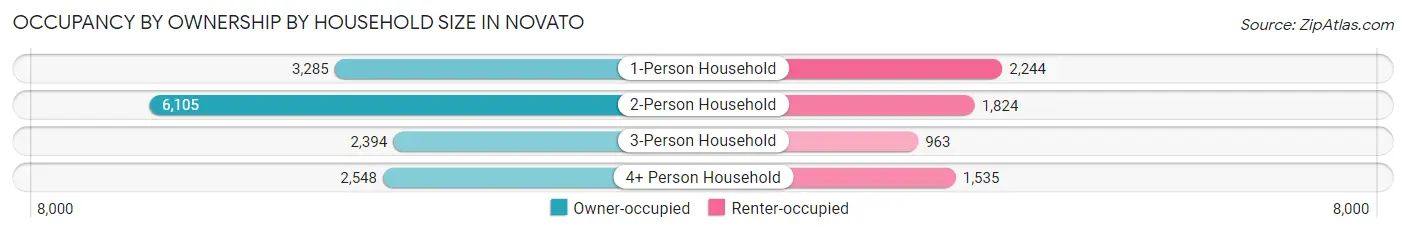
| Household Size | Owner-occupied | Renter-occupied |
| 1-Person Household | 3,285 (59.4%) | 2,244 (40.6%) |
| 2-Person Household | 6,105 (77.0%) | 1,824 (23.0%) |
| 3-Person Household | 2,394 (71.3%) | 963 (28.7%) |
| 4+ Person Household | 2,548 (62.4%) | 1,535 (37.6%) |
| Total Housing Units | 14,332 (68.6%) | 6,566 (31.4%) |
Occupancy by Educational Attainment in Novato
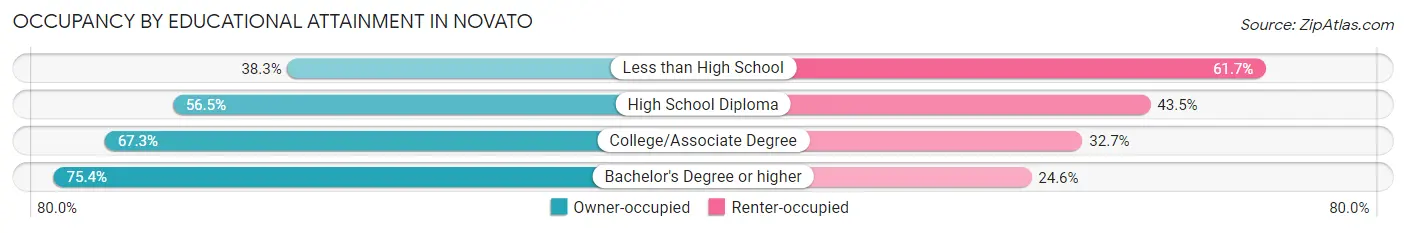
| Household Size | Owner-occupied | Renter-occupied |
| Less than High School | 486 (38.3%) | 783 (61.7%) |
| High School Diploma | 1,409 (56.5%) | 1,085 (43.5%) |
| College/Associate Degree | 3,993 (67.3%) | 1,941 (32.7%) |
| Bachelor's Degree or higher | 8,444 (75.4%) | 2,757 (24.6%) |
Occupancy by Age of Householder in Novato
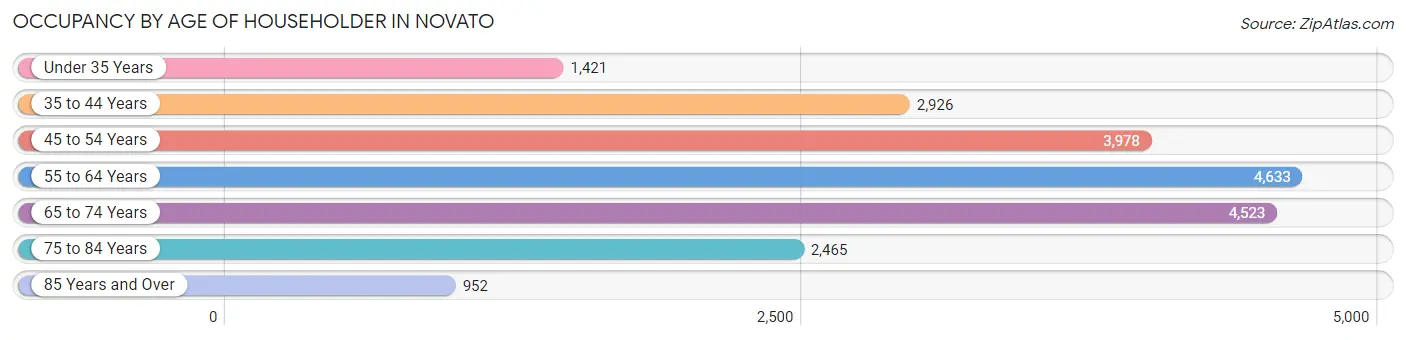
| Age Bracket | # Households | % Households |
| Under 35 Years | 1,421 | 6.8% |
| 35 to 44 Years | 2,926 | 14.0% |
| 45 to 54 Years | 3,978 | 19.0% |
| 55 to 64 Years | 4,633 | 22.2% |
| 65 to 74 Years | 4,523 | 21.6% |
| 75 to 84 Years | 2,465 | 11.8% |
| 85 Years and Over | 952 | 4.6% |
| Total | 20,898 | 100.0% |
Housing Finances in Novato
Median Income by Occupancy in Novato
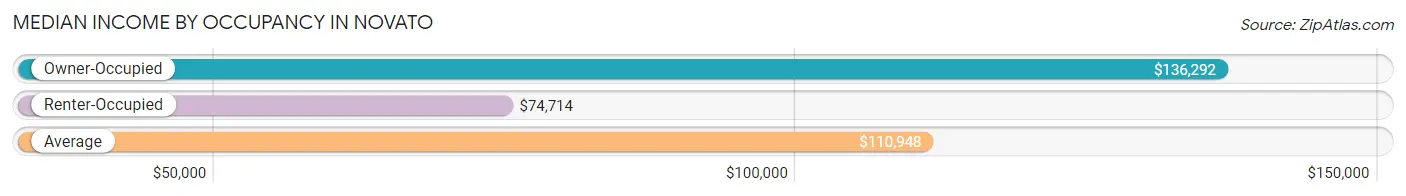
| Occupancy Type | # Households | Median Income |
| Owner-Occupied | 14,332 (68.6%) | $136,292 |
| Renter-Occupied | 6,566 (31.4%) | $74,714 |
| Average | 20,898 (100.0%) | $110,948 |
Occupancy by Householder Income Bracket in Novato
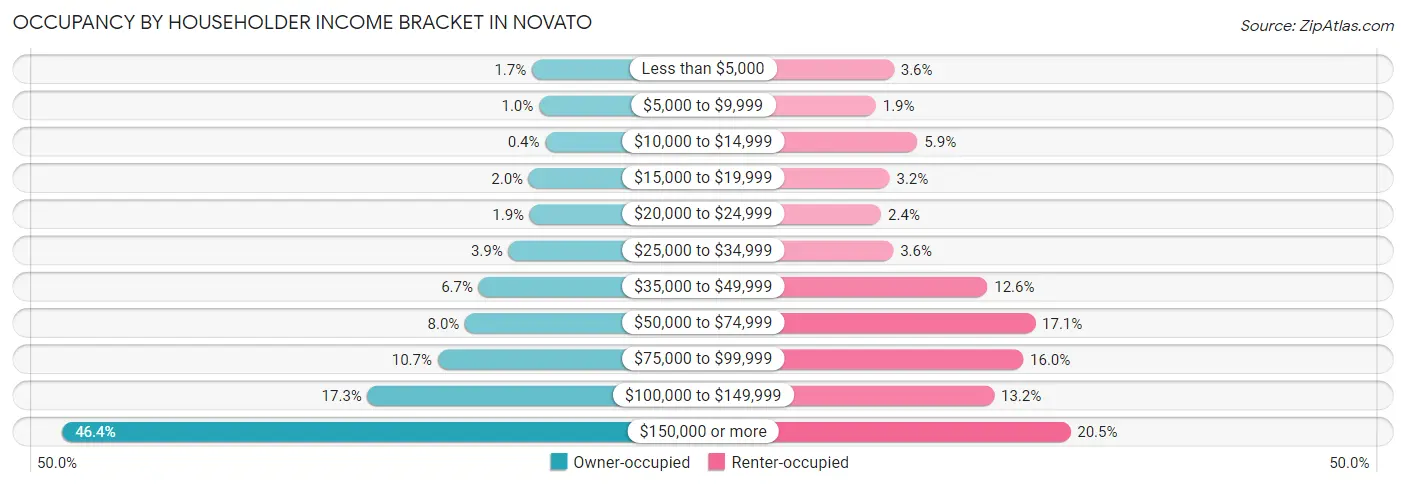
| Income Bracket | Owner-occupied | Renter-occupied |
| Less than $5,000 | 239 (1.7%) | 239 (3.6%) |
| $5,000 to $9,999 | 144 (1.0%) | 127 (1.9%) |
| $10,000 to $14,999 | 58 (0.4%) | 387 (5.9%) |
| $15,000 to $19,999 | 282 (2.0%) | 213 (3.2%) |
| $20,000 to $24,999 | 268 (1.9%) | 160 (2.4%) |
| $25,000 to $34,999 | 561 (3.9%) | 236 (3.6%) |
| $35,000 to $49,999 | 966 (6.7%) | 824 (12.6%) |
| $50,000 to $74,999 | 1,153 (8.0%) | 1,123 (17.1%) |
| $75,000 to $99,999 | 1,526 (10.6%) | 1,048 (16.0%) |
| $100,000 to $149,999 | 2,484 (17.3%) | 866 (13.2%) |
| $150,000 or more | 6,651 (46.4%) | 1,343 (20.4%) |
| Total | 14,332 (100.0%) | 6,566 (100.0%) |
Monthly Housing Cost Tiers in Novato
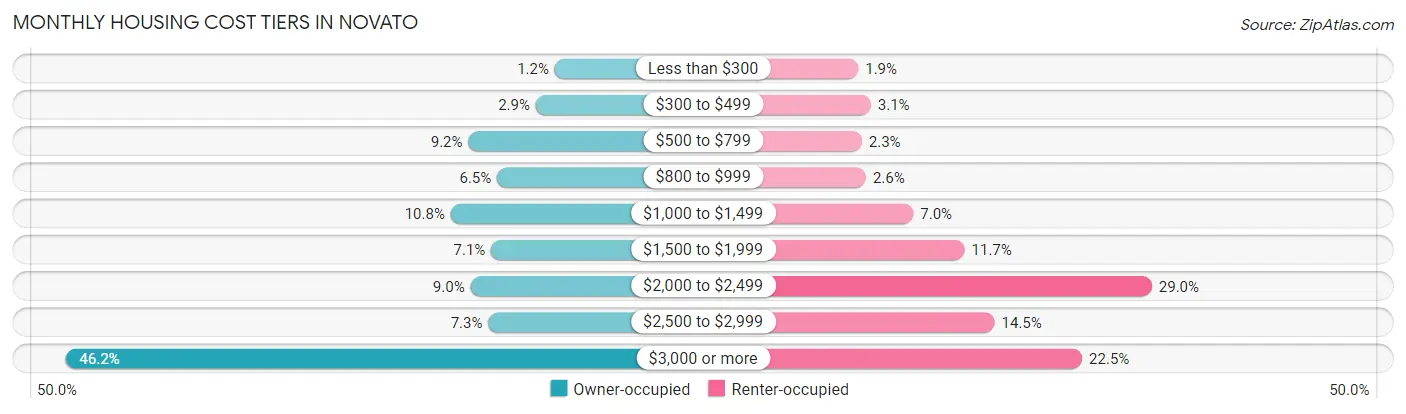
| Monthly Cost | Owner-occupied | Renter-occupied |
| Less than $300 | 171 (1.2%) | 126 (1.9%) |
| $300 to $499 | 421 (2.9%) | 202 (3.1%) |
| $500 to $799 | 1,311 (9.1%) | 148 (2.2%) |
| $800 to $999 | 931 (6.5%) | 173 (2.6%) |
| $1,000 to $1,499 | 1,543 (10.8%) | 459 (7.0%) |
| $1,500 to $1,999 | 1,010 (7.0%) | 769 (11.7%) |
| $2,000 to $2,499 | 1,283 (8.9%) | 1,901 (28.9%) |
| $2,500 to $2,999 | 1,048 (7.3%) | 950 (14.5%) |
| $3,000 or more | 6,614 (46.2%) | 1,479 (22.5%) |
| Total | 14,332 (100.0%) | 6,566 (100.0%) |
Physical Housing Characteristics in Novato
Housing Structures in Novato
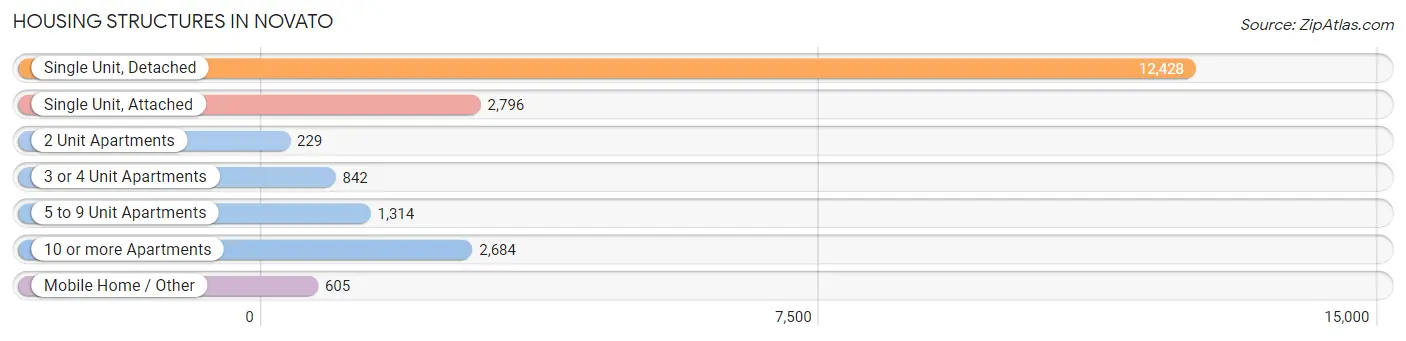
| Structure Type | # Housing Units | % Housing Units |
| Single Unit, Detached | 12,428 | 59.5% |
| Single Unit, Attached | 2,796 | 13.4% |
| 2 Unit Apartments | 229 | 1.1% |
| 3 or 4 Unit Apartments | 842 | 4.0% |
| 5 to 9 Unit Apartments | 1,314 | 6.3% |
| 10 or more Apartments | 2,684 | 12.8% |
| Mobile Home / Other | 605 | 2.9% |
| Total | 20,898 | 100.0% |
Housing Structures by Occupancy in Novato
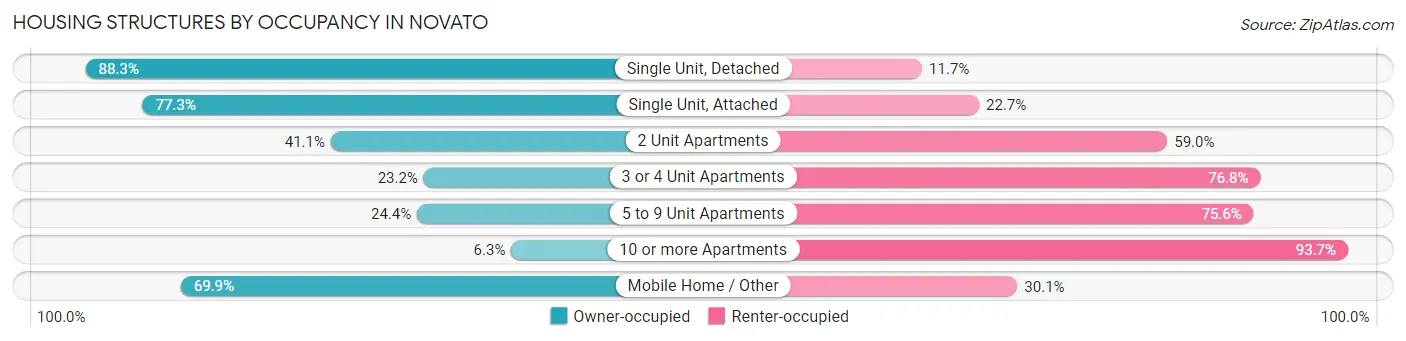
| Structure Type | Owner-occupied | Renter-occupied |
| Single Unit, Detached | 10,969 (88.3%) | 1,459 (11.7%) |
| Single Unit, Attached | 2,161 (77.3%) | 635 (22.7%) |
| 2 Unit Apartments | 94 (41.0%) | 135 (59.0%) |
| 3 or 4 Unit Apartments | 195 (23.2%) | 647 (76.8%) |
| 5 to 9 Unit Apartments | 321 (24.4%) | 993 (75.6%) |
| 10 or more Apartments | 169 (6.3%) | 2,515 (93.7%) |
| Mobile Home / Other | 423 (69.9%) | 182 (30.1%) |
| Total | 14,332 (68.6%) | 6,566 (31.4%) |
Housing Structures by Number of Rooms in Novato
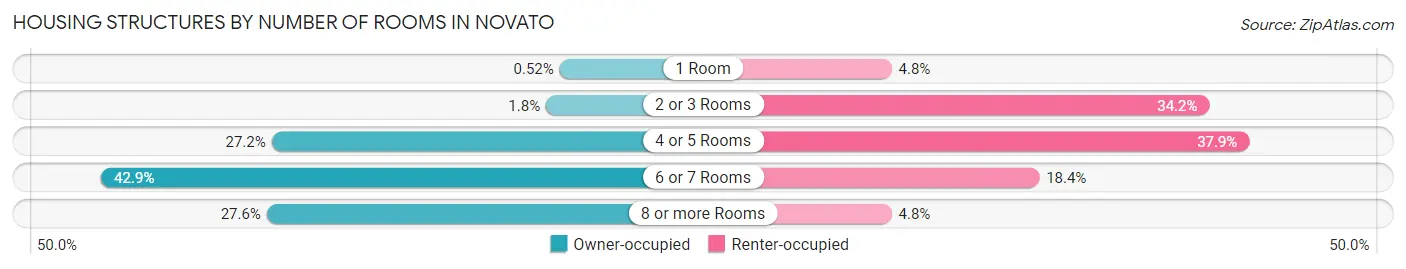
| Number of Rooms | Owner-occupied | Renter-occupied |
| 1 Room | 75 (0.5%) | 314 (4.8%) |
| 2 or 3 Rooms | 255 (1.8%) | 2,243 (34.2%) |
| 4 or 5 Rooms | 3,892 (27.2%) | 2,485 (37.9%) |
| 6 or 7 Rooms | 6,153 (42.9%) | 1,210 (18.4%) |
| 8 or more Rooms | 3,957 (27.6%) | 314 (4.8%) |
| Total | 14,332 (100.0%) | 6,566 (100.0%) |
Housing Structure by Heating Type in Novato
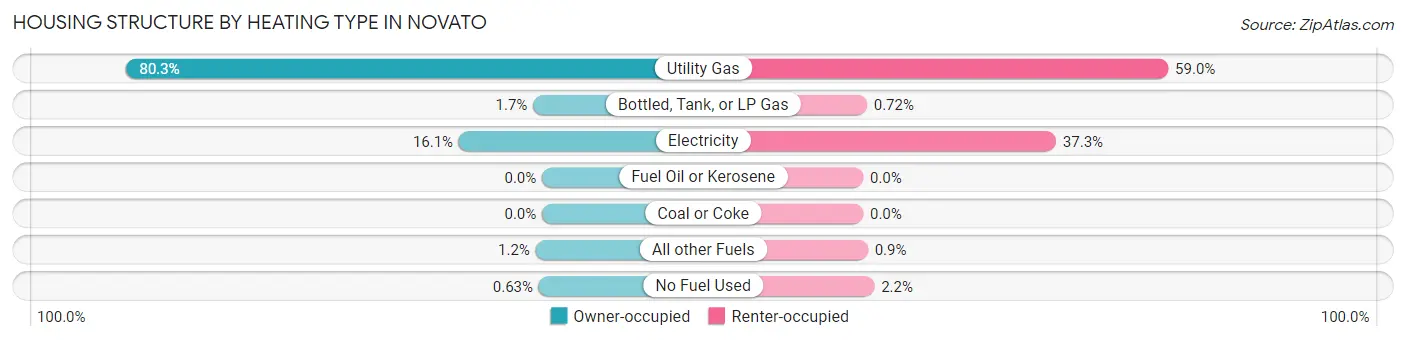
| Heating Type | Owner-occupied | Renter-occupied |
| Utility Gas | 11,514 (80.3%) | 3,871 (59.0%) |
| Bottled, Tank, or LP Gas | 247 (1.7%) | 47 (0.7%) |
| Electricity | 2,303 (16.1%) | 2,447 (37.3%) |
| Fuel Oil or Kerosene | 0 (0.0%) | 0 (0.0%) |
| Coal or Coke | 0 (0.0%) | 0 (0.0%) |
| All other Fuels | 178 (1.2%) | 59 (0.9%) |
| No Fuel Used | 90 (0.6%) | 142 (2.2%) |
| Total | 14,332 (100.0%) | 6,566 (100.0%) |
Household Vehicle Usage in Novato
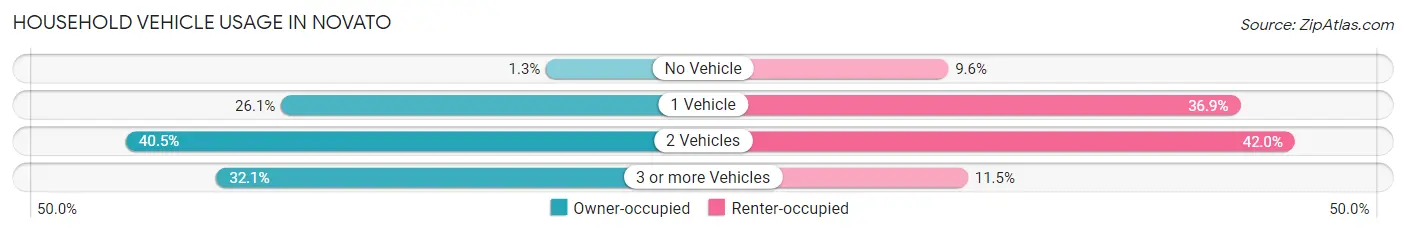
| Vehicles per Household | Owner-occupied | Renter-occupied |
| No Vehicle | 188 (1.3%) | 633 (9.6%) |
| 1 Vehicle | 3,733 (26.1%) | 2,423 (36.9%) |
| 2 Vehicles | 5,810 (40.5%) | 2,757 (42.0%) |
| 3 or more Vehicles | 4,601 (32.1%) | 753 (11.5%) |
| Total | 14,332 (100.0%) | 6,566 (100.0%) |
Real Estate & Mortgages in Novato
Real Estate and Mortgage Overview in Novato
| Characteristic | Without Mortgage | With Mortgage |
| Housing Units | 4,740 | 9,592 |
| Median Property Value | $850,700 | $967,800 |
| Median Household Income | $78,797 | $5,376 |
| Monthly Housing Costs | $927 | $6,577 |
| Real Estate Taxes | $4,762 | $211 |
Property Value by Mortgage Status in Novato
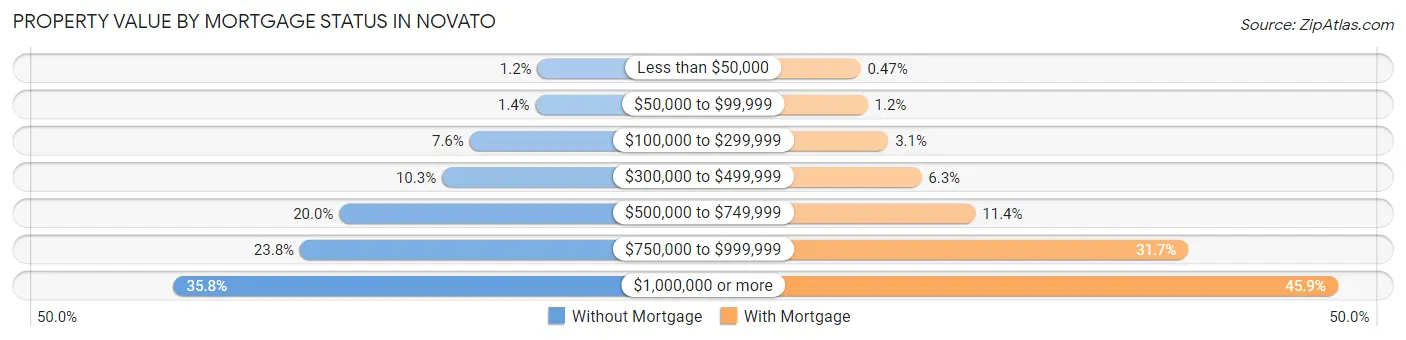
| Property Value | Without Mortgage | With Mortgage |
| Less than $50,000 | 55 (1.2%) | 45 (0.5%) |
| $50,000 to $99,999 | 64 (1.3%) | 110 (1.1%) |
| $100,000 to $299,999 | 361 (7.6%) | 298 (3.1%) |
| $300,000 to $499,999 | 486 (10.2%) | 601 (6.3%) |
| $500,000 to $749,999 | 950 (20.0%) | 1,094 (11.4%) |
| $750,000 to $999,999 | 1,127 (23.8%) | 3,040 (31.7%) |
| $1,000,000 or more | 1,697 (35.8%) | 4,404 (45.9%) |
| Total | 4,740 (100.0%) | 9,592 (100.0%) |
Household Income by Mortgage Status in Novato
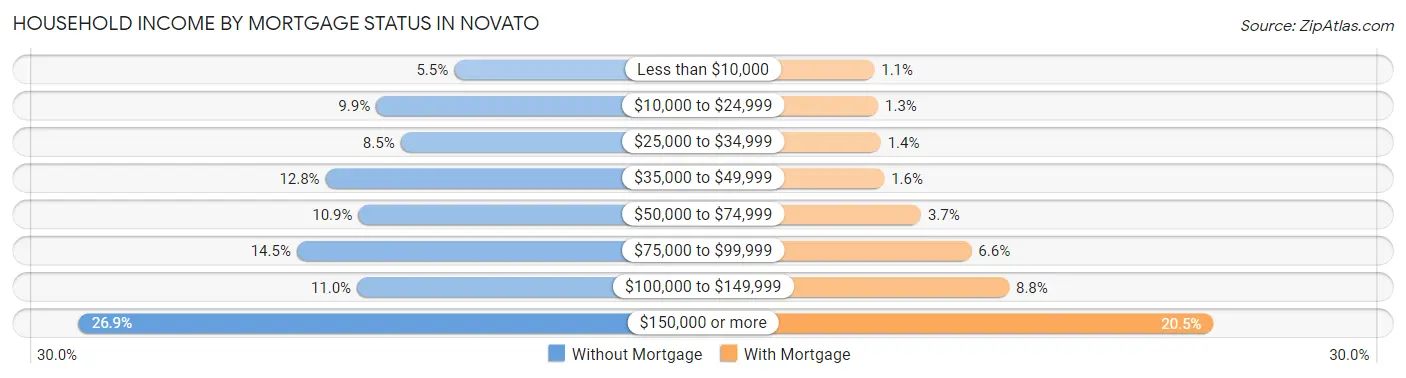
| Household Income | Without Mortgage | With Mortgage |
| Less than $10,000 | 259 (5.5%) | 103 (1.1%) |
| $10,000 to $24,999 | 470 (9.9%) | 124 (1.3%) |
| $25,000 to $34,999 | 404 (8.5%) | 138 (1.4%) |
| $35,000 to $49,999 | 607 (12.8%) | 157 (1.6%) |
| $50,000 to $74,999 | 518 (10.9%) | 359 (3.7%) |
| $75,000 to $99,999 | 685 (14.4%) | 635 (6.6%) |
| $100,000 to $149,999 | 522 (11.0%) | 841 (8.8%) |
| $150,000 or more | 1,275 (26.9%) | 1,962 (20.4%) |
| Total | 4,740 (100.0%) | 9,592 (100.0%) |
Property Value to Household Income Ratio in Novato
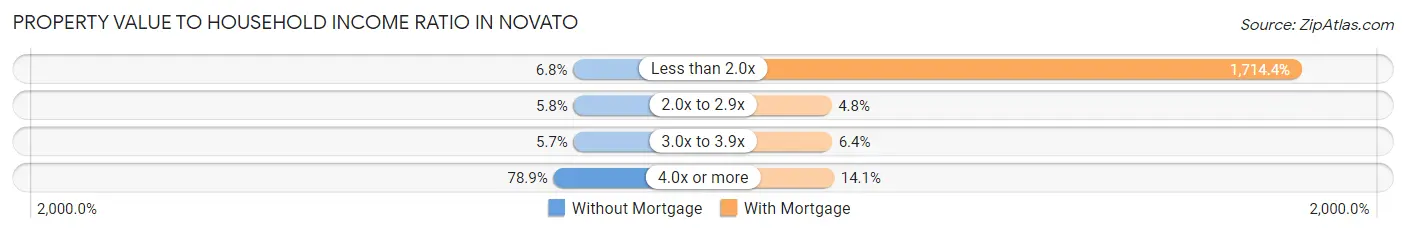
| Value-to-Income Ratio | Without Mortgage | With Mortgage |
| Less than 2.0x | 322 (6.8%) | 164,441 (1,714.4%) |
| 2.0x to 2.9x | 273 (5.8%) | 459 (4.8%) |
| 3.0x to 3.9x | 272 (5.7%) | 613 (6.4%) |
| 4.0x or more | 3,738 (78.9%) | 1,354 (14.1%) |
| Total | 4,740 (100.0%) | 9,592 (100.0%) |
Real Estate Taxes by Mortgage Status in Novato
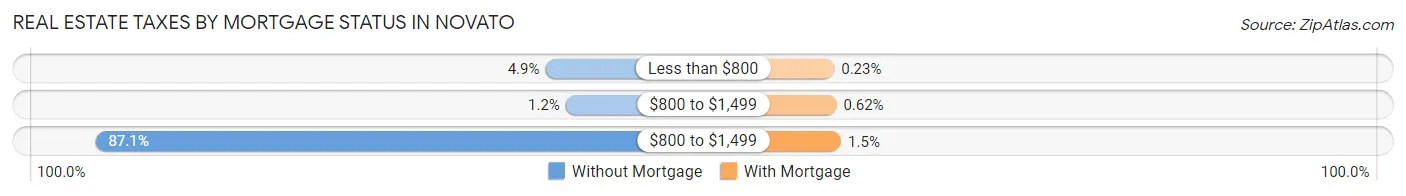
| Property Taxes | Without Mortgage | With Mortgage |
| Less than $800 | 232 (4.9%) | 22 (0.2%) |
| $800 to $1,499 | 56 (1.2%) | 59 (0.6%) |
| $800 to $1,499 | 4,126 (87.1%) | 142 (1.5%) |
| Total | 4,740 (100.0%) | 9,592 (100.0%) |
Health & Disability in Novato
Health Insurance Coverage by Age in Novato
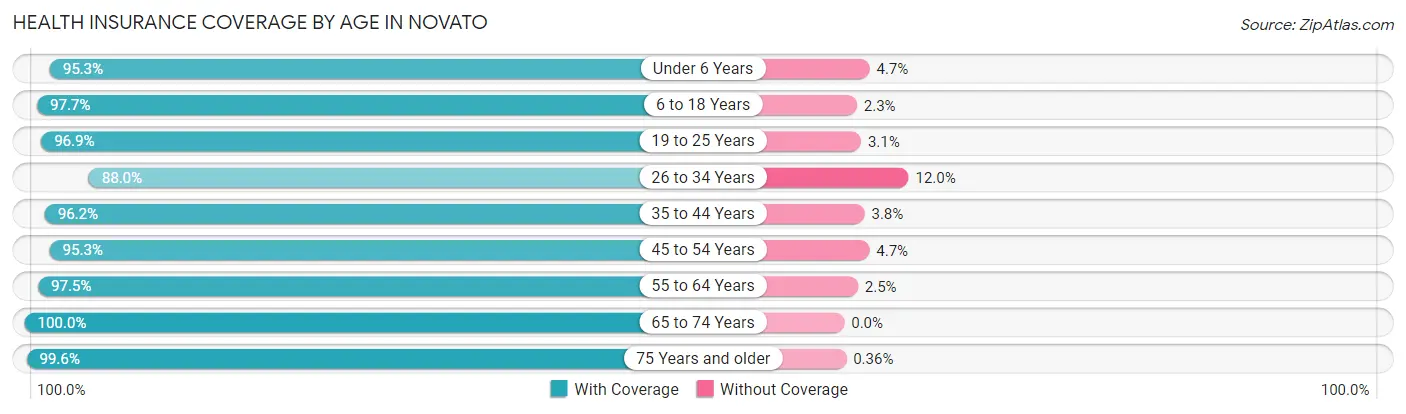
| Age Bracket | With Coverage | Without Coverage |
| Under 6 Years | 2,896 (95.3%) | 143 (4.7%) |
| 6 to 18 Years | 7,765 (97.7%) | 186 (2.3%) |
| 19 to 25 Years | 3,300 (96.9%) | 106 (3.1%) |
| 26 to 34 Years | 3,237 (88.0%) | 441 (12.0%) |
| 35 to 44 Years | 5,669 (96.2%) | 222 (3.8%) |
| 45 to 54 Years | 7,275 (95.3%) | 357 (4.7%) |
| 55 to 64 Years | 7,848 (97.5%) | 204 (2.5%) |
| 65 to 74 Years | 7,944 (100.0%) | 0 (0.0%) |
| 75 Years and older | 5,188 (99.6%) | 19 (0.4%) |
| Total | 51,122 (96.8%) | 1,678 (3.2%) |
Health Insurance Coverage by Citizenship Status in Novato
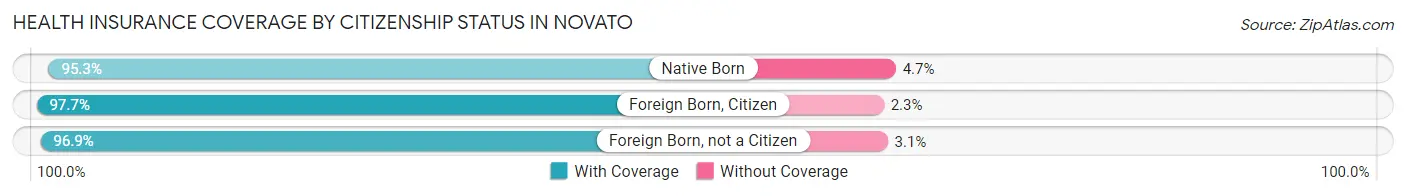
| Citizenship Status | With Coverage | Without Coverage |
| Native Born | 2,896 (95.3%) | 143 (4.7%) |
| Foreign Born, Citizen | 7,765 (97.7%) | 186 (2.3%) |
| Foreign Born, not a Citizen | 3,300 (96.9%) | 106 (3.1%) |
Health Insurance Coverage by Household Income in Novato
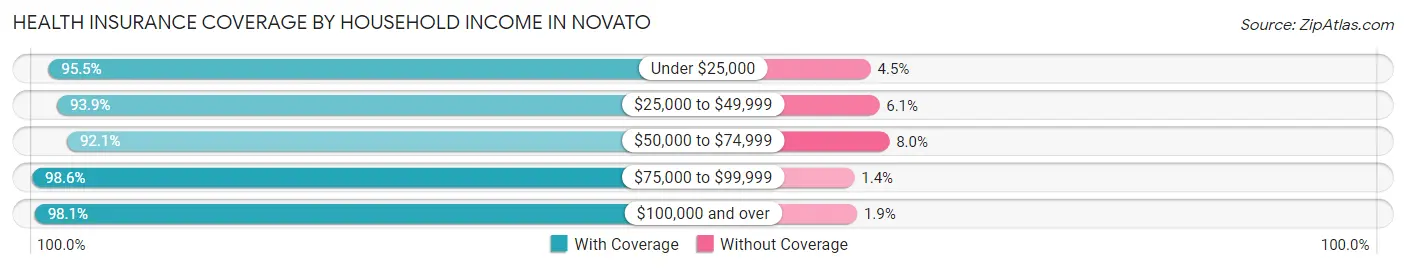
| Household Income | With Coverage | Without Coverage |
| Under $25,000 | 3,749 (95.5%) | 175 (4.5%) |
| $25,000 to $49,999 | 4,537 (93.9%) | 294 (6.1%) |
| $50,000 to $74,999 | 6,023 (92.0%) | 520 (8.0%) |
| $75,000 to $99,999 | 5,901 (98.6%) | 85 (1.4%) |
| $100,000 and over | 30,195 (98.1%) | 585 (1.9%) |
Public vs Private Health Insurance Coverage by Age in Novato
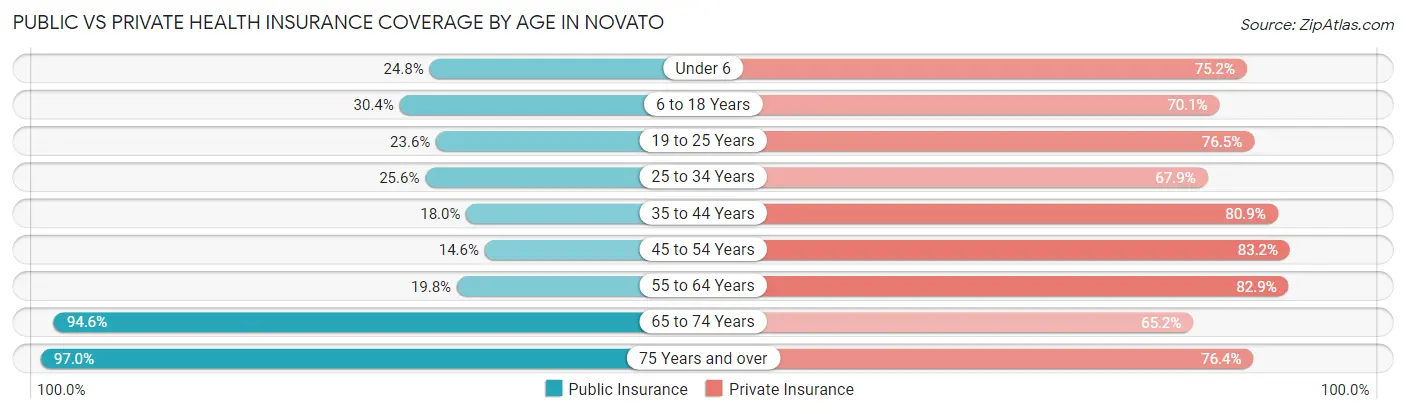
| Age Bracket | Public Insurance | Private Insurance |
| Under 6 | 755 (24.8%) | 2,284 (75.2%) |
| 6 to 18 Years | 2,418 (30.4%) | 5,573 (70.1%) |
| 19 to 25 Years | 804 (23.6%) | 2,606 (76.5%) |
| 25 to 34 Years | 943 (25.6%) | 2,497 (67.9%) |
| 35 to 44 Years | 1,061 (18.0%) | 4,764 (80.9%) |
| 45 to 54 Years | 1,113 (14.6%) | 6,347 (83.2%) |
| 55 to 64 Years | 1,590 (19.8%) | 6,676 (82.9%) |
| 65 to 74 Years | 7,512 (94.6%) | 5,183 (65.2%) |
| 75 Years and over | 5,050 (97.0%) | 3,977 (76.4%) |
| Total | 21,246 (40.2%) | 39,907 (75.6%) |
Disability Status by Sex by Age in Novato
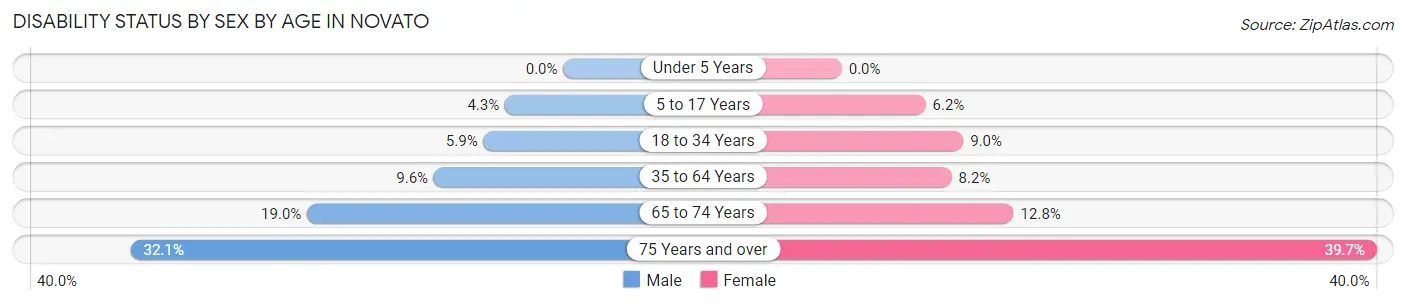
| Age Bracket | Male | Female |
| Under 5 Years | 0 (0.0%) | 0 (0.0%) |
| 5 to 17 Years | 189 (4.3%) | 229 (6.2%) |
| 18 to 34 Years | 223 (5.9%) | 347 (9.0%) |
| 35 to 64 Years | 1,089 (9.6%) | 835 (8.2%) |
| 65 to 74 Years | 660 (19.0%) | 571 (12.8%) |
| 75 Years and over | 810 (32.1%) | 1,067 (39.7%) |
Disability Class by Sex by Age in Novato
Disability Class: Hearing Difficulty
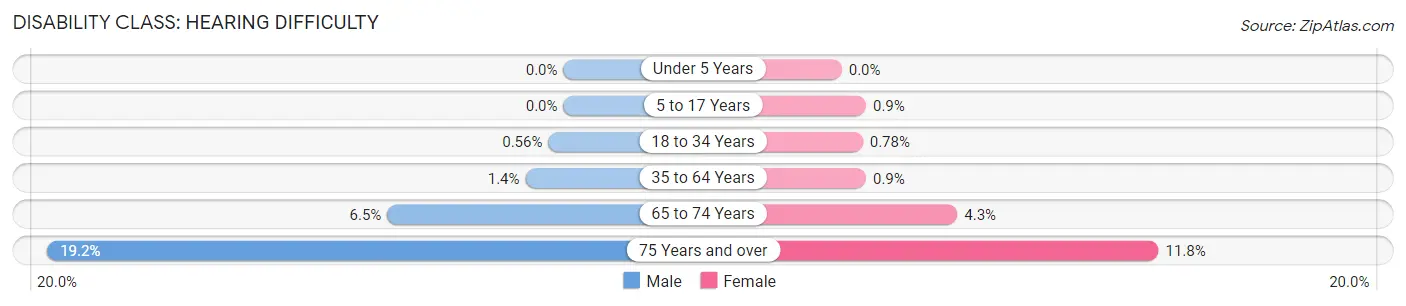
| Age Bracket | Male | Female |
| Under 5 Years | 0 (0.0%) | 0 (0.0%) |
| 5 to 17 Years | 0 (0.0%) | 33 (0.9%) |
| 18 to 34 Years | 21 (0.6%) | 30 (0.8%) |
| 35 to 64 Years | 160 (1.4%) | 92 (0.9%) |
| 65 to 74 Years | 227 (6.5%) | 192 (4.3%) |
| 75 Years and over | 483 (19.2%) | 316 (11.8%) |
Disability Class: Vision Difficulty
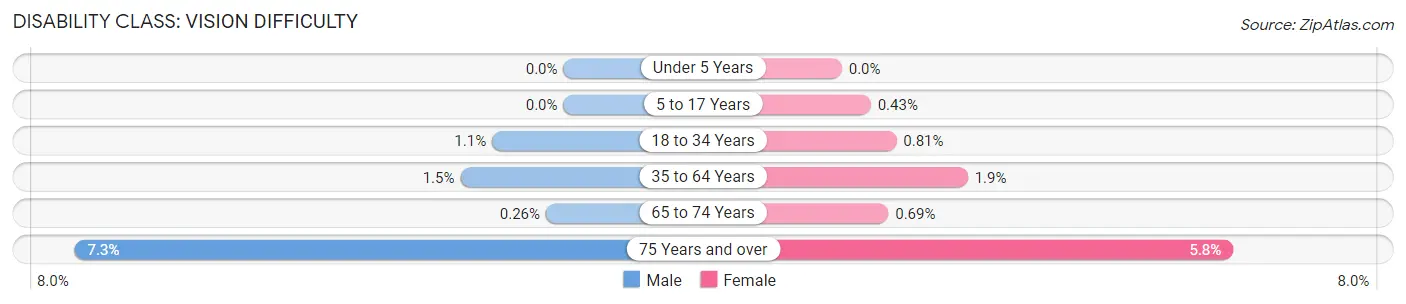
| Age Bracket | Male | Female |
| Under 5 Years | 0 (0.0%) | 0 (0.0%) |
| 5 to 17 Years | 0 (0.0%) | 16 (0.4%) |
| 18 to 34 Years | 40 (1.1%) | 31 (0.8%) |
| 35 to 64 Years | 173 (1.5%) | 191 (1.9%) |
| 65 to 74 Years | 9 (0.3%) | 31 (0.7%) |
| 75 Years and over | 183 (7.3%) | 156 (5.8%) |
Disability Class: Cognitive Difficulty
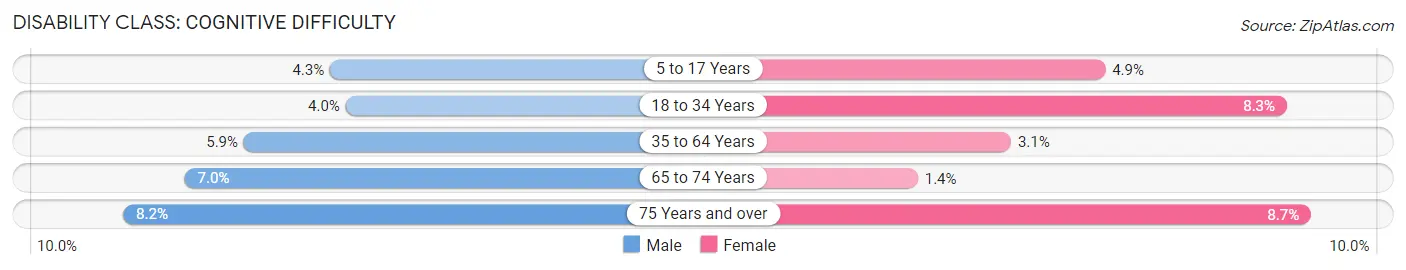
| Age Bracket | Male | Female |
| 5 to 17 Years | 189 (4.3%) | 180 (4.9%) |
| 18 to 34 Years | 152 (4.0%) | 318 (8.3%) |
| 35 to 64 Years | 672 (5.9%) | 322 (3.1%) |
| 65 to 74 Years | 244 (7.0%) | 63 (1.4%) |
| 75 Years and over | 206 (8.2%) | 234 (8.7%) |
Disability Class: Ambulatory Difficulty
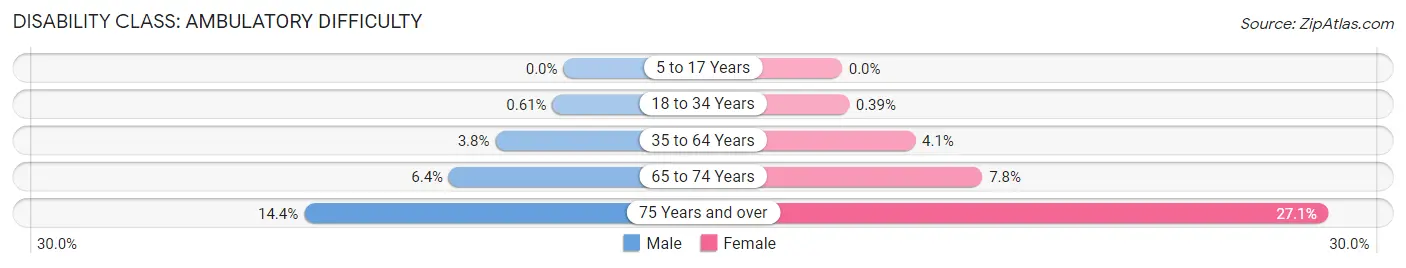
| Age Bracket | Male | Female |
| 5 to 17 Years | 0 (0.0%) | 0 (0.0%) |
| 18 to 34 Years | 23 (0.6%) | 15 (0.4%) |
| 35 to 64 Years | 430 (3.8%) | 418 (4.1%) |
| 65 to 74 Years | 221 (6.4%) | 350 (7.8%) |
| 75 Years and over | 364 (14.4%) | 728 (27.1%) |
Disability Class: Self-Care Difficulty
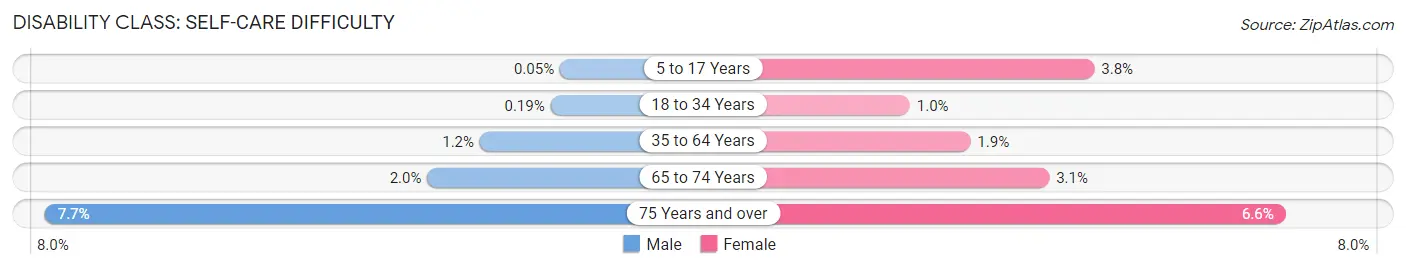
| Age Bracket | Male | Female |
| 5 to 17 Years | 2 (0.1%) | 138 (3.7%) |
| 18 to 34 Years | 7 (0.2%) | 39 (1.0%) |
| 35 to 64 Years | 140 (1.2%) | 196 (1.9%) |
| 65 to 74 Years | 70 (2.0%) | 138 (3.1%) |
| 75 Years and over | 194 (7.7%) | 177 (6.6%) |
Technology Access in Novato
Computing Device Access in Novato
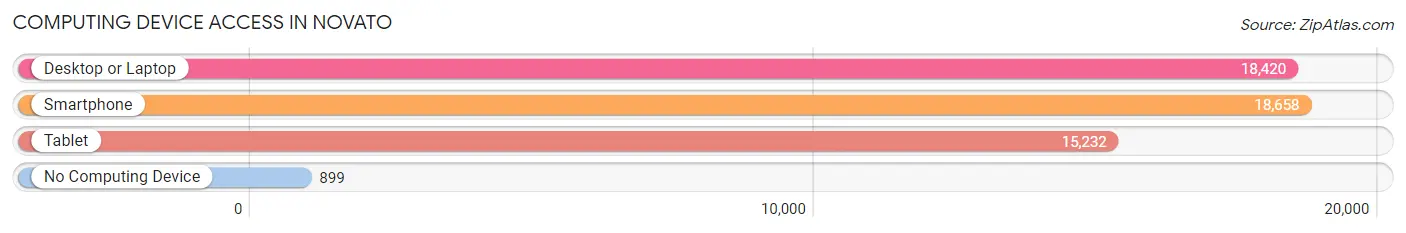
| Device Type | # Households | % Households |
| Desktop or Laptop | 18,420 | 88.1% |
| Smartphone | 18,658 | 89.3% |
| Tablet | 15,232 | 72.9% |
| No Computing Device | 899 | 4.3% |
| Total | 20,898 | 100.0% |
Internet Access in Novato
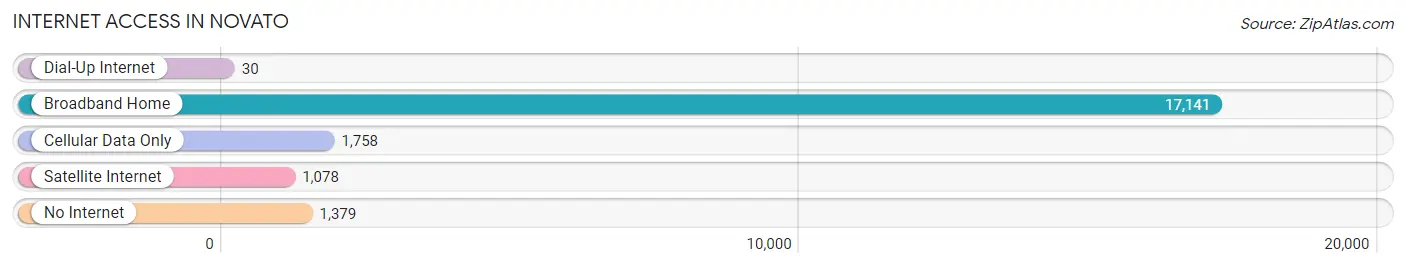
| Internet Type | # Households | % Households |
| Dial-Up Internet | 30 | 0.1% |
| Broadband Home | 17,141 | 82.0% |
| Cellular Data Only | 1,758 | 8.4% |
| Satellite Internet | 1,078 | 5.2% |
| No Internet | 1,379 | 6.6% |
| Total | 20,898 | 100.0% |
Novato Summary
Novato is a city located in Marin County, California, United States. It is located in the North Bay region of the San Francisco Bay Area, approximately 10 miles (16 km) northwest of San Rafael and about 30 miles (48 km) north of San Francisco. As of the 2010 United States Census, the population was 51,904. Novato is the largest city and the county seat of Marin County.
Geography
Novato is located in the North Bay region of the San Francisco Bay Area, approximately 10 miles (16 km) northwest of San Rafael and about 30 miles (48 km) north of San Francisco. It is situated at an elevation of 82 feet (25 m) above sea level. The city is located on the San Francisco Bay, and is bordered by the cities of San Rafael to the east, Ignacio to the south, and Petaluma to the west. The city is also bordered by the unincorporated areas of Marinwood and Lucas Valley-Marinwood to the north, and by the San Pablo Bay National Wildlife Refuge to the northwest.
Novato is located in the San Francisco Bay Area, and is part of the North Bay region. The city is located on the San Francisco Bay, and is bordered by the cities of San Rafael to the east, Ignacio to the south, and Petaluma to the west. The city is also bordered by the unincorporated areas of Marinwood and Lucas Valley-Marinwood to the north, and by the San Pablo Bay National Wildlife Refuge to the northwest.
The city of Novato is located in the San Francisco Bay Area, and is part of the North Bay region. The city is located on the San Francisco Bay, and is bordered by the cities of San Rafael to the east, Ignacio to the south, and Petaluma to the west. The city is also bordered by the unincorporated areas of Marinwood and Lucas Valley-Marinwood to the north, and by the San Pablo Bay National Wildlife Refuge to the northwest.
The city of Novato is located in the San Francisco Bay Area, and is part of the North Bay region. The city is located on the San Francisco Bay, and is bordered by the cities of San Rafael to the east, Ignacio to the south, and Petaluma to the west. The city is also bordered by the unincorporated areas of Marinwood and Lucas Valley-Marinwood to the north, and by the San Pablo Bay National Wildlife Refuge to the northwest.
The city of Novato is located in the San Francisco Bay Area, and is part of the North Bay region. The city is located on the San Francisco Bay, and is bordered by the cities of San Rafael to the east, Ignacio to the south, and Petaluma to the west. The city is also bordered by the unincorporated areas of Marinwood and Lucas Valley-Marinwood to the north, and by the San Pablo Bay National Wildlife Refuge to the northwest.
The city of Novato is located in the San Francisco Bay Area, and is part of the North Bay region. The city is located on the San Francisco Bay, and is bordered by the cities of San Rafael to the east, Ignacio to the south, and Petaluma to the west. The city is also bordered by the unincorporated areas of Marinwood and Lucas Valley-Marinwood to the north, and by the San Pablo Bay National Wildlife Refuge to the northwest.
The city of Novato is located in the San Francisco Bay Area, and is part of the North Bay region. The city is located on the San Francisco Bay, and is bordered by the cities of San Rafael to the east, Ignacio to the south, and Petaluma to the west. The city is also bordered by the unincorporated areas of Marinwood and Lucas Valley-Marinwood to the north, and by the San Pablo Bay National Wildlife Refuge to the northwest.
History
Novato was originally inhabited by the Coast Miwok Native American tribe. The first European settlers arrived in the area in the late 1700s, and the town was officially founded in 1839. The town was originally called Novato Creek, and was later renamed Novato in 1856.
The town grew rapidly in the late 1800s and early 1900s, and was incorporated as a city in 1960. The city has experienced significant growth since then, and is now home to a population of over 51,000 people.
Economy
Novato is home to a diverse economy, with a variety of industries represented in the city. The largest employers in the city are the Novato Unified School District, the County of Marin, and the City of Novato. Other major employers include the Novato Community Hospital, the Marin County Office of Education, and the Novato Fire Protection District.
The city is also home to a number of retail and service businesses, including a number of restaurants, banks, and other businesses. The city is also home to a number of technology companies, including Autodesk, Inc., and the Novato-based software company, Autodesk.
Demographics
As of the 2010 United States Census, the population of Novato was 51,904. The racial makeup of the city was 77.3% White, 8.2% Asian, 6.2% Hispanic or Latino, 5.2% African American, 0.7% Native American, 0.2% Pacific Islander, and 2.4% from other races.
The median household income in Novato was $90,845 in 2019, and the median home value was $817,000. The city has a high rate of homeownership, with 73.3% of residents owning their homes. The city also has a high rate of educational attainment, with 87.2% of residents having at least a high school diploma, and 44.2% having a bachelor's degree or higher.
Common Questions
What is Per Capita Income in Novato?
Per Capita income in Novato is $62,407.
What is the Median Family Income in Novato?
Median Family Income in Novato is $143,567.
What is the Median Household income in Novato?
Median Household Income in Novato is $110,948.
What is Income or Wage Gap in Novato?
Income or Wage Gap in Novato is 29.0%.
Women in Novato earn 71.0 cents for every dollar earned by a man.
What is Inequality or Gini Index in Novato?
Inequality or Gini Index in Novato is 0.46.
What is the Total Population of Novato?
Total Population of Novato is 53,055.
What is the Total Male Population of Novato?
Total Male Population of Novato is 26,829.
What is the Total Female Population of Novato?
Total Female Population of Novato is 26,226.
What is the Ratio of Males per 100 Females in Novato?
There are 102.30 Males per 100 Females in Novato.
What is the Ratio of Females per 100 Males in Novato?
There are 97.75 Females per 100 Males in Novato.
What is the Median Population Age in Novato?
Median Population Age in Novato is 48.6 Years.
What is the Average Family Size in Novato
Average Family Size in Novato is 3.0 People.
What is the Average Household Size in Novato
Average Household Size in Novato is 2.5 People.
How Large is the Labor Force in Novato?
There are 27,087 People in the Labor Forcein in Novato.
What is the Percentage of People in the Labor Force in Novato?
61.3% of People are in the Labor Force in Novato.
What is the Unemployment Rate in Novato?
Unemployment Rate in Novato is 6.5%.