Baldwin Park, CA Map & Demographics
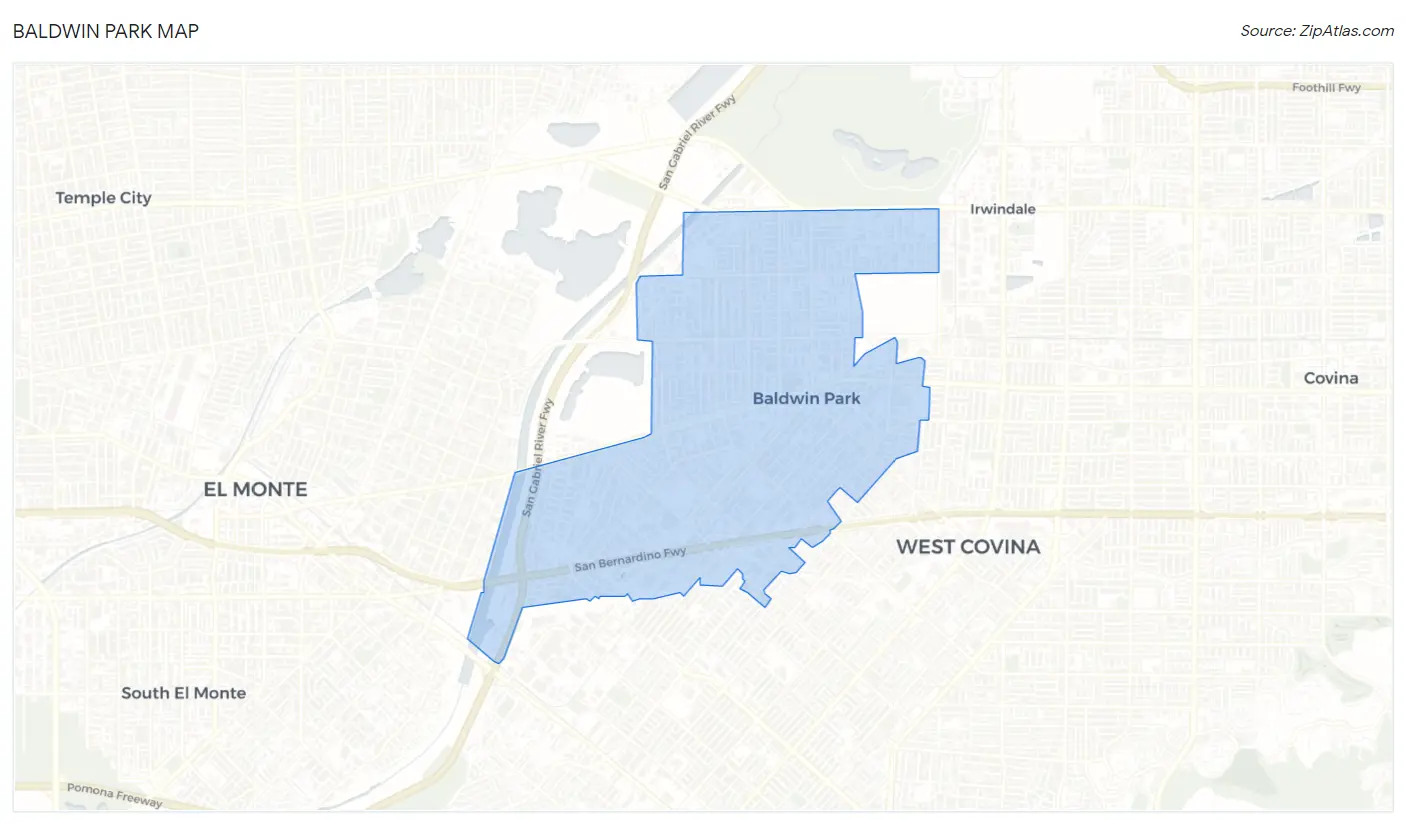
Baldwin Park Map
Baldwin Park Overview
$24,664
PER CAPITA INCOME
$75,229
AVG FAMILY INCOME
$76,002
AVG HOUSEHOLD INCOME
20.7%
WAGE / INCOME GAP [ % ]
79.3¢/ $1
WAGE / INCOME GAP [ $ ]
$10,003
FAMILY INCOME DEFICIT
0.41
INEQUALITY / GINI INDEX
71,692
TOTAL POPULATION
35,696
MALE POPULATION
35,996
FEMALE POPULATION
99.17
MALES / 100 FEMALES
100.84
FEMALES / 100 MALES
37.1
MEDIAN AGE
4.2
AVG FAMILY SIZE
4.0
AVG HOUSEHOLD SIZE
36,443
LABOR FORCE [ PEOPLE ]
62.4%
PERCENT IN LABOR FORCE
7.1%
UNEMPLOYMENT RATE
Baldwin Park Zip Codes
Baldwin Park Area Codes
Income in Baldwin Park
Income Overview in Baldwin Park
Per Capita Income in Baldwin Park is $24,664, while median incomes of families and households are $75,229 and $76,002 respectively.
| Characteristic | Number | Measure |
| Per Capita Income | 71,692 | $24,664 |
| Median Family Income | 15,393 | $75,229 |
| Mean Family Income | 15,393 | $90,346 |
| Median Household Income | 18,022 | $76,002 |
| Mean Household Income | 18,022 | $91,854 |
| Income Deficit | 15,393 | $10,003 |
| Wage / Income Gap (%) | 71,692 | 20.67% |
| Wage / Income Gap ($) | 71,692 | 79.33¢ per $1 |
| Gini / Inequality Index | 71,692 | 0.41 |
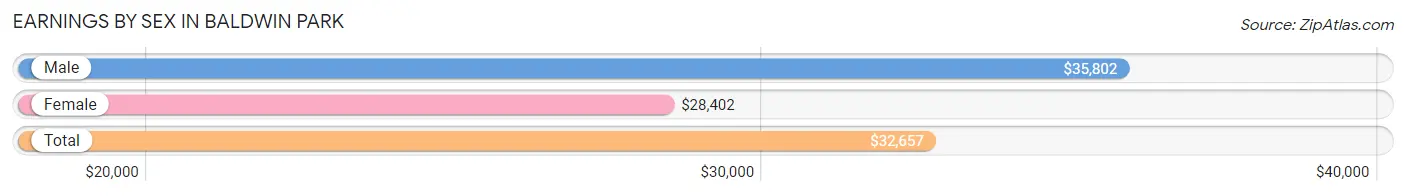
Earnings by Sex in Baldwin Park
Average Earnings in Baldwin Park are $32,657, $35,802 for men and $28,402 for women, a difference of 20.7%.
| Sex | Number | Average Earnings |
| Male | 20,136 (54.9%) | $35,802 |
| Female | 16,519 (45.1%) | $28,402 |
| Total | 36,655 (100.0%) | $32,657 |
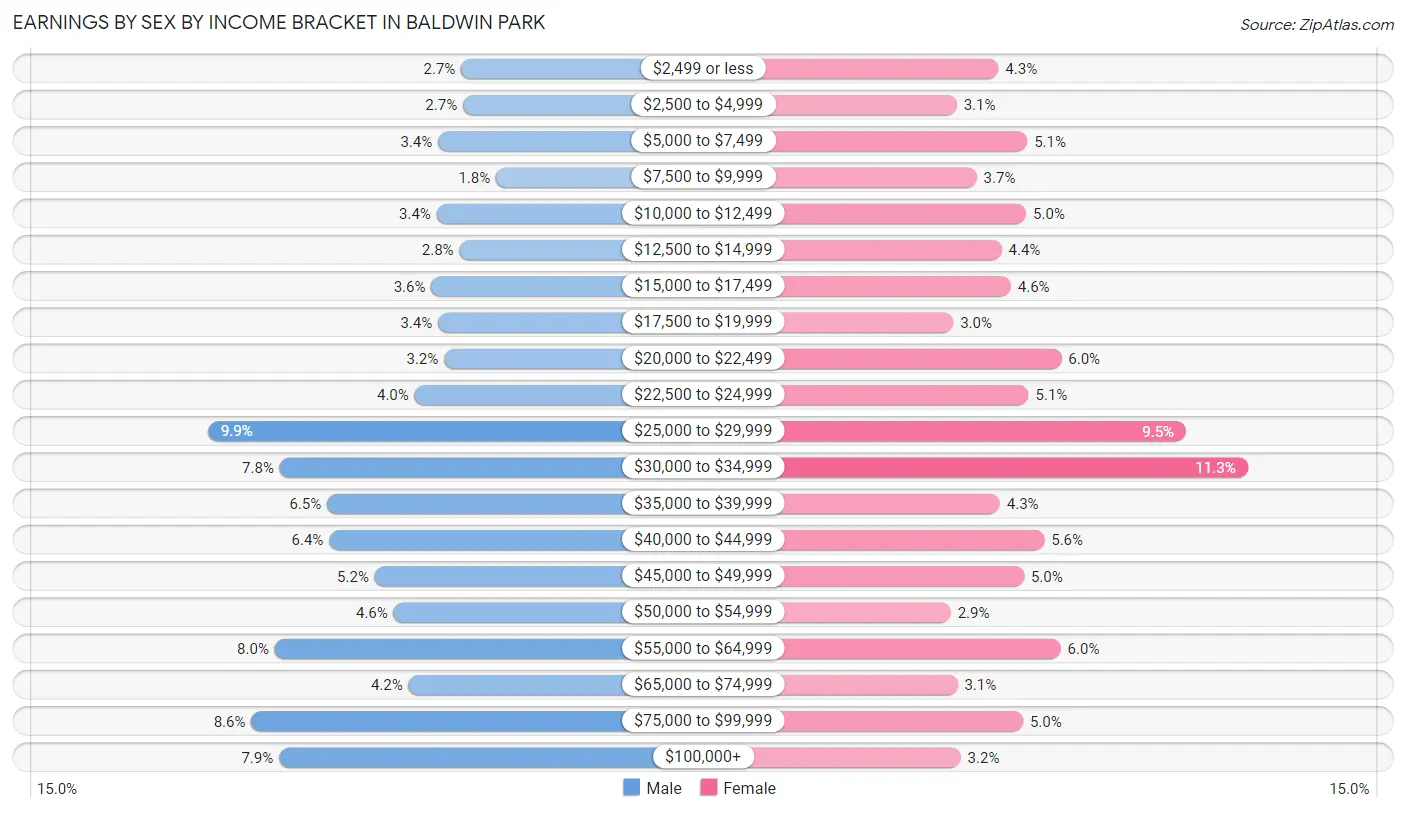
Earnings by Sex by Income Bracket in Baldwin Park
The most common earnings brackets in Baldwin Park are $25,000 to $29,999 for men (1,983 | 9.9%) and $30,000 to $34,999 for women (1,860 | 11.3%).
| Income | Male | Female |
| $2,499 or less | 550 (2.7%) | 703 (4.3%) |
| $2,500 to $4,999 | 540 (2.7%) | 511 (3.1%) |
| $5,000 to $7,499 | 680 (3.4%) | 837 (5.1%) |
| $7,500 to $9,999 | 352 (1.8%) | 603 (3.6%) |
| $10,000 to $12,499 | 689 (3.4%) | 833 (5.0%) |
| $12,500 to $14,999 | 560 (2.8%) | 719 (4.3%) |
| $15,000 to $17,499 | 719 (3.6%) | 762 (4.6%) |
| $17,500 to $19,999 | 680 (3.4%) | 494 (3.0%) |
| $20,000 to $22,499 | 647 (3.2%) | 996 (6.0%) |
| $22,500 to $24,999 | 814 (4.0%) | 844 (5.1%) |
| $25,000 to $29,999 | 1,983 (9.9%) | 1,575 (9.5%) |
| $30,000 to $34,999 | 1,576 (7.8%) | 1,860 (11.3%) |
| $35,000 to $39,999 | 1,308 (6.5%) | 710 (4.3%) |
| $40,000 to $44,999 | 1,296 (6.4%) | 916 (5.6%) |
| $45,000 to $49,999 | 1,039 (5.2%) | 822 (5.0%) |
| $50,000 to $54,999 | 932 (4.6%) | 483 (2.9%) |
| $55,000 to $64,999 | 1,605 (8.0%) | 992 (6.0%) |
| $65,000 to $74,999 | 848 (4.2%) | 513 (3.1%) |
| $75,000 to $99,999 | 1,737 (8.6%) | 818 (5.0%) |
| $100,000+ | 1,581 (7.9%) | 528 (3.2%) |
| Total | 20,136 (100.0%) | 16,519 (100.0%) |
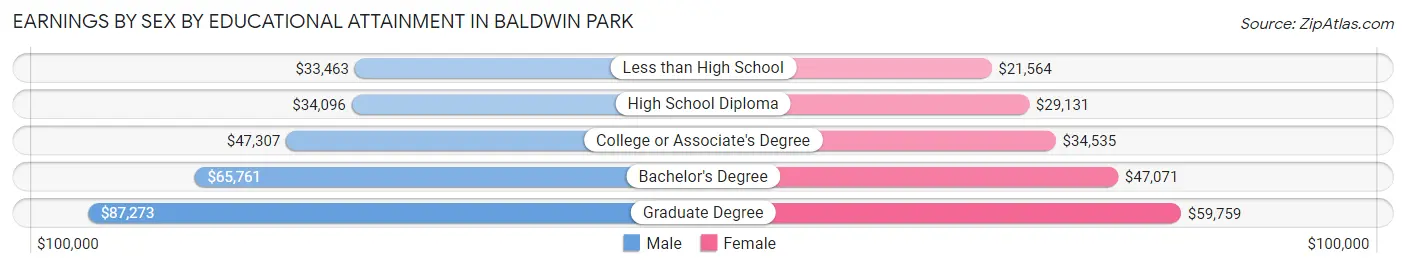
Earnings by Sex by Educational Attainment in Baldwin Park
Average earnings in Baldwin Park are $40,304 for men and $31,903 for women, a difference of 20.8%. Men with an educational attainment of graduate degree enjoy the highest average annual earnings of $87,273, while those with less than high school education earn the least with $33,463. Women with an educational attainment of graduate degree earn the most with the average annual earnings of $59,759, while those with less than high school education have the smallest earnings of $21,564.
| Educational Attainment | Male Income | Female Income |
| Less than High School | $33,463 | $21,564 |
| High School Diploma | $34,096 | $29,131 |
| College or Associate's Degree | $47,307 | $34,535 |
| Bachelor's Degree | $65,761 | $47,071 |
| Graduate Degree | $87,273 | $59,759 |
| Total | $40,304 | $31,903 |
Family Income in Baldwin Park
Family Income Brackets in Baldwin Park
According to the Baldwin Park family income data, there are 3,140 families falling into the $50,000 to $74,999 income range, which is the most common income bracket and makes up 20.4% of all families. Conversely, the less than $10,000 income bracket is the least frequent group with only 354 families (2.3%) belonging to this category.
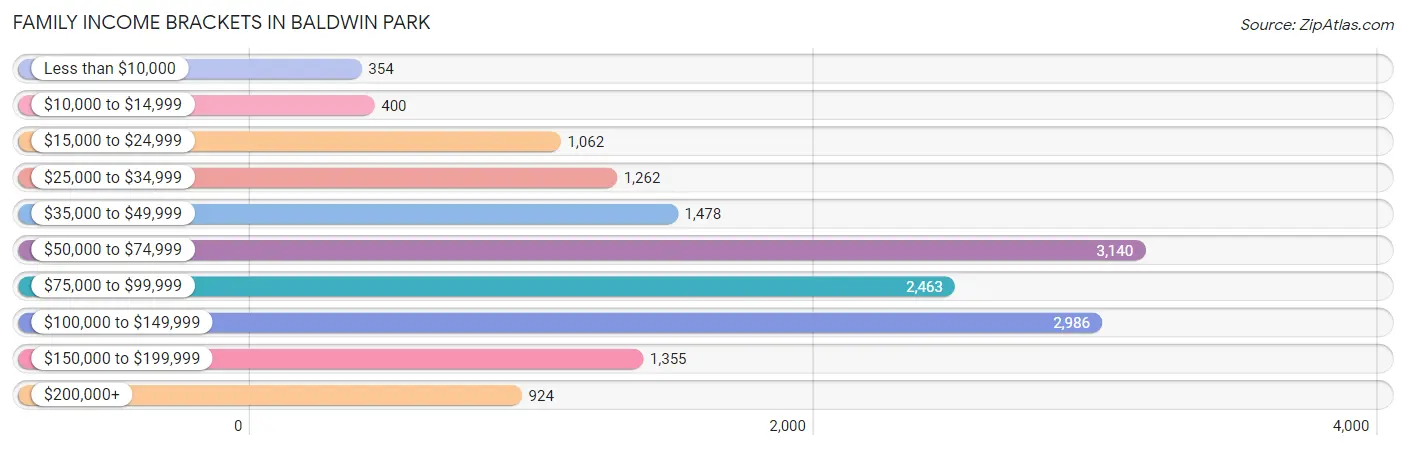
| Income Bracket | # Families | % Families |
| Less than $10,000 | 354 | 2.3% |
| $10,000 to $14,999 | 400 | 2.6% |
| $15,000 to $24,999 | 1,062 | 6.9% |
| $25,000 to $34,999 | 1,262 | 8.2% |
| $35,000 to $49,999 | 1,478 | 9.6% |
| $50,000 to $74,999 | 3,140 | 20.4% |
| $75,000 to $99,999 | 2,463 | 16.0% |
| $100,000 to $149,999 | 2,986 | 19.4% |
| $150,000 to $199,999 | 1,355 | 8.8% |
| $200,000+ | 924 | 6.0% |
Family Income by Famaliy Size in Baldwin Park
7+ person families (1,087 | 7.1%) account for the highest median family income in Baldwin Park with $123,545 per family, while 3-person families (3,177 | 20.6%) have the highest median income of $24,819 per family member.
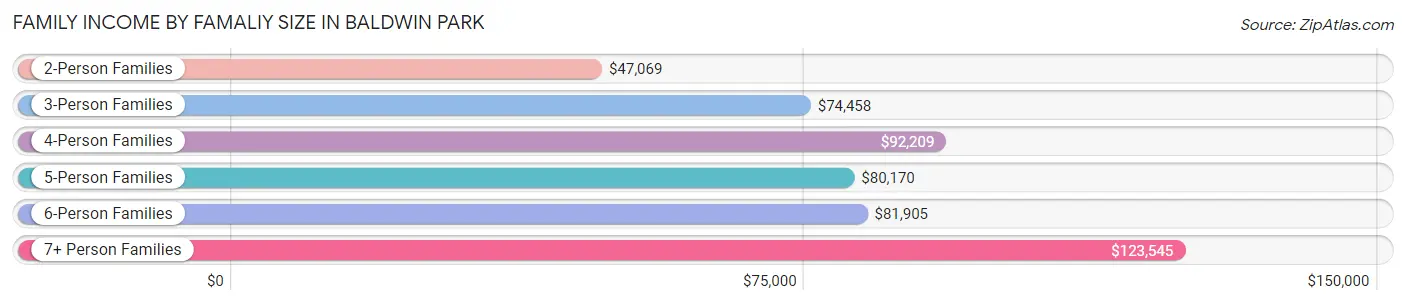
| Income Bracket | # Families | Median Income |
| 2-Person Families | 3,746 (24.3%) | $47,069 |
| 3-Person Families | 3,177 (20.6%) | $74,458 |
| 4-Person Families | 3,596 (23.4%) | $92,209 |
| 5-Person Families | 2,475 (16.1%) | $80,170 |
| 6-Person Families | 1,312 (8.5%) | $81,905 |
| 7+ Person Families | 1,087 (7.1%) | $123,545 |
| Total | 15,393 (100.0%) | $75,229 |
Family Income by Number of Earners in Baldwin Park
The median family income in Baldwin Park is $75,229, with families comprising 3+ earners (4,306) having the highest median family income of $123,307, while families with no earners (1,363) have the lowest median family income of $26,127, accounting for 28.0% and 8.8% of families, respectively.
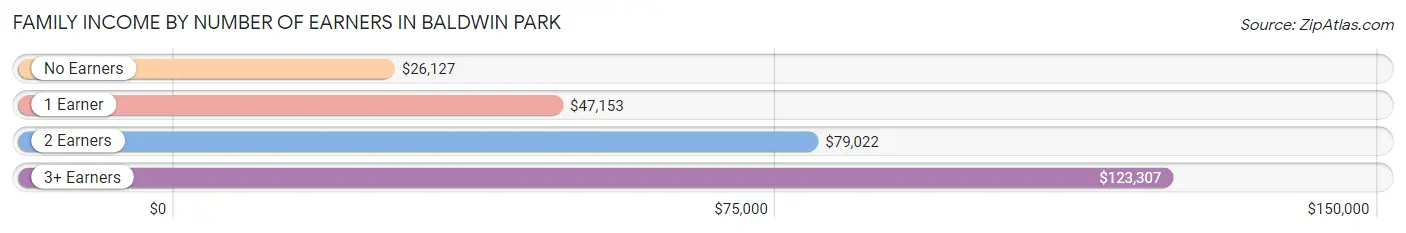
| Number of Earners | # Families | Median Income |
| No Earners | 1,363 (8.8%) | $26,127 |
| 1 Earner | 4,333 (28.1%) | $47,153 |
| 2 Earners | 5,391 (35.0%) | $79,022 |
| 3+ Earners | 4,306 (28.0%) | $123,307 |
| Total | 15,393 (100.0%) | $75,229 |
Household Income in Baldwin Park
Household Income Brackets in Baldwin Park
With 3,568 households falling in the category, the $100,000 to $149,999 income range is the most frequent in Baldwin Park, accounting for 19.8% of all households. In contrast, only 559 households (3.1%) fall into the less than $10,000 income bracket, making it the least populous group.
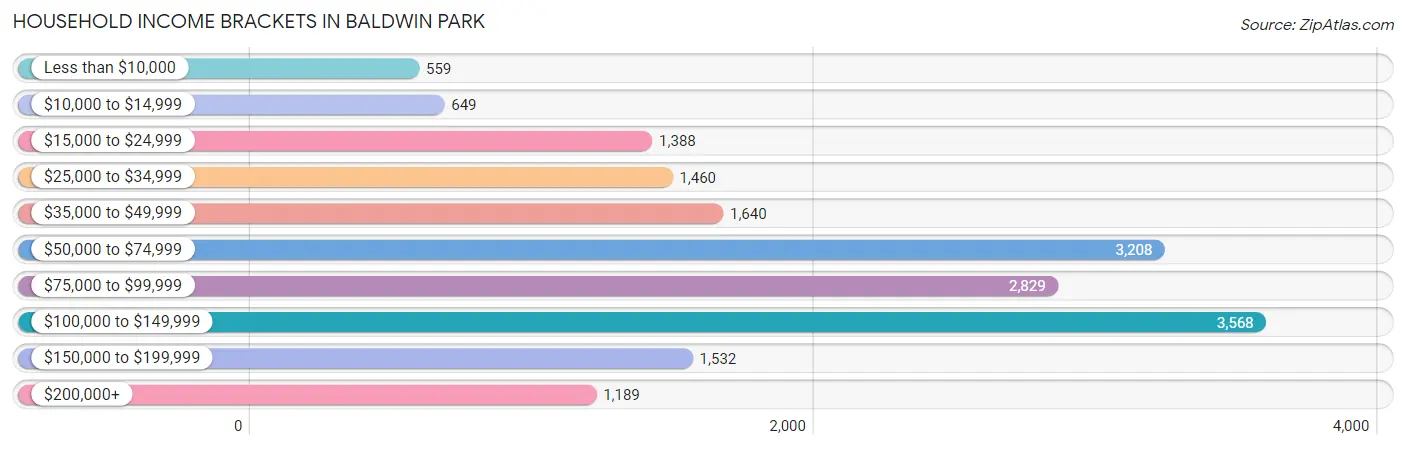
| Income Bracket | # Households | % Households |
| Less than $10,000 | 559 | 3.1% |
| $10,000 to $14,999 | 649 | 3.6% |
| $15,000 to $24,999 | 1,388 | 7.7% |
| $25,000 to $34,999 | 1,460 | 8.1% |
| $35,000 to $49,999 | 1,640 | 9.1% |
| $50,000 to $74,999 | 3,208 | 17.8% |
| $75,000 to $99,999 | 2,829 | 15.7% |
| $100,000 to $149,999 | 3,568 | 19.8% |
| $150,000 to $199,999 | 1,532 | 8.5% |
| $200,000+ | 1,189 | 6.6% |
Household Income by Householder Age in Baldwin Park
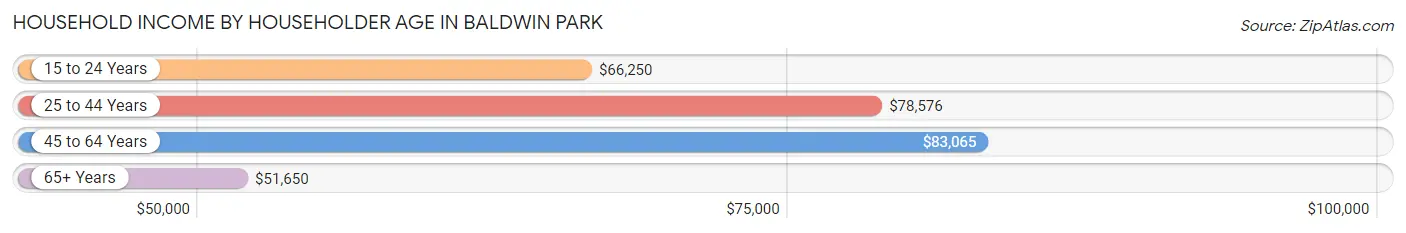
The median household income in Baldwin Park is $76,002, with the highest median household income of $83,065 found in the 45 to 64 years age bracket for the primary householder. A total of 7,890 households (43.8%) fall into this category. Meanwhile, the 65+ years age bracket for the primary householder has the lowest median household income of $51,650, with 4,096 households (22.7%) in this group.
| Income Bracket | # Households | Median Income |
| 15 to 24 Years | 463 (2.6%) | $66,250 |
| 25 to 44 Years | 5,573 (30.9%) | $78,576 |
| 45 to 64 Years | 7,890 (43.8%) | $83,065 |
| 65+ Years | 4,096 (22.7%) | $51,650 |
| Total | 18,022 (100.0%) | $76,002 |
Poverty in Baldwin Park
Income Below Poverty by Sex and Age in Baldwin Park
With 13.0% poverty level for males and 14.5% for females among the residents of Baldwin Park, 15 year old males and 15 year old females are the most vulnerable to poverty, with 161 males (36.7%) and 139 females (35.8%) in their respective age groups living below the poverty level.
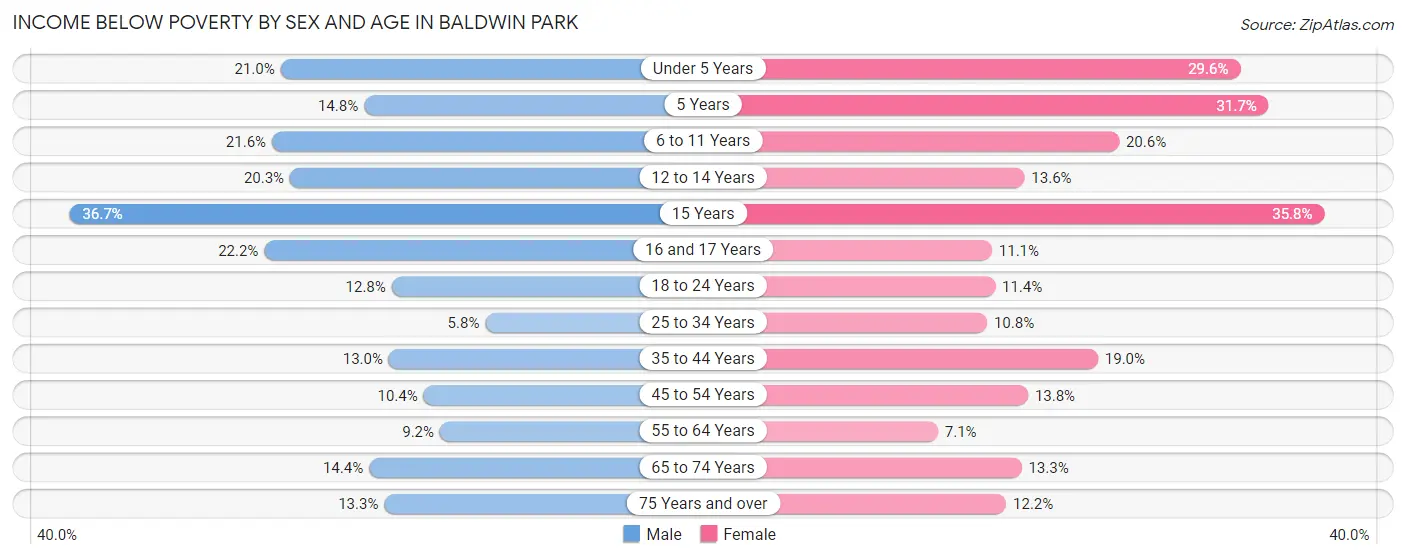
| Age Bracket | Male | Female |
| Under 5 Years | 362 (21.0%) | 601 (29.6%) |
| 5 Years | 33 (14.8%) | 77 (31.7%) |
| 6 to 11 Years | 543 (21.6%) | 485 (20.6%) |
| 12 to 14 Years | 328 (20.3%) | 215 (13.6%) |
| 15 Years | 161 (36.7%) | 139 (35.8%) |
| 16 and 17 Years | 227 (22.2%) | 100 (11.1%) |
| 18 to 24 Years | 556 (12.8%) | 464 (11.4%) |
| 25 to 34 Years | 316 (5.8%) | 521 (10.8%) |
| 35 to 44 Years | 610 (13.0%) | 873 (19.0%) |
| 45 to 54 Years | 531 (10.4%) | 691 (13.8%) |
| 55 to 64 Years | 393 (9.2%) | 309 (7.1%) |
| 65 to 74 Years | 361 (14.4%) | 422 (13.3%) |
| 75 Years and over | 199 (13.3%) | 273 (12.2%) |
| Total | 4,620 (13.0%) | 5,170 (14.5%) |
Income Above Poverty by Sex and Age in Baldwin Park
According to the poverty statistics in Baldwin Park, males aged 25 to 34 years and females aged 55 to 64 years are the age groups that are most secure financially, with 94.2% of males and 92.9% of females in these age groups living above the poverty line.
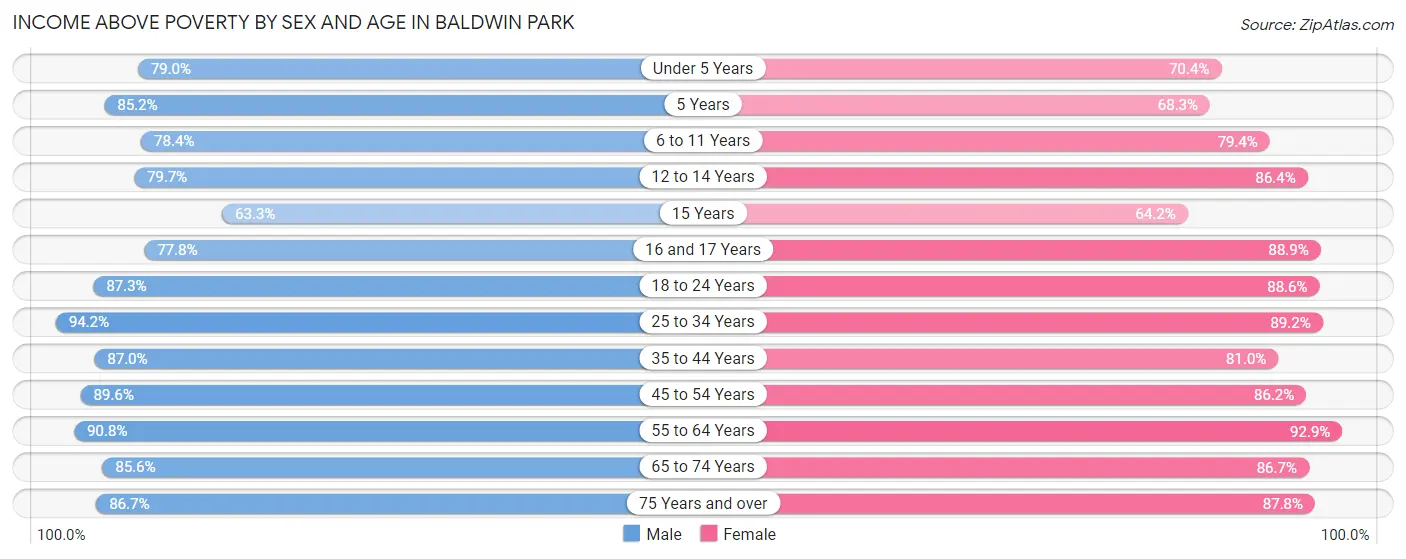
| Age Bracket | Male | Female |
| Under 5 Years | 1,362 (79.0%) | 1,431 (70.4%) |
| 5 Years | 190 (85.2%) | 166 (68.3%) |
| 6 to 11 Years | 1,966 (78.4%) | 1,872 (79.4%) |
| 12 to 14 Years | 1,288 (79.7%) | 1,370 (86.4%) |
| 15 Years | 278 (63.3%) | 249 (64.2%) |
| 16 and 17 Years | 795 (77.8%) | 798 (88.9%) |
| 18 to 24 Years | 3,806 (87.3%) | 3,614 (88.6%) |
| 25 to 34 Years | 5,128 (94.2%) | 4,312 (89.2%) |
| 35 to 44 Years | 4,098 (87.0%) | 3,719 (81.0%) |
| 45 to 54 Years | 4,587 (89.6%) | 4,309 (86.2%) |
| 55 to 64 Years | 3,893 (90.8%) | 4,027 (92.9%) |
| 65 to 74 Years | 2,141 (85.6%) | 2,741 (86.7%) |
| 75 Years and over | 1,297 (86.7%) | 1,964 (87.8%) |
| Total | 30,829 (87.0%) | 30,572 (85.5%) |
Income Below Poverty Among Married-Couple Families in Baldwin Park
The poverty statistics for married-couple families in Baldwin Park show that 10.7% or 1,000 of the total 9,380 families live below the poverty line. Families with 3 or 4 children have the highest poverty rate of 23.2%, comprising of 238 families. On the other hand, families with 5 or more children have the lowest poverty rate of 0.0%, which includes 0 families.
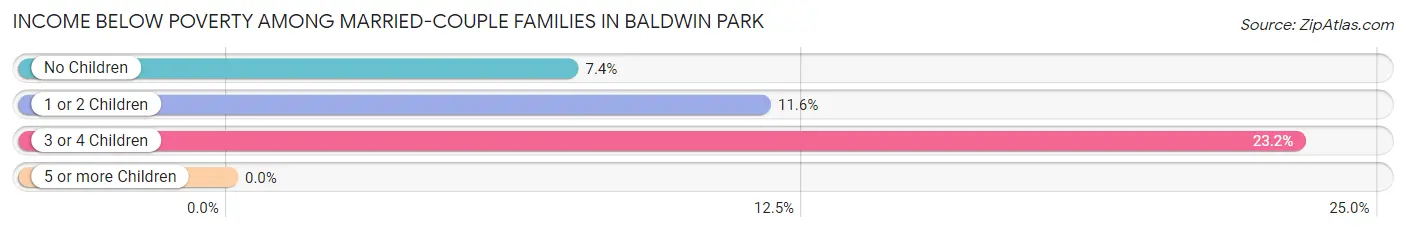
| Children | Above Poverty | Below Poverty |
| No Children | 4,510 (92.6%) | 361 (7.4%) |
| 1 or 2 Children | 3,056 (88.4%) | 401 (11.6%) |
| 3 or 4 Children | 787 (76.8%) | 238 (23.2%) |
| 5 or more Children | 27 (100.0%) | 0 (0.0%) |
| Total | 8,380 (89.3%) | 1,000 (10.7%) |
Income Below Poverty Among Single-Parent Households in Baldwin Park
According to the poverty data in Baldwin Park, 9.6% or 205 single-father households and 16.0% or 618 single-mother households are living below the poverty line. Among single-father households, those with 3 or 4 children have the highest poverty rate, with 66 households (38.2%) experiencing poverty. Likewise, among single-mother households, those with 5 or more children have the highest poverty rate, with 29 households (90.6%) falling below the poverty line.
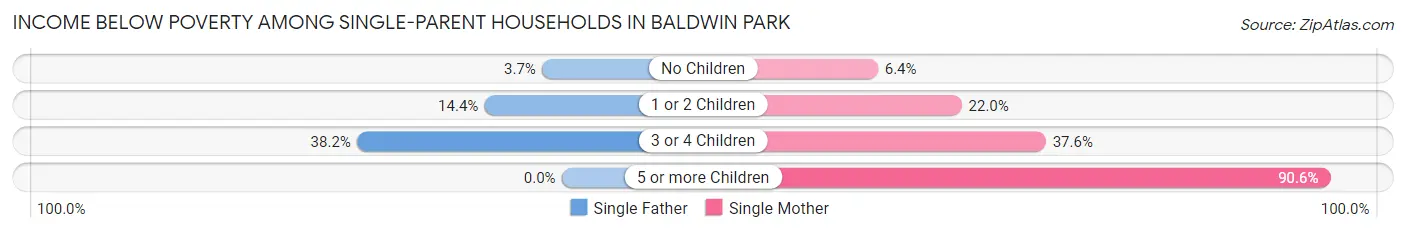
| Children | Single Father | Single Mother |
| No Children | 48 (3.7%) | 125 (6.4%) |
| 1 or 2 Children | 91 (14.4%) | 333 (22.0%) |
| 3 or 4 Children | 66 (38.2%) | 131 (37.6%) |
| 5 or more Children | 0 (0.0%) | 29 (90.6%) |
| Total | 205 (9.6%) | 618 (16.0%) |
Income Below Poverty Among Married-Couple vs Single-Parent Households in Baldwin Park
The poverty data for Baldwin Park shows that 1,000 of the married-couple family households (10.7%) and 823 of the single-parent households (13.7%) are living below the poverty level. Within the married-couple family households, those with 3 or 4 children have the highest poverty rate, with 238 households (23.2%) falling below the poverty line. Among the single-parent households, those with 5 or more children have the highest poverty rate, with 29 household (40.3%) living below poverty.
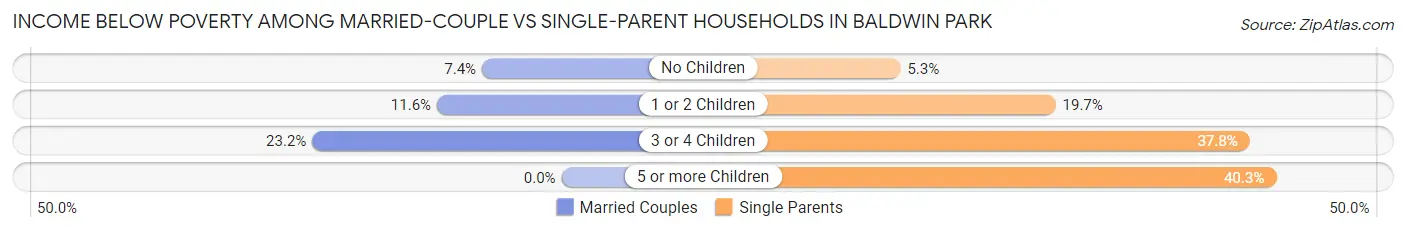
| Children | Married-Couple Families | Single-Parent Households |
| No Children | 361 (7.4%) | 173 (5.3%) |
| 1 or 2 Children | 401 (11.6%) | 424 (19.7%) |
| 3 or 4 Children | 238 (23.2%) | 197 (37.8%) |
| 5 or more Children | 0 (0.0%) | 29 (40.3%) |
| Total | 1,000 (10.7%) | 823 (13.7%) |
Race in Baldwin Park
The most populous races in Baldwin Park are Hispanic or Latino (52,169 | 72.8%), White / Caucasian (19,027 | 26.5%), and Some other Race (17,773 | 24.8%).
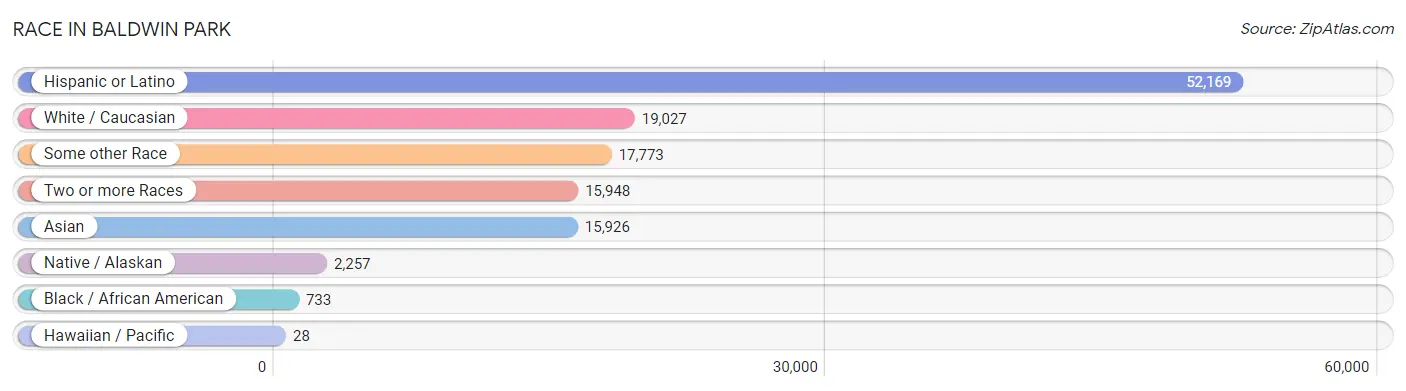
| Race | # Population | % Population |
| Asian | 15,926 | 22.2% |
| Black / African American | 733 | 1.0% |
| Hawaiian / Pacific | 28 | 0.0% |
| Hispanic or Latino | 52,169 | 72.8% |
| Native / Alaskan | 2,257 | 3.2% |
| White / Caucasian | 19,027 | 26.5% |
| Two or more Races | 15,948 | 22.3% |
| Some other Race | 17,773 | 24.8% |
| Total | 71,692 | 100.0% |
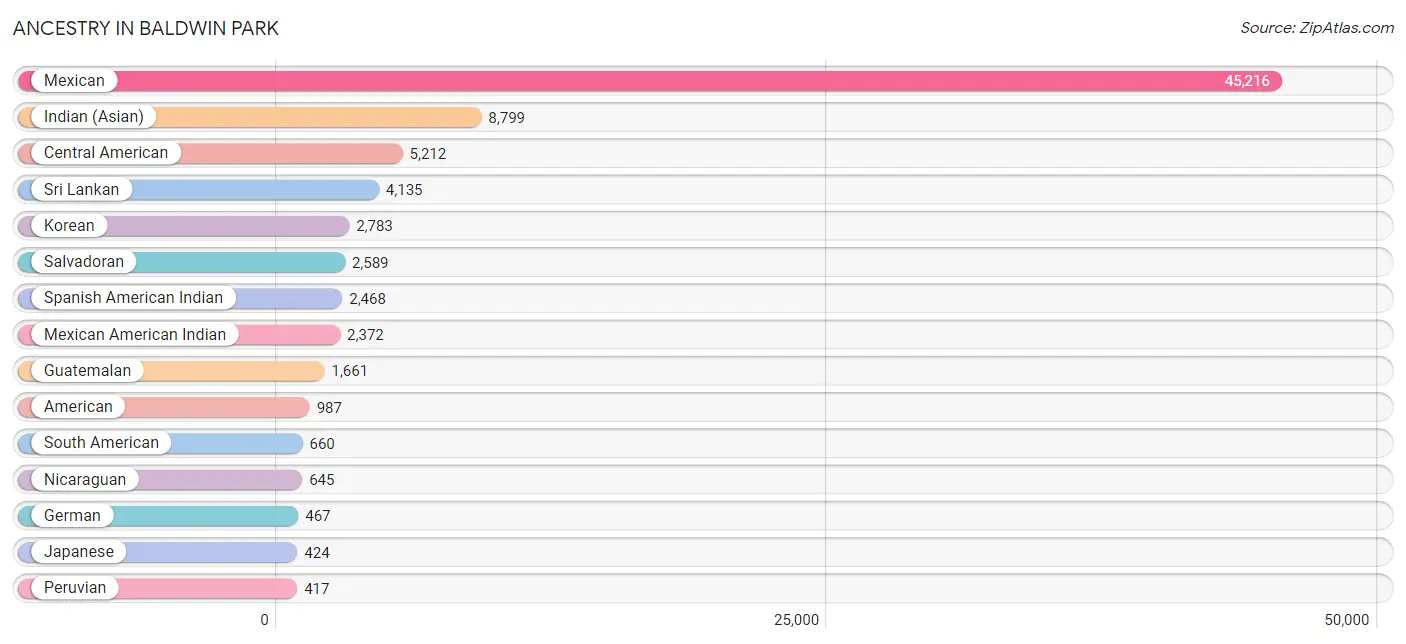
Ancestry in Baldwin Park
The most populous ancestries reported in Baldwin Park are Mexican (45,216 | 63.1%), Indian (Asian) (8,799 | 12.3%), Central American (5,212 | 7.3%), Sri Lankan (4,135 | 5.8%), and Korean (2,783 | 3.9%), together accounting for 92.3% of all Baldwin Park residents.
| Ancestry | # Population | % Population |
| African | 9 | 0.0% |
| American | 987 | 1.4% |
| Apache | 107 | 0.2% |
| Arab | 195 | 0.3% |
| Armenian | 27 | 0.0% |
| Basque | 7 | 0.0% |
| Bhutanese | 107 | 0.2% |
| Blackfeet | 21 | 0.0% |
| Brazilian | 3 | 0.0% |
| British | 10 | 0.0% |
| Burmese | 226 | 0.3% |
| Central American | 5,212 | 7.3% |
| Central American Indian | 142 | 0.2% |
| Cherokee | 4 | 0.0% |
| Chilean | 52 | 0.1% |
| Choctaw | 38 | 0.1% |
| Colombian | 86 | 0.1% |
| Costa Rican | 45 | 0.1% |
| Cuban | 26 | 0.0% |
| Czech | 2 | 0.0% |
| Danish | 85 | 0.1% |
| Dutch | 111 | 0.2% |
| Ecuadorian | 105 | 0.2% |
| Egyptian | 65 | 0.1% |
| English | 229 | 0.3% |
| European | 62 | 0.1% |
| Filipino | 304 | 0.4% |
| French | 116 | 0.2% |
| French Canadian | 17 | 0.0% |
| German | 467 | 0.6% |
| Greek | 8 | 0.0% |
| Guatemalan | 1,661 | 2.3% |
| Honduran | 235 | 0.3% |
| Hopi | 37 | 0.1% |
| Hungarian | 15 | 0.0% |
| Indian (Asian) | 8,799 | 12.3% |
| Indonesian | 374 | 0.5% |
| Irish | 340 | 0.5% |
| Italian | 276 | 0.4% |
| Jamaican | 65 | 0.1% |
| Japanese | 424 | 0.6% |
| Jordanian | 24 | 0.0% |
| Korean | 2,783 | 3.9% |
| Laotian | 17 | 0.0% |
| Lebanese | 10 | 0.0% |
| Malaysian | 228 | 0.3% |
| Mexican | 45,216 | 63.1% |
| Mexican American Indian | 2,372 | 3.3% |
| Mongolian | 17 | 0.0% |
| Navajo | 9 | 0.0% |
| Nicaraguan | 645 | 0.9% |
| Nigerian | 26 | 0.0% |
| Norwegian | 7 | 0.0% |
| Pakistani | 146 | 0.2% |
| Peruvian | 417 | 0.6% |
| Polish | 21 | 0.0% |
| Portuguese | 16 | 0.0% |
| Puerto Rican | 93 | 0.1% |
| Salvadoran | 2,589 | 3.6% |
| Samoan | 28 | 0.0% |
| Scandinavian | 4 | 0.0% |
| Scotch-Irish | 6 | 0.0% |
| Scottish | 62 | 0.1% |
| Slovak | 6 | 0.0% |
| South American | 660 | 0.9% |
| South American Indian | 20 | 0.0% |
| Spaniard | 98 | 0.1% |
| Spanish | 56 | 0.1% |
| Spanish American | 9 | 0.0% |
| Spanish American Indian | 2,468 | 3.4% |
| Sri Lankan | 4,135 | 5.8% |
| Subsaharan African | 35 | 0.1% |
| Swedish | 52 | 0.1% |
| Swiss | 19 | 0.0% |
| Syrian | 42 | 0.1% |
| Thai | 143 | 0.2% |
| Welsh | 7 | 0.0% | View All 77 Rows |
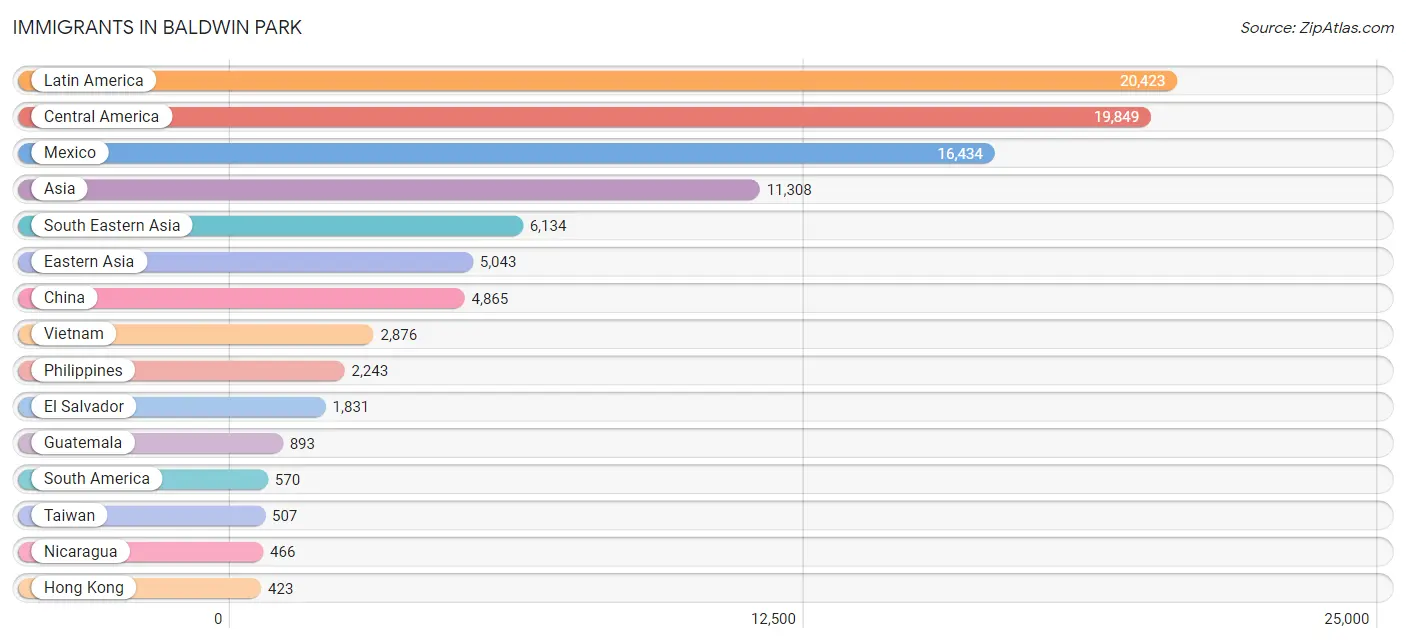
Immigrants in Baldwin Park
The most numerous immigrant groups reported in Baldwin Park came from Latin America (20,423 | 28.5%), Central America (19,849 | 27.7%), Mexico (16,434 | 22.9%), Asia (11,308 | 15.8%), and South Eastern Asia (6,134 | 8.6%), together accounting for 103.4% of all Baldwin Park residents.
| Immigration Origin | # Population | % Population |
| Africa | 29 | 0.0% |
| Argentina | 10 | 0.0% |
| Asia | 11,308 | 15.8% |
| Australia | 23 | 0.0% |
| Cambodia | 247 | 0.3% |
| Caribbean | 4 | 0.0% |
| Central America | 19,849 | 27.7% |
| Chile | 34 | 0.1% |
| China | 4,865 | 6.8% |
| Colombia | 86 | 0.1% |
| Costa Rica | 17 | 0.0% |
| Cuba | 4 | 0.0% |
| Denmark | 43 | 0.1% |
| Eastern Asia | 5,043 | 7.0% |
| Eastern Europe | 11 | 0.0% |
| Ecuador | 119 | 0.2% |
| Egypt | 29 | 0.0% |
| El Salvador | 1,831 | 2.5% |
| England | 10 | 0.0% |
| Europe | 129 | 0.2% |
| Germany | 46 | 0.1% |
| Guatemala | 893 | 1.3% |
| Honduras | 195 | 0.3% |
| Hong Kong | 423 | 0.6% |
| Hungary | 10 | 0.0% |
| India | 22 | 0.0% |
| Indonesia | 59 | 0.1% |
| Iran | 8 | 0.0% |
| Ireland | 8 | 0.0% |
| Israel | 4 | 0.0% |
| Japan | 3 | 0.0% |
| Jordan | 12 | 0.0% |
| Korea | 175 | 0.2% |
| Kuwait | 14 | 0.0% |
| Laos | 112 | 0.2% |
| Latin America | 20,423 | 28.5% |
| Lebanon | 12 | 0.0% |
| Malaysia | 61 | 0.1% |
| Mexico | 16,434 | 22.9% |
| Nicaragua | 466 | 0.6% |
| Northern Africa | 29 | 0.0% |
| Northern Europe | 72 | 0.1% |
| Oceania | 33 | 0.1% |
| Peru | 321 | 0.4% |
| Philippines | 2,243 | 3.1% |
| Romania | 1 | 0.0% |
| Singapore | 5 | 0.0% |
| South America | 570 | 0.8% |
| South Central Asia | 41 | 0.1% |
| South Eastern Asia | 6,134 | 8.6% |
| Sri Lanka | 11 | 0.0% |
| Syria | 42 | 0.1% |
| Taiwan | 507 | 0.7% |
| Thailand | 112 | 0.2% |
| Vietnam | 2,876 | 4.0% |
| Western Asia | 90 | 0.1% |
| Western Europe | 46 | 0.1% | View All 57 Rows |
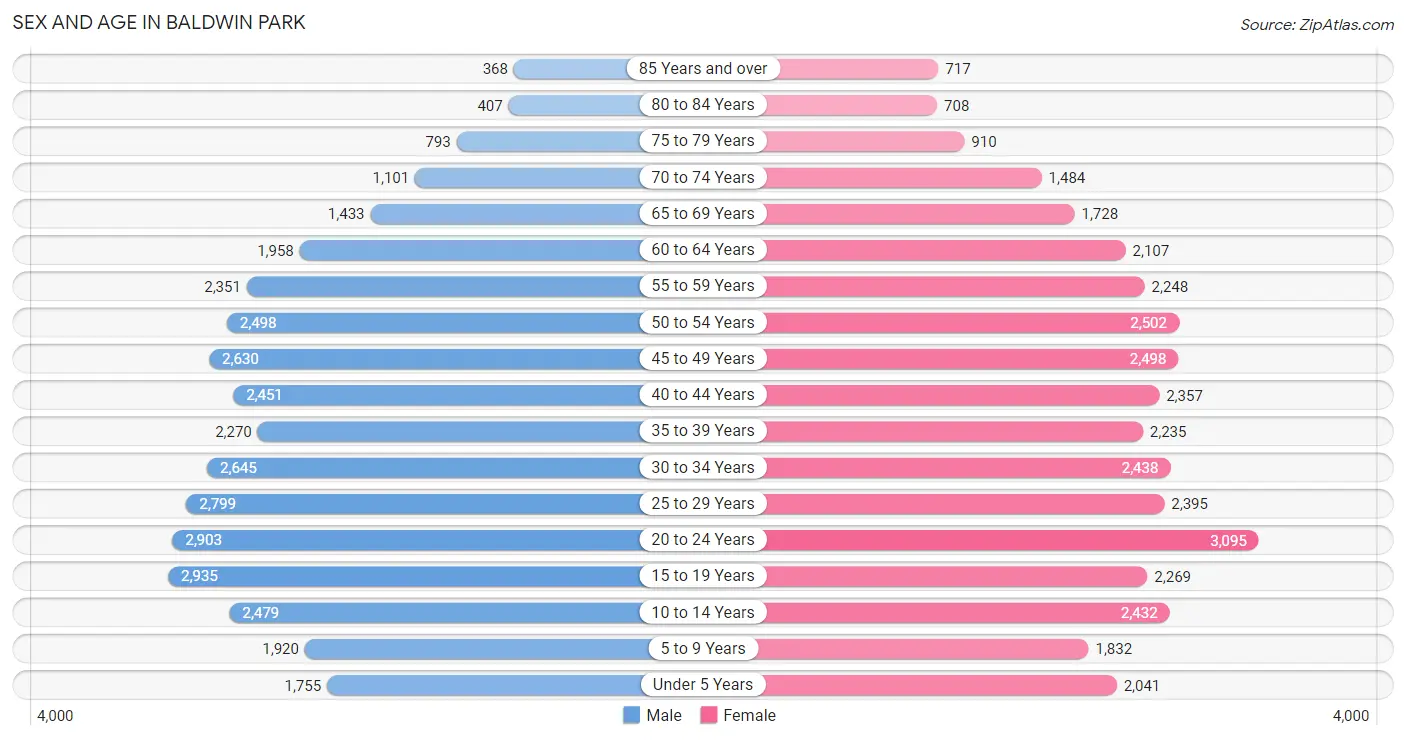
Sex and Age in Baldwin Park
Sex and Age in Baldwin Park
The most populous age groups in Baldwin Park are 15 to 19 Years (2,935 | 8.2%) for men and 20 to 24 Years (3,095 | 8.6%) for women.
| Age Bracket | Male | Female |
| Under 5 Years | 1,755 (4.9%) | 2,041 (5.7%) |
| 5 to 9 Years | 1,920 (5.4%) | 1,832 (5.1%) |
| 10 to 14 Years | 2,479 (6.9%) | 2,432 (6.8%) |
| 15 to 19 Years | 2,935 (8.2%) | 2,269 (6.3%) |
| 20 to 24 Years | 2,903 (8.1%) | 3,095 (8.6%) |
| 25 to 29 Years | 2,799 (7.8%) | 2,395 (6.7%) |
| 30 to 34 Years | 2,645 (7.4%) | 2,438 (6.8%) |
| 35 to 39 Years | 2,270 (6.4%) | 2,235 (6.2%) |
| 40 to 44 Years | 2,451 (6.9%) | 2,357 (6.6%) |
| 45 to 49 Years | 2,630 (7.4%) | 2,498 (6.9%) |
| 50 to 54 Years | 2,498 (7.0%) | 2,502 (7.0%) |
| 55 to 59 Years | 2,351 (6.6%) | 2,248 (6.2%) |
| 60 to 64 Years | 1,958 (5.5%) | 2,107 (5.9%) |
| 65 to 69 Years | 1,433 (4.0%) | 1,728 (4.8%) |
| 70 to 74 Years | 1,101 (3.1%) | 1,484 (4.1%) |
| 75 to 79 Years | 793 (2.2%) | 910 (2.5%) |
| 80 to 84 Years | 407 (1.1%) | 708 (2.0%) |
| 85 Years and over | 368 (1.0%) | 717 (2.0%) |
| Total | 35,696 (100.0%) | 35,996 (100.0%) |
Families and Households in Baldwin Park
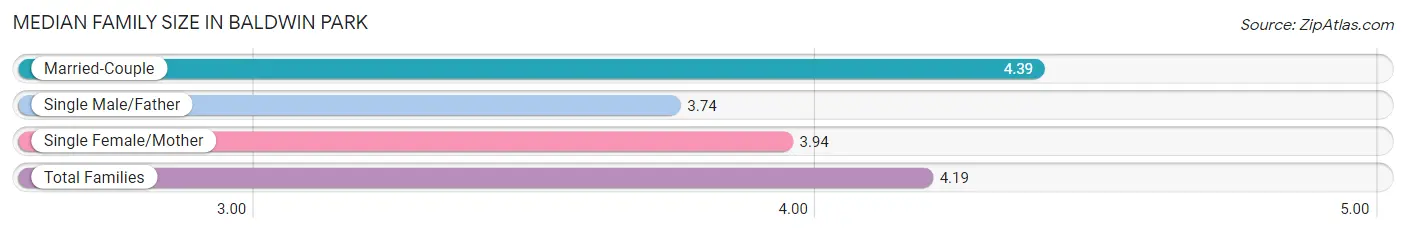
Median Family Size in Baldwin Park
The median family size in Baldwin Park is 4.19 persons per family, with married-couple families (9,380 | 60.9%) accounting for the largest median family size of 4.39 persons per family. On the other hand, single male/father families (2,147 | 14.0%) represent the smallest median family size with 3.74 persons per family.
| Family Type | # Families | Family Size |
| Married-Couple | 9,380 (60.9%) | 4.39 |
| Single Male/Father | 2,147 (14.0%) | 3.74 |
| Single Female/Mother | 3,866 (25.1%) | 3.94 |
| Total Families | 15,393 (100.0%) | 4.19 |
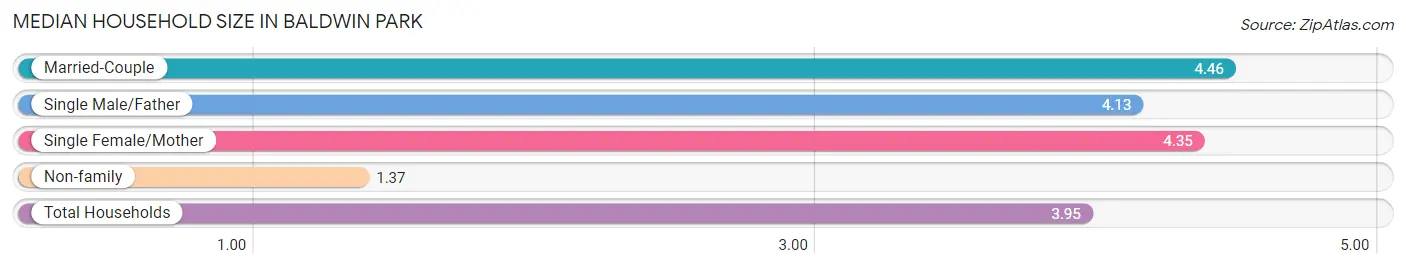
Median Household Size in Baldwin Park
The median household size in Baldwin Park is 3.95 persons per household, with married-couple households (9,380 | 52.0%) accounting for the largest median household size of 4.46 persons per household. non-family households (2,629 | 14.6%) represent the smallest median household size with 1.37 persons per household.
| Household Type | # Households | Household Size |
| Married-Couple | 9,380 (52.0%) | 4.46 |
| Single Male/Father | 2,147 (11.9%) | 4.13 |
| Single Female/Mother | 3,866 (21.4%) | 4.35 |
| Non-family | 2,629 (14.6%) | 1.37 |
| Total Households | 18,022 (100.0%) | 3.95 |
Household Size by Marriage Status in Baldwin Park
Out of a total of 18,022 households in Baldwin Park, 15,393 (85.4%) are family households, while 2,629 (14.6%) are nonfamily households. The most numerous type of family households are 4-person households, comprising 3,676, and the most common type of nonfamily households are 1-person households, comprising 2,062.
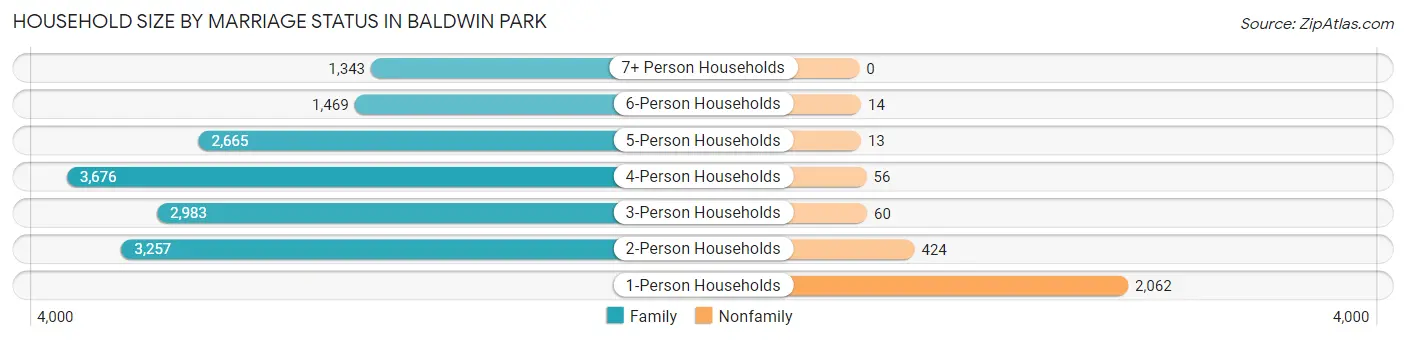
| Household Size | Family Households | Nonfamily Households |
| 1-Person Households | - | 2,062 (11.4%) |
| 2-Person Households | 3,257 (18.1%) | 424 (2.4%) |
| 3-Person Households | 2,983 (16.6%) | 60 (0.3%) |
| 4-Person Households | 3,676 (20.4%) | 56 (0.3%) |
| 5-Person Households | 2,665 (14.8%) | 13 (0.1%) |
| 6-Person Households | 1,469 (8.2%) | 14 (0.1%) |
| 7+ Person Households | 1,343 (7.4%) | 0 (0.0%) |
| Total | 15,393 (85.4%) | 2,629 (14.6%) |
Female Fertility in Baldwin Park
Fertility by Age in Baldwin Park
Average fertility rate in Baldwin Park is 35.0 births per 1,000 women. Women in the age bracket of 20 to 34 years have the highest fertility rate with 47.0 births per 1,000 women. Women in the age bracket of 20 to 34 years acount for 58.3% of all women with births.
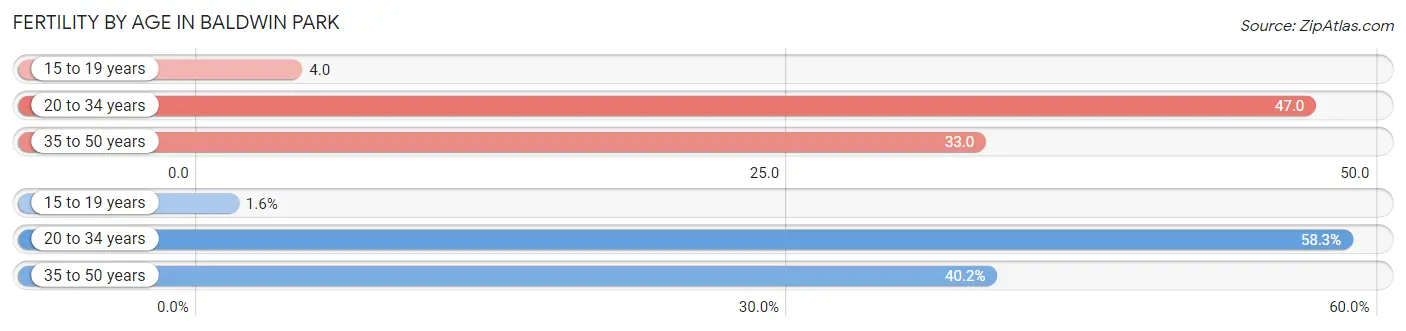
| Age Bracket | Women with Births | Births / 1,000 Women |
| 15 to 19 years | 10 (1.6%) | 4.0 |
| 20 to 34 years | 370 (58.3%) | 47.0 |
| 35 to 50 years | 255 (40.2%) | 33.0 |
| Total | 635 (100.0%) | 35.0 |
Fertility by Age by Marriage Status in Baldwin Park
60.0% of women with births (635) in Baldwin Park are married. The highest percentage of unmarried women with births falls into 15 to 19 years age bracket with 100.0% of them unmarried at the time of birth, while the lowest percentage of unmarried women with births belong to 35 to 50 years age bracket with 29.4% of them unmarried.
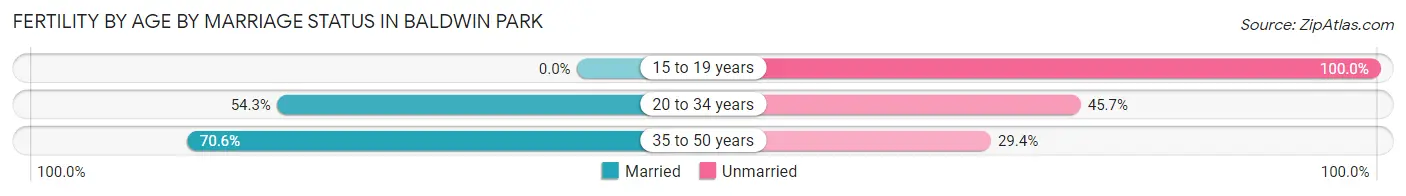
| Age Bracket | Married | Unmarried |
| 15 to 19 years | 0 (0.0%) | 10 (100.0%) |
| 20 to 34 years | 201 (54.3%) | 169 (45.7%) |
| 35 to 50 years | 180 (70.6%) | 75 (29.4%) |
| Total | 381 (60.0%) | 254 (40.0%) |
Fertility by Education in Baldwin Park
Average fertility rate in Baldwin Park is 35.0 births per 1,000 women. Women with the education attainment of bachelor's degree have the highest fertility rate of 70.0 births per 1,000 women, while women with the education attainment of less than high school have the lowest fertility at 21.0 births per 1,000 women. Women with the education attainment of high school diploma represent 33.5% of all women with births.
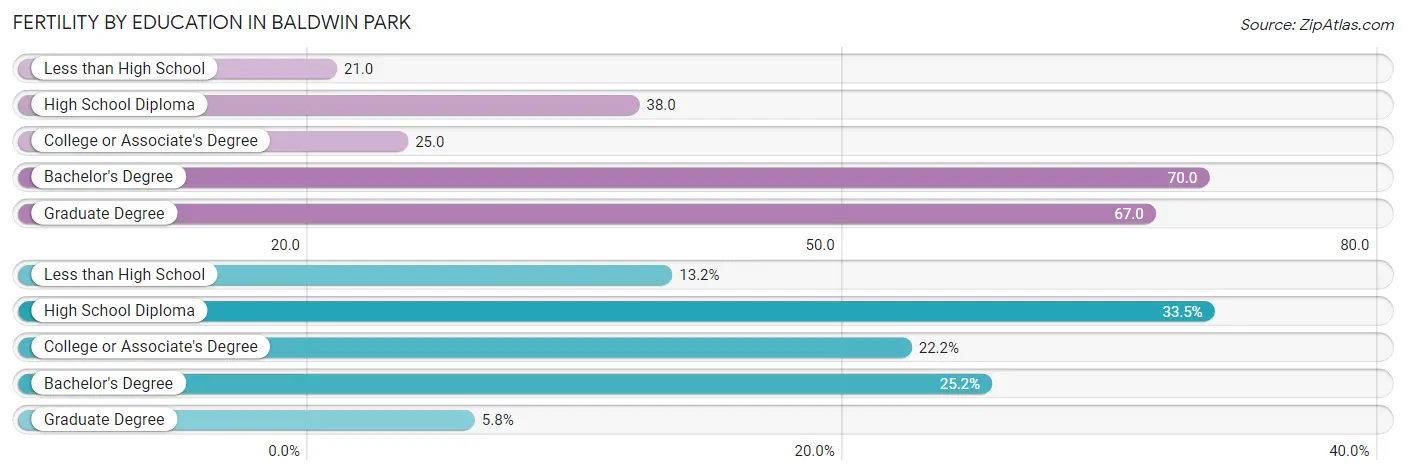
| Educational Attainment | Women with Births | Births / 1,000 Women |
| Less than High School | 84 (13.2%) | 21.0 |
| High School Diploma | 213 (33.5%) | 38.0 |
| College or Associate's Degree | 141 (22.2%) | 25.0 |
| Bachelor's Degree | 160 (25.2%) | 70.0 |
| Graduate Degree | 37 (5.8%) | 67.0 |
| Total | 635 (100.0%) | 35.0 |
Fertility by Education by Marriage Status in Baldwin Park
40.0% of women with births in Baldwin Park are unmarried. Women with the educational attainment of graduate degree are most likely to be married with 100.0% of them married at childbirth, while women with the educational attainment of college or associate's degree are least likely to be married with 71.6% of them unmarried at childbirth.
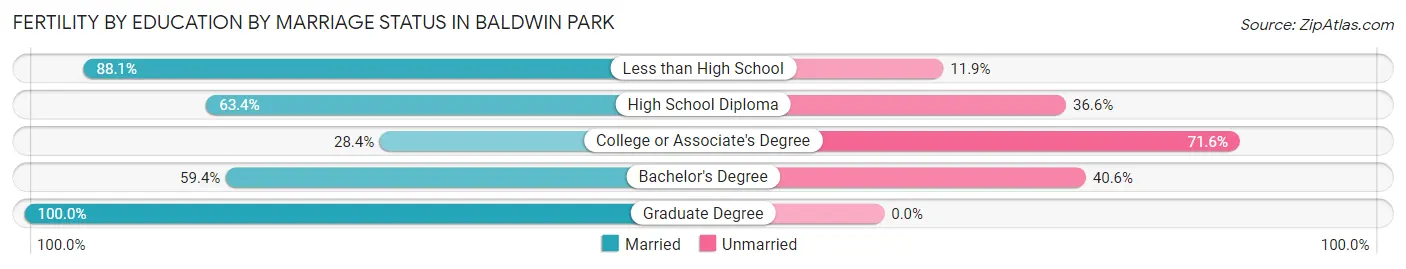
| Educational Attainment | Married | Unmarried |
| Less than High School | 74 (88.1%) | 10 (11.9%) |
| High School Diploma | 135 (63.4%) | 78 (36.6%) |
| College or Associate's Degree | 40 (28.4%) | 101 (71.6%) |
| Bachelor's Degree | 95 (59.4%) | 65 (40.6%) |
| Graduate Degree | 37 (100.0%) | 0 (0.0%) |
| Total | 381 (60.0%) | 254 (40.0%) |
Employment Characteristics in Baldwin Park
Employment by Class of Employer in Baldwin Park
Among the 32,947 employed individuals in Baldwin Park, private company employees (24,315 | 73.8%), self-employed (not incorporated) (2,427 | 7.4%), and not-for-profit organizations (2,133 | 6.5%) make up the most common classes of employment.
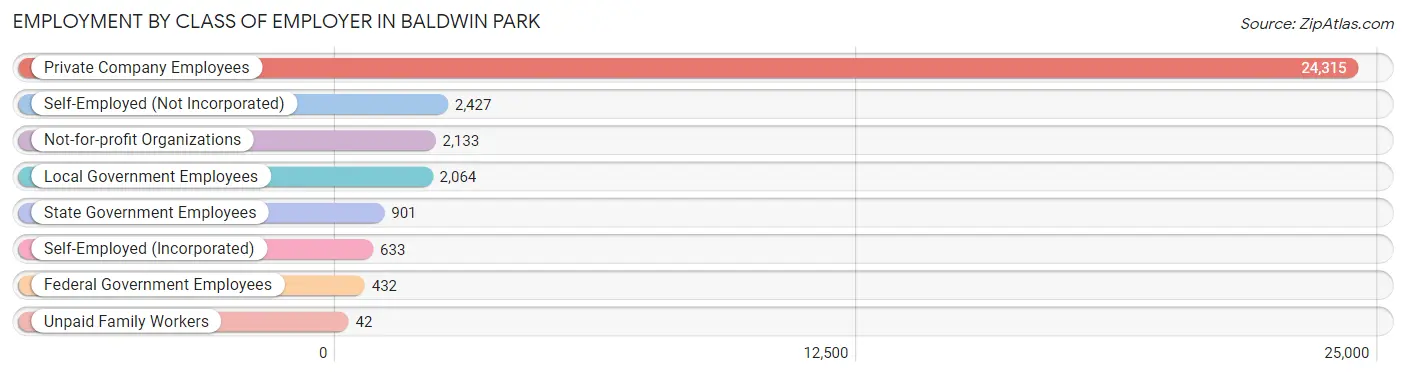
| Employer Class | # Employees | % Employees |
| Private Company Employees | 24,315 | 73.8% |
| Self-Employed (Incorporated) | 633 | 1.9% |
| Self-Employed (Not Incorporated) | 2,427 | 7.4% |
| Not-for-profit Organizations | 2,133 | 6.5% |
| Local Government Employees | 2,064 | 6.3% |
| State Government Employees | 901 | 2.7% |
| Federal Government Employees | 432 | 1.3% |
| Unpaid Family Workers | 42 | 0.1% |
| Total | 32,947 | 100.0% |
Employment Status by Age in Baldwin Park
According to the labor force statistics for Baldwin Park, out of the total population over 16 years of age (58,403), 62.4% or 36,443 individuals are in the labor force, with 7.1% or 2,587 of them unemployed. The age group with the highest labor force participation rate is 25 to 29 years, with 83.5% or 4,337 individuals in the labor force. Within the labor force, the 16 to 19 years age range has the highest percentage of unemployed individuals, with 16.3% or 193 of them being unemployed.
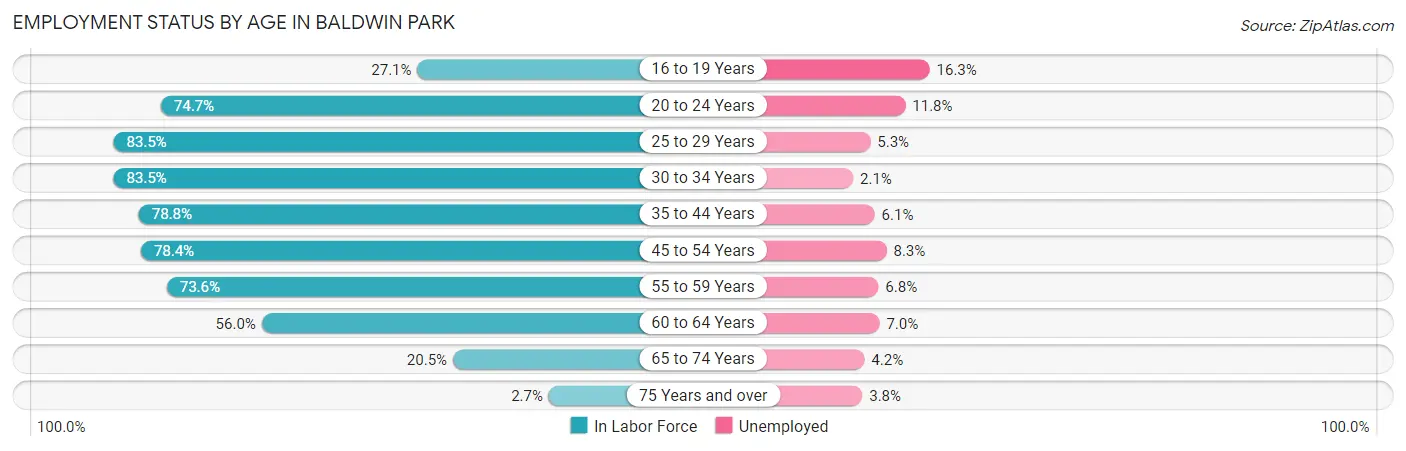
| Age Bracket | In Labor Force | Unemployed |
| 16 to 19 Years | 1,185 (27.1%) | 193 (16.3%) |
| 20 to 24 Years | 4,481 (74.7%) | 529 (11.8%) |
| 25 to 29 Years | 4,337 (83.5%) | 230 (5.3%) |
| 30 to 34 Years | 4,244 (83.5%) | 89 (2.1%) |
| 35 to 44 Years | 7,339 (78.8%) | 448 (6.1%) |
| 45 to 54 Years | 7,940 (78.4%) | 659 (8.3%) |
| 55 to 59 Years | 3,385 (73.6%) | 230 (6.8%) |
| 60 to 64 Years | 2,276 (56.0%) | 159 (7.0%) |
| 65 to 74 Years | 1,178 (20.5%) | 49 (4.2%) |
| 75 Years and over | 105 (2.7%) | 4 (3.8%) |
| Total | 36,443 (62.4%) | 2,587 (7.1%) |
Employment Status by Educational Attainment in Baldwin Park
According to labor force statistics for Baldwin Park, 76.9% of individuals (29,516) out of the total population between 25 and 64 years of age (38,382) are in the labor force, with 6.2% or 1,830 of them being unemployed. The group with the highest labor force participation rate are those with the educational attainment of bachelor's degree or higher, with 87.7% or 5,021 individuals in the labor force. Within the labor force, individuals with less than high school education have the highest percentage of unemployment, with 6.9% or 493 of them being unemployed.
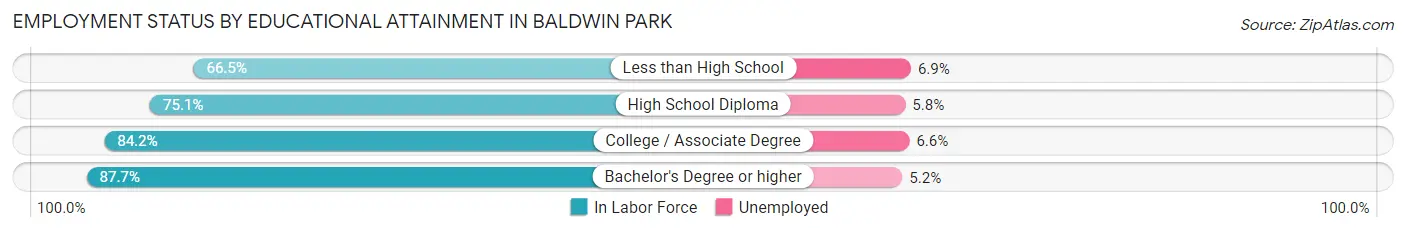
| Educational Attainment | In Labor Force | Unemployed |
| Less than High School | 7,140 (66.5%) | 741 (6.9%) |
| High School Diploma | 9,139 (75.1%) | 706 (5.8%) |
| College / Associate Degree | 8,210 (84.2%) | 644 (6.6%) |
| Bachelor's Degree or higher | 5,021 (87.7%) | 298 (5.2%) |
| Total | 29,516 (76.9%) | 2,380 (6.2%) |
Employment Occupations by Sex in Baldwin Park
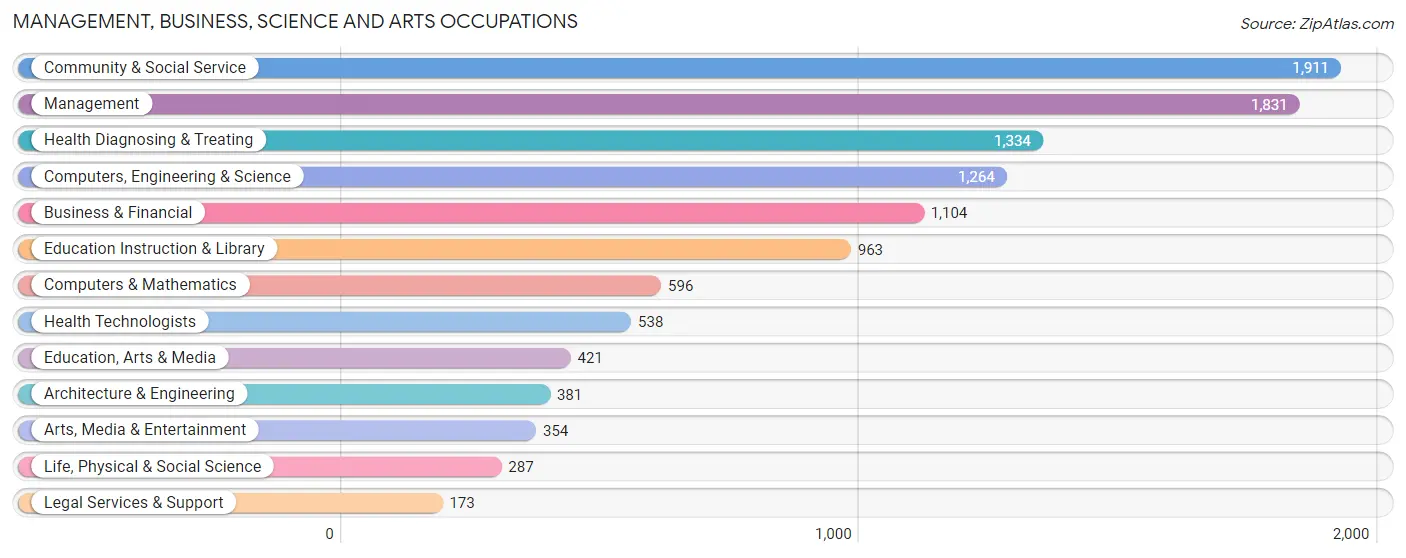
Management, Business, Science and Arts Occupations
The most common Management, Business, Science and Arts occupations in Baldwin Park are Community & Social Service (1,911 | 5.7%), Management (1,831 | 5.4%), Health Diagnosing & Treating (1,334 | 3.9%), Computers, Engineering & Science (1,264 | 3.7%), and Business & Financial (1,104 | 3.3%).
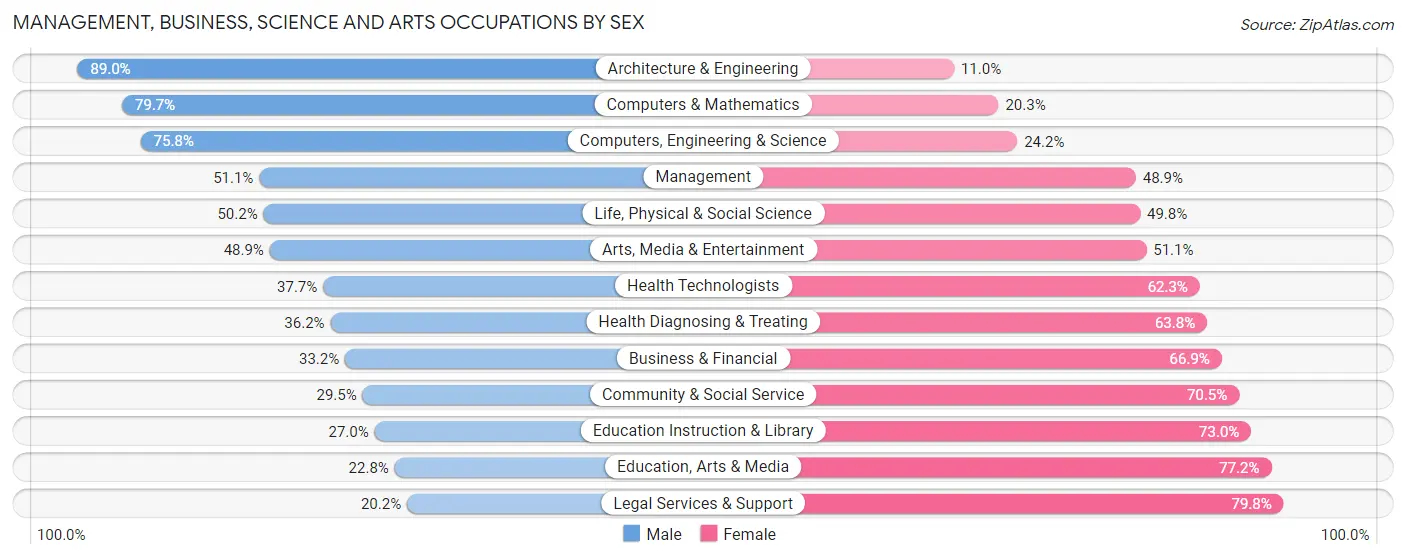
Management, Business, Science and Arts Occupations by Sex
Within the Management, Business, Science and Arts occupations in Baldwin Park, the most male-oriented occupations are Architecture & Engineering (89.0%), Computers & Mathematics (79.7%), and Computers, Engineering & Science (75.8%), while the most female-oriented occupations are Legal Services & Support (79.8%), Education, Arts & Media (77.2%), and Education Instruction & Library (73.0%).
| Occupation | Male | Female |
| Management | 935 (51.1%) | 896 (48.9%) |
| Business & Financial | 366 (33.2%) | 738 (66.8%) |
| Computers, Engineering & Science | 958 (75.8%) | 306 (24.2%) |
| Computers & Mathematics | 475 (79.7%) | 121 (20.3%) |
| Architecture & Engineering | 339 (89.0%) | 42 (11.0%) |
| Life, Physical & Social Science | 144 (50.2%) | 143 (49.8%) |
| Community & Social Service | 564 (29.5%) | 1,347 (70.5%) |
| Education, Arts & Media | 96 (22.8%) | 325 (77.2%) |
| Legal Services & Support | 35 (20.2%) | 138 (79.8%) |
| Education Instruction & Library | 260 (27.0%) | 703 (73.0%) |
| Arts, Media & Entertainment | 173 (48.9%) | 181 (51.1%) |
| Health Diagnosing & Treating | 483 (36.2%) | 851 (63.8%) |
| Health Technologists | 203 (37.7%) | 335 (62.3%) |
| Total (Category) | 3,306 (44.4%) | 4,138 (55.6%) |
| Total (Overall) | 18,587 (54.9%) | 15,255 (45.1%) |
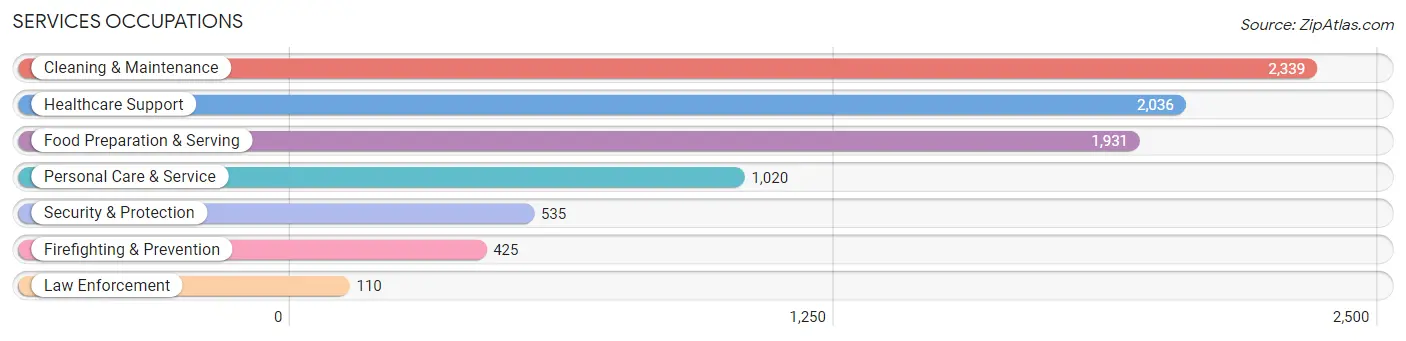
Services Occupations
The most common Services occupations in Baldwin Park are Cleaning & Maintenance (2,339 | 6.9%), Healthcare Support (2,036 | 6.0%), Food Preparation & Serving (1,931 | 5.7%), Personal Care & Service (1,020 | 3.0%), and Security & Protection (535 | 1.6%).
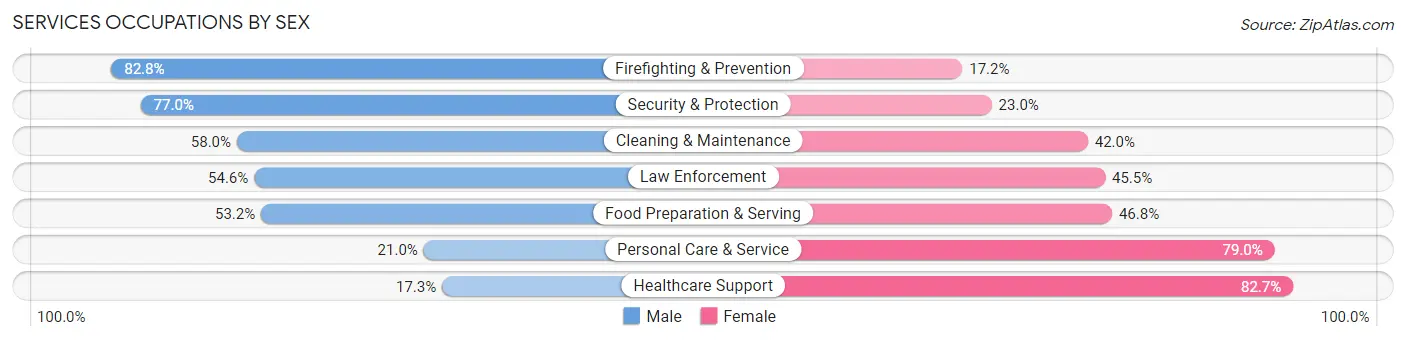
Services Occupations by Sex
Within the Services occupations in Baldwin Park, the most male-oriented occupations are Firefighting & Prevention (82.8%), Security & Protection (77.0%), and Cleaning & Maintenance (58.0%), while the most female-oriented occupations are Healthcare Support (82.7%), Personal Care & Service (79.0%), and Food Preparation & Serving (46.8%).
| Occupation | Male | Female |
| Healthcare Support | 353 (17.3%) | 1,683 (82.7%) |
| Security & Protection | 412 (77.0%) | 123 (23.0%) |
| Firefighting & Prevention | 352 (82.8%) | 73 (17.2%) |
| Law Enforcement | 60 (54.5%) | 50 (45.5%) |
| Food Preparation & Serving | 1,027 (53.2%) | 904 (46.8%) |
| Cleaning & Maintenance | 1,356 (58.0%) | 983 (42.0%) |
| Personal Care & Service | 214 (21.0%) | 806 (79.0%) |
| Total (Category) | 3,362 (42.8%) | 4,499 (57.2%) |
| Total (Overall) | 18,587 (54.9%) | 15,255 (45.1%) |
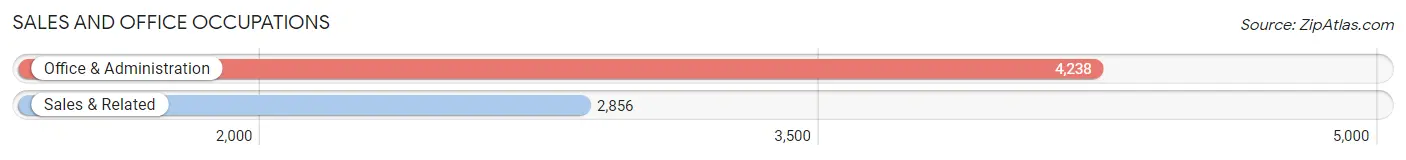
Sales and Office Occupations
The most common Sales and Office occupations in Baldwin Park are Office & Administration (4,238 | 12.5%), and Sales & Related (2,856 | 8.4%).
Sales and Office Occupations by Sex
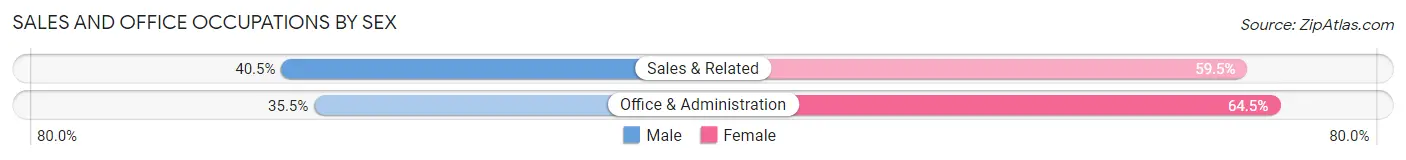
| Occupation | Male | Female |
| Sales & Related | 1,157 (40.5%) | 1,699 (59.5%) |
| Office & Administration | 1,503 (35.5%) | 2,735 (64.5%) |
| Total (Category) | 2,660 (37.5%) | 4,434 (62.5%) |
| Total (Overall) | 18,587 (54.9%) | 15,255 (45.1%) |
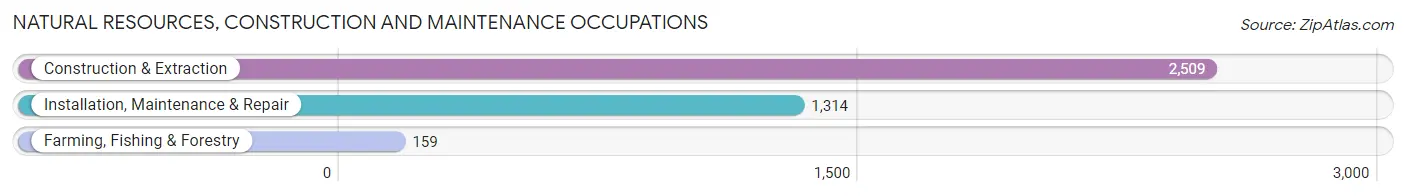
Natural Resources, Construction and Maintenance Occupations
The most common Natural Resources, Construction and Maintenance occupations in Baldwin Park are Construction & Extraction (2,509 | 7.4%), Installation, Maintenance & Repair (1,314 | 3.9%), and Farming, Fishing & Forestry (159 | 0.5%).
Natural Resources, Construction and Maintenance Occupations by Sex
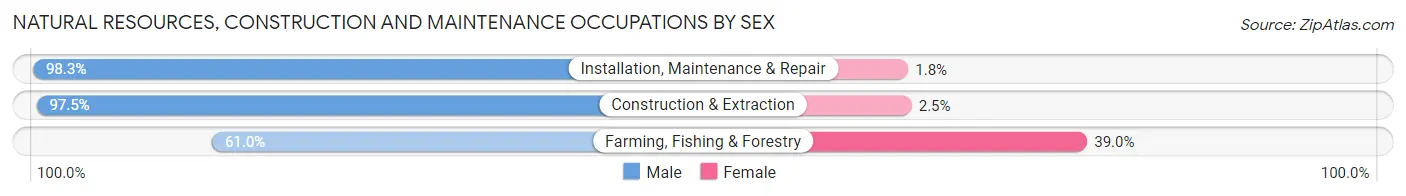
| Occupation | Male | Female |
| Farming, Fishing & Forestry | 97 (61.0%) | 62 (39.0%) |
| Construction & Extraction | 2,447 (97.5%) | 62 (2.5%) |
| Installation, Maintenance & Repair | 1,291 (98.3%) | 23 (1.8%) |
| Total (Category) | 3,835 (96.3%) | 147 (3.7%) |
| Total (Overall) | 18,587 (54.9%) | 15,255 (45.1%) |
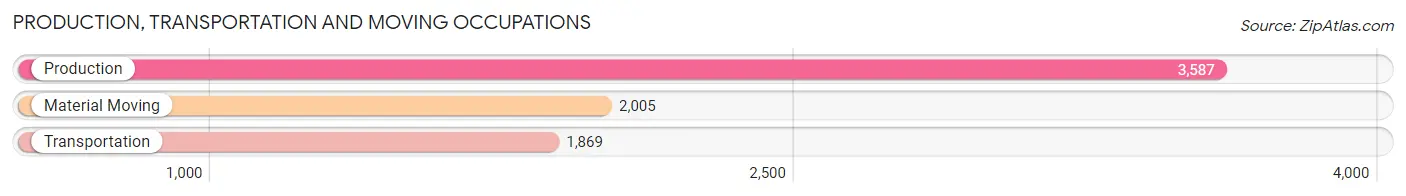
Production, Transportation and Moving Occupations
The most common Production, Transportation and Moving occupations in Baldwin Park are Production (3,587 | 10.6%), Material Moving (2,005 | 5.9%), and Transportation (1,869 | 5.5%).
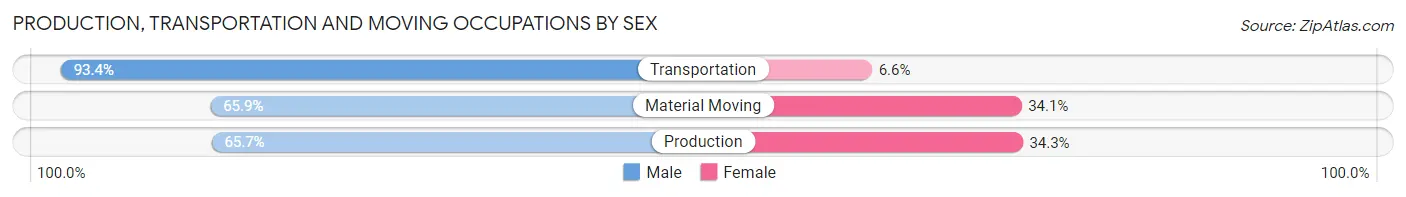
Production, Transportation and Moving Occupations by Sex
| Occupation | Male | Female |
| Production | 2,357 (65.7%) | 1,230 (34.3%) |
| Transportation | 1,745 (93.4%) | 124 (6.6%) |
| Material Moving | 1,322 (65.9%) | 683 (34.1%) |
| Total (Category) | 5,424 (72.7%) | 2,037 (27.3%) |
| Total (Overall) | 18,587 (54.9%) | 15,255 (45.1%) |
Employment Industries by Sex in Baldwin Park
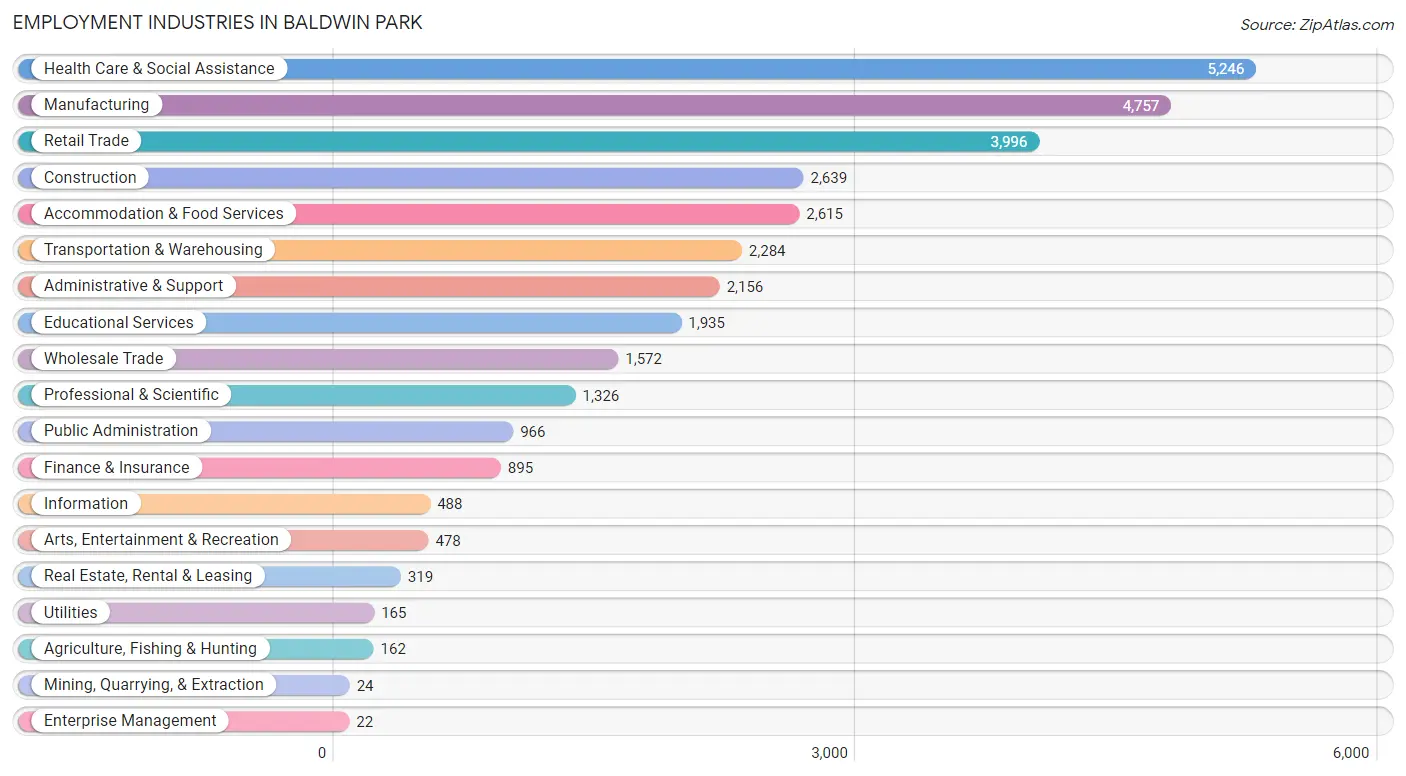
Employment Industries in Baldwin Park
The major employment industries in Baldwin Park include Health Care & Social Assistance (5,246 | 15.5%), Manufacturing (4,757 | 14.1%), Retail Trade (3,996 | 11.8%), Construction (2,639 | 7.8%), and Accommodation & Food Services (2,615 | 7.7%).
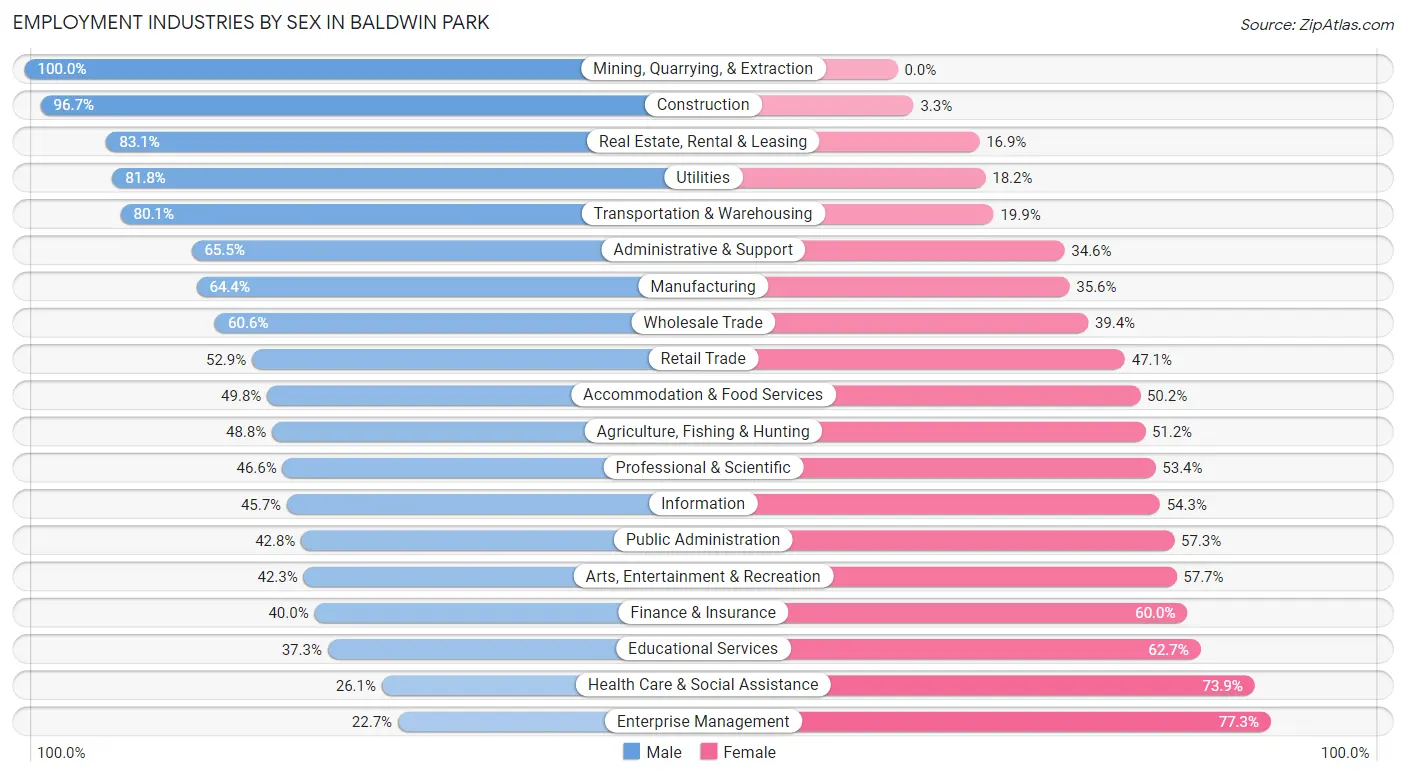
Employment Industries by Sex in Baldwin Park
The Baldwin Park industries that see more men than women are Mining, Quarrying, & Extraction (100.0%), Construction (96.7%), and Real Estate, Rental & Leasing (83.1%), whereas the industries that tend to have a higher number of women are Enterprise Management (77.3%), Health Care & Social Assistance (73.9%), and Educational Services (62.7%).
| Industry | Male | Female |
| Agriculture, Fishing & Hunting | 79 (48.8%) | 83 (51.2%) |
| Mining, Quarrying, & Extraction | 24 (100.0%) | 0 (0.0%) |
| Construction | 2,551 (96.7%) | 88 (3.3%) |
| Manufacturing | 3,064 (64.4%) | 1,693 (35.6%) |
| Wholesale Trade | 952 (60.6%) | 620 (39.4%) |
| Retail Trade | 2,115 (52.9%) | 1,881 (47.1%) |
| Transportation & Warehousing | 1,830 (80.1%) | 454 (19.9%) |
| Utilities | 135 (81.8%) | 30 (18.2%) |
| Information | 223 (45.7%) | 265 (54.3%) |
| Finance & Insurance | 358 (40.0%) | 537 (60.0%) |
| Real Estate, Rental & Leasing | 265 (83.1%) | 54 (16.9%) |
| Professional & Scientific | 618 (46.6%) | 708 (53.4%) |
| Enterprise Management | 5 (22.7%) | 17 (77.3%) |
| Administrative & Support | 1,411 (65.4%) | 745 (34.5%) |
| Educational Services | 721 (37.3%) | 1,214 (62.7%) |
| Health Care & Social Assistance | 1,367 (26.1%) | 3,879 (73.9%) |
| Arts, Entertainment & Recreation | 202 (42.3%) | 276 (57.7%) |
| Accommodation & Food Services | 1,302 (49.8%) | 1,313 (50.2%) |
| Public Administration | 413 (42.7%) | 553 (57.3%) |
| Total | 18,587 (54.9%) | 15,255 (45.1%) |
Education in Baldwin Park
School Enrollment in Baldwin Park
The most common levels of schooling among the 18,707 students in Baldwin Park are college / undergraduate (5,766 | 30.8%), high school (4,114 | 22.0%), and middle school (3,679 | 19.7%).
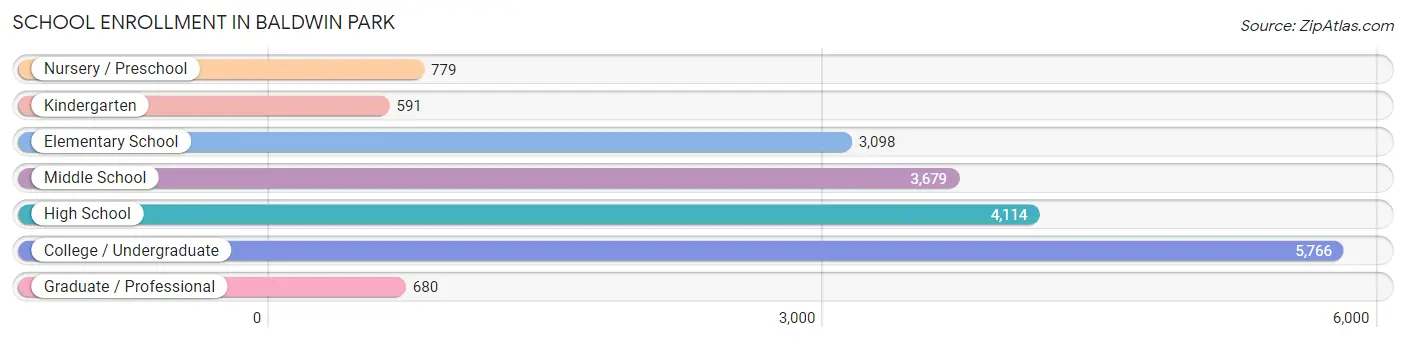
| School Level | # Students | % Students |
| Nursery / Preschool | 779 | 4.2% |
| Kindergarten | 591 | 3.2% |
| Elementary School | 3,098 | 16.6% |
| Middle School | 3,679 | 19.7% |
| High School | 4,114 | 22.0% |
| College / Undergraduate | 5,766 | 30.8% |
| Graduate / Professional | 680 | 3.6% |
| Total | 18,707 | 100.0% |
School Enrollment by Age by Funding Source in Baldwin Park
Out of a total of 18,707 students who are enrolled in schools in Baldwin Park, 1,927 (10.3%) attend a private institution, while the remaining 16,780 (89.7%) are enrolled in public schools. The age group of 25 to 34 year olds has the highest likelihood of being enrolled in private schools, with 629 (33.0% in the age bracket) enrolled. Conversely, the age group of 15 to 17 year olds has the lowest likelihood of being enrolled in a private school, with 2,618 (99.0% in the age bracket) attending a public institution.
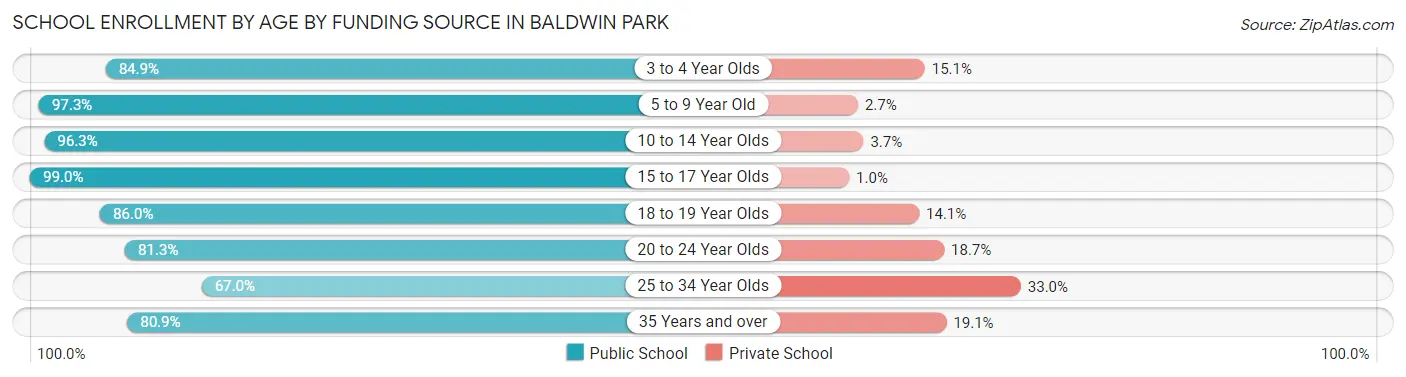
| Age Bracket | Public School | Private School |
| 3 to 4 Year Olds | 562 (84.9%) | 100 (15.1%) |
| 5 to 9 Year Old | 3,465 (97.3%) | 95 (2.7%) |
| 10 to 14 Year Olds | 4,541 (96.3%) | 174 (3.7%) |
| 15 to 17 Year Olds | 2,618 (99.0%) | 27 (1.0%) |
| 18 to 19 Year Olds | 1,474 (86.0%) | 241 (14.1%) |
| 20 to 24 Year Olds | 2,033 (81.3%) | 468 (18.7%) |
| 25 to 34 Year Olds | 1,277 (67.0%) | 629 (33.0%) |
| 35 Years and over | 811 (80.9%) | 192 (19.1%) |
| Total | 16,780 (89.7%) | 1,927 (10.3%) |
Educational Attainment by Field of Study in Baldwin Park
Business (1,550 | 21.6%), science & technology (938 | 13.1%), engineering (750 | 10.5%), arts & humanities (576 | 8.0%), and social sciences (493 | 6.9%) are the most common fields of study among 7,167 individuals in Baldwin Park who have obtained a bachelor's degree or higher.
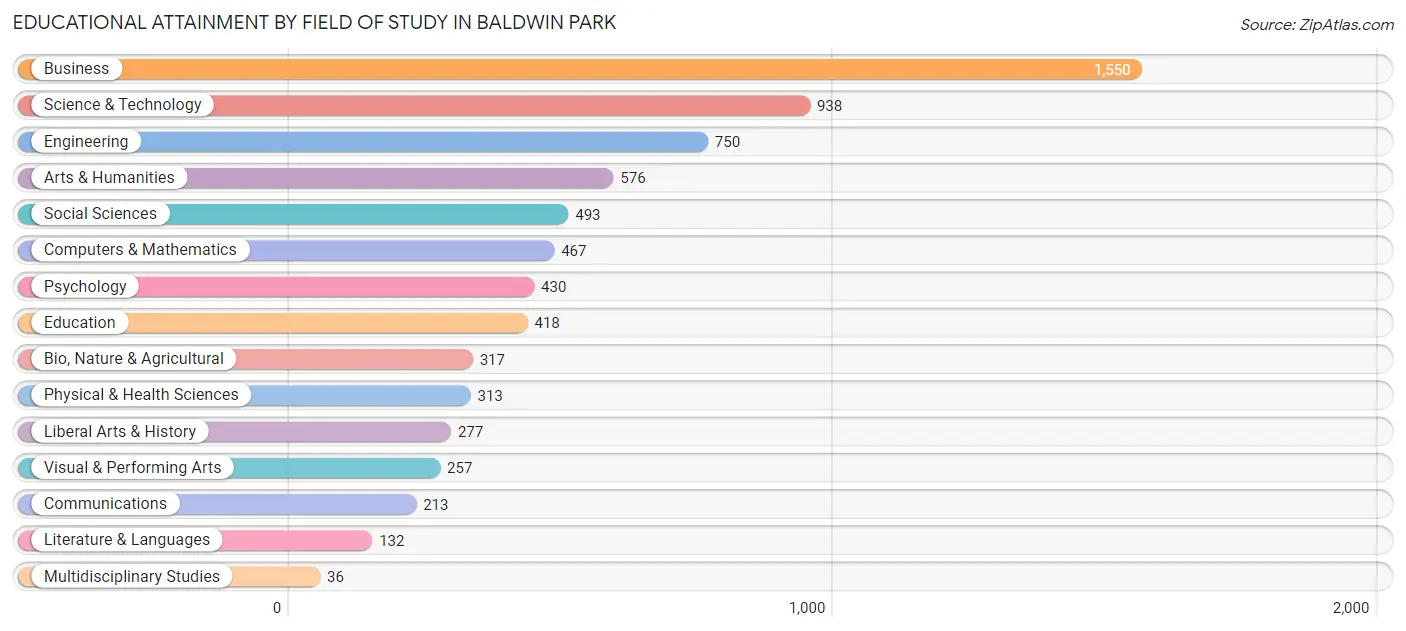
| Field of Study | # Graduates | % Graduates |
| Computers & Mathematics | 467 | 6.5% |
| Bio, Nature & Agricultural | 317 | 4.4% |
| Physical & Health Sciences | 313 | 4.4% |
| Psychology | 430 | 6.0% |
| Social Sciences | 493 | 6.9% |
| Engineering | 750 | 10.5% |
| Multidisciplinary Studies | 36 | 0.5% |
| Science & Technology | 938 | 13.1% |
| Business | 1,550 | 21.6% |
| Education | 418 | 5.8% |
| Literature & Languages | 132 | 1.8% |
| Liberal Arts & History | 277 | 3.9% |
| Visual & Performing Arts | 257 | 3.6% |
| Communications | 213 | 3.0% |
| Arts & Humanities | 576 | 8.0% |
| Total | 7,167 | 100.0% |
Transportation & Commute in Baldwin Park
Vehicle Availability by Sex in Baldwin Park
The most prevalent vehicle ownership categories in Baldwin Park are males with 2 vehicles (5,097, accounting for 28.1%) and females with 2 vehicles (4,487, making up 34.5%).
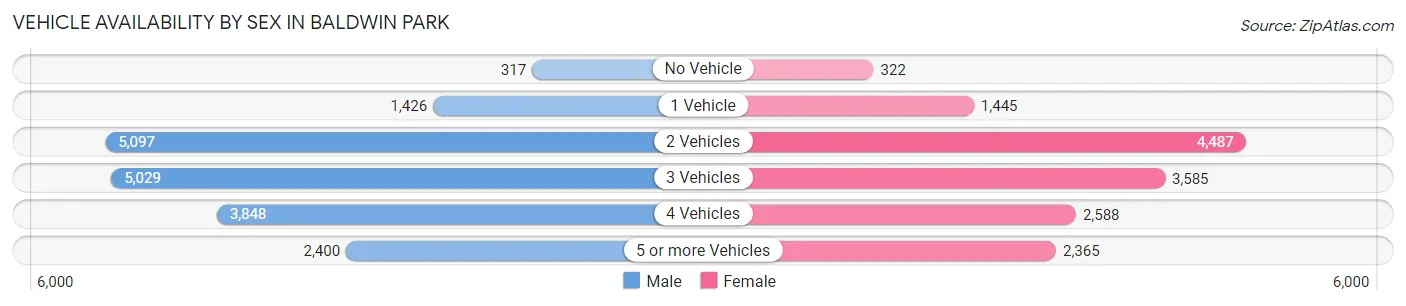
| Vehicles Available | Male | Female |
| No Vehicle | 317 (1.8%) | 322 (2.2%) |
| 1 Vehicle | 1,426 (7.9%) | 1,445 (9.8%) |
| 2 Vehicles | 5,097 (28.1%) | 4,487 (30.3%) |
| 3 Vehicles | 5,029 (27.8%) | 3,585 (24.2%) |
| 4 Vehicles | 3,848 (21.2%) | 2,588 (17.5%) |
| 5 or more Vehicles | 2,400 (13.3%) | 2,365 (16.0%) |
| Total | 18,117 (100.0%) | 14,792 (100.0%) |
Commute Time in Baldwin Park
The most frequently occuring commute durations in Baldwin Park are 30 to 34 minutes (6,354 commuters, 20.2%), 15 to 19 minutes (6,352 commuters, 20.2%), and 20 to 24 minutes (3,730 commuters, 11.9%).
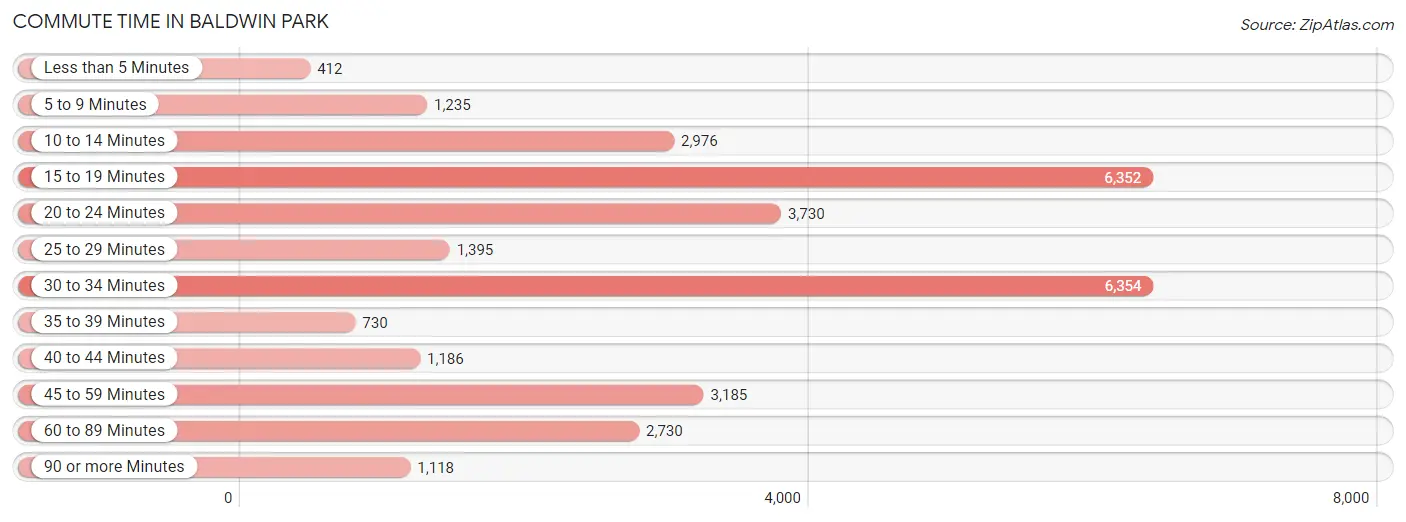
| Commute Time | # Commuters | % Commuters |
| Less than 5 Minutes | 412 | 1.3% |
| 5 to 9 Minutes | 1,235 | 3.9% |
| 10 to 14 Minutes | 2,976 | 9.5% |
| 15 to 19 Minutes | 6,352 | 20.2% |
| 20 to 24 Minutes | 3,730 | 11.9% |
| 25 to 29 Minutes | 1,395 | 4.4% |
| 30 to 34 Minutes | 6,354 | 20.2% |
| 35 to 39 Minutes | 730 | 2.3% |
| 40 to 44 Minutes | 1,186 | 3.8% |
| 45 to 59 Minutes | 3,185 | 10.1% |
| 60 to 89 Minutes | 2,730 | 8.7% |
| 90 or more Minutes | 1,118 | 3.6% |
Commute Time by Sex in Baldwin Park
The most common commute times in Baldwin Park are 30 to 34 minutes (3,784 commuters, 21.5%) for males and 15 to 19 minutes (3,059 commuters, 22.1%) for females.
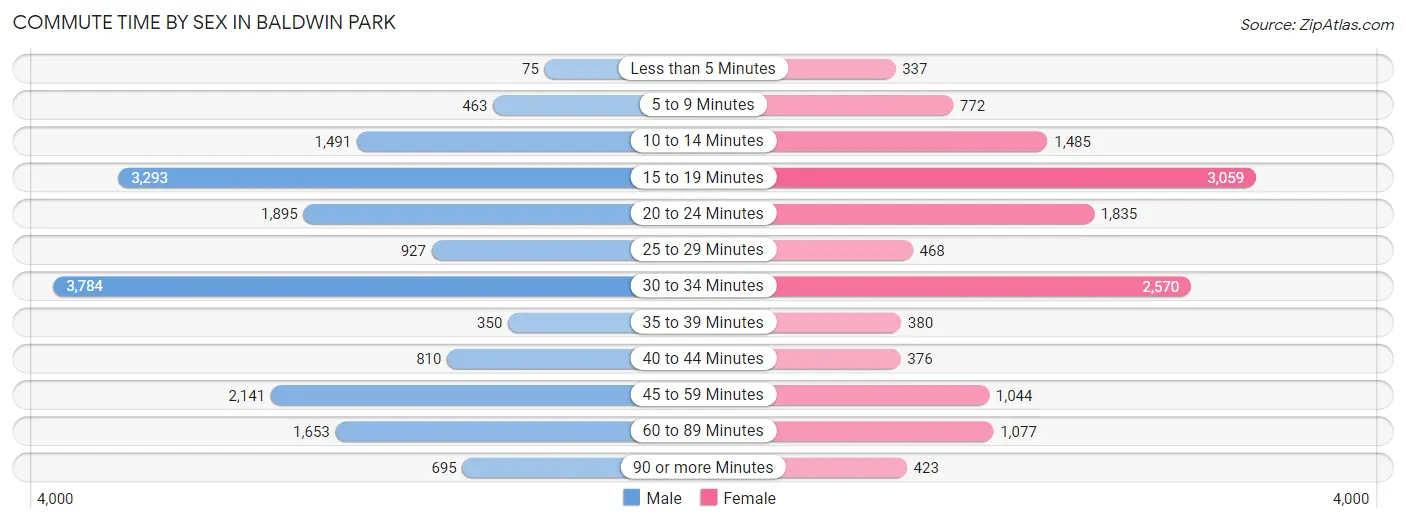
| Commute Time | Male | Female |
| Less than 5 Minutes | 75 (0.4%) | 337 (2.4%) |
| 5 to 9 Minutes | 463 (2.6%) | 772 (5.6%) |
| 10 to 14 Minutes | 1,491 (8.5%) | 1,485 (10.7%) |
| 15 to 19 Minutes | 3,293 (18.7%) | 3,059 (22.1%) |
| 20 to 24 Minutes | 1,895 (10.8%) | 1,835 (13.3%) |
| 25 to 29 Minutes | 927 (5.3%) | 468 (3.4%) |
| 30 to 34 Minutes | 3,784 (21.5%) | 2,570 (18.6%) |
| 35 to 39 Minutes | 350 (2.0%) | 380 (2.8%) |
| 40 to 44 Minutes | 810 (4.6%) | 376 (2.7%) |
| 45 to 59 Minutes | 2,141 (12.2%) | 1,044 (7.5%) |
| 60 to 89 Minutes | 1,653 (9.4%) | 1,077 (7.8%) |
| 90 or more Minutes | 695 (4.0%) | 423 (3.1%) |
Time of Departure to Work by Sex in Baldwin Park
The most frequent times of departure to work in Baldwin Park are 12:00 AM to 4:59 AM (2,921, 16.6%) for males and 8:00 AM to 8:29 AM (1,967, 14.2%) for females.
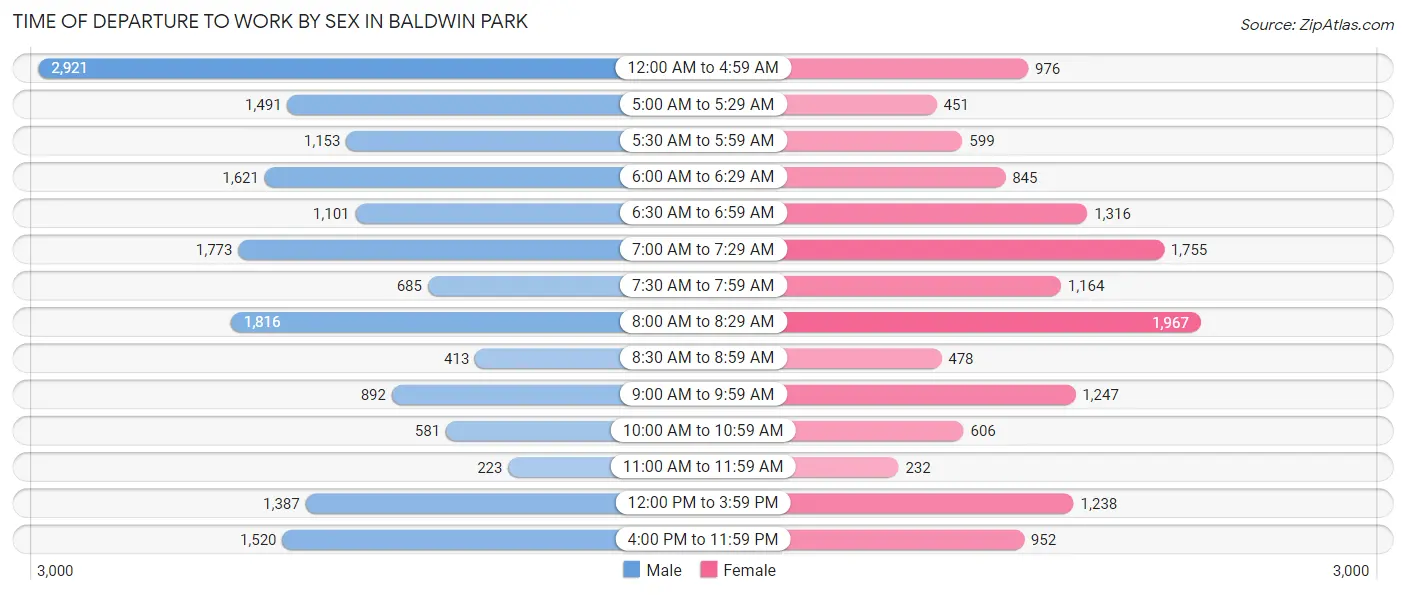
| Time of Departure | Male | Female |
| 12:00 AM to 4:59 AM | 2,921 (16.6%) | 976 (7.1%) |
| 5:00 AM to 5:29 AM | 1,491 (8.5%) | 451 (3.3%) |
| 5:30 AM to 5:59 AM | 1,153 (6.6%) | 599 (4.3%) |
| 6:00 AM to 6:29 AM | 1,621 (9.2%) | 845 (6.1%) |
| 6:30 AM to 6:59 AM | 1,101 (6.3%) | 1,316 (9.5%) |
| 7:00 AM to 7:29 AM | 1,773 (10.1%) | 1,755 (12.7%) |
| 7:30 AM to 7:59 AM | 685 (3.9%) | 1,164 (8.4%) |
| 8:00 AM to 8:29 AM | 1,816 (10.3%) | 1,967 (14.2%) |
| 8:30 AM to 8:59 AM | 413 (2.4%) | 478 (3.5%) |
| 9:00 AM to 9:59 AM | 892 (5.1%) | 1,247 (9.0%) |
| 10:00 AM to 10:59 AM | 581 (3.3%) | 606 (4.4%) |
| 11:00 AM to 11:59 AM | 223 (1.3%) | 232 (1.7%) |
| 12:00 PM to 3:59 PM | 1,387 (7.9%) | 1,238 (8.9%) |
| 4:00 PM to 11:59 PM | 1,520 (8.6%) | 952 (6.9%) |
| Total | 17,577 (100.0%) | 13,826 (100.0%) |
Housing Occupancy in Baldwin Park
Occupancy by Ownership in Baldwin Park
Of the total 18,022 dwellings in Baldwin Park, owner-occupied units account for 10,681 (59.3%), while renter-occupied units make up 7,341 (40.7%).
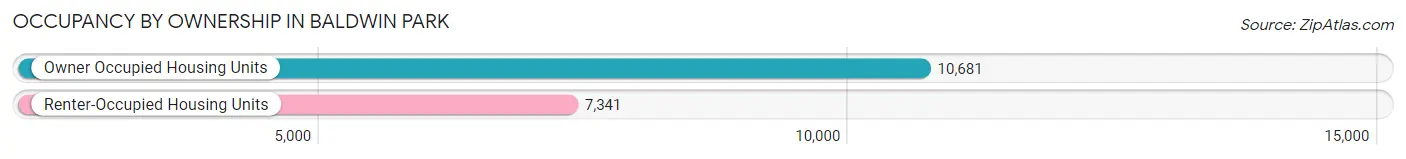
| Occupancy | # Housing Units | % Housing Units |
| Owner Occupied Housing Units | 10,681 | 59.3% |
| Renter-Occupied Housing Units | 7,341 | 40.7% |
| Total Occupied Housing Units | 18,022 | 100.0% |
Occupancy by Household Size in Baldwin Park
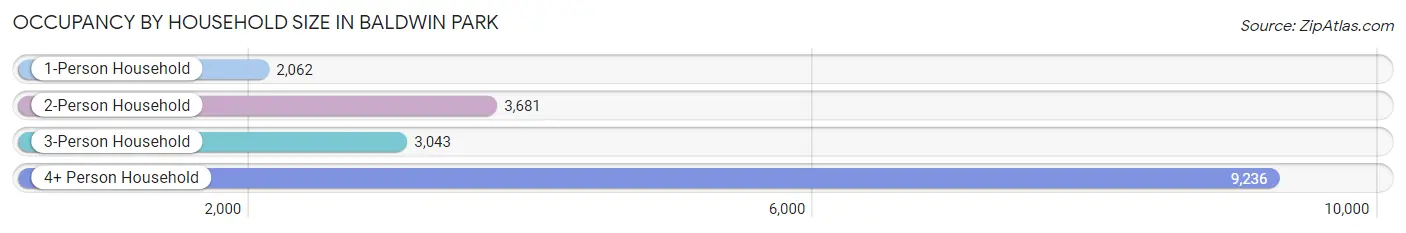
| Household Size | # Housing Units | % Housing Units |
| 1-Person Household | 2,062 | 11.4% |
| 2-Person Household | 3,681 | 20.4% |
| 3-Person Household | 3,043 | 16.9% |
| 4+ Person Household | 9,236 | 51.2% |
| Total Housing Units | 18,022 | 100.0% |
Occupancy by Ownership by Household Size in Baldwin Park
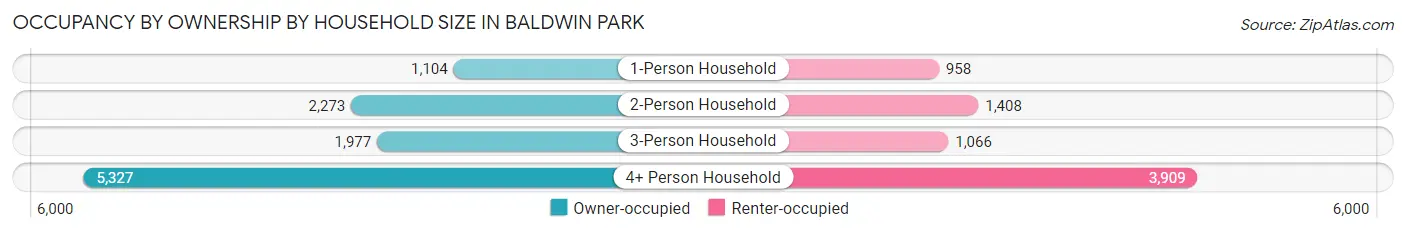
| Household Size | Owner-occupied | Renter-occupied |
| 1-Person Household | 1,104 (53.5%) | 958 (46.5%) |
| 2-Person Household | 2,273 (61.8%) | 1,408 (38.3%) |
| 3-Person Household | 1,977 (65.0%) | 1,066 (35.0%) |
| 4+ Person Household | 5,327 (57.7%) | 3,909 (42.3%) |
| Total Housing Units | 10,681 (59.3%) | 7,341 (40.7%) |
Occupancy by Educational Attainment in Baldwin Park
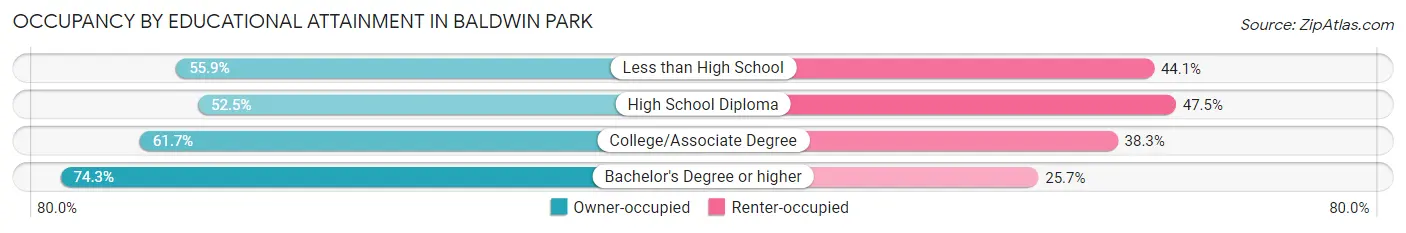
| Household Size | Owner-occupied | Renter-occupied |
| Less than High School | 3,067 (55.9%) | 2,416 (44.1%) |
| High School Diploma | 2,779 (52.5%) | 2,516 (47.5%) |
| College/Associate Degree | 2,678 (61.7%) | 1,662 (38.3%) |
| Bachelor's Degree or higher | 2,157 (74.3%) | 747 (25.7%) |
Occupancy by Age of Householder in Baldwin Park
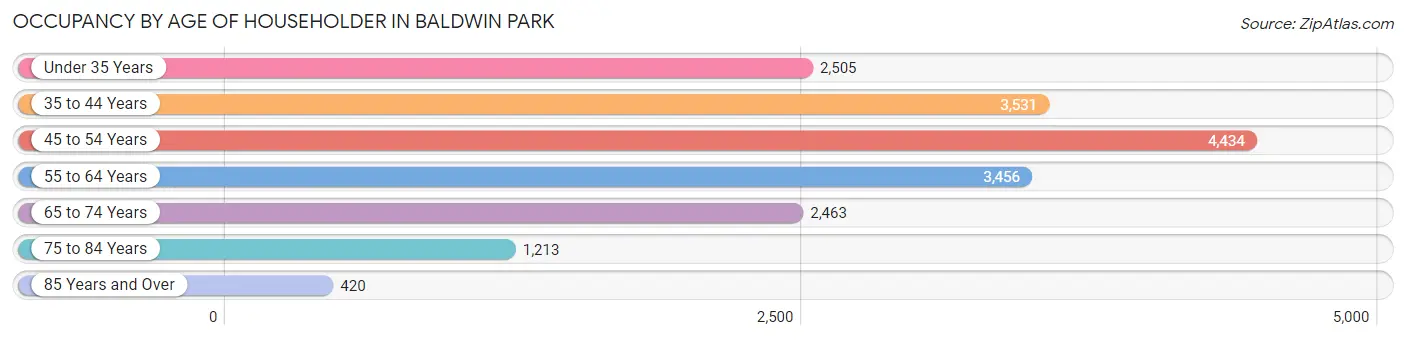
| Age Bracket | # Households | % Households |
| Under 35 Years | 2,505 | 13.9% |
| 35 to 44 Years | 3,531 | 19.6% |
| 45 to 54 Years | 4,434 | 24.6% |
| 55 to 64 Years | 3,456 | 19.2% |
| 65 to 74 Years | 2,463 | 13.7% |
| 75 to 84 Years | 1,213 | 6.7% |
| 85 Years and Over | 420 | 2.3% |
| Total | 18,022 | 100.0% |
Housing Finances in Baldwin Park
Median Income by Occupancy in Baldwin Park
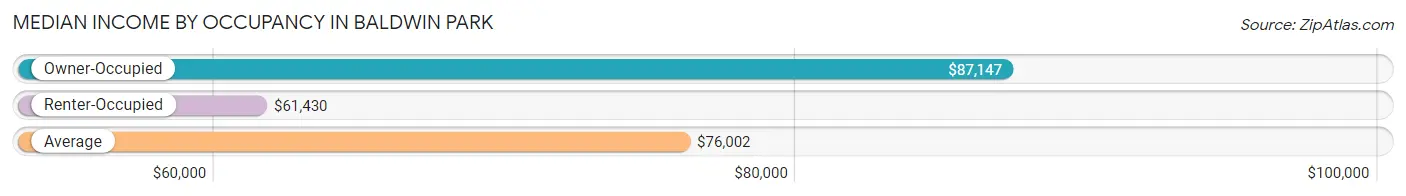
| Occupancy Type | # Households | Median Income |
| Owner-Occupied | 10,681 (59.3%) | $87,147 |
| Renter-Occupied | 7,341 (40.7%) | $61,430 |
| Average | 18,022 (100.0%) | $76,002 |
Occupancy by Householder Income Bracket in Baldwin Park
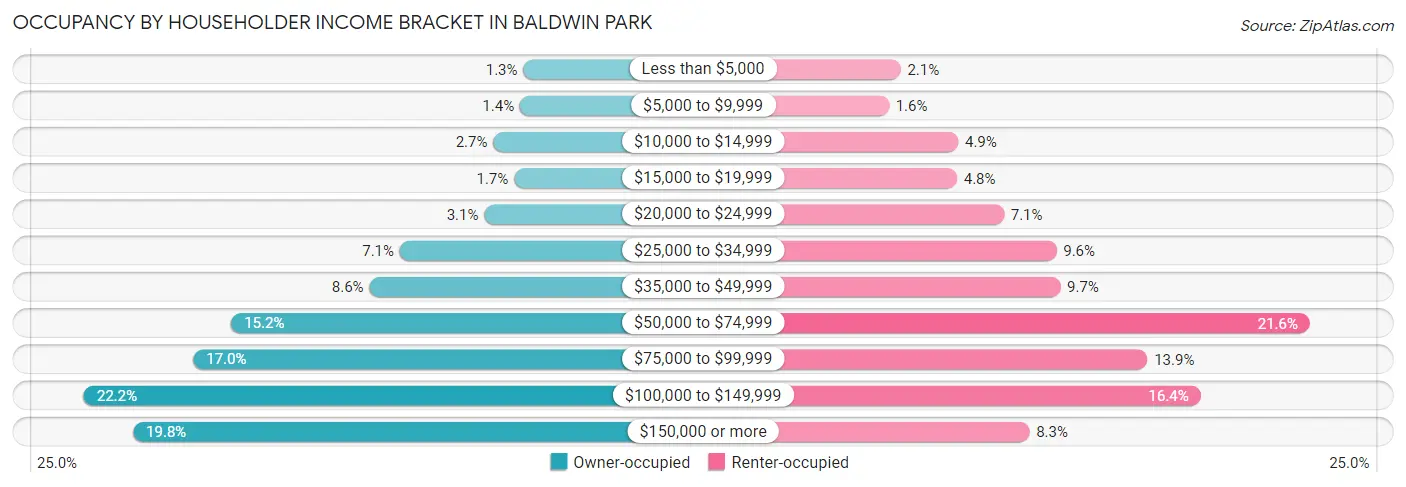
| Income Bracket | Owner-occupied | Renter-occupied |
| Less than $5,000 | 134 (1.3%) | 157 (2.1%) |
| $5,000 to $9,999 | 151 (1.4%) | 116 (1.6%) |
| $10,000 to $14,999 | 286 (2.7%) | 358 (4.9%) |
| $15,000 to $19,999 | 180 (1.7%) | 354 (4.8%) |
| $20,000 to $24,999 | 332 (3.1%) | 518 (7.1%) |
| $25,000 to $34,999 | 762 (7.1%) | 702 (9.6%) |
| $35,000 to $49,999 | 916 (8.6%) | 715 (9.7%) |
| $50,000 to $74,999 | 1,619 (15.2%) | 1,588 (21.6%) |
| $75,000 to $99,999 | 1,813 (17.0%) | 1,020 (13.9%) |
| $100,000 to $149,999 | 2,369 (22.2%) | 1,206 (16.4%) |
| $150,000 or more | 2,119 (19.8%) | 607 (8.3%) |
| Total | 10,681 (100.0%) | 7,341 (100.0%) |
Monthly Housing Cost Tiers in Baldwin Park
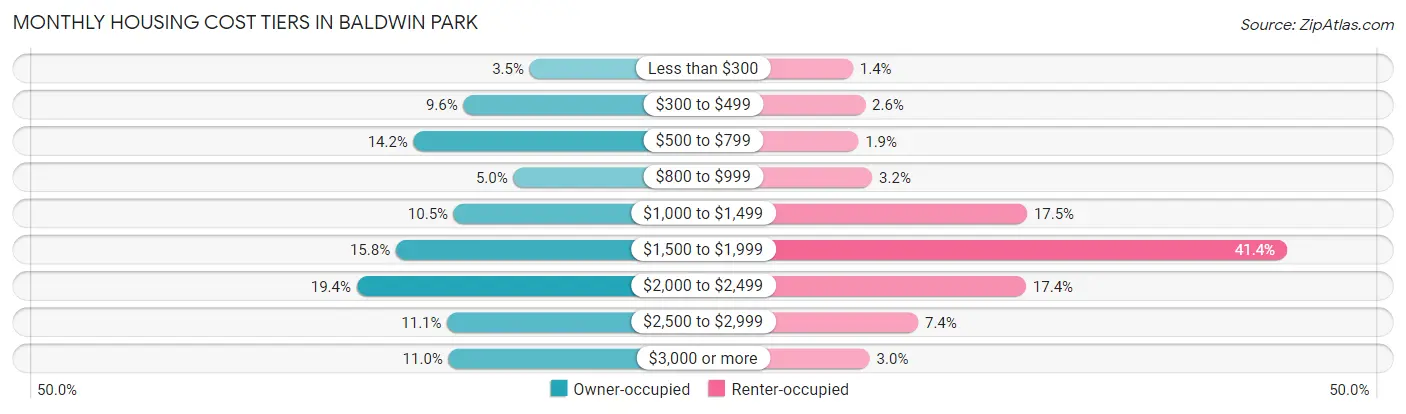
| Monthly Cost | Owner-occupied | Renter-occupied |
| Less than $300 | 373 (3.5%) | 104 (1.4%) |
| $300 to $499 | 1,024 (9.6%) | 187 (2.5%) |
| $500 to $799 | 1,515 (14.2%) | 141 (1.9%) |
| $800 to $999 | 533 (5.0%) | 235 (3.2%) |
| $1,000 to $1,499 | 1,119 (10.5%) | 1,281 (17.4%) |
| $1,500 to $1,999 | 1,689 (15.8%) | 3,038 (41.4%) |
| $2,000 to $2,499 | 2,074 (19.4%) | 1,274 (17.3%) |
| $2,500 to $2,999 | 1,183 (11.1%) | 545 (7.4%) |
| $3,000 or more | 1,171 (11.0%) | 218 (3.0%) |
| Total | 10,681 (100.0%) | 7,341 (100.0%) |
Physical Housing Characteristics in Baldwin Park
Housing Structures in Baldwin Park
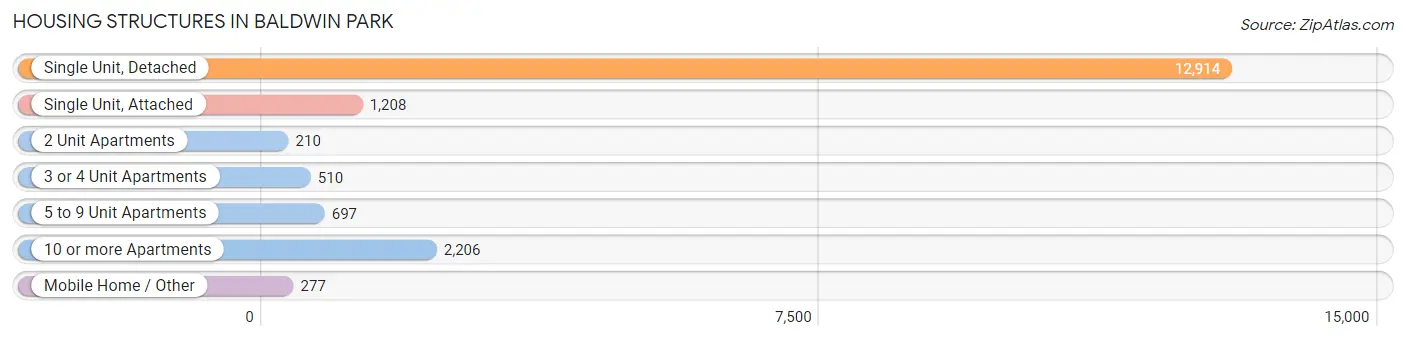
| Structure Type | # Housing Units | % Housing Units |
| Single Unit, Detached | 12,914 | 71.7% |
| Single Unit, Attached | 1,208 | 6.7% |
| 2 Unit Apartments | 210 | 1.2% |
| 3 or 4 Unit Apartments | 510 | 2.8% |
| 5 to 9 Unit Apartments | 697 | 3.9% |
| 10 or more Apartments | 2,206 | 12.2% |
| Mobile Home / Other | 277 | 1.5% |
| Total | 18,022 | 100.0% |
Housing Structures by Occupancy in Baldwin Park
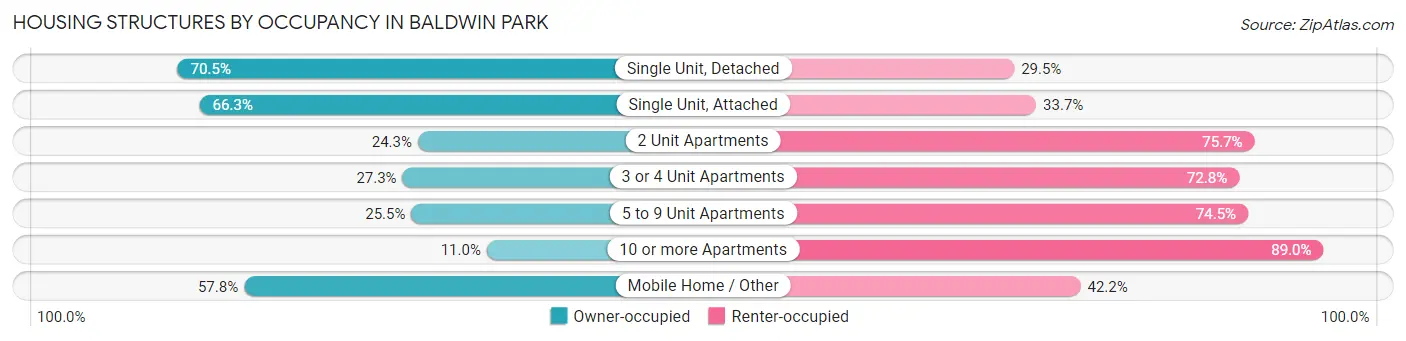
| Structure Type | Owner-occupied | Renter-occupied |
| Single Unit, Detached | 9,109 (70.5%) | 3,805 (29.5%) |
| Single Unit, Attached | 801 (66.3%) | 407 (33.7%) |
| 2 Unit Apartments | 51 (24.3%) | 159 (75.7%) |
| 3 or 4 Unit Apartments | 139 (27.3%) | 371 (72.8%) |
| 5 to 9 Unit Apartments | 178 (25.5%) | 519 (74.5%) |
| 10 or more Apartments | 243 (11.0%) | 1,963 (89.0%) |
| Mobile Home / Other | 160 (57.8%) | 117 (42.2%) |
| Total | 10,681 (59.3%) | 7,341 (40.7%) |
Housing Structures by Number of Rooms in Baldwin Park
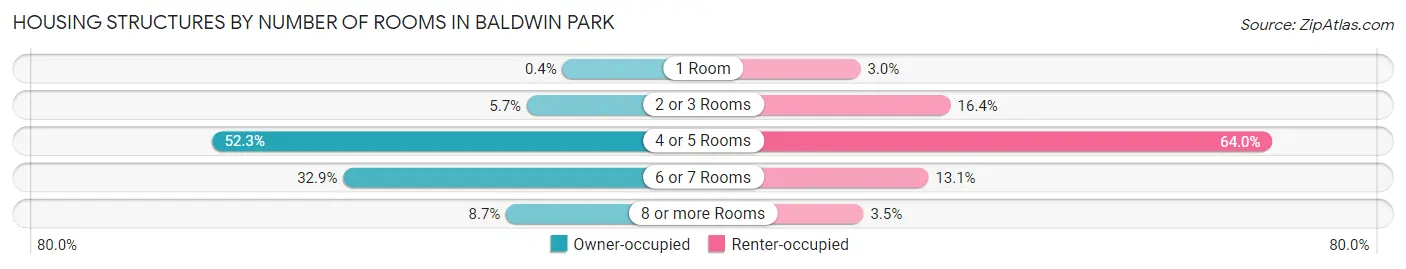
| Number of Rooms | Owner-occupied | Renter-occupied |
| 1 Room | 43 (0.4%) | 223 (3.0%) |
| 2 or 3 Rooms | 606 (5.7%) | 1,203 (16.4%) |
| 4 or 5 Rooms | 5,590 (52.3%) | 4,697 (64.0%) |
| 6 or 7 Rooms | 3,509 (32.9%) | 962 (13.1%) |
| 8 or more Rooms | 933 (8.7%) | 256 (3.5%) |
| Total | 10,681 (100.0%) | 7,341 (100.0%) |
Housing Structure by Heating Type in Baldwin Park
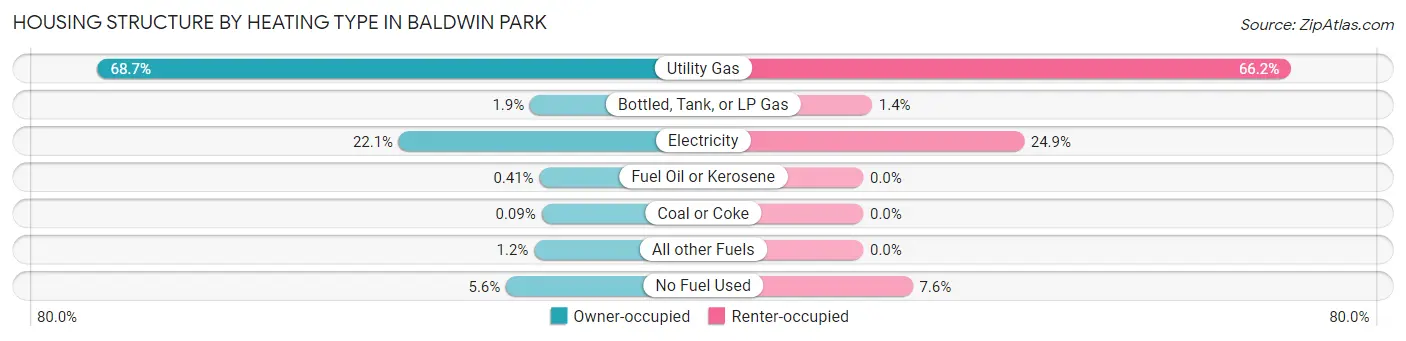
| Heating Type | Owner-occupied | Renter-occupied |
| Utility Gas | 7,340 (68.7%) | 4,856 (66.1%) |
| Bottled, Tank, or LP Gas | 199 (1.9%) | 100 (1.4%) |
| Electricity | 2,364 (22.1%) | 1,824 (24.8%) |
| Fuel Oil or Kerosene | 44 (0.4%) | 0 (0.0%) |
| Coal or Coke | 10 (0.1%) | 0 (0.0%) |
| All other Fuels | 130 (1.2%) | 0 (0.0%) |
| No Fuel Used | 594 (5.6%) | 561 (7.6%) |
| Total | 10,681 (100.0%) | 7,341 (100.0%) |
Household Vehicle Usage in Baldwin Park
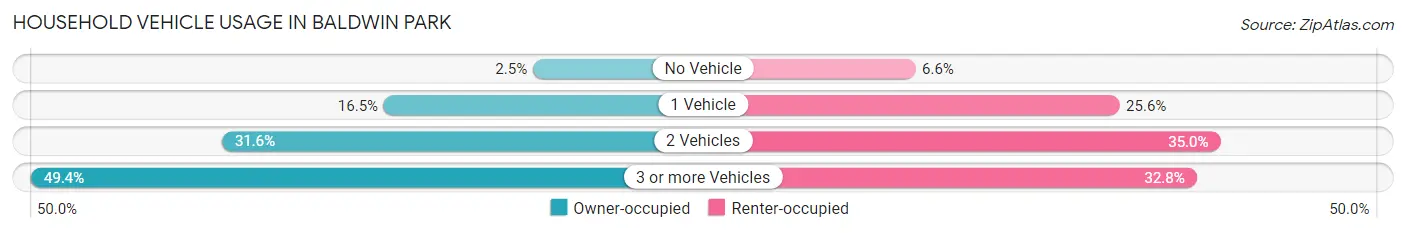
| Vehicles per Household | Owner-occupied | Renter-occupied |
| No Vehicle | 271 (2.5%) | 481 (6.6%) |
| 1 Vehicle | 1,758 (16.5%) | 1,879 (25.6%) |
| 2 Vehicles | 3,374 (31.6%) | 2,572 (35.0%) |
| 3 or more Vehicles | 5,278 (49.4%) | 2,409 (32.8%) |
| Total | 10,681 (100.0%) | 7,341 (100.0%) |
Real Estate & Mortgages in Baldwin Park
Real Estate and Mortgage Overview in Baldwin Park
| Characteristic | Without Mortgage | With Mortgage |
| Housing Units | 3,359 | 7,322 |
| Median Property Value | $544,900 | $556,900 |
| Median Household Income | $75,612 | $1,495 |
| Monthly Housing Costs | $570 | $1,136 |
| Real Estate Taxes | $3,346 | $133 |
Property Value by Mortgage Status in Baldwin Park
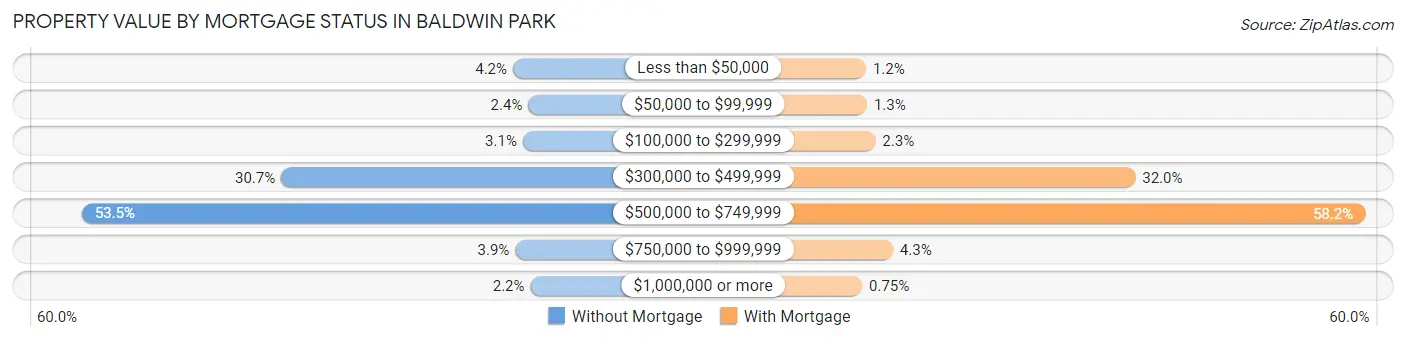
| Property Value | Without Mortgage | With Mortgage |
| Less than $50,000 | 141 (4.2%) | 87 (1.2%) |
| $50,000 to $99,999 | 82 (2.4%) | 96 (1.3%) |
| $100,000 to $299,999 | 103 (3.1%) | 166 (2.3%) |
| $300,000 to $499,999 | 1,031 (30.7%) | 2,341 (32.0%) |
| $500,000 to $749,999 | 1,796 (53.5%) | 4,264 (58.2%) |
| $750,000 to $999,999 | 132 (3.9%) | 313 (4.3%) |
| $1,000,000 or more | 74 (2.2%) | 55 (0.7%) |
| Total | 3,359 (100.0%) | 7,322 (100.0%) |
Household Income by Mortgage Status in Baldwin Park
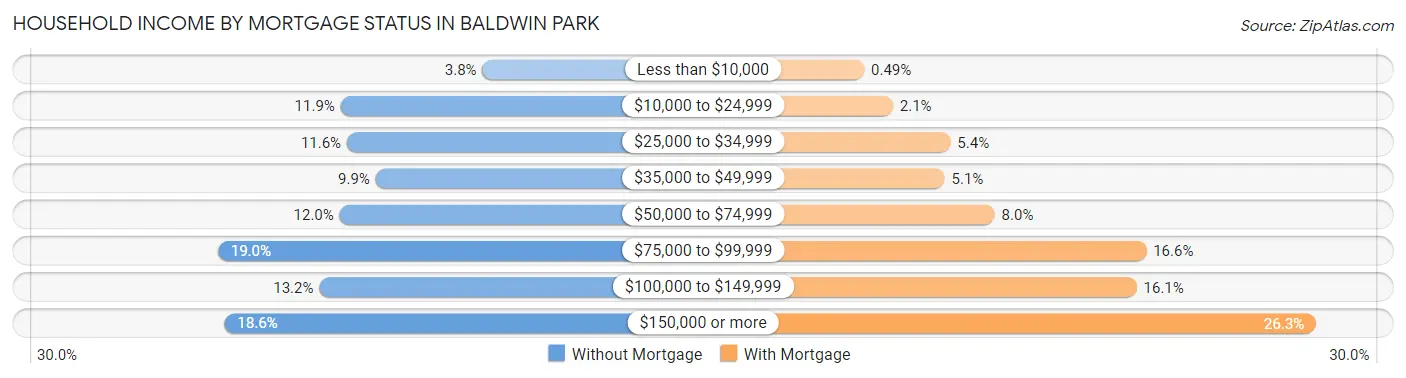
| Household Income | Without Mortgage | With Mortgage |
| Less than $10,000 | 129 (3.8%) | 36 (0.5%) |
| $10,000 to $24,999 | 401 (11.9%) | 156 (2.1%) |
| $25,000 to $34,999 | 389 (11.6%) | 397 (5.4%) |
| $35,000 to $49,999 | 334 (9.9%) | 373 (5.1%) |
| $50,000 to $74,999 | 403 (12.0%) | 582 (8.0%) |
| $75,000 to $99,999 | 637 (19.0%) | 1,216 (16.6%) |
| $100,000 to $149,999 | 442 (13.2%) | 1,176 (16.1%) |
| $150,000 or more | 624 (18.6%) | 1,927 (26.3%) |
| Total | 3,359 (100.0%) | 7,322 (100.0%) |
Property Value to Household Income Ratio in Baldwin Park
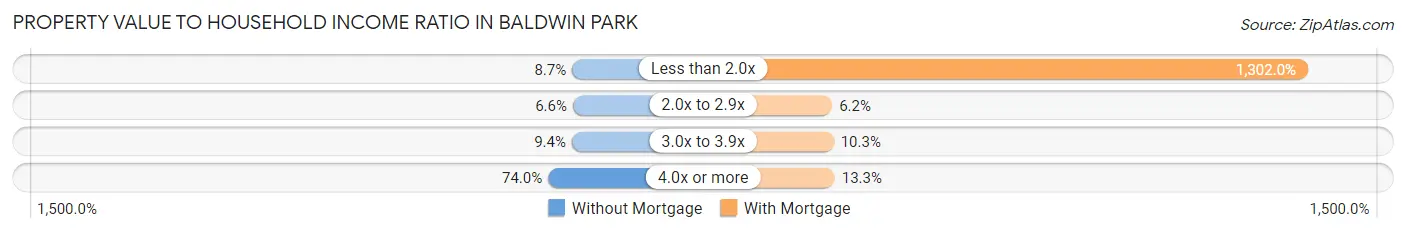
| Value-to-Income Ratio | Without Mortgage | With Mortgage |
| Less than 2.0x | 291 (8.7%) | 95,330 (1,302.0%) |
| 2.0x to 2.9x | 220 (6.6%) | 456 (6.2%) |
| 3.0x to 3.9x | 315 (9.4%) | 756 (10.3%) |
| 4.0x or more | 2,485 (74.0%) | 971 (13.3%) |
| Total | 3,359 (100.0%) | 7,322 (100.0%) |
Real Estate Taxes by Mortgage Status in Baldwin Park
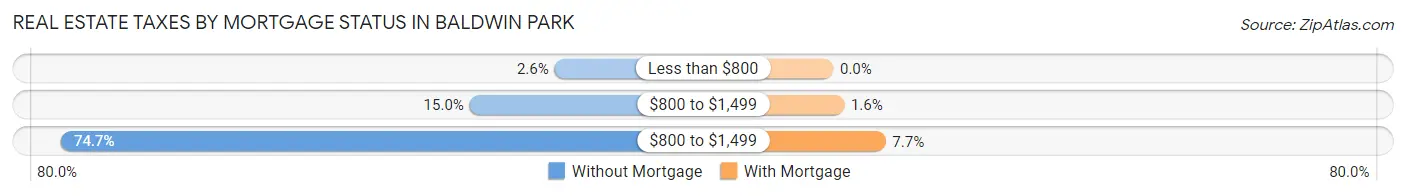
| Property Taxes | Without Mortgage | With Mortgage |
| Less than $800 | 86 (2.6%) | 0 (0.0%) |
| $800 to $1,499 | 503 (15.0%) | 117 (1.6%) |
| $800 to $1,499 | 2,508 (74.7%) | 560 (7.6%) |
| Total | 3,359 (100.0%) | 7,322 (100.0%) |
Health & Disability in Baldwin Park
Health Insurance Coverage by Age in Baldwin Park
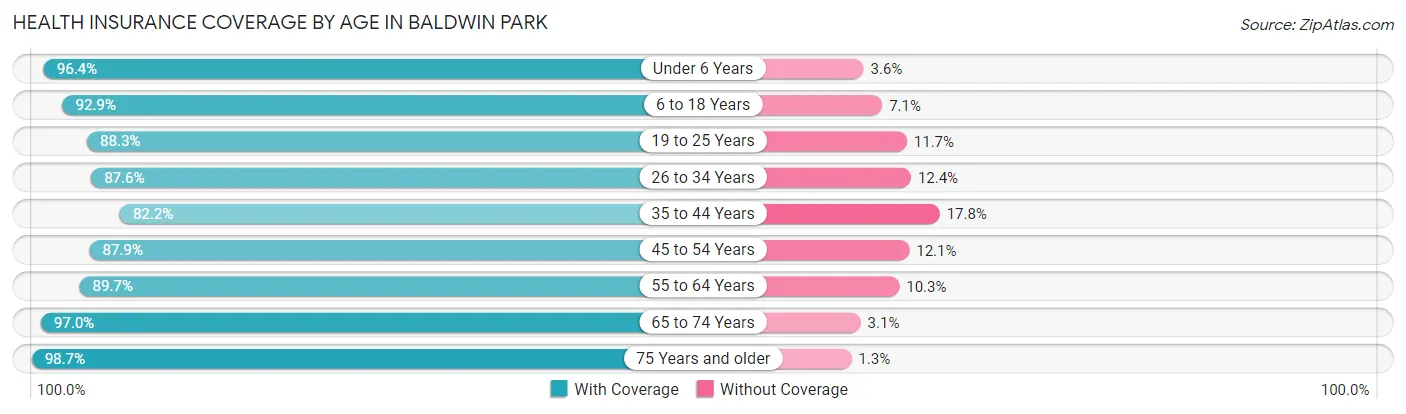
| Age Bracket | With Coverage | Without Coverage |
| Under 6 Years | 4,121 (96.4%) | 154 (3.6%) |
| 6 to 18 Years | 11,144 (92.9%) | 849 (7.1%) |
| 19 to 25 Years | 7,203 (88.3%) | 952 (11.7%) |
| 26 to 34 Years | 8,298 (87.6%) | 1,178 (12.4%) |
| 35 to 44 Years | 7,641 (82.2%) | 1,653 (17.8%) |
| 45 to 54 Years | 8,892 (87.9%) | 1,226 (12.1%) |
| 55 to 64 Years | 7,737 (89.7%) | 885 (10.3%) |
| 65 to 74 Years | 5,492 (97.0%) | 173 (3.0%) |
| 75 Years and older | 3,683 (98.7%) | 50 (1.3%) |
| Total | 64,211 (90.0%) | 7,120 (10.0%) |
Health Insurance Coverage by Citizenship Status in Baldwin Park
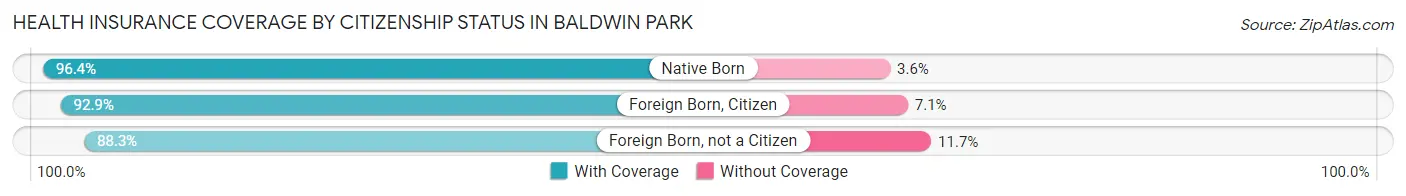
| Citizenship Status | With Coverage | Without Coverage |
| Native Born | 4,121 (96.4%) | 154 (3.6%) |
| Foreign Born, Citizen | 11,144 (92.9%) | 849 (7.1%) |
| Foreign Born, not a Citizen | 7,203 (88.3%) | 952 (11.7%) |
Health Insurance Coverage by Household Income in Baldwin Park
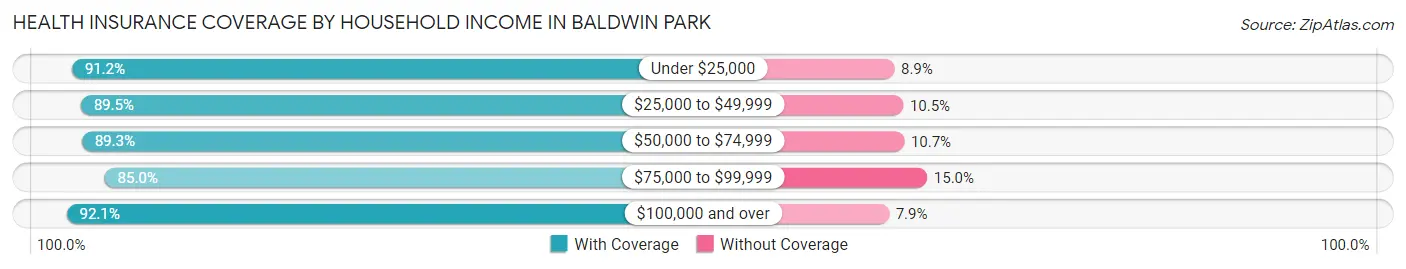
| Household Income | With Coverage | Without Coverage |
| Under $25,000 | 5,600 (91.1%) | 544 (8.8%) |
| $25,000 to $49,999 | 8,788 (89.5%) | 1,033 (10.5%) |
| $50,000 to $74,999 | 11,444 (89.3%) | 1,372 (10.7%) |
| $75,000 to $99,999 | 9,923 (85.0%) | 1,751 (15.0%) |
| $100,000 and over | 28,246 (92.1%) | 2,411 (7.9%) |
Public vs Private Health Insurance Coverage by Age in Baldwin Park
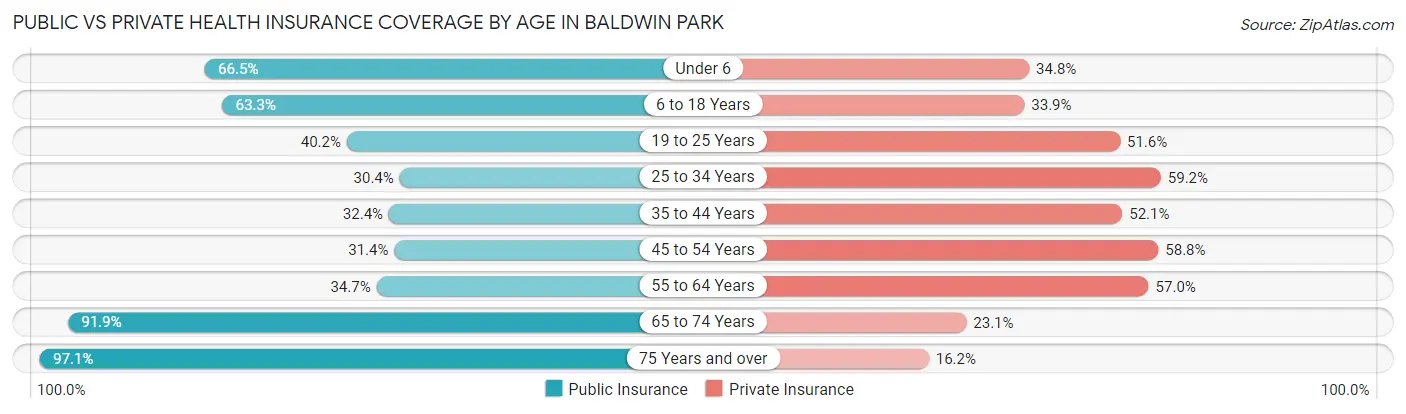
| Age Bracket | Public Insurance | Private Insurance |
| Under 6 | 2,842 (66.5%) | 1,487 (34.8%) |
| 6 to 18 Years | 7,586 (63.2%) | 4,064 (33.9%) |
| 19 to 25 Years | 3,278 (40.2%) | 4,211 (51.6%) |
| 25 to 34 Years | 2,880 (30.4%) | 5,612 (59.2%) |
| 35 to 44 Years | 3,009 (32.4%) | 4,838 (52.1%) |
| 45 to 54 Years | 3,175 (31.4%) | 5,945 (58.8%) |
| 55 to 64 Years | 2,991 (34.7%) | 4,911 (57.0%) |
| 65 to 74 Years | 5,205 (91.9%) | 1,310 (23.1%) |
| 75 Years and over | 3,626 (97.1%) | 603 (16.2%) |
| Total | 34,592 (48.5%) | 32,981 (46.2%) |
Disability Status by Sex by Age in Baldwin Park
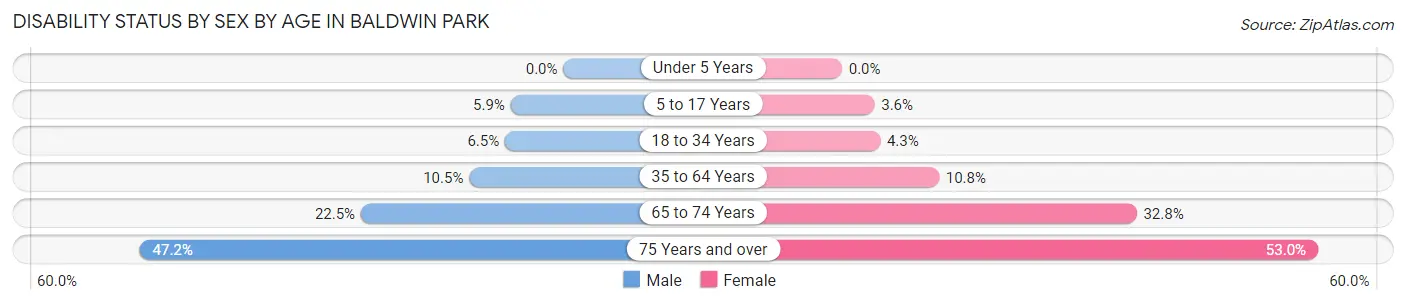
| Age Bracket | Male | Female |
| Under 5 Years | 0 (0.0%) | 0 (0.0%) |
| 5 to 17 Years | 344 (5.9%) | 201 (3.6%) |
| 18 to 34 Years | 635 (6.5%) | 379 (4.3%) |
| 35 to 64 Years | 1,478 (10.5%) | 1,504 (10.8%) |
| 65 to 74 Years | 564 (22.5%) | 1,038 (32.8%) |
| 75 Years and over | 706 (47.2%) | 1,186 (53.0%) |
Disability Class by Sex by Age in Baldwin Park
Disability Class: Hearing Difficulty
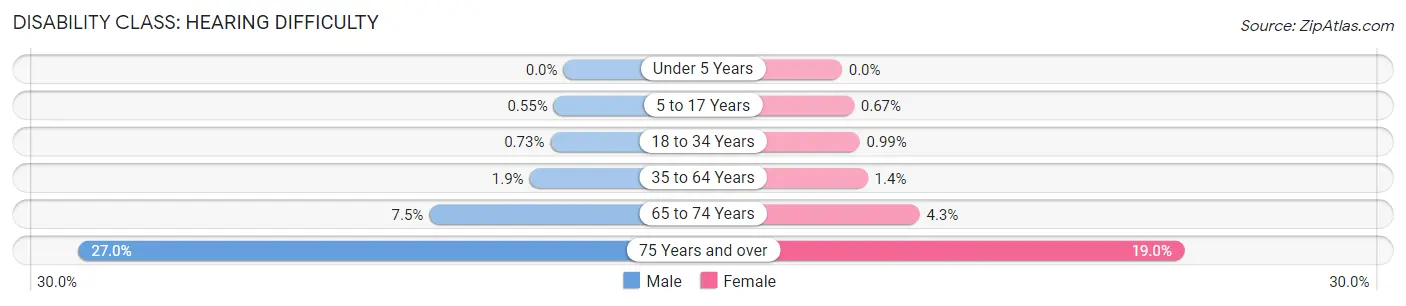
| Age Bracket | Male | Female |
| Under 5 Years | 0 (0.0%) | 0 (0.0%) |
| 5 to 17 Years | 32 (0.5%) | 37 (0.7%) |
| 18 to 34 Years | 71 (0.7%) | 88 (1.0%) |
| 35 to 64 Years | 267 (1.9%) | 200 (1.4%) |
| 65 to 74 Years | 187 (7.5%) | 137 (4.3%) |
| 75 Years and over | 404 (27.0%) | 426 (19.0%) |
Disability Class: Vision Difficulty
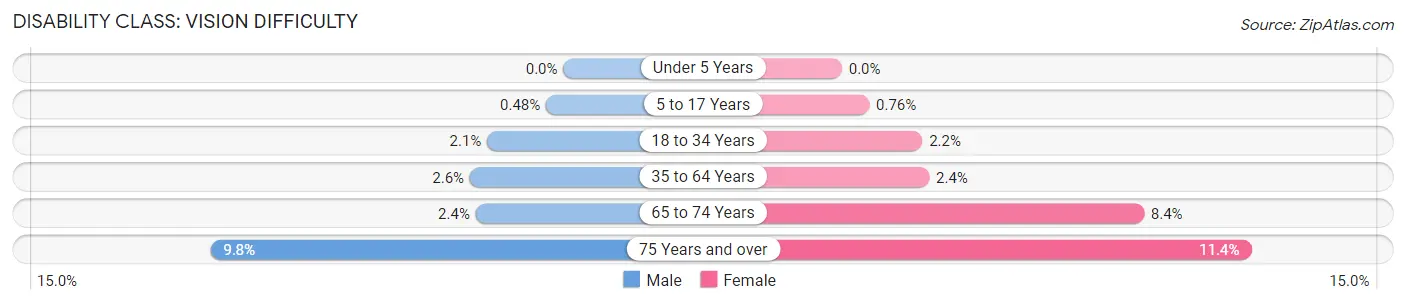
| Age Bracket | Male | Female |
| Under 5 Years | 0 (0.0%) | 0 (0.0%) |
| 5 to 17 Years | 28 (0.5%) | 42 (0.8%) |
| 18 to 34 Years | 207 (2.1%) | 200 (2.2%) |
| 35 to 64 Years | 367 (2.6%) | 339 (2.4%) |
| 65 to 74 Years | 61 (2.4%) | 266 (8.4%) |
| 75 Years and over | 147 (9.8%) | 255 (11.4%) |
Disability Class: Cognitive Difficulty
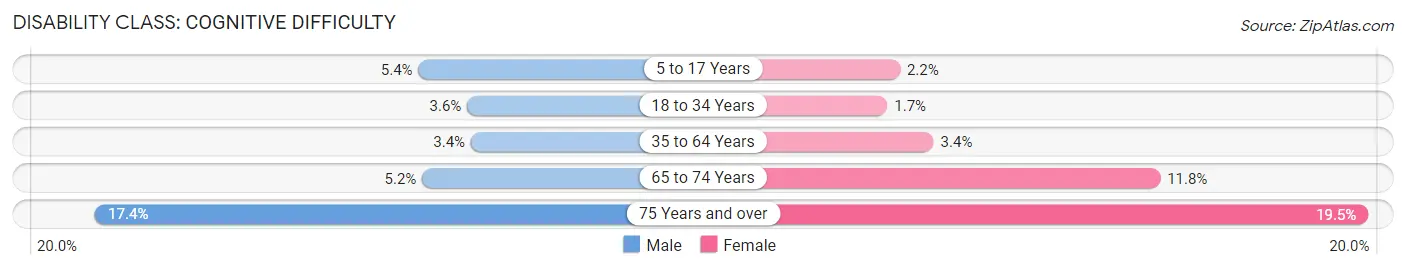
| Age Bracket | Male | Female |
| 5 to 17 Years | 315 (5.4%) | 120 (2.2%) |
| 18 to 34 Years | 349 (3.6%) | 151 (1.7%) |
| 35 to 64 Years | 484 (3.4%) | 475 (3.4%) |
| 65 to 74 Years | 131 (5.2%) | 374 (11.8%) |
| 75 Years and over | 260 (17.4%) | 437 (19.5%) |
Disability Class: Ambulatory Difficulty
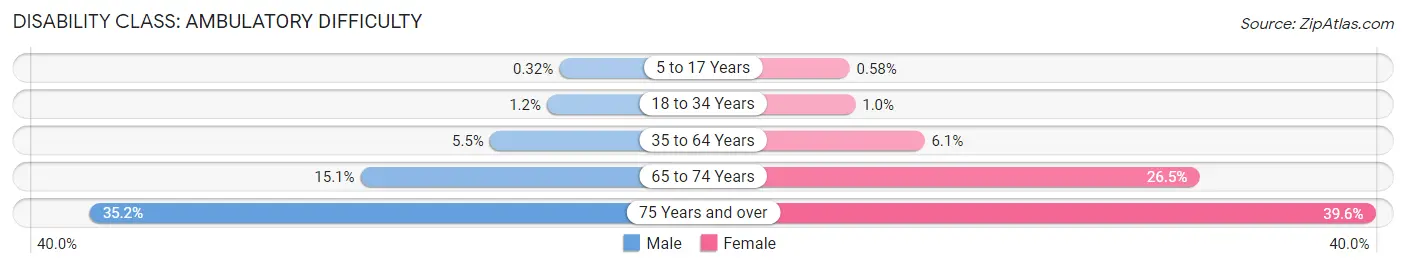
| Age Bracket | Male | Female |
| 5 to 17 Years | 19 (0.3%) | 32 (0.6%) |
| 18 to 34 Years | 120 (1.2%) | 89 (1.0%) |
| 35 to 64 Years | 772 (5.5%) | 855 (6.1%) |
| 65 to 74 Years | 377 (15.1%) | 839 (26.5%) |
| 75 Years and over | 526 (35.2%) | 886 (39.6%) |
Disability Class: Self-Care Difficulty
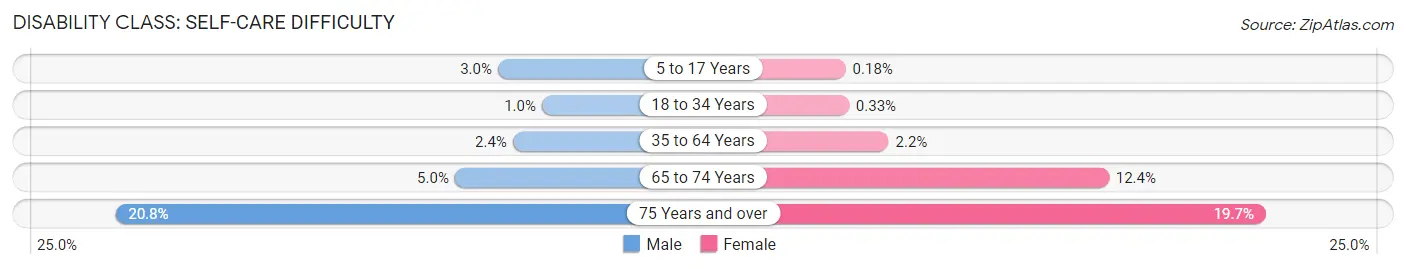
| Age Bracket | Male | Female |
| 5 to 17 Years | 178 (3.0%) | 10 (0.2%) |
| 18 to 34 Years | 98 (1.0%) | 29 (0.3%) |
| 35 to 64 Years | 331 (2.4%) | 302 (2.2%) |
| 65 to 74 Years | 126 (5.0%) | 392 (12.4%) |
| 75 Years and over | 311 (20.8%) | 440 (19.7%) |
Technology Access in Baldwin Park
Computing Device Access in Baldwin Park
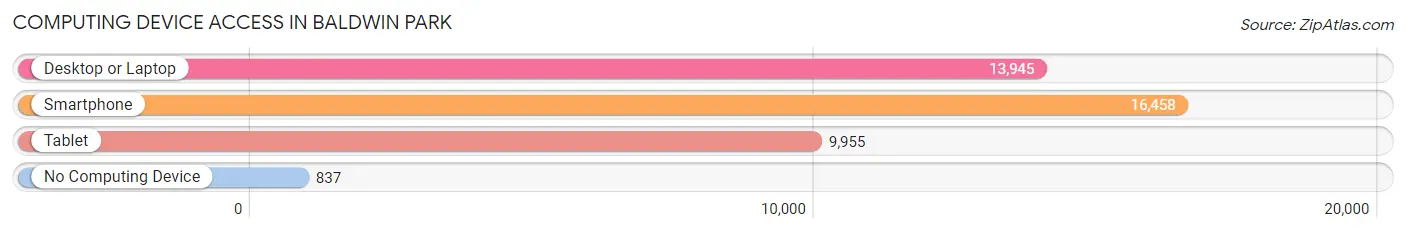
| Device Type | # Households | % Households |
| Desktop or Laptop | 13,945 | 77.4% |
| Smartphone | 16,458 | 91.3% |
| Tablet | 9,955 | 55.2% |
| No Computing Device | 837 | 4.6% |
| Total | 18,022 | 100.0% |
Internet Access in Baldwin Park
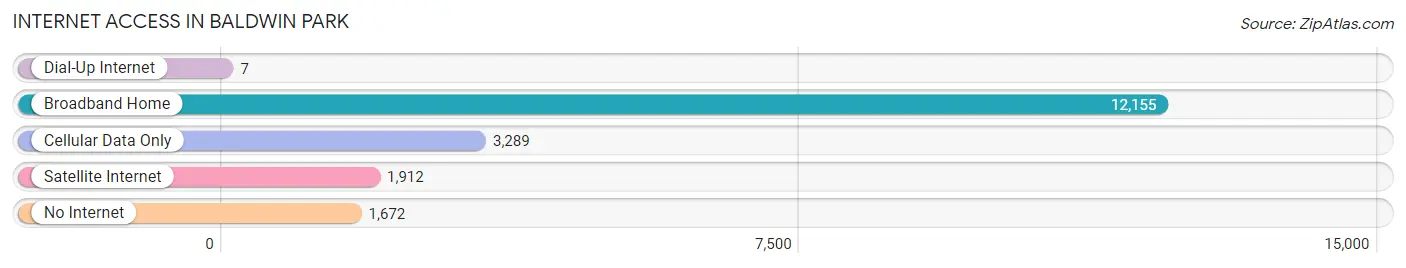
| Internet Type | # Households | % Households |
| Dial-Up Internet | 7 | 0.0% |
| Broadband Home | 12,155 | 67.4% |
| Cellular Data Only | 3,289 | 18.2% |
| Satellite Internet | 1,912 | 10.6% |
| No Internet | 1,672 | 9.3% |
| Total | 18,022 | 100.0% |
Baldwin Park Summary
Baldwin Park is a city located in the San Gabriel Valley region of Los Angeles County, California. It is located about 20 miles east of downtown Los Angeles and is part of the Greater Los Angeles Area. The city has a population of about 75,000 people and is known for its diverse population and vibrant culture.
Geography
Baldwin Park is located in the San Gabriel Valley region of Los Angeles County, California. It is bordered by the cities of El Monte, West Covina, and Irwindale to the north, Azusa to the east, Covina to the south, and the San Gabriel Mountains to the west. The city covers an area of 8.5 square miles and has an elevation of 545 feet.
The city is divided into several distinct neighborhoods, including Baldwin Park, Midway City, and North Baldwin Park. The city is also home to several parks, including Baldwin Park Lake, which is a popular spot for fishing and picnicking.
History
Baldwin Park was founded in 1906 by Elias J. "Lucky" Baldwin, a wealthy landowner and developer. The city was named after him and was incorporated in 1956.
In the early 20th century, Baldwin Park was a rural farming community. The city experienced rapid growth in the 1950s and 1960s, as the population increased from about 5,000 to over 75,000.
Economy
Baldwin Park is home to a diverse economy. The city is home to several major employers, including the Los Angeles County Department of Public Health, the Los Angeles County Sheriff's Department, and the Los Angeles County Fire Department.
The city is also home to several retail and commercial businesses, including the Baldwin Park Town Center, which is a popular shopping destination. The city is also home to several industrial parks, which are home to a variety of manufacturing and distribution companies.
Demographics
As of the 2010 census, Baldwin Park had a population of 75,390 people. The racial makeup of the city was 57.2% Hispanic or Latino, 28.2% White, 8.2% Asian, 4.2% African American, and 2.2% other.
The median household income in Baldwin Park was $50,945, and the median family income was $54,945. The per capita income was $20,945.
Conclusion
Baldwin Park is a vibrant city located in the San Gabriel Valley region of Los Angeles County, California. The city has a diverse population and a thriving economy. It is home to several major employers and is a popular shopping destination. The city is also home to several parks and recreational areas, making it a great place to live and work.
Common Questions
What is Per Capita Income in Baldwin Park?
Per Capita income in Baldwin Park is $24,664.
What is the Median Family Income in Baldwin Park?
Median Family Income in Baldwin Park is $75,229.
What is the Median Household income in Baldwin Park?
Median Household Income in Baldwin Park is $76,002.
What is Income or Wage Gap in Baldwin Park?
Income or Wage Gap in Baldwin Park is 20.7%.
Women in Baldwin Park earn 79.3 cents for every dollar earned by a man.
What is Family Income Deficit in Baldwin Park?
Family Income Deficit in Baldwin Park is $10,003.
Families that are below poverty line in Baldwin Park earn $10,003 less on average than the poverty threshold level.
What is Inequality or Gini Index in Baldwin Park?
Inequality or Gini Index in Baldwin Park is 0.41.
What is the Total Population of Baldwin Park?
Total Population of Baldwin Park is 71,692.
What is the Total Male Population of Baldwin Park?
Total Male Population of Baldwin Park is 35,696.
What is the Total Female Population of Baldwin Park?
Total Female Population of Baldwin Park is 35,996.
What is the Ratio of Males per 100 Females in Baldwin Park?
There are 99.17 Males per 100 Females in Baldwin Park.
What is the Ratio of Females per 100 Males in Baldwin Park?
There are 100.84 Females per 100 Males in Baldwin Park.
What is the Median Population Age in Baldwin Park?
Median Population Age in Baldwin Park is 37.1 Years.
What is the Average Family Size in Baldwin Park
Average Family Size in Baldwin Park is 4.2 People.
What is the Average Household Size in Baldwin Park
Average Household Size in Baldwin Park is 4.0 People.
How Large is the Labor Force in Baldwin Park?
There are 36,443 People in the Labor Forcein in Baldwin Park.
What is the Percentage of People in the Labor Force in Baldwin Park?
62.4% of People are in the Labor Force in Baldwin Park.
What is the Unemployment Rate in Baldwin Park?
Unemployment Rate in Baldwin Park is 7.1%.