Walnut Park, CA Map & Demographics
Walnut Park Map
Walnut Park Overview
$21,571
PER CAPITA INCOME
$67,412
AVG FAMILY INCOME
$71,683
AVG HOUSEHOLD INCOME
24.9%
WAGE / INCOME GAP [ % ]
75.1¢/ $1
WAGE / INCOME GAP [ $ ]
0.41
INEQUALITY / GINI INDEX
16,209
TOTAL POPULATION
8,391
MALE POPULATION
7,818
FEMALE POPULATION
107.33
MALES / 100 FEMALES
93.17
FEMALES / 100 MALES
35.9
MEDIAN AGE
4.3
AVG FAMILY SIZE
4.2
AVG HOUSEHOLD SIZE
8,032
LABOR FORCE [ PEOPLE ]
63.6%
PERCENT IN LABOR FORCE
9.3%
UNEMPLOYMENT RATE
Walnut Park Area Codes
Income in Walnut Park
Income Overview in Walnut Park
Per Capita Income in Walnut Park is $21,571, while median incomes of families and households are $67,412 and $71,683 respectively.
| Characteristic | Number | Measure |
| Per Capita Income | 16,209 | $21,571 |
| Median Family Income | 3,322 | $67,412 |
| Mean Family Income | 3,322 | $79,770 |
| Median Household Income | 3,821 | $71,683 |
| Mean Household Income | 3,821 | $86,008 |
| Income Deficit | 3,322 | $0 |
| Wage / Income Gap (%) | 16,209 | 24.90% |
| Wage / Income Gap ($) | 16,209 | 75.10¢ per $1 |
| Gini / Inequality Index | 16,209 | 0.41 |
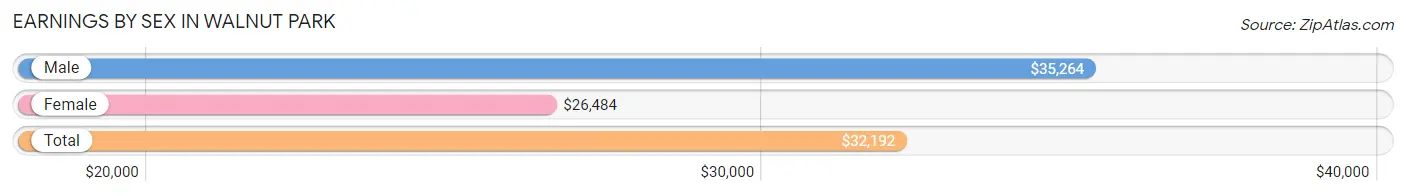
Earnings by Sex in Walnut Park
Average Earnings in Walnut Park are $32,192, $35,264 for men and $26,484 for women, a difference of 24.9%.
| Sex | Number | Average Earnings |
| Male | 4,646 (59.1%) | $35,264 |
| Female | 3,218 (40.9%) | $26,484 |
| Total | 7,864 (100.0%) | $32,192 |
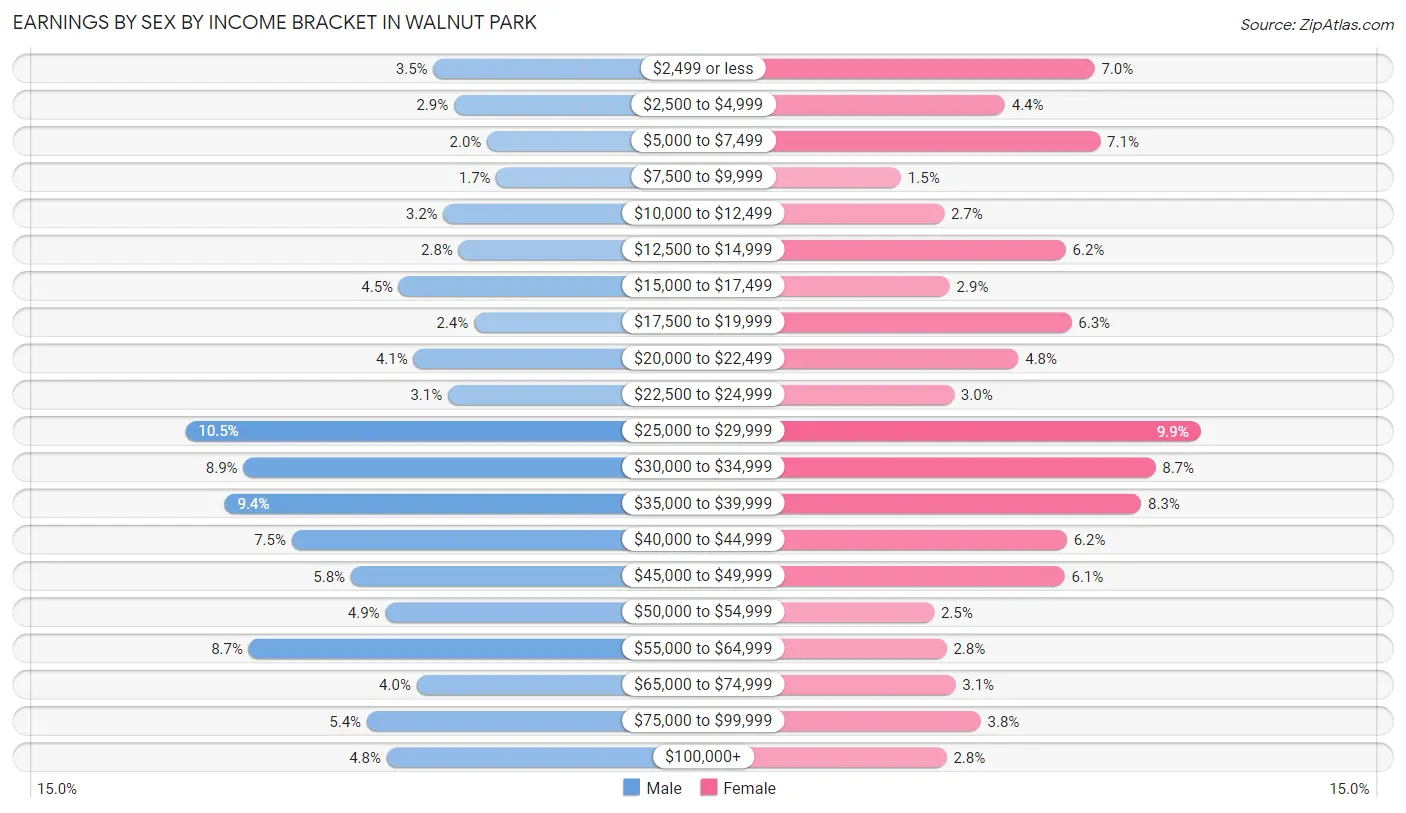
Earnings by Sex by Income Bracket in Walnut Park
The most common earnings brackets in Walnut Park are $25,000 to $29,999 for men (487 | 10.5%) and $25,000 to $29,999 for women (320 | 9.9%).
| Income | Male | Female |
| $2,499 or less | 163 (3.5%) | 224 (7.0%) |
| $2,500 to $4,999 | 136 (2.9%) | 143 (4.4%) |
| $5,000 to $7,499 | 93 (2.0%) | 229 (7.1%) |
| $7,500 to $9,999 | 81 (1.7%) | 49 (1.5%) |
| $10,000 to $12,499 | 150 (3.2%) | 88 (2.7%) |
| $12,500 to $14,999 | 130 (2.8%) | 198 (6.1%) |
| $15,000 to $17,499 | 208 (4.5%) | 93 (2.9%) |
| $17,500 to $19,999 | 110 (2.4%) | 203 (6.3%) |
| $20,000 to $22,499 | 189 (4.1%) | 155 (4.8%) |
| $22,500 to $24,999 | 144 (3.1%) | 97 (3.0%) |
| $25,000 to $29,999 | 487 (10.5%) | 320 (9.9%) |
| $30,000 to $34,999 | 411 (8.8%) | 279 (8.7%) |
| $35,000 to $39,999 | 436 (9.4%) | 266 (8.3%) |
| $40,000 to $44,999 | 348 (7.5%) | 199 (6.2%) |
| $45,000 to $49,999 | 271 (5.8%) | 197 (6.1%) |
| $50,000 to $54,999 | 226 (4.9%) | 79 (2.5%) |
| $55,000 to $64,999 | 404 (8.7%) | 90 (2.8%) |
| $65,000 to $74,999 | 185 (4.0%) | 98 (3.0%) |
| $75,000 to $99,999 | 250 (5.4%) | 121 (3.8%) |
| $100,000+ | 224 (4.8%) | 90 (2.8%) |
| Total | 4,646 (100.0%) | 3,218 (100.0%) |
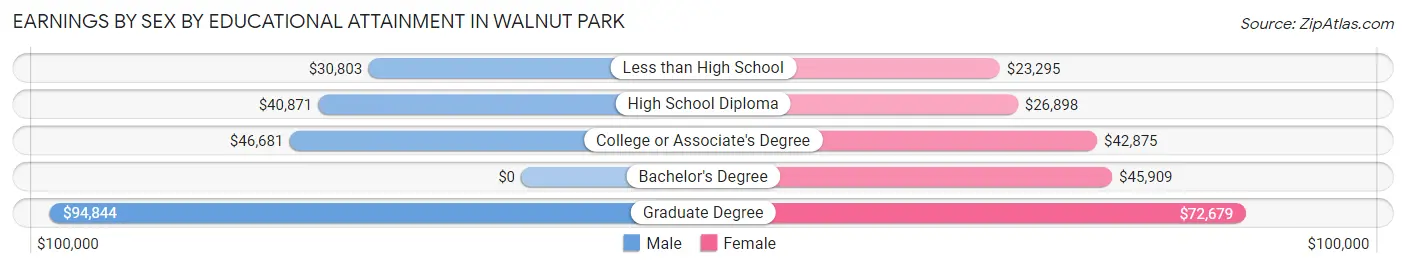
Earnings by Sex by Educational Attainment in Walnut Park
Average earnings in Walnut Park are $37,194 for men and $29,190 for women, a difference of 21.5%. Men with an educational attainment of graduate degree enjoy the highest average annual earnings of $94,844, while those with less than high school education earn the least with $30,803. Women with an educational attainment of graduate degree earn the most with the average annual earnings of $72,679, while those with less than high school education have the smallest earnings of $23,295.
| Educational Attainment | Male Income | Female Income |
| Less than High School | $30,803 | $23,295 |
| High School Diploma | $40,871 | $26,898 |
| College or Associate's Degree | $46,681 | $42,875 |
| Bachelor's Degree | - | - |
| Graduate Degree | $94,844 | $72,679 |
| Total | $37,194 | $29,190 |
Family Income in Walnut Park
Family Income Brackets in Walnut Park
According to the Walnut Park family income data, there are 718 families falling into the $50,000 to $74,999 income range, which is the most common income bracket and makes up 21.6% of all families. Conversely, the less than $10,000 income bracket is the least frequent group with only 100 families (3.0%) belonging to this category.
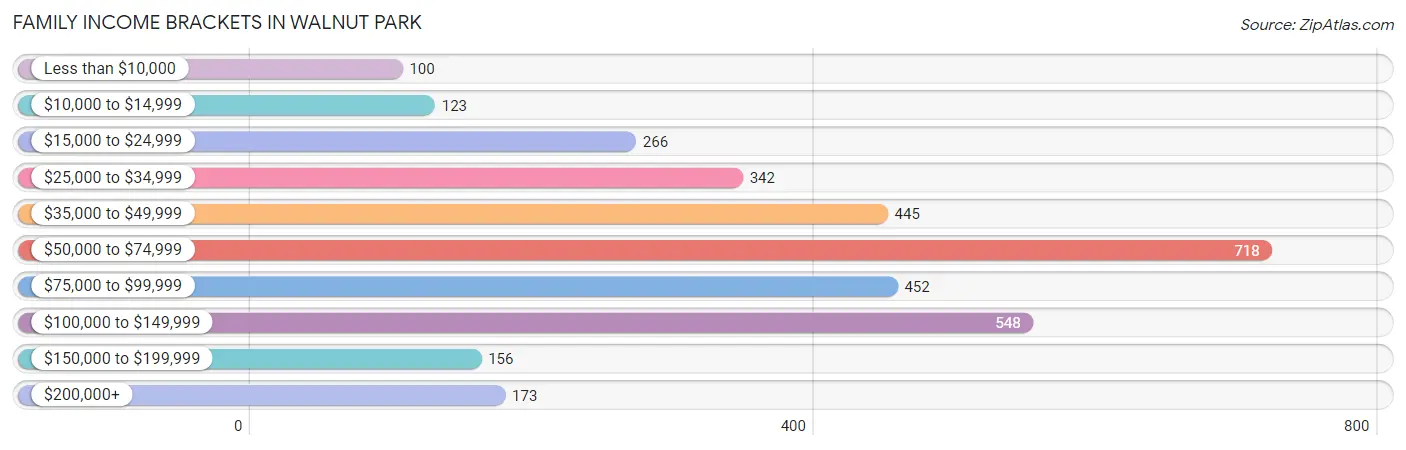
| Income Bracket | # Families | % Families |
| Less than $10,000 | 100 | 3.0% |
| $10,000 to $14,999 | 123 | 3.7% |
| $15,000 to $24,999 | 266 | 8.0% |
| $25,000 to $34,999 | 342 | 10.3% |
| $35,000 to $49,999 | 445 | 13.4% |
| $50,000 to $74,999 | 718 | 21.6% |
| $75,000 to $99,999 | 452 | 13.6% |
| $100,000 to $149,999 | 548 | 16.5% |
| $150,000 to $199,999 | 156 | 4.7% |
| $200,000+ | 173 | 5.2% |
Family Income by Famaliy Size in Walnut Park
7+ person families (397 | 11.9%) account for the highest median family income in Walnut Park with $110,987 per family, while 3-person families (749 | 22.6%) have the highest median income of $23,806 per family member.
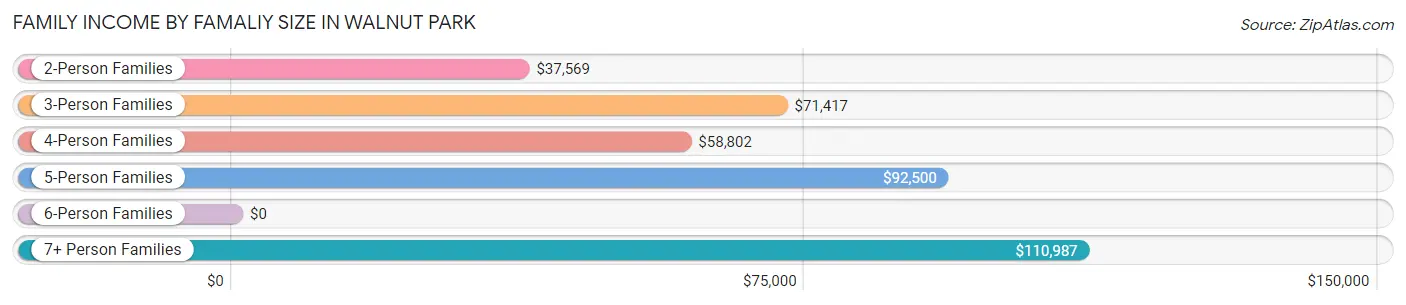
| Income Bracket | # Families | Median Income |
| 2-Person Families | 762 (22.9%) | $37,569 |
| 3-Person Families | 749 (22.6%) | $71,417 |
| 4-Person Families | 745 (22.4%) | $58,802 |
| 5-Person Families | 356 (10.7%) | $92,500 |
| 6-Person Families | 313 (9.4%) | $0 |
| 7+ Person Families | 397 (11.9%) | $110,987 |
| Total | 3,322 (100.0%) | $67,412 |
Family Income by Number of Earners in Walnut Park
The median family income in Walnut Park is $67,412, with families comprising 3+ earners (875) having the highest median family income of $112,841, while families with no earners (317) have the lowest median family income of $25,388, accounting for 26.3% and 9.5% of families, respectively.
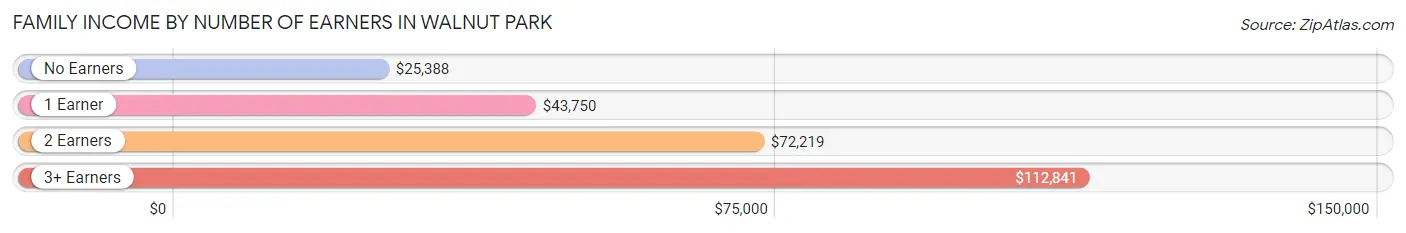
| Number of Earners | # Families | Median Income |
| No Earners | 317 (9.5%) | $25,388 |
| 1 Earner | 1,277 (38.4%) | $43,750 |
| 2 Earners | 853 (25.7%) | $72,219 |
| 3+ Earners | 875 (26.3%) | $112,841 |
| Total | 3,322 (100.0%) | $67,412 |
Household Income in Walnut Park
Household Income Brackets in Walnut Park
With 760 households falling in the category, the $50,000 to $74,999 income range is the most frequent in Walnut Park, accounting for 19.9% of all households. In contrast, only 153 households (4.0%) fall into the $10,000 to $14,999 income bracket, making it the least populous group.
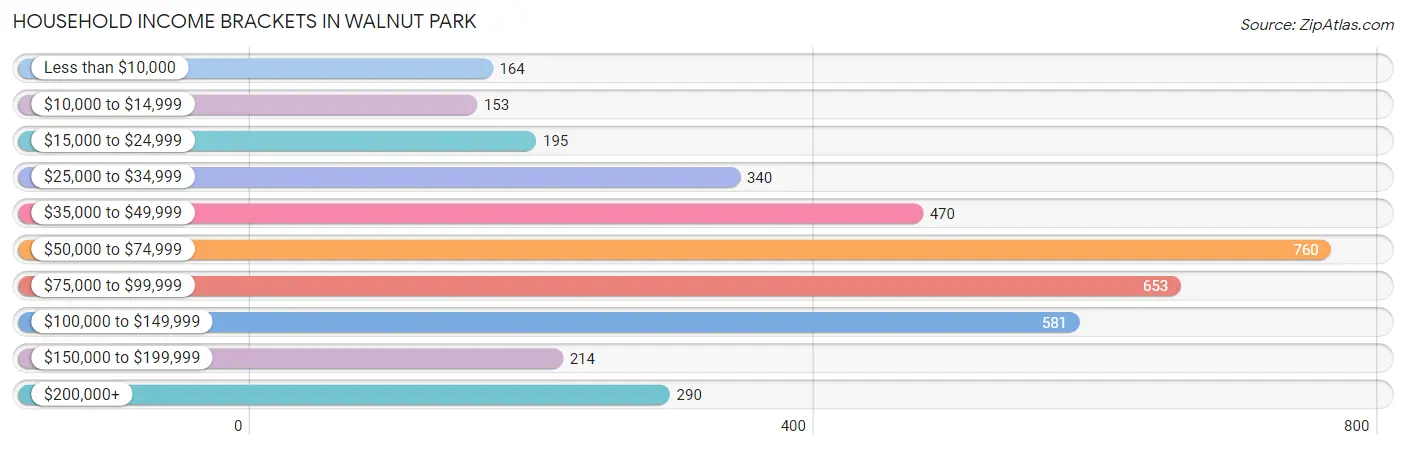
| Income Bracket | # Households | % Households |
| Less than $10,000 | 164 | 4.3% |
| $10,000 to $14,999 | 153 | 4.0% |
| $15,000 to $24,999 | 195 | 5.1% |
| $25,000 to $34,999 | 340 | 8.9% |
| $35,000 to $49,999 | 470 | 12.3% |
| $50,000 to $74,999 | 760 | 19.9% |
| $75,000 to $99,999 | 653 | 17.1% |
| $100,000 to $149,999 | 581 | 15.2% |
| $150,000 to $199,999 | 214 | 5.6% |
| $200,000+ | 290 | 7.6% |
Household Income by Householder Age in Walnut Park
The median household income in Walnut Park is $71,683, with the highest median household income of $75,357 found in the 65+ years age bracket for the primary householder. A total of 1,056 households (27.6%) fall into this category. Meanwhile, the 15 to 24 years age bracket for the primary householder has the lowest median household income of $0, with 85 households (2.2%) in this group.
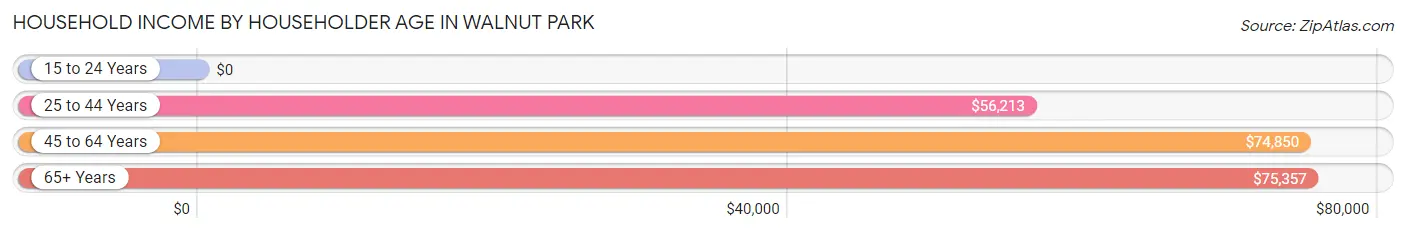
| Income Bracket | # Households | Median Income |
| 15 to 24 Years | 85 (2.2%) | $0 |
| 25 to 44 Years | 1,033 (27.0%) | $56,213 |
| 45 to 64 Years | 1,647 (43.1%) | $74,850 |
| 65+ Years | 1,056 (27.6%) | $75,357 |
| Total | 3,821 (100.0%) | $71,683 |
Poverty in Walnut Park
Income Below Poverty by Sex and Age in Walnut Park
With 12.7% poverty level for males and 18.9% for females among the residents of Walnut Park, 15 year old males and 15 year old females are the most vulnerable to poverty, with 27 males (42.2%) and 22 females (47.8%) in their respective age groups living below the poverty level.
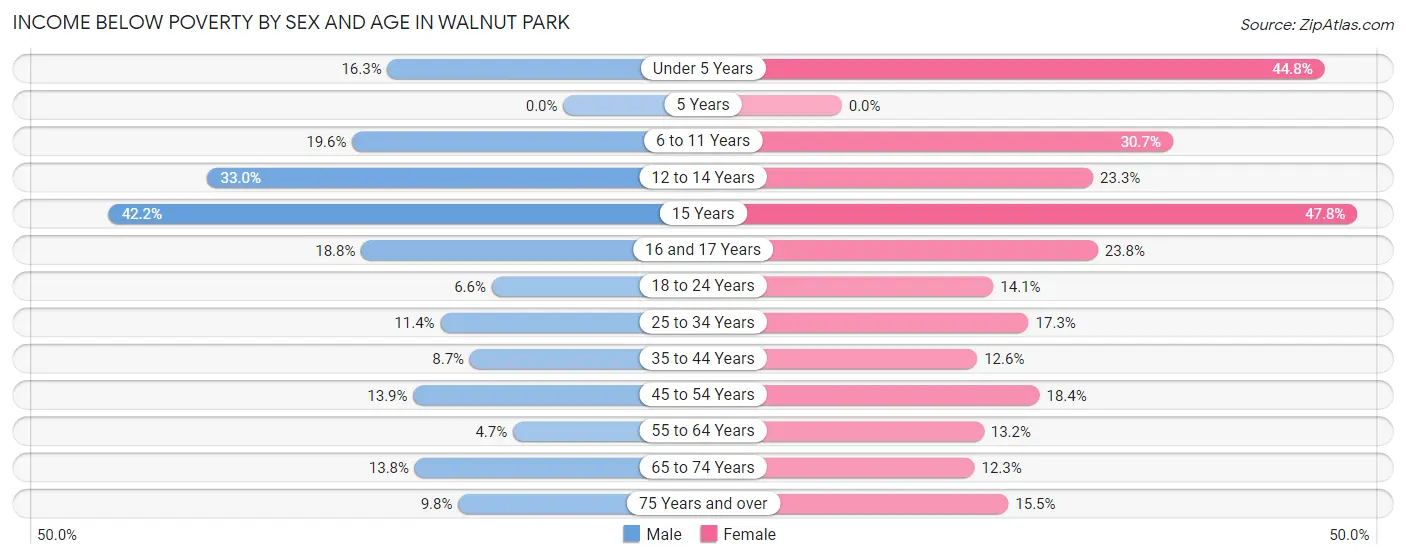
| Age Bracket | Male | Female |
| Under 5 Years | 62 (16.3%) | 198 (44.8%) |
| 5 Years | 0 (0.0%) | 0 (0.0%) |
| 6 to 11 Years | 124 (19.6%) | 230 (30.7%) |
| 12 to 14 Years | 170 (33.0%) | 94 (23.3%) |
| 15 Years | 27 (42.2%) | 22 (47.8%) |
| 16 and 17 Years | 60 (18.8%) | 43 (23.8%) |
| 18 to 24 Years | 50 (6.6%) | 93 (14.1%) |
| 25 to 34 Years | 162 (11.4%) | 179 (17.3%) |
| 35 to 44 Years | 114 (8.7%) | 133 (12.6%) |
| 45 to 54 Years | 137 (13.9%) | 187 (18.3%) |
| 55 to 64 Years | 43 (4.7%) | 128 (13.2%) |
| 65 to 74 Years | 78 (13.8%) | 76 (12.3%) |
| 75 Years and over | 27 (9.8%) | 81 (15.5%) |
| Total | 1,054 (12.7%) | 1,464 (18.9%) |
Income Above Poverty by Sex and Age in Walnut Park
According to the poverty statistics in Walnut Park, males aged 5 years and females aged 5 years are the age groups that are most secure financially, with 100.0% of males and 100.0% of females in these age groups living above the poverty line.
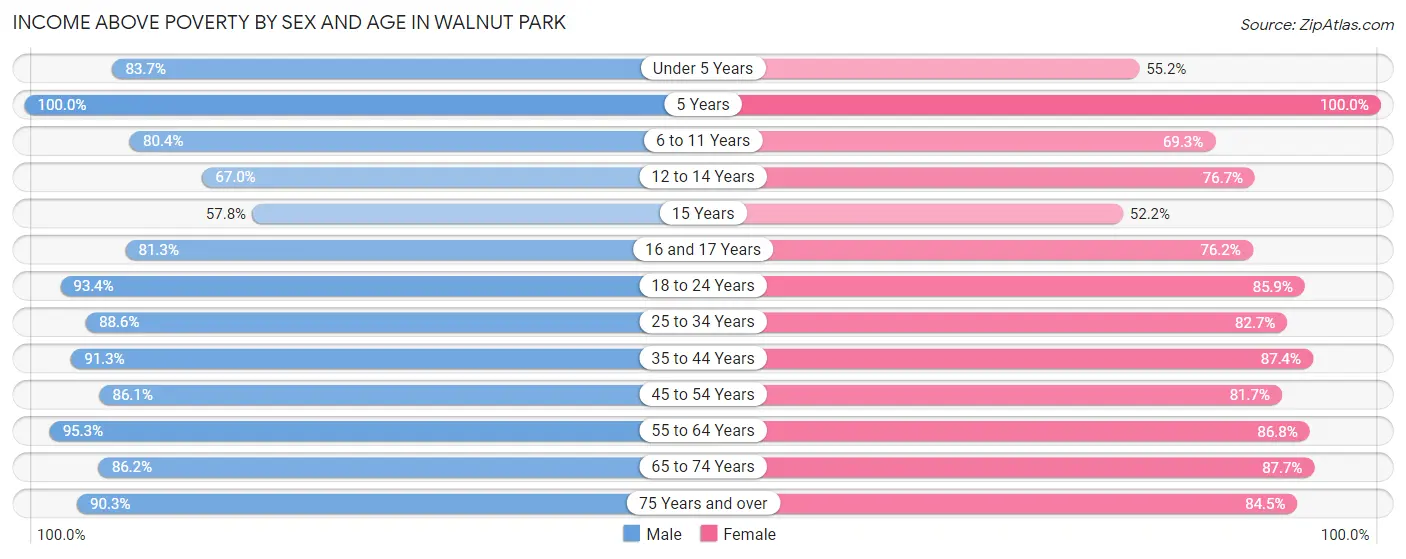
| Age Bracket | Male | Female |
| Under 5 Years | 318 (83.7%) | 244 (55.2%) |
| 5 Years | 128 (100.0%) | 40 (100.0%) |
| 6 to 11 Years | 509 (80.4%) | 519 (69.3%) |
| 12 to 14 Years | 345 (67.0%) | 309 (76.7%) |
| 15 Years | 37 (57.8%) | 24 (52.2%) |
| 16 and 17 Years | 260 (81.2%) | 138 (76.2%) |
| 18 to 24 Years | 703 (93.4%) | 568 (85.9%) |
| 25 to 34 Years | 1,258 (88.6%) | 853 (82.7%) |
| 35 to 44 Years | 1,201 (91.3%) | 925 (87.4%) |
| 45 to 54 Years | 847 (86.1%) | 832 (81.7%) |
| 55 to 64 Years | 877 (95.3%) | 843 (86.8%) |
| 65 to 74 Years | 488 (86.2%) | 541 (87.7%) |
| 75 Years and over | 250 (90.2%) | 443 (84.5%) |
| Total | 7,221 (87.3%) | 6,279 (81.1%) |
Income Below Poverty Among Married-Couple Families in Walnut Park
The poverty statistics for married-couple families in Walnut Park show that 10.0% or 212 of the total 2,117 families live below the poverty line. Families with 5 or more children have the highest poverty rate of 86.6%, comprising of 71 families. On the other hand, families with 3 or 4 children have the lowest poverty rate of 0.0%, which includes 0 families.
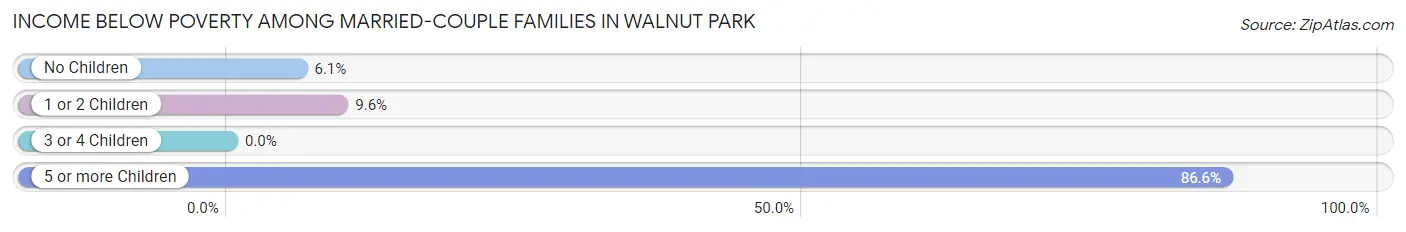
| Children | Above Poverty | Below Poverty |
| No Children | 931 (94.0%) | 60 (6.0%) |
| 1 or 2 Children | 763 (90.4%) | 81 (9.6%) |
| 3 or 4 Children | 200 (100.0%) | 0 (0.0%) |
| 5 or more Children | 11 (13.4%) | 71 (86.6%) |
| Total | 1,905 (90.0%) | 212 (10.0%) |
Income Below Poverty Among Single-Parent Households in Walnut Park
According to the poverty data in Walnut Park, 2.7% or 11 single-father households and 30.3% or 242 single-mother households are living below the poverty line. Among single-father households, those with 3 or 4 children have the highest poverty rate, with 2 households (7.7%) experiencing poverty. Likewise, among single-mother households, those with 5 or more children have the highest poverty rate, with 9 households (100.0%) falling below the poverty line.
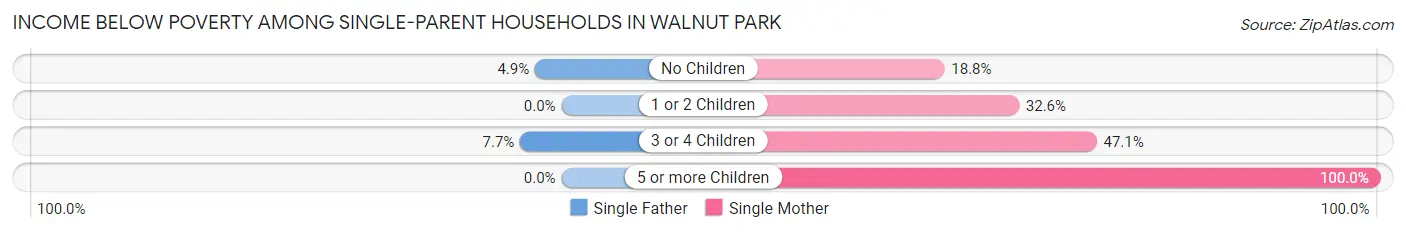
| Children | Single Father | Single Mother |
| No Children | 9 (4.9%) | 60 (18.8%) |
| 1 or 2 Children | 0 (0.0%) | 108 (32.6%) |
| 3 or 4 Children | 2 (7.7%) | 65 (47.1%) |
| 5 or more Children | 0 (0.0%) | 9 (100.0%) |
| Total | 11 (2.7%) | 242 (30.3%) |
Income Below Poverty Among Married-Couple vs Single-Parent Households in Walnut Park
The poverty data for Walnut Park shows that 212 of the married-couple family households (10.0%) and 253 of the single-parent households (21.0%) are living below the poverty level. Within the married-couple family households, those with 5 or more children have the highest poverty rate, with 71 households (86.6%) falling below the poverty line. Among the single-parent households, those with 5 or more children have the highest poverty rate, with 9 household (100.0%) living below poverty.
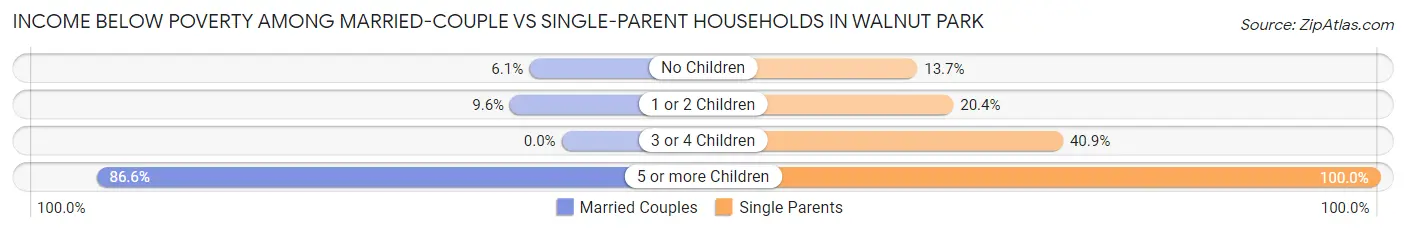
| Children | Married-Couple Families | Single-Parent Households |
| No Children | 60 (6.0%) | 69 (13.7%) |
| 1 or 2 Children | 81 (9.6%) | 108 (20.4%) |
| 3 or 4 Children | 0 (0.0%) | 67 (40.8%) |
| 5 or more Children | 71 (86.6%) | 9 (100.0%) |
| Total | 212 (10.0%) | 253 (21.0%) |
Race in Walnut Park
The most populous races in Walnut Park are Hispanic or Latino (15,912 | 98.2%), Some other Race (6,481 | 40.0%), and White / Caucasian (5,709 | 35.2%).
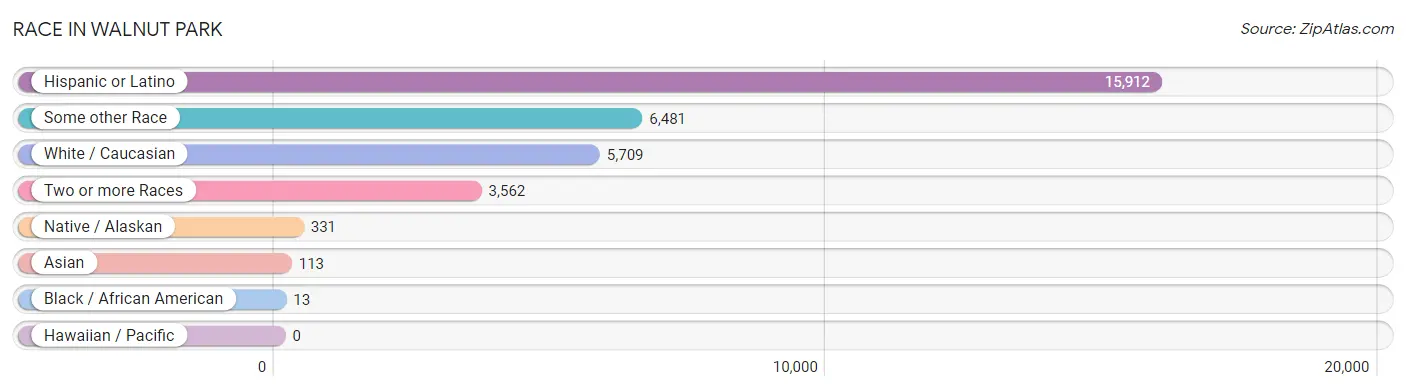
| Race | # Population | % Population |
| Asian | 113 | 0.7% |
| Black / African American | 13 | 0.1% |
| Hawaiian / Pacific | 0 | 0.0% |
| Hispanic or Latino | 15,912 | 98.2% |
| Native / Alaskan | 331 | 2.0% |
| White / Caucasian | 5,709 | 35.2% |
| Two or more Races | 3,562 | 22.0% |
| Some other Race | 6,481 | 40.0% |
| Total | 16,209 | 100.0% |
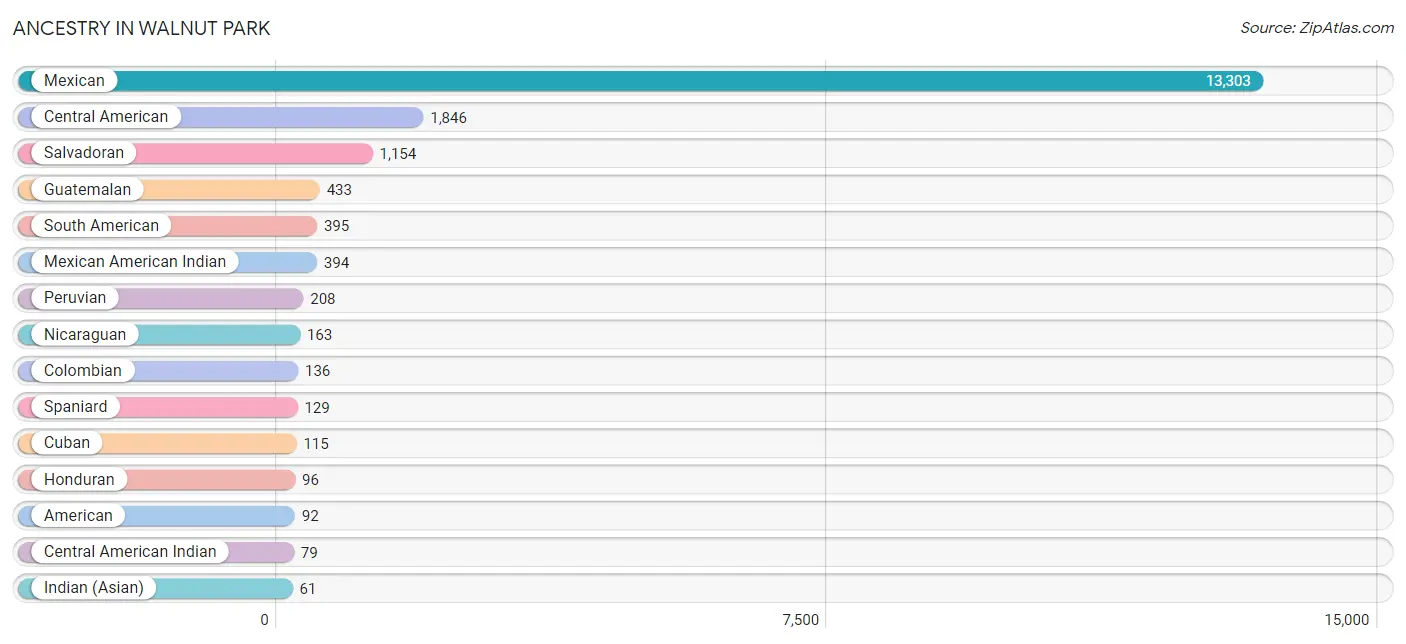
Ancestry in Walnut Park
The most populous ancestries reported in Walnut Park are Mexican (13,303 | 82.1%), Central American (1,846 | 11.4%), Salvadoran (1,154 | 7.1%), Guatemalan (433 | 2.7%), and South American (395 | 2.4%), together accounting for 105.7% of all Walnut Park residents.
| Ancestry | # Population | % Population |
| American | 92 | 0.6% |
| Argentinean | 7 | 0.0% |
| Bhutanese | 41 | 0.3% |
| British | 9 | 0.1% |
| Central American | 1,846 | 11.4% |
| Central American Indian | 79 | 0.5% |
| Colombian | 136 | 0.8% |
| Cuban | 115 | 0.7% |
| Dominican | 43 | 0.3% |
| Ecuadorian | 21 | 0.1% |
| English | 43 | 0.3% |
| French | 9 | 0.1% |
| German | 24 | 0.2% |
| Greek | 14 | 0.1% |
| Guatemalan | 433 | 2.7% |
| Honduran | 96 | 0.6% |
| Indian (Asian) | 61 | 0.4% |
| Indonesian | 12 | 0.1% |
| Irish | 19 | 0.1% |
| Italian | 33 | 0.2% |
| Korean | 14 | 0.1% |
| Mexican | 13,303 | 82.1% |
| Mexican American Indian | 394 | 2.4% |
| Native Hawaiian | 16 | 0.1% |
| Navajo | 18 | 0.1% |
| Nicaraguan | 163 | 1.0% |
| Peruvian | 208 | 1.3% |
| Portuguese | 13 | 0.1% |
| Puerto Rican | 29 | 0.2% |
| Salvadoran | 1,154 | 7.1% |
| Scottish | 11 | 0.1% |
| South American | 395 | 2.4% |
| Spaniard | 129 | 0.8% |
| Thai | 28 | 0.2% | View All 34 Rows |
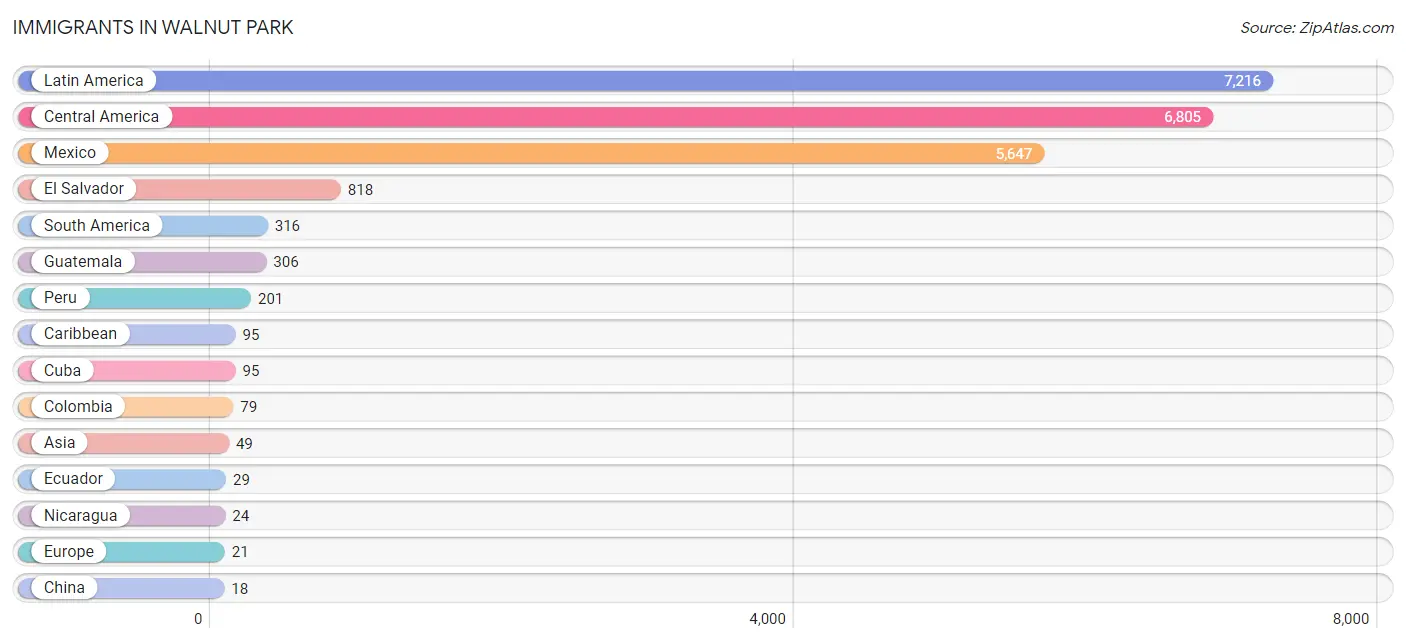
Immigrants in Walnut Park
The most numerous immigrant groups reported in Walnut Park came from Latin America (7,216 | 44.5%), Central America (6,805 | 42.0%), Mexico (5,647 | 34.8%), El Salvador (818 | 5.1%), and South America (316 | 1.9%), together accounting for 128.3% of all Walnut Park residents.
| Immigration Origin | # Population | % Population |
| Argentina | 7 | 0.0% |
| Asia | 49 | 0.3% |
| Caribbean | 95 | 0.6% |
| Central America | 6,805 | 42.0% |
| China | 18 | 0.1% |
| Colombia | 79 | 0.5% |
| Cuba | 95 | 0.6% |
| Eastern Asia | 18 | 0.1% |
| Ecuador | 29 | 0.2% |
| El Salvador | 818 | 5.1% |
| England | 10 | 0.1% |
| Europe | 21 | 0.1% |
| Greece | 5 | 0.0% |
| Guatemala | 306 | 1.9% |
| Honduras | 10 | 0.1% |
| India | 10 | 0.1% |
| Italy | 6 | 0.0% |
| Latin America | 7,216 | 44.5% |
| Lebanon | 9 | 0.1% |
| Mexico | 5,647 | 34.8% |
| Nicaragua | 24 | 0.2% |
| Northern Europe | 10 | 0.1% |
| Peru | 201 | 1.2% |
| South America | 316 | 1.9% |
| South Central Asia | 10 | 0.1% |
| South Eastern Asia | 12 | 0.1% |
| Southern Europe | 11 | 0.1% |
| Western Asia | 9 | 0.1% | View All 28 Rows |
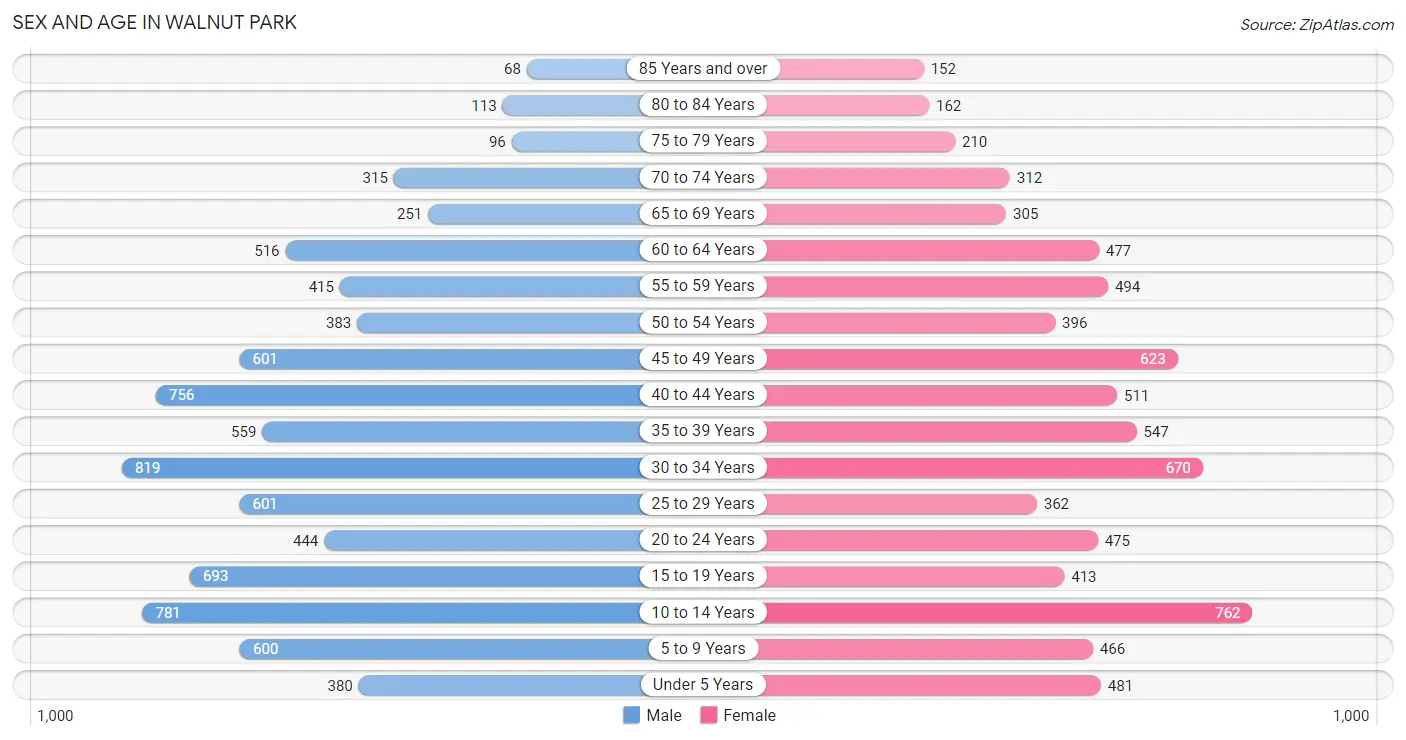
Sex and Age in Walnut Park
Sex and Age in Walnut Park
The most populous age groups in Walnut Park are 30 to 34 Years (819 | 9.8%) for men and 10 to 14 Years (762 | 9.8%) for women.
| Age Bracket | Male | Female |
| Under 5 Years | 380 (4.5%) | 481 (6.1%) |
| 5 to 9 Years | 600 (7.1%) | 466 (6.0%) |
| 10 to 14 Years | 781 (9.3%) | 762 (9.8%) |
| 15 to 19 Years | 693 (8.3%) | 413 (5.3%) |
| 20 to 24 Years | 444 (5.3%) | 475 (6.1%) |
| 25 to 29 Years | 601 (7.2%) | 362 (4.6%) |
| 30 to 34 Years | 819 (9.8%) | 670 (8.6%) |
| 35 to 39 Years | 559 (6.7%) | 547 (7.0%) |
| 40 to 44 Years | 756 (9.0%) | 511 (6.5%) |
| 45 to 49 Years | 601 (7.2%) | 623 (8.0%) |
| 50 to 54 Years | 383 (4.6%) | 396 (5.1%) |
| 55 to 59 Years | 415 (5.0%) | 494 (6.3%) |
| 60 to 64 Years | 516 (6.1%) | 477 (6.1%) |
| 65 to 69 Years | 251 (3.0%) | 305 (3.9%) |
| 70 to 74 Years | 315 (3.7%) | 312 (4.0%) |
| 75 to 79 Years | 96 (1.1%) | 210 (2.7%) |
| 80 to 84 Years | 113 (1.3%) | 162 (2.1%) |
| 85 Years and over | 68 (0.8%) | 152 (1.9%) |
| Total | 8,391 (100.0%) | 7,818 (100.0%) |
Families and Households in Walnut Park
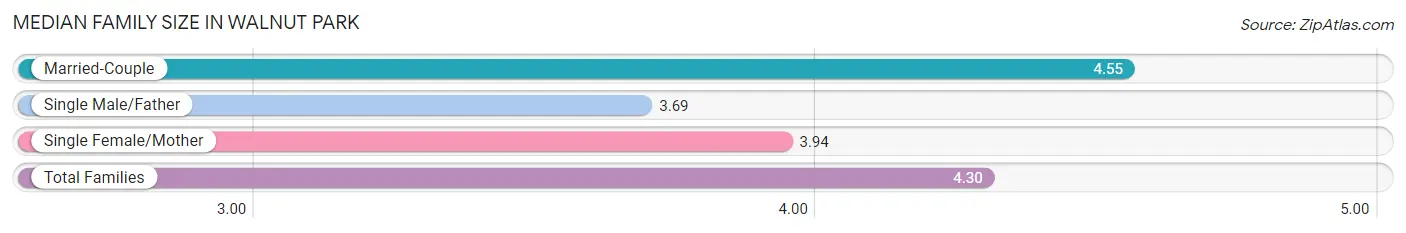
Median Family Size in Walnut Park
The median family size in Walnut Park is 4.30 persons per family, with married-couple families (2,117 | 63.7%) accounting for the largest median family size of 4.55 persons per family. On the other hand, single male/father families (407 | 12.2%) represent the smallest median family size with 3.69 persons per family.
| Family Type | # Families | Family Size |
| Married-Couple | 2,117 (63.7%) | 4.55 |
| Single Male/Father | 407 (12.2%) | 3.69 |
| Single Female/Mother | 798 (24.0%) | 3.94 |
| Total Families | 3,322 (100.0%) | 4.30 |
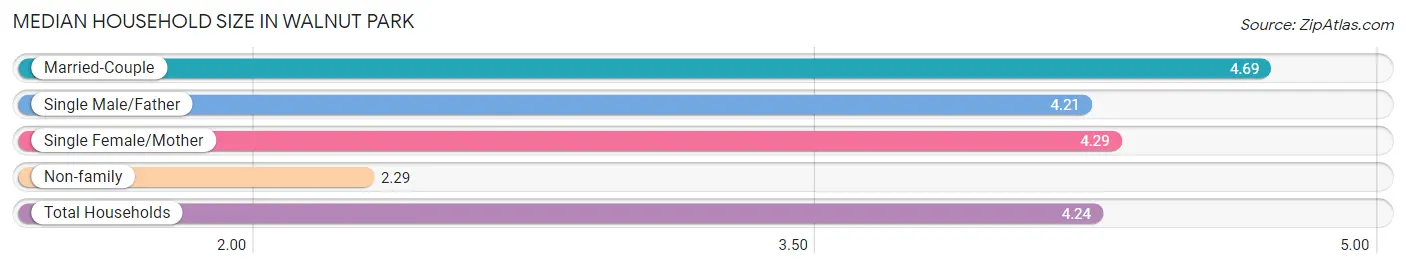
Median Household Size in Walnut Park
The median household size in Walnut Park is 4.24 persons per household, with married-couple households (2,117 | 55.4%) accounting for the largest median household size of 4.69 persons per household. non-family households (499 | 13.1%) represent the smallest median household size with 2.29 persons per household.
| Household Type | # Households | Household Size |
| Married-Couple | 2,117 (55.4%) | 4.69 |
| Single Male/Father | 407 (10.6%) | 4.21 |
| Single Female/Mother | 798 (20.9%) | 4.29 |
| Non-family | 499 (13.1%) | 2.29 |
| Total Households | 3,821 (100.0%) | 4.24 |
Household Size by Marriage Status in Walnut Park
Out of a total of 3,821 households in Walnut Park, 3,322 (86.9%) are family households, while 499 (13.1%) are nonfamily households. The most numerous type of family households are 4-person households, comprising 715, and the most common type of nonfamily households are 1-person households, comprising 266.
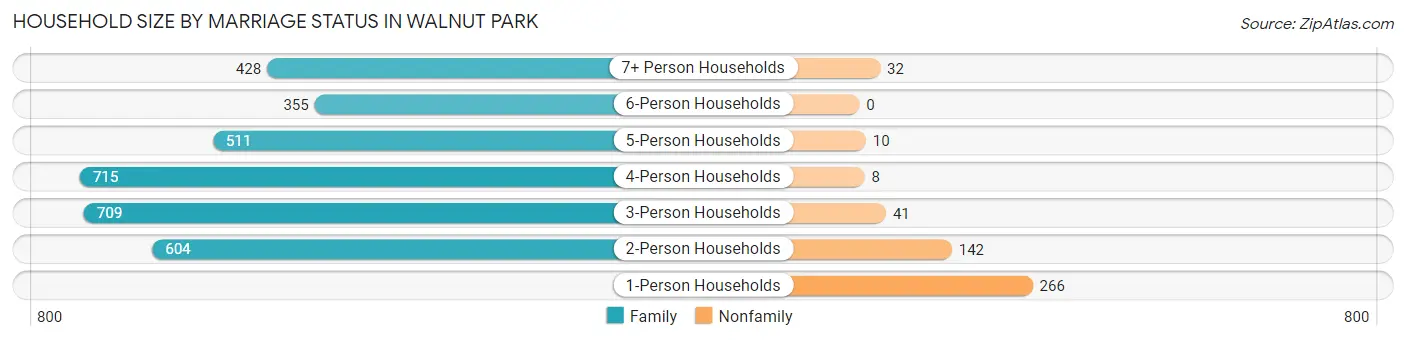
| Household Size | Family Households | Nonfamily Households |
| 1-Person Households | - | 266 (7.0%) |
| 2-Person Households | 604 (15.8%) | 142 (3.7%) |
| 3-Person Households | 709 (18.6%) | 41 (1.1%) |
| 4-Person Households | 715 (18.7%) | 8 (0.2%) |
| 5-Person Households | 511 (13.4%) | 10 (0.3%) |
| 6-Person Households | 355 (9.3%) | 0 (0.0%) |
| 7+ Person Households | 428 (11.2%) | 32 (0.8%) |
| Total | 3,322 (86.9%) | 499 (13.1%) |
Female Fertility in Walnut Park
Fertility by Age in Walnut Park
Average fertility rate in Walnut Park is 37.0 births per 1,000 women. Women in the age bracket of 20 to 34 years have the highest fertility rate with 58.0 births per 1,000 women. Women in the age bracket of 20 to 34 years acount for 63.5% of all women with births.
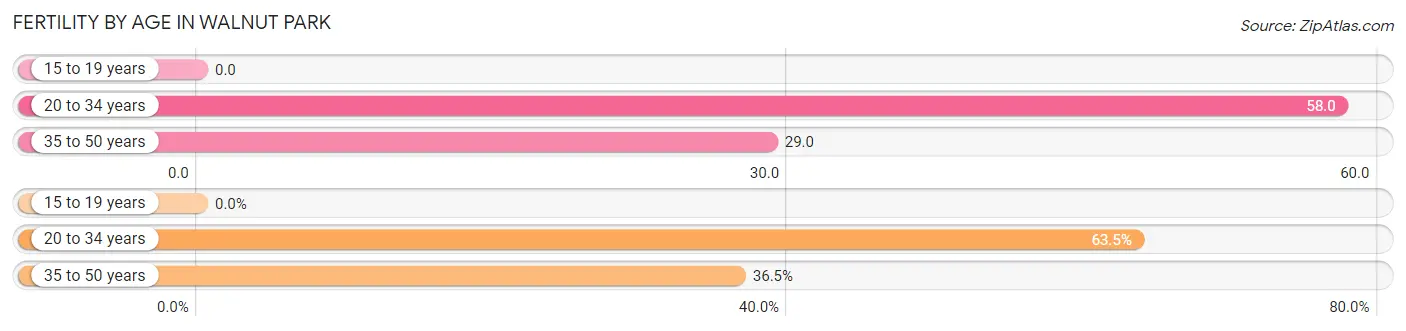
| Age Bracket | Women with Births | Births / 1,000 Women |
| 15 to 19 years | 0 (0.0%) | 0.0 |
| 20 to 34 years | 87 (63.5%) | 58.0 |
| 35 to 50 years | 50 (36.5%) | 29.0 |
| Total | 137 (100.0%) | 37.0 |
Fertility by Age by Marriage Status in Walnut Park
81.8% of women with births (137) in Walnut Park are married. The highest percentage of unmarried women with births falls into 20 to 34 years age bracket with 28.7% of them unmarried at the time of birth, while the lowest percentage of unmarried women with births belong to 35 to 50 years age bracket with 0.0% of them unmarried.
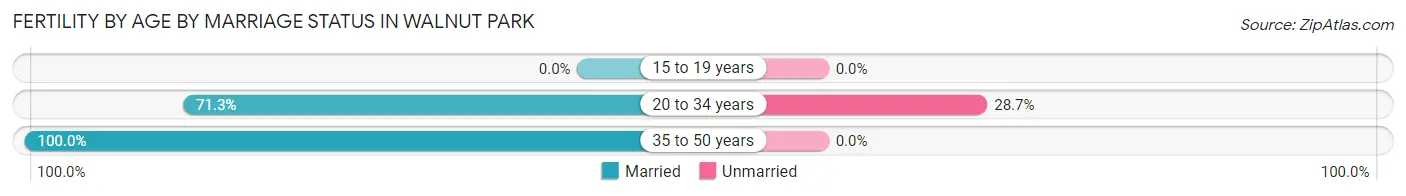
| Age Bracket | Married | Unmarried |
| 15 to 19 years | 0 (0.0%) | 0 (0.0%) |
| 20 to 34 years | 62 (71.3%) | 25 (28.7%) |
| 35 to 50 years | 50 (100.0%) | 0 (0.0%) |
| Total | 112 (81.8%) | 25 (18.2%) |
Fertility by Education in Walnut Park
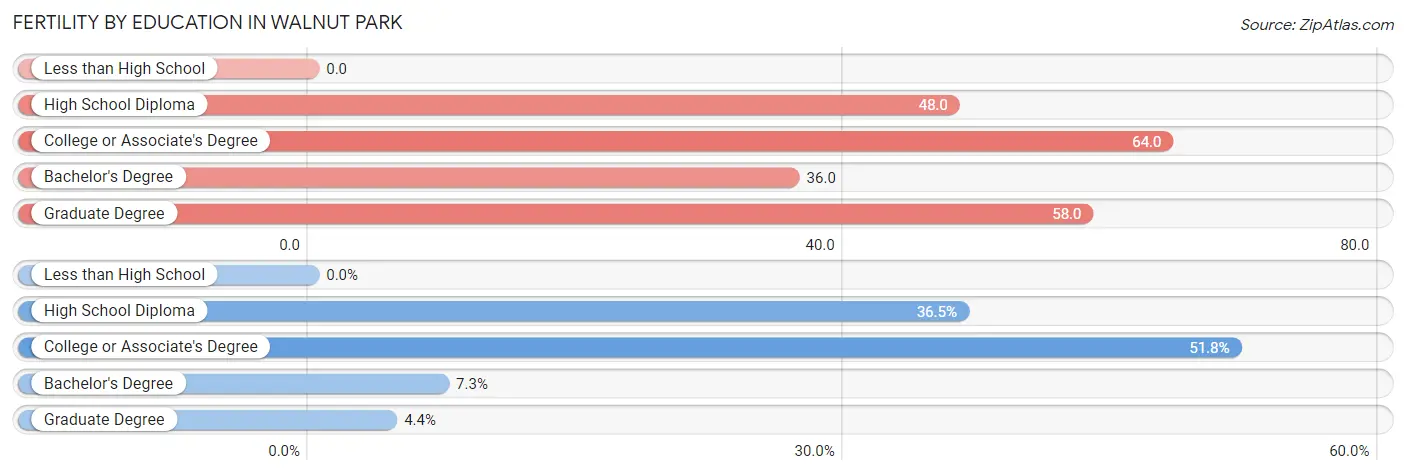
| Educational Attainment | Women with Births | Births / 1,000 Women |
| Less than High School | 0 (0.0%) | 0.0 |
| High School Diploma | 50 (36.5%) | 48.0 |
| College or Associate's Degree | 71 (51.8%) | 64.0 |
| Bachelor's Degree | 10 (7.3%) | 36.0 |
| Graduate Degree | 6 (4.4%) | 58.0 |
| Total | 137 (100.0%) | 37.0 |
Fertility by Education by Marriage Status in Walnut Park
18.2% of women with births in Walnut Park are unmarried. Women with the educational attainment of high school diploma are most likely to be married with 100.0% of them married at childbirth, while women with the educational attainment of bachelor's degree are least likely to be married with 100.0% of them unmarried at childbirth.
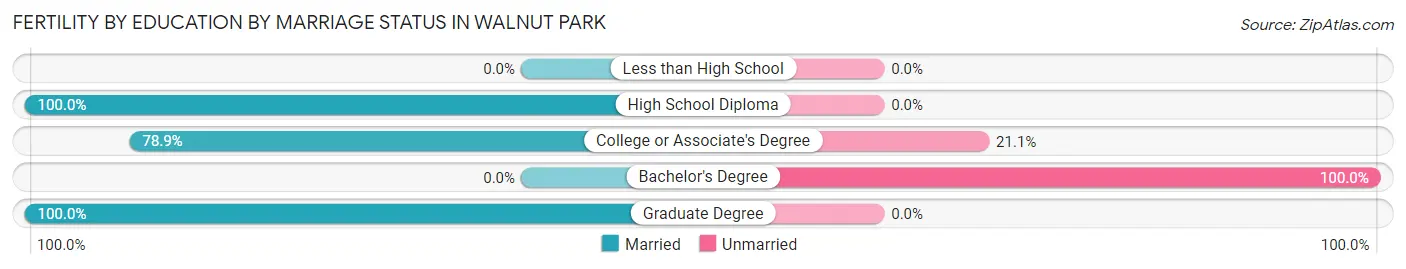
| Educational Attainment | Married | Unmarried |
| Less than High School | 0 (0.0%) | 0 (0.0%) |
| High School Diploma | 50 (100.0%) | 0 (0.0%) |
| College or Associate's Degree | 56 (78.9%) | 15 (21.1%) |
| Bachelor's Degree | 0 (0.0%) | 10 (100.0%) |
| Graduate Degree | 6 (100.0%) | 0 (0.0%) |
| Total | 112 (81.8%) | 25 (18.2%) |
Employment Characteristics in Walnut Park
Employment by Class of Employer in Walnut Park
Among the 7,044 employed individuals in Walnut Park, private company employees (5,221 | 74.1%), self-employed (not incorporated) (581 | 8.3%), and local government employees (519 | 7.4%) make up the most common classes of employment.
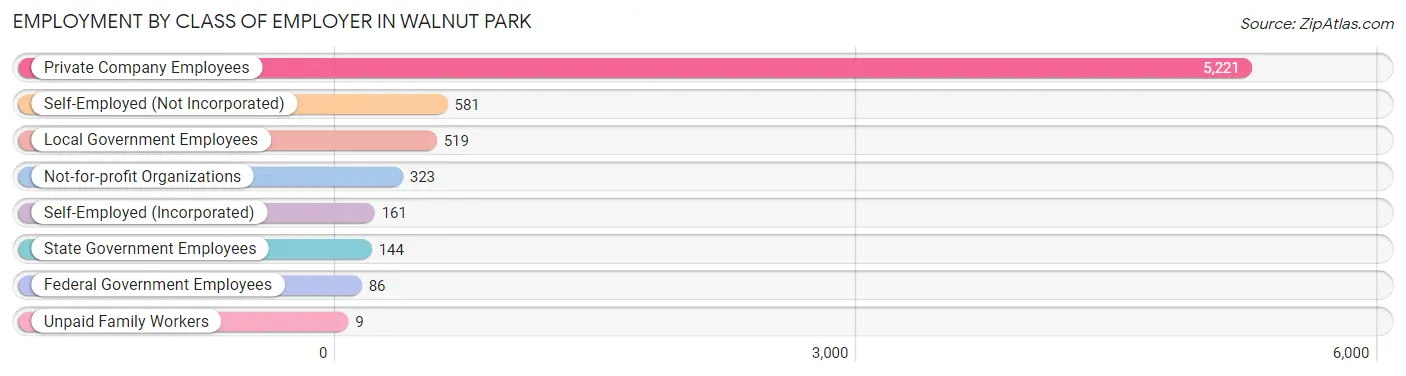
| Employer Class | # Employees | % Employees |
| Private Company Employees | 5,221 | 74.1% |
| Self-Employed (Incorporated) | 161 | 2.3% |
| Self-Employed (Not Incorporated) | 581 | 8.3% |
| Not-for-profit Organizations | 323 | 4.6% |
| Local Government Employees | 519 | 7.4% |
| State Government Employees | 144 | 2.0% |
| Federal Government Employees | 86 | 1.2% |
| Unpaid Family Workers | 9 | 0.1% |
| Total | 7,044 | 100.0% |
Employment Status by Age in Walnut Park
According to the labor force statistics for Walnut Park, out of the total population over 16 years of age (12,629), 63.6% or 8,032 individuals are in the labor force, with 9.3% or 747 of them unemployed. The age group with the highest labor force participation rate is 20 to 24 years, with 88.6% or 814 individuals in the labor force. Within the labor force, the 16 to 19 years age range has the highest percentage of unemployed individuals, with 24.5% or 75 of them being unemployed.
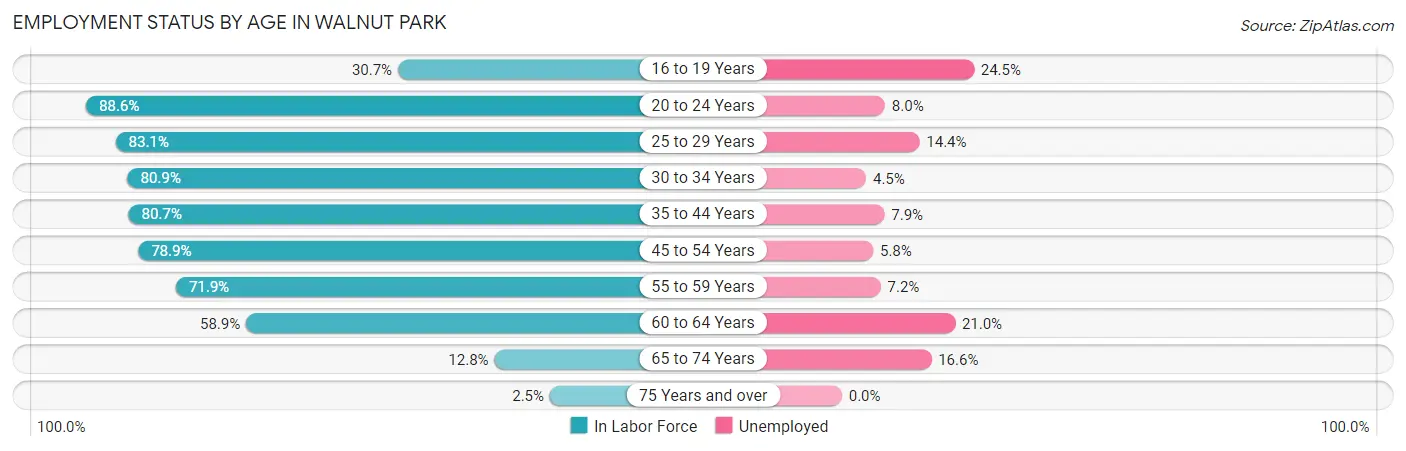
| Age Bracket | In Labor Force | Unemployed |
| 16 to 19 Years | 306 (30.7%) | 75 (24.5%) |
| 20 to 24 Years | 814 (88.6%) | 65 (8.0%) |
| 25 to 29 Years | 800 (83.1%) | 115 (14.4%) |
| 30 to 34 Years | 1,205 (80.9%) | 54 (4.5%) |
| 35 to 44 Years | 1,915 (80.7%) | 151 (7.9%) |
| 45 to 54 Years | 1,580 (78.9%) | 92 (5.8%) |
| 55 to 59 Years | 654 (71.9%) | 47 (7.2%) |
| 60 to 64 Years | 585 (58.9%) | 123 (21.0%) |
| 65 to 74 Years | 151 (12.8%) | 25 (16.6%) |
| 75 Years and over | 20 (2.5%) | 0 (0.0%) |
| Total | 8,032 (63.6%) | 747 (9.3%) |
Employment Status by Educational Attainment in Walnut Park
According to labor force statistics for Walnut Park, 77.2% of individuals (6,740) out of the total population between 25 and 64 years of age (8,730) are in the labor force, with 8.6% or 580 of them being unemployed. The group with the highest labor force participation rate are those with the educational attainment of bachelor's degree or higher, with 86.7% or 780 individuals in the labor force. Within the labor force, individuals with bachelor's degree or higher education have the highest percentage of unemployment, with 10.4% or 81 of them being unemployed.
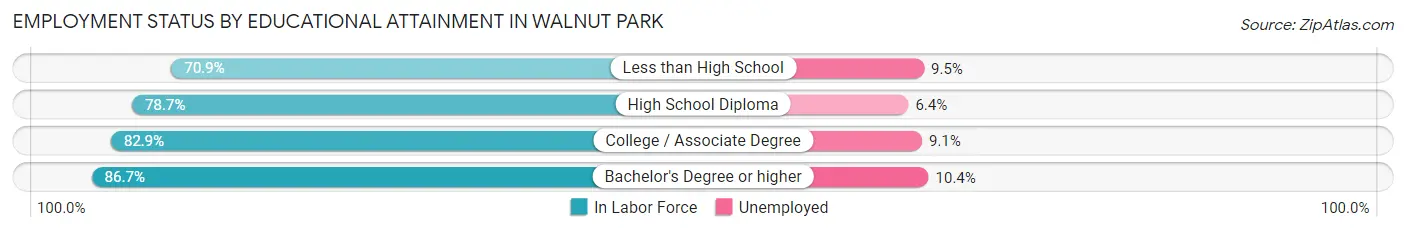
| Educational Attainment | In Labor Force | Unemployed |
| Less than High School | 2,525 (70.9%) | 338 (9.5%) |
| High School Diploma | 1,973 (78.7%) | 160 (6.4%) |
| College / Associate Degree | 1,460 (82.9%) | 160 (9.1%) |
| Bachelor's Degree or higher | 780 (86.7%) | 94 (10.4%) |
| Total | 6,740 (77.2%) | 751 (8.6%) |
Employment Occupations by Sex in Walnut Park
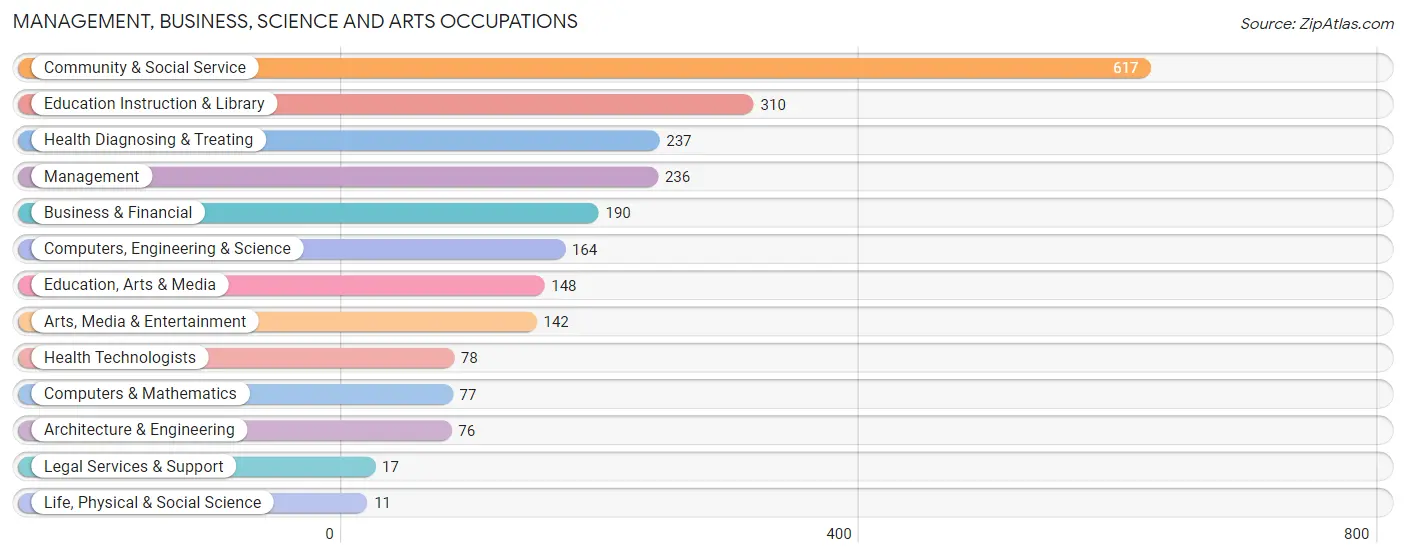
Management, Business, Science and Arts Occupations
The most common Management, Business, Science and Arts occupations in Walnut Park are Community & Social Service (617 | 8.5%), Education Instruction & Library (310 | 4.3%), Health Diagnosing & Treating (237 | 3.3%), Management (236 | 3.2%), and Business & Financial (190 | 2.6%).
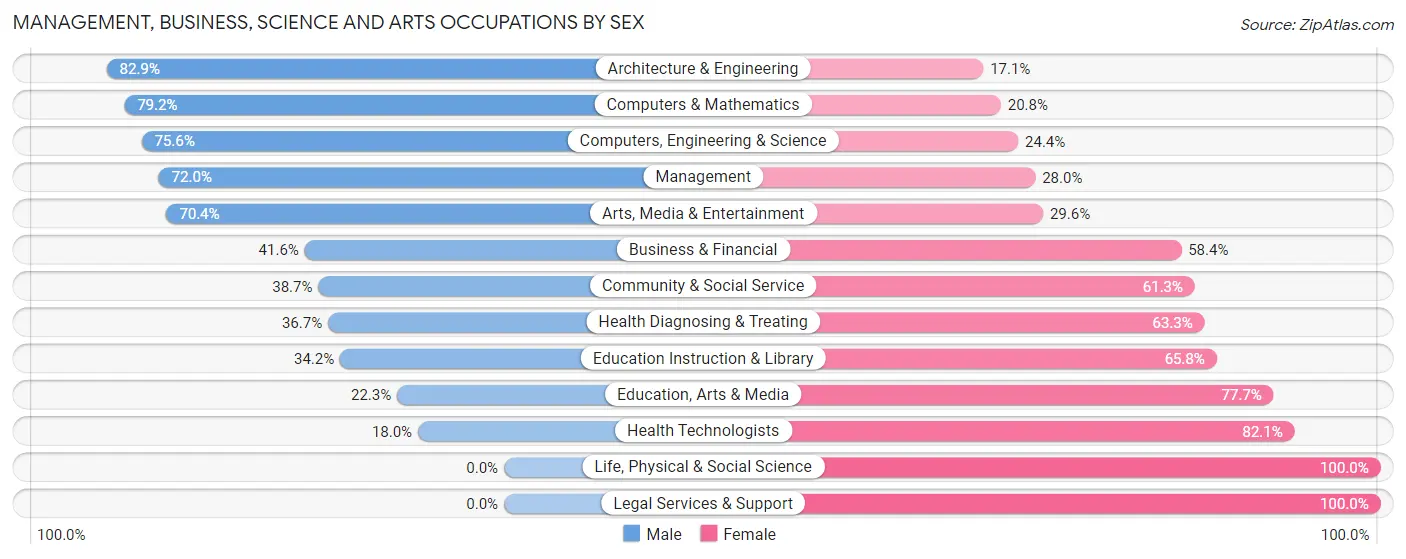
Management, Business, Science and Arts Occupations by Sex
Within the Management, Business, Science and Arts occupations in Walnut Park, the most male-oriented occupations are Architecture & Engineering (82.9%), Computers & Mathematics (79.2%), and Computers, Engineering & Science (75.6%), while the most female-oriented occupations are Life, Physical & Social Science (100.0%), Legal Services & Support (100.0%), and Health Technologists (82.1%).
| Occupation | Male | Female |
| Management | 170 (72.0%) | 66 (28.0%) |
| Business & Financial | 79 (41.6%) | 111 (58.4%) |
| Computers, Engineering & Science | 124 (75.6%) | 40 (24.4%) |
| Computers & Mathematics | 61 (79.2%) | 16 (20.8%) |
| Architecture & Engineering | 63 (82.9%) | 13 (17.1%) |
| Life, Physical & Social Science | 0 (0.0%) | 11 (100.0%) |
| Community & Social Service | 239 (38.7%) | 378 (61.3%) |
| Education, Arts & Media | 33 (22.3%) | 115 (77.7%) |
| Legal Services & Support | 0 (0.0%) | 17 (100.0%) |
| Education Instruction & Library | 106 (34.2%) | 204 (65.8%) |
| Arts, Media & Entertainment | 100 (70.4%) | 42 (29.6%) |
| Health Diagnosing & Treating | 87 (36.7%) | 150 (63.3%) |
| Health Technologists | 14 (17.9%) | 64 (82.1%) |
| Total (Category) | 699 (48.4%) | 745 (51.6%) |
| Total (Overall) | 4,263 (58.5%) | 3,019 (41.5%) |
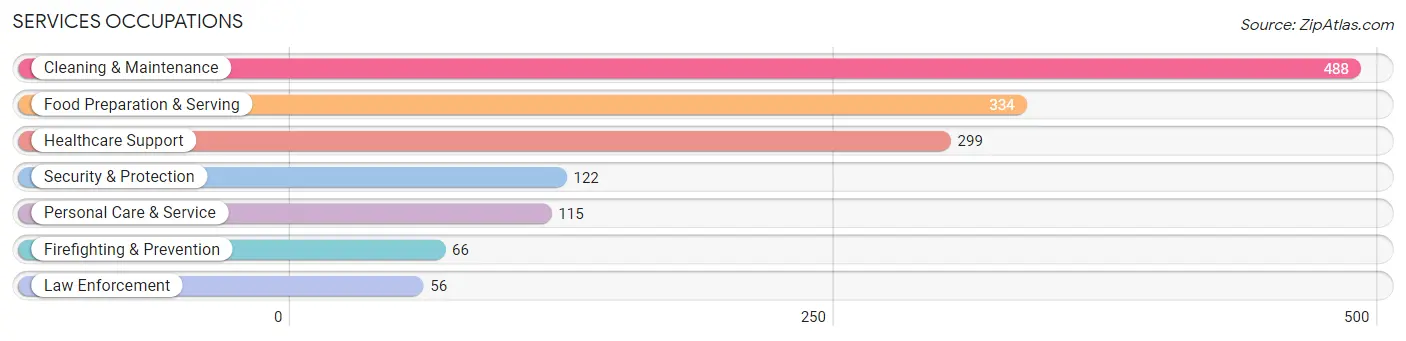
Services Occupations
The most common Services occupations in Walnut Park are Cleaning & Maintenance (488 | 6.7%), Food Preparation & Serving (334 | 4.6%), Healthcare Support (299 | 4.1%), Security & Protection (122 | 1.7%), and Personal Care & Service (115 | 1.6%).
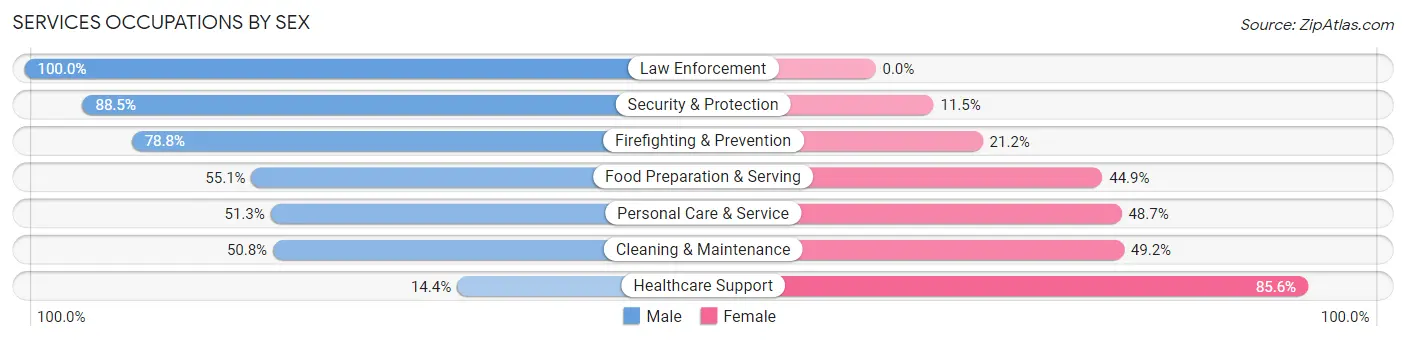
Services Occupations by Sex
Within the Services occupations in Walnut Park, the most male-oriented occupations are Law Enforcement (100.0%), Security & Protection (88.5%), and Firefighting & Prevention (78.8%), while the most female-oriented occupations are Healthcare Support (85.6%), Cleaning & Maintenance (49.2%), and Personal Care & Service (48.7%).
| Occupation | Male | Female |
| Healthcare Support | 43 (14.4%) | 256 (85.6%) |
| Security & Protection | 108 (88.5%) | 14 (11.5%) |
| Firefighting & Prevention | 52 (78.8%) | 14 (21.2%) |
| Law Enforcement | 56 (100.0%) | 0 (0.0%) |
| Food Preparation & Serving | 184 (55.1%) | 150 (44.9%) |
| Cleaning & Maintenance | 248 (50.8%) | 240 (49.2%) |
| Personal Care & Service | 59 (51.3%) | 56 (48.7%) |
| Total (Category) | 642 (47.3%) | 716 (52.7%) |
| Total (Overall) | 4,263 (58.5%) | 3,019 (41.5%) |
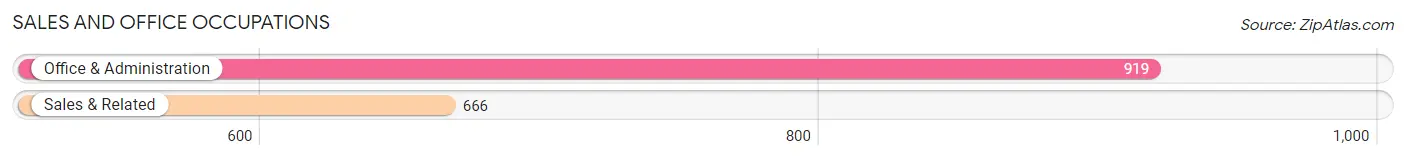
Sales and Office Occupations
The most common Sales and Office occupations in Walnut Park are Office & Administration (919 | 12.6%), and Sales & Related (666 | 9.1%).
Sales and Office Occupations by Sex
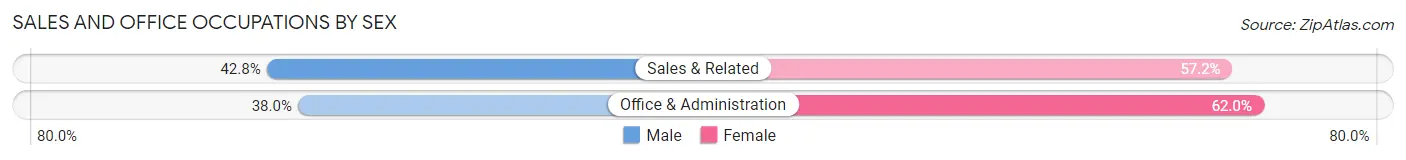
| Occupation | Male | Female |
| Sales & Related | 285 (42.8%) | 381 (57.2%) |
| Office & Administration | 349 (38.0%) | 570 (62.0%) |
| Total (Category) | 634 (40.0%) | 951 (60.0%) |
| Total (Overall) | 4,263 (58.5%) | 3,019 (41.5%) |
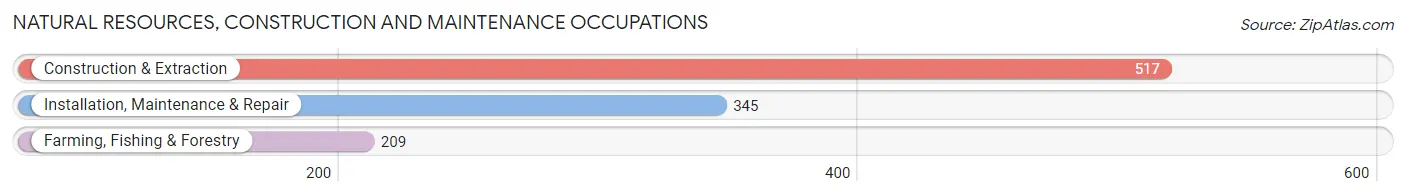
Natural Resources, Construction and Maintenance Occupations
The most common Natural Resources, Construction and Maintenance occupations in Walnut Park are Construction & Extraction (517 | 7.1%), Installation, Maintenance & Repair (345 | 4.7%), and Farming, Fishing & Forestry (209 | 2.9%).
Natural Resources, Construction and Maintenance Occupations by Sex
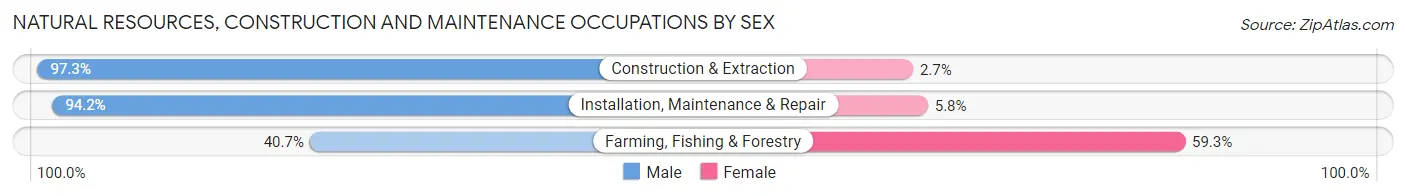
| Occupation | Male | Female |
| Farming, Fishing & Forestry | 85 (40.7%) | 124 (59.3%) |
| Construction & Extraction | 503 (97.3%) | 14 (2.7%) |
| Installation, Maintenance & Repair | 325 (94.2%) | 20 (5.8%) |
| Total (Category) | 913 (85.3%) | 158 (14.7%) |
| Total (Overall) | 4,263 (58.5%) | 3,019 (41.5%) |
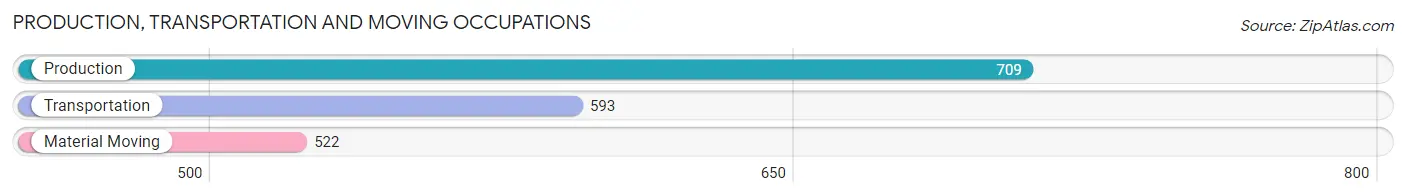
Production, Transportation and Moving Occupations
The most common Production, Transportation and Moving occupations in Walnut Park are Production (709 | 9.7%), Transportation (593 | 8.1%), and Material Moving (522 | 7.2%).
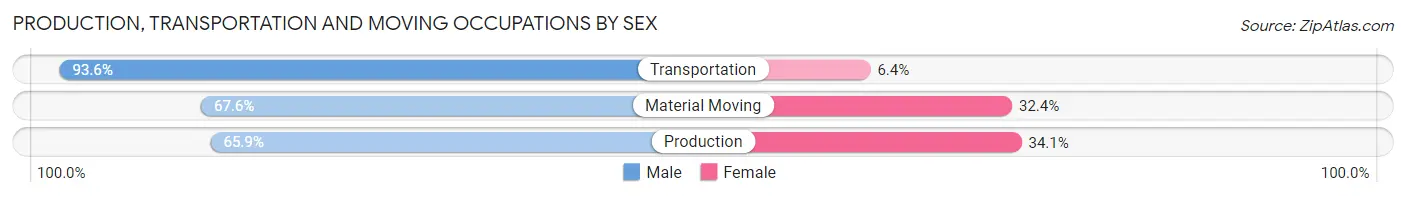
Production, Transportation and Moving Occupations by Sex
| Occupation | Male | Female |
| Production | 467 (65.9%) | 242 (34.1%) |
| Transportation | 555 (93.6%) | 38 (6.4%) |
| Material Moving | 353 (67.6%) | 169 (32.4%) |
| Total (Category) | 1,375 (75.4%) | 449 (24.6%) |
| Total (Overall) | 4,263 (58.5%) | 3,019 (41.5%) |
Employment Industries by Sex in Walnut Park
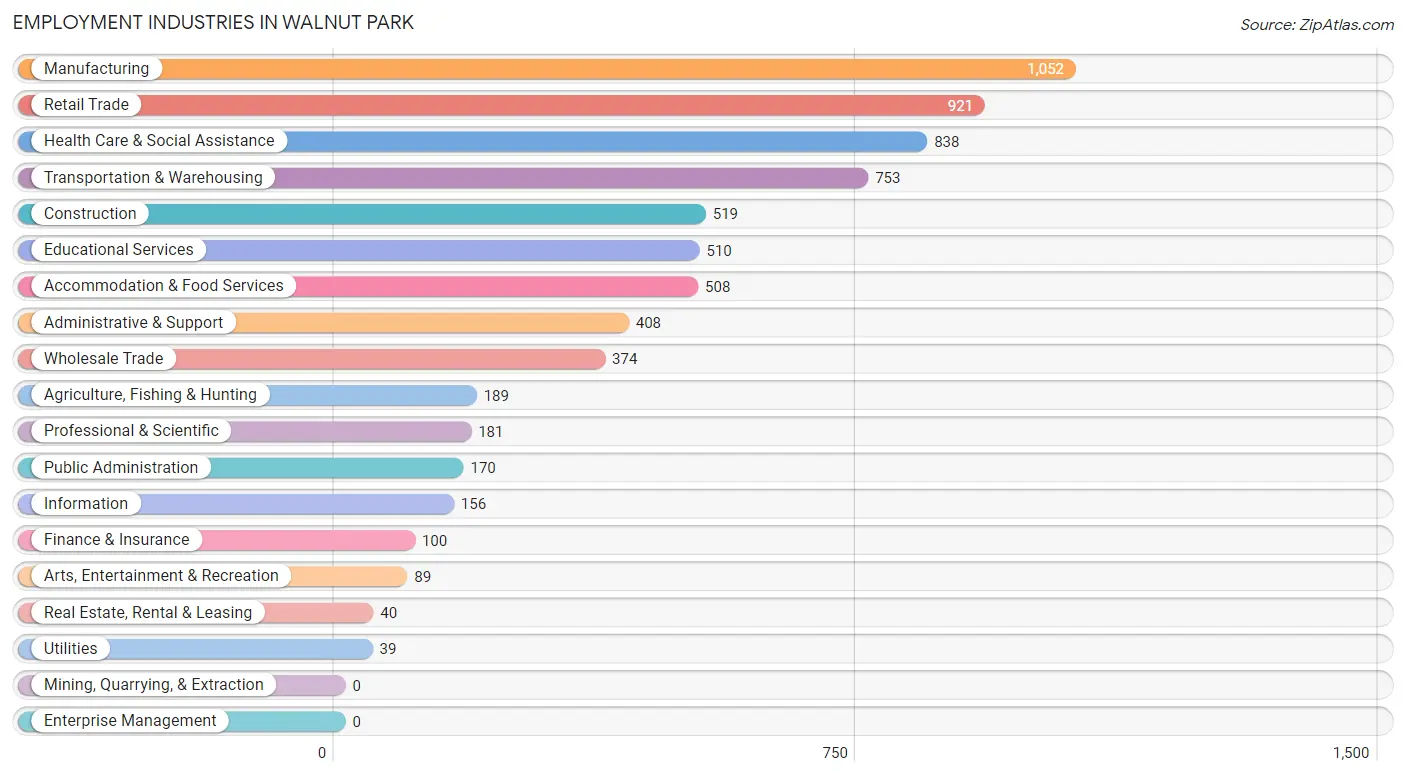
Employment Industries in Walnut Park
The major employment industries in Walnut Park include Manufacturing (1,052 | 14.4%), Retail Trade (921 | 12.7%), Health Care & Social Assistance (838 | 11.5%), Transportation & Warehousing (753 | 10.3%), and Construction (519 | 7.1%).
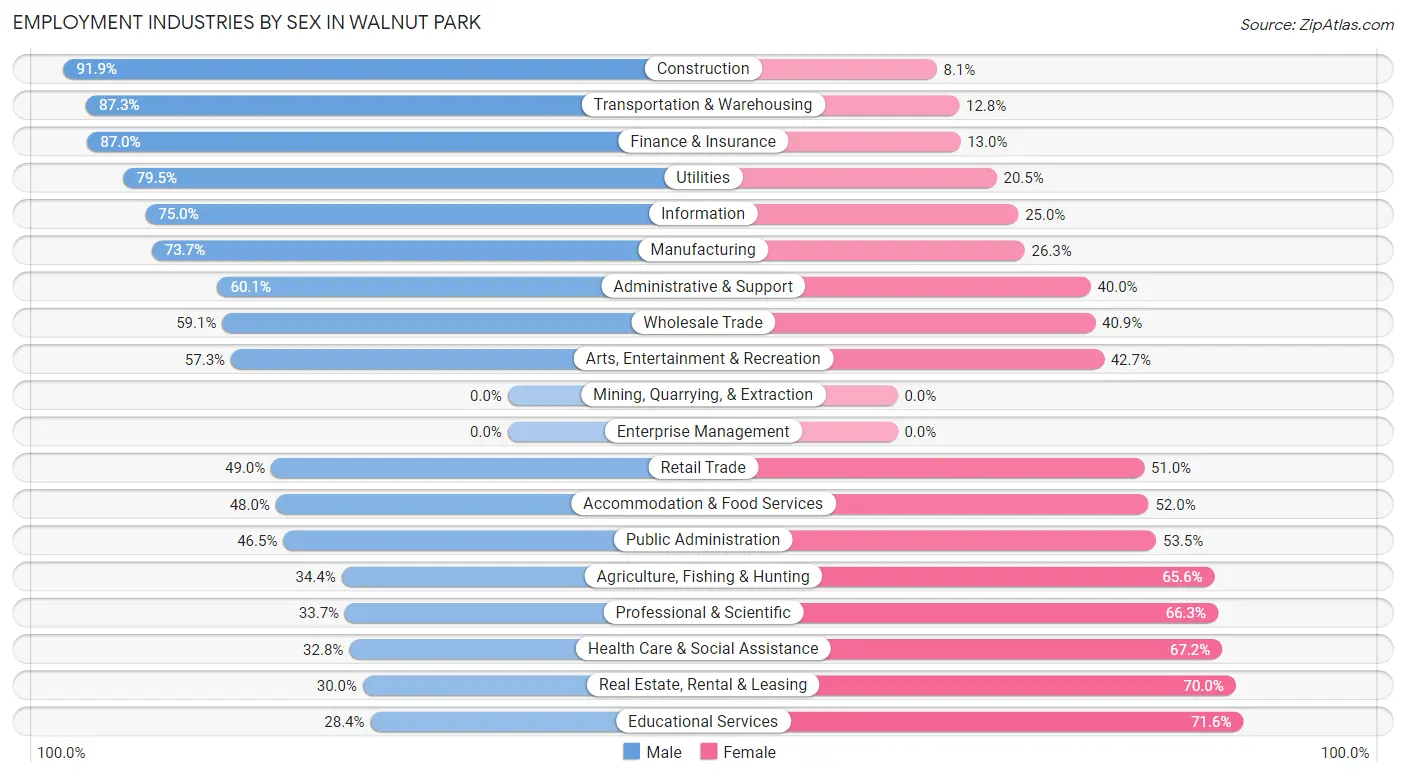
Employment Industries by Sex in Walnut Park
The Walnut Park industries that see more men than women are Construction (91.9%), Transportation & Warehousing (87.3%), and Finance & Insurance (87.0%), whereas the industries that tend to have a higher number of women are Educational Services (71.6%), Real Estate, Rental & Leasing (70.0%), and Health Care & Social Assistance (67.2%).
| Industry | Male | Female |
| Agriculture, Fishing & Hunting | 65 (34.4%) | 124 (65.6%) |
| Mining, Quarrying, & Extraction | 0 (0.0%) | 0 (0.0%) |
| Construction | 477 (91.9%) | 42 (8.1%) |
| Manufacturing | 775 (73.7%) | 277 (26.3%) |
| Wholesale Trade | 221 (59.1%) | 153 (40.9%) |
| Retail Trade | 451 (49.0%) | 470 (51.0%) |
| Transportation & Warehousing | 657 (87.3%) | 96 (12.8%) |
| Utilities | 31 (79.5%) | 8 (20.5%) |
| Information | 117 (75.0%) | 39 (25.0%) |
| Finance & Insurance | 87 (87.0%) | 13 (13.0%) |
| Real Estate, Rental & Leasing | 12 (30.0%) | 28 (70.0%) |
| Professional & Scientific | 61 (33.7%) | 120 (66.3%) |
| Enterprise Management | 0 (0.0%) | 0 (0.0%) |
| Administrative & Support | 245 (60.1%) | 163 (40.0%) |
| Educational Services | 145 (28.4%) | 365 (71.6%) |
| Health Care & Social Assistance | 275 (32.8%) | 563 (67.2%) |
| Arts, Entertainment & Recreation | 51 (57.3%) | 38 (42.7%) |
| Accommodation & Food Services | 244 (48.0%) | 264 (52.0%) |
| Public Administration | 79 (46.5%) | 91 (53.5%) |
| Total | 4,263 (58.5%) | 3,019 (41.5%) |
Education in Walnut Park
School Enrollment in Walnut Park
The most common levels of schooling among the 4,676 students in Walnut Park are middle school (1,257 | 26.9%), college / undergraduate (983 | 21.0%), and high school (918 | 19.6%).
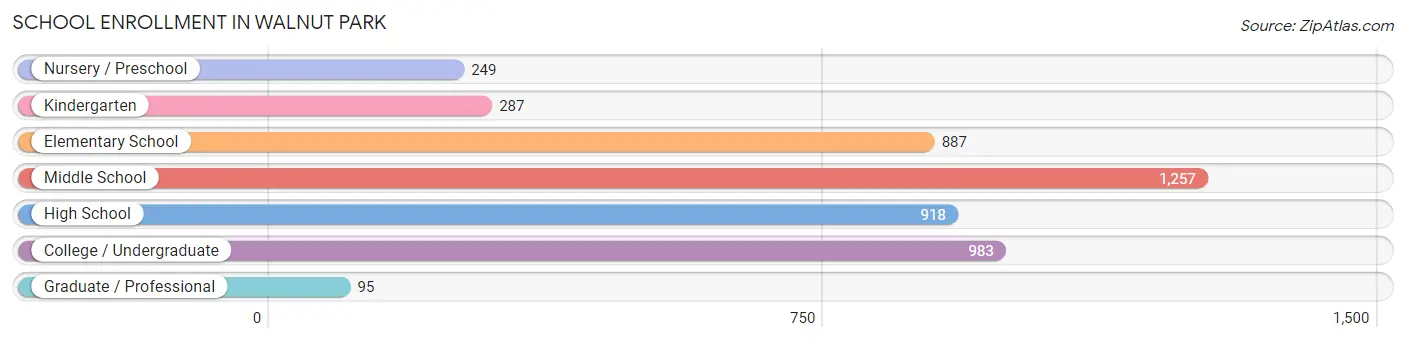
| School Level | # Students | % Students |
| Nursery / Preschool | 249 | 5.3% |
| Kindergarten | 287 | 6.1% |
| Elementary School | 887 | 19.0% |
| Middle School | 1,257 | 26.9% |
| High School | 918 | 19.6% |
| College / Undergraduate | 983 | 21.0% |
| Graduate / Professional | 95 | 2.0% |
| Total | 4,676 | 100.0% |
School Enrollment by Age by Funding Source in Walnut Park
Out of a total of 4,676 students who are enrolled in schools in Walnut Park, 355 (7.6%) attend a private institution, while the remaining 4,321 (92.4%) are enrolled in public schools. The age group of 35 years and over has the highest likelihood of being enrolled in private schools, with 36 (28.8% in the age bracket) enrolled. Conversely, the age group of 3 to 4 year olds has the lowest likelihood of being enrolled in a private school, with 280 (100.0% in the age bracket) attending a public institution.
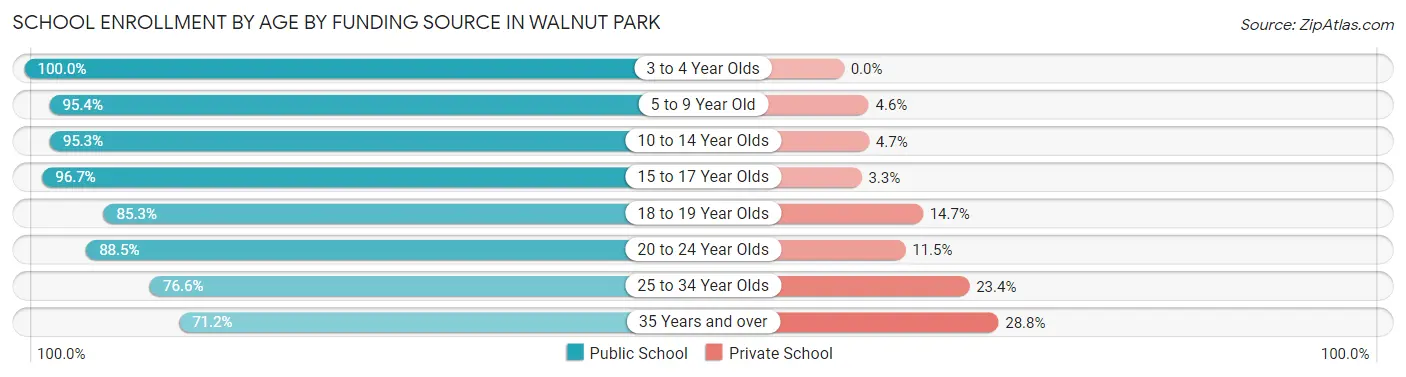
| Age Bracket | Public School | Private School |
| 3 to 4 Year Olds | 280 (100.0%) | 0 (0.0%) |
| 5 to 9 Year Old | 1,006 (95.4%) | 49 (4.6%) |
| 10 to 14 Year Olds | 1,441 (95.3%) | 71 (4.7%) |
| 15 to 17 Year Olds | 582 (96.7%) | 20 (3.3%) |
| 18 to 19 Year Olds | 336 (85.3%) | 58 (14.7%) |
| 20 to 24 Year Olds | 324 (88.5%) | 42 (11.5%) |
| 25 to 34 Year Olds | 262 (76.6%) | 80 (23.4%) |
| 35 Years and over | 89 (71.2%) | 36 (28.8%) |
| Total | 4,321 (92.4%) | 355 (7.6%) |
Educational Attainment by Field of Study in Walnut Park
Arts & humanities (173 | 16.6%), business (163 | 15.6%), education (120 | 11.5%), literature & languages (98 | 9.4%), and science & technology (93 | 8.9%) are the most common fields of study among 1,042 individuals in Walnut Park who have obtained a bachelor's degree or higher.
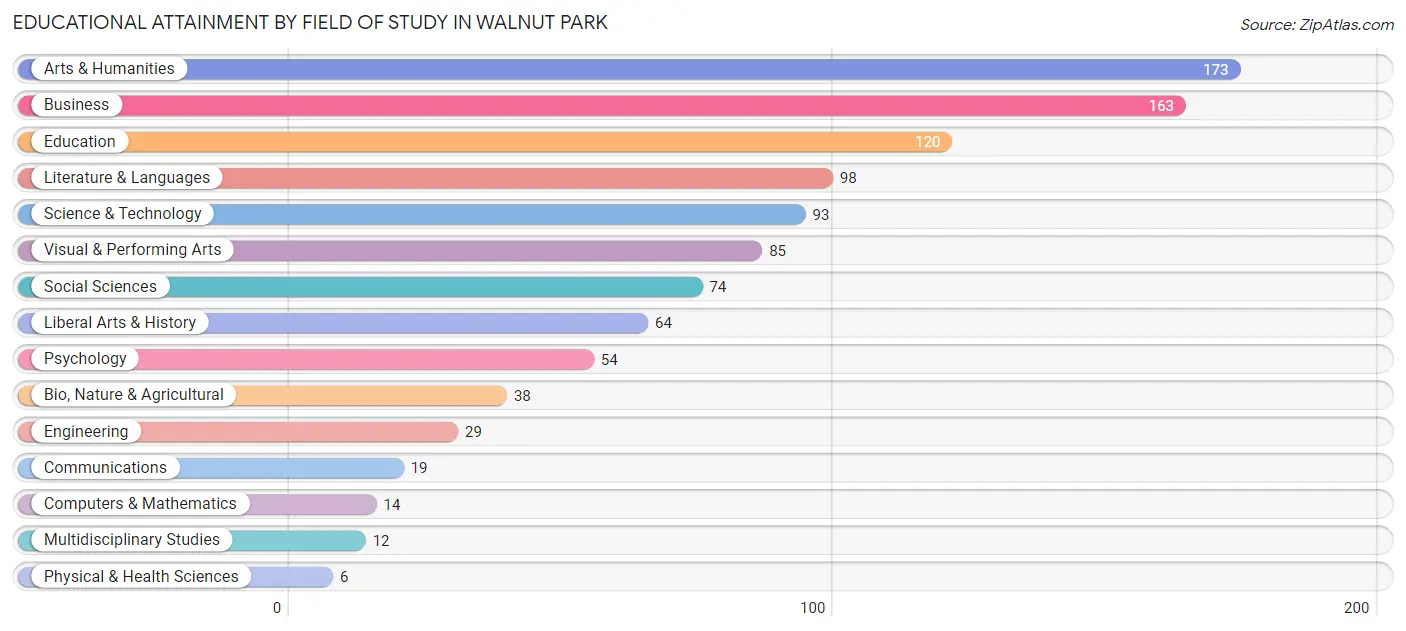
| Field of Study | # Graduates | % Graduates |
| Computers & Mathematics | 14 | 1.3% |
| Bio, Nature & Agricultural | 38 | 3.6% |
| Physical & Health Sciences | 6 | 0.6% |
| Psychology | 54 | 5.2% |
| Social Sciences | 74 | 7.1% |
| Engineering | 29 | 2.8% |
| Multidisciplinary Studies | 12 | 1.1% |
| Science & Technology | 93 | 8.9% |
| Business | 163 | 15.6% |
| Education | 120 | 11.5% |
| Literature & Languages | 98 | 9.4% |
| Liberal Arts & History | 64 | 6.1% |
| Visual & Performing Arts | 85 | 8.2% |
| Communications | 19 | 1.8% |
| Arts & Humanities | 173 | 16.6% |
| Total | 1,042 | 100.0% |
Transportation & Commute in Walnut Park
Vehicle Availability by Sex in Walnut Park
The most prevalent vehicle ownership categories in Walnut Park are males with 2 vehicles (1,307, accounting for 31.6%) and females with 2 vehicles (884, making up 45.0%).
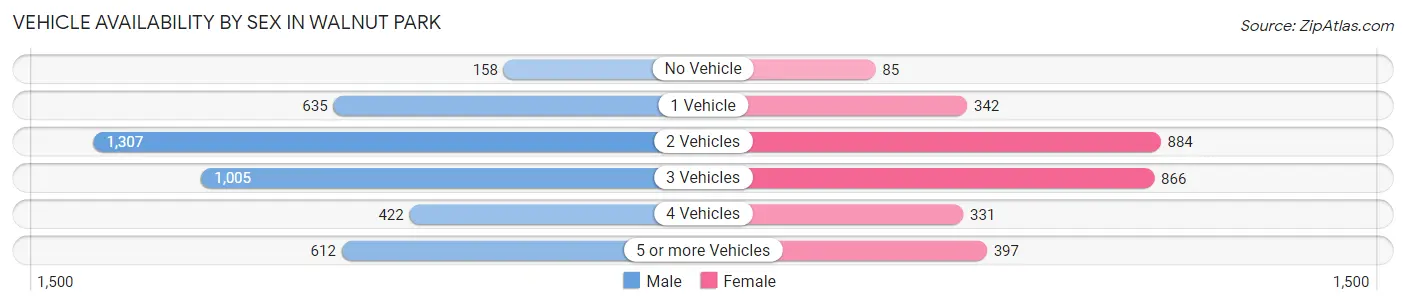
| Vehicles Available | Male | Female |
| No Vehicle | 158 (3.8%) | 85 (2.9%) |
| 1 Vehicle | 635 (15.3%) | 342 (11.8%) |
| 2 Vehicles | 1,307 (31.6%) | 884 (30.4%) |
| 3 Vehicles | 1,005 (24.3%) | 866 (29.8%) |
| 4 Vehicles | 422 (10.2%) | 331 (11.4%) |
| 5 or more Vehicles | 612 (14.8%) | 397 (13.7%) |
| Total | 4,139 (100.0%) | 2,905 (100.0%) |
Commute Time in Walnut Park
The most frequently occuring commute durations in Walnut Park are 30 to 34 minutes (1,225 commuters, 18.4%), 45 to 59 minutes (926 commuters, 13.9%), and 60 to 89 minutes (779 commuters, 11.7%).
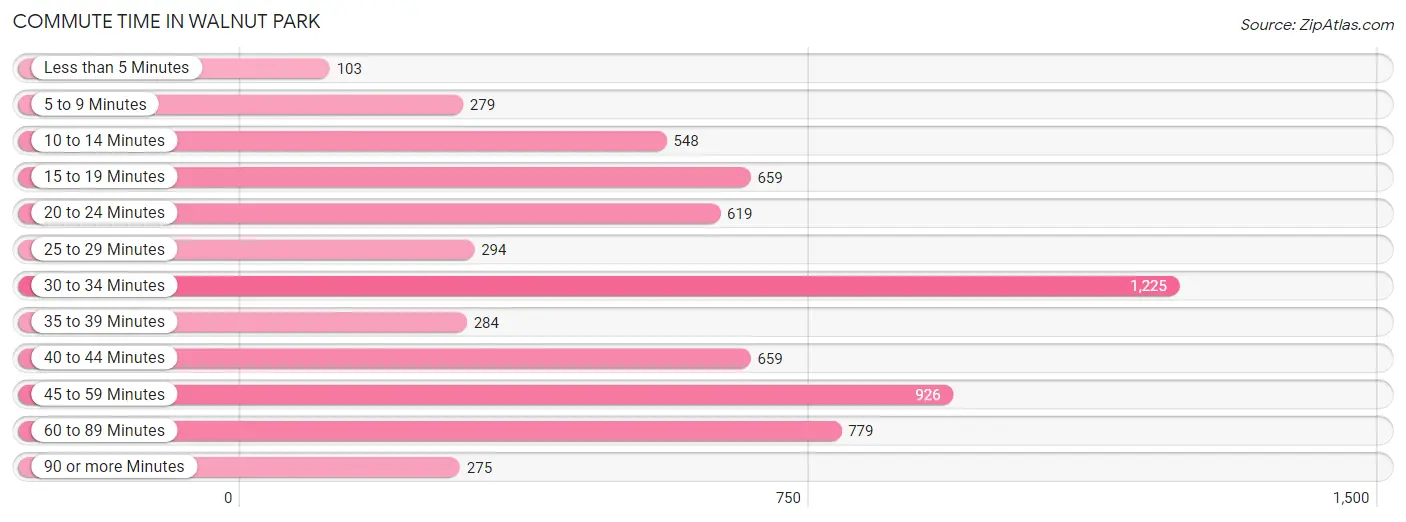
| Commute Time | # Commuters | % Commuters |
| Less than 5 Minutes | 103 | 1.5% |
| 5 to 9 Minutes | 279 | 4.2% |
| 10 to 14 Minutes | 548 | 8.2% |
| 15 to 19 Minutes | 659 | 9.9% |
| 20 to 24 Minutes | 619 | 9.3% |
| 25 to 29 Minutes | 294 | 4.4% |
| 30 to 34 Minutes | 1,225 | 18.4% |
| 35 to 39 Minutes | 284 | 4.3% |
| 40 to 44 Minutes | 659 | 9.9% |
| 45 to 59 Minutes | 926 | 13.9% |
| 60 to 89 Minutes | 779 | 11.7% |
| 90 or more Minutes | 275 | 4.1% |
Commute Time by Sex in Walnut Park
The most common commute times in Walnut Park are 45 to 59 minutes (722 commuters, 18.5%) for males and 30 to 34 minutes (549 commuters, 20.0%) for females.
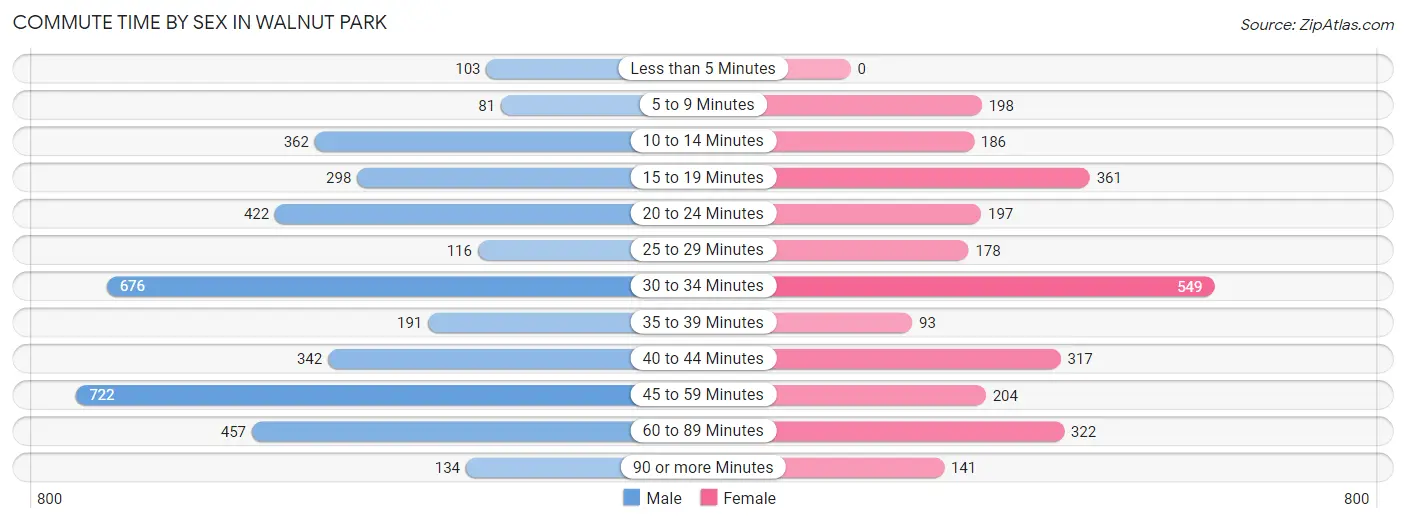
| Commute Time | Male | Female |
| Less than 5 Minutes | 103 (2.6%) | 0 (0.0%) |
| 5 to 9 Minutes | 81 (2.1%) | 198 (7.2%) |
| 10 to 14 Minutes | 362 (9.3%) | 186 (6.8%) |
| 15 to 19 Minutes | 298 (7.6%) | 361 (13.2%) |
| 20 to 24 Minutes | 422 (10.8%) | 197 (7.2%) |
| 25 to 29 Minutes | 116 (3.0%) | 178 (6.5%) |
| 30 to 34 Minutes | 676 (17.3%) | 549 (20.0%) |
| 35 to 39 Minutes | 191 (4.9%) | 93 (3.4%) |
| 40 to 44 Minutes | 342 (8.8%) | 317 (11.5%) |
| 45 to 59 Minutes | 722 (18.5%) | 204 (7.4%) |
| 60 to 89 Minutes | 457 (11.7%) | 322 (11.7%) |
| 90 or more Minutes | 134 (3.4%) | 141 (5.1%) |
Time of Departure to Work by Sex in Walnut Park
The most frequent times of departure to work in Walnut Park are 12:00 AM to 4:59 AM (563, 14.4%) for males and 8:00 AM to 8:29 AM (478, 17.4%) for females.
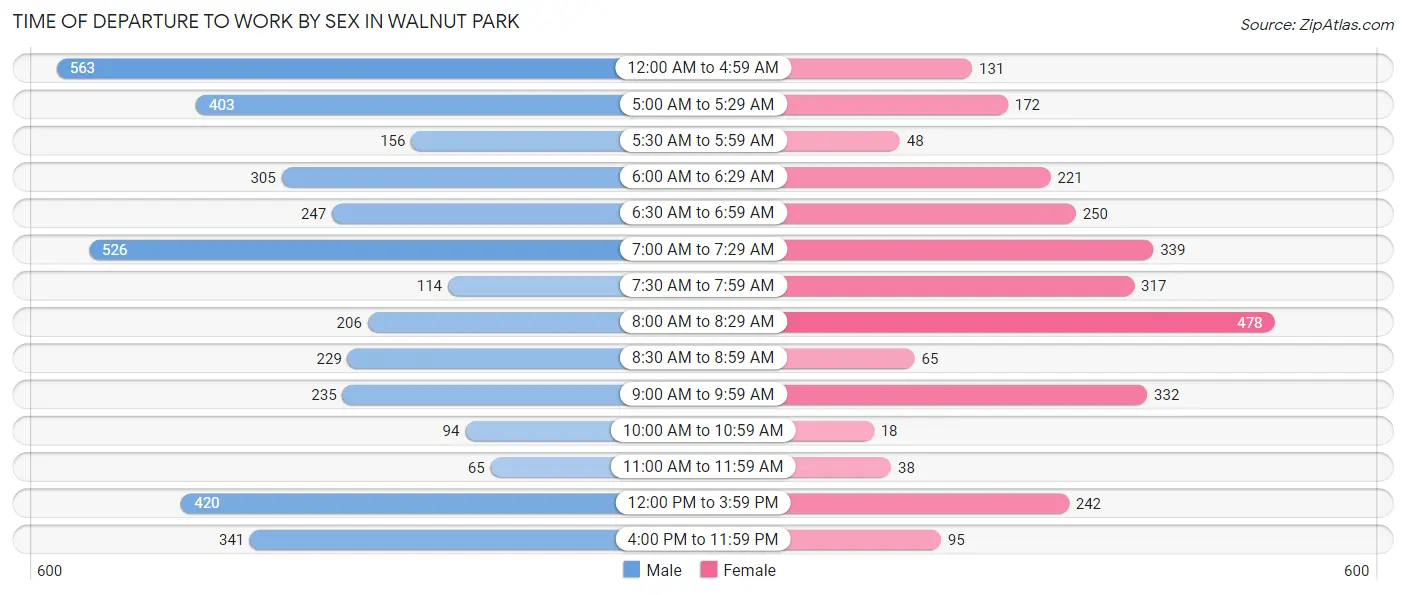
| Time of Departure | Male | Female |
| 12:00 AM to 4:59 AM | 563 (14.4%) | 131 (4.8%) |
| 5:00 AM to 5:29 AM | 403 (10.3%) | 172 (6.3%) |
| 5:30 AM to 5:59 AM | 156 (4.0%) | 48 (1.8%) |
| 6:00 AM to 6:29 AM | 305 (7.8%) | 221 (8.1%) |
| 6:30 AM to 6:59 AM | 247 (6.3%) | 250 (9.1%) |
| 7:00 AM to 7:29 AM | 526 (13.5%) | 339 (12.3%) |
| 7:30 AM to 7:59 AM | 114 (2.9%) | 317 (11.5%) |
| 8:00 AM to 8:29 AM | 206 (5.3%) | 478 (17.4%) |
| 8:30 AM to 8:59 AM | 229 (5.9%) | 65 (2.4%) |
| 9:00 AM to 9:59 AM | 235 (6.0%) | 332 (12.1%) |
| 10:00 AM to 10:59 AM | 94 (2.4%) | 18 (0.7%) |
| 11:00 AM to 11:59 AM | 65 (1.7%) | 38 (1.4%) |
| 12:00 PM to 3:59 PM | 420 (10.8%) | 242 (8.8%) |
| 4:00 PM to 11:59 PM | 341 (8.7%) | 95 (3.5%) |
| Total | 3,904 (100.0%) | 2,746 (100.0%) |
Housing Occupancy in Walnut Park
Occupancy by Ownership in Walnut Park
Of the total 3,821 dwellings in Walnut Park, owner-occupied units account for 1,996 (52.2%), while renter-occupied units make up 1,825 (47.8%).
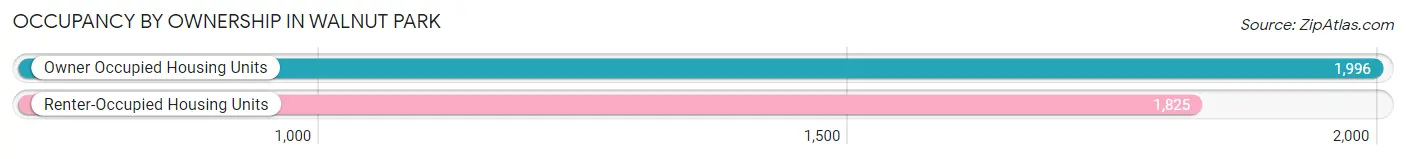
| Occupancy | # Housing Units | % Housing Units |
| Owner Occupied Housing Units | 1,996 | 52.2% |
| Renter-Occupied Housing Units | 1,825 | 47.8% |
| Total Occupied Housing Units | 3,821 | 100.0% |
Occupancy by Household Size in Walnut Park
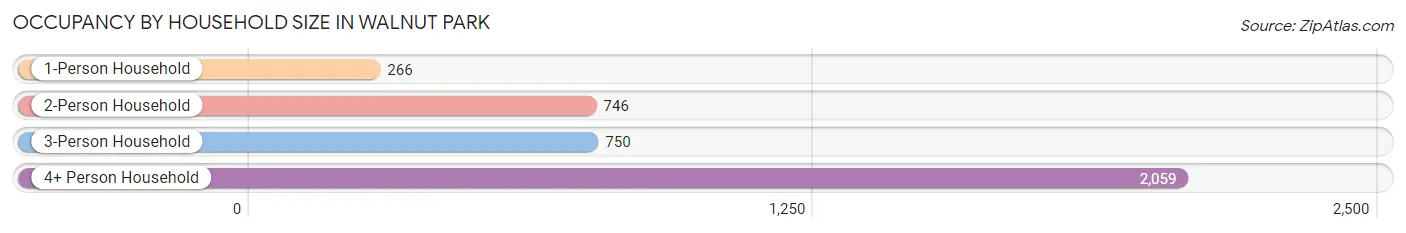
| Household Size | # Housing Units | % Housing Units |
| 1-Person Household | 266 | 7.0% |
| 2-Person Household | 746 | 19.5% |
| 3-Person Household | 750 | 19.6% |
| 4+ Person Household | 2,059 | 53.9% |
| Total Housing Units | 3,821 | 100.0% |
Occupancy by Ownership by Household Size in Walnut Park
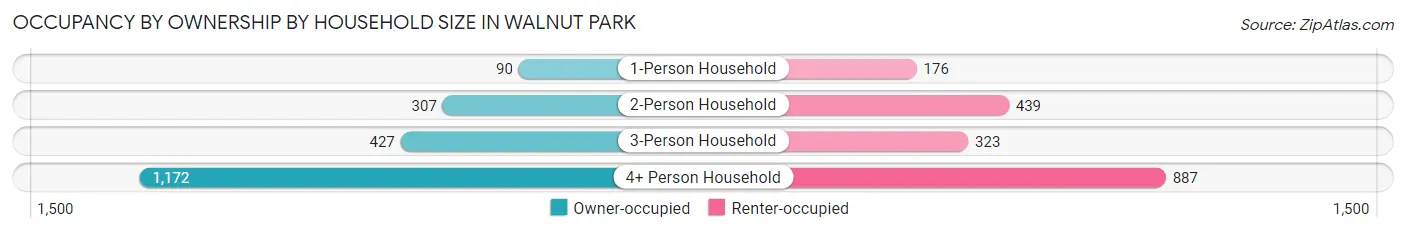
| Household Size | Owner-occupied | Renter-occupied |
| 1-Person Household | 90 (33.8%) | 176 (66.2%) |
| 2-Person Household | 307 (41.1%) | 439 (58.9%) |
| 3-Person Household | 427 (56.9%) | 323 (43.1%) |
| 4+ Person Household | 1,172 (56.9%) | 887 (43.1%) |
| Total Housing Units | 1,996 (52.2%) | 1,825 (47.8%) |
Occupancy by Educational Attainment in Walnut Park
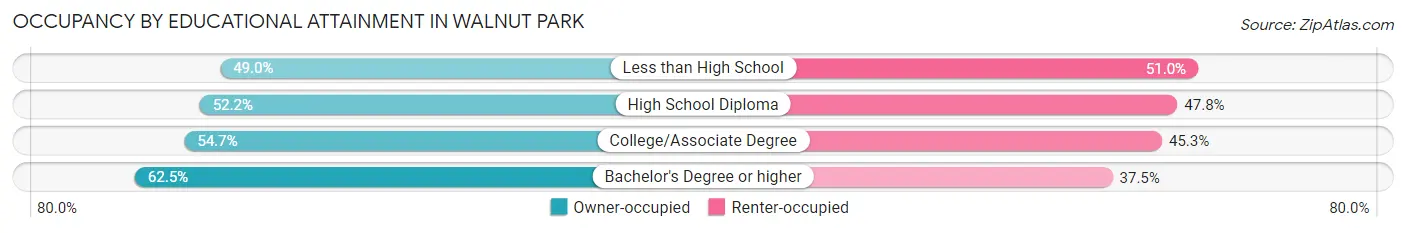
| Household Size | Owner-occupied | Renter-occupied |
| Less than High School | 930 (49.0%) | 969 (51.0%) |
| High School Diploma | 435 (52.2%) | 398 (47.8%) |
| College/Associate Degree | 346 (54.7%) | 287 (45.3%) |
| Bachelor's Degree or higher | 285 (62.5%) | 171 (37.5%) |
Occupancy by Age of Householder in Walnut Park
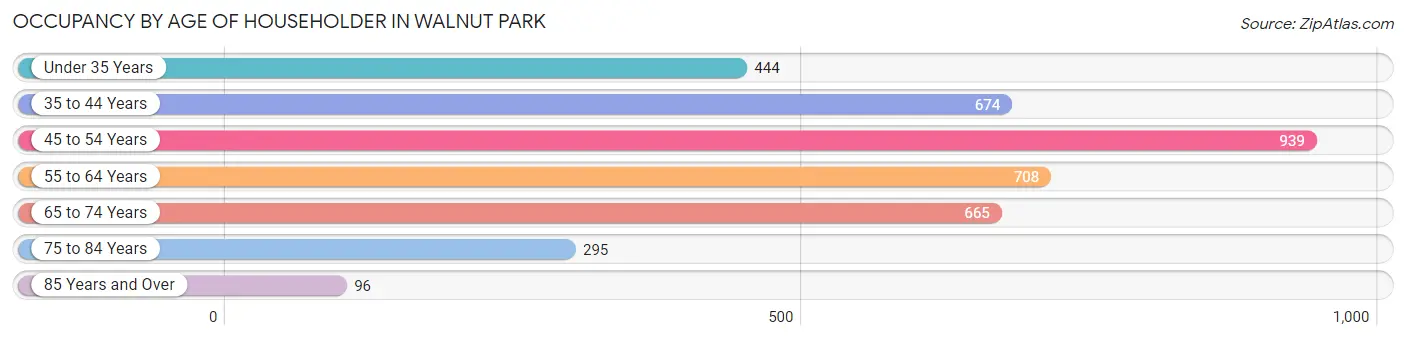
| Age Bracket | # Households | % Households |
| Under 35 Years | 444 | 11.6% |
| 35 to 44 Years | 674 | 17.6% |
| 45 to 54 Years | 939 | 24.6% |
| 55 to 64 Years | 708 | 18.5% |
| 65 to 74 Years | 665 | 17.4% |
| 75 to 84 Years | 295 | 7.7% |
| 85 Years and Over | 96 | 2.5% |
| Total | 3,821 | 100.0% |
Housing Finances in Walnut Park
Median Income by Occupancy in Walnut Park
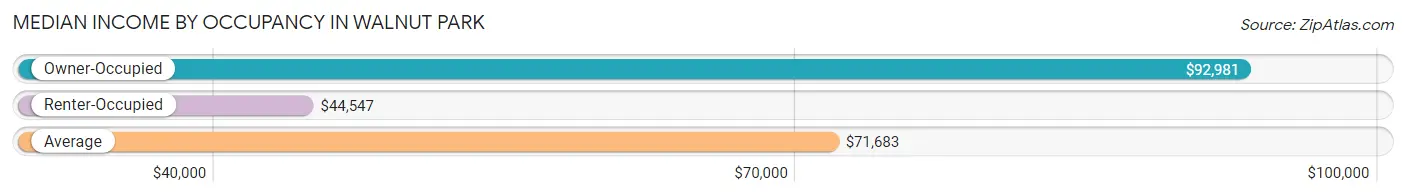
| Occupancy Type | # Households | Median Income |
| Owner-Occupied | 1,996 (52.2%) | $92,981 |
| Renter-Occupied | 1,825 (47.8%) | $44,547 |
| Average | 3,821 (100.0%) | $71,683 |
Occupancy by Householder Income Bracket in Walnut Park
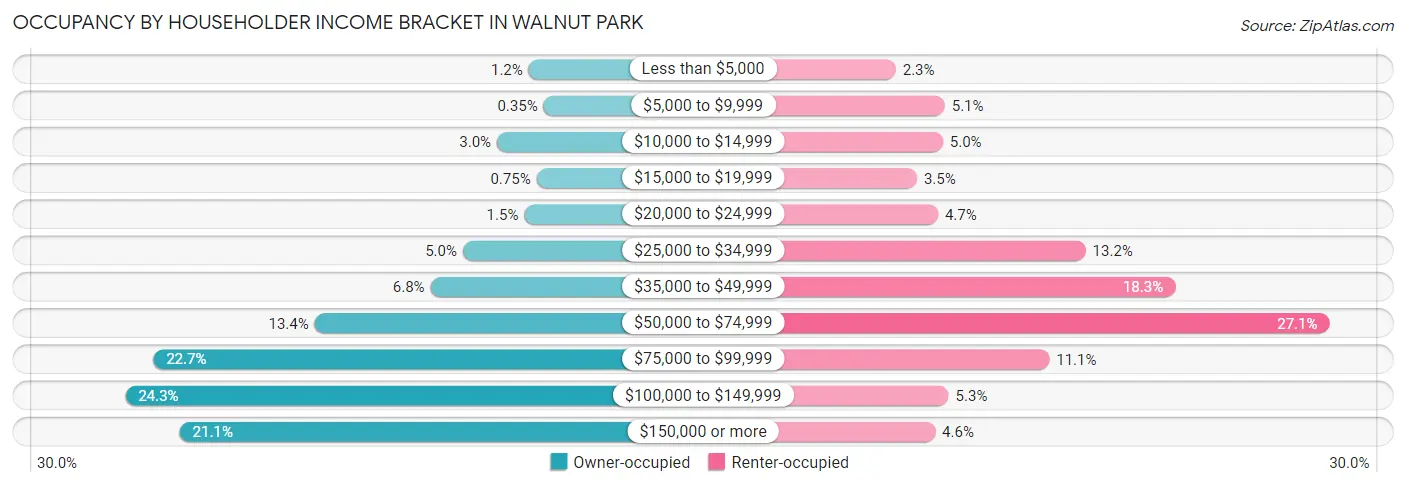
| Income Bracket | Owner-occupied | Renter-occupied |
| Less than $5,000 | 24 (1.2%) | 42 (2.3%) |
| $5,000 to $9,999 | 7 (0.4%) | 93 (5.1%) |
| $10,000 to $14,999 | 60 (3.0%) | 91 (5.0%) |
| $15,000 to $19,999 | 15 (0.7%) | 64 (3.5%) |
| $20,000 to $24,999 | 29 (1.5%) | 86 (4.7%) |
| $25,000 to $34,999 | 99 (5.0%) | 240 (13.2%) |
| $35,000 to $49,999 | 136 (6.8%) | 333 (18.2%) |
| $50,000 to $74,999 | 268 (13.4%) | 494 (27.1%) |
| $75,000 to $99,999 | 452 (22.7%) | 202 (11.1%) |
| $100,000 to $149,999 | 484 (24.2%) | 97 (5.3%) |
| $150,000 or more | 422 (21.1%) | 83 (4.5%) |
| Total | 1,996 (100.0%) | 1,825 (100.0%) |
Monthly Housing Cost Tiers in Walnut Park
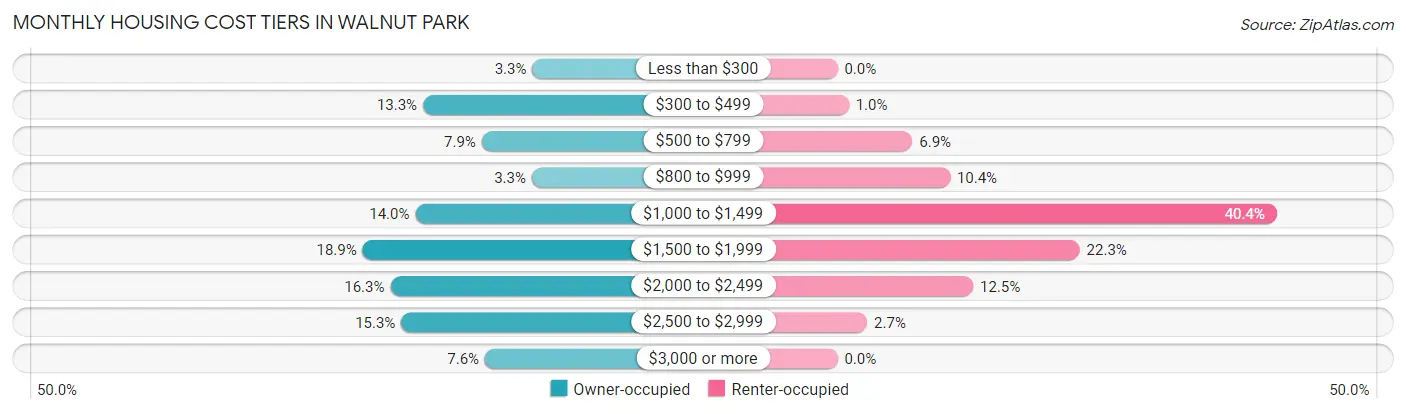
| Monthly Cost | Owner-occupied | Renter-occupied |
| Less than $300 | 65 (3.3%) | 0 (0.0%) |
| $300 to $499 | 266 (13.3%) | 19 (1.0%) |
| $500 to $799 | 158 (7.9%) | 126 (6.9%) |
| $800 to $999 | 66 (3.3%) | 189 (10.4%) |
| $1,000 to $1,499 | 280 (14.0%) | 738 (40.4%) |
| $1,500 to $1,999 | 377 (18.9%) | 407 (22.3%) |
| $2,000 to $2,499 | 326 (16.3%) | 228 (12.5%) |
| $2,500 to $2,999 | 306 (15.3%) | 50 (2.7%) |
| $3,000 or more | 152 (7.6%) | 0 (0.0%) |
| Total | 1,996 (100.0%) | 1,825 (100.0%) |
Physical Housing Characteristics in Walnut Park
Housing Structures in Walnut Park
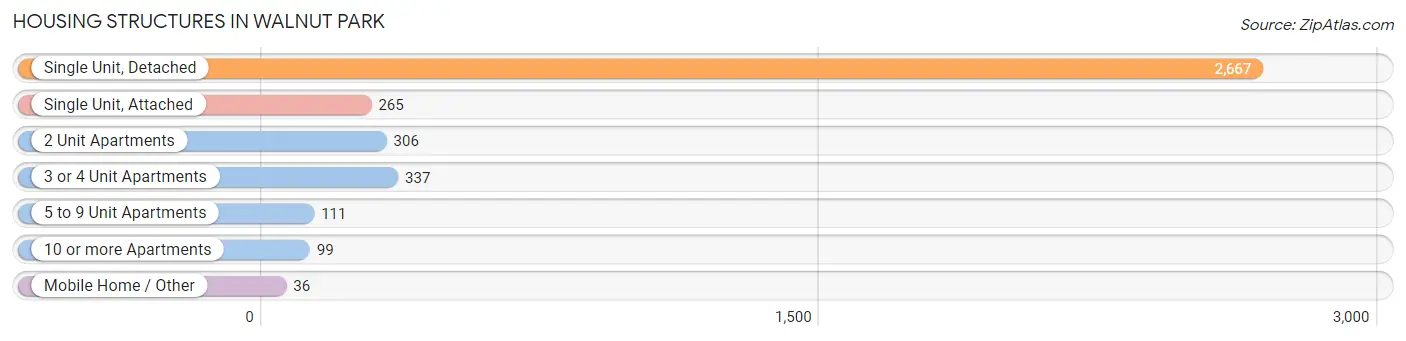
| Structure Type | # Housing Units | % Housing Units |
| Single Unit, Detached | 2,667 | 69.8% |
| Single Unit, Attached | 265 | 6.9% |
| 2 Unit Apartments | 306 | 8.0% |
| 3 or 4 Unit Apartments | 337 | 8.8% |
| 5 to 9 Unit Apartments | 111 | 2.9% |
| 10 or more Apartments | 99 | 2.6% |
| Mobile Home / Other | 36 | 0.9% |
| Total | 3,821 | 100.0% |
Housing Structures by Occupancy in Walnut Park
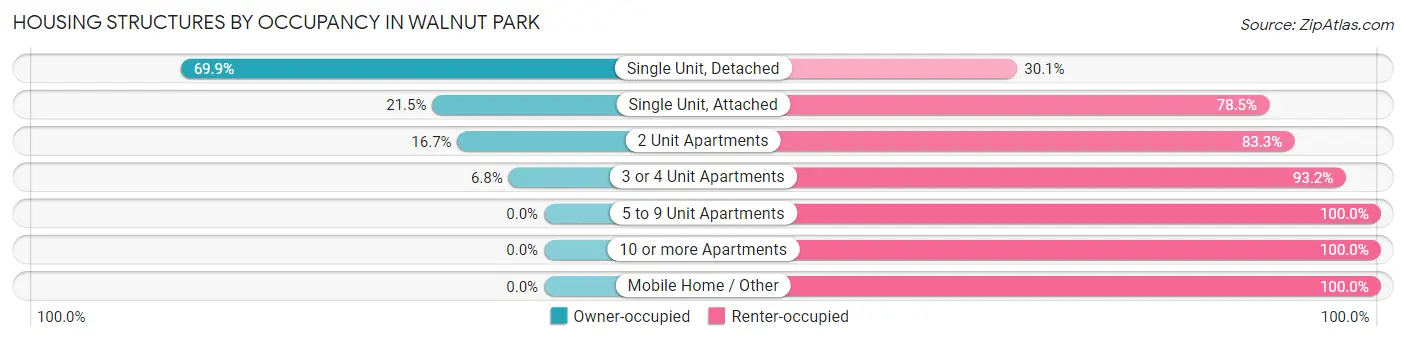
| Structure Type | Owner-occupied | Renter-occupied |
| Single Unit, Detached | 1,865 (69.9%) | 802 (30.1%) |
| Single Unit, Attached | 57 (21.5%) | 208 (78.5%) |
| 2 Unit Apartments | 51 (16.7%) | 255 (83.3%) |
| 3 or 4 Unit Apartments | 23 (6.8%) | 314 (93.2%) |
| 5 to 9 Unit Apartments | 0 (0.0%) | 111 (100.0%) |
| 10 or more Apartments | 0 (0.0%) | 99 (100.0%) |
| Mobile Home / Other | 0 (0.0%) | 36 (100.0%) |
| Total | 1,996 (52.2%) | 1,825 (47.8%) |
Housing Structures by Number of Rooms in Walnut Park
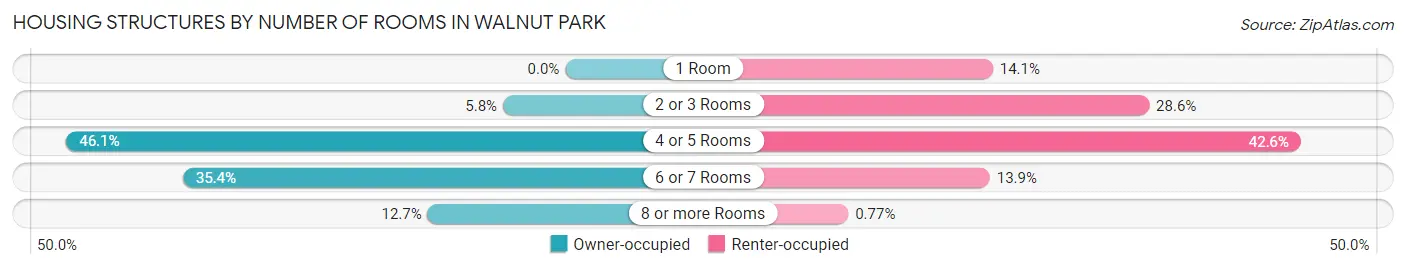
| Number of Rooms | Owner-occupied | Renter-occupied |
| 1 Room | 0 (0.0%) | 258 (14.1%) |
| 2 or 3 Rooms | 115 (5.8%) | 522 (28.6%) |
| 4 or 5 Rooms | 921 (46.1%) | 778 (42.6%) |
| 6 or 7 Rooms | 706 (35.4%) | 253 (13.9%) |
| 8 or more Rooms | 254 (12.7%) | 14 (0.8%) |
| Total | 1,996 (100.0%) | 1,825 (100.0%) |
Housing Structure by Heating Type in Walnut Park
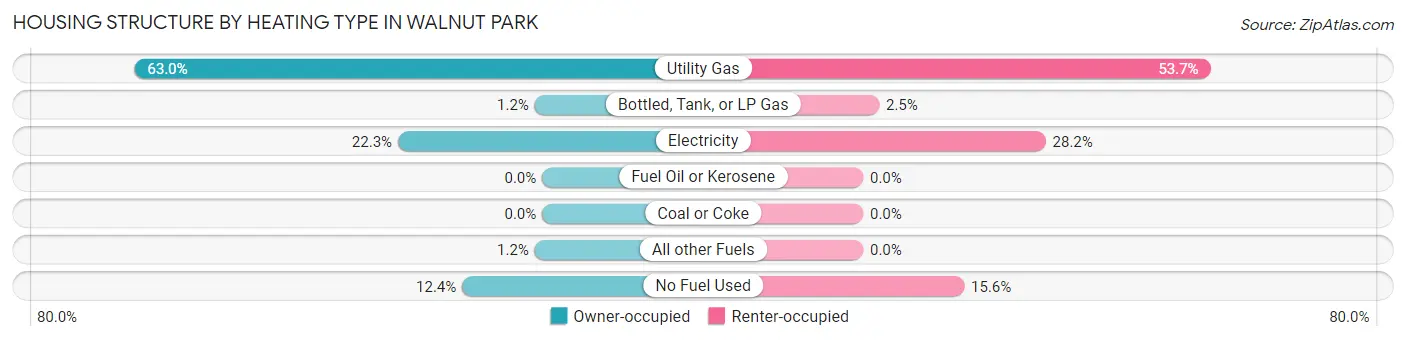
| Heating Type | Owner-occupied | Renter-occupied |
| Utility Gas | 1,258 (63.0%) | 980 (53.7%) |
| Bottled, Tank, or LP Gas | 23 (1.1%) | 45 (2.5%) |
| Electricity | 445 (22.3%) | 515 (28.2%) |
| Fuel Oil or Kerosene | 0 (0.0%) | 0 (0.0%) |
| Coal or Coke | 0 (0.0%) | 0 (0.0%) |
| All other Fuels | 23 (1.1%) | 0 (0.0%) |
| No Fuel Used | 247 (12.4%) | 285 (15.6%) |
| Total | 1,996 (100.0%) | 1,825 (100.0%) |
Household Vehicle Usage in Walnut Park
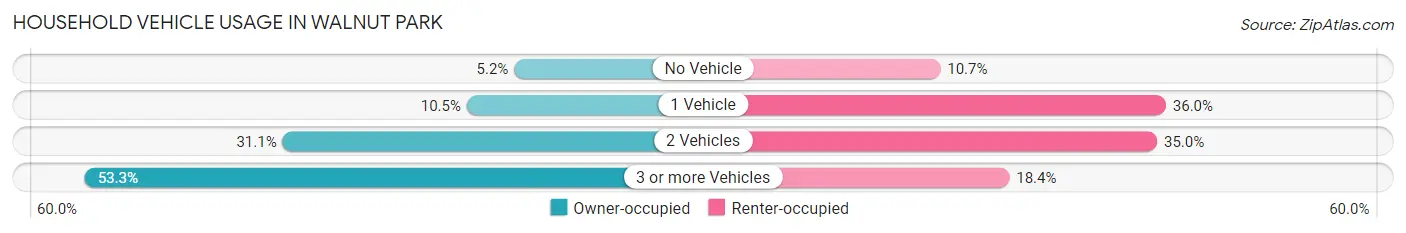
| Vehicles per Household | Owner-occupied | Renter-occupied |
| No Vehicle | 103 (5.2%) | 195 (10.7%) |
| 1 Vehicle | 209 (10.5%) | 656 (35.9%) |
| 2 Vehicles | 621 (31.1%) | 638 (35.0%) |
| 3 or more Vehicles | 1,063 (53.3%) | 336 (18.4%) |
| Total | 1,996 (100.0%) | 1,825 (100.0%) |
Real Estate & Mortgages in Walnut Park
Real Estate and Mortgage Overview in Walnut Park
| Characteristic | Without Mortgage | With Mortgage |
| Housing Units | 569 | 1,427 |
| Median Property Value | $579,300 | $543,300 |
| Median Household Income | $90,402 | $317 |
| Monthly Housing Costs | $485 | $152 |
| Real Estate Taxes | $2,747 | $0 |
Property Value by Mortgage Status in Walnut Park
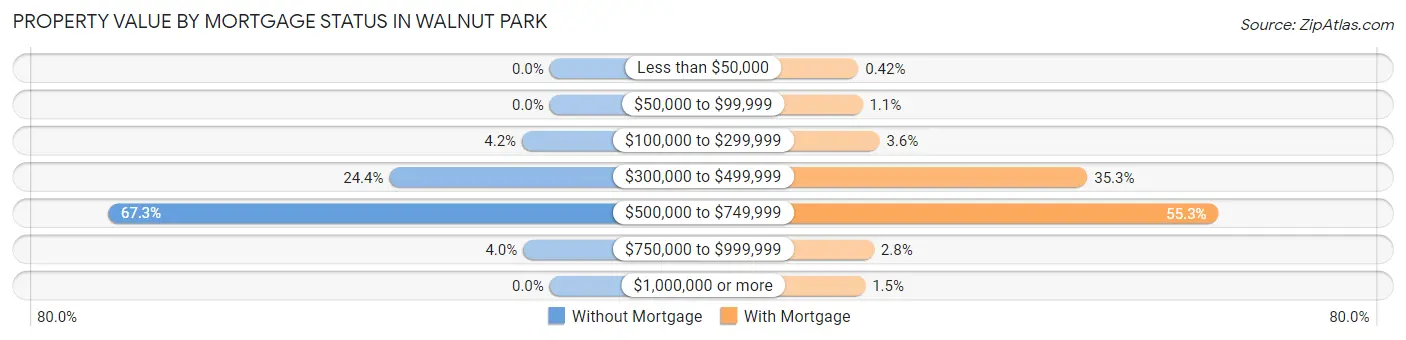
| Property Value | Without Mortgage | With Mortgage |
| Less than $50,000 | 0 (0.0%) | 6 (0.4%) |
| $50,000 to $99,999 | 0 (0.0%) | 15 (1.1%) |
| $100,000 to $299,999 | 24 (4.2%) | 52 (3.6%) |
| $300,000 to $499,999 | 139 (24.4%) | 504 (35.3%) |
| $500,000 to $749,999 | 383 (67.3%) | 789 (55.3%) |
| $750,000 to $999,999 | 23 (4.0%) | 40 (2.8%) |
| $1,000,000 or more | 0 (0.0%) | 21 (1.5%) |
| Total | 569 (100.0%) | 1,427 (100.0%) |
Household Income by Mortgage Status in Walnut Park
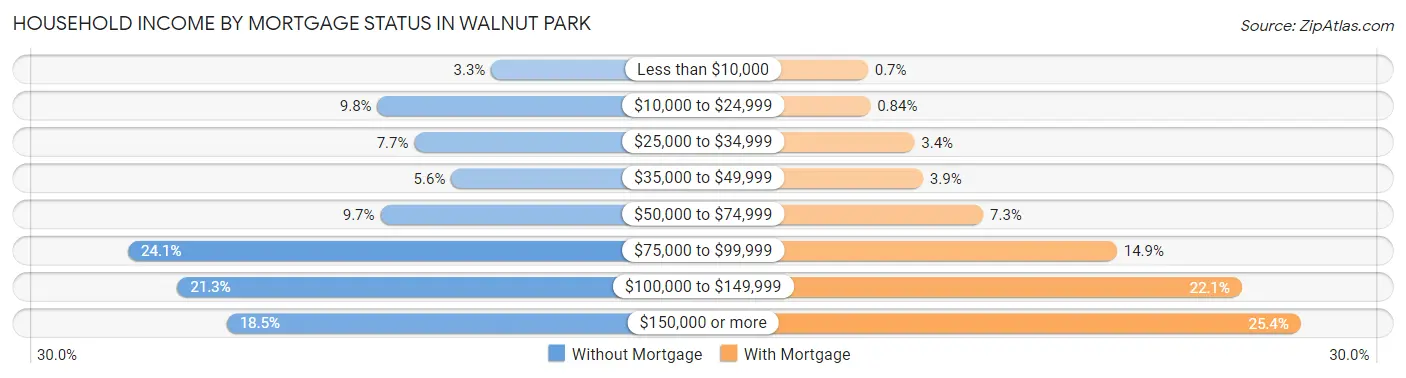
| Household Income | Without Mortgage | With Mortgage |
| Less than $10,000 | 19 (3.3%) | 10 (0.7%) |
| $10,000 to $24,999 | 56 (9.8%) | 12 (0.8%) |
| $25,000 to $34,999 | 44 (7.7%) | 48 (3.4%) |
| $35,000 to $49,999 | 32 (5.6%) | 55 (3.8%) |
| $50,000 to $74,999 | 55 (9.7%) | 104 (7.3%) |
| $75,000 to $99,999 | 137 (24.1%) | 213 (14.9%) |
| $100,000 to $149,999 | 121 (21.3%) | 315 (22.1%) |
| $150,000 or more | 105 (18.4%) | 363 (25.4%) |
| Total | 569 (100.0%) | 1,427 (100.0%) |
Property Value to Household Income Ratio in Walnut Park
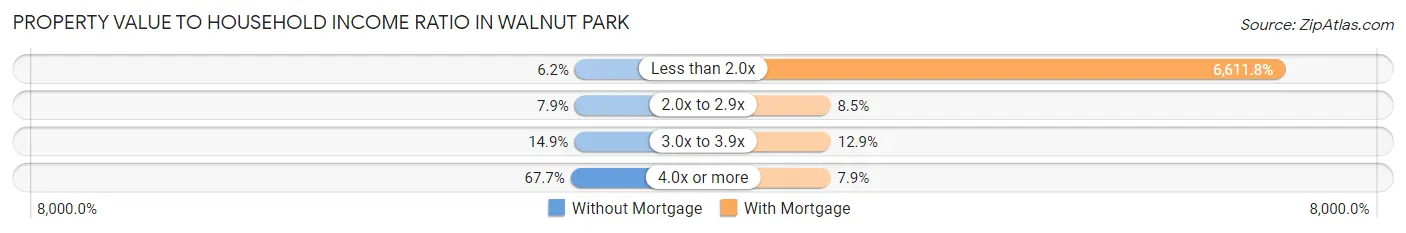
| Value-to-Income Ratio | Without Mortgage | With Mortgage |
| Less than 2.0x | 35 (6.1%) | 94,351 (6,611.8%) |
| 2.0x to 2.9x | 45 (7.9%) | 121 (8.5%) |
| 3.0x to 3.9x | 85 (14.9%) | 184 (12.9%) |
| 4.0x or more | 385 (67.7%) | 112 (7.9%) |
| Total | 569 (100.0%) | 1,427 (100.0%) |
Real Estate Taxes by Mortgage Status in Walnut Park
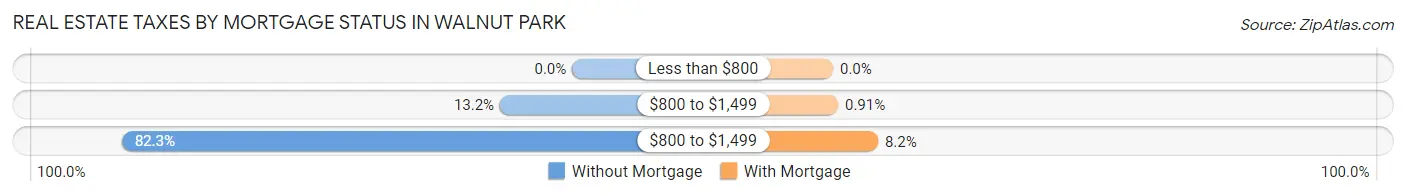
| Property Taxes | Without Mortgage | With Mortgage |
| Less than $800 | 0 (0.0%) | 0 (0.0%) |
| $800 to $1,499 | 75 (13.2%) | 13 (0.9%) |
| $800 to $1,499 | 468 (82.3%) | 117 (8.2%) |
| Total | 569 (100.0%) | 1,427 (100.0%) |
Health & Disability in Walnut Park
Health Insurance Coverage by Age in Walnut Park
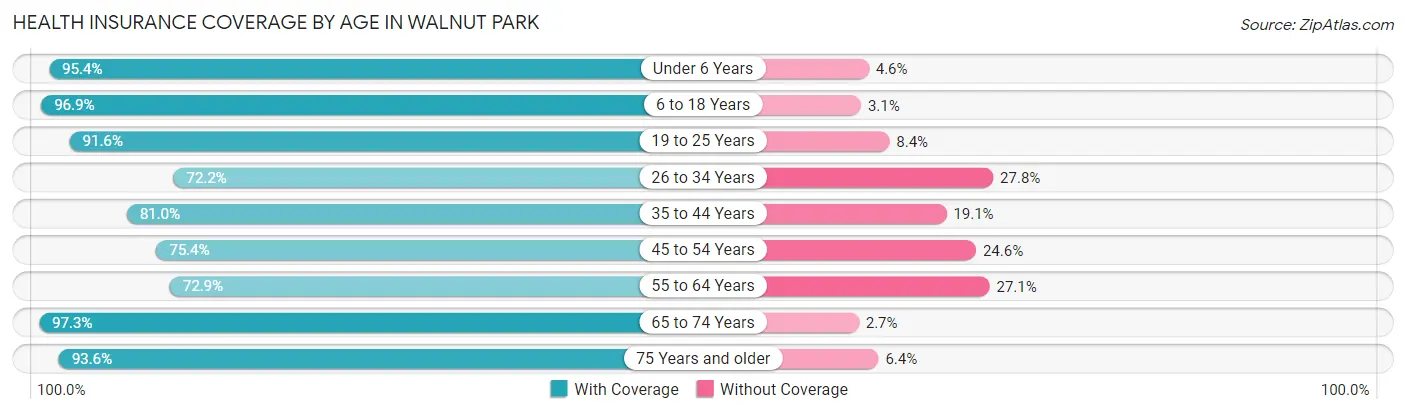
| Age Bracket | With Coverage | Without Coverage |
| Under 6 Years | 982 (95.4%) | 47 (4.6%) |
| 6 to 18 Years | 3,208 (96.9%) | 103 (3.1%) |
| 19 to 25 Years | 1,222 (91.6%) | 112 (8.4%) |
| 26 to 34 Years | 1,642 (72.2%) | 631 (27.8%) |
| 35 to 44 Years | 1,921 (80.9%) | 452 (19.1%) |
| 45 to 54 Years | 1,511 (75.4%) | 492 (24.6%) |
| 55 to 64 Years | 1,379 (72.9%) | 512 (27.1%) |
| 65 to 74 Years | 1,151 (97.3%) | 32 (2.7%) |
| 75 Years and older | 750 (93.6%) | 51 (6.4%) |
| Total | 13,766 (85.0%) | 2,432 (15.0%) |
Health Insurance Coverage by Citizenship Status in Walnut Park
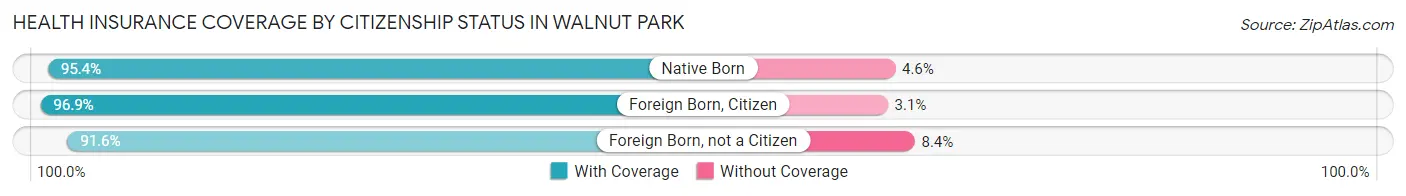
| Citizenship Status | With Coverage | Without Coverage |
| Native Born | 982 (95.4%) | 47 (4.6%) |
| Foreign Born, Citizen | 3,208 (96.9%) | 103 (3.1%) |
| Foreign Born, not a Citizen | 1,222 (91.6%) | 112 (8.4%) |
Health Insurance Coverage by Household Income in Walnut Park
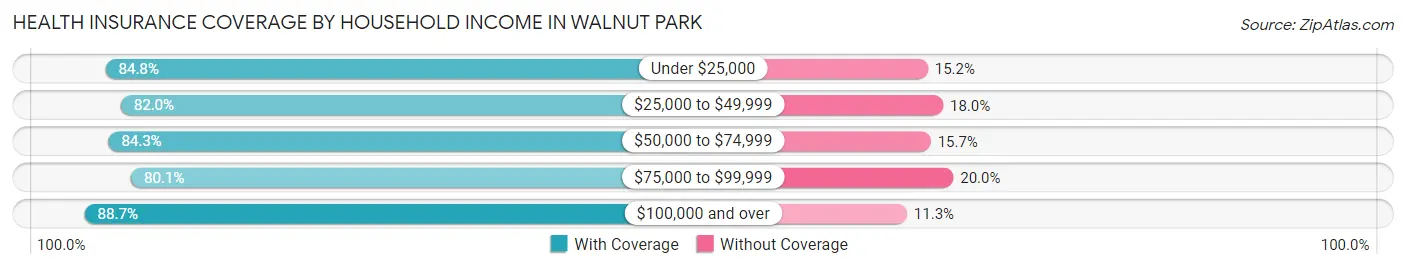
| Household Income | With Coverage | Without Coverage |
| Under $25,000 | 1,252 (84.8%) | 224 (15.2%) |
| $25,000 to $49,999 | 2,281 (82.0%) | 502 (18.0%) |
| $50,000 to $74,999 | 2,772 (84.3%) | 517 (15.7%) |
| $75,000 to $99,999 | 1,982 (80.0%) | 494 (20.0%) |
| $100,000 and over | 5,479 (88.7%) | 695 (11.3%) |
Public vs Private Health Insurance Coverage by Age in Walnut Park
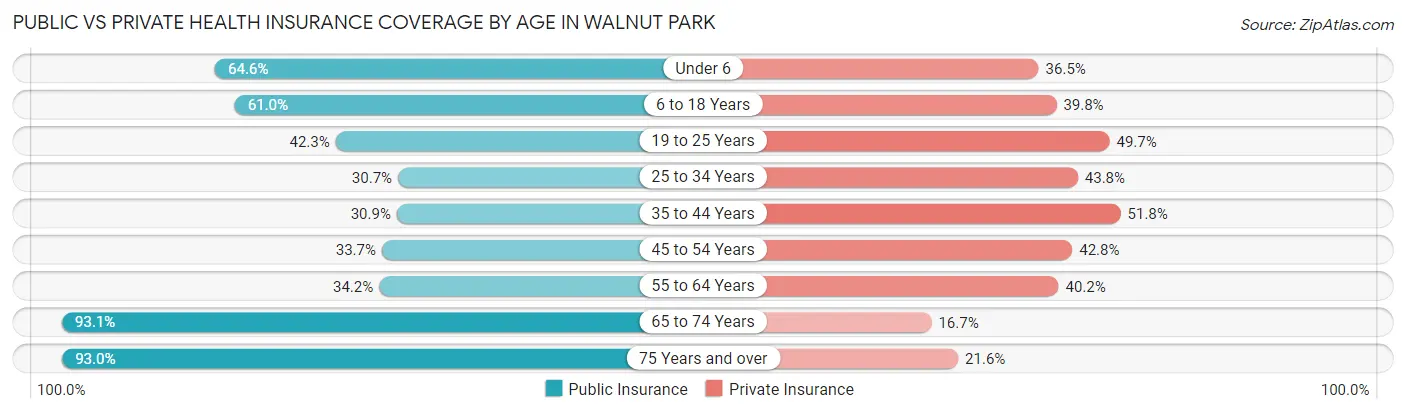
| Age Bracket | Public Insurance | Private Insurance |
| Under 6 | 665 (64.6%) | 376 (36.5%) |
| 6 to 18 Years | 2,019 (61.0%) | 1,319 (39.8%) |
| 19 to 25 Years | 564 (42.3%) | 663 (49.7%) |
| 25 to 34 Years | 698 (30.7%) | 996 (43.8%) |
| 35 to 44 Years | 734 (30.9%) | 1,228 (51.7%) |
| 45 to 54 Years | 675 (33.7%) | 857 (42.8%) |
| 55 to 64 Years | 647 (34.2%) | 761 (40.2%) |
| 65 to 74 Years | 1,101 (93.1%) | 197 (16.7%) |
| 75 Years and over | 745 (93.0%) | 173 (21.6%) |
| Total | 7,848 (48.4%) | 6,570 (40.6%) |
Disability Status by Sex by Age in Walnut Park
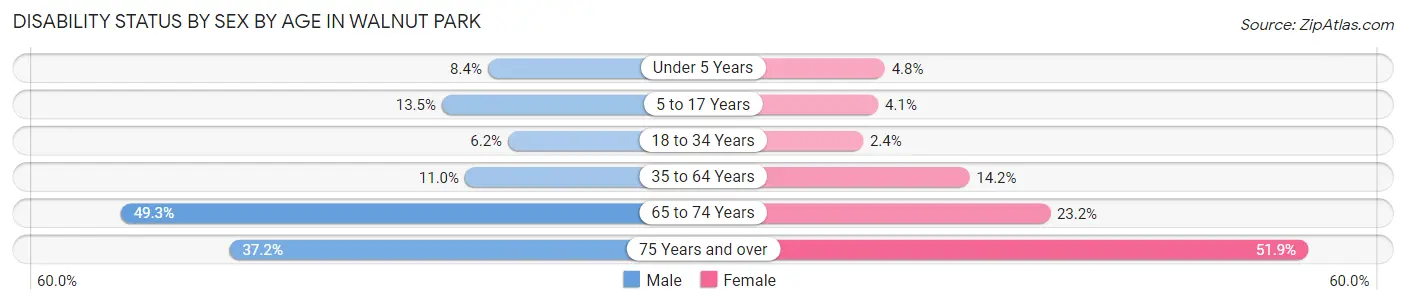
| Age Bracket | Male | Female |
| Under 5 Years | 32 (8.4%) | 23 (4.8%) |
| 5 to 17 Years | 239 (13.5%) | 59 (4.1%) |
| 18 to 34 Years | 134 (6.2%) | 40 (2.4%) |
| 35 to 64 Years | 353 (11.0%) | 433 (14.2%) |
| 65 to 74 Years | 279 (49.3%) | 143 (23.2%) |
| 75 Years and over | 103 (37.2%) | 272 (51.9%) |
Disability Class by Sex by Age in Walnut Park
Disability Class: Hearing Difficulty
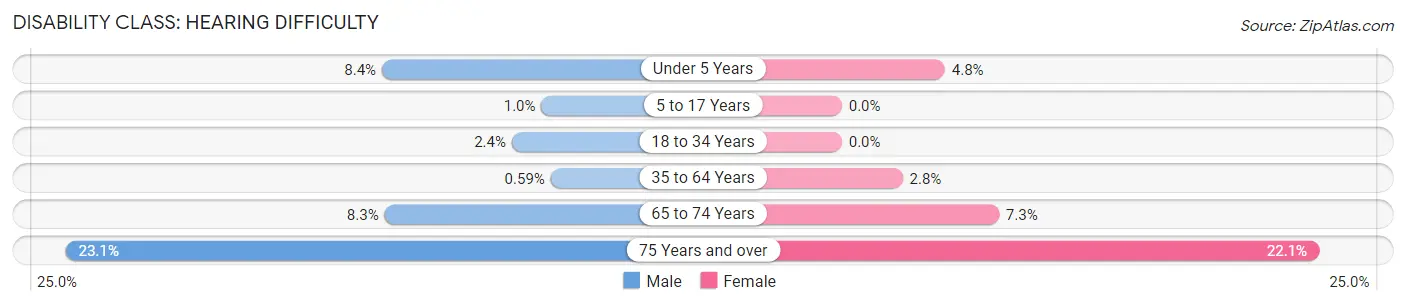
| Age Bracket | Male | Female |
| Under 5 Years | 32 (8.4%) | 23 (4.8%) |
| 5 to 17 Years | 18 (1.0%) | 0 (0.0%) |
| 18 to 34 Years | 52 (2.4%) | 0 (0.0%) |
| 35 to 64 Years | 19 (0.6%) | 86 (2.8%) |
| 65 to 74 Years | 47 (8.3%) | 45 (7.3%) |
| 75 Years and over | 64 (23.1%) | 116 (22.1%) |
Disability Class: Vision Difficulty
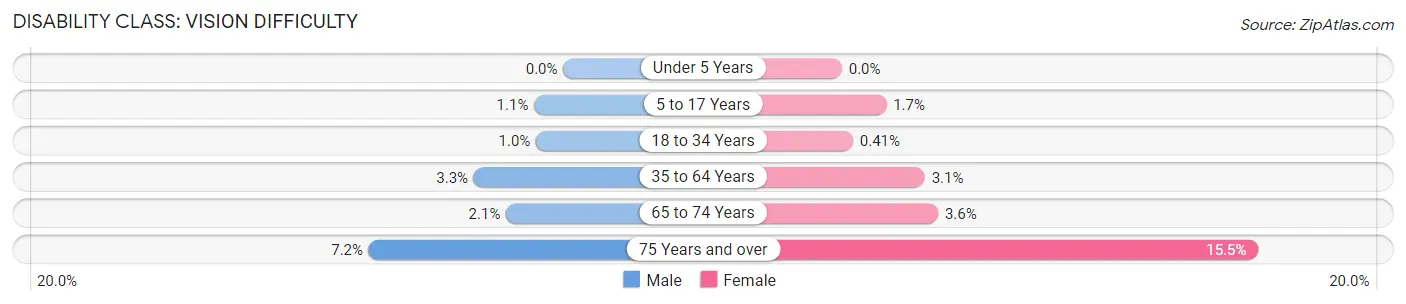
| Age Bracket | Male | Female |
| Under 5 Years | 0 (0.0%) | 0 (0.0%) |
| 5 to 17 Years | 19 (1.1%) | 24 (1.7%) |
| 18 to 34 Years | 22 (1.0%) | 7 (0.4%) |
| 35 to 64 Years | 107 (3.3%) | 94 (3.1%) |
| 65 to 74 Years | 12 (2.1%) | 22 (3.6%) |
| 75 Years and over | 20 (7.2%) | 81 (15.5%) |
Disability Class: Cognitive Difficulty
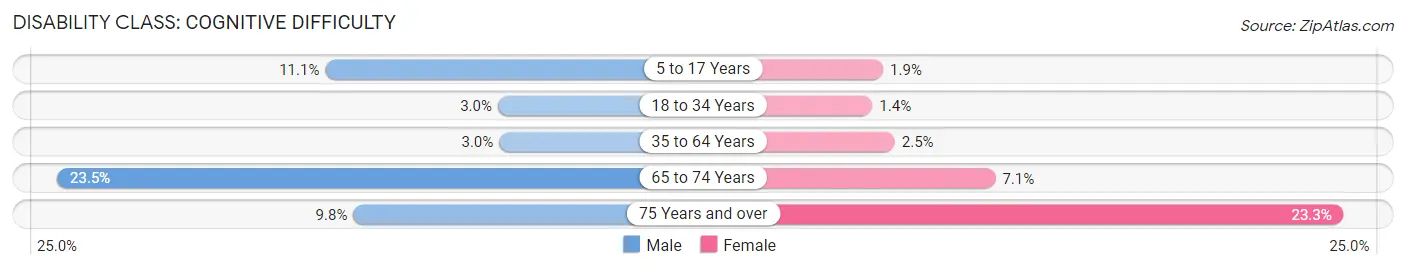
| Age Bracket | Male | Female |
| 5 to 17 Years | 195 (11.1%) | 28 (1.9%) |
| 18 to 34 Years | 66 (3.0%) | 24 (1.4%) |
| 35 to 64 Years | 96 (3.0%) | 75 (2.5%) |
| 65 to 74 Years | 133 (23.5%) | 44 (7.1%) |
| 75 Years and over | 27 (9.8%) | 122 (23.3%) |
Disability Class: Ambulatory Difficulty
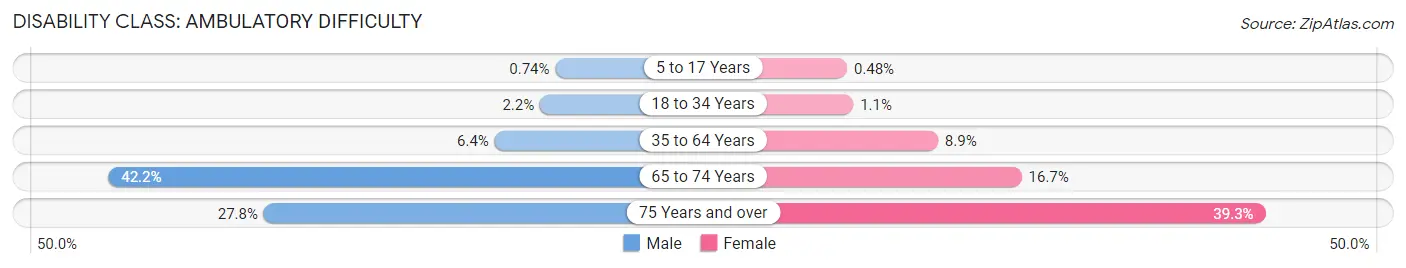
| Age Bracket | Male | Female |
| 5 to 17 Years | 13 (0.7%) | 7 (0.5%) |
| 18 to 34 Years | 47 (2.2%) | 18 (1.1%) |
| 35 to 64 Years | 205 (6.4%) | 272 (8.9%) |
| 65 to 74 Years | 239 (42.2%) | 103 (16.7%) |
| 75 Years and over | 77 (27.8%) | 206 (39.3%) |
Disability Class: Self-Care Difficulty
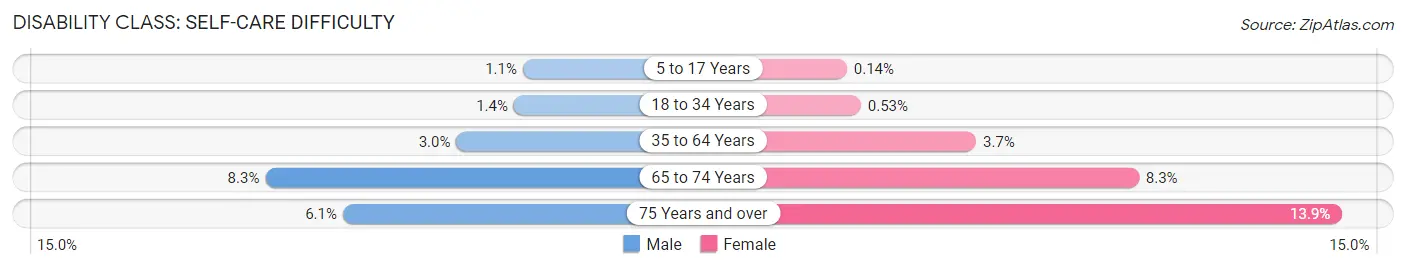
| Age Bracket | Male | Female |
| 5 to 17 Years | 20 (1.1%) | 2 (0.1%) |
| 18 to 34 Years | 30 (1.4%) | 9 (0.5%) |
| 35 to 64 Years | 96 (3.0%) | 114 (3.7%) |
| 65 to 74 Years | 47 (8.3%) | 51 (8.3%) |
| 75 Years and over | 17 (6.1%) | 73 (13.9%) |
Technology Access in Walnut Park
Computing Device Access in Walnut Park
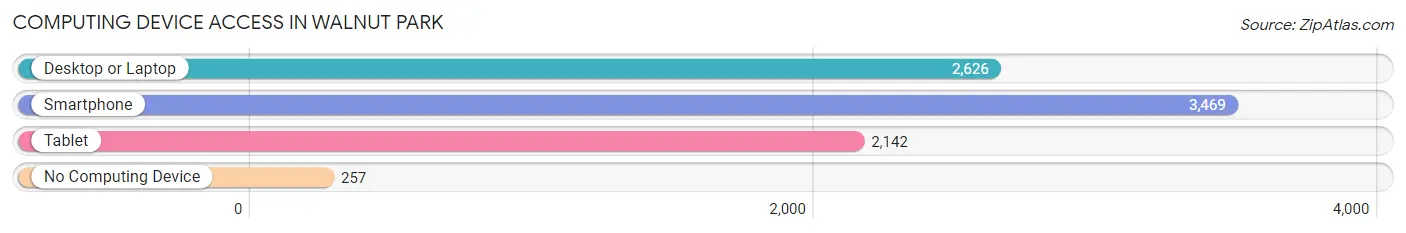
| Device Type | # Households | % Households |
| Desktop or Laptop | 2,626 | 68.7% |
| Smartphone | 3,469 | 90.8% |
| Tablet | 2,142 | 56.1% |
| No Computing Device | 257 | 6.7% |
| Total | 3,821 | 100.0% |
Internet Access in Walnut Park
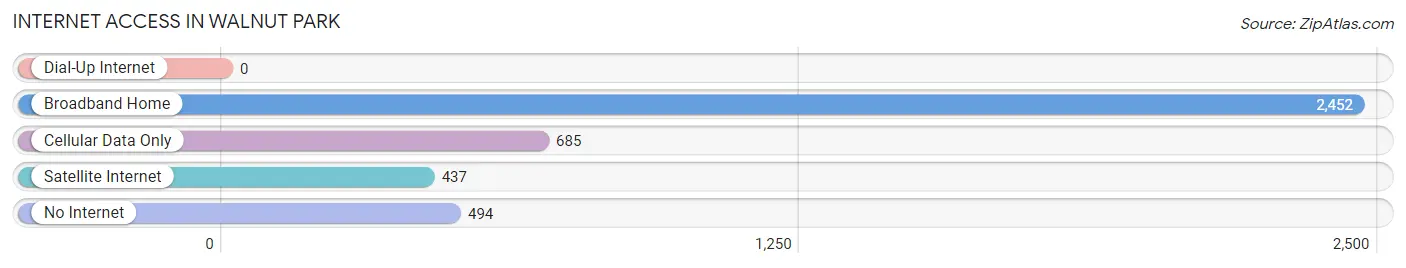
| Internet Type | # Households | % Households |
| Dial-Up Internet | 0 | 0.0% |
| Broadband Home | 2,452 | 64.2% |
| Cellular Data Only | 685 | 17.9% |
| Satellite Internet | 437 | 11.4% |
| No Internet | 494 | 12.9% |
| Total | 3,821 | 100.0% |
Walnut Park Summary
Walnut Park is a census-designated place (CDP) located in Los Angeles County, California. It is located in the southeastern portion of the county, just south of the city of Los Angeles. The population of Walnut Park was 8,845 at the 2010 census.
Geography
Walnut Park is located at 34°1′25″N 118°13′45″W (34.023607, -118.229259). According to the United States Census Bureau, the CDP has a total area of 0.7 square miles (1.8 km2), all of it land.
Demographics
As of the census of 2000, there were 8,845 people, 2,717 households, and 2,093 families residing in the CDP. The population density was 12,845.3 people per square mile (4,945.2/km2). There were 2,817 housing units at an average density of 4,039.2 per square mile (1,556.2/km2). The racial makeup of the CDP was 64.2% White, 1.2% African American, 1.2% Native American, 0.7% Asian, 0.1% Pacific Islander, 29.2% from other races, and 3.5% from two or more races. Hispanic or Latino of any race were 78.2% of the population.
Economy
Walnut Park is a primarily residential area, with no major industries or businesses located within its boundaries. The economy of the area is largely dependent on the surrounding communities, with many residents commuting to nearby cities for work. The median household income in Walnut Park was $30,945 in 2000, compared to the median income of $50,740 for the entire county.
History
Walnut Park was originally part of the Rancho San Antonio, a large Spanish land grant given to Antonio Maria Lugo in 1845. The area was later subdivided and sold off in the late 19th century. The area was known as "Walnut Park" by the early 20th century, and the name was officially adopted in the 1950s.
Walnut Park was largely an agricultural area until the 1950s, when the population began to grow rapidly due to the influx of new residents from other parts of Los Angeles County. The population continued to grow throughout the 1960s and 1970s, and by the 1980s the area had become a predominantly Latino community.
Today, Walnut Park is a diverse community with a mix of Latino, African American, and White residents. The area is home to a variety of businesses, including restaurants, grocery stores, and other retail establishments. The community is served by the Los Angeles Unified School District, and is home to several parks and recreational facilities.
Common Questions
What is Per Capita Income in Walnut Park?
Per Capita income in Walnut Park is $21,571.
What is the Median Family Income in Walnut Park?
Median Family Income in Walnut Park is $67,412.
What is the Median Household income in Walnut Park?
Median Household Income in Walnut Park is $71,683.
What is Income or Wage Gap in Walnut Park?
Income or Wage Gap in Walnut Park is 24.9%.
Women in Walnut Park earn 75.1 cents for every dollar earned by a man.
What is Inequality or Gini Index in Walnut Park?
Inequality or Gini Index in Walnut Park is 0.41.
What is the Total Population of Walnut Park?
Total Population of Walnut Park is 16,209.
What is the Total Male Population of Walnut Park?
Total Male Population of Walnut Park is 8,391.
What is the Total Female Population of Walnut Park?
Total Female Population of Walnut Park is 7,818.
What is the Ratio of Males per 100 Females in Walnut Park?
There are 107.33 Males per 100 Females in Walnut Park.
What is the Ratio of Females per 100 Males in Walnut Park?
There are 93.17 Females per 100 Males in Walnut Park.
What is the Median Population Age in Walnut Park?
Median Population Age in Walnut Park is 35.9 Years.
What is the Average Family Size in Walnut Park
Average Family Size in Walnut Park is 4.3 People.
What is the Average Household Size in Walnut Park
Average Household Size in Walnut Park is 4.2 People.
How Large is the Labor Force in Walnut Park?
There are 8,032 People in the Labor Forcein in Walnut Park.
What is the Percentage of People in the Labor Force in Walnut Park?
63.6% of People are in the Labor Force in Walnut Park.
What is the Unemployment Rate in Walnut Park?
Unemployment Rate in Walnut Park is 9.3%.