Cherryland, CA Map & Demographics
Cherryland Map
Cherryland Overview
$31,130
PER CAPITA INCOME
$84,145
AVG FAMILY INCOME
$80,921
AVG HOUSEHOLD INCOME
2.1%
WAGE / INCOME GAP [ % ]
97.9¢/ $1
WAGE / INCOME GAP [ $ ]
$11,315
FAMILY INCOME DEFICIT
0.40
INEQUALITY / GINI INDEX
15,499
TOTAL POPULATION
7,964
MALE POPULATION
7,535
FEMALE POPULATION
105.69
MALES / 100 FEMALES
94.61
FEMALES / 100 MALES
39.0
MEDIAN AGE
3.8
AVG FAMILY SIZE
3.1
AVG HOUSEHOLD SIZE
7,745
LABOR FORCE [ PEOPLE ]
60.1%
PERCENT IN LABOR FORCE
5.3%
UNEMPLOYMENT RATE
Income in Cherryland
Income Overview in Cherryland
Per Capita Income in Cherryland is $31,130, while median incomes of families and households are $84,145 and $80,921 respectively.
| Characteristic | Number | Measure |
| Per Capita Income | 15,499 | $31,130 |
| Median Family Income | 3,147 | $84,145 |
| Mean Family Income | 3,147 | $101,189 |
| Median Household Income | 4,720 | $80,921 |
| Mean Household Income | 4,720 | $94,614 |
| Income Deficit | 3,147 | $11,315 |
| Wage / Income Gap (%) | 15,499 | 2.13% |
| Wage / Income Gap ($) | 15,499 | 97.87¢ per $1 |
| Gini / Inequality Index | 15,499 | 0.40 |
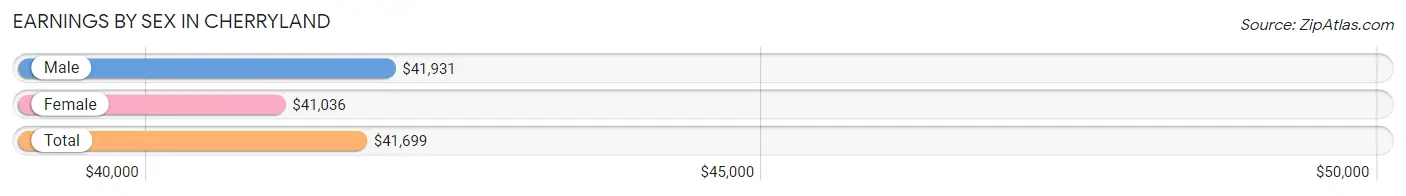
Earnings by Sex in Cherryland
Average Earnings in Cherryland are $41,699, $41,931 for men and $41,036 for women, a difference of 2.1%.
| Sex | Number | Average Earnings |
| Male | 4,457 (57.4%) | $41,931 |
| Female | 3,306 (42.6%) | $41,036 |
| Total | 7,763 (100.0%) | $41,699 |
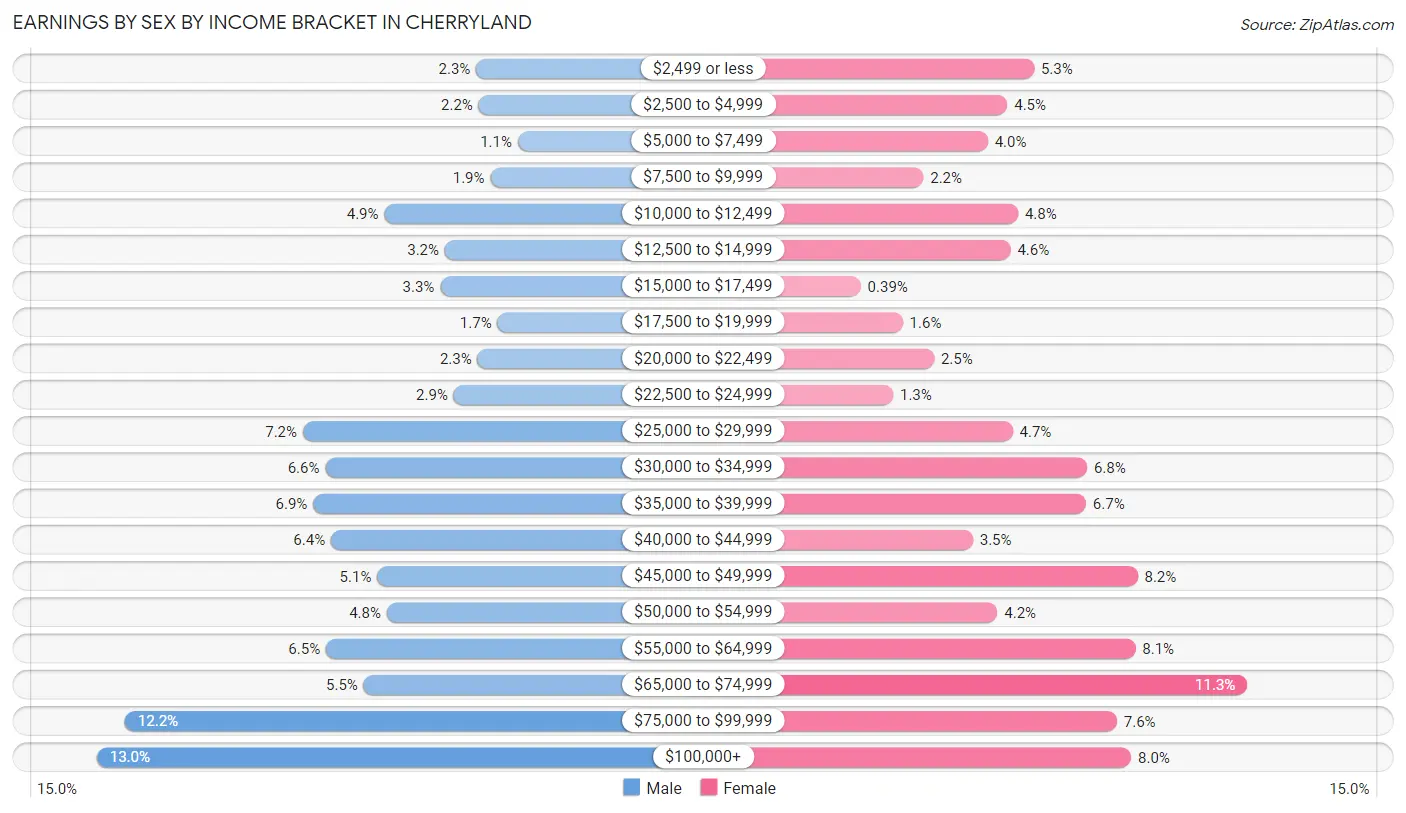
Earnings by Sex by Income Bracket in Cherryland
The most common earnings brackets in Cherryland are $100,000+ for men (578 | 13.0%) and $65,000 to $74,999 for women (372 | 11.3%).
| Income | Male | Female |
| $2,499 or less | 103 (2.3%) | 174 (5.3%) |
| $2,500 to $4,999 | 100 (2.2%) | 149 (4.5%) |
| $5,000 to $7,499 | 51 (1.1%) | 131 (4.0%) |
| $7,500 to $9,999 | 85 (1.9%) | 71 (2.1%) |
| $10,000 to $12,499 | 218 (4.9%) | 159 (4.8%) |
| $12,500 to $14,999 | 142 (3.2%) | 152 (4.6%) |
| $15,000 to $17,499 | 148 (3.3%) | 13 (0.4%) |
| $17,500 to $19,999 | 76 (1.7%) | 52 (1.6%) |
| $20,000 to $22,499 | 101 (2.3%) | 81 (2.5%) |
| $22,500 to $24,999 | 131 (2.9%) | 43 (1.3%) |
| $25,000 to $29,999 | 320 (7.2%) | 154 (4.7%) |
| $30,000 to $34,999 | 292 (6.6%) | 223 (6.8%) |
| $35,000 to $39,999 | 307 (6.9%) | 222 (6.7%) |
| $40,000 to $44,999 | 285 (6.4%) | 117 (3.5%) |
| $45,000 to $49,999 | 227 (5.1%) | 270 (8.2%) |
| $50,000 to $54,999 | 215 (4.8%) | 140 (4.2%) |
| $55,000 to $64,999 | 291 (6.5%) | 268 (8.1%) |
| $65,000 to $74,999 | 244 (5.5%) | 372 (11.3%) |
| $75,000 to $99,999 | 543 (12.2%) | 251 (7.6%) |
| $100,000+ | 578 (13.0%) | 264 (8.0%) |
| Total | 4,457 (100.0%) | 3,306 (100.0%) |
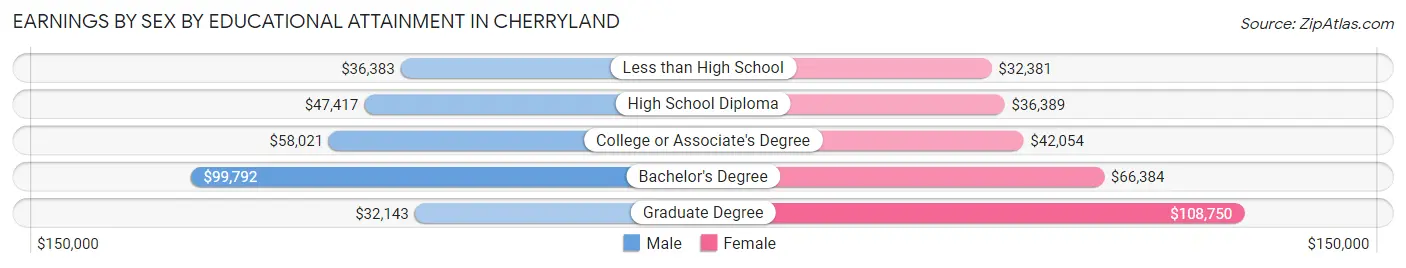
Earnings by Sex by Educational Attainment in Cherryland
Average earnings in Cherryland are $46,045 for men and $46,114 for women, a difference of 0.2%. Men with an educational attainment of bachelor's degree enjoy the highest average annual earnings of $99,792, while those with graduate degree education earn the least with $32,143. Women with an educational attainment of graduate degree earn the most with the average annual earnings of $108,750, while those with less than high school education have the smallest earnings of $32,381.
| Educational Attainment | Male Income | Female Income |
| Less than High School | $36,383 | $32,381 |
| High School Diploma | $47,417 | $36,389 |
| College or Associate's Degree | $58,021 | $42,054 |
| Bachelor's Degree | $99,792 | $66,384 |
| Graduate Degree | $32,143 | $108,750 |
| Total | $46,045 | $46,114 |
Family Income in Cherryland
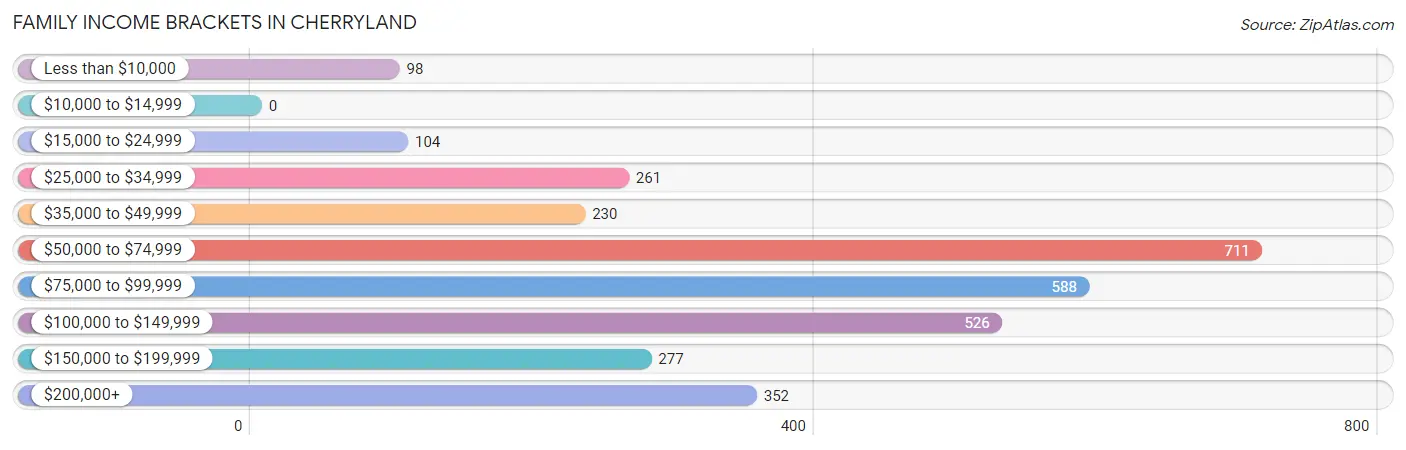
Family Income Brackets in Cherryland
According to the Cherryland family income data, there are 711 families falling into the $50,000 to $74,999 income range, which is the most common income bracket and makes up 22.6% of all families.
| Income Bracket | # Families | % Families |
| Less than $10,000 | 98 | 3.1% |
| $10,000 to $14,999 | 0 | 0.0% |
| $15,000 to $24,999 | 104 | 3.3% |
| $25,000 to $34,999 | 261 | 8.3% |
| $35,000 to $49,999 | 230 | 7.3% |
| $50,000 to $74,999 | 711 | 22.6% |
| $75,000 to $99,999 | 588 | 18.7% |
| $100,000 to $149,999 | 526 | 16.7% |
| $150,000 to $199,999 | 277 | 8.8% |
| $200,000+ | 352 | 11.2% |
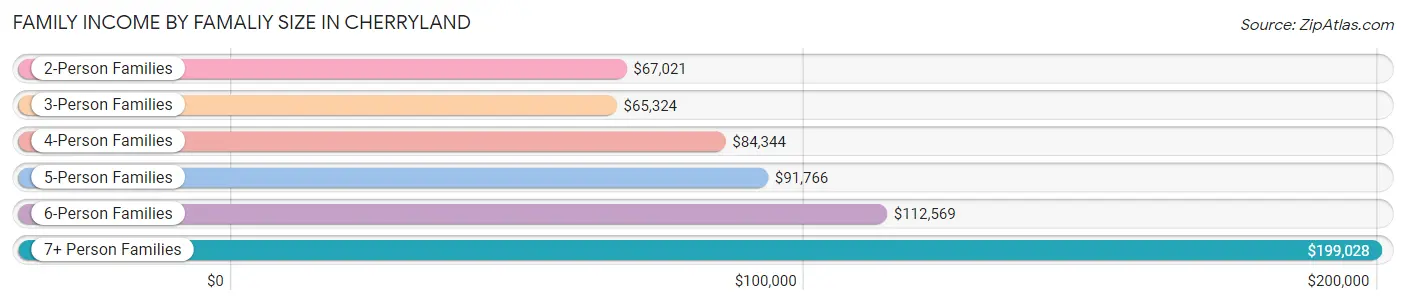
Family Income by Famaliy Size in Cherryland
7+ person families (159 | 5.1%) account for the highest median family income in Cherryland with $199,028 per family, while 2-person families (1,235 | 39.2%) have the highest median income of $33,510 per family member.
| Income Bracket | # Families | Median Income |
| 2-Person Families | 1,235 (39.2%) | $67,021 |
| 3-Person Families | 511 (16.2%) | $65,324 |
| 4-Person Families | 606 (19.3%) | $84,344 |
| 5-Person Families | 249 (7.9%) | $91,766 |
| 6-Person Families | 387 (12.3%) | $112,569 |
| 7+ Person Families | 159 (5.1%) | $199,028 |
| Total | 3,147 (100.0%) | $84,145 |
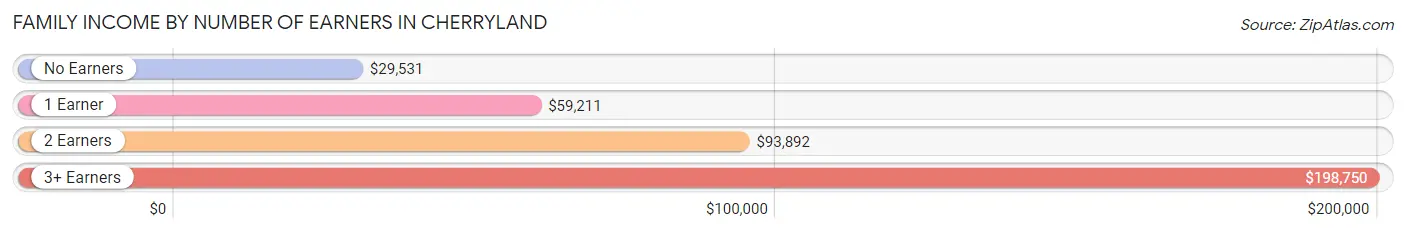
Family Income by Number of Earners in Cherryland
The median family income in Cherryland is $84,145, with families comprising 3+ earners (595) having the highest median family income of $198,750, while families with no earners (237) have the lowest median family income of $29,531, accounting for 18.9% and 7.5% of families, respectively.
| Number of Earners | # Families | Median Income |
| No Earners | 237 (7.5%) | $29,531 |
| 1 Earner | 1,198 (38.1%) | $59,211 |
| 2 Earners | 1,117 (35.5%) | $93,892 |
| 3+ Earners | 595 (18.9%) | $198,750 |
| Total | 3,147 (100.0%) | $84,145 |
Household Income in Cherryland
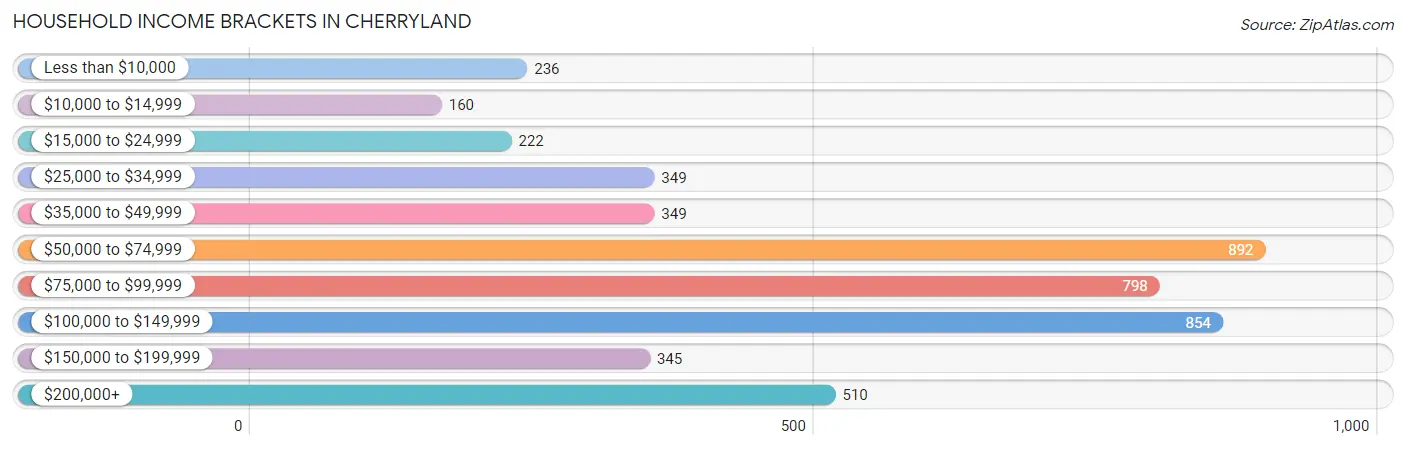
Household Income Brackets in Cherryland
With 892 households falling in the category, the $50,000 to $74,999 income range is the most frequent in Cherryland, accounting for 18.9% of all households. In contrast, only 160 households (3.4%) fall into the $10,000 to $14,999 income bracket, making it the least populous group.
| Income Bracket | # Households | % Households |
| Less than $10,000 | 236 | 5.0% |
| $10,000 to $14,999 | 160 | 3.4% |
| $15,000 to $24,999 | 222 | 4.7% |
| $25,000 to $34,999 | 349 | 7.4% |
| $35,000 to $49,999 | 349 | 7.4% |
| $50,000 to $74,999 | 892 | 18.9% |
| $75,000 to $99,999 | 798 | 16.9% |
| $100,000 to $149,999 | 854 | 18.1% |
| $150,000 to $199,999 | 345 | 7.3% |
| $200,000+ | 510 | 10.8% |
Household Income by Householder Age in Cherryland
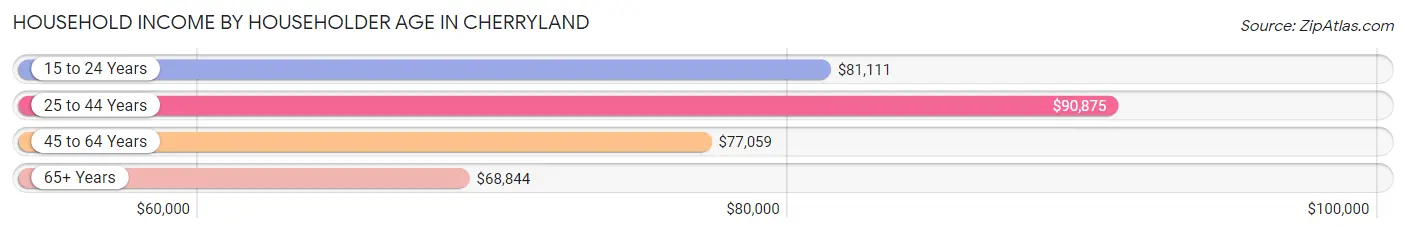
The median household income in Cherryland is $80,921, with the highest median household income of $90,875 found in the 25 to 44 years age bracket for the primary householder. A total of 1,491 households (31.6%) fall into this category. Meanwhile, the 65+ years age bracket for the primary householder has the lowest median household income of $68,844, with 1,075 households (22.8%) in this group.
| Income Bracket | # Households | Median Income |
| 15 to 24 Years | 74 (1.6%) | $81,111 |
| 25 to 44 Years | 1,491 (31.6%) | $90,875 |
| 45 to 64 Years | 2,080 (44.1%) | $77,059 |
| 65+ Years | 1,075 (22.8%) | $68,844 |
| Total | 4,720 (100.0%) | $80,921 |
Poverty in Cherryland
Income Below Poverty by Sex and Age in Cherryland
With 11.9% poverty level for males and 11.5% for females among the residents of Cherryland, under 5 year old males and 16 and 17 year old females are the most vulnerable to poverty, with 73 males (17.6%) and 65 females (29.1%) in their respective age groups living below the poverty level.
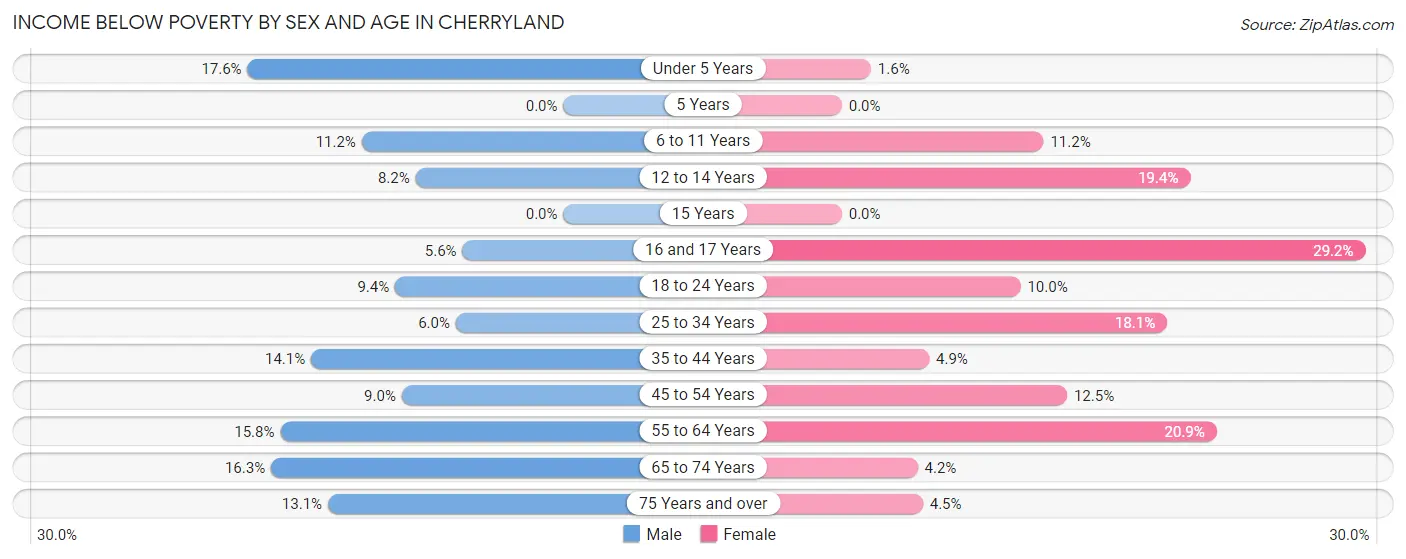
| Age Bracket | Male | Female |
| Under 5 Years | 73 (17.6%) | 4 (1.6%) |
| 5 Years | 0 (0.0%) | 0 (0.0%) |
| 6 to 11 Years | 54 (11.2%) | 65 (11.2%) |
| 12 to 14 Years | 26 (8.2%) | 39 (19.4%) |
| 15 Years | 0 (0.0%) | 0 (0.0%) |
| 16 and 17 Years | 14 (5.6%) | 65 (29.1%) |
| 18 to 24 Years | 58 (9.4%) | 80 (10.0%) |
| 25 to 34 Years | 54 (6.0%) | 188 (18.1%) |
| 35 to 44 Years | 245 (14.1%) | 52 (4.9%) |
| 45 to 54 Years | 83 (9.0%) | 128 (12.5%) |
| 55 to 64 Years | 199 (15.8%) | 178 (20.9%) |
| 65 to 74 Years | 78 (16.3%) | 25 (4.2%) |
| 75 Years and over | 48 (13.1%) | 23 (4.5%) |
| Total | 932 (11.9%) | 847 (11.5%) |
Income Above Poverty by Sex and Age in Cherryland
According to the poverty statistics in Cherryland, males aged 5 years and females aged 5 years are the age groups that are most secure financially, with 100.0% of males and 100.0% of females in these age groups living above the poverty line.
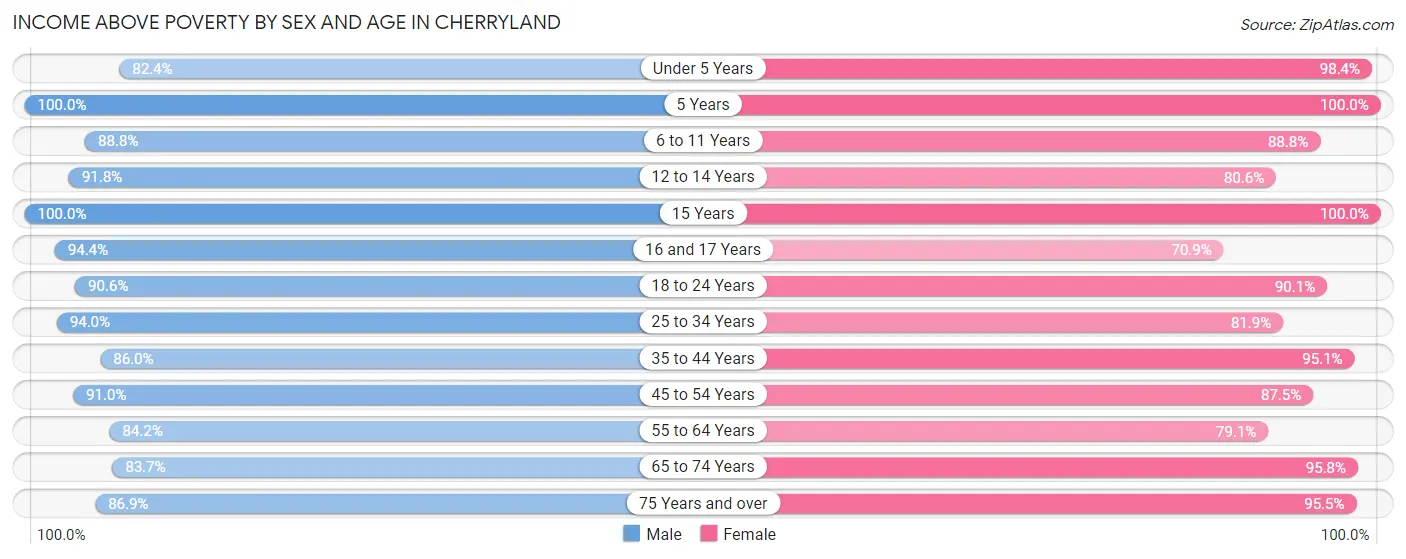
| Age Bracket | Male | Female |
| Under 5 Years | 342 (82.4%) | 243 (98.4%) |
| 5 Years | 52 (100.0%) | 87 (100.0%) |
| 6 to 11 Years | 427 (88.8%) | 514 (88.8%) |
| 12 to 14 Years | 290 (91.8%) | 162 (80.6%) |
| 15 Years | 41 (100.0%) | 126 (100.0%) |
| 16 and 17 Years | 235 (94.4%) | 158 (70.9%) |
| 18 to 24 Years | 561 (90.6%) | 724 (90.0%) |
| 25 to 34 Years | 847 (94.0%) | 850 (81.9%) |
| 35 to 44 Years | 1,499 (86.0%) | 1,018 (95.1%) |
| 45 to 54 Years | 839 (91.0%) | 893 (87.5%) |
| 55 to 64 Years | 1,064 (84.2%) | 675 (79.1%) |
| 65 to 74 Years | 401 (83.7%) | 567 (95.8%) |
| 75 Years and over | 318 (86.9%) | 487 (95.5%) |
| Total | 6,916 (88.1%) | 6,504 (88.5%) |
Income Below Poverty Among Married-Couple Families in Cherryland
The poverty statistics for married-couple families in Cherryland show that 5.3% or 101 of the total 1,912 families live below the poverty line. Families with 3 or 4 children have the highest poverty rate of 10.7%, comprising of 35 families. On the other hand, families with 5 or more children have the lowest poverty rate of 0.0%, which includes 0 families.
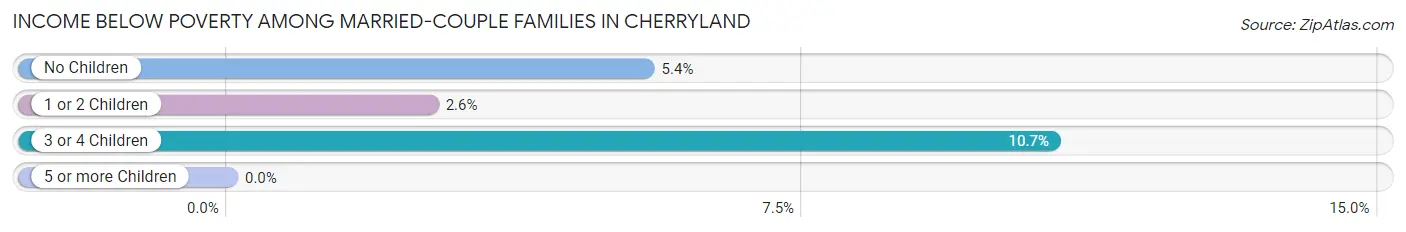
| Children | Above Poverty | Below Poverty |
| No Children | 835 (94.6%) | 48 (5.4%) |
| 1 or 2 Children | 670 (97.4%) | 18 (2.6%) |
| 3 or 4 Children | 291 (89.3%) | 35 (10.7%) |
| 5 or more Children | 15 (100.0%) | 0 (0.0%) |
| Total | 1,811 (94.7%) | 101 (5.3%) |
Income Below Poverty Among Single-Parent Households in Cherryland
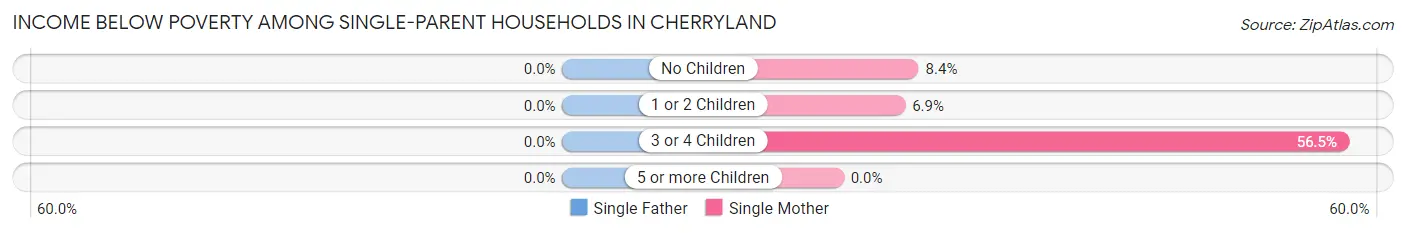
| Children | Single Father | Single Mother |
| No Children | 0 (0.0%) | 33 (8.4%) |
| 1 or 2 Children | 0 (0.0%) | 22 (6.9%) |
| 3 or 4 Children | 0 (0.0%) | 35 (56.5%) |
| 5 or more Children | 0 (0.0%) | 0 (0.0%) |
| Total | 0 (0.0%) | 90 (11.6%) |
Income Below Poverty Among Married-Couple vs Single-Parent Households in Cherryland
The poverty data for Cherryland shows that 101 of the married-couple family households (5.3%) and 90 of the single-parent households (7.3%) are living below the poverty level. Within the married-couple family households, those with 3 or 4 children have the highest poverty rate, with 35 households (10.7%) falling below the poverty line. Among the single-parent households, those with 3 or 4 children have the highest poverty rate, with 35 household (56.5%) living below poverty.
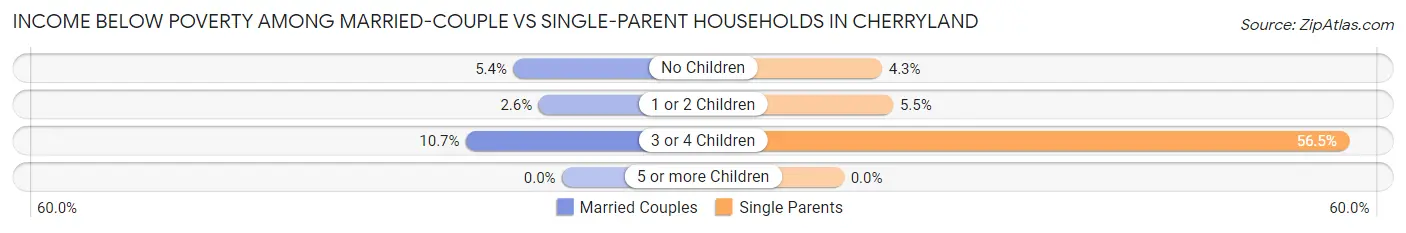
| Children | Married-Couple Families | Single-Parent Households |
| No Children | 48 (5.4%) | 33 (4.3%) |
| 1 or 2 Children | 18 (2.6%) | 22 (5.5%) |
| 3 or 4 Children | 35 (10.7%) | 35 (56.5%) |
| 5 or more Children | 0 (0.0%) | 0 (0.0%) |
| Total | 101 (5.3%) | 90 (7.3%) |
Race in Cherryland
The most populous races in Cherryland are Hispanic or Latino (8,399 | 54.2%), Some other Race (4,658 | 30.0%), and White / Caucasian (4,366 | 28.2%).
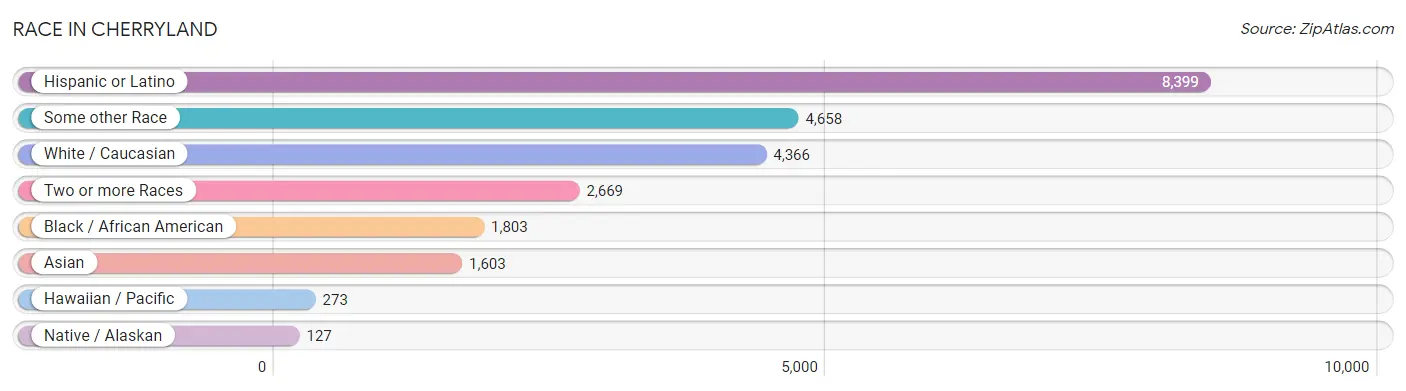
| Race | # Population | % Population |
| Asian | 1,603 | 10.3% |
| Black / African American | 1,803 | 11.6% |
| Hawaiian / Pacific | 273 | 1.8% |
| Hispanic or Latino | 8,399 | 54.2% |
| Native / Alaskan | 127 | 0.8% |
| White / Caucasian | 4,366 | 28.2% |
| Two or more Races | 2,669 | 17.2% |
| Some other Race | 4,658 | 30.0% |
| Total | 15,499 | 100.0% |
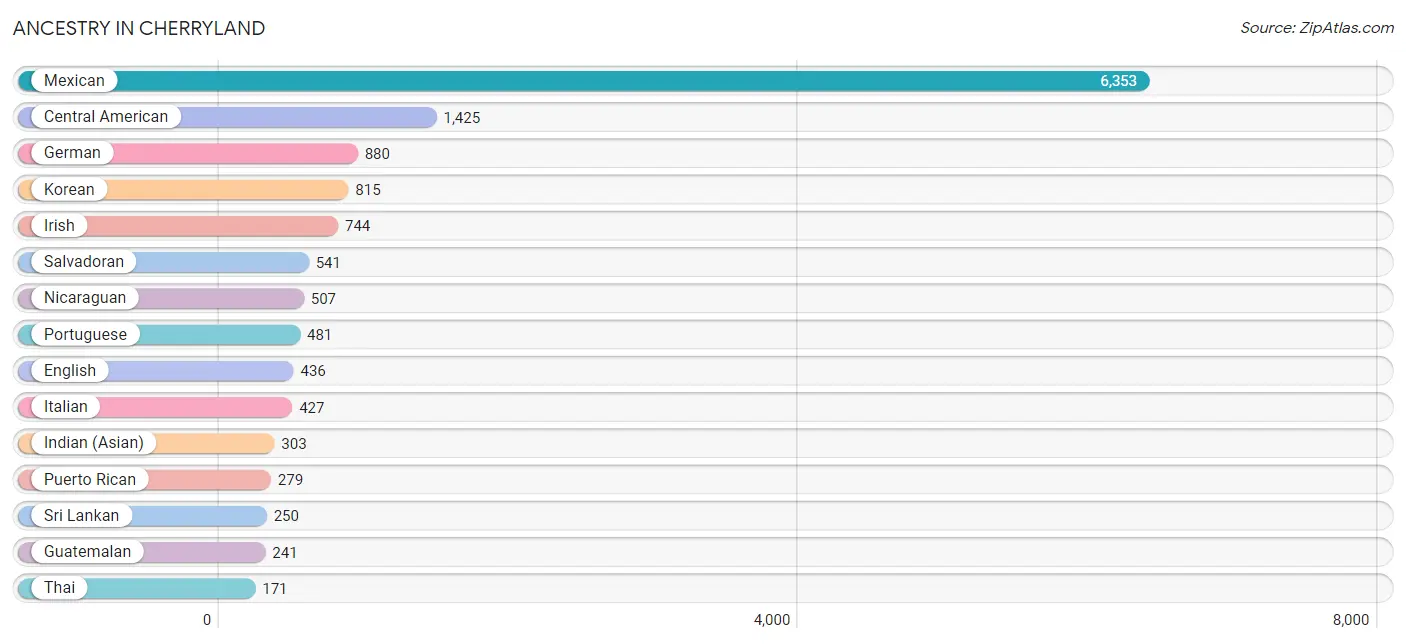
Ancestry in Cherryland
The most populous ancestries reported in Cherryland are Mexican (6,353 | 41.0%), Central American (1,425 | 9.2%), German (880 | 5.7%), Korean (815 | 5.3%), and Irish (744 | 4.8%), together accounting for 65.9% of all Cherryland residents.
| Ancestry | # Population | % Population |
| Afghan | 32 | 0.2% |
| African | 41 | 0.3% |
| American | 69 | 0.4% |
| Arab | 31 | 0.2% |
| Argentinean | 62 | 0.4% |
| Austrian | 10 | 0.1% |
| Bangladeshi | 41 | 0.3% |
| Bhutanese | 84 | 0.5% |
| Brazilian | 63 | 0.4% |
| British | 163 | 1.1% |
| Burmese | 53 | 0.3% |
| Central American | 1,425 | 9.2% |
| Central American Indian | 56 | 0.4% |
| Cuban | 20 | 0.1% |
| Czech | 7 | 0.1% |
| Danish | 9 | 0.1% |
| Dutch | 7 | 0.1% |
| Eastern European | 11 | 0.1% |
| English | 436 | 2.8% |
| European | 32 | 0.2% |
| Filipino | 39 | 0.3% |
| French | 126 | 0.8% |
| French Canadian | 8 | 0.1% |
| German | 880 | 5.7% |
| Guamanian / Chamorro | 27 | 0.2% |
| Guatemalan | 241 | 1.5% |
| Honduran | 136 | 0.9% |
| Indian (Asian) | 303 | 1.9% |
| Iranian | 10 | 0.1% |
| Irish | 744 | 4.8% |
| Italian | 427 | 2.8% |
| Jamaican | 43 | 0.3% |
| Japanese | 16 | 0.1% |
| Korean | 815 | 5.3% |
| Mexican | 6,353 | 41.0% |
| Mexican American Indian | 49 | 0.3% |
| Native Hawaiian | 86 | 0.5% |
| Nicaraguan | 507 | 3.3% |
| Northern European | 24 | 0.2% |
| Norwegian | 64 | 0.4% |
| Peruvian | 35 | 0.2% |
| Polish | 20 | 0.1% |
| Portuguese | 481 | 3.1% |
| Puerto Rican | 279 | 1.8% |
| Russian | 18 | 0.1% |
| Salvadoran | 541 | 3.5% |
| Samoan | 94 | 0.6% |
| Scandinavian | 19 | 0.1% |
| Scotch-Irish | 18 | 0.1% |
| Scottish | 44 | 0.3% |
| South American | 103 | 0.7% |
| Spaniard | 148 | 0.9% |
| Spanish | 35 | 0.2% |
| Sri Lankan | 250 | 1.6% |
| Subsaharan African | 41 | 0.3% |
| Swedish | 97 | 0.6% |
| Thai | 171 | 1.1% |
| Tongan | 26 | 0.2% |
| Venezuelan | 6 | 0.0% |
| Welsh | 23 | 0.2% |
| Yugoslavian | 44 | 0.3% | View All 61 Rows |
Immigrants in Cherryland
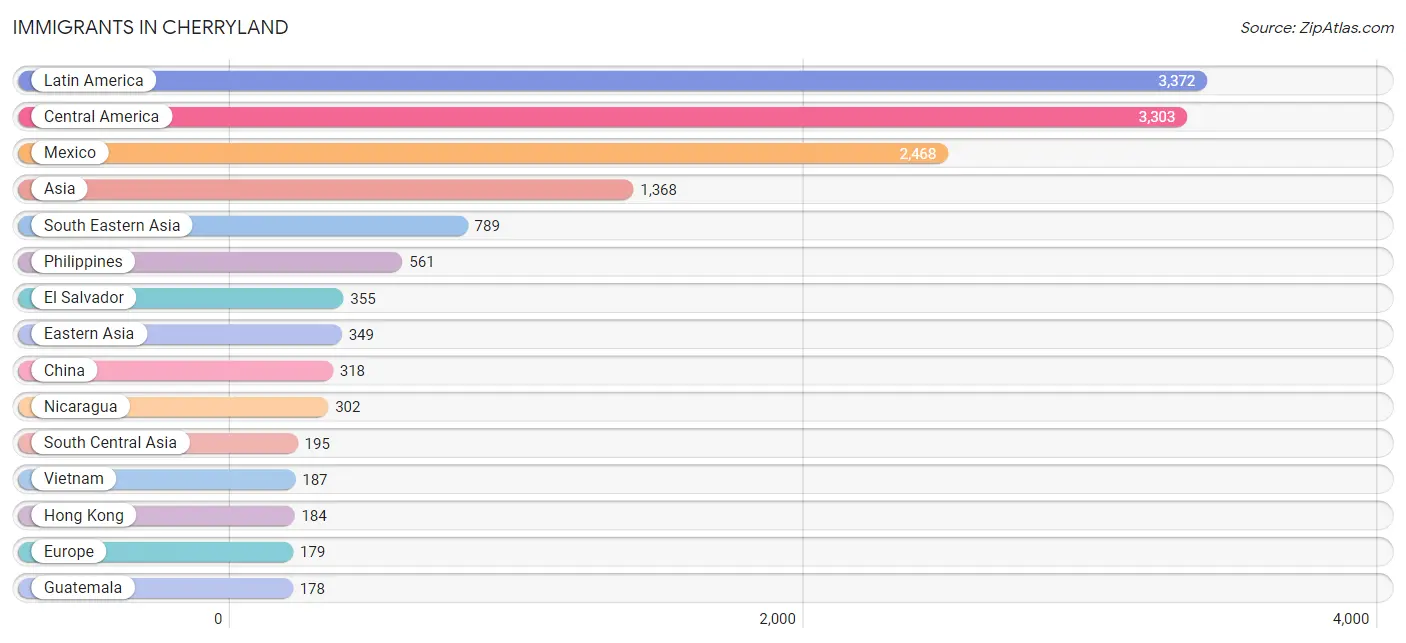
The most numerous immigrant groups reported in Cherryland came from Latin America (3,372 | 21.8%), Central America (3,303 | 21.3%), Mexico (2,468 | 15.9%), Asia (1,368 | 8.8%), and South Eastern Asia (789 | 5.1%), together accounting for 72.9% of all Cherryland residents.
| Immigration Origin | # Population | % Population |
| Afghanistan | 32 | 0.2% |
| Africa | 85 | 0.5% |
| Asia | 1,368 | 8.8% |
| Azores | 45 | 0.3% |
| Caribbean | 28 | 0.2% |
| Central America | 3,303 | 21.3% |
| China | 318 | 2.1% |
| Cuba | 10 | 0.1% |
| Eastern Africa | 70 | 0.4% |
| Eastern Asia | 349 | 2.2% |
| Eastern Europe | 23 | 0.2% |
| El Salvador | 355 | 2.3% |
| Ethiopia | 70 | 0.4% |
| Europe | 179 | 1.1% |
| Fiji | 100 | 0.6% |
| Germany | 52 | 0.3% |
| Guatemala | 178 | 1.1% |
| Hong Kong | 184 | 1.2% |
| India | 163 | 1.1% |
| Jamaica | 18 | 0.1% |
| Korea | 31 | 0.2% |
| Laos | 41 | 0.3% |
| Latin America | 3,372 | 21.8% |
| Latvia | 12 | 0.1% |
| Lebanon | 35 | 0.2% |
| Mexico | 2,468 | 15.9% |
| Nicaragua | 302 | 1.9% |
| Northern Europe | 18 | 0.1% |
| Oceania | 130 | 0.8% |
| Peru | 35 | 0.2% |
| Philippines | 561 | 3.6% |
| Portugal | 86 | 0.5% |
| Russia | 11 | 0.1% |
| South America | 41 | 0.3% |
| South Central Asia | 195 | 1.3% |
| South Eastern Asia | 789 | 5.1% |
| Southern Europe | 86 | 0.5% |
| Taiwan | 39 | 0.3% |
| Venezuela | 6 | 0.0% |
| Vietnam | 187 | 1.2% |
| Western Africa | 15 | 0.1% |
| Western Asia | 35 | 0.2% |
| Western Europe | 52 | 0.3% | View All 43 Rows |
Sex and Age in Cherryland
Sex and Age in Cherryland
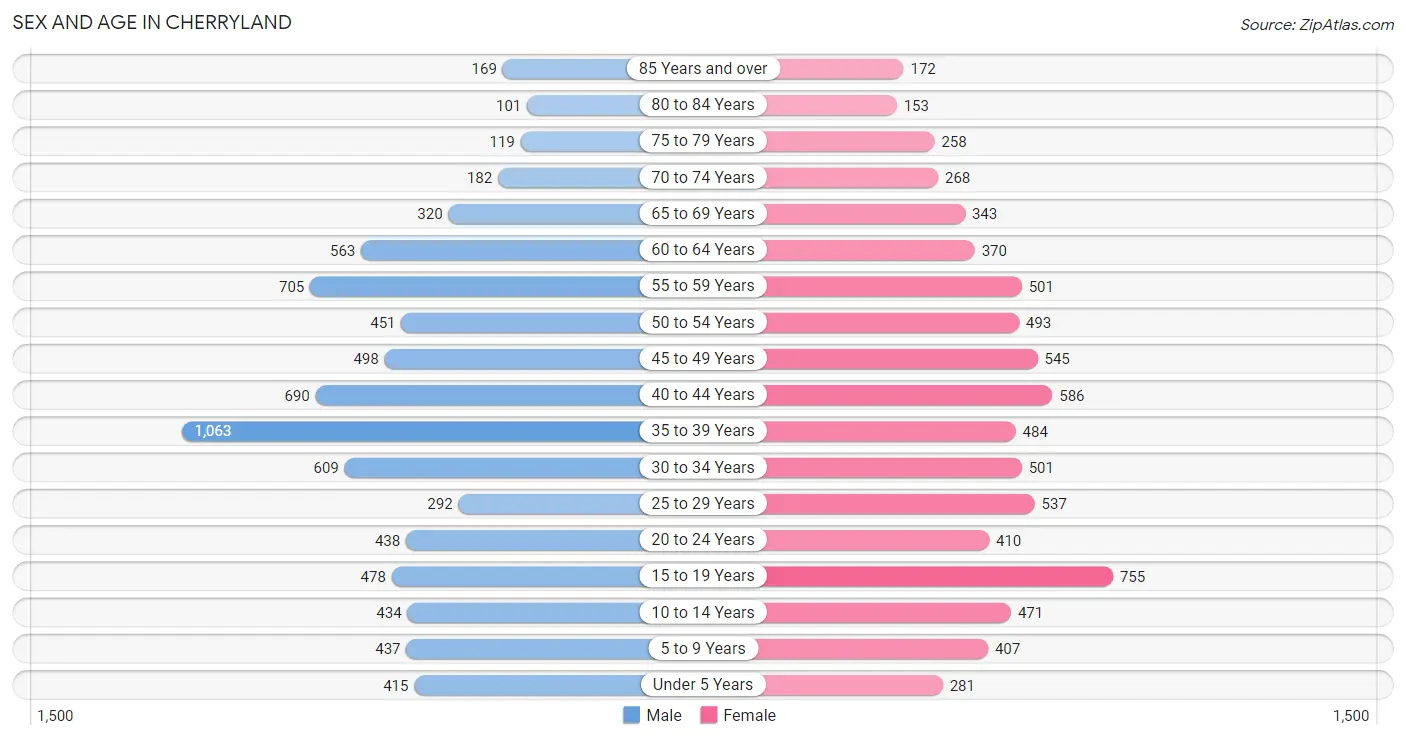
The most populous age groups in Cherryland are 35 to 39 Years (1,063 | 13.4%) for men and 15 to 19 Years (755 | 10.0%) for women.
| Age Bracket | Male | Female |
| Under 5 Years | 415 (5.2%) | 281 (3.7%) |
| 5 to 9 Years | 437 (5.5%) | 407 (5.4%) |
| 10 to 14 Years | 434 (5.4%) | 471 (6.2%) |
| 15 to 19 Years | 478 (6.0%) | 755 (10.0%) |
| 20 to 24 Years | 438 (5.5%) | 410 (5.4%) |
| 25 to 29 Years | 292 (3.7%) | 537 (7.1%) |
| 30 to 34 Years | 609 (7.6%) | 501 (6.7%) |
| 35 to 39 Years | 1,063 (13.4%) | 484 (6.4%) |
| 40 to 44 Years | 690 (8.7%) | 586 (7.8%) |
| 45 to 49 Years | 498 (6.2%) | 545 (7.2%) |
| 50 to 54 Years | 451 (5.7%) | 493 (6.5%) |
| 55 to 59 Years | 705 (8.8%) | 501 (6.7%) |
| 60 to 64 Years | 563 (7.1%) | 370 (4.9%) |
| 65 to 69 Years | 320 (4.0%) | 343 (4.5%) |
| 70 to 74 Years | 182 (2.3%) | 268 (3.6%) |
| 75 to 79 Years | 119 (1.5%) | 258 (3.4%) |
| 80 to 84 Years | 101 (1.3%) | 153 (2.0%) |
| 85 Years and over | 169 (2.1%) | 172 (2.3%) |
| Total | 7,964 (100.0%) | 7,535 (100.0%) |
Families and Households in Cherryland
Median Family Size in Cherryland
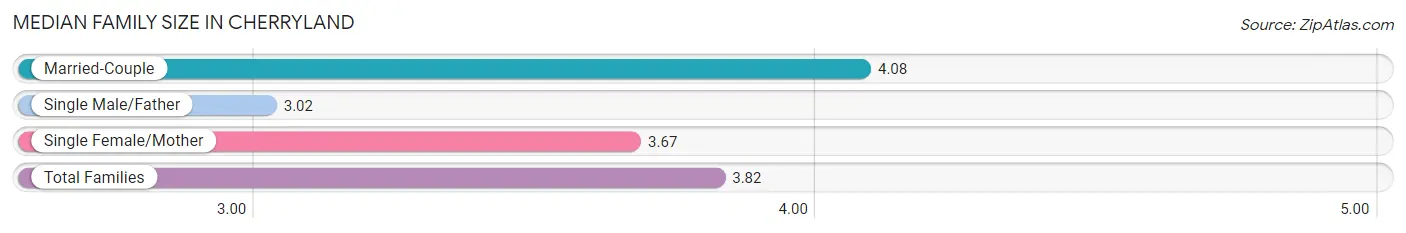
The median family size in Cherryland is 3.82 persons per family, with married-couple families (1,912 | 60.8%) accounting for the largest median family size of 4.08 persons per family. On the other hand, single male/father families (459 | 14.6%) represent the smallest median family size with 3.02 persons per family.
| Family Type | # Families | Family Size |
| Married-Couple | 1,912 (60.8%) | 4.08 |
| Single Male/Father | 459 (14.6%) | 3.02 |
| Single Female/Mother | 776 (24.7%) | 3.67 |
| Total Families | 3,147 (100.0%) | 3.82 |
Median Household Size in Cherryland
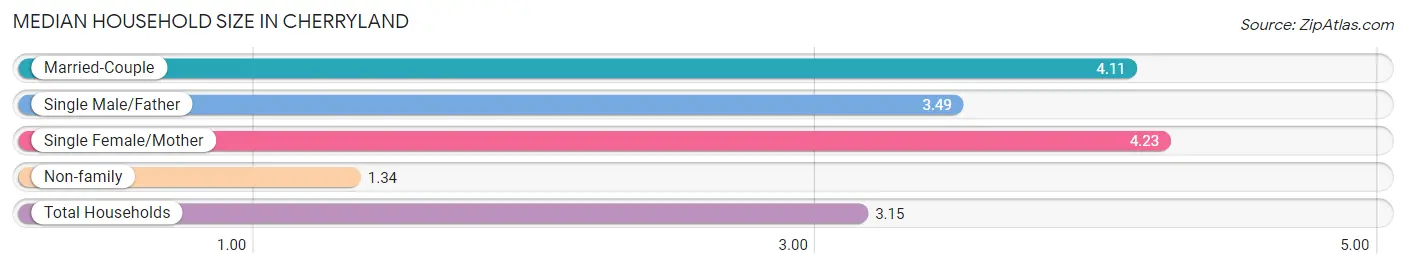
The median household size in Cherryland is 3.15 persons per household, with single female/mother households (776 | 16.4%) accounting for the largest median household size of 4.23 persons per household. non-family households (1,573 | 33.3%) represent the smallest median household size with 1.34 persons per household.
| Household Type | # Households | Household Size |
| Married-Couple | 1,912 (40.5%) | 4.11 |
| Single Male/Father | 459 (9.7%) | 3.49 |
| Single Female/Mother | 776 (16.4%) | 4.23 |
| Non-family | 1,573 (33.3%) | 1.34 |
| Total Households | 4,720 (100.0%) | 3.15 |
Household Size by Marriage Status in Cherryland
Out of a total of 4,720 households in Cherryland, 3,147 (66.7%) are family households, while 1,573 (33.3%) are nonfamily households. The most numerous type of family households are 2-person households, comprising 975, and the most common type of nonfamily households are 1-person households, comprising 1,171.
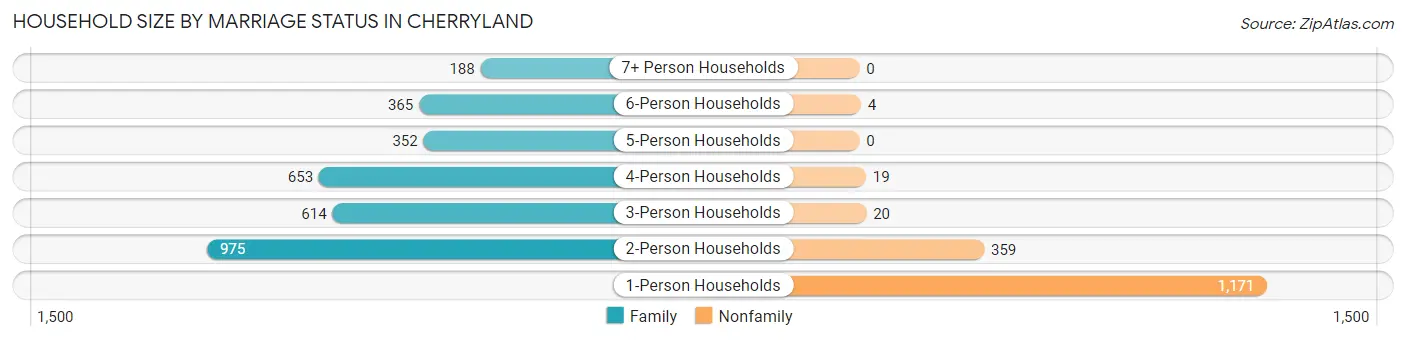
| Household Size | Family Households | Nonfamily Households |
| 1-Person Households | - | 1,171 (24.8%) |
| 2-Person Households | 975 (20.7%) | 359 (7.6%) |
| 3-Person Households | 614 (13.0%) | 20 (0.4%) |
| 4-Person Households | 653 (13.8%) | 19 (0.4%) |
| 5-Person Households | 352 (7.5%) | 0 (0.0%) |
| 6-Person Households | 365 (7.7%) | 4 (0.1%) |
| 7+ Person Households | 188 (4.0%) | 0 (0.0%) |
| Total | 3,147 (66.7%) | 1,573 (33.3%) |
Female Fertility in Cherryland
Fertility by Age in Cherryland
Average fertility rate in Cherryland is 44.0 births per 1,000 women. Women in the age bracket of 35 to 50 years have the highest fertility rate with 68.0 births per 1,000 women. Women in the age bracket of 35 to 50 years acount for 67.2% of all women with births.
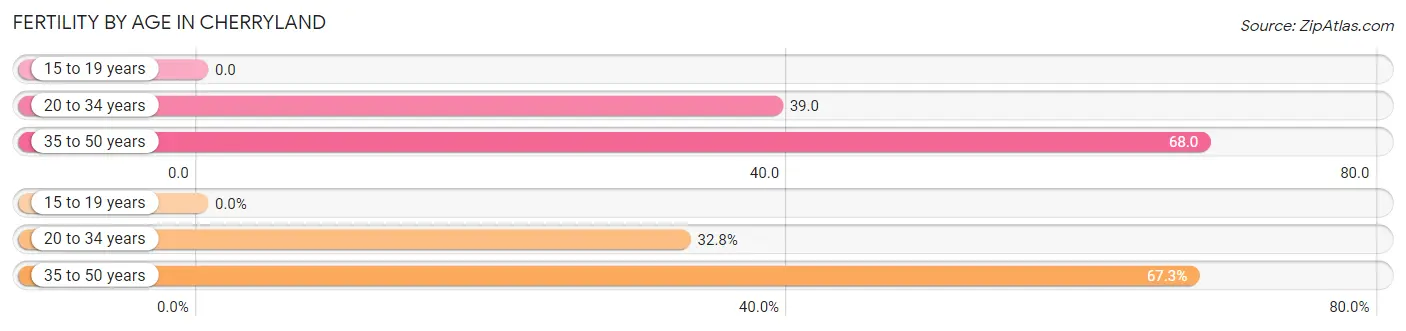
| Age Bracket | Women with Births | Births / 1,000 Women |
| 15 to 19 years | 0 (0.0%) | 0.0 |
| 20 to 34 years | 56 (32.8%) | 39.0 |
| 35 to 50 years | 115 (67.2%) | 68.0 |
| Total | 171 (100.0%) | 44.0 |
Fertility by Age by Marriage Status in Cherryland
70.2% of women with births (171) in Cherryland are married. The highest percentage of unmarried women with births falls into 35 to 50 years age bracket with 30.4% of them unmarried at the time of birth, while the lowest percentage of unmarried women with births belong to 20 to 34 years age bracket with 28.6% of them unmarried.
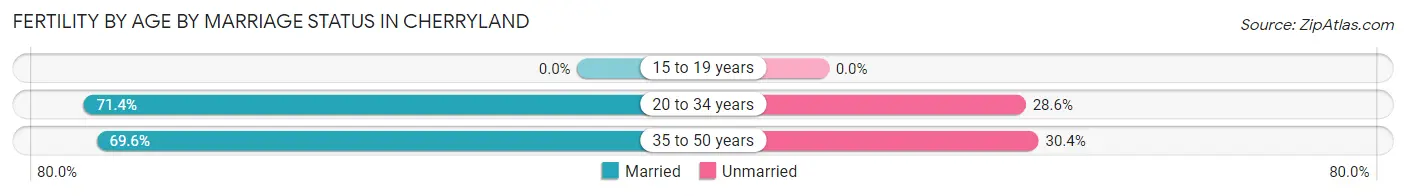
| Age Bracket | Married | Unmarried |
| 15 to 19 years | 0 (0.0%) | 0 (0.0%) |
| 20 to 34 years | 40 (71.4%) | 16 (28.6%) |
| 35 to 50 years | 80 (69.6%) | 35 (30.4%) |
| Total | 120 (70.2%) | 51 (29.8%) |
Fertility by Education in Cherryland
Average fertility rate in Cherryland is 44.0 births per 1,000 women. Women with the education attainment of less than high school have the highest fertility rate of 78.0 births per 1,000 women, while women with the education attainment of college or associate's degree have the lowest fertility at 11.0 births per 1,000 women. Women with the education attainment of less than high school represent 57.3% of all women with births.
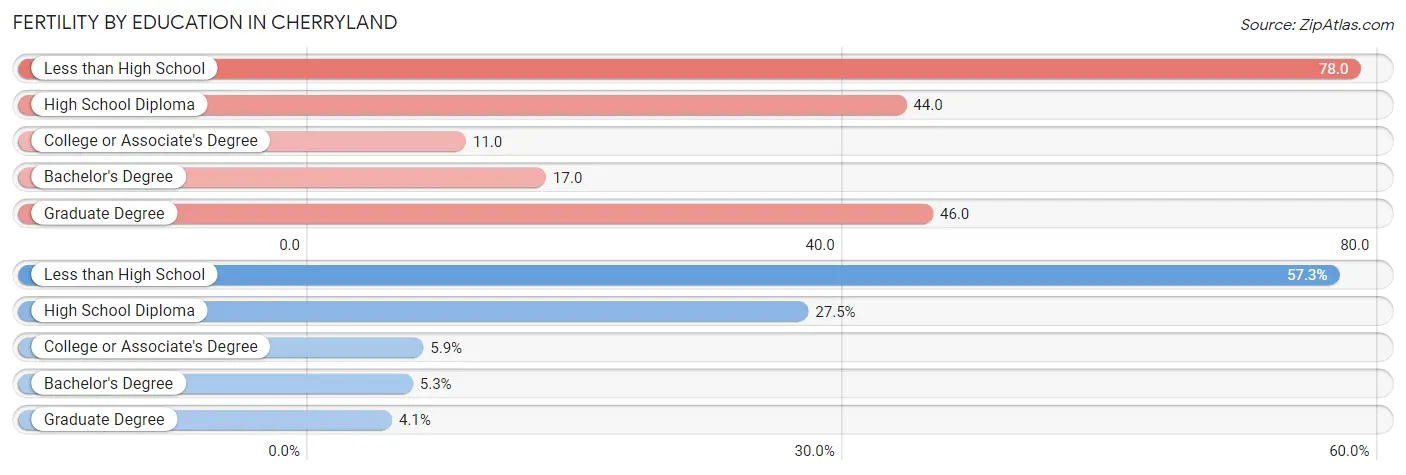
| Educational Attainment | Women with Births | Births / 1,000 Women |
| Less than High School | 98 (57.3%) | 78.0 |
| High School Diploma | 47 (27.5%) | 44.0 |
| College or Associate's Degree | 10 (5.9%) | 11.0 |
| Bachelor's Degree | 9 (5.3%) | 17.0 |
| Graduate Degree | 7 (4.1%) | 46.0 |
| Total | 171 (100.0%) | 44.0 |
Fertility by Education by Marriage Status in Cherryland
29.8% of women with births in Cherryland are unmarried. Women with the educational attainment of bachelor's degree are most likely to be married with 100.0% of them married at childbirth, while women with the educational attainment of college or associate's degree are least likely to be married with 100.0% of them unmarried at childbirth.
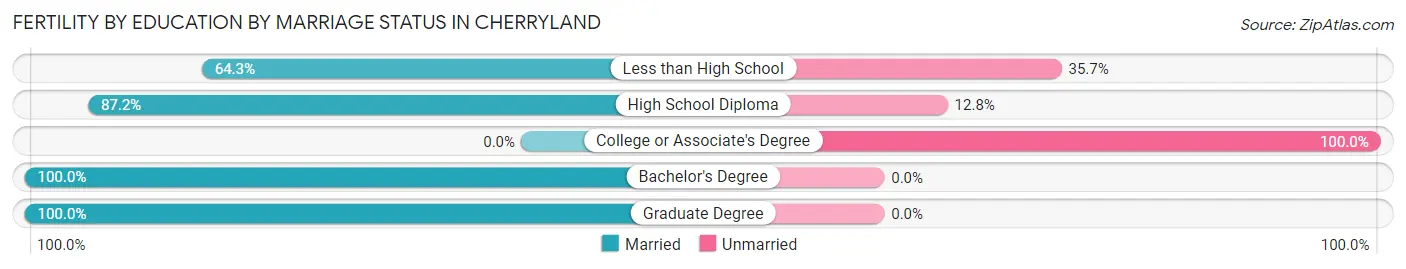
| Educational Attainment | Married | Unmarried |
| Less than High School | 63 (64.3%) | 35 (35.7%) |
| High School Diploma | 41 (87.2%) | 6 (12.8%) |
| College or Associate's Degree | 0 (0.0%) | 10 (100.0%) |
| Bachelor's Degree | 9 (100.0%) | 0 (0.0%) |
| Graduate Degree | 7 (100.0%) | 0 (0.0%) |
| Total | 120 (70.2%) | 51 (29.8%) |
Employment Characteristics in Cherryland
Employment by Class of Employer in Cherryland
Among the 6,334 employed individuals in Cherryland, private company employees (4,198 | 66.3%), not-for-profit organizations (566 | 8.9%), and self-employed (not incorporated) (564 | 8.9%) make up the most common classes of employment.
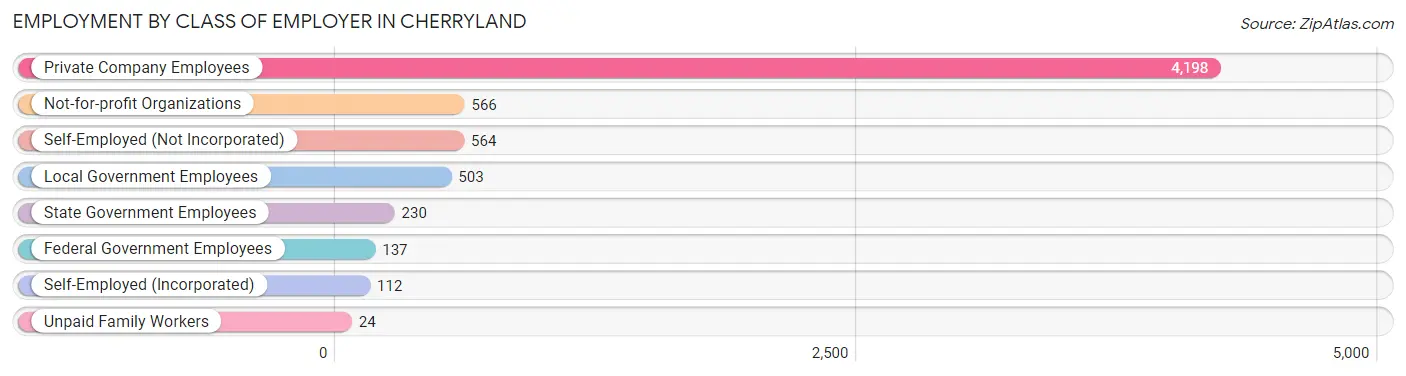
| Employer Class | # Employees | % Employees |
| Private Company Employees | 4,198 | 66.3% |
| Self-Employed (Incorporated) | 112 | 1.8% |
| Self-Employed (Not Incorporated) | 564 | 8.9% |
| Not-for-profit Organizations | 566 | 8.9% |
| Local Government Employees | 503 | 7.9% |
| State Government Employees | 230 | 3.6% |
| Federal Government Employees | 137 | 2.2% |
| Unpaid Family Workers | 24 | 0.4% |
| Total | 6,334 | 100.0% |
Employment Status by Age in Cherryland
According to the labor force statistics for Cherryland, out of the total population over 16 years of age (12,887), 60.1% or 7,745 individuals are in the labor force, with 5.3% or 410 of them unemployed. The age group with the highest labor force participation rate is 30 to 34 years, with 89.9% or 998 individuals in the labor force. Within the labor force, the 16 to 19 years age range has the highest percentage of unemployed individuals, with 12.2% or 35 of them being unemployed.
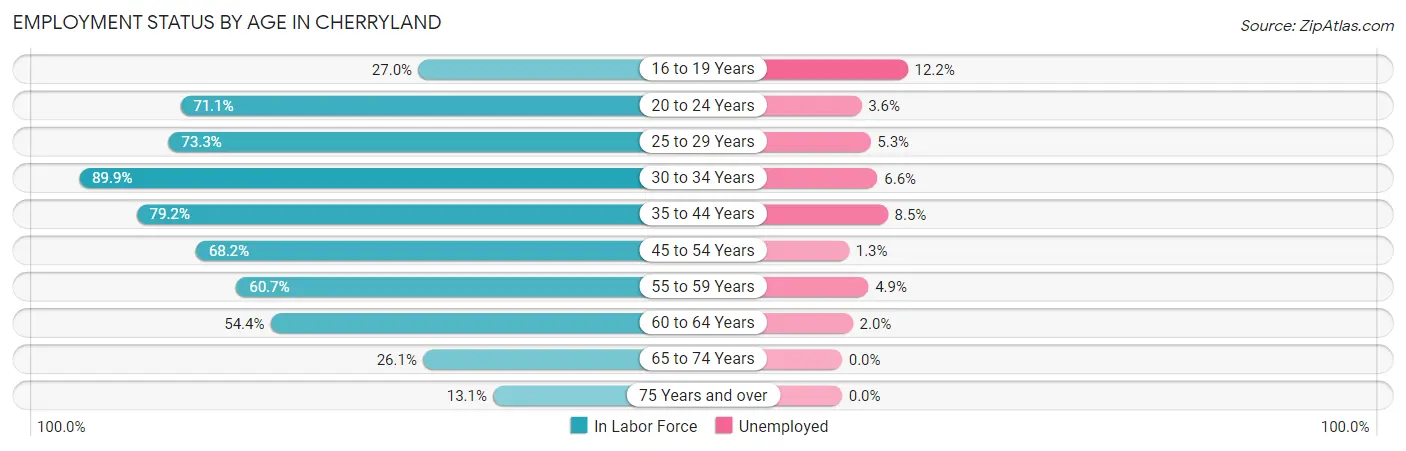
| Age Bracket | In Labor Force | Unemployed |
| 16 to 19 Years | 288 (27.0%) | 35 (12.2%) |
| 20 to 24 Years | 603 (71.1%) | 22 (3.6%) |
| 25 to 29 Years | 608 (73.3%) | 32 (5.3%) |
| 30 to 34 Years | 998 (89.9%) | 66 (6.6%) |
| 35 to 44 Years | 2,236 (79.2%) | 190 (8.5%) |
| 45 to 54 Years | 1,355 (68.2%) | 18 (1.3%) |
| 55 to 59 Years | 732 (60.7%) | 36 (4.9%) |
| 60 to 64 Years | 508 (54.4%) | 10 (2.0%) |
| 65 to 74 Years | 290 (26.1%) | 0 (0.0%) |
| 75 Years and over | 127 (13.1%) | 0 (0.0%) |
| Total | 7,745 (60.1%) | 410 (5.3%) |
Employment Status by Educational Attainment in Cherryland
According to labor force statistics for Cherryland, 72.4% of individuals (6,435) out of the total population between 25 and 64 years of age (8,888) are in the labor force, with 5.5% or 354 of them being unemployed. The group with the highest labor force participation rate are those with the educational attainment of college / associate degree, with 82.6% or 1,724 individuals in the labor force. Within the labor force, individuals with college / associate degree education have the highest percentage of unemployment, with 7.4% or 128 of them being unemployed.
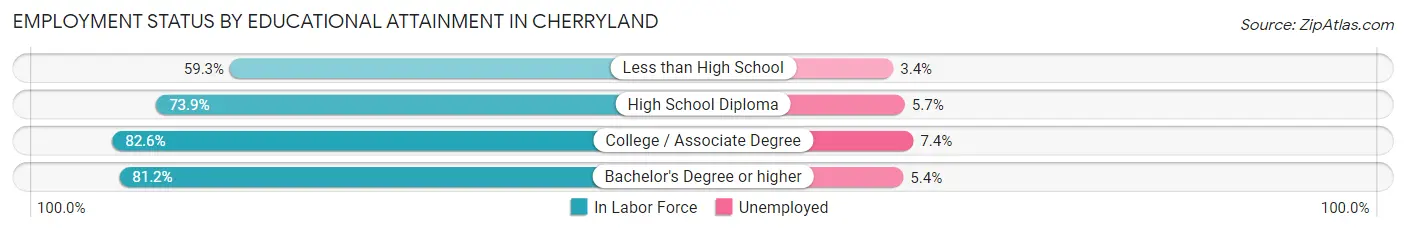
| Educational Attainment | In Labor Force | Unemployed |
| Less than High School | 1,689 (59.3%) | 97 (3.4%) |
| High School Diploma | 1,875 (73.9%) | 145 (5.7%) |
| College / Associate Degree | 1,724 (82.6%) | 154 (7.4%) |
| Bachelor's Degree or higher | 1,150 (81.2%) | 76 (5.4%) |
| Total | 6,435 (72.4%) | 489 (5.5%) |
Employment Occupations by Sex in Cherryland
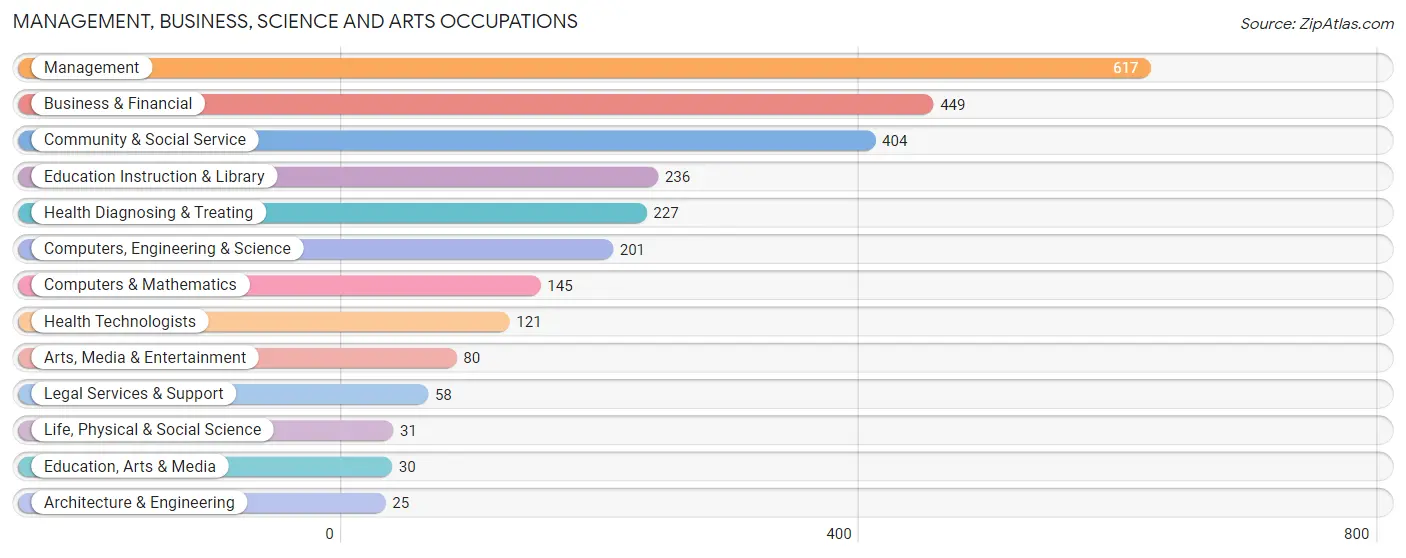
Management, Business, Science and Arts Occupations
The most common Management, Business, Science and Arts occupations in Cherryland are Management (617 | 8.4%), Business & Financial (449 | 6.1%), Community & Social Service (404 | 5.5%), Education Instruction & Library (236 | 3.2%), and Health Diagnosing & Treating (227 | 3.1%).
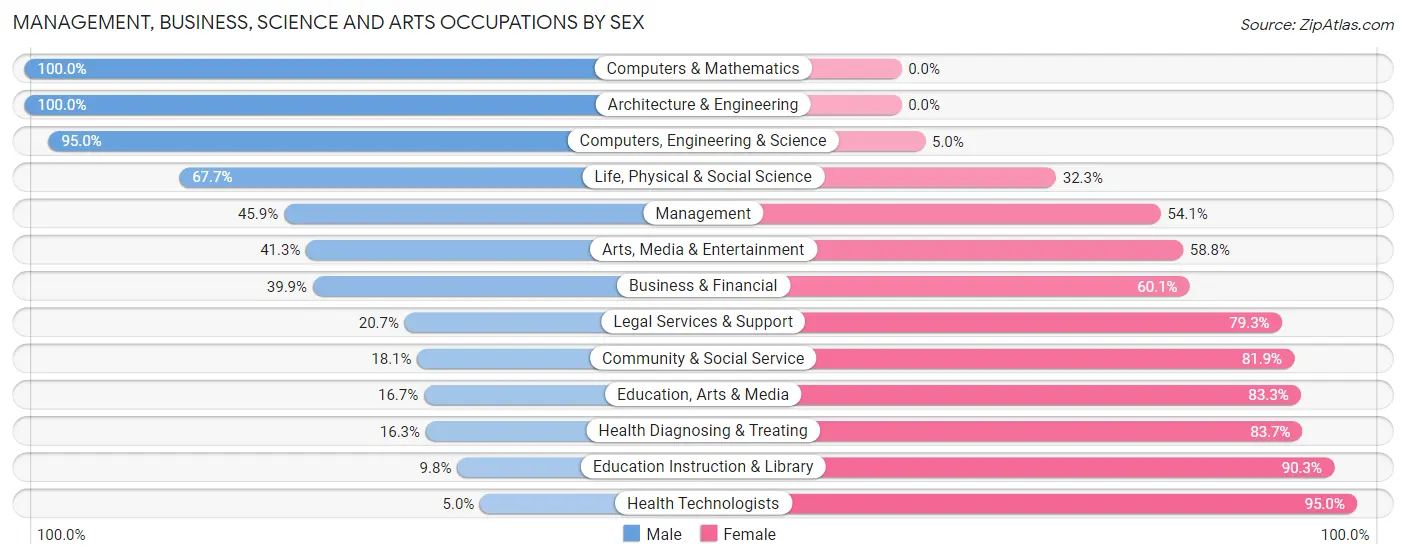
Management, Business, Science and Arts Occupations by Sex
Within the Management, Business, Science and Arts occupations in Cherryland, the most male-oriented occupations are Computers & Mathematics (100.0%), Architecture & Engineering (100.0%), and Computers, Engineering & Science (95.0%), while the most female-oriented occupations are Health Technologists (95.0%), Education Instruction & Library (90.2%), and Health Diagnosing & Treating (83.7%).
| Occupation | Male | Female |
| Management | 283 (45.9%) | 334 (54.1%) |
| Business & Financial | 179 (39.9%) | 270 (60.1%) |
| Computers, Engineering & Science | 191 (95.0%) | 10 (5.0%) |
| Computers & Mathematics | 145 (100.0%) | 0 (0.0%) |
| Architecture & Engineering | 25 (100.0%) | 0 (0.0%) |
| Life, Physical & Social Science | 21 (67.7%) | 10 (32.3%) |
| Community & Social Service | 73 (18.1%) | 331 (81.9%) |
| Education, Arts & Media | 5 (16.7%) | 25 (83.3%) |
| Legal Services & Support | 12 (20.7%) | 46 (79.3%) |
| Education Instruction & Library | 23 (9.8%) | 213 (90.2%) |
| Arts, Media & Entertainment | 33 (41.2%) | 47 (58.8%) |
| Health Diagnosing & Treating | 37 (16.3%) | 190 (83.7%) |
| Health Technologists | 6 (5.0%) | 115 (95.0%) |
| Total (Category) | 763 (40.2%) | 1,135 (59.8%) |
| Total (Overall) | 4,211 (57.4%) | 3,126 (42.6%) |
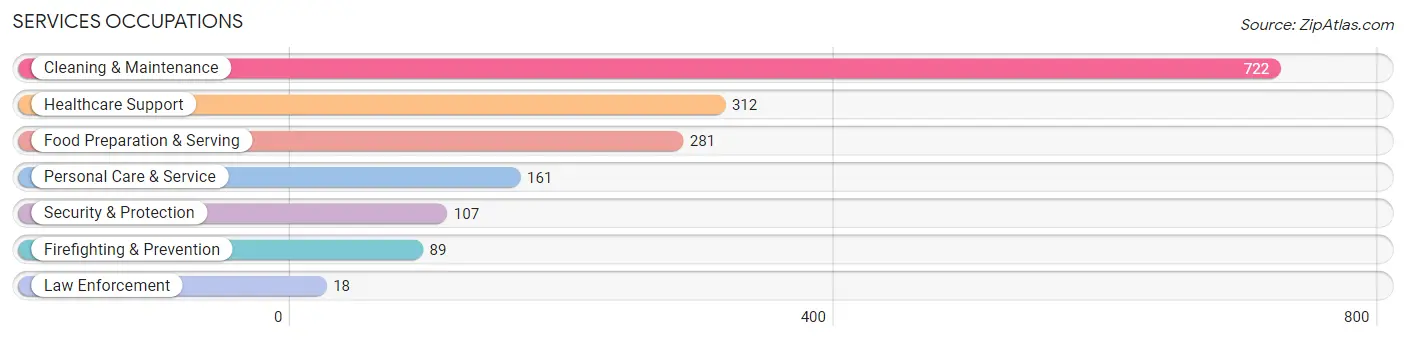
Services Occupations
The most common Services occupations in Cherryland are Cleaning & Maintenance (722 | 9.8%), Healthcare Support (312 | 4.3%), Food Preparation & Serving (281 | 3.8%), Personal Care & Service (161 | 2.2%), and Security & Protection (107 | 1.5%).
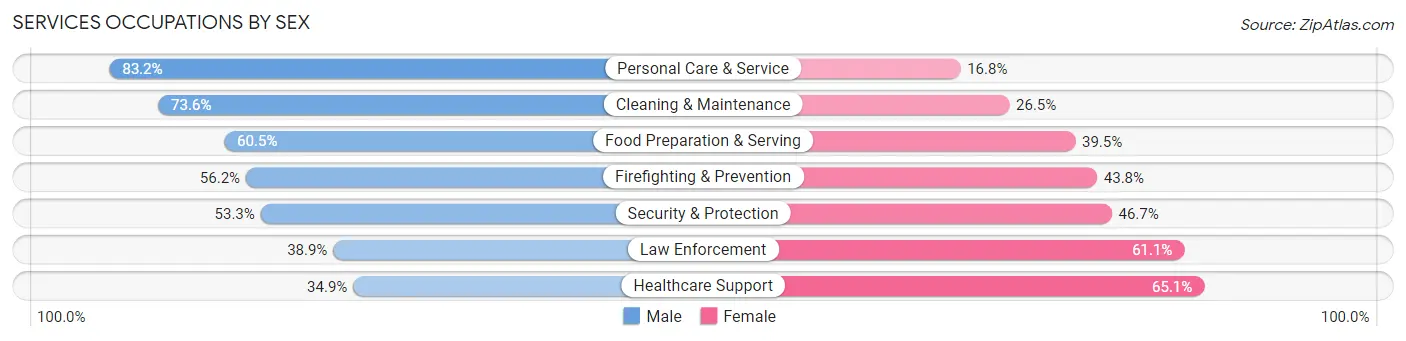
Services Occupations by Sex
Within the Services occupations in Cherryland, the most male-oriented occupations are Personal Care & Service (83.2%), Cleaning & Maintenance (73.6%), and Food Preparation & Serving (60.5%), while the most female-oriented occupations are Healthcare Support (65.1%), Law Enforcement (61.1%), and Security & Protection (46.7%).
| Occupation | Male | Female |
| Healthcare Support | 109 (34.9%) | 203 (65.1%) |
| Security & Protection | 57 (53.3%) | 50 (46.7%) |
| Firefighting & Prevention | 50 (56.2%) | 39 (43.8%) |
| Law Enforcement | 7 (38.9%) | 11 (61.1%) |
| Food Preparation & Serving | 170 (60.5%) | 111 (39.5%) |
| Cleaning & Maintenance | 531 (73.6%) | 191 (26.5%) |
| Personal Care & Service | 134 (83.2%) | 27 (16.8%) |
| Total (Category) | 1,001 (63.2%) | 582 (36.8%) |
| Total (Overall) | 4,211 (57.4%) | 3,126 (42.6%) |
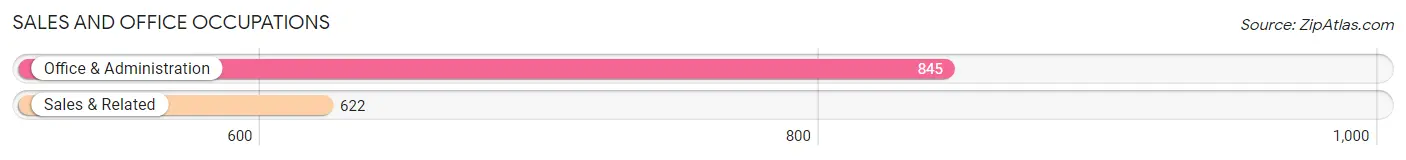
Sales and Office Occupations
The most common Sales and Office occupations in Cherryland are Office & Administration (845 | 11.5%), and Sales & Related (622 | 8.5%).
Sales and Office Occupations by Sex
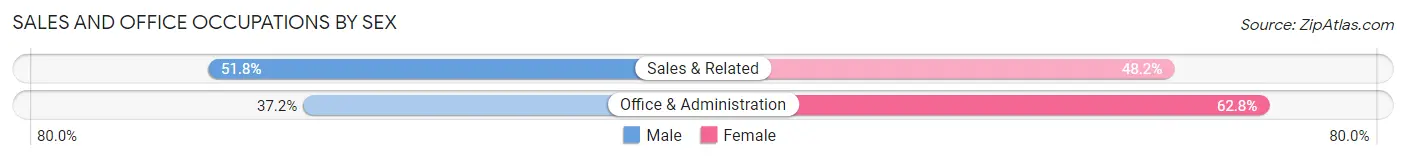
| Occupation | Male | Female |
| Sales & Related | 322 (51.8%) | 300 (48.2%) |
| Office & Administration | 314 (37.2%) | 531 (62.8%) |
| Total (Category) | 636 (43.3%) | 831 (56.7%) |
| Total (Overall) | 4,211 (57.4%) | 3,126 (42.6%) |
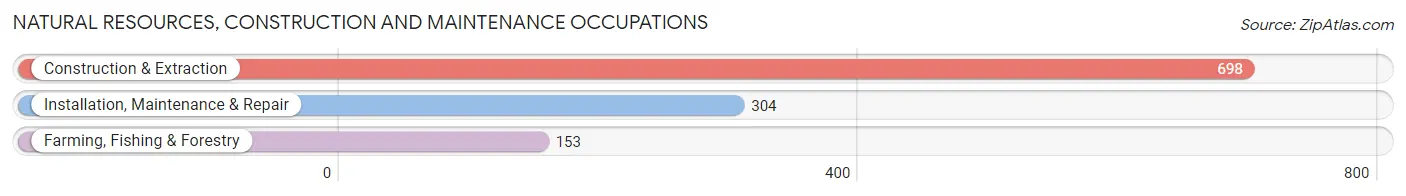
Natural Resources, Construction and Maintenance Occupations
The most common Natural Resources, Construction and Maintenance occupations in Cherryland are Construction & Extraction (698 | 9.5%), Installation, Maintenance & Repair (304 | 4.1%), and Farming, Fishing & Forestry (153 | 2.1%).
Natural Resources, Construction and Maintenance Occupations by Sex
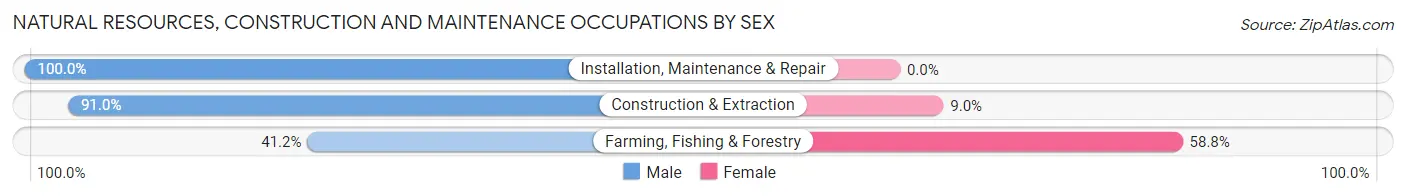
| Occupation | Male | Female |
| Farming, Fishing & Forestry | 63 (41.2%) | 90 (58.8%) |
| Construction & Extraction | 635 (91.0%) | 63 (9.0%) |
| Installation, Maintenance & Repair | 304 (100.0%) | 0 (0.0%) |
| Total (Category) | 1,002 (86.8%) | 153 (13.3%) |
| Total (Overall) | 4,211 (57.4%) | 3,126 (42.6%) |
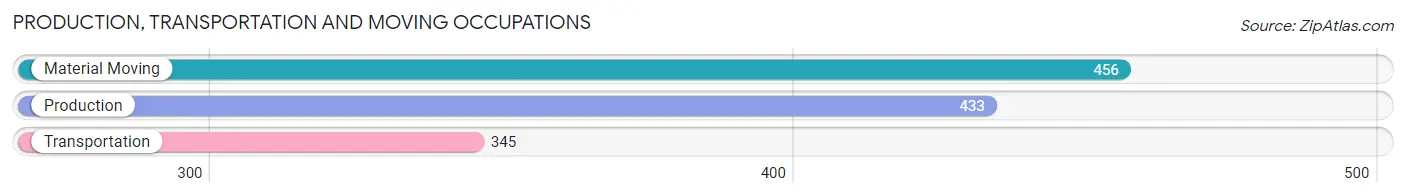
Production, Transportation and Moving Occupations
The most common Production, Transportation and Moving occupations in Cherryland are Material Moving (456 | 6.2%), Production (433 | 5.9%), and Transportation (345 | 4.7%).
Production, Transportation and Moving Occupations by Sex
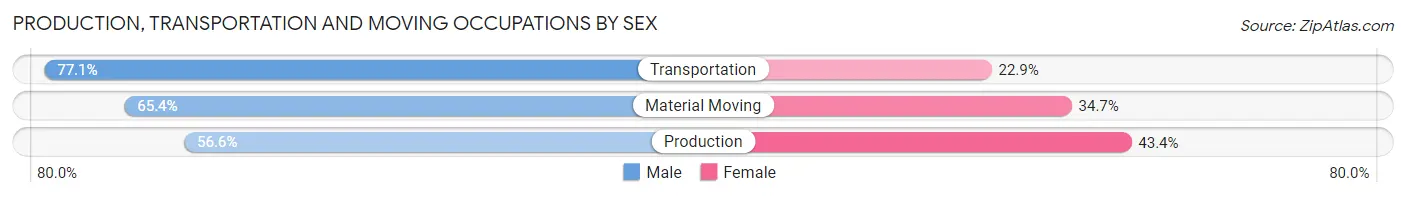
| Occupation | Male | Female |
| Production | 245 (56.6%) | 188 (43.4%) |
| Transportation | 266 (77.1%) | 79 (22.9%) |
| Material Moving | 298 (65.3%) | 158 (34.6%) |
| Total (Category) | 809 (65.6%) | 425 (34.4%) |
| Total (Overall) | 4,211 (57.4%) | 3,126 (42.6%) |
Employment Industries by Sex in Cherryland
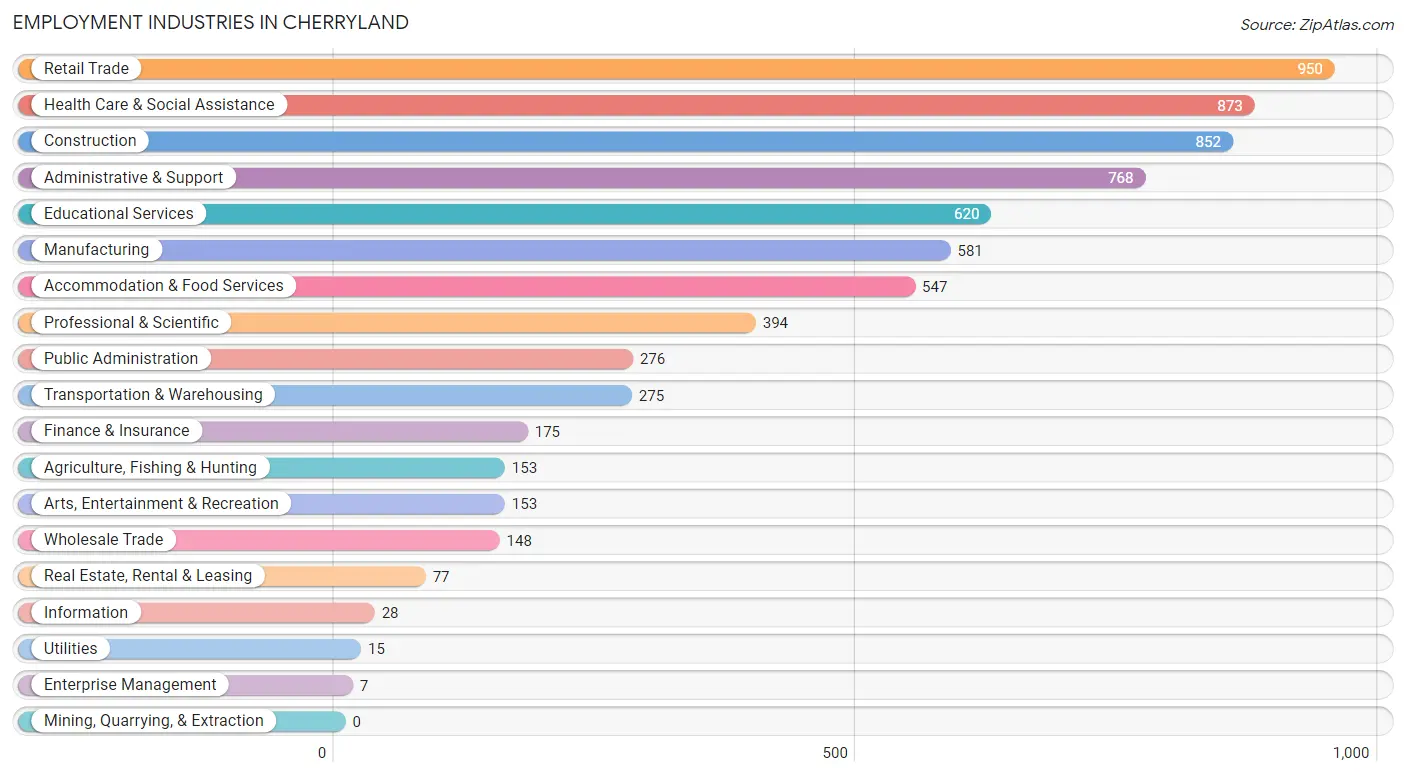
Employment Industries in Cherryland
The major employment industries in Cherryland include Retail Trade (950 | 13.0%), Health Care & Social Assistance (873 | 11.9%), Construction (852 | 11.6%), Administrative & Support (768 | 10.5%), and Educational Services (620 | 8.5%).
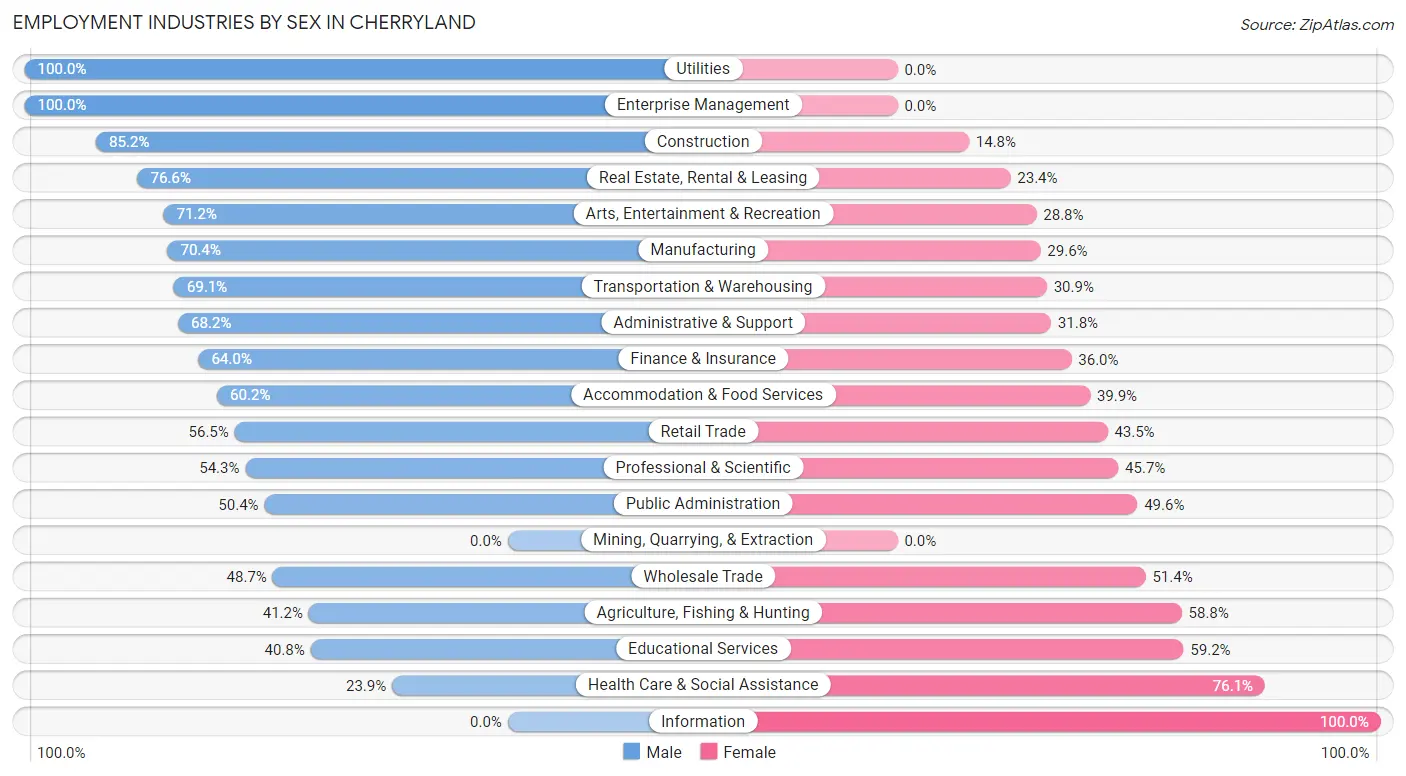
Employment Industries by Sex in Cherryland
The Cherryland industries that see more men than women are Utilities (100.0%), Enterprise Management (100.0%), and Construction (85.2%), whereas the industries that tend to have a higher number of women are Information (100.0%), Health Care & Social Assistance (76.1%), and Educational Services (59.2%).
| Industry | Male | Female |
| Agriculture, Fishing & Hunting | 63 (41.2%) | 90 (58.8%) |
| Mining, Quarrying, & Extraction | 0 (0.0%) | 0 (0.0%) |
| Construction | 726 (85.2%) | 126 (14.8%) |
| Manufacturing | 409 (70.4%) | 172 (29.6%) |
| Wholesale Trade | 72 (48.6%) | 76 (51.3%) |
| Retail Trade | 537 (56.5%) | 413 (43.5%) |
| Transportation & Warehousing | 190 (69.1%) | 85 (30.9%) |
| Utilities | 15 (100.0%) | 0 (0.0%) |
| Information | 0 (0.0%) | 28 (100.0%) |
| Finance & Insurance | 112 (64.0%) | 63 (36.0%) |
| Real Estate, Rental & Leasing | 59 (76.6%) | 18 (23.4%) |
| Professional & Scientific | 214 (54.3%) | 180 (45.7%) |
| Enterprise Management | 7 (100.0%) | 0 (0.0%) |
| Administrative & Support | 524 (68.2%) | 244 (31.8%) |
| Educational Services | 253 (40.8%) | 367 (59.2%) |
| Health Care & Social Assistance | 209 (23.9%) | 664 (76.1%) |
| Arts, Entertainment & Recreation | 109 (71.2%) | 44 (28.8%) |
| Accommodation & Food Services | 329 (60.2%) | 218 (39.9%) |
| Public Administration | 139 (50.4%) | 137 (49.6%) |
| Total | 4,211 (57.4%) | 3,126 (42.6%) |
Education in Cherryland
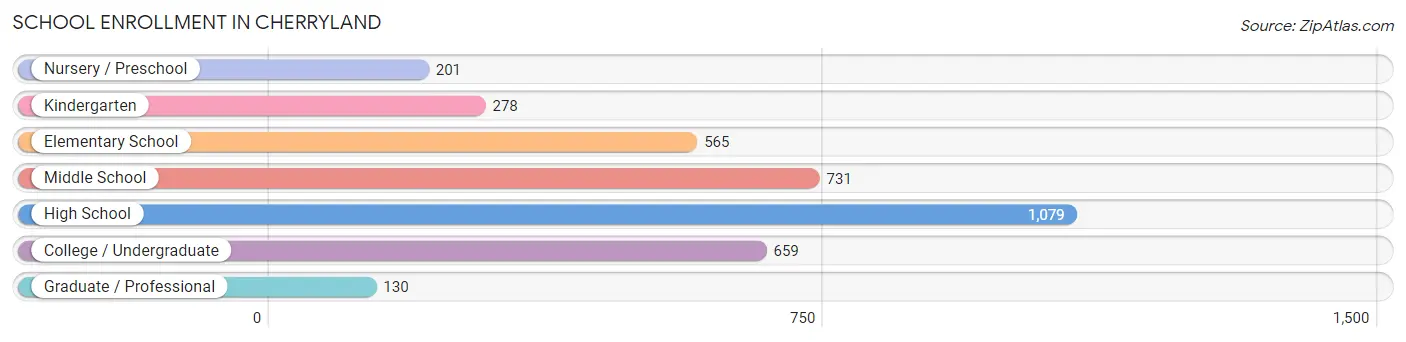
School Enrollment in Cherryland
The most common levels of schooling among the 3,643 students in Cherryland are high school (1,079 | 29.6%), middle school (731 | 20.1%), and college / undergraduate (659 | 18.1%).
| School Level | # Students | % Students |
| Nursery / Preschool | 201 | 5.5% |
| Kindergarten | 278 | 7.6% |
| Elementary School | 565 | 15.5% |
| Middle School | 731 | 20.1% |
| High School | 1,079 | 29.6% |
| College / Undergraduate | 659 | 18.1% |
| Graduate / Professional | 130 | 3.6% |
| Total | 3,643 | 100.0% |
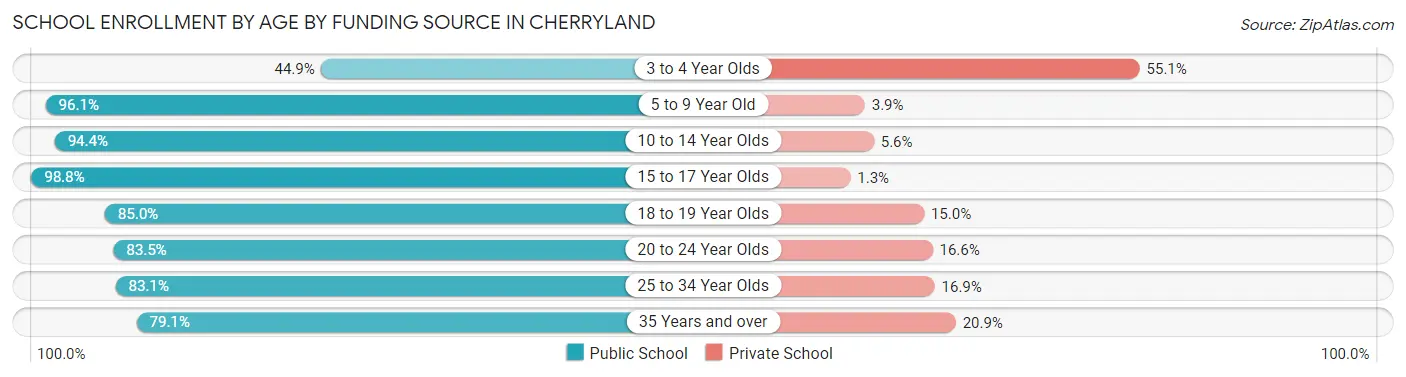
School Enrollment by Age by Funding Source in Cherryland
Out of a total of 3,643 students who are enrolled in schools in Cherryland, 386 (10.6%) attend a private institution, while the remaining 3,257 (89.4%) are enrolled in public schools. The age group of 3 to 4 year olds has the highest likelihood of being enrolled in private schools, with 113 (55.1% in the age bracket) enrolled. Conversely, the age group of 15 to 17 year olds has the lowest likelihood of being enrolled in a private school, with 631 (98.8% in the age bracket) attending a public institution.
| Age Bracket | Public School | Private School |
| 3 to 4 Year Olds | 92 (44.9%) | 113 (55.1%) |
| 5 to 9 Year Old | 782 (96.1%) | 32 (3.9%) |
| 10 to 14 Year Olds | 841 (94.4%) | 50 (5.6%) |
| 15 to 17 Year Olds | 631 (98.8%) | 8 (1.3%) |
| 18 to 19 Year Olds | 398 (85.0%) | 70 (15.0%) |
| 20 to 24 Year Olds | 247 (83.5%) | 49 (16.6%) |
| 25 to 34 Year Olds | 103 (83.1%) | 21 (16.9%) |
| 35 Years and over | 163 (79.1%) | 43 (20.9%) |
| Total | 3,257 (89.4%) | 386 (10.6%) |
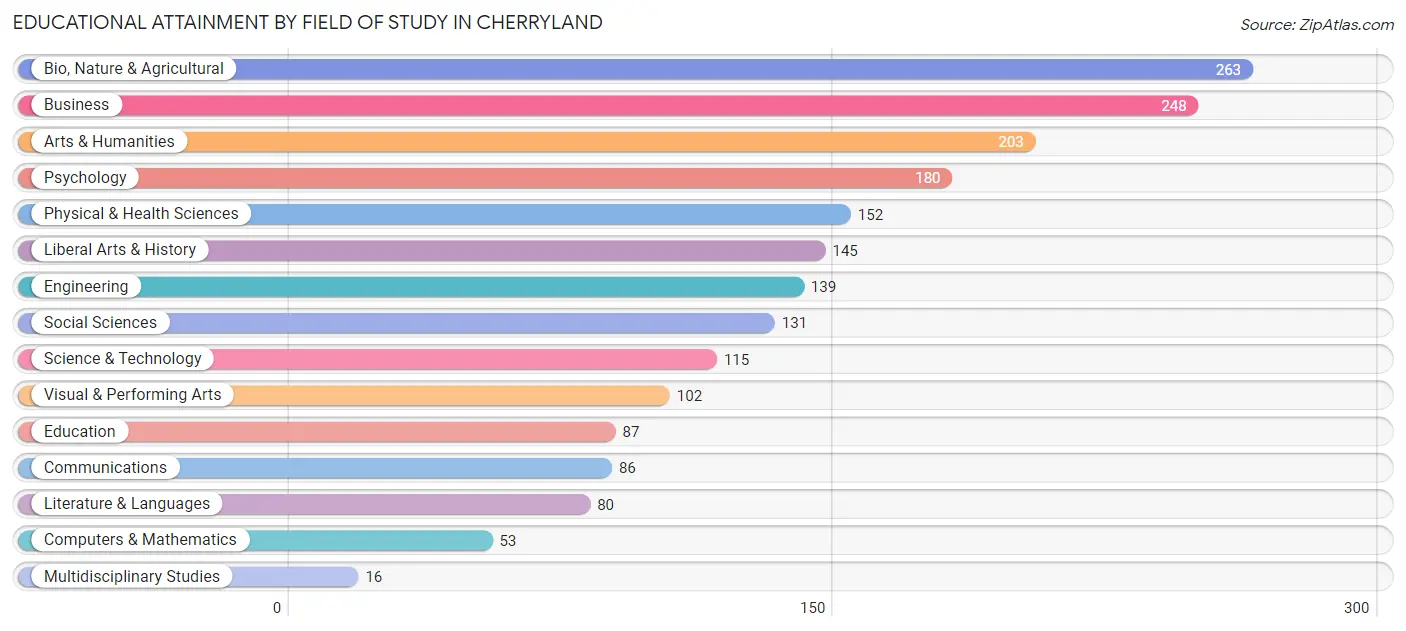
Educational Attainment by Field of Study in Cherryland
Bio, nature & agricultural (263 | 13.2%), business (248 | 12.4%), arts & humanities (203 | 10.2%), psychology (180 | 9.0%), and physical & health sciences (152 | 7.6%) are the most common fields of study among 2,000 individuals in Cherryland who have obtained a bachelor's degree or higher.
| Field of Study | # Graduates | % Graduates |
| Computers & Mathematics | 53 | 2.6% |
| Bio, Nature & Agricultural | 263 | 13.2% |
| Physical & Health Sciences | 152 | 7.6% |
| Psychology | 180 | 9.0% |
| Social Sciences | 131 | 6.6% |
| Engineering | 139 | 7.0% |
| Multidisciplinary Studies | 16 | 0.8% |
| Science & Technology | 115 | 5.8% |
| Business | 248 | 12.4% |
| Education | 87 | 4.3% |
| Literature & Languages | 80 | 4.0% |
| Liberal Arts & History | 145 | 7.2% |
| Visual & Performing Arts | 102 | 5.1% |
| Communications | 86 | 4.3% |
| Arts & Humanities | 203 | 10.2% |
| Total | 2,000 | 100.0% |
Transportation & Commute in Cherryland
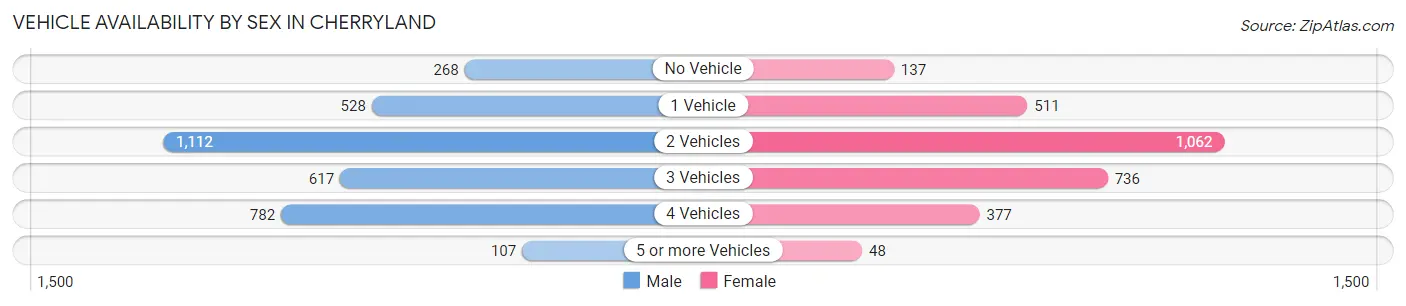
Vehicle Availability by Sex in Cherryland
The most prevalent vehicle ownership categories in Cherryland are males with 2 vehicles (1,112, accounting for 32.6%) and females with 2 vehicles (1,062, making up 38.7%).
| Vehicles Available | Male | Female |
| No Vehicle | 268 (7.9%) | 137 (4.8%) |
| 1 Vehicle | 528 (15.5%) | 511 (17.8%) |
| 2 Vehicles | 1,112 (32.6%) | 1,062 (37.0%) |
| 3 Vehicles | 617 (18.1%) | 736 (25.6%) |
| 4 Vehicles | 782 (22.9%) | 377 (13.1%) |
| 5 or more Vehicles | 107 (3.1%) | 48 (1.7%) |
| Total | 3,414 (100.0%) | 2,871 (100.0%) |
Commute Time in Cherryland
The most frequently occuring commute durations in Cherryland are 30 to 34 minutes (1,065 commuters, 18.6%), 10 to 14 minutes (930 commuters, 16.2%), and 15 to 19 minutes (766 commuters, 13.4%).
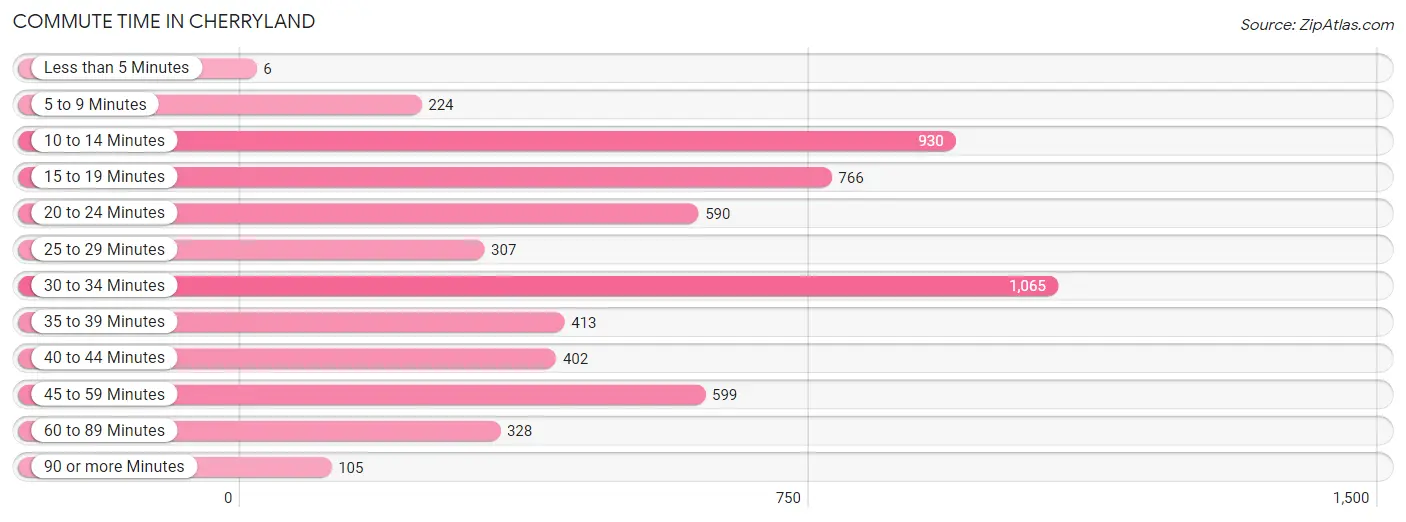
| Commute Time | # Commuters | % Commuters |
| Less than 5 Minutes | 6 | 0.1% |
| 5 to 9 Minutes | 224 | 3.9% |
| 10 to 14 Minutes | 930 | 16.2% |
| 15 to 19 Minutes | 766 | 13.4% |
| 20 to 24 Minutes | 590 | 10.3% |
| 25 to 29 Minutes | 307 | 5.3% |
| 30 to 34 Minutes | 1,065 | 18.6% |
| 35 to 39 Minutes | 413 | 7.2% |
| 40 to 44 Minutes | 402 | 7.0% |
| 45 to 59 Minutes | 599 | 10.4% |
| 60 to 89 Minutes | 328 | 5.7% |
| 90 or more Minutes | 105 | 1.8% |
Commute Time by Sex in Cherryland
The most common commute times in Cherryland are 30 to 34 minutes (586 commuters, 18.3%) for males and 10 to 14 minutes (534 commuters, 21.1%) for females.
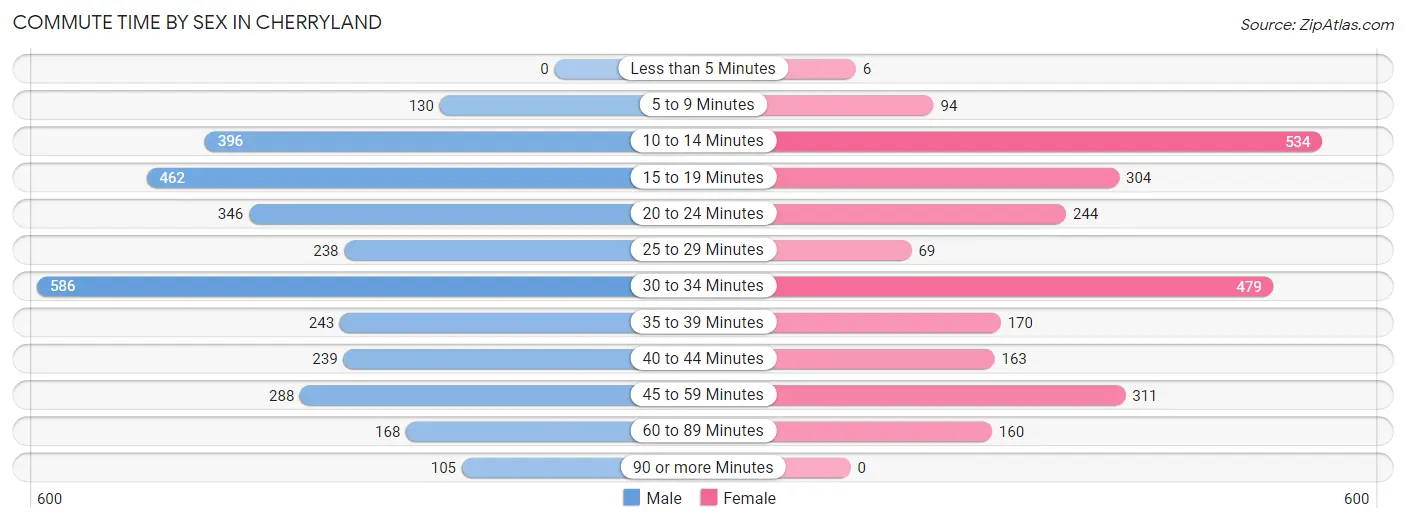
| Commute Time | Male | Female |
| Less than 5 Minutes | 0 (0.0%) | 6 (0.2%) |
| 5 to 9 Minutes | 130 (4.1%) | 94 (3.7%) |
| 10 to 14 Minutes | 396 (12.4%) | 534 (21.1%) |
| 15 to 19 Minutes | 462 (14.4%) | 304 (12.0%) |
| 20 to 24 Minutes | 346 (10.8%) | 244 (9.6%) |
| 25 to 29 Minutes | 238 (7.4%) | 69 (2.7%) |
| 30 to 34 Minutes | 586 (18.3%) | 479 (18.9%) |
| 35 to 39 Minutes | 243 (7.6%) | 170 (6.7%) |
| 40 to 44 Minutes | 239 (7.5%) | 163 (6.4%) |
| 45 to 59 Minutes | 288 (9.0%) | 311 (12.3%) |
| 60 to 89 Minutes | 168 (5.2%) | 160 (6.3%) |
| 90 or more Minutes | 105 (3.3%) | 0 (0.0%) |
Time of Departure to Work by Sex in Cherryland
The most frequent times of departure to work in Cherryland are 6:00 AM to 6:29 AM (449, 14.0%) for males and 7:00 AM to 7:29 AM (471, 18.6%) for females.
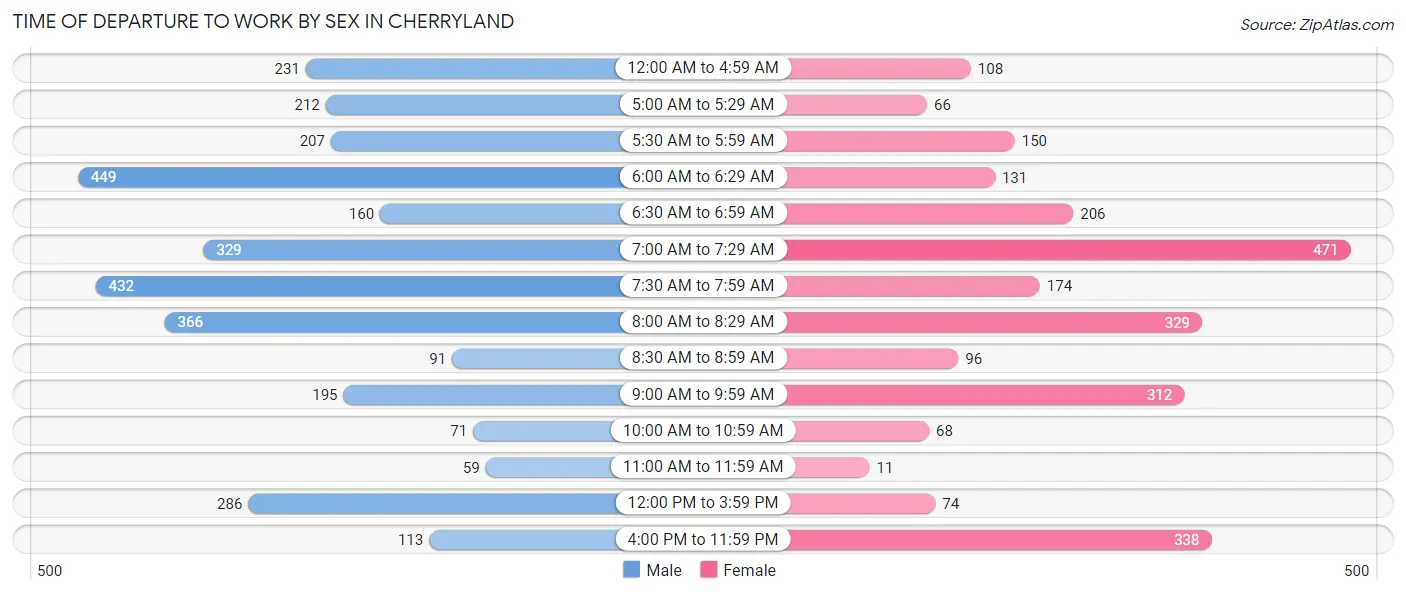
| Time of Departure | Male | Female |
| 12:00 AM to 4:59 AM | 231 (7.2%) | 108 (4.3%) |
| 5:00 AM to 5:29 AM | 212 (6.6%) | 66 (2.6%) |
| 5:30 AM to 5:59 AM | 207 (6.5%) | 150 (5.9%) |
| 6:00 AM to 6:29 AM | 449 (14.0%) | 131 (5.2%) |
| 6:30 AM to 6:59 AM | 160 (5.0%) | 206 (8.1%) |
| 7:00 AM to 7:29 AM | 329 (10.3%) | 471 (18.6%) |
| 7:30 AM to 7:59 AM | 432 (13.5%) | 174 (6.9%) |
| 8:00 AM to 8:29 AM | 366 (11.4%) | 329 (13.0%) |
| 8:30 AM to 8:59 AM | 91 (2.8%) | 96 (3.8%) |
| 9:00 AM to 9:59 AM | 195 (6.1%) | 312 (12.3%) |
| 10:00 AM to 10:59 AM | 71 (2.2%) | 68 (2.7%) |
| 11:00 AM to 11:59 AM | 59 (1.8%) | 11 (0.4%) |
| 12:00 PM to 3:59 PM | 286 (8.9%) | 74 (2.9%) |
| 4:00 PM to 11:59 PM | 113 (3.5%) | 338 (13.3%) |
| Total | 3,201 (100.0%) | 2,534 (100.0%) |
Housing Occupancy in Cherryland
Occupancy by Ownership in Cherryland
Of the total 4,720 dwellings in Cherryland, owner-occupied units account for 1,451 (30.7%), while renter-occupied units make up 3,269 (69.3%).
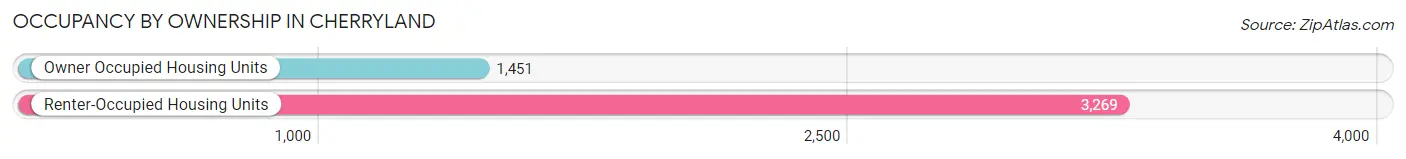
| Occupancy | # Housing Units | % Housing Units |
| Owner Occupied Housing Units | 1,451 | 30.7% |
| Renter-Occupied Housing Units | 3,269 | 69.3% |
| Total Occupied Housing Units | 4,720 | 100.0% |
Occupancy by Household Size in Cherryland
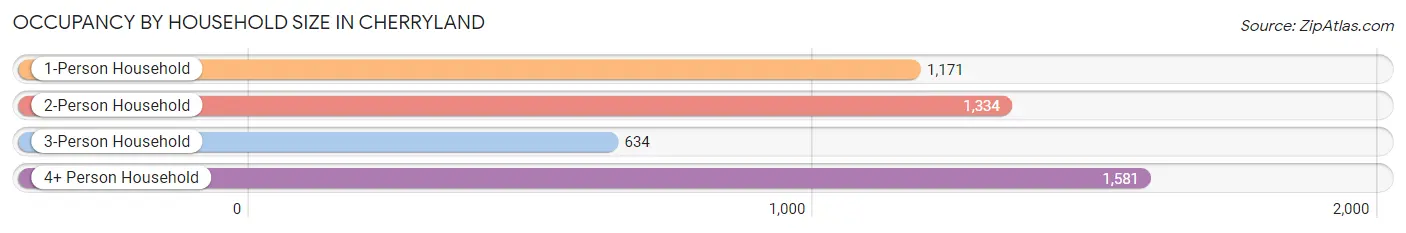
| Household Size | # Housing Units | % Housing Units |
| 1-Person Household | 1,171 | 24.8% |
| 2-Person Household | 1,334 | 28.3% |
| 3-Person Household | 634 | 13.4% |
| 4+ Person Household | 1,581 | 33.5% |
| Total Housing Units | 4,720 | 100.0% |
Occupancy by Ownership by Household Size in Cherryland
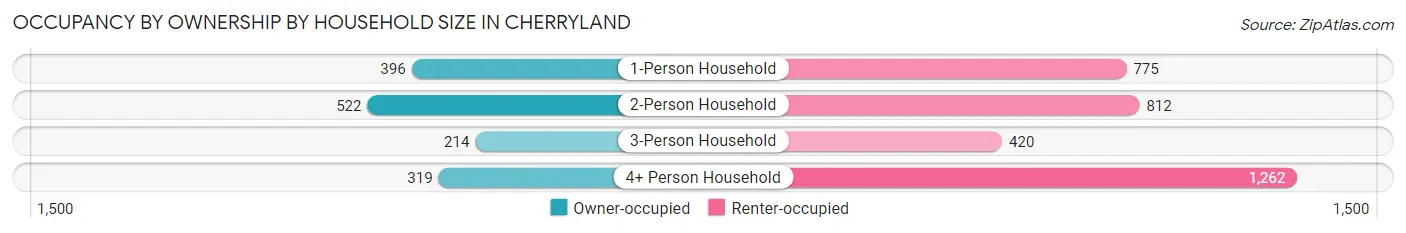
| Household Size | Owner-occupied | Renter-occupied |
| 1-Person Household | 396 (33.8%) | 775 (66.2%) |
| 2-Person Household | 522 (39.1%) | 812 (60.9%) |
| 3-Person Household | 214 (33.8%) | 420 (66.2%) |
| 4+ Person Household | 319 (20.2%) | 1,262 (79.8%) |
| Total Housing Units | 1,451 (30.7%) | 3,269 (69.3%) |
Occupancy by Educational Attainment in Cherryland
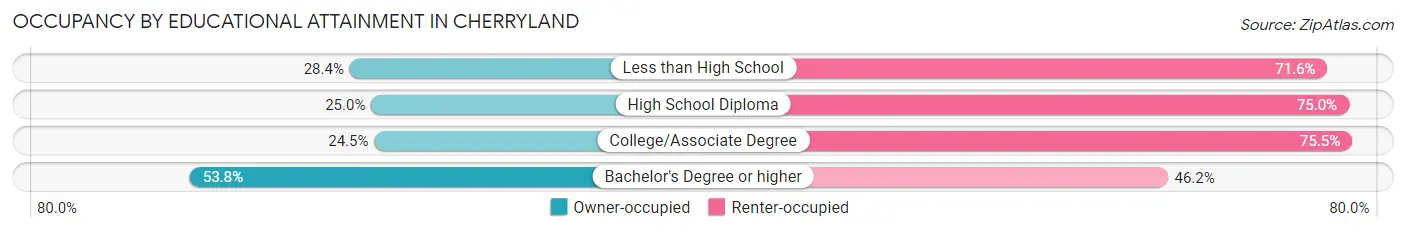
| Household Size | Owner-occupied | Renter-occupied |
| Less than High School | 313 (28.4%) | 788 (71.6%) |
| High School Diploma | 363 (25.0%) | 1,088 (75.0%) |
| College/Associate Degree | 328 (24.5%) | 1,009 (75.5%) |
| Bachelor's Degree or higher | 447 (53.8%) | 384 (46.2%) |
Occupancy by Age of Householder in Cherryland
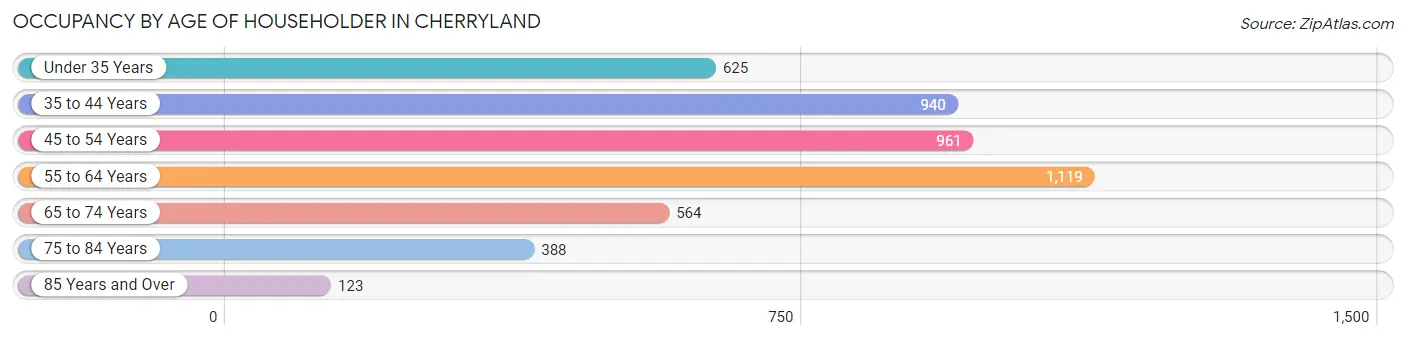
| Age Bracket | # Households | % Households |
| Under 35 Years | 625 | 13.2% |
| 35 to 44 Years | 940 | 19.9% |
| 45 to 54 Years | 961 | 20.4% |
| 55 to 64 Years | 1,119 | 23.7% |
| 65 to 74 Years | 564 | 11.9% |
| 75 to 84 Years | 388 | 8.2% |
| 85 Years and Over | 123 | 2.6% |
| Total | 4,720 | 100.0% |
Housing Finances in Cherryland
Median Income by Occupancy in Cherryland
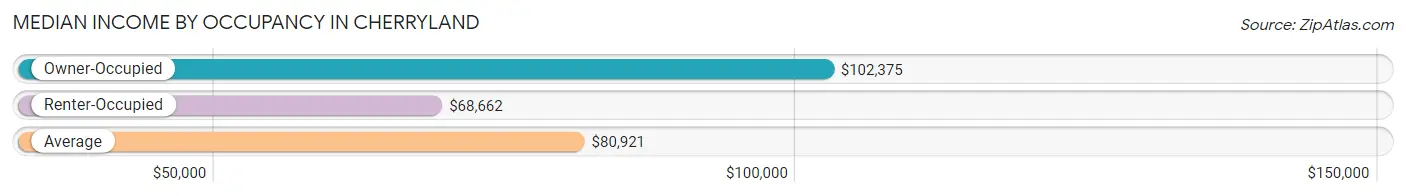
| Occupancy Type | # Households | Median Income |
| Owner-Occupied | 1,451 (30.7%) | $102,375 |
| Renter-Occupied | 3,269 (69.3%) | $68,662 |
| Average | 4,720 (100.0%) | $80,921 |
Occupancy by Householder Income Bracket in Cherryland
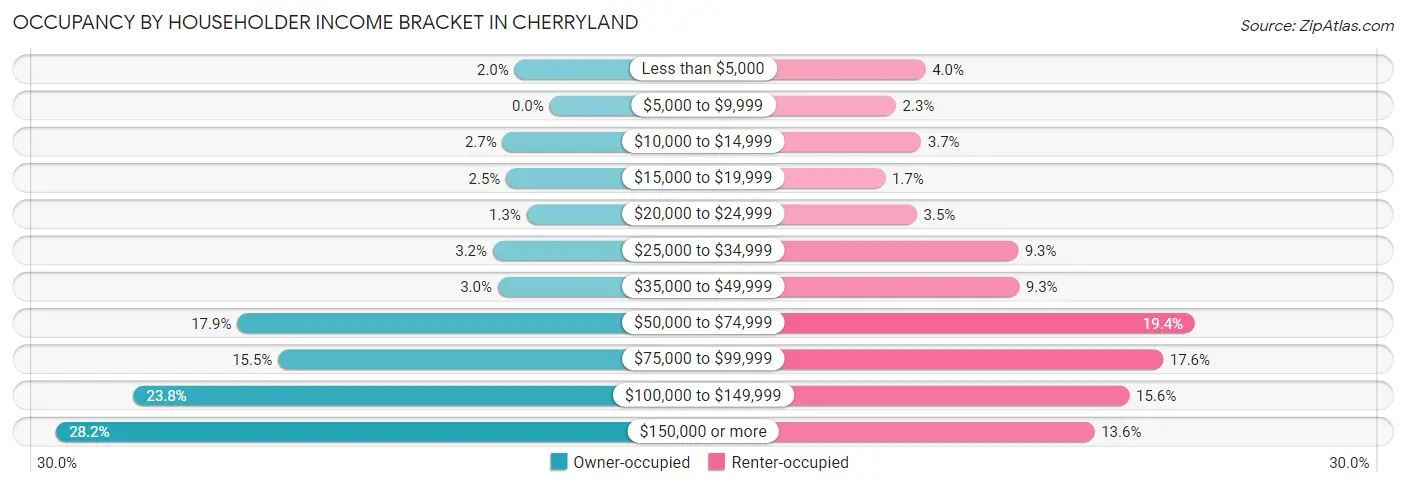
| Income Bracket | Owner-occupied | Renter-occupied |
| Less than $5,000 | 29 (2.0%) | 130 (4.0%) |
| $5,000 to $9,999 | 0 (0.0%) | 75 (2.3%) |
| $10,000 to $14,999 | 39 (2.7%) | 122 (3.7%) |
| $15,000 to $19,999 | 36 (2.5%) | 55 (1.7%) |
| $20,000 to $24,999 | 19 (1.3%) | 114 (3.5%) |
| $25,000 to $34,999 | 47 (3.2%) | 303 (9.3%) |
| $35,000 to $49,999 | 43 (3.0%) | 305 (9.3%) |
| $50,000 to $74,999 | 259 (17.8%) | 634 (19.4%) |
| $75,000 to $99,999 | 225 (15.5%) | 574 (17.6%) |
| $100,000 to $149,999 | 345 (23.8%) | 511 (15.6%) |
| $150,000 or more | 409 (28.2%) | 446 (13.6%) |
| Total | 1,451 (100.0%) | 3,269 (100.0%) |
Monthly Housing Cost Tiers in Cherryland
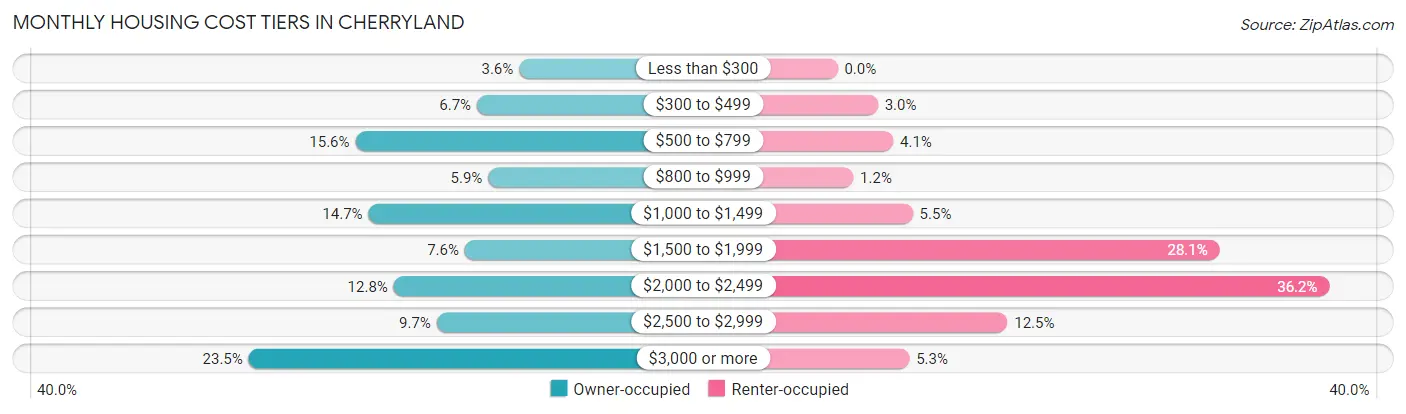
| Monthly Cost | Owner-occupied | Renter-occupied |
| Less than $300 | 52 (3.6%) | 0 (0.0%) |
| $300 to $499 | 97 (6.7%) | 97 (3.0%) |
| $500 to $799 | 227 (15.6%) | 134 (4.1%) |
| $800 to $999 | 85 (5.9%) | 38 (1.2%) |
| $1,000 to $1,499 | 213 (14.7%) | 181 (5.5%) |
| $1,500 to $1,999 | 110 (7.6%) | 920 (28.1%) |
| $2,000 to $2,499 | 186 (12.8%) | 1,184 (36.2%) |
| $2,500 to $2,999 | 140 (9.7%) | 409 (12.5%) |
| $3,000 or more | 341 (23.5%) | 173 (5.3%) |
| Total | 1,451 (100.0%) | 3,269 (100.0%) |
Physical Housing Characteristics in Cherryland
Housing Structures in Cherryland
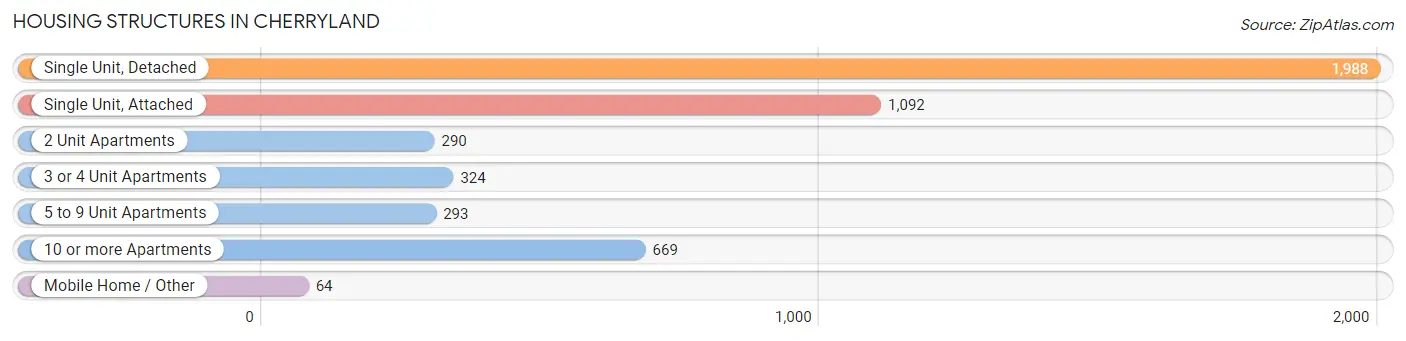
| Structure Type | # Housing Units | % Housing Units |
| Single Unit, Detached | 1,988 | 42.1% |
| Single Unit, Attached | 1,092 | 23.1% |
| 2 Unit Apartments | 290 | 6.1% |
| 3 or 4 Unit Apartments | 324 | 6.9% |
| 5 to 9 Unit Apartments | 293 | 6.2% |
| 10 or more Apartments | 669 | 14.2% |
| Mobile Home / Other | 64 | 1.4% |
| Total | 4,720 | 100.0% |
Housing Structures by Occupancy in Cherryland
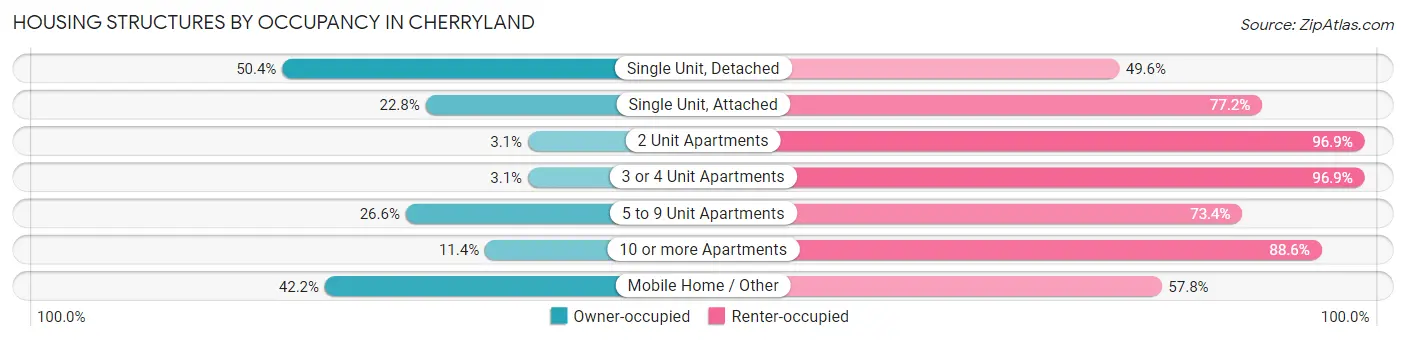
| Structure Type | Owner-occupied | Renter-occupied |
| Single Unit, Detached | 1,002 (50.4%) | 986 (49.6%) |
| Single Unit, Attached | 249 (22.8%) | 843 (77.2%) |
| 2 Unit Apartments | 9 (3.1%) | 281 (96.9%) |
| 3 or 4 Unit Apartments | 10 (3.1%) | 314 (96.9%) |
| 5 to 9 Unit Apartments | 78 (26.6%) | 215 (73.4%) |
| 10 or more Apartments | 76 (11.4%) | 593 (88.6%) |
| Mobile Home / Other | 27 (42.2%) | 37 (57.8%) |
| Total | 1,451 (30.7%) | 3,269 (69.3%) |
Housing Structures by Number of Rooms in Cherryland
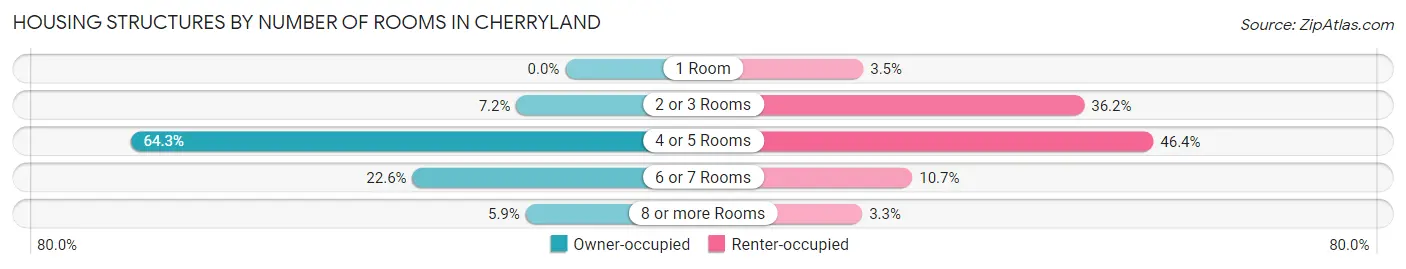
| Number of Rooms | Owner-occupied | Renter-occupied |
| 1 Room | 0 (0.0%) | 113 (3.5%) |
| 2 or 3 Rooms | 105 (7.2%) | 1,182 (36.2%) |
| 4 or 5 Rooms | 933 (64.3%) | 1,516 (46.4%) |
| 6 or 7 Rooms | 328 (22.6%) | 350 (10.7%) |
| 8 or more Rooms | 85 (5.9%) | 108 (3.3%) |
| Total | 1,451 (100.0%) | 3,269 (100.0%) |
Housing Structure by Heating Type in Cherryland
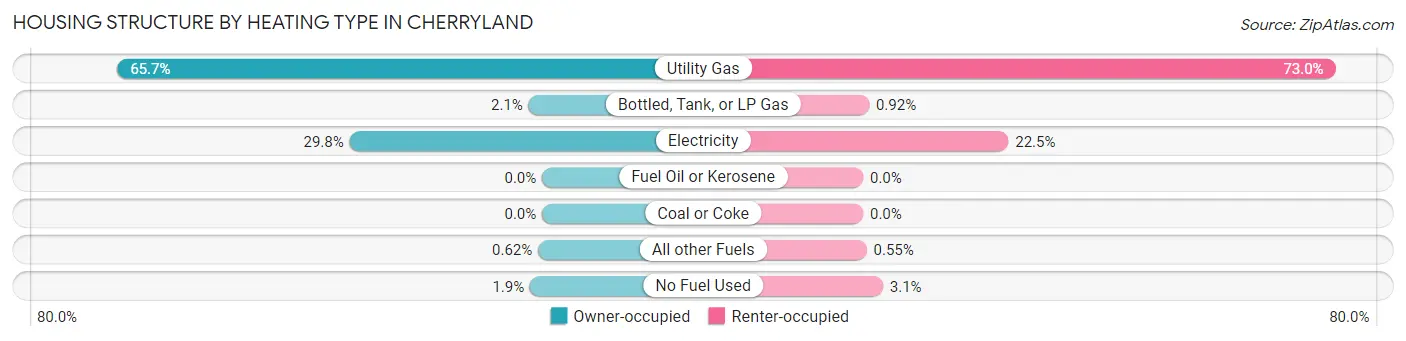
| Heating Type | Owner-occupied | Renter-occupied |
| Utility Gas | 953 (65.7%) | 2,387 (73.0%) |
| Bottled, Tank, or LP Gas | 30 (2.1%) | 30 (0.9%) |
| Electricity | 432 (29.8%) | 734 (22.5%) |
| Fuel Oil or Kerosene | 0 (0.0%) | 0 (0.0%) |
| Coal or Coke | 0 (0.0%) | 0 (0.0%) |
| All other Fuels | 9 (0.6%) | 18 (0.5%) |
| No Fuel Used | 27 (1.9%) | 100 (3.1%) |
| Total | 1,451 (100.0%) | 3,269 (100.0%) |
Household Vehicle Usage in Cherryland
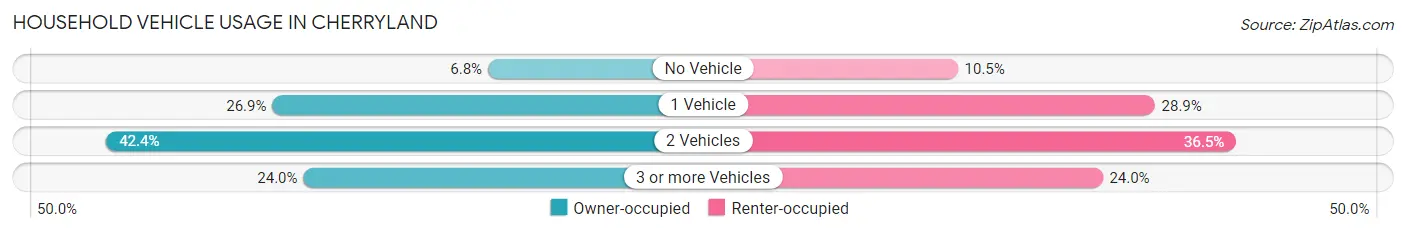
| Vehicles per Household | Owner-occupied | Renter-occupied |
| No Vehicle | 98 (6.8%) | 344 (10.5%) |
| 1 Vehicle | 390 (26.9%) | 945 (28.9%) |
| 2 Vehicles | 615 (42.4%) | 1,194 (36.5%) |
| 3 or more Vehicles | 348 (24.0%) | 786 (24.0%) |
| Total | 1,451 (100.0%) | 3,269 (100.0%) |
Real Estate & Mortgages in Cherryland
Real Estate and Mortgage Overview in Cherryland
| Characteristic | Without Mortgage | With Mortgage |
| Housing Units | 514 | 937 |
| Median Property Value | $720,800 | $623,400 |
| Median Household Income | $69,091 | $300 |
| Monthly Housing Costs | $721 | $341 |
| Real Estate Taxes | $3,000 | $111 |
Property Value by Mortgage Status in Cherryland
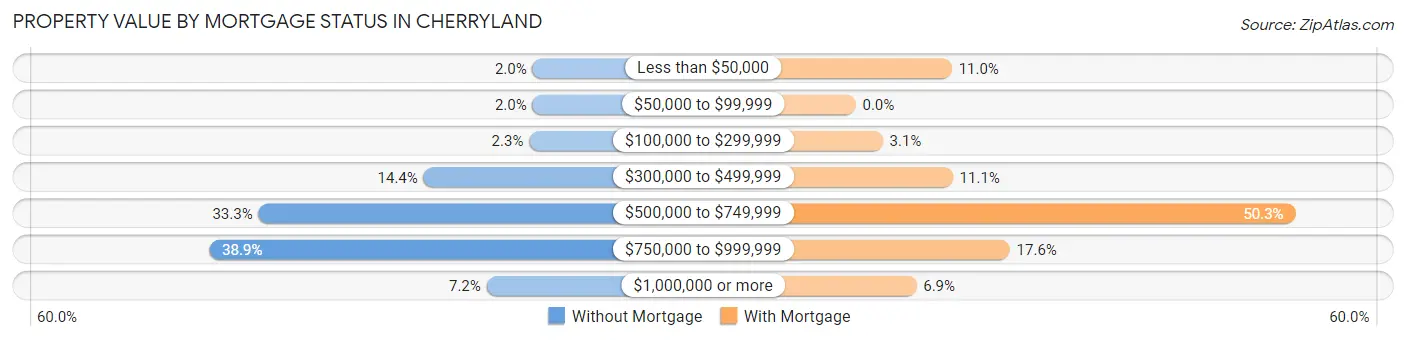
| Property Value | Without Mortgage | With Mortgage |
| Less than $50,000 | 10 (1.9%) | 103 (11.0%) |
| $50,000 to $99,999 | 10 (1.9%) | 0 (0.0%) |
| $100,000 to $299,999 | 12 (2.3%) | 29 (3.1%) |
| $300,000 to $499,999 | 74 (14.4%) | 104 (11.1%) |
| $500,000 to $749,999 | 171 (33.3%) | 471 (50.3%) |
| $750,000 to $999,999 | 200 (38.9%) | 165 (17.6%) |
| $1,000,000 or more | 37 (7.2%) | 65 (6.9%) |
| Total | 514 (100.0%) | 937 (100.0%) |
Household Income by Mortgage Status in Cherryland
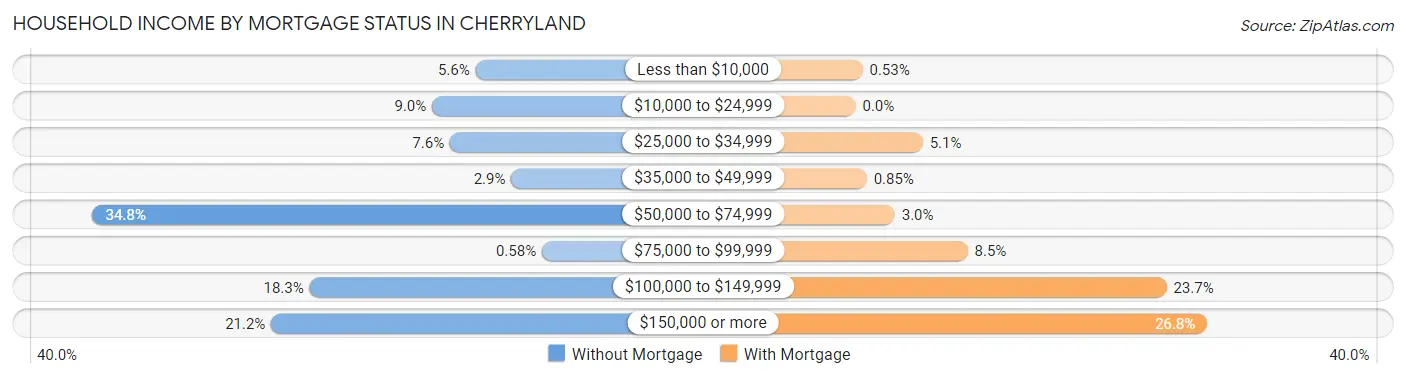
| Household Income | Without Mortgage | With Mortgage |
| Less than $10,000 | 29 (5.6%) | 5 (0.5%) |
| $10,000 to $24,999 | 46 (8.9%) | 0 (0.0%) |
| $25,000 to $34,999 | 39 (7.6%) | 48 (5.1%) |
| $35,000 to $49,999 | 15 (2.9%) | 8 (0.9%) |
| $50,000 to $74,999 | 179 (34.8%) | 28 (3.0%) |
| $75,000 to $99,999 | 3 (0.6%) | 80 (8.5%) |
| $100,000 to $149,999 | 94 (18.3%) | 222 (23.7%) |
| $150,000 or more | 109 (21.2%) | 251 (26.8%) |
| Total | 514 (100.0%) | 937 (100.0%) |
Property Value to Household Income Ratio in Cherryland
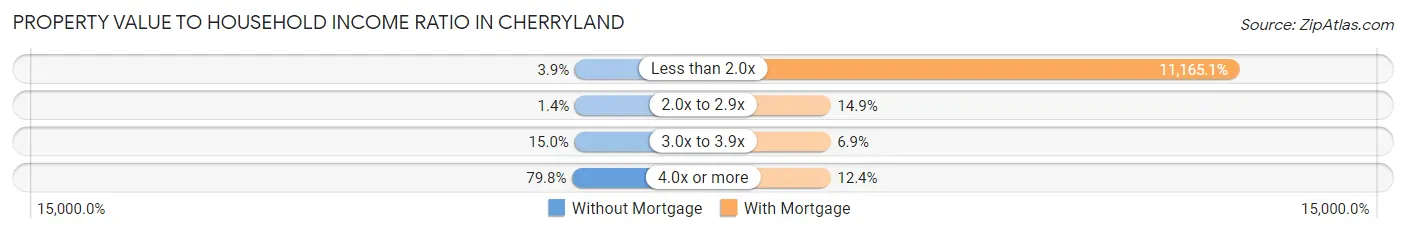
| Value-to-Income Ratio | Without Mortgage | With Mortgage |
| Less than 2.0x | 20 (3.9%) | 104,617 (11,165.1%) |
| 2.0x to 2.9x | 7 (1.4%) | 140 (14.9%) |
| 3.0x to 3.9x | 77 (15.0%) | 65 (6.9%) |
| 4.0x or more | 410 (79.8%) | 116 (12.4%) |
| Total | 514 (100.0%) | 937 (100.0%) |
Real Estate Taxes by Mortgage Status in Cherryland
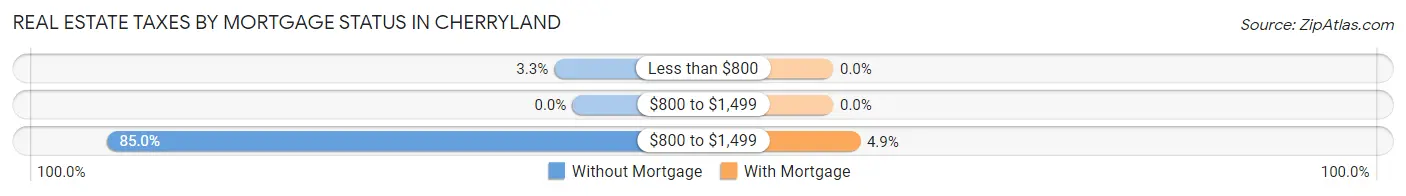
| Property Taxes | Without Mortgage | With Mortgage |
| Less than $800 | 17 (3.3%) | 0 (0.0%) |
| $800 to $1,499 | 0 (0.0%) | 0 (0.0%) |
| $800 to $1,499 | 437 (85.0%) | 46 (4.9%) |
| Total | 514 (100.0%) | 937 (100.0%) |
Health & Disability in Cherryland
Health Insurance Coverage by Age in Cherryland
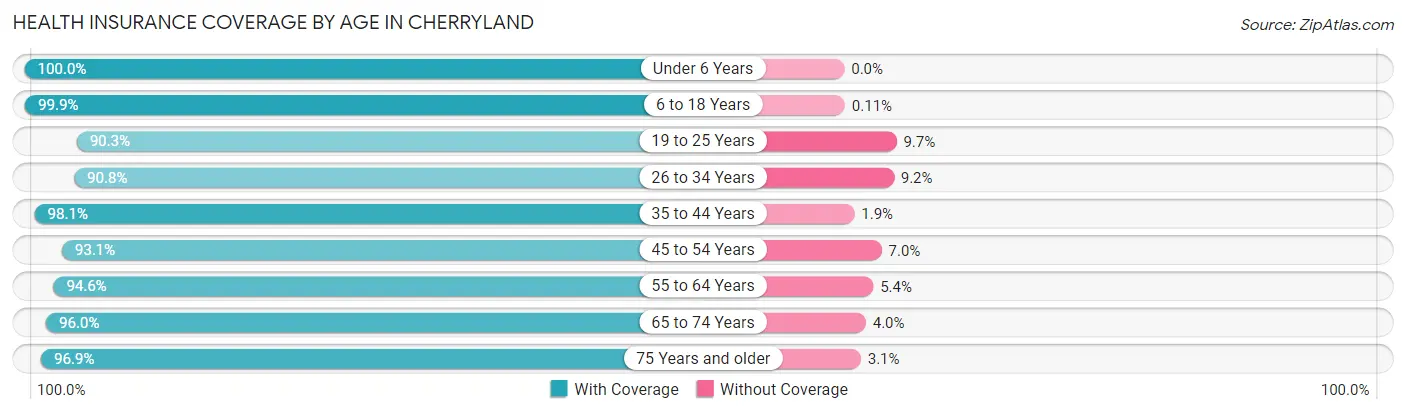
| Age Bracket | With Coverage | Without Coverage |
| Under 6 Years | 835 (100.0%) | 0 (0.0%) |
| 6 to 18 Years | 2,617 (99.9%) | 3 (0.1%) |
| 19 to 25 Years | 1,123 (90.3%) | 121 (9.7%) |
| 26 to 34 Years | 1,603 (90.8%) | 163 (9.2%) |
| 35 to 44 Years | 2,761 (98.1%) | 53 (1.9%) |
| 45 to 54 Years | 1,808 (93.0%) | 135 (7.0%) |
| 55 to 64 Years | 2,002 (94.6%) | 114 (5.4%) |
| 65 to 74 Years | 1,028 (96.0%) | 43 (4.0%) |
| 75 Years and older | 849 (96.9%) | 27 (3.1%) |
| Total | 14,626 (95.7%) | 659 (4.3%) |
Health Insurance Coverage by Citizenship Status in Cherryland
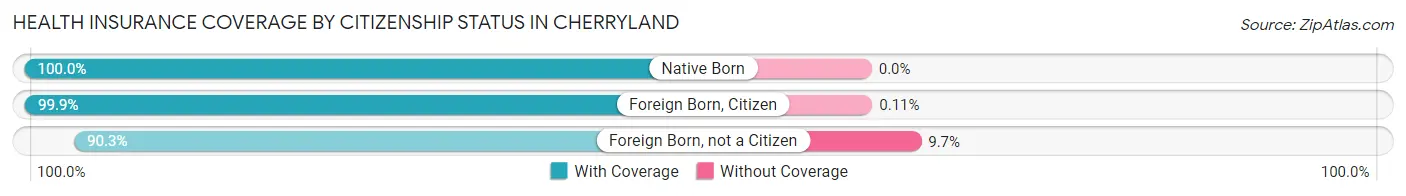
| Citizenship Status | With Coverage | Without Coverage |
| Native Born | 835 (100.0%) | 0 (0.0%) |
| Foreign Born, Citizen | 2,617 (99.9%) | 3 (0.1%) |
| Foreign Born, not a Citizen | 1,123 (90.3%) | 121 (9.7%) |
Health Insurance Coverage by Household Income in Cherryland
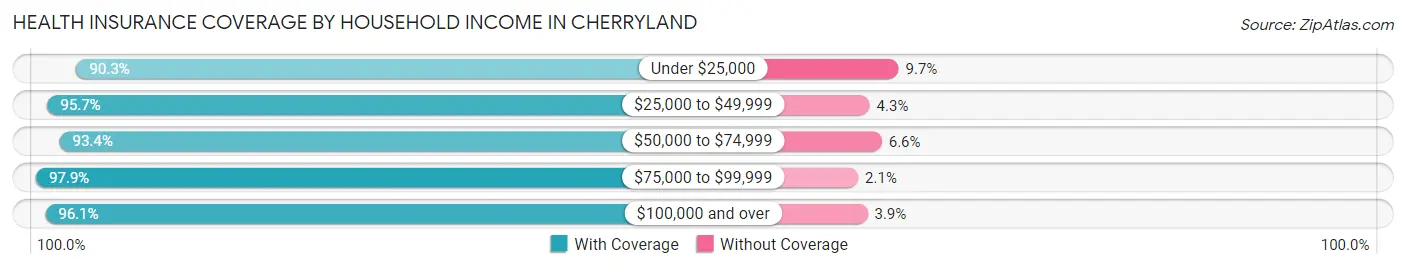
| Household Income | With Coverage | Without Coverage |
| Under $25,000 | 883 (90.3%) | 95 (9.7%) |
| $25,000 to $49,999 | 1,633 (95.7%) | 73 (4.3%) |
| $50,000 to $74,999 | 2,292 (93.4%) | 161 (6.6%) |
| $75,000 to $99,999 | 2,618 (97.9%) | 57 (2.1%) |
| $100,000 and over | 6,768 (96.1%) | 273 (3.9%) |
Public vs Private Health Insurance Coverage by Age in Cherryland
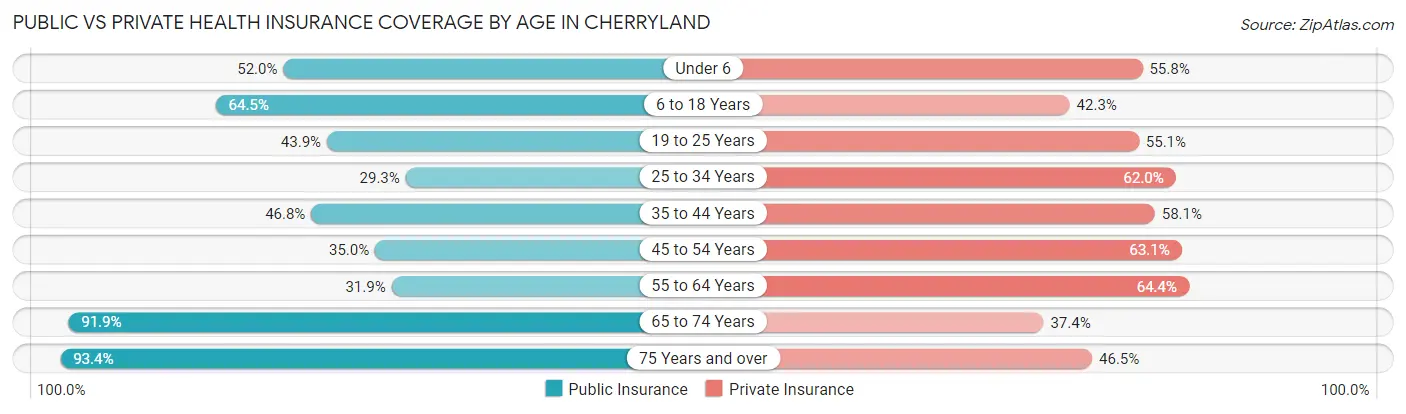
| Age Bracket | Public Insurance | Private Insurance |
| Under 6 | 434 (52.0%) | 466 (55.8%) |
| 6 to 18 Years | 1,691 (64.5%) | 1,108 (42.3%) |
| 19 to 25 Years | 546 (43.9%) | 686 (55.1%) |
| 25 to 34 Years | 517 (29.3%) | 1,094 (62.0%) |
| 35 to 44 Years | 1,317 (46.8%) | 1,635 (58.1%) |
| 45 to 54 Years | 679 (34.9%) | 1,225 (63.0%) |
| 55 to 64 Years | 675 (31.9%) | 1,363 (64.4%) |
| 65 to 74 Years | 984 (91.9%) | 401 (37.4%) |
| 75 Years and over | 818 (93.4%) | 407 (46.5%) |
| Total | 7,661 (50.1%) | 8,385 (54.9%) |
Disability Status by Sex by Age in Cherryland
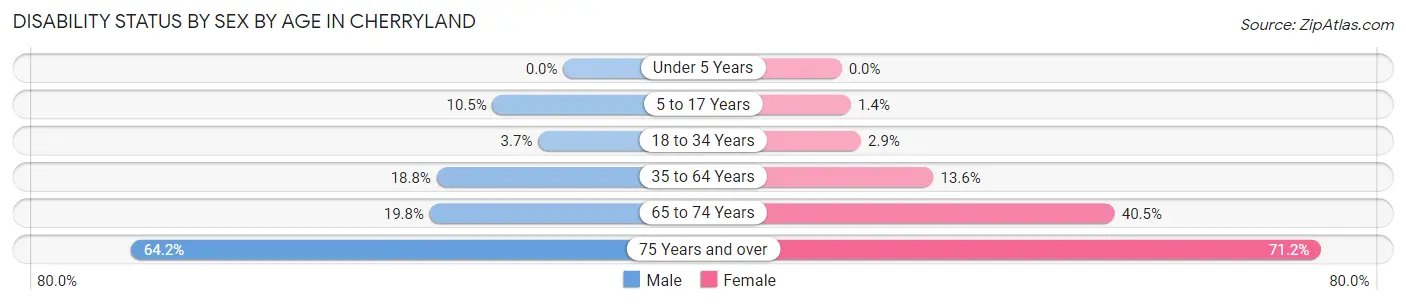
| Age Bracket | Male | Female |
| Under 5 Years | 0 (0.0%) | 0 (0.0%) |
| 5 to 17 Years | 122 (10.5%) | 17 (1.4%) |
| 18 to 34 Years | 57 (3.7%) | 53 (2.9%) |
| 35 to 64 Years | 739 (18.8%) | 401 (13.6%) |
| 65 to 74 Years | 95 (19.8%) | 240 (40.5%) |
| 75 Years and over | 235 (64.2%) | 363 (71.2%) |
Disability Class by Sex by Age in Cherryland
Disability Class: Hearing Difficulty
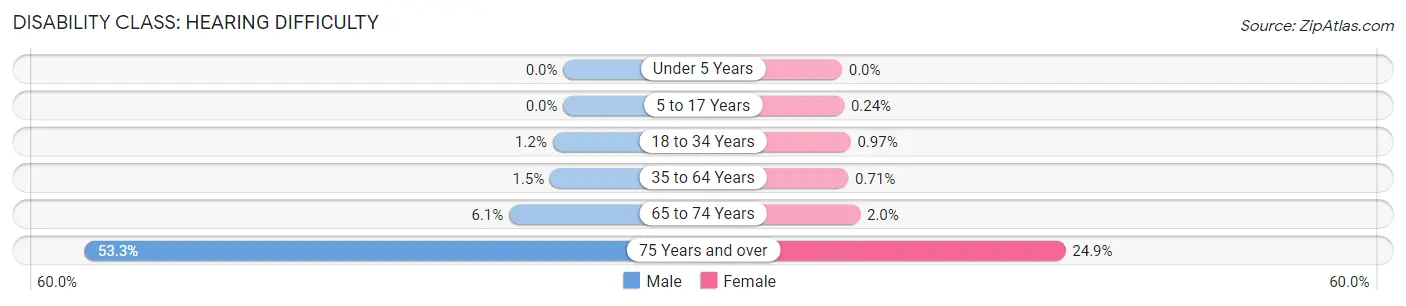
| Age Bracket | Male | Female |
| Under 5 Years | 0 (0.0%) | 0 (0.0%) |
| 5 to 17 Years | 0 (0.0%) | 3 (0.2%) |
| 18 to 34 Years | 18 (1.2%) | 18 (1.0%) |
| 35 to 64 Years | 58 (1.5%) | 21 (0.7%) |
| 65 to 74 Years | 29 (6.0%) | 12 (2.0%) |
| 75 Years and over | 195 (53.3%) | 127 (24.9%) |
Disability Class: Vision Difficulty
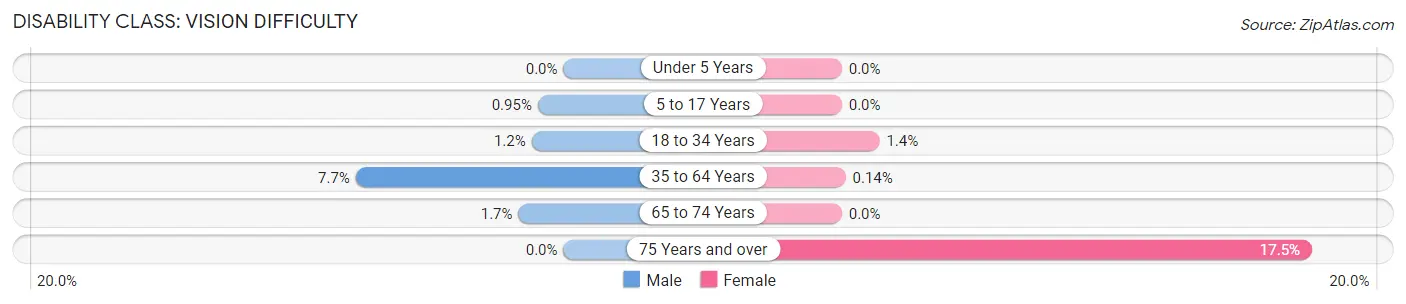
| Age Bracket | Male | Female |
| Under 5 Years | 0 (0.0%) | 0 (0.0%) |
| 5 to 17 Years | 11 (0.9%) | 0 (0.0%) |
| 18 to 34 Years | 18 (1.2%) | 26 (1.4%) |
| 35 to 64 Years | 303 (7.7%) | 4 (0.1%) |
| 65 to 74 Years | 8 (1.7%) | 0 (0.0%) |
| 75 Years and over | 0 (0.0%) | 89 (17.4%) |
Disability Class: Cognitive Difficulty
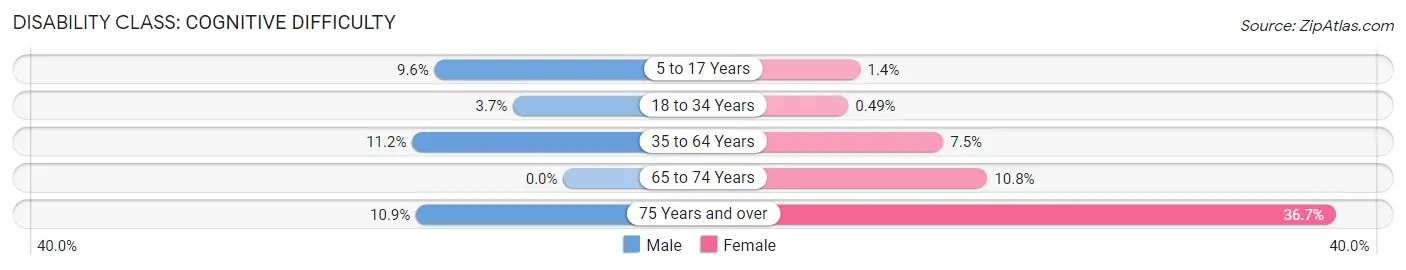
| Age Bracket | Male | Female |
| 5 to 17 Years | 111 (9.6%) | 17 (1.4%) |
| 18 to 34 Years | 57 (3.7%) | 9 (0.5%) |
| 35 to 64 Years | 441 (11.2%) | 222 (7.5%) |
| 65 to 74 Years | 0 (0.0%) | 64 (10.8%) |
| 75 Years and over | 40 (10.9%) | 187 (36.7%) |
Disability Class: Ambulatory Difficulty
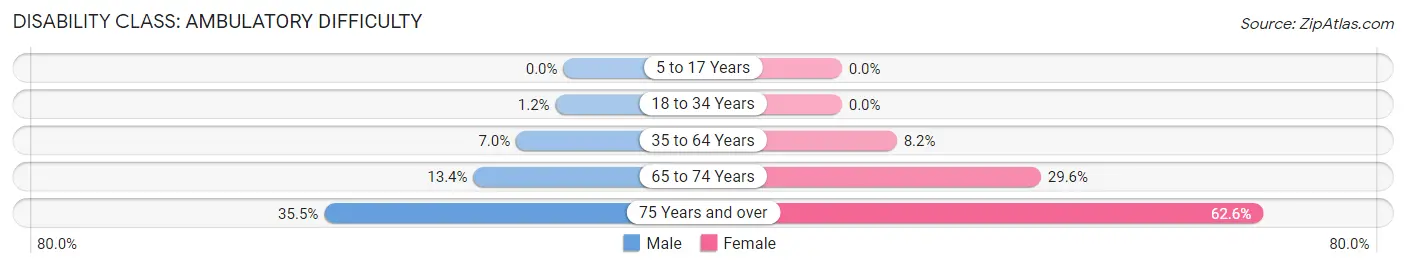
| Age Bracket | Male | Female |
| 5 to 17 Years | 0 (0.0%) | 0 (0.0%) |
| 18 to 34 Years | 18 (1.2%) | 0 (0.0%) |
| 35 to 64 Years | 276 (7.0%) | 240 (8.2%) |
| 65 to 74 Years | 64 (13.4%) | 175 (29.6%) |
| 75 Years and over | 130 (35.5%) | 319 (62.5%) |
Disability Class: Self-Care Difficulty
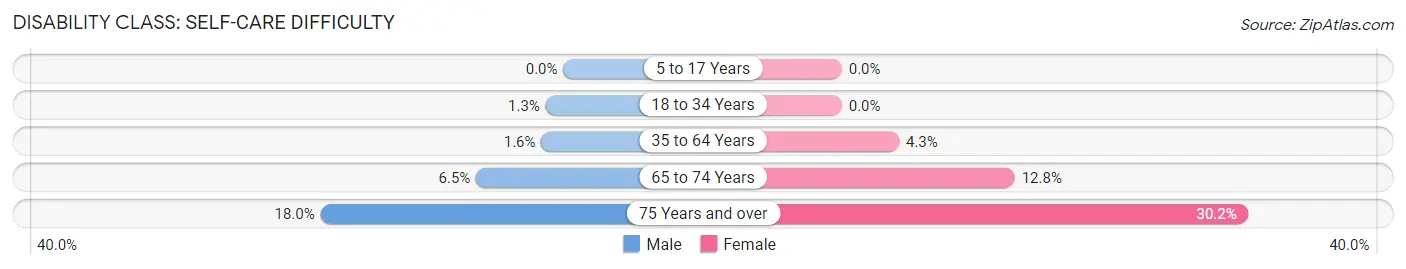
| Age Bracket | Male | Female |
| 5 to 17 Years | 0 (0.0%) | 0 (0.0%) |
| 18 to 34 Years | 20 (1.3%) | 0 (0.0%) |
| 35 to 64 Years | 64 (1.6%) | 125 (4.3%) |
| 65 to 74 Years | 31 (6.5%) | 76 (12.8%) |
| 75 Years and over | 66 (18.0%) | 154 (30.2%) |
Technology Access in Cherryland
Computing Device Access in Cherryland
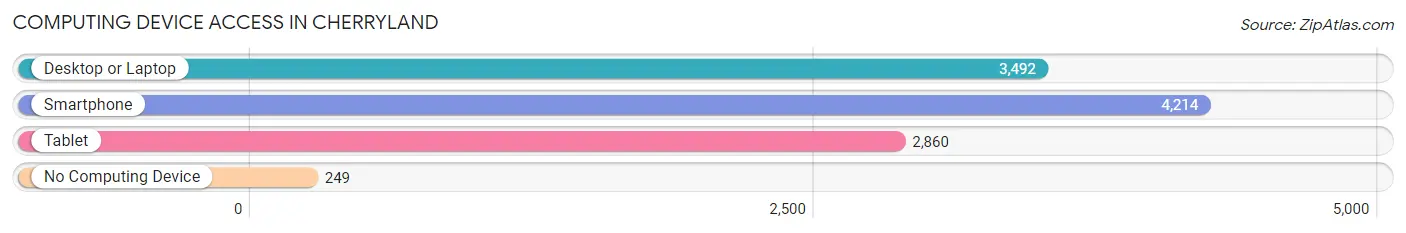
| Device Type | # Households | % Households |
| Desktop or Laptop | 3,492 | 74.0% |
| Smartphone | 4,214 | 89.3% |
| Tablet | 2,860 | 60.6% |
| No Computing Device | 249 | 5.3% |
| Total | 4,720 | 100.0% |
Internet Access in Cherryland
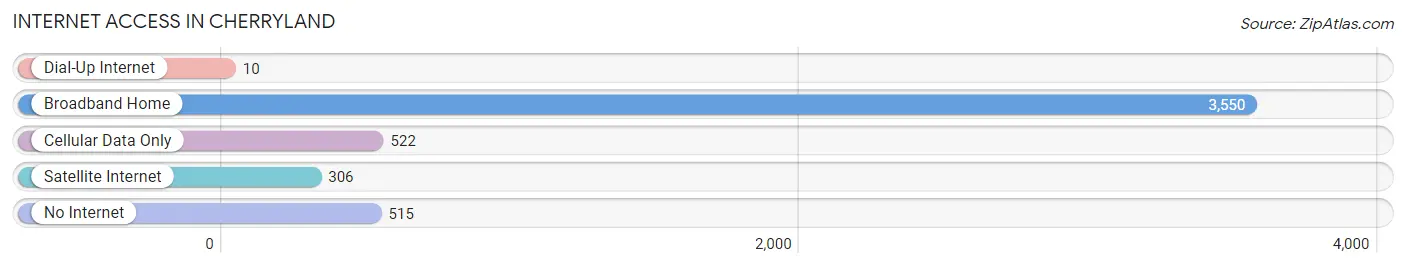
| Internet Type | # Households | % Households |
| Dial-Up Internet | 10 | 0.2% |
| Broadband Home | 3,550 | 75.2% |
| Cellular Data Only | 522 | 11.1% |
| Satellite Internet | 306 | 6.5% |
| No Internet | 515 | 10.9% |
| Total | 4,720 | 100.0% |
Cherryland Summary
Cherryland is a census-designated place (CDP) located in Alameda County, California, United States. It is situated in the San Francisco Bay Area, approximately 10 miles south of Oakland and 25 miles north of San Jose. The population was 14,728 at the 2010 census.
History
Cherryland was originally part of the Rancho San Lorenzo, a Mexican land grant given to José de Jesús Vallejo in 1841. The area was first settled in the 1850s by farmers and ranchers, and was known as "Cherryland" due to the abundance of cherry trees in the area. The first post office was established in 1891.
In the early 1900s, the area was a popular destination for weekend picnics and outings. The area was also home to a number of resorts, including the Cherryland Hotel, which was built in 1906 and served as a popular destination for visitors from San Francisco.
In the 1950s, the area began to experience rapid growth as the population of the Bay Area increased. The area was annexed by the City of Hayward in 1956, and the population continued to grow throughout the 1960s and 1970s.
Geography
Cherryland is located at 37°37'17" North, 122°6'17" West (37.6214, -122.1047). According to the United States Census Bureau, the CDP has a total area of 2.2 square miles (5.7 km2), all of it land.
Economy
Cherryland is primarily a residential community, with a few small businesses located in the area. The largest employer in the area is the Hayward Unified School District, which employs over 1,000 people. Other major employers include the City of Hayward, Kaiser Permanente, and the Alameda County Sheriff's Office.
Demographics
As of the 2010 census, there were 14,728 people, 5,717 households, and 3,845 families residing in the CDP. The population density was 6,717.3 people per square mile (2,597.2/km2). There were 5,945 housing units at an average density of 2,717.3 per square mile (1,051.2/km2). The racial makeup of the CDP was 44.2% White, 11.3% African American, 0.7% Native American, 24.3% Asian, 0.4% Pacific Islander, 14.2% from other races, and 5.1% from two or more races. Hispanic or Latino of any race were 28.3% of the population.
There were 5,717 households, out of which 33.2% had children under the age of 18 living with them, 46.2% were married couples living together, 15.2% had a female householder with no husband present, and 32.2% were non-families. 24.7% of all households were made up of individuals, and 8.2% had someone living alone who was 65 years of age or older. The average household size was 2.56 and the average family size was 3.06.
In the CDP, the population was spread out, with 24.2% under the age of 18, 9.2% from 18 to 24, 30.2% from 25 to 44, 24.3% from 45 to 64, and 12.1% who were 65 years of age or older. The median age was 36 years. For every 100 females, there were 95.2 males. For every 100 females age 18 and over, there were 92.3 males.
The median income for a household in the CDP was $50,945, and the median income for a family was $58,945. Males had a median income of $41,813 versus $35,938 for females. The per capita income for the CDP was $23,945. About 8.2% of families and 10.2% of the population were below the poverty line, including 13.2% of those under age 18 and 8.2% of those age 65 or over.
Common Questions
What is Per Capita Income in Cherryland?
Per Capita income in Cherryland is $31,130.
What is the Median Family Income in Cherryland?
Median Family Income in Cherryland is $84,145.
What is the Median Household income in Cherryland?
Median Household Income in Cherryland is $80,921.
What is Income or Wage Gap in Cherryland?
Income or Wage Gap in Cherryland is 2.1%.
Women in Cherryland earn 97.9 cents for every dollar earned by a man.
What is Family Income Deficit in Cherryland?
Family Income Deficit in Cherryland is $11,315.
Families that are below poverty line in Cherryland earn $11,315 less on average than the poverty threshold level.
What is Inequality or Gini Index in Cherryland?
Inequality or Gini Index in Cherryland is 0.40.
What is the Total Population of Cherryland?
Total Population of Cherryland is 15,499.
What is the Total Male Population of Cherryland?
Total Male Population of Cherryland is 7,964.
What is the Total Female Population of Cherryland?
Total Female Population of Cherryland is 7,535.
What is the Ratio of Males per 100 Females in Cherryland?
There are 105.69 Males per 100 Females in Cherryland.
What is the Ratio of Females per 100 Males in Cherryland?
There are 94.61 Females per 100 Males in Cherryland.
What is the Median Population Age in Cherryland?
Median Population Age in Cherryland is 39.0 Years.
What is the Average Family Size in Cherryland
Average Family Size in Cherryland is 3.8 People.
What is the Average Household Size in Cherryland
Average Household Size in Cherryland is 3.1 People.
How Large is the Labor Force in Cherryland?
There are 7,745 People in the Labor Forcein in Cherryland.
What is the Percentage of People in the Labor Force in Cherryland?
60.1% of People are in the Labor Force in Cherryland.
What is the Unemployment Rate in Cherryland?
Unemployment Rate in Cherryland is 5.3%.