Lancaster, CA Map & Demographics
Lancaster Map
Lancaster Overview
$28,082
PER CAPITA INCOME
$78,572
AVG FAMILY INCOME
$71,367
AVG HOUSEHOLD INCOME
16.5%
WAGE / INCOME GAP [ % ]
83.5¢/ $1
WAGE / INCOME GAP [ $ ]
$13,757
FAMILY INCOME DEFICIT
0.45
INEQUALITY / GINI INDEX
171,465
TOTAL POPULATION
86,180
MALE POPULATION
85,285
FEMALE POPULATION
101.05
MALES / 100 FEMALES
98.96
FEMALES / 100 MALES
33.6
MEDIAN AGE
3.7
AVG FAMILY SIZE
3.2
AVG HOUSEHOLD SIZE
70,581
LABOR FORCE [ PEOPLE ]
54.4%
PERCENT IN LABOR FORCE
7.5%
UNEMPLOYMENT RATE
Lancaster Area Codes
Income in Lancaster
Income Overview in Lancaster
Per Capita Income in Lancaster is $28,082, while median incomes of families and households are $78,572 and $71,367 respectively.
| Characteristic | Number | Measure |
| Per Capita Income | 171,465 | $28,082 |
| Median Family Income | 38,365 | $78,572 |
| Mean Family Income | 38,365 | $96,633 |
| Median Household Income | 52,341 | $71,367 |
| Mean Household Income | 52,341 | $89,183 |
| Income Deficit | 38,365 | $13,757 |
| Wage / Income Gap (%) | 171,465 | 16.50% |
| Wage / Income Gap ($) | 171,465 | 83.50¢ per $1 |
| Gini / Inequality Index | 171,465 | 0.45 |
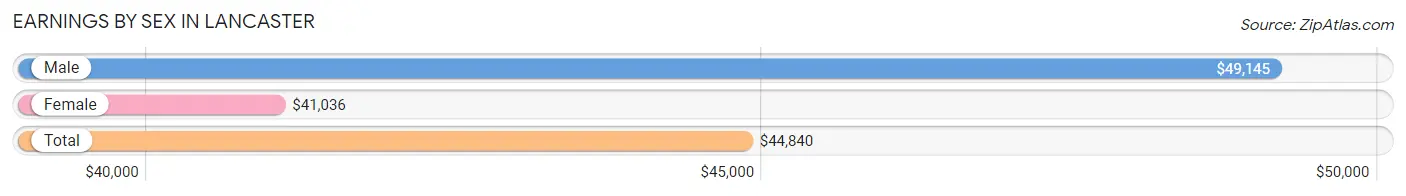
Earnings by Sex in Lancaster
Average Earnings in Lancaster are $44,840, $49,145 for men and $41,036 for women, a difference of 16.5%.
| Sex | Number | Average Earnings |
| Male | 38,006 (53.6%) | $49,145 |
| Female | 32,917 (46.4%) | $41,036 |
| Total | 70,923 (100.0%) | $44,840 |
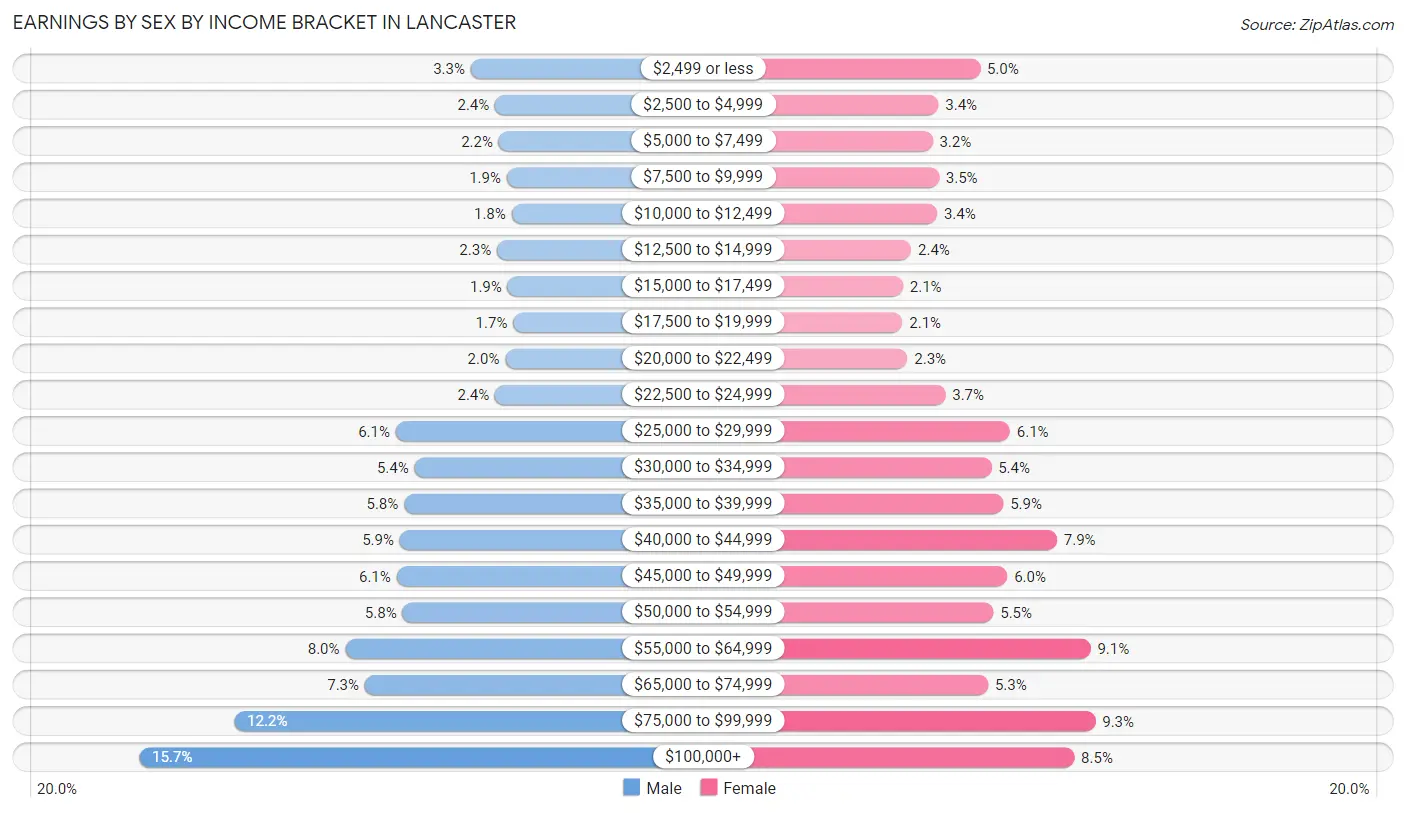
Earnings by Sex by Income Bracket in Lancaster
The most common earnings brackets in Lancaster are $100,000+ for men (5,972 | 15.7%) and $75,000 to $99,999 for women (3,064 | 9.3%).
| Income | Male | Female |
| $2,499 or less | 1,248 (3.3%) | 1,642 (5.0%) |
| $2,500 to $4,999 | 899 (2.4%) | 1,130 (3.4%) |
| $5,000 to $7,499 | 847 (2.2%) | 1,058 (3.2%) |
| $7,500 to $9,999 | 734 (1.9%) | 1,136 (3.5%) |
| $10,000 to $12,499 | 664 (1.8%) | 1,113 (3.4%) |
| $12,500 to $14,999 | 875 (2.3%) | 792 (2.4%) |
| $15,000 to $17,499 | 724 (1.9%) | 692 (2.1%) |
| $17,500 to $19,999 | 642 (1.7%) | 684 (2.1%) |
| $20,000 to $22,499 | 757 (2.0%) | 746 (2.3%) |
| $22,500 to $24,999 | 899 (2.4%) | 1,213 (3.7%) |
| $25,000 to $29,999 | 2,314 (6.1%) | 2,010 (6.1%) |
| $30,000 to $34,999 | 2,050 (5.4%) | 1,781 (5.4%) |
| $35,000 to $39,999 | 2,195 (5.8%) | 1,930 (5.9%) |
| $40,000 to $44,999 | 2,256 (5.9%) | 2,591 (7.9%) |
| $45,000 to $49,999 | 2,304 (6.1%) | 1,978 (6.0%) |
| $50,000 to $54,999 | 2,221 (5.8%) | 1,808 (5.5%) |
| $55,000 to $64,999 | 3,033 (8.0%) | 3,004 (9.1%) |
| $65,000 to $74,999 | 2,755 (7.2%) | 1,742 (5.3%) |
| $75,000 to $99,999 | 4,617 (12.1%) | 3,064 (9.3%) |
| $100,000+ | 5,972 (15.7%) | 2,803 (8.5%) |
| Total | 38,006 (100.0%) | 32,917 (100.0%) |
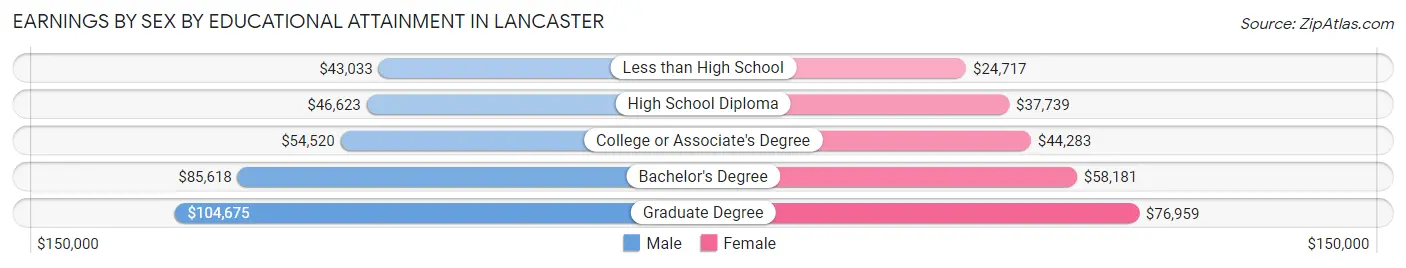
Earnings by Sex by Educational Attainment in Lancaster
Average earnings in Lancaster are $52,944 for men and $44,683 for women, a difference of 15.6%. Men with an educational attainment of graduate degree enjoy the highest average annual earnings of $104,675, while those with less than high school education earn the least with $43,033. Women with an educational attainment of graduate degree earn the most with the average annual earnings of $76,959, while those with less than high school education have the smallest earnings of $24,717.
| Educational Attainment | Male Income | Female Income |
| Less than High School | $43,033 | $24,717 |
| High School Diploma | $46,623 | $37,739 |
| College or Associate's Degree | $54,520 | $44,283 |
| Bachelor's Degree | $85,618 | $58,181 |
| Graduate Degree | $104,675 | $76,959 |
| Total | $52,944 | $44,683 |
Family Income in Lancaster
Family Income Brackets in Lancaster
According to the Lancaster family income data, there are 8,172 families falling into the $100,000 to $149,999 income range, which is the most common income bracket and makes up 21.3% of all families. Conversely, the $10,000 to $14,999 income bracket is the least frequent group with only 921 families (2.4%) belonging to this category.
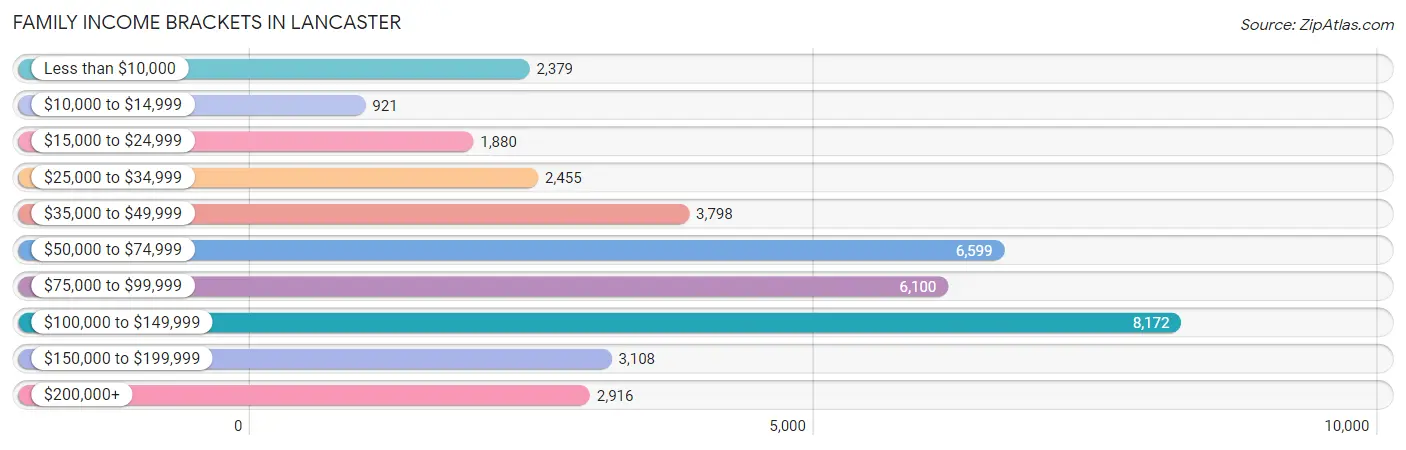
| Income Bracket | # Families | % Families |
| Less than $10,000 | 2,379 | 6.2% |
| $10,000 to $14,999 | 921 | 2.4% |
| $15,000 to $24,999 | 1,880 | 4.9% |
| $25,000 to $34,999 | 2,455 | 6.4% |
| $35,000 to $49,999 | 3,798 | 9.9% |
| $50,000 to $74,999 | 6,599 | 17.2% |
| $75,000 to $99,999 | 6,100 | 15.9% |
| $100,000 to $149,999 | 8,172 | 21.3% |
| $150,000 to $199,999 | 3,108 | 8.1% |
| $200,000+ | 2,916 | 7.6% |
Family Income by Famaliy Size in Lancaster
7+ person families (1,960 | 5.1%) account for the highest median family income in Lancaster with $102,194 per family, while 2-person families (12,195 | 31.8%) have the highest median income of $35,816 per family member.
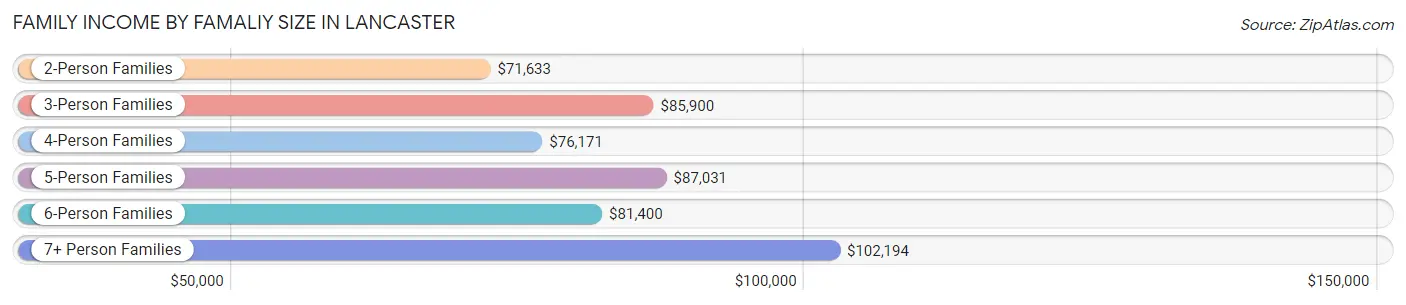
| Income Bracket | # Families | Median Income |
| 2-Person Families | 12,195 (31.8%) | $71,633 |
| 3-Person Families | 8,796 (22.9%) | $85,900 |
| 4-Person Families | 8,105 (21.1%) | $76,171 |
| 5-Person Families | 5,109 (13.3%) | $87,031 |
| 6-Person Families | 2,200 (5.7%) | $81,400 |
| 7+ Person Families | 1,960 (5.1%) | $102,194 |
| Total | 38,365 (100.0%) | $78,572 |
Family Income by Number of Earners in Lancaster
The median family income in Lancaster is $78,572, with families comprising 3+ earners (4,611) having the highest median family income of $130,625, while families with no earners (6,270) have the lowest median family income of $23,453, accounting for 12.0% and 16.3% of families, respectively.
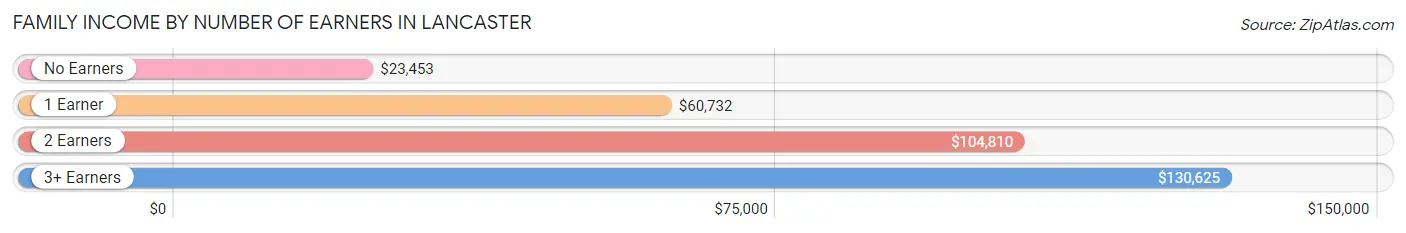
| Number of Earners | # Families | Median Income |
| No Earners | 6,270 (16.3%) | $23,453 |
| 1 Earner | 14,261 (37.2%) | $60,732 |
| 2 Earners | 13,223 (34.5%) | $104,810 |
| 3+ Earners | 4,611 (12.0%) | $130,625 |
| Total | 38,365 (100.0%) | $78,572 |
Household Income in Lancaster
Household Income Brackets in Lancaster
With 9,735 households falling in the category, the $100,000 to $149,999 income range is the most frequent in Lancaster, accounting for 18.6% of all households. In contrast, only 2,617 households (5.0%) fall into the $10,000 to $14,999 income bracket, making it the least populous group.
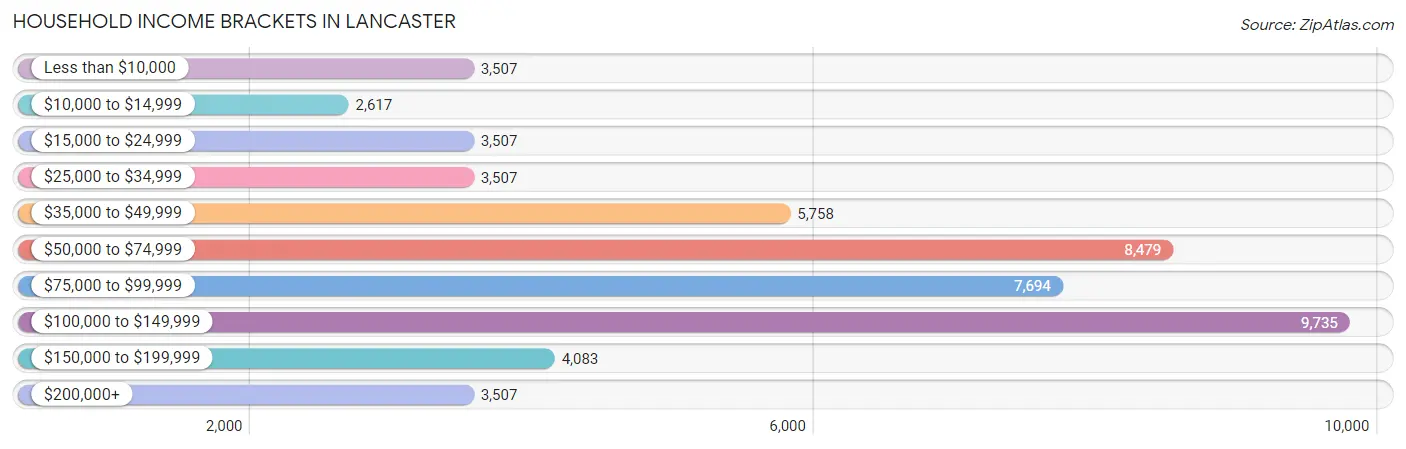
| Income Bracket | # Households | % Households |
| Less than $10,000 | 3,507 | 6.7% |
| $10,000 to $14,999 | 2,617 | 5.0% |
| $15,000 to $24,999 | 3,507 | 6.7% |
| $25,000 to $34,999 | 3,507 | 6.7% |
| $35,000 to $49,999 | 5,758 | 11.0% |
| $50,000 to $74,999 | 8,479 | 16.2% |
| $75,000 to $99,999 | 7,694 | 14.7% |
| $100,000 to $149,999 | 9,735 | 18.6% |
| $150,000 to $199,999 | 4,083 | 7.8% |
| $200,000+ | 3,507 | 6.7% |
Household Income by Householder Age in Lancaster
The median household income in Lancaster is $71,367, with the highest median household income of $82,175 found in the 45 to 64 years age bracket for the primary householder. A total of 21,088 households (40.3%) fall into this category. Meanwhile, the 65+ years age bracket for the primary householder has the lowest median household income of $51,613, with 10,866 households (20.8%) in this group.
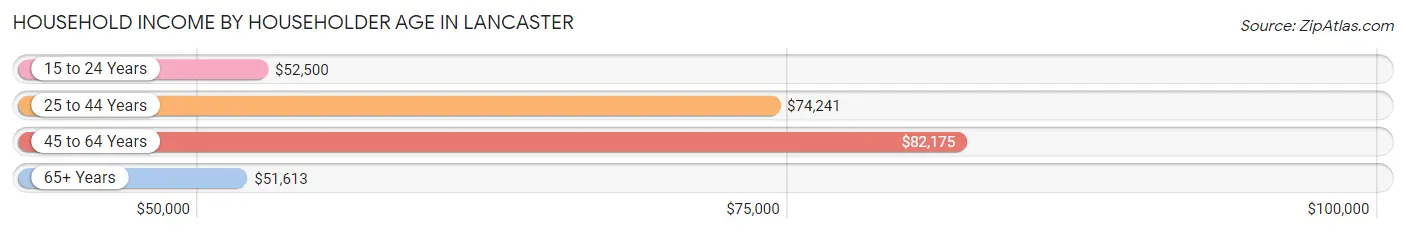
| Income Bracket | # Households | Median Income |
| 15 to 24 Years | 840 (1.6%) | $52,500 |
| 25 to 44 Years | 19,547 (37.3%) | $74,241 |
| 45 to 64 Years | 21,088 (40.3%) | $82,175 |
| 65+ Years | 10,866 (20.8%) | $51,613 |
| Total | 52,341 (100.0%) | $71,367 |
Poverty in Lancaster
Income Below Poverty by Sex and Age in Lancaster
With 16.1% poverty level for males and 19.1% for females among the residents of Lancaster, 5 year old males and 15 year old females are the most vulnerable to poverty, with 380 males (31.7%) and 323 females (28.9%) in their respective age groups living below the poverty level.
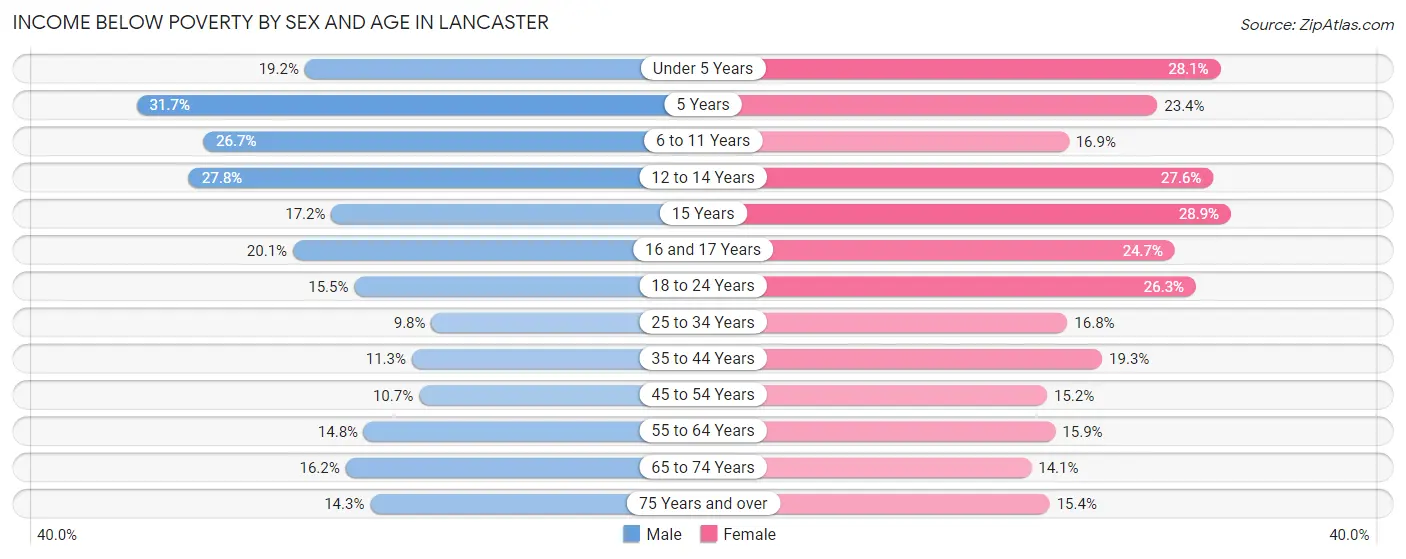
| Age Bracket | Male | Female |
| Under 5 Years | 1,033 (19.2%) | 1,411 (28.1%) |
| 5 Years | 380 (31.7%) | 227 (23.4%) |
| 6 to 11 Years | 2,309 (26.7%) | 1,359 (16.9%) |
| 12 to 14 Years | 1,342 (27.8%) | 1,211 (27.6%) |
| 15 Years | 179 (17.2%) | 323 (28.9%) |
| 16 and 17 Years | 626 (20.1%) | 669 (24.7%) |
| 18 to 24 Years | 1,241 (15.5%) | 1,930 (26.3%) |
| 25 to 34 Years | 1,149 (9.8%) | 2,009 (16.8%) |
| 35 to 44 Years | 1,202 (11.3%) | 2,304 (19.3%) |
| 45 to 54 Years | 1,047 (10.7%) | 1,495 (15.2%) |
| 55 to 64 Years | 1,314 (14.8%) | 1,621 (15.9%) |
| 65 to 74 Years | 868 (16.2%) | 899 (14.1%) |
| 75 Years and over | 406 (14.3%) | 642 (15.4%) |
| Total | 13,096 (16.1%) | 16,100 (19.1%) |
Income Above Poverty by Sex and Age in Lancaster
According to the poverty statistics in Lancaster, males aged 25 to 34 years and females aged 65 to 74 years are the age groups that are most secure financially, with 90.2% of males and 85.9% of females in these age groups living above the poverty line.
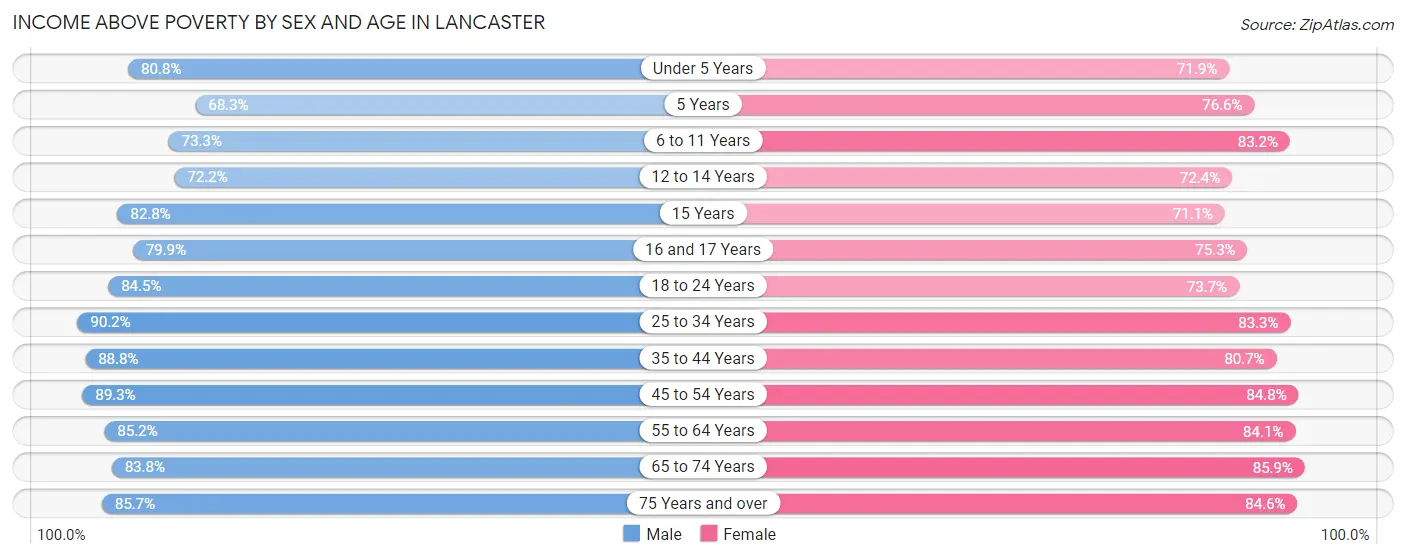
| Age Bracket | Male | Female |
| Under 5 Years | 4,348 (80.8%) | 3,608 (71.9%) |
| 5 Years | 819 (68.3%) | 742 (76.6%) |
| 6 to 11 Years | 6,325 (73.3%) | 6,705 (83.2%) |
| 12 to 14 Years | 3,486 (72.2%) | 3,181 (72.4%) |
| 15 Years | 860 (82.8%) | 795 (71.1%) |
| 16 and 17 Years | 2,491 (79.9%) | 2,037 (75.3%) |
| 18 to 24 Years | 6,754 (84.5%) | 5,410 (73.7%) |
| 25 to 34 Years | 10,579 (90.2%) | 9,987 (83.3%) |
| 35 to 44 Years | 9,485 (88.7%) | 9,616 (80.7%) |
| 45 to 54 Years | 8,718 (89.3%) | 8,312 (84.8%) |
| 55 to 64 Years | 7,560 (85.2%) | 8,598 (84.1%) |
| 65 to 74 Years | 4,499 (83.8%) | 5,492 (85.9%) |
| 75 Years and over | 2,426 (85.7%) | 3,516 (84.6%) |
| Total | 68,350 (83.9%) | 67,999 (80.9%) |
Income Below Poverty Among Married-Couple Families in Lancaster
The poverty statistics for married-couple families in Lancaster show that 8.1% or 1,952 of the total 24,141 families live below the poverty line. Families with 5 or more children have the highest poverty rate of 19.9%, comprising of 113 families. On the other hand, families with no children have the lowest poverty rate of 6.7%, which includes 761 families.
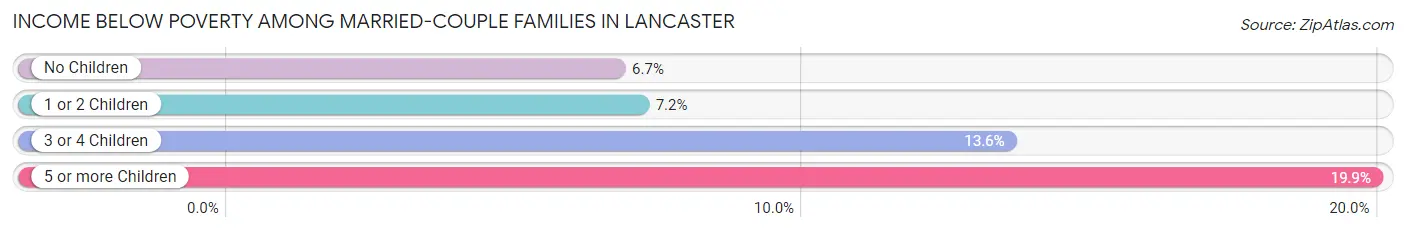
| Children | Above Poverty | Below Poverty |
| No Children | 10,531 (93.3%) | 761 (6.7%) |
| 1 or 2 Children | 8,499 (92.8%) | 654 (7.1%) |
| 3 or 4 Children | 2,705 (86.5%) | 424 (13.6%) |
| 5 or more Children | 454 (80.1%) | 113 (19.9%) |
| Total | 22,189 (91.9%) | 1,952 (8.1%) |
Income Below Poverty Among Single-Parent Households in Lancaster
According to the poverty data in Lancaster, 12.1% or 462 single-father households and 28.5% or 2,966 single-mother households are living below the poverty line. Among single-father households, those with 5 or more children have the highest poverty rate, with 16 households (84.2%) experiencing poverty. Likewise, among single-mother households, those with 5 or more children have the highest poverty rate, with 315 households (68.6%) falling below the poverty line.
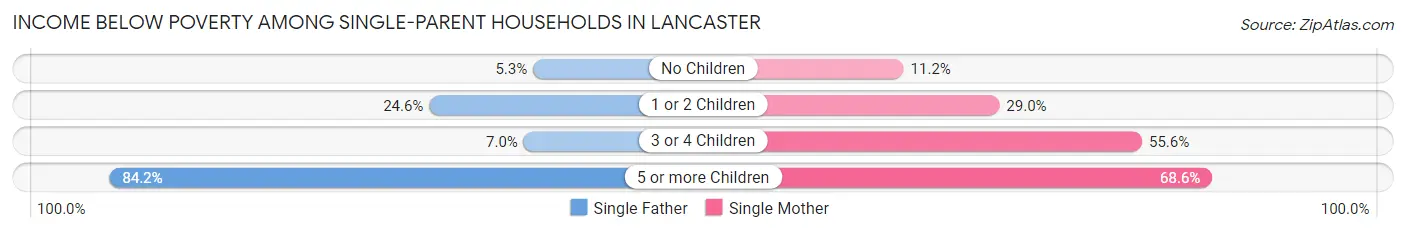
| Children | Single Father | Single Mother |
| No Children | 122 (5.3%) | 370 (11.2%) |
| 1 or 2 Children | 305 (24.6%) | 1,528 (29.0%) |
| 3 or 4 Children | 19 (7.0%) | 753 (55.6%) |
| 5 or more Children | 16 (84.2%) | 315 (68.6%) |
| Total | 462 (12.1%) | 2,966 (28.5%) |
Income Below Poverty Among Married-Couple vs Single-Parent Households in Lancaster
The poverty data for Lancaster shows that 1,952 of the married-couple family households (8.1%) and 3,428 of the single-parent households (24.1%) are living below the poverty level. Within the married-couple family households, those with 5 or more children have the highest poverty rate, with 113 households (19.9%) falling below the poverty line. Among the single-parent households, those with 5 or more children have the highest poverty rate, with 331 household (69.3%) living below poverty.
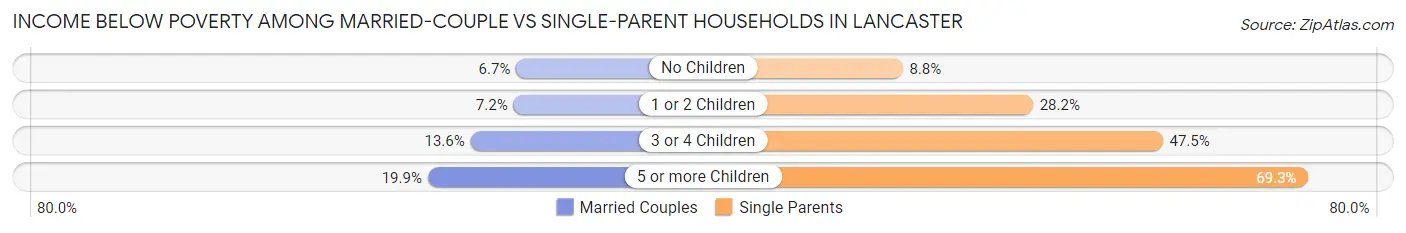
| Children | Married-Couple Families | Single-Parent Households |
| No Children | 761 (6.7%) | 492 (8.8%) |
| 1 or 2 Children | 654 (7.1%) | 1,833 (28.2%) |
| 3 or 4 Children | 424 (13.6%) | 772 (47.5%) |
| 5 or more Children | 113 (19.9%) | 331 (69.3%) |
| Total | 1,952 (8.1%) | 3,428 (24.1%) |
Race in Lancaster
The most populous races in Lancaster are Hispanic or Latino (77,617 | 45.3%), White / Caucasian (71,200 | 41.5%), and Black / African American (36,296 | 21.2%).
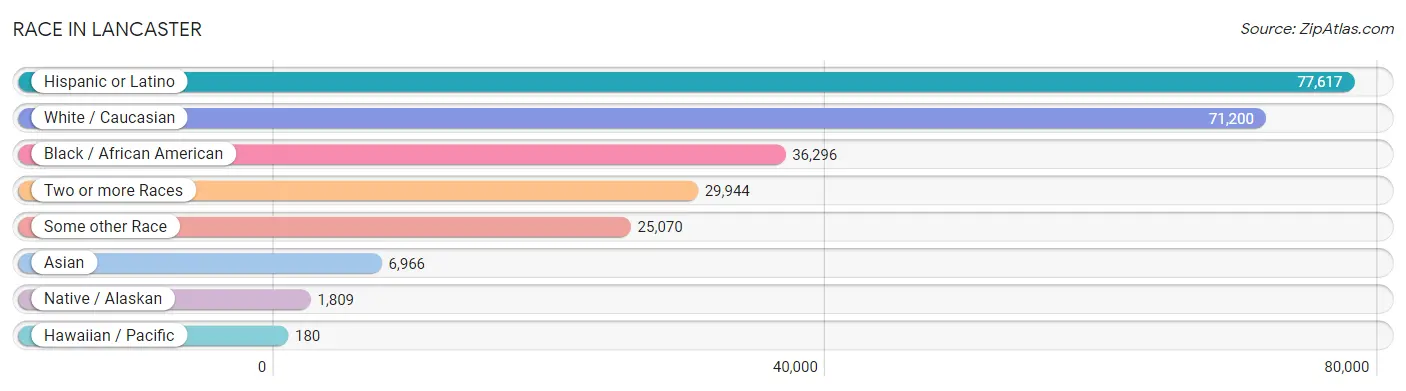
| Race | # Population | % Population |
| Asian | 6,966 | 4.1% |
| Black / African American | 36,296 | 21.2% |
| Hawaiian / Pacific | 180 | 0.1% |
| Hispanic or Latino | 77,617 | 45.3% |
| Native / Alaskan | 1,809 | 1.1% |
| White / Caucasian | 71,200 | 41.5% |
| Two or more Races | 29,944 | 17.5% |
| Some other Race | 25,070 | 14.6% |
| Total | 171,465 | 100.0% |
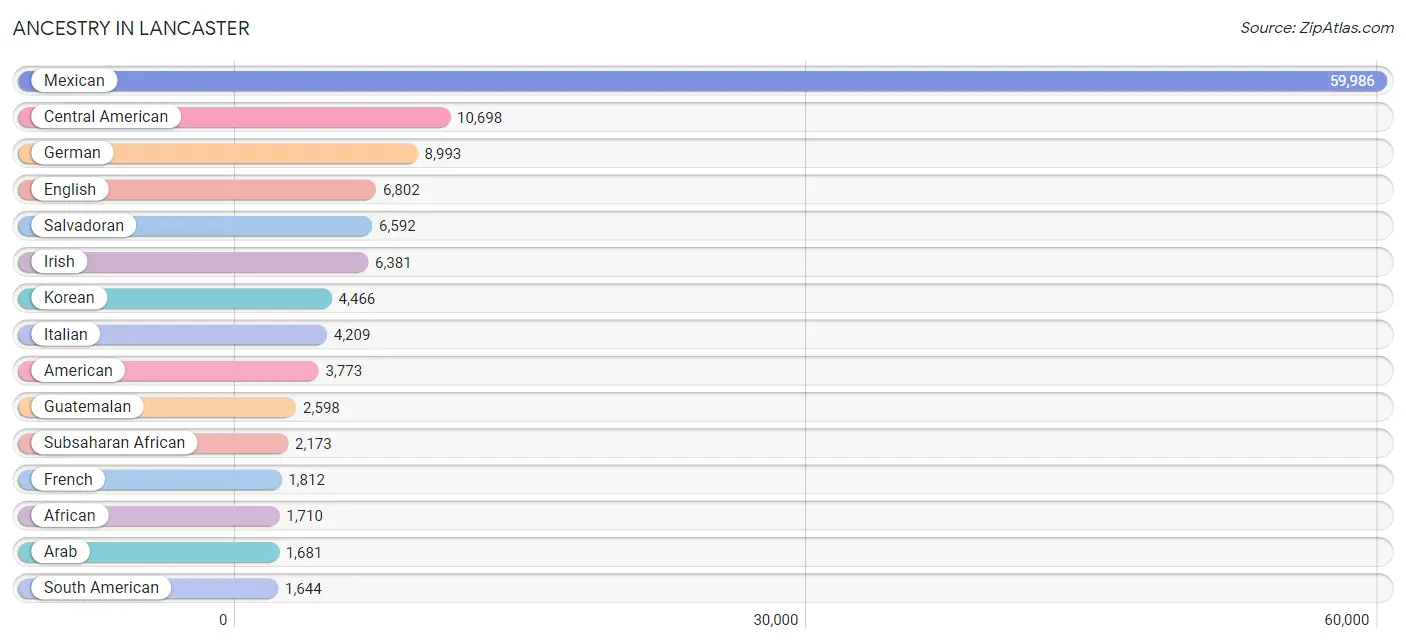
Ancestry in Lancaster
The most populous ancestries reported in Lancaster are Mexican (59,986 | 35.0%), Central American (10,698 | 6.2%), German (8,993 | 5.2%), English (6,802 | 4.0%), and Salvadoran (6,592 | 3.8%), together accounting for 54.3% of all Lancaster residents.
| Ancestry | # Population | % Population |
| Afghan | 68 | 0.0% |
| African | 1,710 | 1.0% |
| Alaska Native | 18 | 0.0% |
| American | 3,773 | 2.2% |
| Apache | 79 | 0.1% |
| Arab | 1,681 | 1.0% |
| Argentinean | 185 | 0.1% |
| Armenian | 111 | 0.1% |
| Assyrian / Chaldean / Syriac | 29 | 0.0% |
| Australian | 414 | 0.2% |
| Austrian | 92 | 0.1% |
| Bangladeshi | 8 | 0.0% |
| Basque | 40 | 0.0% |
| Belgian | 34 | 0.0% |
| Belizean | 407 | 0.2% |
| Bhutanese | 1,031 | 0.6% |
| Blackfeet | 379 | 0.2% |
| Bolivian | 99 | 0.1% |
| Brazilian | 53 | 0.0% |
| British | 478 | 0.3% |
| British West Indian | 3 | 0.0% |
| Bulgarian | 60 | 0.0% |
| Burmese | 729 | 0.4% |
| Cajun | 15 | 0.0% |
| Canadian | 200 | 0.1% |
| Celtic | 9 | 0.0% |
| Central American | 10,698 | 6.2% |
| Central American Indian | 668 | 0.4% |
| Cherokee | 641 | 0.4% |
| Chickasaw | 149 | 0.1% |
| Chilean | 432 | 0.3% |
| Chippewa | 18 | 0.0% |
| Choctaw | 225 | 0.1% |
| Colombian | 216 | 0.1% |
| Costa Rican | 66 | 0.0% |
| Creek | 61 | 0.0% |
| Croatian | 28 | 0.0% |
| Cuban | 434 | 0.3% |
| Czech | 67 | 0.0% |
| Czechoslovakian | 3 | 0.0% |
| Danish | 177 | 0.1% |
| Dominican | 12 | 0.0% |
| Dutch | 869 | 0.5% |
| Eastern European | 80 | 0.1% |
| Ecuadorian | 120 | 0.1% |
| Egyptian | 580 | 0.3% |
| English | 6,802 | 4.0% |
| Ethiopian | 23 | 0.0% |
| European | 1,099 | 0.6% |
| Filipino | 58 | 0.0% |
| Finnish | 118 | 0.1% |
| French | 1,812 | 1.1% |
| French Canadian | 150 | 0.1% |
| German | 8,993 | 5.2% |
| Greek | 428 | 0.3% |
| Guamanian / Chamorro | 203 | 0.1% |
| Guatemalan | 2,598 | 1.5% |
| Guyanese | 10 | 0.0% |
| Haitian | 46 | 0.0% |
| Honduran | 626 | 0.4% |
| Hungarian | 174 | 0.1% |
| Icelander | 18 | 0.0% |
| Indian (Asian) | 910 | 0.5% |
| Indonesian | 28 | 0.0% |
| Iranian | 126 | 0.1% |
| Irish | 6,381 | 3.7% |
| Iroquois | 19 | 0.0% |
| Israeli | 212 | 0.1% |
| Italian | 4,209 | 2.5% |
| Jamaican | 148 | 0.1% |
| Japanese | 225 | 0.1% |
| Jordanian | 146 | 0.1% |
| Kiowa | 19 | 0.0% |
| Korean | 4,466 | 2.6% |
| Laotian | 125 | 0.1% |
| Lebanese | 83 | 0.1% |
| Liberian | 23 | 0.0% |
| Lithuanian | 26 | 0.0% |
| Luxembourger | 11 | 0.0% |
| Malaysian | 77 | 0.0% |
| Mexican | 59,986 | 35.0% |
| Mexican American Indian | 872 | 0.5% |
| Mongolian | 12 | 0.0% |
| Moroccan | 3 | 0.0% |
| Native Hawaiian | 177 | 0.1% |
| Navajo | 93 | 0.1% |
| Nicaraguan | 630 | 0.4% |
| Nigerian | 371 | 0.2% |
| Northern European | 324 | 0.2% |
| Norwegian | 783 | 0.5% |
| Osage | 58 | 0.0% |
| Paiute | 38 | 0.0% |
| Pakistani | 157 | 0.1% |
| Panamanian | 107 | 0.1% |
| Paraguayan | 5 | 0.0% |
| Pennsylvania German | 11 | 0.0% |
| Peruvian | 519 | 0.3% |
| Pima | 2 | 0.0% |
| Polish | 1,295 | 0.8% |
| Portuguese | 324 | 0.2% |
| Pueblo | 23 | 0.0% |
| Puerto Rican | 1,145 | 0.7% |
| Romanian | 186 | 0.1% |
| Russian | 488 | 0.3% |
| Salvadoran | 6,592 | 3.8% |
| Samoan | 85 | 0.1% |
| Scandinavian | 329 | 0.2% |
| Scotch-Irish | 510 | 0.3% |
| Scottish | 1,421 | 0.8% |
| Seminole | 319 | 0.2% |
| Serbian | 16 | 0.0% |
| Sioux | 43 | 0.0% |
| Slavic | 53 | 0.0% |
| Slovak | 26 | 0.0% |
| South American | 1,644 | 1.0% |
| South American Indian | 46 | 0.0% |
| Spaniard | 454 | 0.3% |
| Spanish | 875 | 0.5% |
| Spanish American | 19 | 0.0% |
| Sri Lankan | 420 | 0.2% |
| Subsaharan African | 2,173 | 1.3% |
| Swedish | 749 | 0.4% |
| Swiss | 378 | 0.2% |
| Syrian | 290 | 0.2% |
| Thai | 1,123 | 0.6% |
| Tongan | 4 | 0.0% |
| Trinidadian and Tobagonian | 35 | 0.0% |
| Turkish | 19 | 0.0% |
| U.S. Virgin Islander | 27 | 0.0% |
| Ugandan | 10 | 0.0% |
| Ukrainian | 49 | 0.0% |
| Uruguayan | 35 | 0.0% |
| Ute | 106 | 0.1% |
| Venezuelan | 33 | 0.0% |
| Vietnamese | 27 | 0.0% |
| Welsh | 541 | 0.3% |
| West Indian | 27 | 0.0% |
| Yaqui | 20 | 0.0% |
| Yugoslavian | 34 | 0.0% |
| Zimbabwean | 16 | 0.0% | View All 140 Rows |
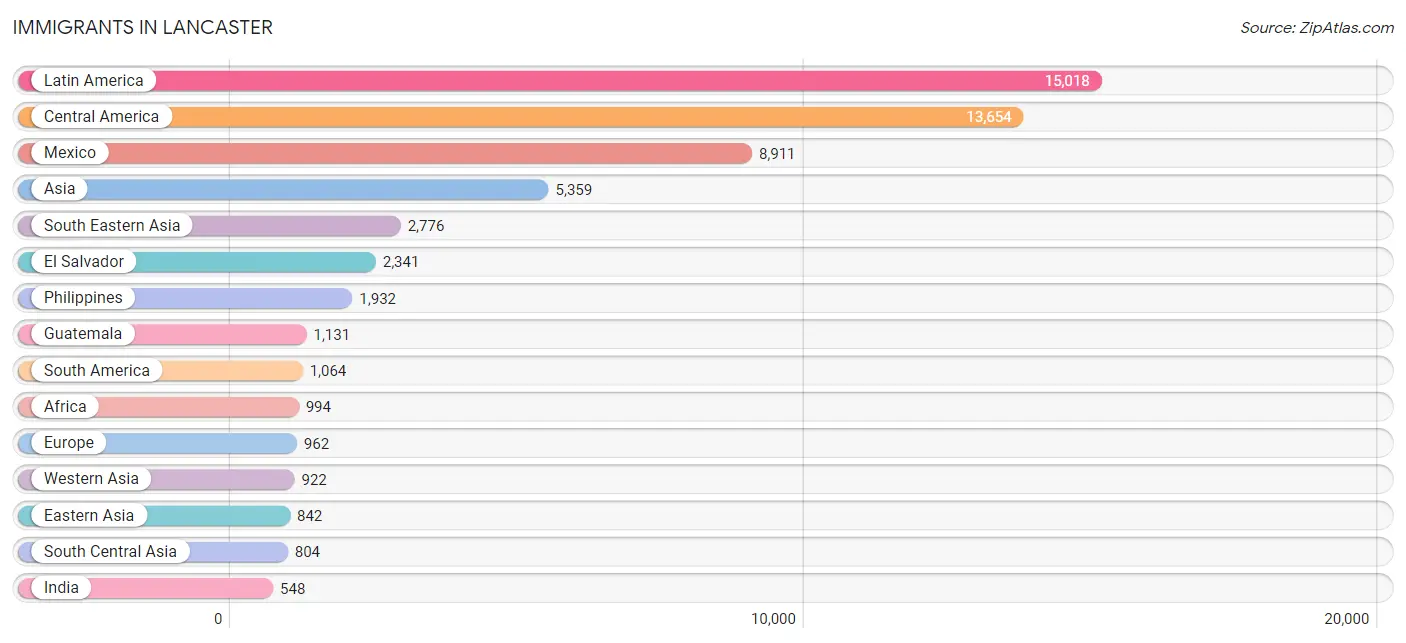
Immigrants in Lancaster
The most numerous immigrant groups reported in Lancaster came from Latin America (15,018 | 8.8%), Central America (13,654 | 8.0%), Mexico (8,911 | 5.2%), Asia (5,359 | 3.1%), and South Eastern Asia (2,776 | 1.6%), together accounting for 26.7% of all Lancaster residents.
| Immigration Origin | # Population | % Population |
| Afghanistan | 100 | 0.1% |
| Africa | 994 | 0.6% |
| Argentina | 144 | 0.1% |
| Armenia | 29 | 0.0% |
| Asia | 5,359 | 3.1% |
| Australia | 299 | 0.2% |
| Austria | 2 | 0.0% |
| Bangladesh | 22 | 0.0% |
| Belgium | 21 | 0.0% |
| Belize | 383 | 0.2% |
| Brazil | 50 | 0.0% |
| Cambodia | 208 | 0.1% |
| Cameroon | 47 | 0.0% |
| Canada | 171 | 0.1% |
| Caribbean | 300 | 0.2% |
| Central America | 13,654 | 8.0% |
| Chile | 186 | 0.1% |
| China | 441 | 0.3% |
| Colombia | 165 | 0.1% |
| Costa Rica | 15 | 0.0% |
| Croatia | 4 | 0.0% |
| Cuba | 138 | 0.1% |
| Czechoslovakia | 22 | 0.0% |
| Denmark | 15 | 0.0% |
| Eastern Africa | 70 | 0.0% |
| Eastern Asia | 842 | 0.5% |
| Eastern Europe | 135 | 0.1% |
| Ecuador | 67 | 0.0% |
| Egypt | 434 | 0.3% |
| El Salvador | 2,341 | 1.4% |
| England | 75 | 0.0% |
| Ethiopia | 8 | 0.0% |
| Europe | 962 | 0.6% |
| Germany | 153 | 0.1% |
| Ghana | 18 | 0.0% |
| Greece | 36 | 0.0% |
| Guatemala | 1,131 | 0.7% |
| Guyana | 17 | 0.0% |
| Haiti | 36 | 0.0% |
| Honduras | 336 | 0.2% |
| Hong Kong | 54 | 0.0% |
| Hungary | 32 | 0.0% |
| India | 548 | 0.3% |
| Indonesia | 81 | 0.1% |
| Iran | 42 | 0.0% |
| Iraq | 43 | 0.0% |
| Israel | 138 | 0.1% |
| Italy | 169 | 0.1% |
| Jamaica | 95 | 0.1% |
| Japan | 133 | 0.1% |
| Jordan | 206 | 0.1% |
| Kenya | 32 | 0.0% |
| Korea | 268 | 0.2% |
| Kuwait | 26 | 0.0% |
| Laos | 34 | 0.0% |
| Latin America | 15,018 | 8.8% |
| Malaysia | 12 | 0.0% |
| Mexico | 8,911 | 5.2% |
| Micronesia | 1 | 0.0% |
| Middle Africa | 47 | 0.0% |
| Nepal | 92 | 0.1% |
| Netherlands | 75 | 0.0% |
| Nicaragua | 474 | 0.3% |
| Nigeria | 168 | 0.1% |
| Northern Africa | 469 | 0.3% |
| Northern Europe | 362 | 0.2% |
| Norway | 7 | 0.0% |
| Oceania | 326 | 0.2% |
| Panama | 63 | 0.0% |
| Peru | 380 | 0.2% |
| Philippines | 1,932 | 1.1% |
| Poland | 10 | 0.0% |
| Portugal | 9 | 0.0% |
| Romania | 8 | 0.0% |
| Russia | 26 | 0.0% |
| Scotland | 49 | 0.0% |
| Serbia | 19 | 0.0% |
| Singapore | 109 | 0.1% |
| South Africa | 15 | 0.0% |
| South America | 1,064 | 0.6% |
| South Central Asia | 804 | 0.5% |
| South Eastern Asia | 2,776 | 1.6% |
| Southern Europe | 214 | 0.1% |
| Syria | 431 | 0.3% |
| Taiwan | 85 | 0.1% |
| Thailand | 76 | 0.0% |
| Trinidad and Tobago | 9 | 0.0% |
| Uganda | 10 | 0.0% |
| Ukraine | 4 | 0.0% |
| Uruguay | 17 | 0.0% |
| Venezuela | 33 | 0.0% |
| Vietnam | 304 | 0.2% |
| Western Africa | 186 | 0.1% |
| Western Asia | 922 | 0.5% |
| Western Europe | 251 | 0.2% |
| Yemen | 28 | 0.0% |
| Zimbabwe | 16 | 0.0% | View All 97 Rows |
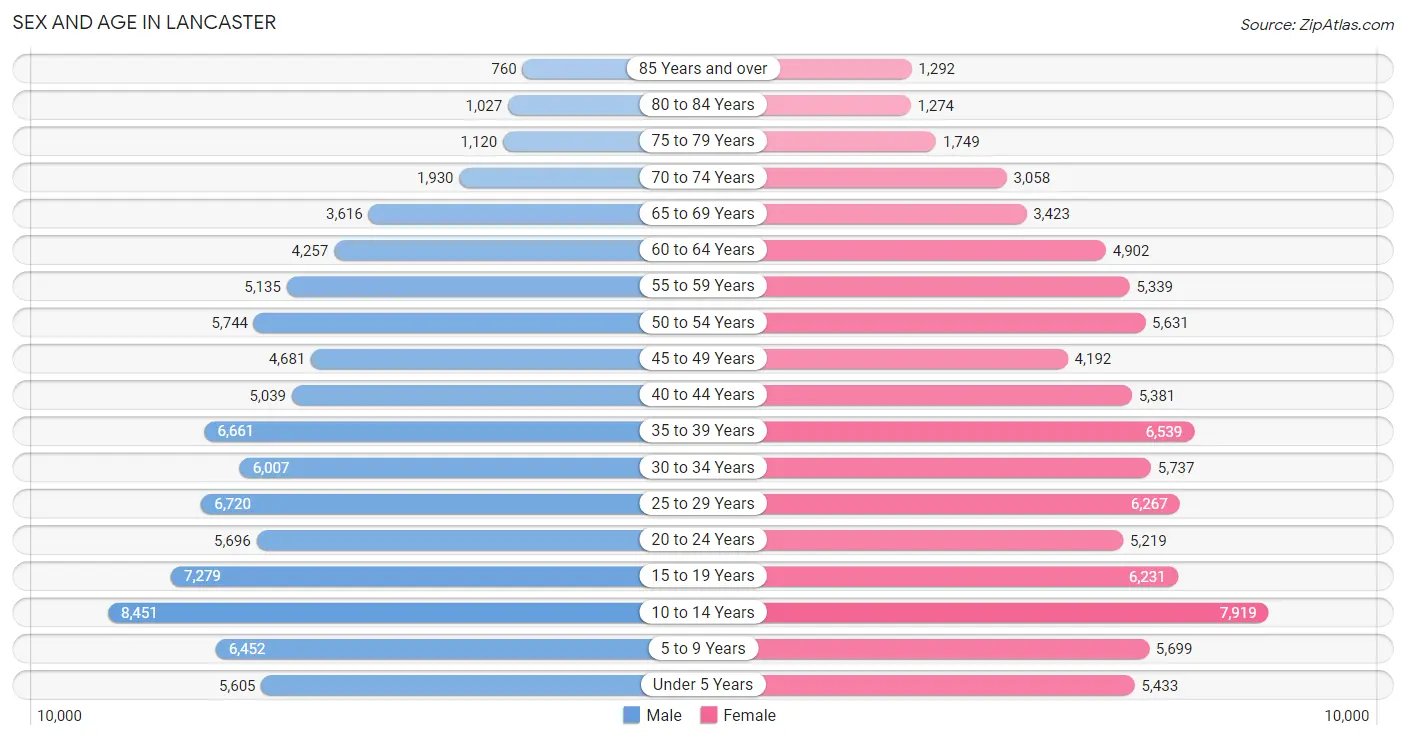
Sex and Age in Lancaster
Sex and Age in Lancaster
The most populous age groups in Lancaster are 10 to 14 Years (8,451 | 9.8%) for men and 10 to 14 Years (7,919 | 9.3%) for women.
| Age Bracket | Male | Female |
| Under 5 Years | 5,605 (6.5%) | 5,433 (6.4%) |
| 5 to 9 Years | 6,452 (7.5%) | 5,699 (6.7%) |
| 10 to 14 Years | 8,451 (9.8%) | 7,919 (9.3%) |
| 15 to 19 Years | 7,279 (8.5%) | 6,231 (7.3%) |
| 20 to 24 Years | 5,696 (6.6%) | 5,219 (6.1%) |
| 25 to 29 Years | 6,720 (7.8%) | 6,267 (7.3%) |
| 30 to 34 Years | 6,007 (7.0%) | 5,737 (6.7%) |
| 35 to 39 Years | 6,661 (7.7%) | 6,539 (7.7%) |
| 40 to 44 Years | 5,039 (5.9%) | 5,381 (6.3%) |
| 45 to 49 Years | 4,681 (5.4%) | 4,192 (4.9%) |
| 50 to 54 Years | 5,744 (6.7%) | 5,631 (6.6%) |
| 55 to 59 Years | 5,135 (6.0%) | 5,339 (6.3%) |
| 60 to 64 Years | 4,257 (4.9%) | 4,902 (5.8%) |
| 65 to 69 Years | 3,616 (4.2%) | 3,423 (4.0%) |
| 70 to 74 Years | 1,930 (2.2%) | 3,058 (3.6%) |
| 75 to 79 Years | 1,120 (1.3%) | 1,749 (2.1%) |
| 80 to 84 Years | 1,027 (1.2%) | 1,274 (1.5%) |
| 85 Years and over | 760 (0.9%) | 1,292 (1.5%) |
| Total | 86,180 (100.0%) | 85,285 (100.0%) |
Families and Households in Lancaster
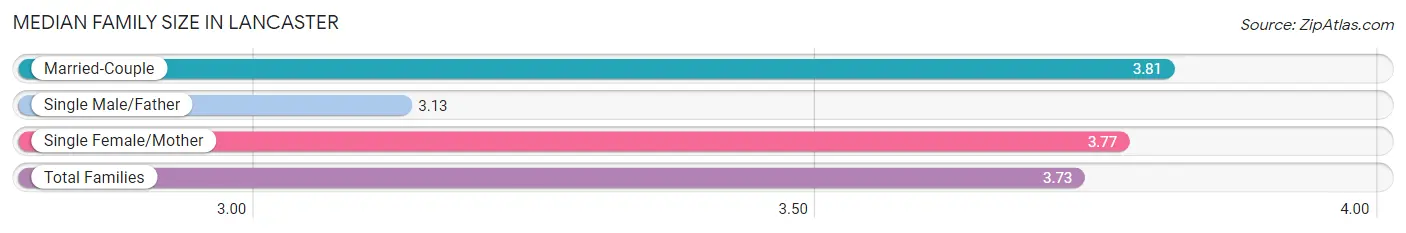
Median Family Size in Lancaster
The median family size in Lancaster is 3.73 persons per family, with married-couple families (24,141 | 62.9%) accounting for the largest median family size of 3.81 persons per family. On the other hand, single male/father families (3,830 | 10.0%) represent the smallest median family size with 3.13 persons per family.
| Family Type | # Families | Family Size |
| Married-Couple | 24,141 (62.9%) | 3.81 |
| Single Male/Father | 3,830 (10.0%) | 3.13 |
| Single Female/Mother | 10,394 (27.1%) | 3.77 |
| Total Families | 38,365 (100.0%) | 3.73 |
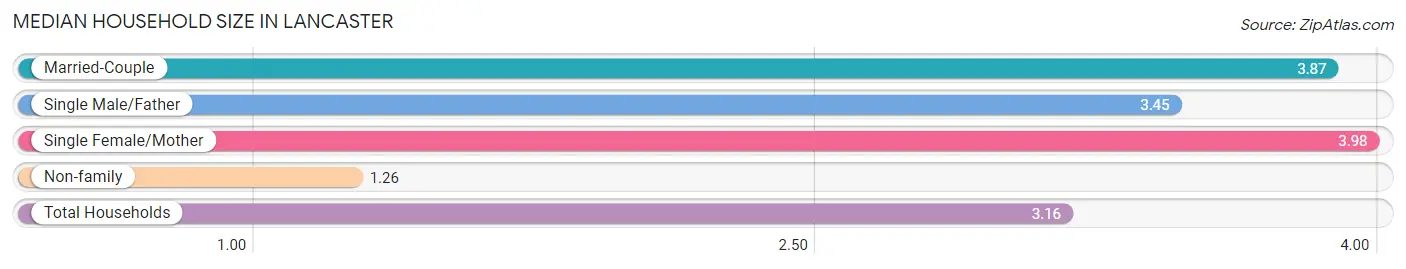
Median Household Size in Lancaster
The median household size in Lancaster is 3.16 persons per household, with single female/mother households (10,394 | 19.9%) accounting for the largest median household size of 3.98 persons per household. non-family households (13,976 | 26.7%) represent the smallest median household size with 1.26 persons per household.
| Household Type | # Households | Household Size |
| Married-Couple | 24,141 (46.1%) | 3.87 |
| Single Male/Father | 3,830 (7.3%) | 3.45 |
| Single Female/Mother | 10,394 (19.9%) | 3.98 |
| Non-family | 13,976 (26.7%) | 1.26 |
| Total Households | 52,341 (100.0%) | 3.16 |
Household Size by Marriage Status in Lancaster
Out of a total of 52,341 households in Lancaster, 38,365 (73.3%) are family households, while 13,976 (26.7%) are nonfamily households. The most numerous type of family households are 2-person households, comprising 11,154, and the most common type of nonfamily households are 1-person households, comprising 11,464.
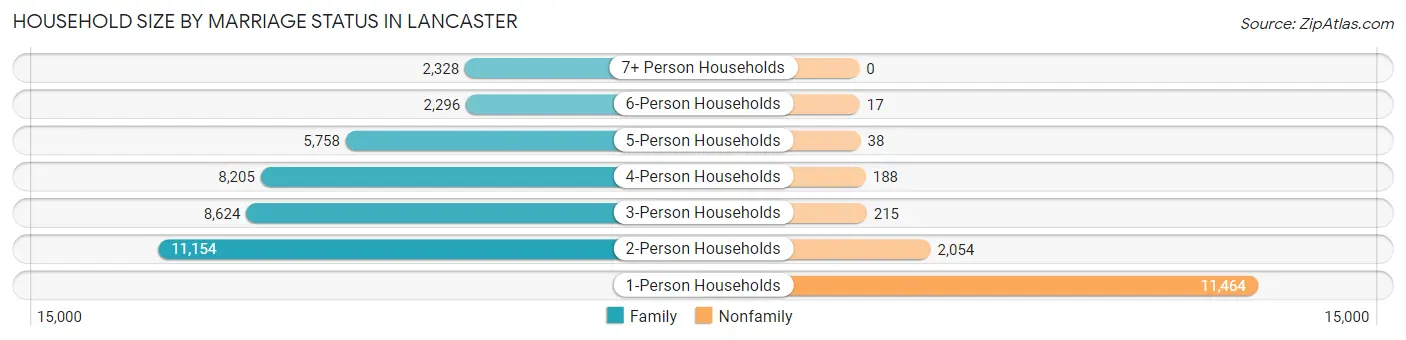
| Household Size | Family Households | Nonfamily Households |
| 1-Person Households | - | 11,464 (21.9%) |
| 2-Person Households | 11,154 (21.3%) | 2,054 (3.9%) |
| 3-Person Households | 8,624 (16.5%) | 215 (0.4%) |
| 4-Person Households | 8,205 (15.7%) | 188 (0.4%) |
| 5-Person Households | 5,758 (11.0%) | 38 (0.1%) |
| 6-Person Households | 2,296 (4.4%) | 17 (0.0%) |
| 7+ Person Households | 2,328 (4.4%) | 0 (0.0%) |
| Total | 38,365 (73.3%) | 13,976 (26.7%) |
Female Fertility in Lancaster
Fertility by Age in Lancaster
Average fertility rate in Lancaster is 43.0 births per 1,000 women. Women in the age bracket of 20 to 34 years have the highest fertility rate with 75.0 births per 1,000 women. Women in the age bracket of 20 to 34 years acount for 73.4% of all women with births.
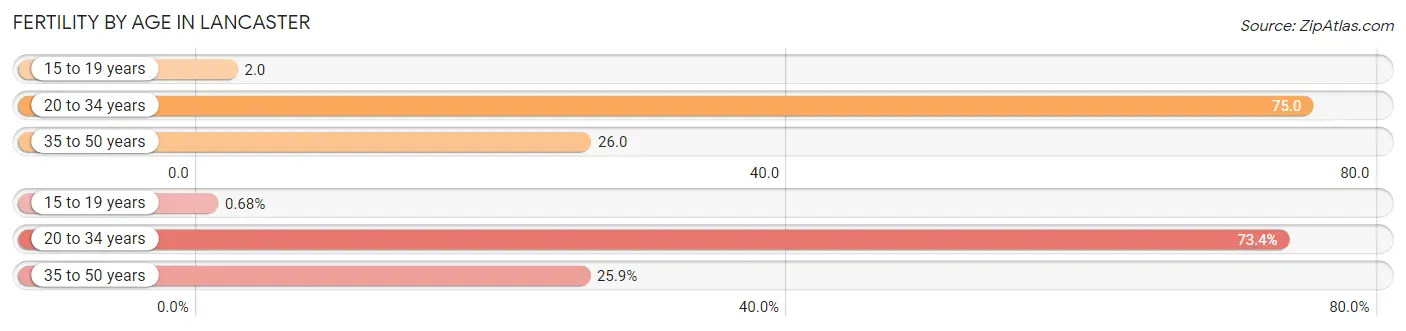
| Age Bracket | Women with Births | Births / 1,000 Women |
| 15 to 19 years | 12 (0.7%) | 2.0 |
| 20 to 34 years | 1,291 (73.4%) | 75.0 |
| 35 to 50 years | 456 (25.9%) | 26.0 |
| Total | 1,759 (100.0%) | 43.0 |
Fertility by Age by Marriage Status in Lancaster
52.1% of women with births (1,759) in Lancaster are married. The highest percentage of unmarried women with births falls into 15 to 19 years age bracket with 100.0% of them unmarried at the time of birth, while the lowest percentage of unmarried women with births belong to 35 to 50 years age bracket with 32.0% of them unmarried.
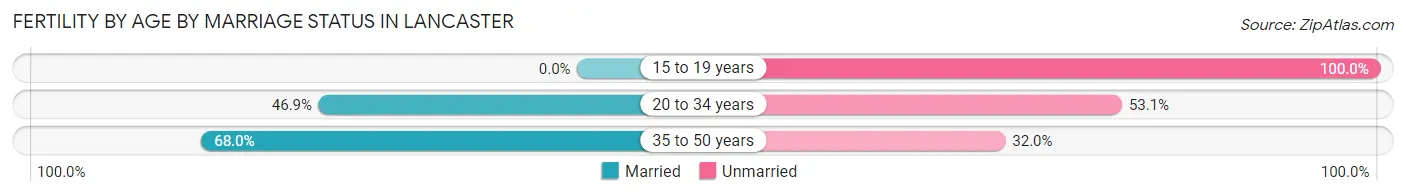
| Age Bracket | Married | Unmarried |
| 15 to 19 years | 0 (0.0%) | 12 (100.0%) |
| 20 to 34 years | 605 (46.9%) | 686 (53.1%) |
| 35 to 50 years | 310 (68.0%) | 146 (32.0%) |
| Total | 916 (52.1%) | 843 (47.9%) |
Fertility by Education in Lancaster
Average fertility rate in Lancaster is 43.0 births per 1,000 women. Women with the education attainment of bachelor's degree have the highest fertility rate of 96.0 births per 1,000 women, while women with the education attainment of less than high school have the lowest fertility at 33.0 births per 1,000 women. Women with the education attainment of college or associate's degree represent 30.9% of all women with births.
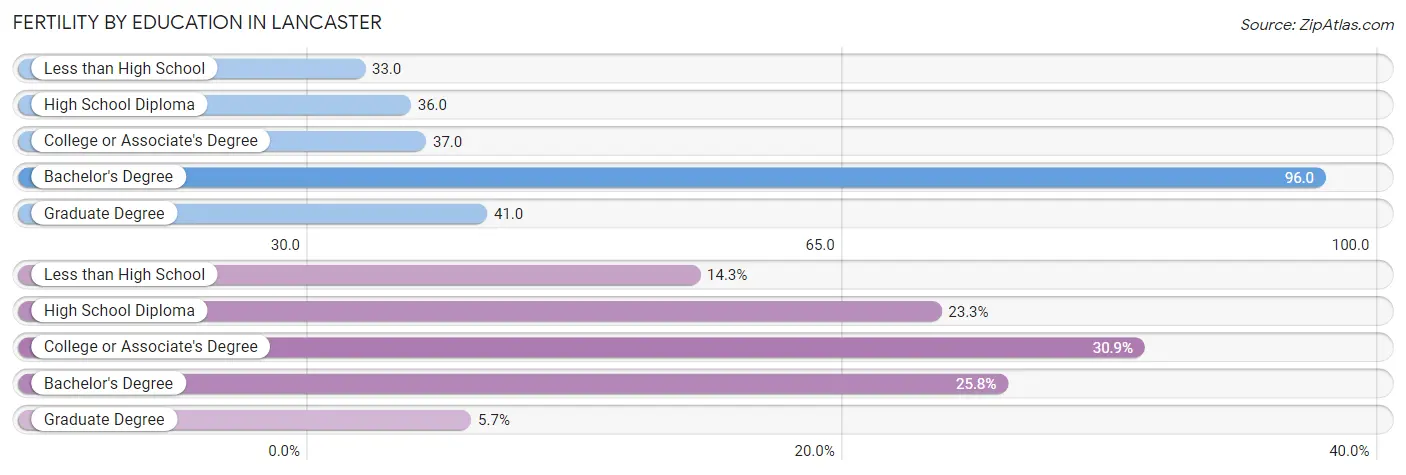
| Educational Attainment | Women with Births | Births / 1,000 Women |
| Less than High School | 251 (14.3%) | 33.0 |
| High School Diploma | 410 (23.3%) | 36.0 |
| College or Associate's Degree | 544 (30.9%) | 37.0 |
| Bachelor's Degree | 454 (25.8%) | 96.0 |
| Graduate Degree | 100 (5.7%) | 41.0 |
| Total | 1,759 (100.0%) | 43.0 |
Fertility by Education by Marriage Status in Lancaster
47.9% of women with births in Lancaster are unmarried. Women with the educational attainment of graduate degree are most likely to be married with 88.0% of them married at childbirth, while women with the educational attainment of less than high school are least likely to be married with 63.3% of them unmarried at childbirth.
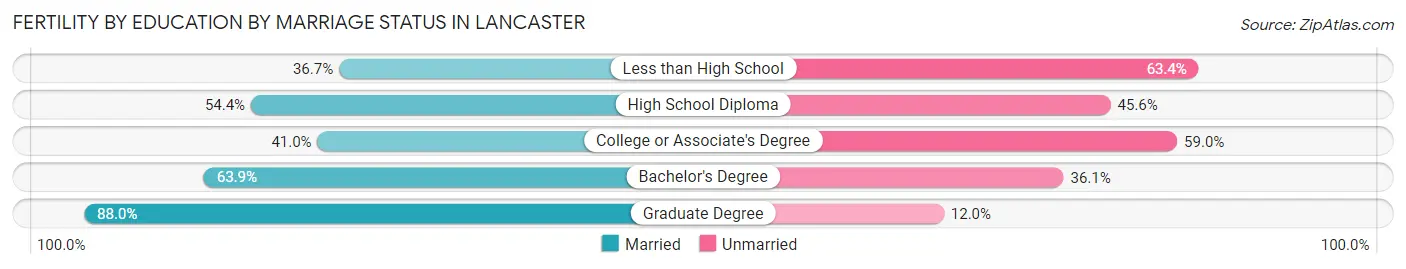
| Educational Attainment | Married | Unmarried |
| Less than High School | 92 (36.6%) | 159 (63.3%) |
| High School Diploma | 223 (54.4%) | 187 (45.6%) |
| College or Associate's Degree | 223 (41.0%) | 321 (59.0%) |
| Bachelor's Degree | 290 (63.9%) | 164 (36.1%) |
| Graduate Degree | 88 (88.0%) | 12 (12.0%) |
| Total | 916 (52.1%) | 843 (47.9%) |
Employment Characteristics in Lancaster
Employment by Class of Employer in Lancaster
Among the 63,696 employed individuals in Lancaster, private company employees (39,539 | 62.1%), local government employees (7,820 | 12.3%), and not-for-profit organizations (4,607 | 7.2%) make up the most common classes of employment.
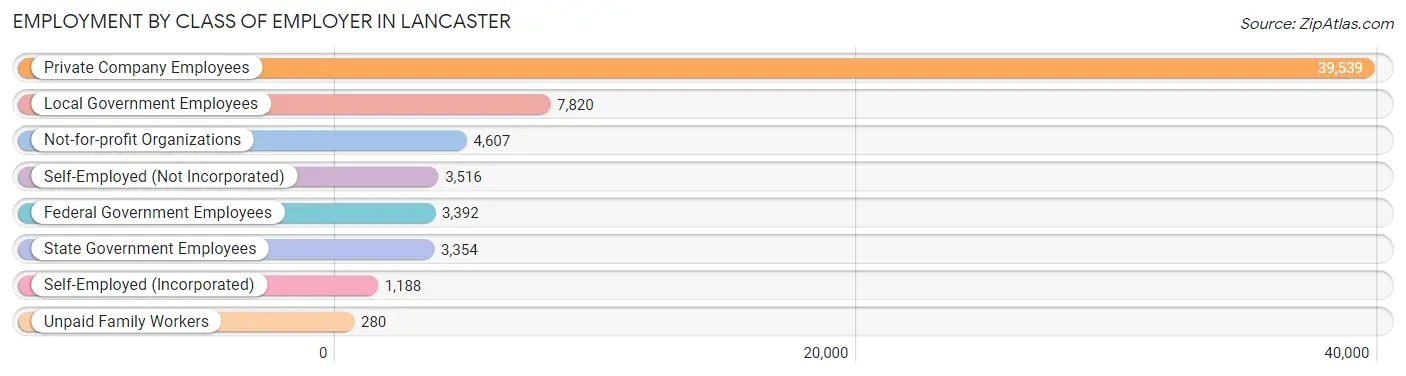
| Employer Class | # Employees | % Employees |
| Private Company Employees | 39,539 | 62.1% |
| Self-Employed (Incorporated) | 1,188 | 1.9% |
| Self-Employed (Not Incorporated) | 3,516 | 5.5% |
| Not-for-profit Organizations | 4,607 | 7.2% |
| Local Government Employees | 7,820 | 12.3% |
| State Government Employees | 3,354 | 5.3% |
| Federal Government Employees | 3,392 | 5.3% |
| Unpaid Family Workers | 280 | 0.4% |
| Total | 63,696 | 100.0% |
Employment Status by Age in Lancaster
According to the labor force statistics for Lancaster, out of the total population over 16 years of age (129,744), 54.4% or 70,581 individuals are in the labor force, with 7.5% or 5,294 of them unemployed. The age group with the highest labor force participation rate is 30 to 34 years, with 75.3% or 8,843 individuals in the labor force. Within the labor force, the 16 to 19 years age range has the highest percentage of unemployed individuals, with 21.6% or 493 of them being unemployed.
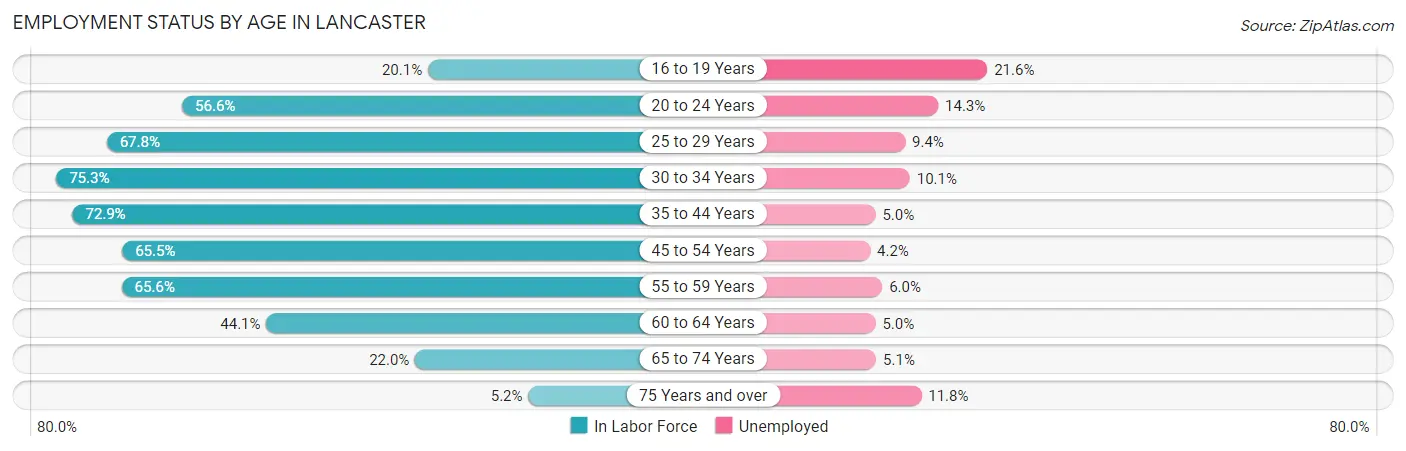
| Age Bracket | In Labor Force | Unemployed |
| 16 to 19 Years | 2,281 (20.1%) | 493 (21.6%) |
| 20 to 24 Years | 6,178 (56.6%) | 883 (14.3%) |
| 25 to 29 Years | 8,805 (67.8%) | 828 (9.4%) |
| 30 to 34 Years | 8,843 (75.3%) | 893 (10.1%) |
| 35 to 44 Years | 17,219 (72.9%) | 861 (5.0%) |
| 45 to 54 Years | 13,262 (65.5%) | 557 (4.2%) |
| 55 to 59 Years | 6,871 (65.6%) | 412 (6.0%) |
| 60 to 64 Years | 4,039 (44.1%) | 202 (5.0%) |
| 65 to 74 Years | 2,646 (22.0%) | 135 (5.1%) |
| 75 Years and over | 376 (5.2%) | 44 (11.8%) |
| Total | 70,581 (54.4%) | 5,294 (7.5%) |
Employment Status by Educational Attainment in Lancaster
According to labor force statistics for Lancaster, 66.9% of individuals (59,027) out of the total population between 25 and 64 years of age (88,232) are in the labor force, with 6.3% or 3,719 of them being unemployed. The group with the highest labor force participation rate are those with the educational attainment of bachelor's degree or higher, with 84.0% or 14,488 individuals in the labor force. Within the labor force, individuals with less than high school education have the highest percentage of unemployment, with 10.1% or 769 of them being unemployed.
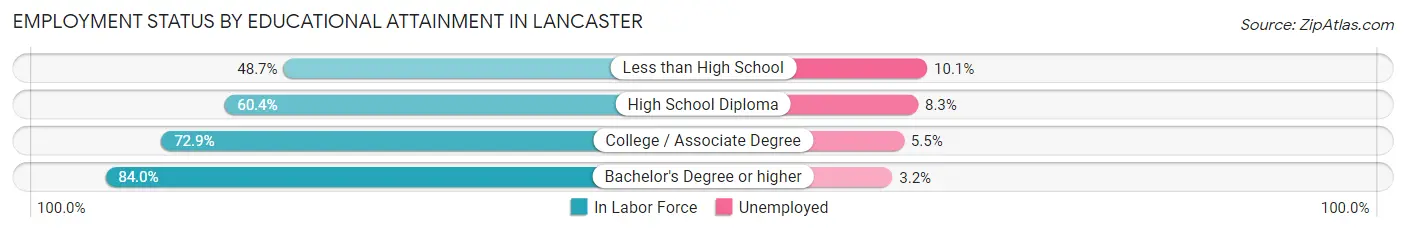
| Educational Attainment | In Labor Force | Unemployed |
| Less than High School | 7,611 (48.7%) | 1,578 (10.1%) |
| High School Diploma | 16,432 (60.4%) | 2,258 (8.3%) |
| College / Associate Degree | 20,521 (72.9%) | 1,548 (5.5%) |
| Bachelor's Degree or higher | 14,488 (84.0%) | 552 (3.2%) |
| Total | 59,027 (66.9%) | 5,559 (6.3%) |
Employment Occupations by Sex in Lancaster
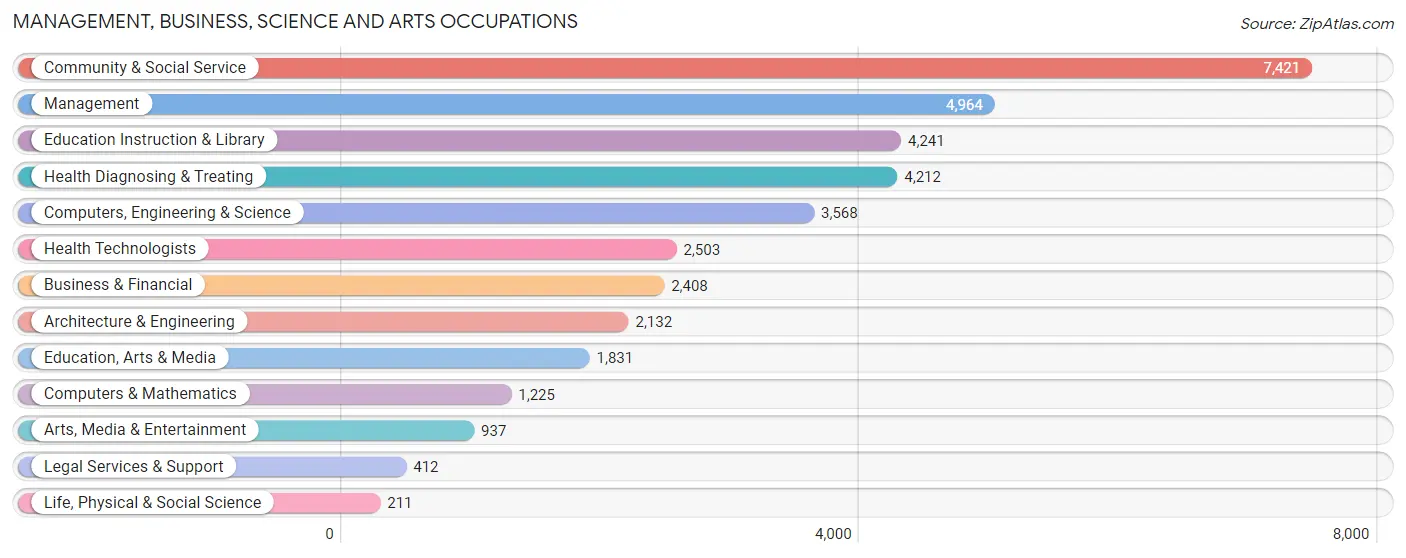
Management, Business, Science and Arts Occupations
The most common Management, Business, Science and Arts occupations in Lancaster are Community & Social Service (7,421 | 11.4%), Management (4,964 | 7.6%), Education Instruction & Library (4,241 | 6.5%), Health Diagnosing & Treating (4,212 | 6.5%), and Computers, Engineering & Science (3,568 | 5.5%).
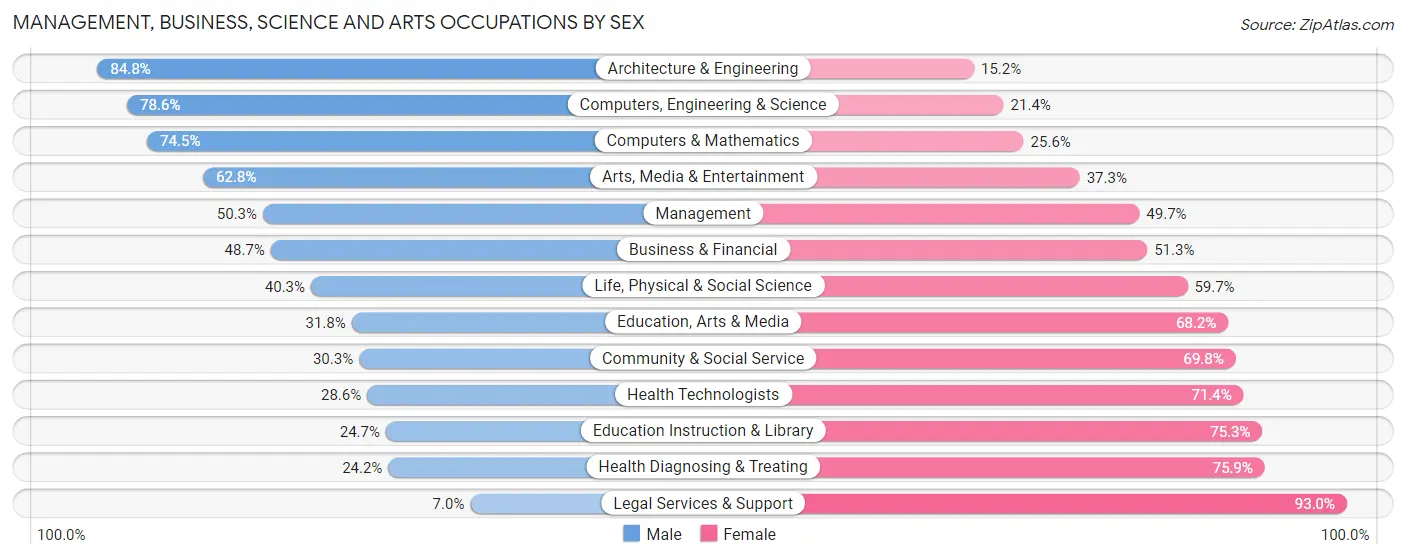
Management, Business, Science and Arts Occupations by Sex
Within the Management, Business, Science and Arts occupations in Lancaster, the most male-oriented occupations are Architecture & Engineering (84.8%), Computers, Engineering & Science (78.6%), and Computers & Mathematics (74.5%), while the most female-oriented occupations are Legal Services & Support (93.0%), Health Diagnosing & Treating (75.8%), and Education Instruction & Library (75.3%).
| Occupation | Male | Female |
| Management | 2,497 (50.3%) | 2,467 (49.7%) |
| Business & Financial | 1,172 (48.7%) | 1,236 (51.3%) |
| Computers, Engineering & Science | 2,805 (78.6%) | 763 (21.4%) |
| Computers & Mathematics | 912 (74.5%) | 313 (25.6%) |
| Architecture & Engineering | 1,808 (84.8%) | 324 (15.2%) |
| Life, Physical & Social Science | 85 (40.3%) | 126 (59.7%) |
| Community & Social Service | 2,245 (30.2%) | 5,176 (69.8%) |
| Education, Arts & Media | 582 (31.8%) | 1,249 (68.2%) |
| Legal Services & Support | 29 (7.0%) | 383 (93.0%) |
| Education Instruction & Library | 1,046 (24.7%) | 3,195 (75.3%) |
| Arts, Media & Entertainment | 588 (62.7%) | 349 (37.2%) |
| Health Diagnosing & Treating | 1,017 (24.1%) | 3,195 (75.8%) |
| Health Technologists | 715 (28.6%) | 1,788 (71.4%) |
| Total (Category) | 9,736 (43.1%) | 12,837 (56.9%) |
| Total (Overall) | 34,749 (53.5%) | 30,181 (46.5%) |
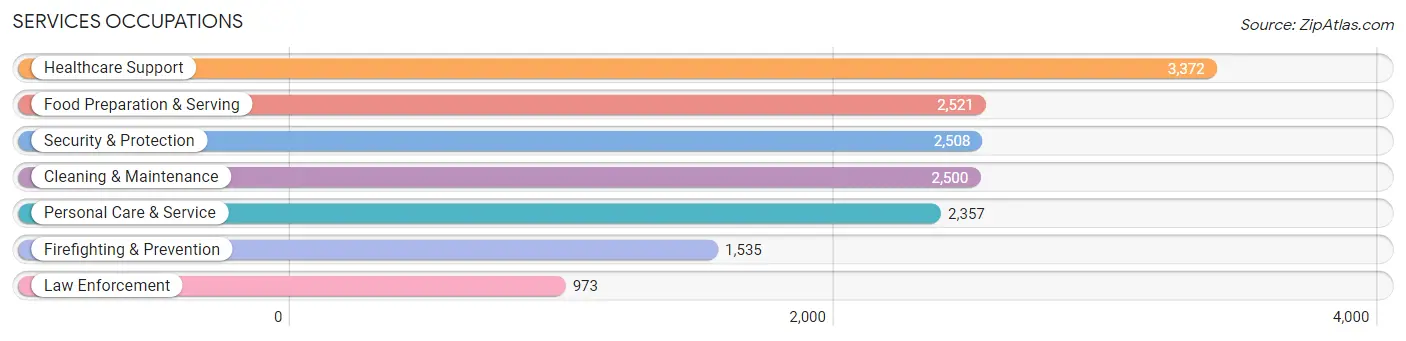
Services Occupations
The most common Services occupations in Lancaster are Healthcare Support (3,372 | 5.2%), Food Preparation & Serving (2,521 | 3.9%), Security & Protection (2,508 | 3.9%), Cleaning & Maintenance (2,500 | 3.8%), and Personal Care & Service (2,357 | 3.6%).
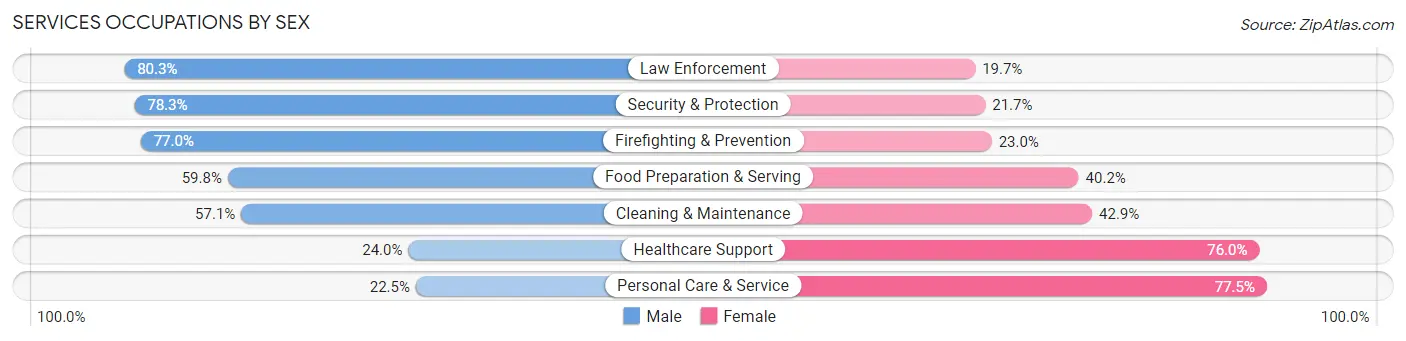
Services Occupations by Sex
Within the Services occupations in Lancaster, the most male-oriented occupations are Law Enforcement (80.3%), Security & Protection (78.3%), and Firefighting & Prevention (77.0%), while the most female-oriented occupations are Personal Care & Service (77.5%), Healthcare Support (76.0%), and Cleaning & Maintenance (42.9%).
| Occupation | Male | Female |
| Healthcare Support | 810 (24.0%) | 2,562 (76.0%) |
| Security & Protection | 1,963 (78.3%) | 545 (21.7%) |
| Firefighting & Prevention | 1,182 (77.0%) | 353 (23.0%) |
| Law Enforcement | 781 (80.3%) | 192 (19.7%) |
| Food Preparation & Serving | 1,507 (59.8%) | 1,014 (40.2%) |
| Cleaning & Maintenance | 1,428 (57.1%) | 1,072 (42.9%) |
| Personal Care & Service | 531 (22.5%) | 1,826 (77.5%) |
| Total (Category) | 6,239 (47.1%) | 7,019 (52.9%) |
| Total (Overall) | 34,749 (53.5%) | 30,181 (46.5%) |
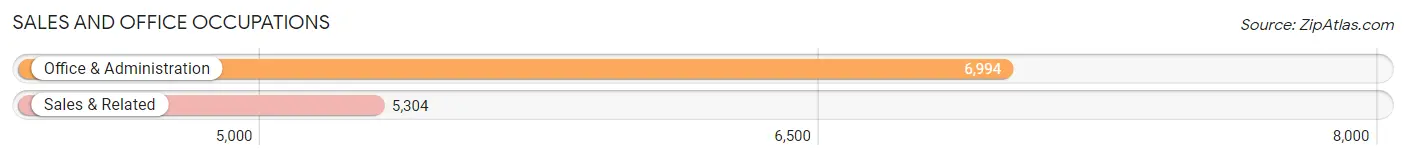
Sales and Office Occupations
The most common Sales and Office occupations in Lancaster are Office & Administration (6,994 | 10.8%), and Sales & Related (5,304 | 8.2%).
Sales and Office Occupations by Sex
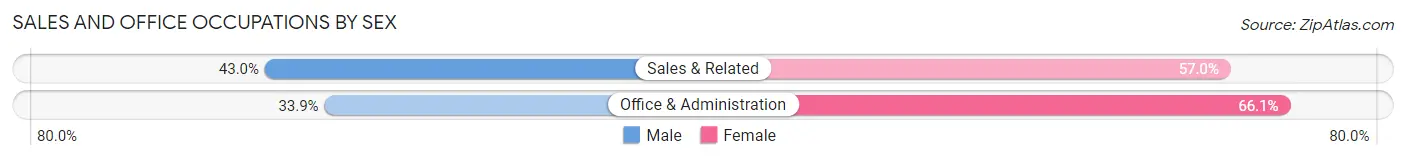
| Occupation | Male | Female |
| Sales & Related | 2,283 (43.0%) | 3,021 (57.0%) |
| Office & Administration | 2,369 (33.9%) | 4,625 (66.1%) |
| Total (Category) | 4,652 (37.8%) | 7,646 (62.2%) |
| Total (Overall) | 34,749 (53.5%) | 30,181 (46.5%) |
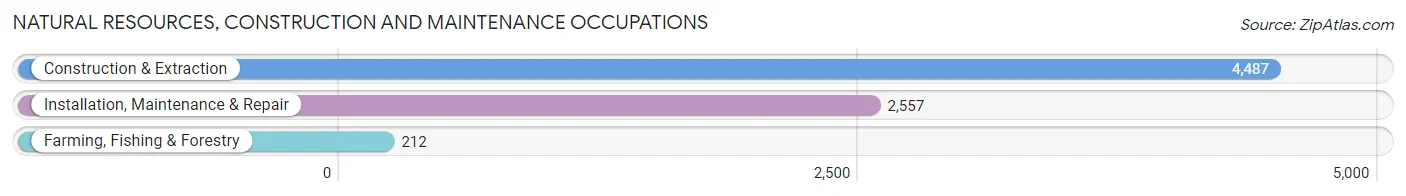
Natural Resources, Construction and Maintenance Occupations
The most common Natural Resources, Construction and Maintenance occupations in Lancaster are Construction & Extraction (4,487 | 6.9%), Installation, Maintenance & Repair (2,557 | 3.9%), and Farming, Fishing & Forestry (212 | 0.3%).
Natural Resources, Construction and Maintenance Occupations by Sex
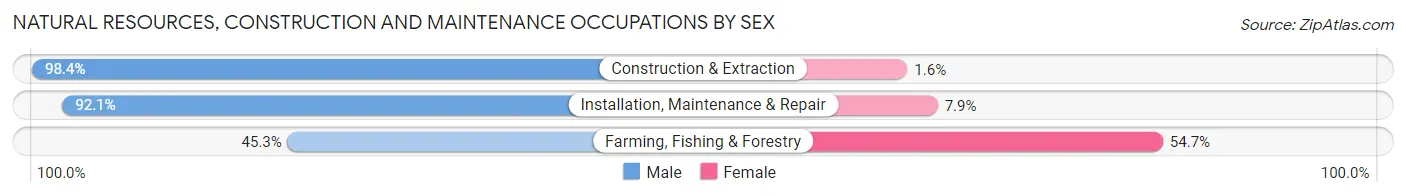
| Occupation | Male | Female |
| Farming, Fishing & Forestry | 96 (45.3%) | 116 (54.7%) |
| Construction & Extraction | 4,417 (98.4%) | 70 (1.6%) |
| Installation, Maintenance & Repair | 2,356 (92.1%) | 201 (7.9%) |
| Total (Category) | 6,869 (94.7%) | 387 (5.3%) |
| Total (Overall) | 34,749 (53.5%) | 30,181 (46.5%) |
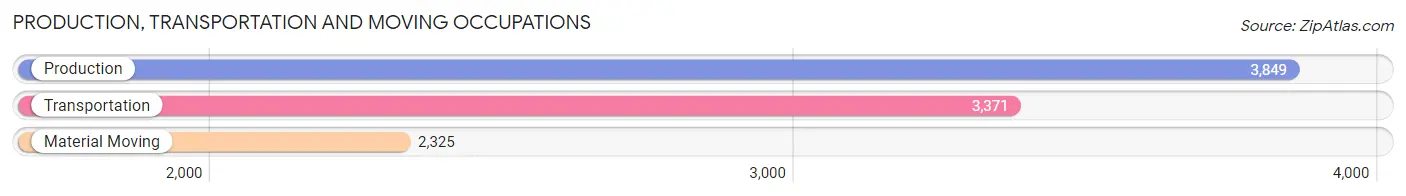
Production, Transportation and Moving Occupations
The most common Production, Transportation and Moving occupations in Lancaster are Production (3,849 | 5.9%), Transportation (3,371 | 5.2%), and Material Moving (2,325 | 3.6%).
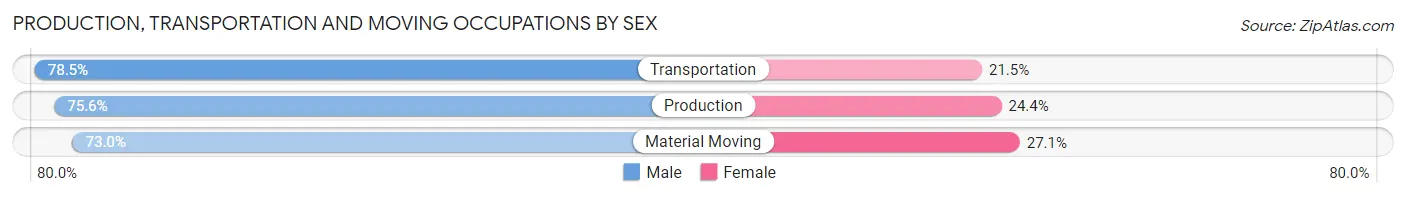
Production, Transportation and Moving Occupations by Sex
| Occupation | Male | Female |
| Production | 2,911 (75.6%) | 938 (24.4%) |
| Transportation | 2,646 (78.5%) | 725 (21.5%) |
| Material Moving | 1,696 (73.0%) | 629 (27.1%) |
| Total (Category) | 7,253 (76.0%) | 2,292 (24.0%) |
| Total (Overall) | 34,749 (53.5%) | 30,181 (46.5%) |
Employment Industries by Sex in Lancaster
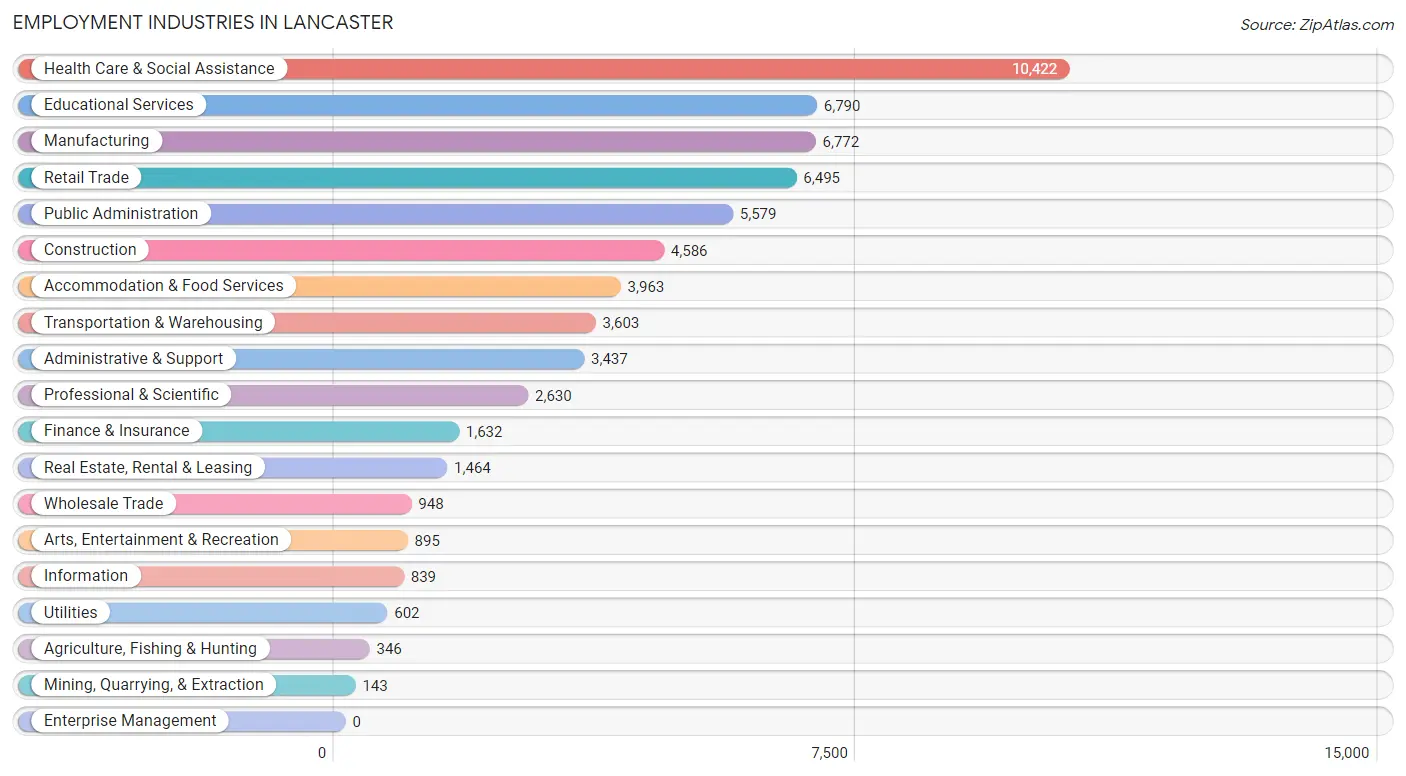
Employment Industries in Lancaster
The major employment industries in Lancaster include Health Care & Social Assistance (10,422 | 16.1%), Educational Services (6,790 | 10.5%), Manufacturing (6,772 | 10.4%), Retail Trade (6,495 | 10.0%), and Public Administration (5,579 | 8.6%).
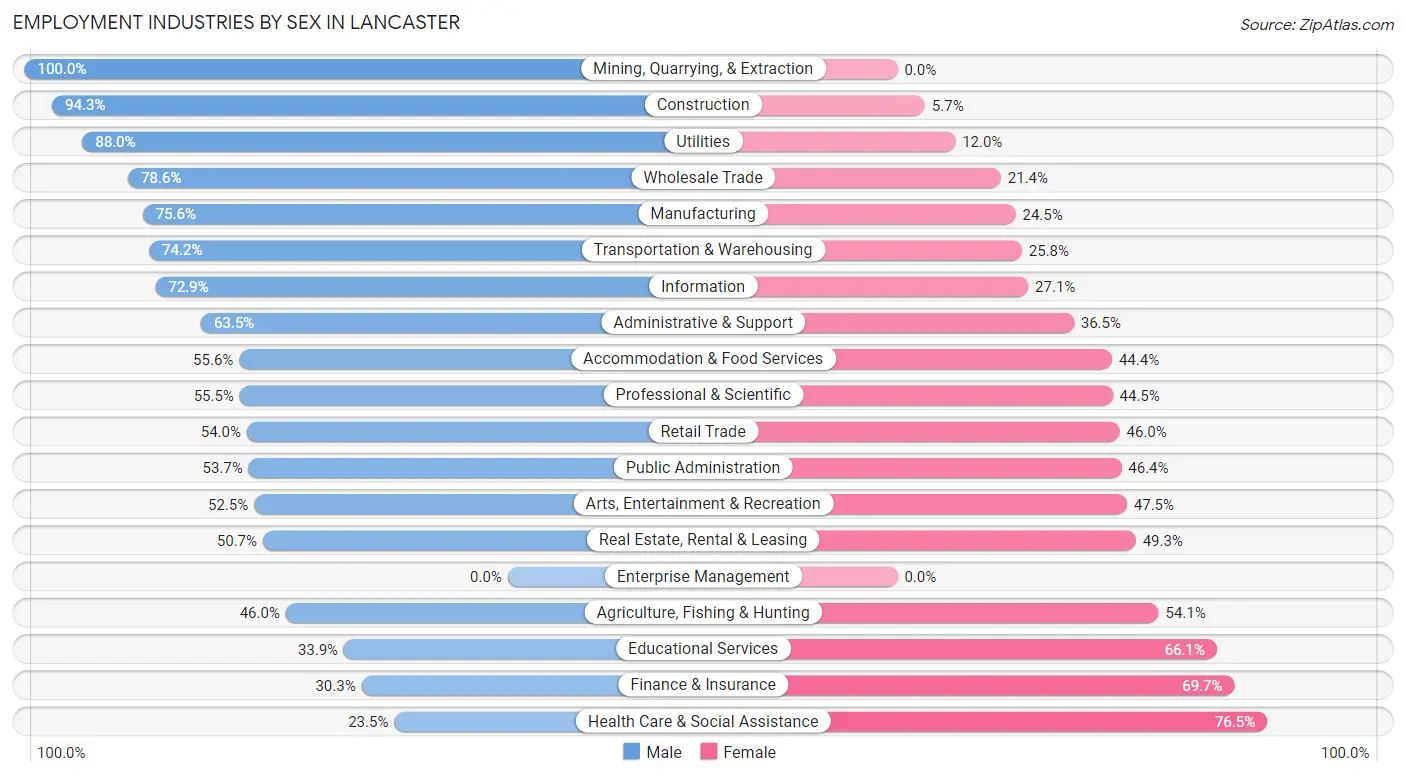
Employment Industries by Sex in Lancaster
The Lancaster industries that see more men than women are Mining, Quarrying, & Extraction (100.0%), Construction (94.3%), and Utilities (88.0%), whereas the industries that tend to have a higher number of women are Health Care & Social Assistance (76.5%), Finance & Insurance (69.7%), and Educational Services (66.1%).
| Industry | Male | Female |
| Agriculture, Fishing & Hunting | 159 (46.0%) | 187 (54.0%) |
| Mining, Quarrying, & Extraction | 143 (100.0%) | 0 (0.0%) |
| Construction | 4,325 (94.3%) | 261 (5.7%) |
| Manufacturing | 5,116 (75.5%) | 1,656 (24.4%) |
| Wholesale Trade | 745 (78.6%) | 203 (21.4%) |
| Retail Trade | 3,508 (54.0%) | 2,987 (46.0%) |
| Transportation & Warehousing | 2,675 (74.2%) | 928 (25.8%) |
| Utilities | 530 (88.0%) | 72 (12.0%) |
| Information | 612 (72.9%) | 227 (27.1%) |
| Finance & Insurance | 494 (30.3%) | 1,138 (69.7%) |
| Real Estate, Rental & Leasing | 742 (50.7%) | 722 (49.3%) |
| Professional & Scientific | 1,459 (55.5%) | 1,171 (44.5%) |
| Enterprise Management | 0 (0.0%) | 0 (0.0%) |
| Administrative & Support | 2,182 (63.5%) | 1,255 (36.5%) |
| Educational Services | 2,302 (33.9%) | 4,488 (66.1%) |
| Health Care & Social Assistance | 2,448 (23.5%) | 7,974 (76.5%) |
| Arts, Entertainment & Recreation | 470 (52.5%) | 425 (47.5%) |
| Accommodation & Food Services | 2,203 (55.6%) | 1,760 (44.4%) |
| Public Administration | 2,993 (53.6%) | 2,586 (46.4%) |
| Total | 34,749 (53.5%) | 30,181 (46.5%) |
Education in Lancaster
School Enrollment in Lancaster
The most common levels of schooling among the 51,735 students in Lancaster are middle school (12,082 | 23.4%), high school (12,003 | 23.2%), and college / undergraduate (10,404 | 20.1%).
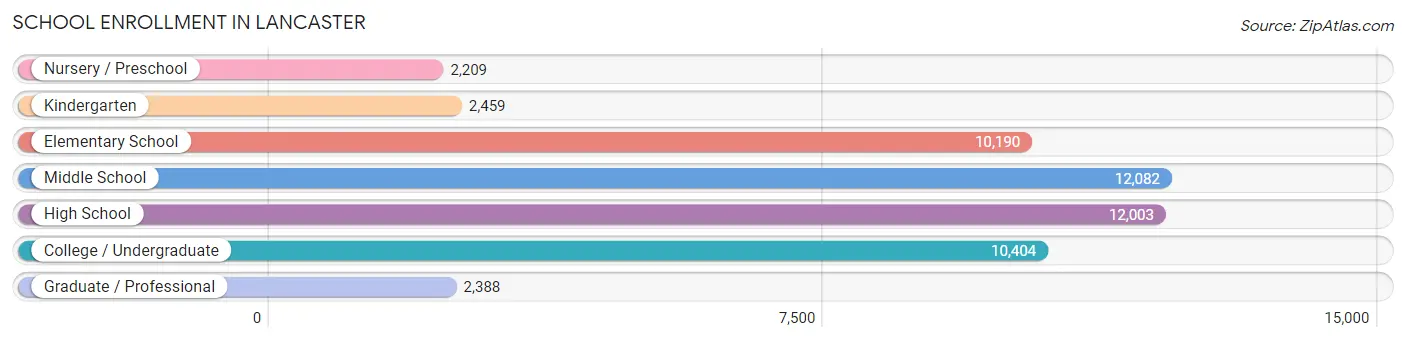
| School Level | # Students | % Students |
| Nursery / Preschool | 2,209 | 4.3% |
| Kindergarten | 2,459 | 4.8% |
| Elementary School | 10,190 | 19.7% |
| Middle School | 12,082 | 23.4% |
| High School | 12,003 | 23.2% |
| College / Undergraduate | 10,404 | 20.1% |
| Graduate / Professional | 2,388 | 4.6% |
| Total | 51,735 | 100.0% |
School Enrollment by Age by Funding Source in Lancaster
Out of a total of 51,735 students who are enrolled in schools in Lancaster, 6,105 (11.8%) attend a private institution, while the remaining 45,630 (88.2%) are enrolled in public schools. The age group of 35 years and over has the highest likelihood of being enrolled in private schools, with 1,279 (40.1% in the age bracket) enrolled. Conversely, the age group of 5 to 9 year old has the lowest likelihood of being enrolled in a private school, with 10,959 (94.8% in the age bracket) attending a public institution.
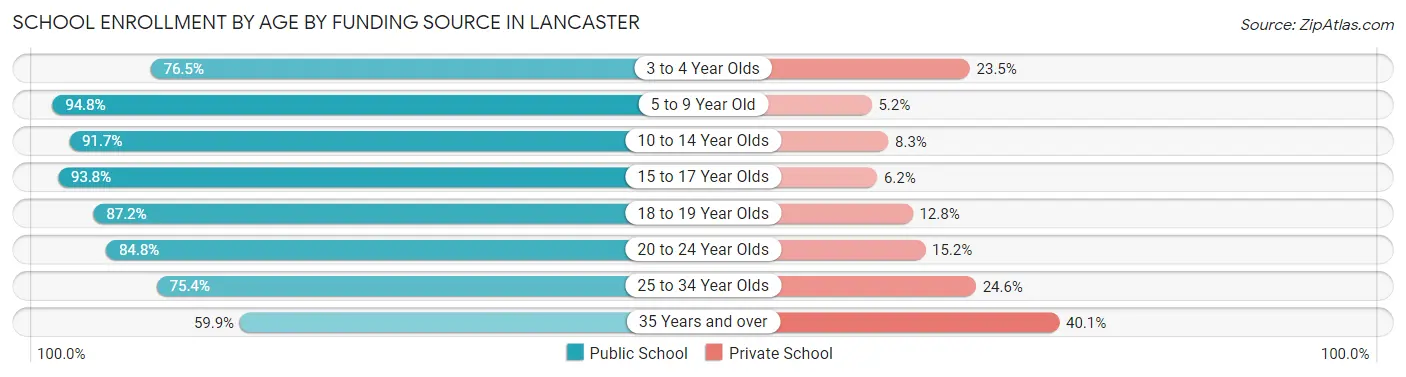
| Age Bracket | Public School | Private School |
| 3 to 4 Year Olds | 1,644 (76.5%) | 504 (23.5%) |
| 5 to 9 Year Old | 10,959 (94.8%) | 597 (5.2%) |
| 10 to 14 Year Olds | 14,482 (91.7%) | 1,306 (8.3%) |
| 15 to 17 Year Olds | 7,199 (93.8%) | 476 (6.2%) |
| 18 to 19 Year Olds | 3,292 (87.2%) | 484 (12.8%) |
| 20 to 24 Year Olds | 3,525 (84.8%) | 630 (15.2%) |
| 25 to 34 Year Olds | 2,600 (75.4%) | 848 (24.6%) |
| 35 Years and over | 1,910 (59.9%) | 1,279 (40.1%) |
| Total | 45,630 (88.2%) | 6,105 (11.8%) |
Educational Attainment by Field of Study in Lancaster
Business (3,340 | 15.0%), engineering (2,700 | 12.1%), education (2,398 | 10.7%), science & technology (2,284 | 10.2%), and arts & humanities (1,750 | 7.8%) are the most common fields of study among 22,312 individuals in Lancaster who have obtained a bachelor's degree or higher.
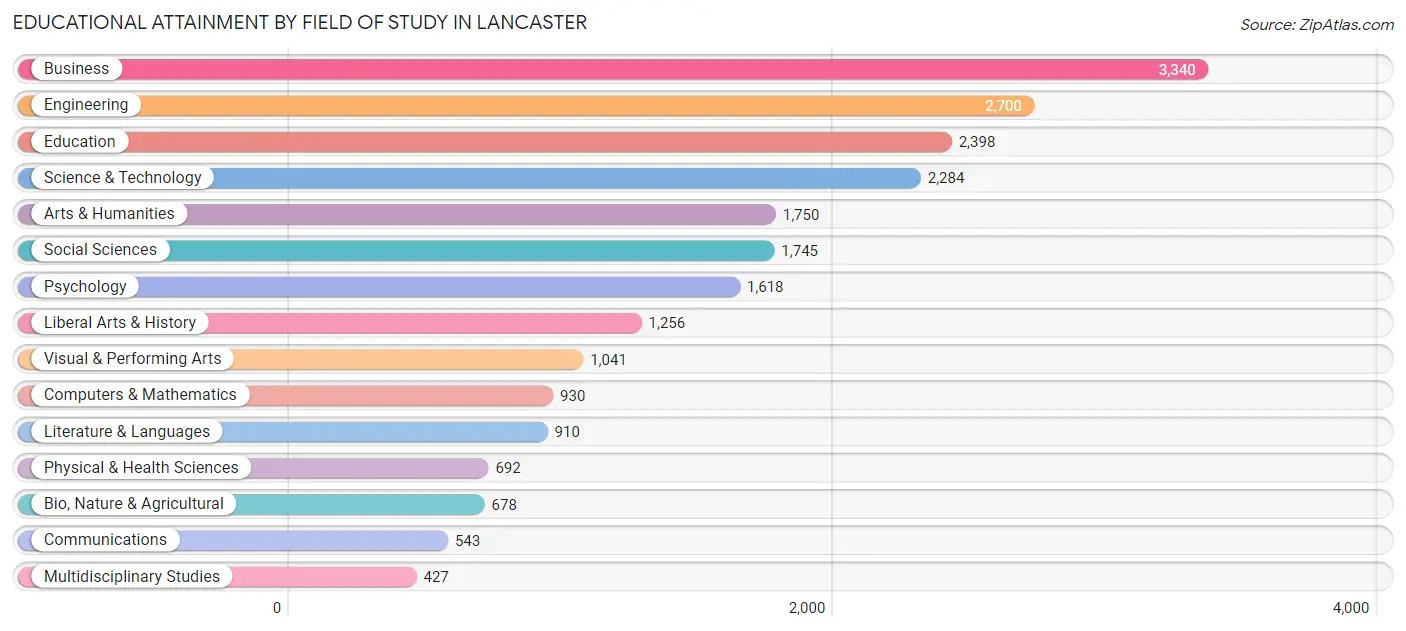
| Field of Study | # Graduates | % Graduates |
| Computers & Mathematics | 930 | 4.2% |
| Bio, Nature & Agricultural | 678 | 3.0% |
| Physical & Health Sciences | 692 | 3.1% |
| Psychology | 1,618 | 7.2% |
| Social Sciences | 1,745 | 7.8% |
| Engineering | 2,700 | 12.1% |
| Multidisciplinary Studies | 427 | 1.9% |
| Science & Technology | 2,284 | 10.2% |
| Business | 3,340 | 15.0% |
| Education | 2,398 | 10.7% |
| Literature & Languages | 910 | 4.1% |
| Liberal Arts & History | 1,256 | 5.6% |
| Visual & Performing Arts | 1,041 | 4.7% |
| Communications | 543 | 2.4% |
| Arts & Humanities | 1,750 | 7.8% |
| Total | 22,312 | 100.0% |
Transportation & Commute in Lancaster
Vehicle Availability by Sex in Lancaster
The most prevalent vehicle ownership categories in Lancaster are males with 2 vehicles (13,577, accounting for 40.0%) and females with 2 vehicles (11,254, making up 46.5%).
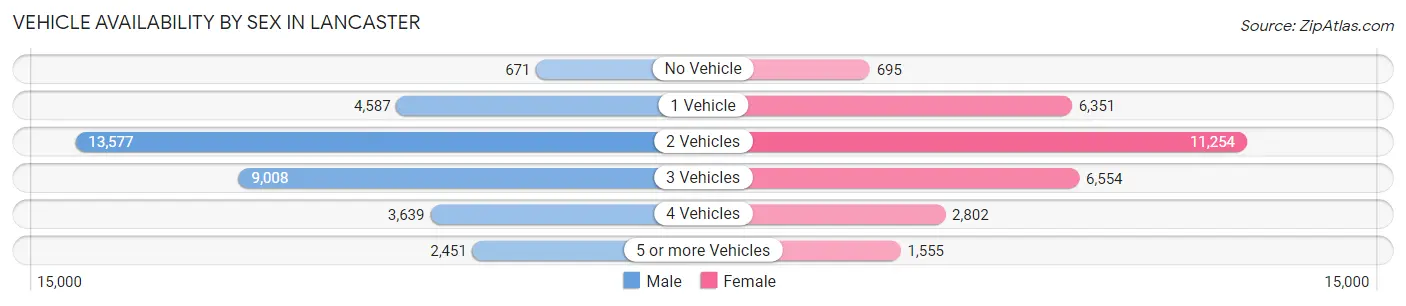
| Vehicles Available | Male | Female |
| No Vehicle | 671 (2.0%) | 695 (2.4%) |
| 1 Vehicle | 4,587 (13.5%) | 6,351 (21.7%) |
| 2 Vehicles | 13,577 (40.0%) | 11,254 (38.5%) |
| 3 Vehicles | 9,008 (26.6%) | 6,554 (22.4%) |
| 4 Vehicles | 3,639 (10.7%) | 2,802 (9.6%) |
| 5 or more Vehicles | 2,451 (7.2%) | 1,555 (5.3%) |
| Total | 33,933 (100.0%) | 29,211 (100.0%) |
Commute Time in Lancaster
The most frequently occuring commute durations in Lancaster are 15 to 19 minutes (12,693 commuters, 21.8%), 10 to 14 minutes (10,187 commuters, 17.5%), and 20 to 24 minutes (8,240 commuters, 14.1%).
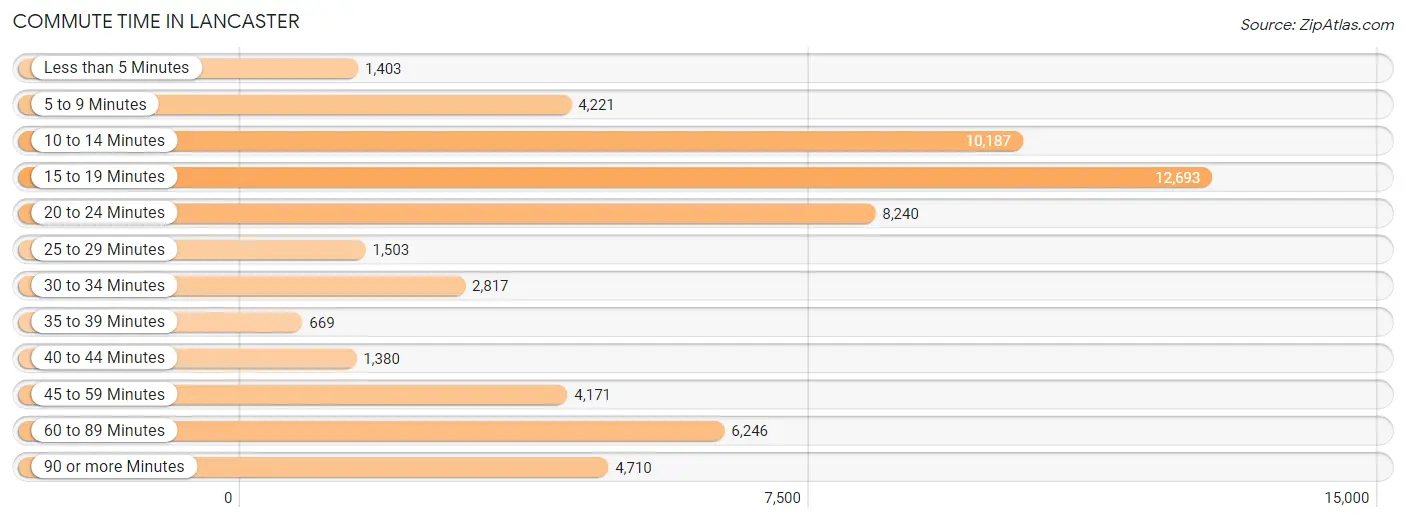
| Commute Time | # Commuters | % Commuters |
| Less than 5 Minutes | 1,403 | 2.4% |
| 5 to 9 Minutes | 4,221 | 7.2% |
| 10 to 14 Minutes | 10,187 | 17.5% |
| 15 to 19 Minutes | 12,693 | 21.8% |
| 20 to 24 Minutes | 8,240 | 14.1% |
| 25 to 29 Minutes | 1,503 | 2.6% |
| 30 to 34 Minutes | 2,817 | 4.8% |
| 35 to 39 Minutes | 669 | 1.1% |
| 40 to 44 Minutes | 1,380 | 2.4% |
| 45 to 59 Minutes | 4,171 | 7.2% |
| 60 to 89 Minutes | 6,246 | 10.7% |
| 90 or more Minutes | 4,710 | 8.1% |
Commute Time by Sex in Lancaster
The most common commute times in Lancaster are 15 to 19 minutes (5,965 commuters, 18.8%) for males and 15 to 19 minutes (6,728 commuters, 25.4%) for females.
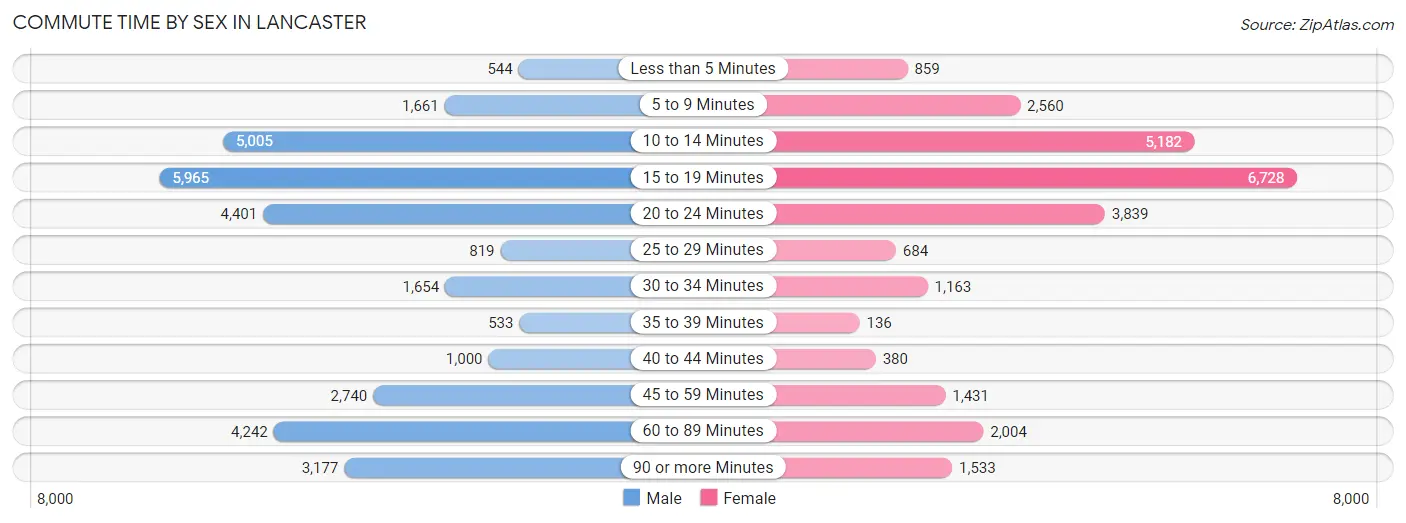
| Commute Time | Male | Female |
| Less than 5 Minutes | 544 (1.7%) | 859 (3.2%) |
| 5 to 9 Minutes | 1,661 (5.2%) | 2,560 (9.7%) |
| 10 to 14 Minutes | 5,005 (15.8%) | 5,182 (19.6%) |
| 15 to 19 Minutes | 5,965 (18.8%) | 6,728 (25.4%) |
| 20 to 24 Minutes | 4,401 (13.9%) | 3,839 (14.5%) |
| 25 to 29 Minutes | 819 (2.6%) | 684 (2.6%) |
| 30 to 34 Minutes | 1,654 (5.2%) | 1,163 (4.4%) |
| 35 to 39 Minutes | 533 (1.7%) | 136 (0.5%) |
| 40 to 44 Minutes | 1,000 (3.2%) | 380 (1.4%) |
| 45 to 59 Minutes | 2,740 (8.6%) | 1,431 (5.4%) |
| 60 to 89 Minutes | 4,242 (13.4%) | 2,004 (7.6%) |
| 90 or more Minutes | 3,177 (10.0%) | 1,533 (5.8%) |
Time of Departure to Work by Sex in Lancaster
The most frequent times of departure to work in Lancaster are 7:00 AM to 7:29 AM (5,437, 17.1%) for males and 7:00 AM to 7:29 AM (6,336, 23.9%) for females.
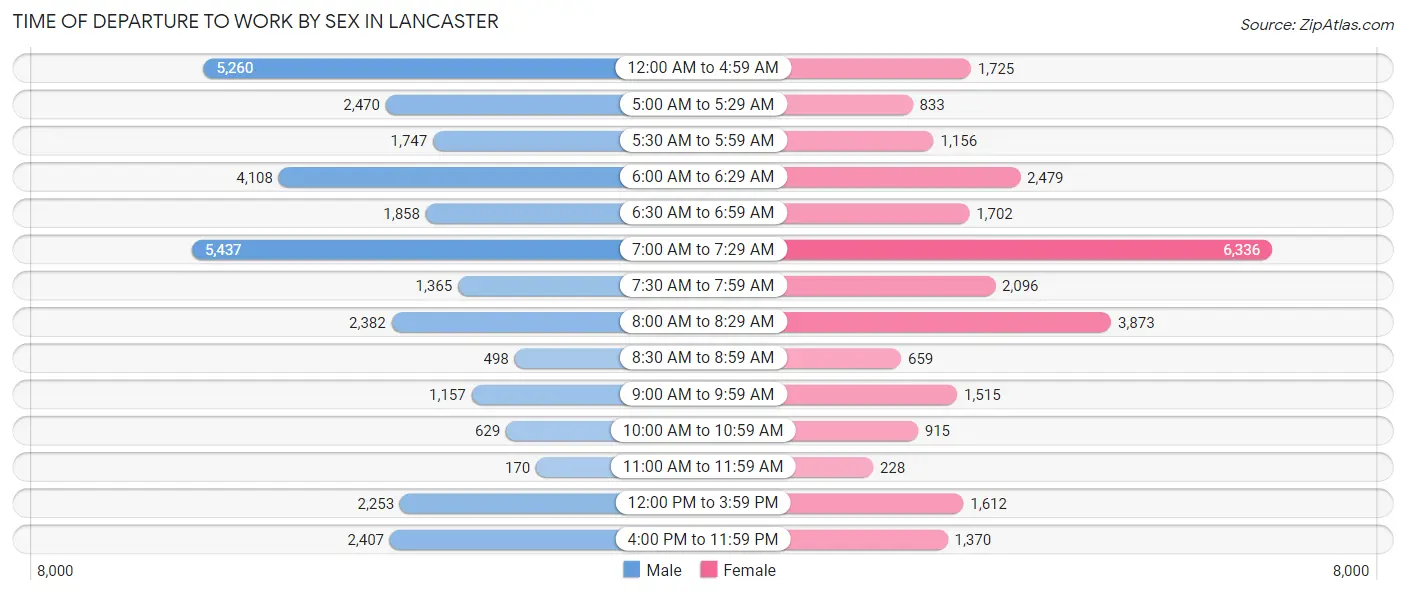
| Time of Departure | Male | Female |
| 12:00 AM to 4:59 AM | 5,260 (16.6%) | 1,725 (6.5%) |
| 5:00 AM to 5:29 AM | 2,470 (7.8%) | 833 (3.1%) |
| 5:30 AM to 5:59 AM | 1,747 (5.5%) | 1,156 (4.4%) |
| 6:00 AM to 6:29 AM | 4,108 (12.9%) | 2,479 (9.4%) |
| 6:30 AM to 6:59 AM | 1,858 (5.9%) | 1,702 (6.4%) |
| 7:00 AM to 7:29 AM | 5,437 (17.1%) | 6,336 (23.9%) |
| 7:30 AM to 7:59 AM | 1,365 (4.3%) | 2,096 (7.9%) |
| 8:00 AM to 8:29 AM | 2,382 (7.5%) | 3,873 (14.6%) |
| 8:30 AM to 8:59 AM | 498 (1.6%) | 659 (2.5%) |
| 9:00 AM to 9:59 AM | 1,157 (3.6%) | 1,515 (5.7%) |
| 10:00 AM to 10:59 AM | 629 (2.0%) | 915 (3.5%) |
| 11:00 AM to 11:59 AM | 170 (0.5%) | 228 (0.9%) |
| 12:00 PM to 3:59 PM | 2,253 (7.1%) | 1,612 (6.1%) |
| 4:00 PM to 11:59 PM | 2,407 (7.6%) | 1,370 (5.2%) |
| Total | 31,741 (100.0%) | 26,499 (100.0%) |
Housing Occupancy in Lancaster
Occupancy by Ownership in Lancaster
Of the total 52,341 dwellings in Lancaster, owner-occupied units account for 29,901 (57.1%), while renter-occupied units make up 22,440 (42.9%).
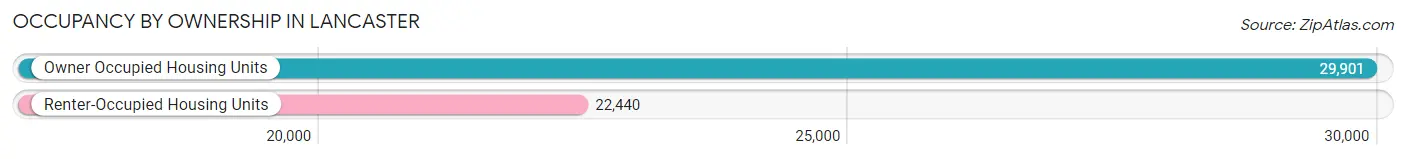
| Occupancy | # Housing Units | % Housing Units |
| Owner Occupied Housing Units | 29,901 | 57.1% |
| Renter-Occupied Housing Units | 22,440 | 42.9% |
| Total Occupied Housing Units | 52,341 | 100.0% |
Occupancy by Household Size in Lancaster
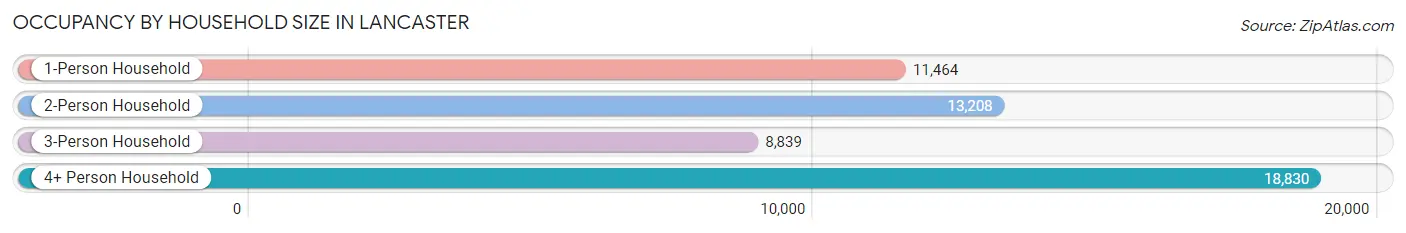
| Household Size | # Housing Units | % Housing Units |
| 1-Person Household | 11,464 | 21.9% |
| 2-Person Household | 13,208 | 25.2% |
| 3-Person Household | 8,839 | 16.9% |
| 4+ Person Household | 18,830 | 36.0% |
| Total Housing Units | 52,341 | 100.0% |
Occupancy by Ownership by Household Size in Lancaster
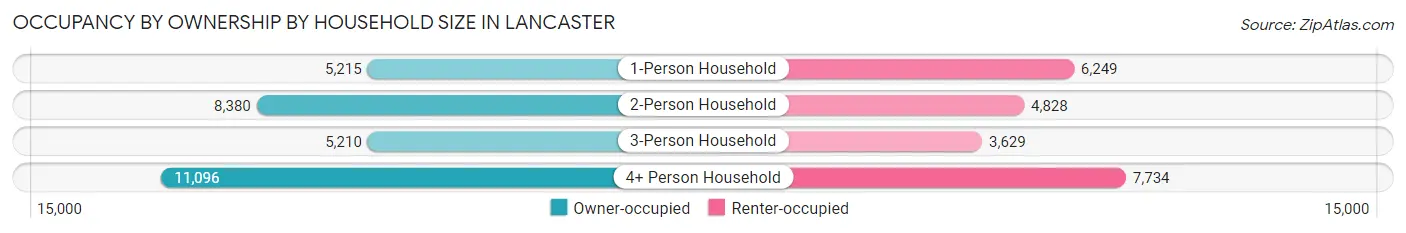
| Household Size | Owner-occupied | Renter-occupied |
| 1-Person Household | 5,215 (45.5%) | 6,249 (54.5%) |
| 2-Person Household | 8,380 (63.4%) | 4,828 (36.5%) |
| 3-Person Household | 5,210 (58.9%) | 3,629 (41.1%) |
| 4+ Person Household | 11,096 (58.9%) | 7,734 (41.1%) |
| Total Housing Units | 29,901 (57.1%) | 22,440 (42.9%) |
Occupancy by Educational Attainment in Lancaster
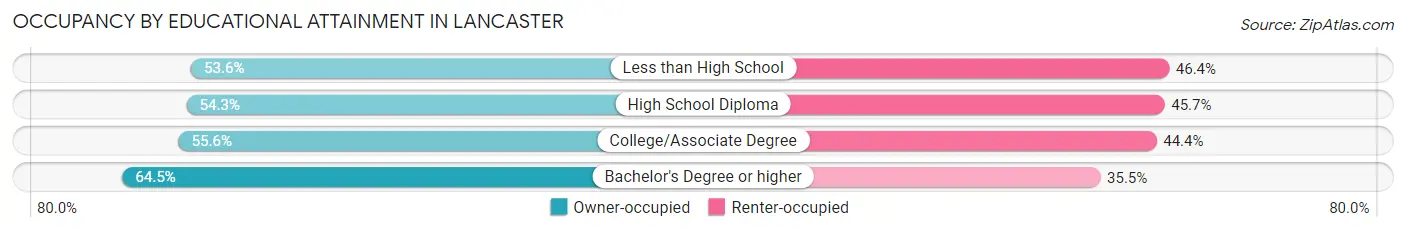
| Household Size | Owner-occupied | Renter-occupied |
| Less than High School | 4,021 (53.6%) | 3,483 (46.4%) |
| High School Diploma | 7,691 (54.3%) | 6,472 (45.7%) |
| College/Associate Degree | 9,913 (55.6%) | 7,926 (44.4%) |
| Bachelor's Degree or higher | 8,276 (64.5%) | 4,559 (35.5%) |
Occupancy by Age of Householder in Lancaster
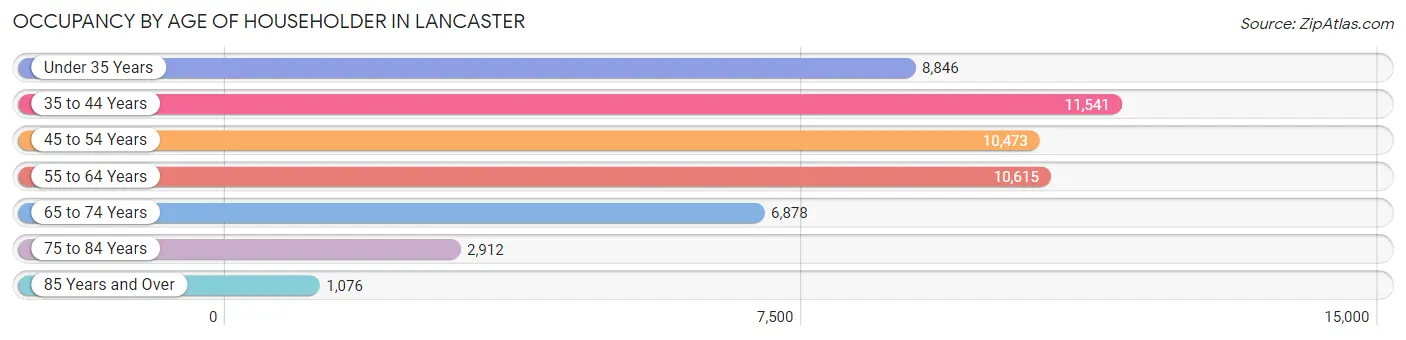
| Age Bracket | # Households | % Households |
| Under 35 Years | 8,846 | 16.9% |
| 35 to 44 Years | 11,541 | 22.1% |
| 45 to 54 Years | 10,473 | 20.0% |
| 55 to 64 Years | 10,615 | 20.3% |
| 65 to 74 Years | 6,878 | 13.1% |
| 75 to 84 Years | 2,912 | 5.6% |
| 85 Years and Over | 1,076 | 2.1% |
| Total | 52,341 | 100.0% |
Housing Finances in Lancaster
Median Income by Occupancy in Lancaster
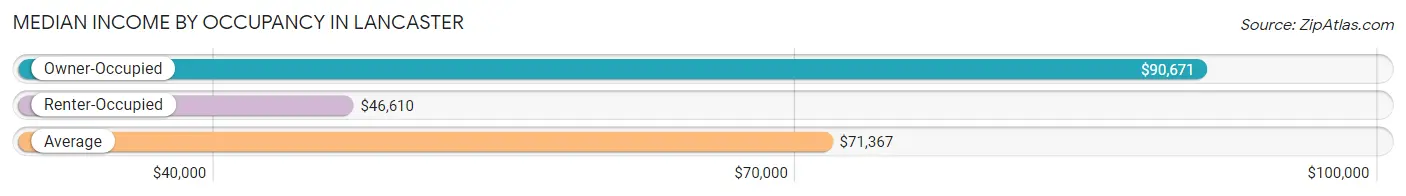
| Occupancy Type | # Households | Median Income |
| Owner-Occupied | 29,901 (57.1%) | $90,671 |
| Renter-Occupied | 22,440 (42.9%) | $46,610 |
| Average | 52,341 (100.0%) | $71,367 |
Occupancy by Householder Income Bracket in Lancaster
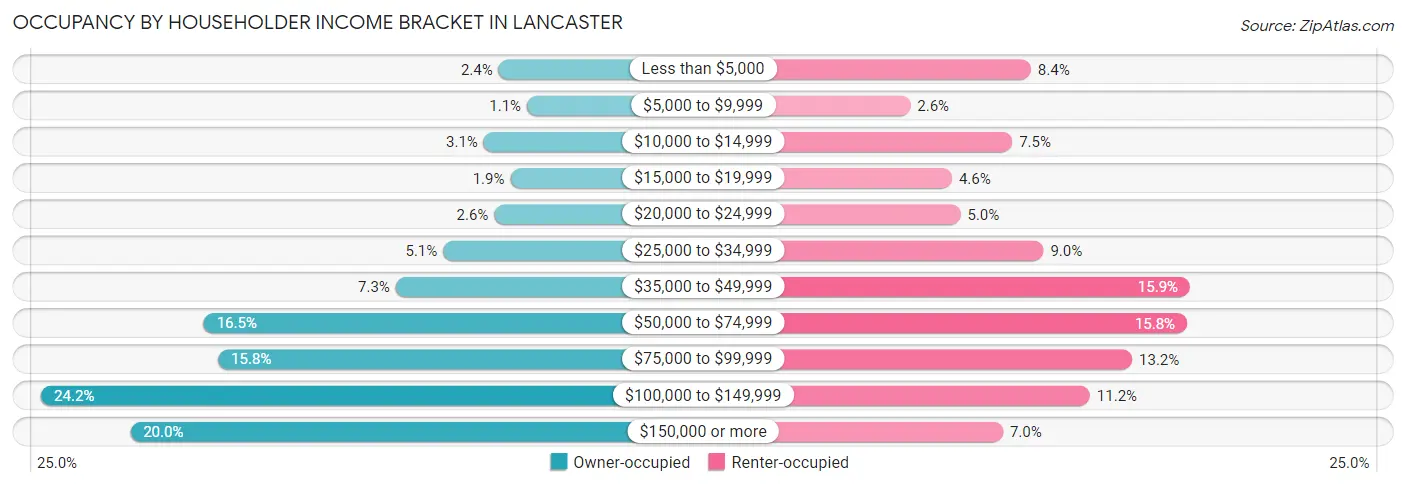
| Income Bracket | Owner-occupied | Renter-occupied |
| Less than $5,000 | 728 (2.4%) | 1,873 (8.4%) |
| $5,000 to $9,999 | 323 (1.1%) | 586 (2.6%) |
| $10,000 to $14,999 | 938 (3.1%) | 1,673 (7.5%) |
| $15,000 to $19,999 | 559 (1.9%) | 1,029 (4.6%) |
| $20,000 to $24,999 | 790 (2.6%) | 1,123 (5.0%) |
| $25,000 to $34,999 | 1,516 (5.1%) | 2,008 (8.9%) |
| $35,000 to $49,999 | 2,192 (7.3%) | 3,572 (15.9%) |
| $50,000 to $74,999 | 4,926 (16.5%) | 3,541 (15.8%) |
| $75,000 to $99,999 | 4,720 (15.8%) | 2,956 (13.2%) |
| $100,000 to $149,999 | 7,238 (24.2%) | 2,504 (11.2%) |
| $150,000 or more | 5,971 (20.0%) | 1,575 (7.0%) |
| Total | 29,901 (100.0%) | 22,440 (100.0%) |
Monthly Housing Cost Tiers in Lancaster
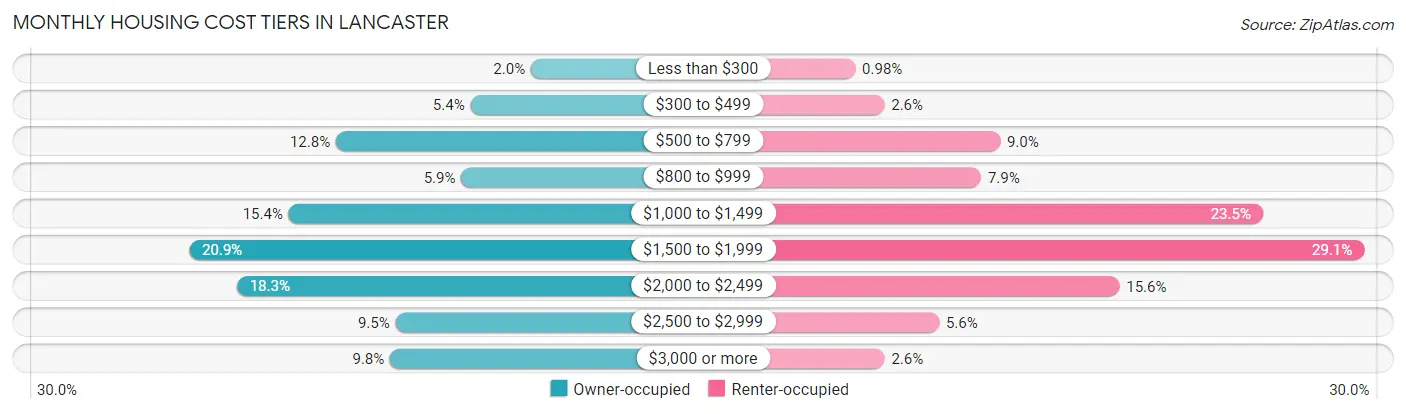
| Monthly Cost | Owner-occupied | Renter-occupied |
| Less than $300 | 607 (2.0%) | 219 (1.0%) |
| $300 to $499 | 1,605 (5.4%) | 581 (2.6%) |
| $500 to $799 | 3,827 (12.8%) | 2,015 (9.0%) |
| $800 to $999 | 1,757 (5.9%) | 1,779 (7.9%) |
| $1,000 to $1,499 | 4,609 (15.4%) | 5,271 (23.5%) |
| $1,500 to $1,999 | 6,256 (20.9%) | 6,527 (29.1%) |
| $2,000 to $2,499 | 5,465 (18.3%) | 3,493 (15.6%) |
| $2,500 to $2,999 | 2,843 (9.5%) | 1,259 (5.6%) |
| $3,000 or more | 2,932 (9.8%) | 583 (2.6%) |
| Total | 29,901 (100.0%) | 22,440 (100.0%) |
Physical Housing Characteristics in Lancaster
Housing Structures in Lancaster
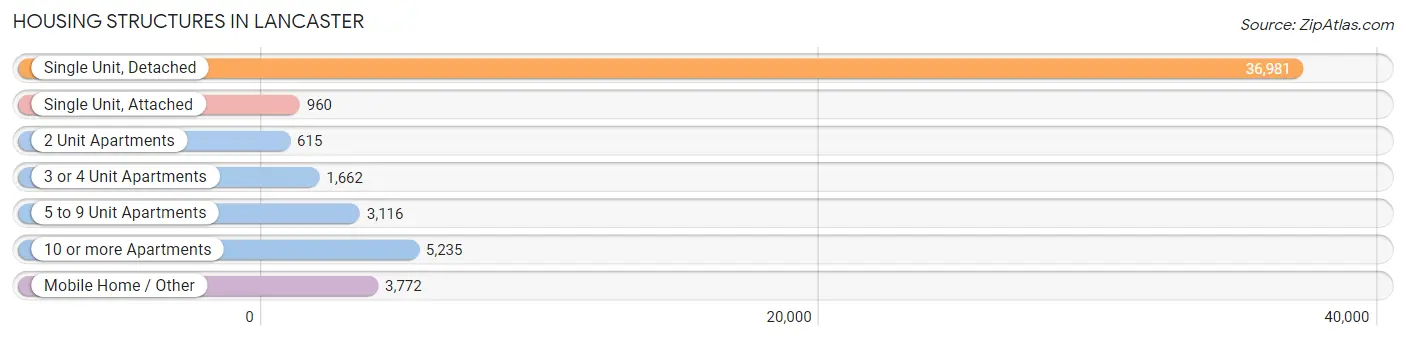
| Structure Type | # Housing Units | % Housing Units |
| Single Unit, Detached | 36,981 | 70.7% |
| Single Unit, Attached | 960 | 1.8% |
| 2 Unit Apartments | 615 | 1.2% |
| 3 or 4 Unit Apartments | 1,662 | 3.2% |
| 5 to 9 Unit Apartments | 3,116 | 5.9% |
| 10 or more Apartments | 5,235 | 10.0% |
| Mobile Home / Other | 3,772 | 7.2% |
| Total | 52,341 | 100.0% |
Housing Structures by Occupancy in Lancaster
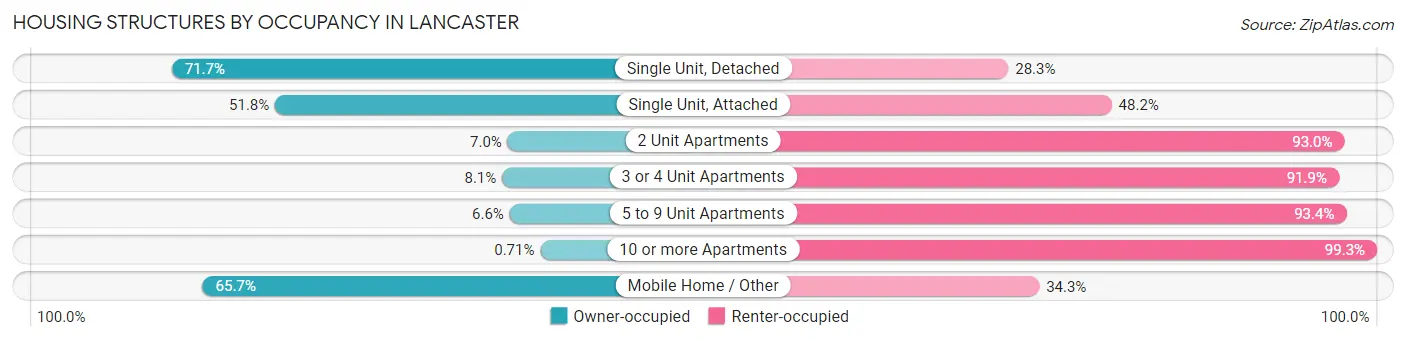
| Structure Type | Owner-occupied | Renter-occupied |
| Single Unit, Detached | 26,505 (71.7%) | 10,476 (28.3%) |
| Single Unit, Attached | 497 (51.8%) | 463 (48.2%) |
| 2 Unit Apartments | 43 (7.0%) | 572 (93.0%) |
| 3 or 4 Unit Apartments | 134 (8.1%) | 1,528 (91.9%) |
| 5 to 9 Unit Apartments | 206 (6.6%) | 2,910 (93.4%) |
| 10 or more Apartments | 37 (0.7%) | 5,198 (99.3%) |
| Mobile Home / Other | 2,479 (65.7%) | 1,293 (34.3%) |
| Total | 29,901 (57.1%) | 22,440 (42.9%) |
Housing Structures by Number of Rooms in Lancaster
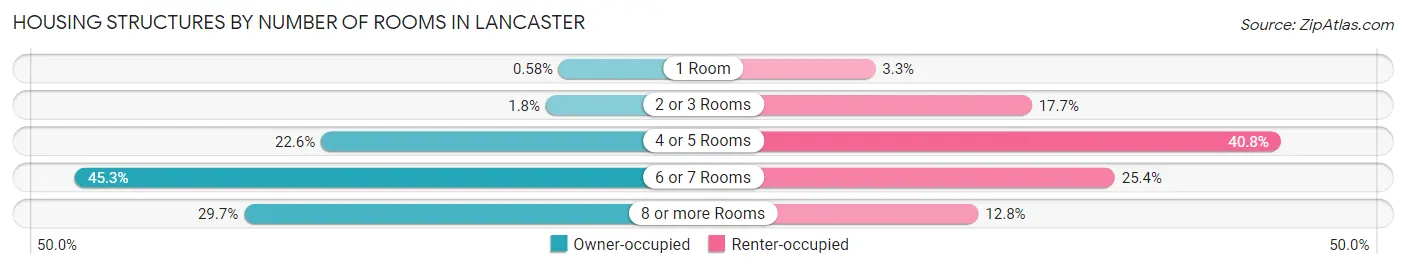
| Number of Rooms | Owner-occupied | Renter-occupied |
| 1 Room | 174 (0.6%) | 735 (3.3%) |
| 2 or 3 Rooms | 536 (1.8%) | 3,980 (17.7%) |
| 4 or 5 Rooms | 6,753 (22.6%) | 9,147 (40.8%) |
| 6 or 7 Rooms | 13,555 (45.3%) | 5,704 (25.4%) |
| 8 or more Rooms | 8,883 (29.7%) | 2,874 (12.8%) |
| Total | 29,901 (100.0%) | 22,440 (100.0%) |
Housing Structure by Heating Type in Lancaster
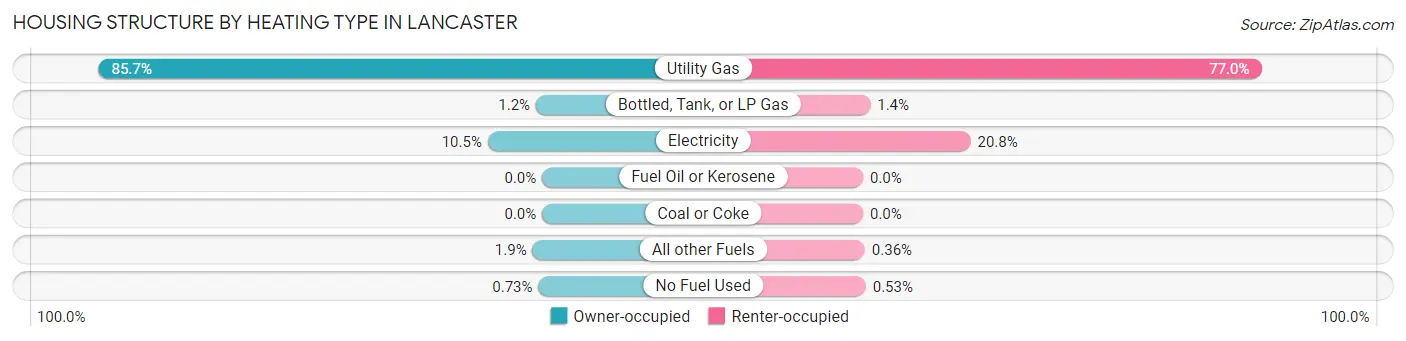
| Heating Type | Owner-occupied | Renter-occupied |
| Utility Gas | 25,625 (85.7%) | 17,267 (76.9%) |
| Bottled, Tank, or LP Gas | 357 (1.2%) | 314 (1.4%) |
| Electricity | 3,143 (10.5%) | 4,660 (20.8%) |
| Fuel Oil or Kerosene | 0 (0.0%) | 0 (0.0%) |
| Coal or Coke | 0 (0.0%) | 0 (0.0%) |
| All other Fuels | 557 (1.9%) | 81 (0.4%) |
| No Fuel Used | 219 (0.7%) | 118 (0.5%) |
| Total | 29,901 (100.0%) | 22,440 (100.0%) |
Household Vehicle Usage in Lancaster
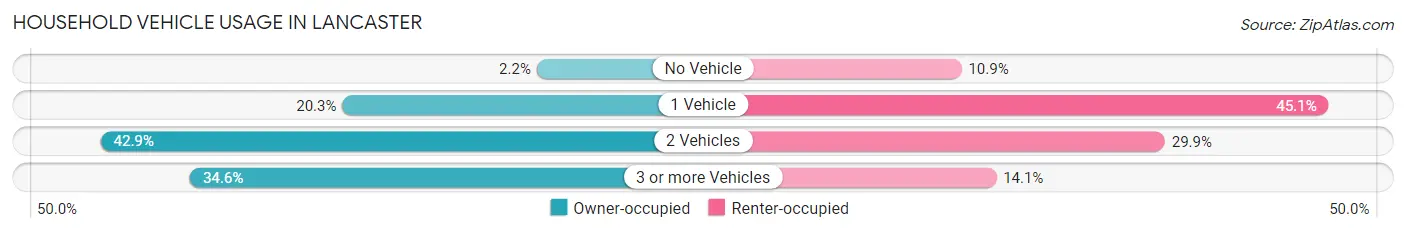
| Vehicles per Household | Owner-occupied | Renter-occupied |
| No Vehicle | 656 (2.2%) | 2,442 (10.9%) |
| 1 Vehicle | 6,082 (20.3%) | 10,130 (45.1%) |
| 2 Vehicles | 12,829 (42.9%) | 6,700 (29.9%) |
| 3 or more Vehicles | 10,334 (34.6%) | 3,168 (14.1%) |
| Total | 29,901 (100.0%) | 22,440 (100.0%) |
Real Estate & Mortgages in Lancaster
Real Estate and Mortgage Overview in Lancaster
| Characteristic | Without Mortgage | With Mortgage |
| Housing Units | 7,919 | 21,982 |
| Median Property Value | $301,600 | $385,700 |
| Median Household Income | $58,698 | $5,086 |
| Monthly Housing Costs | $656 | $2,920 |
| Real Estate Taxes | $2,797 | $426 |
Property Value by Mortgage Status in Lancaster
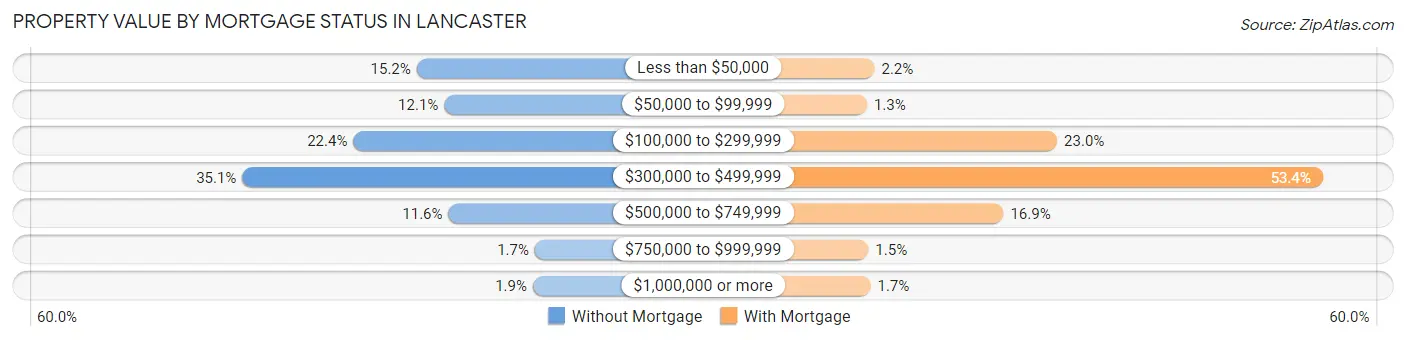
| Property Value | Without Mortgage | With Mortgage |
| Less than $50,000 | 1,204 (15.2%) | 477 (2.2%) |
| $50,000 to $99,999 | 954 (12.0%) | 288 (1.3%) |
| $100,000 to $299,999 | 1,777 (22.4%) | 5,065 (23.0%) |
| $300,000 to $499,999 | 2,782 (35.1%) | 11,737 (53.4%) |
| $500,000 to $749,999 | 916 (11.6%) | 3,717 (16.9%) |
| $750,000 to $999,999 | 134 (1.7%) | 323 (1.5%) |
| $1,000,000 or more | 152 (1.9%) | 375 (1.7%) |
| Total | 7,919 (100.0%) | 21,982 (100.0%) |
Household Income by Mortgage Status in Lancaster
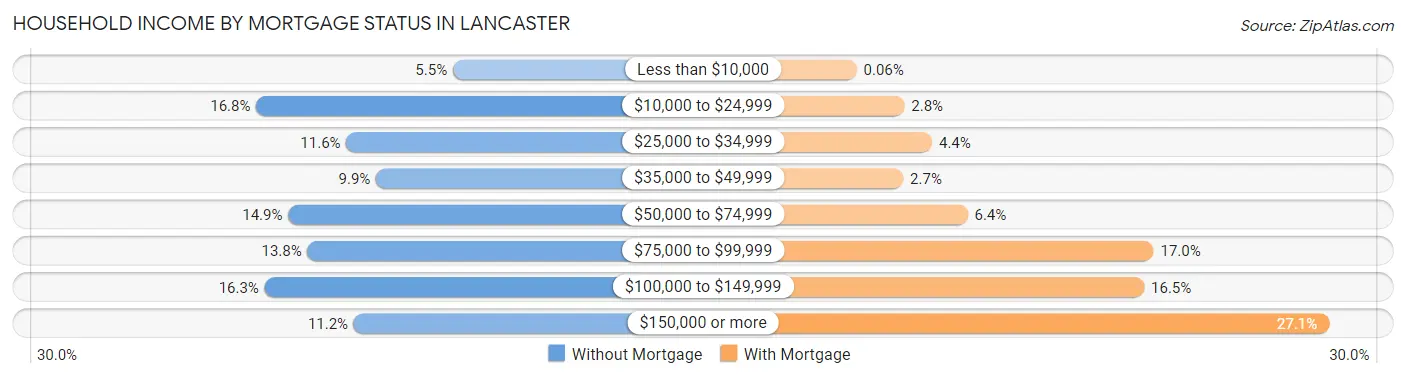
| Household Income | Without Mortgage | With Mortgage |
| Less than $10,000 | 437 (5.5%) | 14 (0.1%) |
| $10,000 to $24,999 | 1,327 (16.8%) | 614 (2.8%) |
| $25,000 to $34,999 | 919 (11.6%) | 960 (4.4%) |
| $35,000 to $49,999 | 785 (9.9%) | 597 (2.7%) |
| $50,000 to $74,999 | 1,182 (14.9%) | 1,407 (6.4%) |
| $75,000 to $99,999 | 1,095 (13.8%) | 3,744 (17.0%) |
| $100,000 to $149,999 | 1,289 (16.3%) | 3,625 (16.5%) |
| $150,000 or more | 885 (11.2%) | 5,949 (27.1%) |
| Total | 7,919 (100.0%) | 21,982 (100.0%) |
Property Value to Household Income Ratio in Lancaster
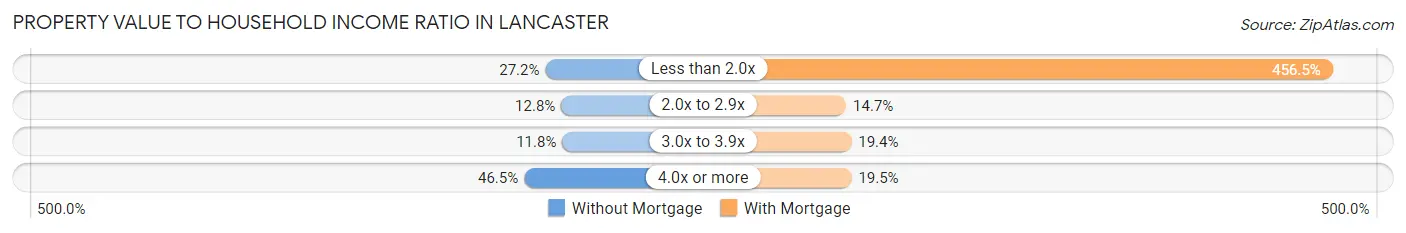
| Value-to-Income Ratio | Without Mortgage | With Mortgage |
| Less than 2.0x | 2,150 (27.2%) | 100,348 (456.5%) |
| 2.0x to 2.9x | 1,012 (12.8%) | 3,241 (14.7%) |
| 3.0x to 3.9x | 933 (11.8%) | 4,257 (19.4%) |
| 4.0x or more | 3,680 (46.5%) | 4,292 (19.5%) |
| Total | 7,919 (100.0%) | 21,982 (100.0%) |
Real Estate Taxes by Mortgage Status in Lancaster
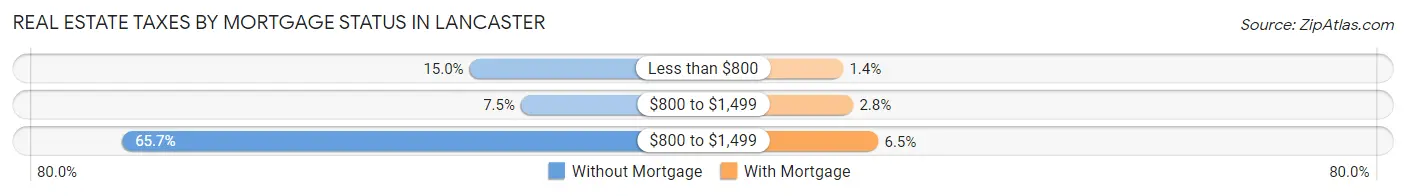
| Property Taxes | Without Mortgage | With Mortgage |
| Less than $800 | 1,188 (15.0%) | 302 (1.4%) |
| $800 to $1,499 | 594 (7.5%) | 625 (2.8%) |
| $800 to $1,499 | 5,205 (65.7%) | 1,429 (6.5%) |
| Total | 7,919 (100.0%) | 21,982 (100.0%) |
Health & Disability in Lancaster
Health Insurance Coverage by Age in Lancaster
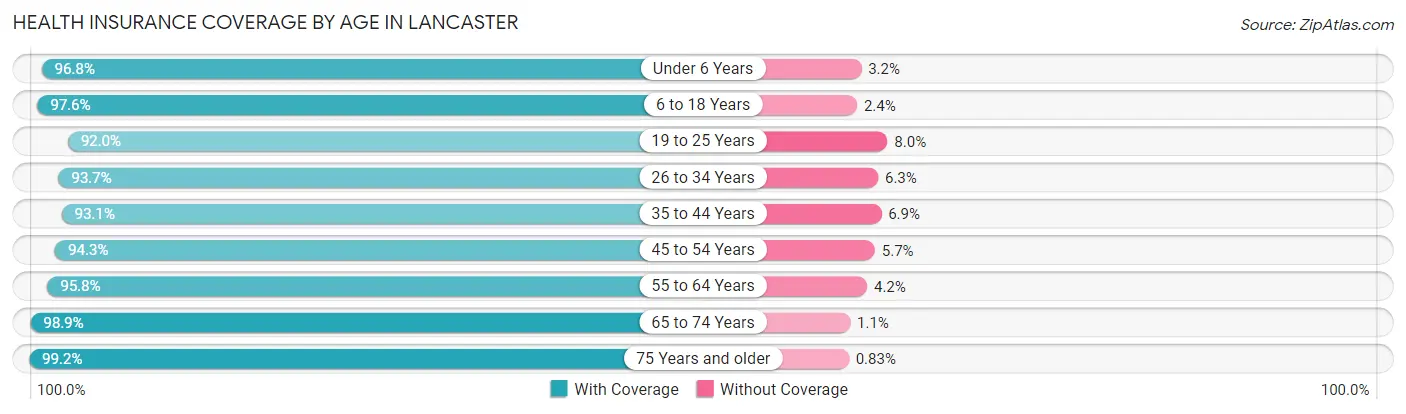
| Age Bracket | With Coverage | Without Coverage |
| Under 6 Years | 12,841 (96.8%) | 419 (3.2%) |
| 6 to 18 Years | 36,039 (97.6%) | 875 (2.4%) |
| 19 to 25 Years | 14,455 (92.0%) | 1,264 (8.0%) |
| 26 to 34 Years | 19,816 (93.7%) | 1,331 (6.3%) |
| 35 to 44 Years | 20,937 (93.1%) | 1,550 (6.9%) |
| 45 to 54 Years | 18,457 (94.3%) | 1,115 (5.7%) |
| 55 to 64 Years | 18,283 (95.8%) | 810 (4.2%) |
| 65 to 74 Years | 11,631 (98.9%) | 127 (1.1%) |
| 75 Years and older | 6,932 (99.2%) | 58 (0.8%) |
| Total | 159,391 (95.5%) | 7,549 (4.5%) |
Health Insurance Coverage by Citizenship Status in Lancaster
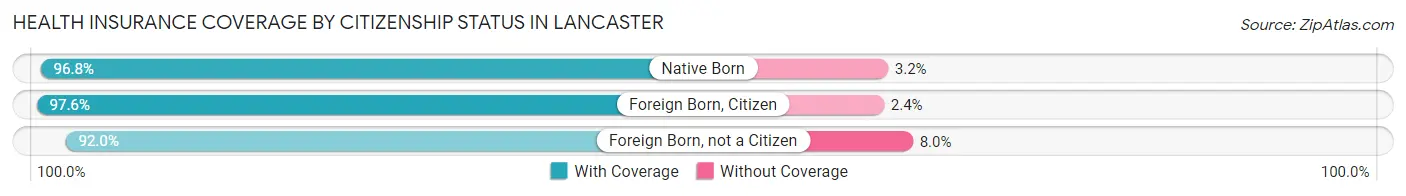
| Citizenship Status | With Coverage | Without Coverage |
| Native Born | 12,841 (96.8%) | 419 (3.2%) |
| Foreign Born, Citizen | 36,039 (97.6%) | 875 (2.4%) |
| Foreign Born, not a Citizen | 14,455 (92.0%) | 1,264 (8.0%) |
Health Insurance Coverage by Household Income in Lancaster
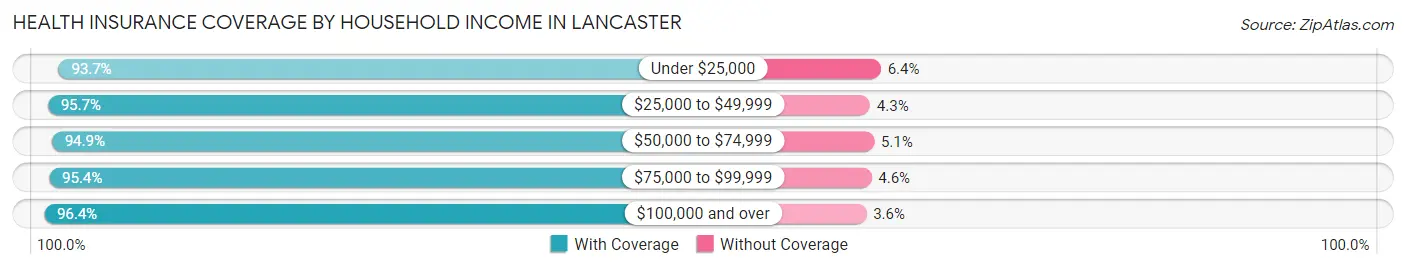
| Household Income | With Coverage | Without Coverage |
| Under $25,000 | 20,250 (93.6%) | 1,372 (6.4%) |
| $25,000 to $49,999 | 26,272 (95.7%) | 1,190 (4.3%) |
| $50,000 to $74,999 | 25,450 (94.9%) | 1,365 (5.1%) |
| $75,000 to $99,999 | 25,081 (95.4%) | 1,210 (4.6%) |
| $100,000 and over | 60,660 (96.4%) | 2,285 (3.6%) |
Public vs Private Health Insurance Coverage by Age in Lancaster
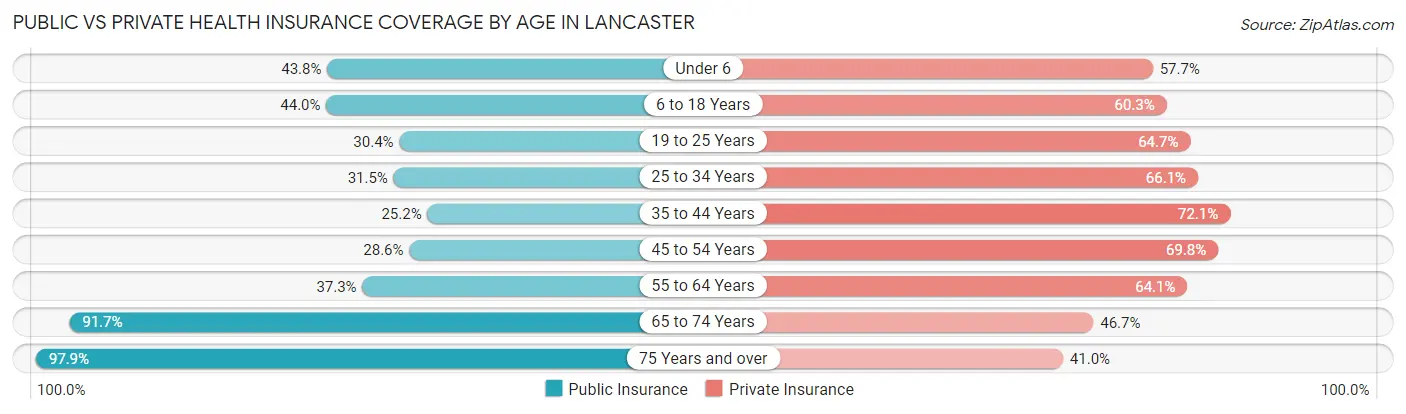
| Age Bracket | Public Insurance | Private Insurance |
| Under 6 | 5,811 (43.8%) | 7,652 (57.7%) |
| 6 to 18 Years | 16,240 (44.0%) | 22,253 (60.3%) |
| 19 to 25 Years | 4,784 (30.4%) | 10,165 (64.7%) |
| 25 to 34 Years | 6,660 (31.5%) | 13,976 (66.1%) |
| 35 to 44 Years | 5,672 (25.2%) | 16,204 (72.1%) |
| 45 to 54 Years | 5,594 (28.6%) | 13,670 (69.8%) |
| 55 to 64 Years | 7,120 (37.3%) | 12,243 (64.1%) |
| 65 to 74 Years | 10,782 (91.7%) | 5,489 (46.7%) |
| 75 Years and over | 6,844 (97.9%) | 2,869 (41.0%) |
| Total | 69,507 (41.6%) | 104,521 (62.6%) |
Disability Status by Sex by Age in Lancaster
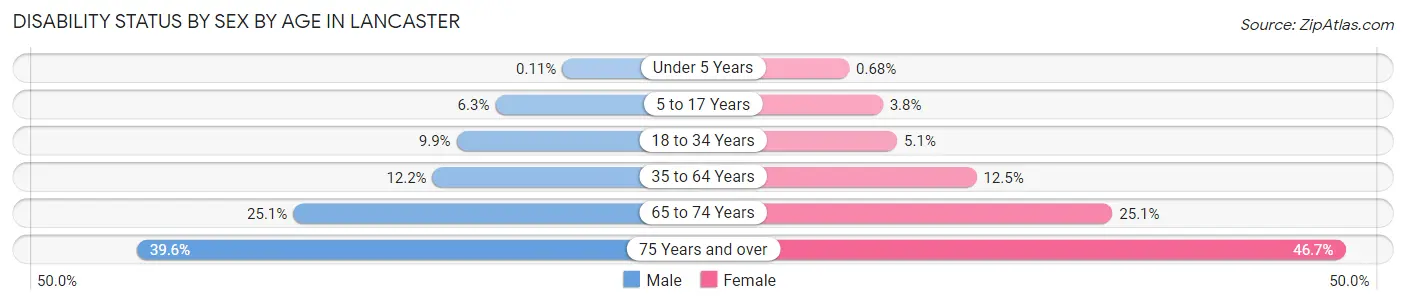
| Age Bracket | Male | Female |
| Under 5 Years | 6 (0.1%) | 37 (0.7%) |
| 5 to 17 Years | 1,204 (6.3%) | 663 (3.8%) |
| 18 to 34 Years | 1,976 (9.9%) | 1,007 (5.1%) |
| 35 to 64 Years | 3,549 (12.1%) | 3,994 (12.5%) |
| 65 to 74 Years | 1,346 (25.1%) | 1,605 (25.1%) |
| 75 Years and over | 1,121 (39.6%) | 1,943 (46.7%) |
Disability Class by Sex by Age in Lancaster
Disability Class: Hearing Difficulty
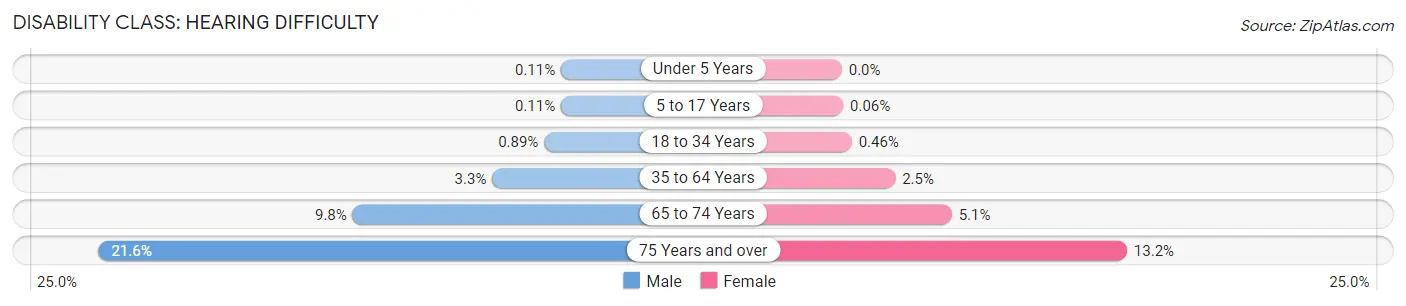
| Age Bracket | Male | Female |
| Under 5 Years | 6 (0.1%) | 0 (0.0%) |
| 5 to 17 Years | 21 (0.1%) | 10 (0.1%) |
| 18 to 34 Years | 177 (0.9%) | 91 (0.5%) |
| 35 to 64 Years | 963 (3.3%) | 793 (2.5%) |
| 65 to 74 Years | 525 (9.8%) | 326 (5.1%) |
| 75 Years and over | 611 (21.6%) | 550 (13.2%) |
Disability Class: Vision Difficulty
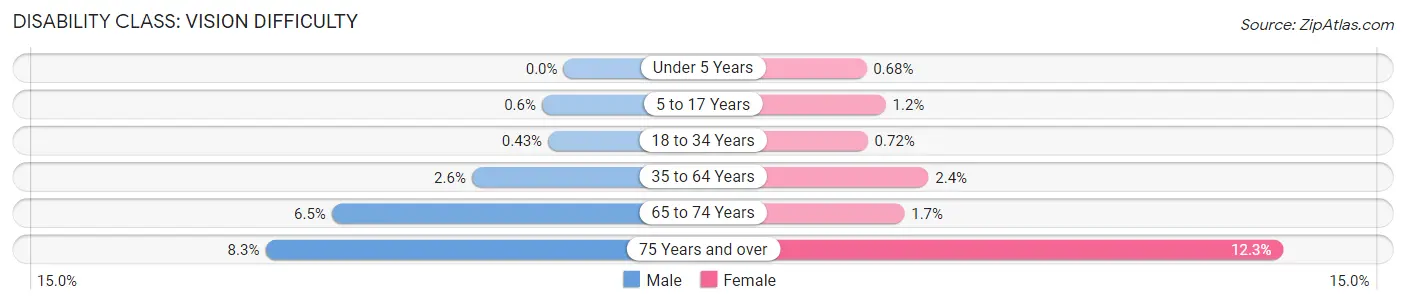
| Age Bracket | Male | Female |
| Under 5 Years | 0 (0.0%) | 37 (0.7%) |
| 5 to 17 Years | 114 (0.6%) | 212 (1.2%) |
| 18 to 34 Years | 85 (0.4%) | 142 (0.7%) |
| 35 to 64 Years | 744 (2.5%) | 769 (2.4%) |
| 65 to 74 Years | 346 (6.5%) | 111 (1.7%) |
| 75 Years and over | 235 (8.3%) | 511 (12.3%) |
Disability Class: Cognitive Difficulty
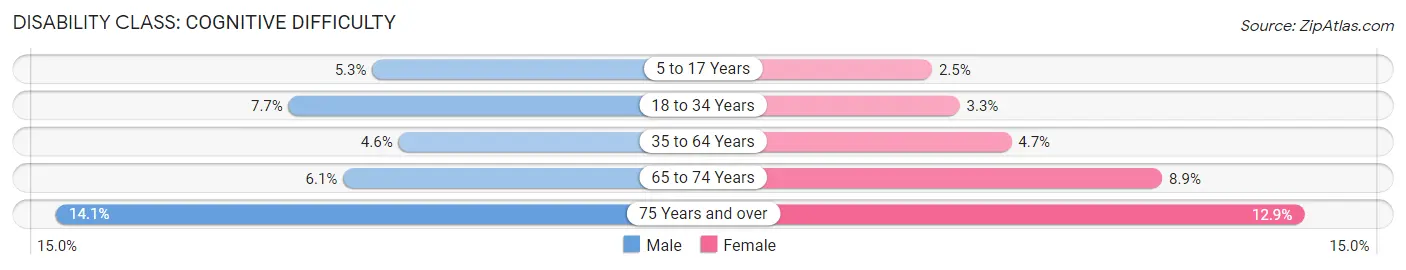
| Age Bracket | Male | Female |
| 5 to 17 Years | 1,013 (5.3%) | 438 (2.5%) |
| 18 to 34 Years | 1,525 (7.6%) | 642 (3.3%) |
| 35 to 64 Years | 1,342 (4.6%) | 1,508 (4.7%) |
| 65 to 74 Years | 329 (6.1%) | 570 (8.9%) |
| 75 Years and over | 400 (14.1%) | 535 (12.9%) |
Disability Class: Ambulatory Difficulty
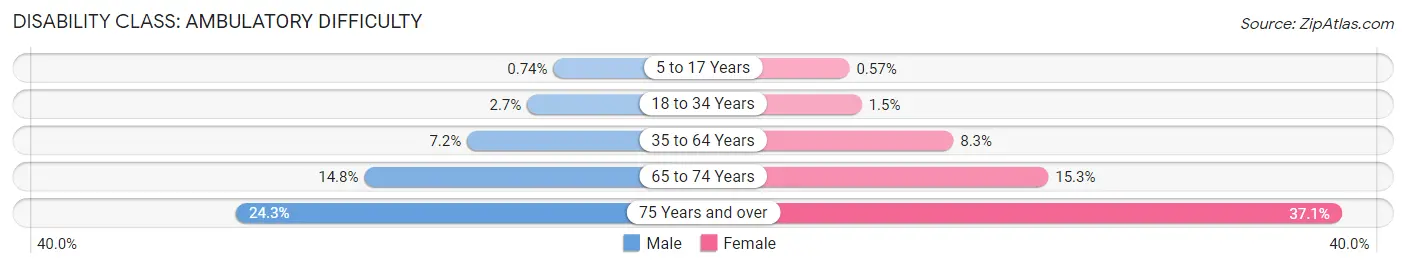
| Age Bracket | Male | Female |
| 5 to 17 Years | 141 (0.7%) | 99 (0.6%) |
| 18 to 34 Years | 535 (2.7%) | 291 (1.5%) |
| 35 to 64 Years | 2,089 (7.1%) | 2,646 (8.3%) |
| 65 to 74 Years | 793 (14.8%) | 980 (15.3%) |
| 75 Years and over | 688 (24.3%) | 1,543 (37.1%) |
Disability Class: Self-Care Difficulty
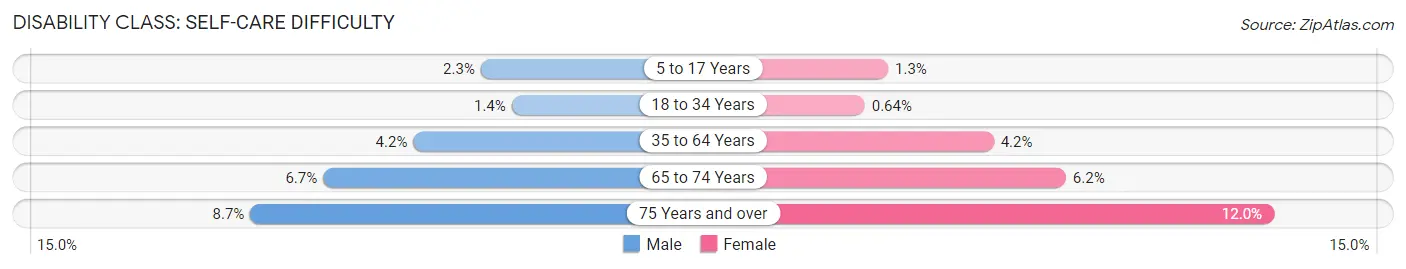
| Age Bracket | Male | Female |
| 5 to 17 Years | 438 (2.3%) | 225 (1.3%) |
| 18 to 34 Years | 287 (1.4%) | 126 (0.6%) |
| 35 to 64 Years | 1,220 (4.2%) | 1,352 (4.2%) |
| 65 to 74 Years | 359 (6.7%) | 399 (6.2%) |
| 75 Years and over | 247 (8.7%) | 500 (12.0%) |
Technology Access in Lancaster
Computing Device Access in Lancaster
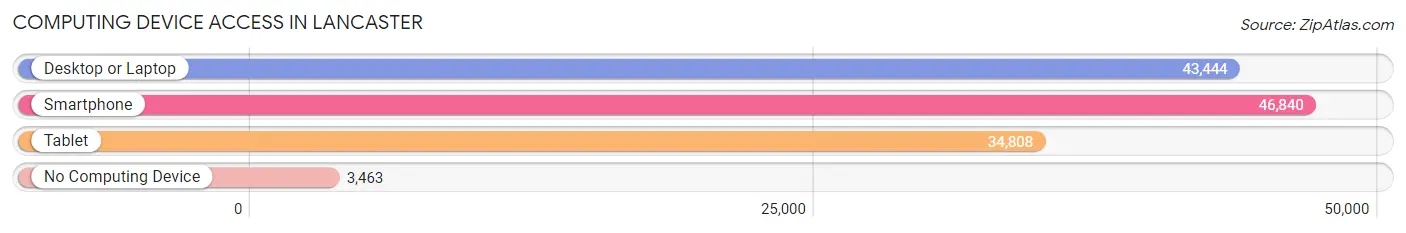
| Device Type | # Households | % Households |
| Desktop or Laptop | 43,444 | 83.0% |
| Smartphone | 46,840 | 89.5% |
| Tablet | 34,808 | 66.5% |
| No Computing Device | 3,463 | 6.6% |
| Total | 52,341 | 100.0% |
Internet Access in Lancaster
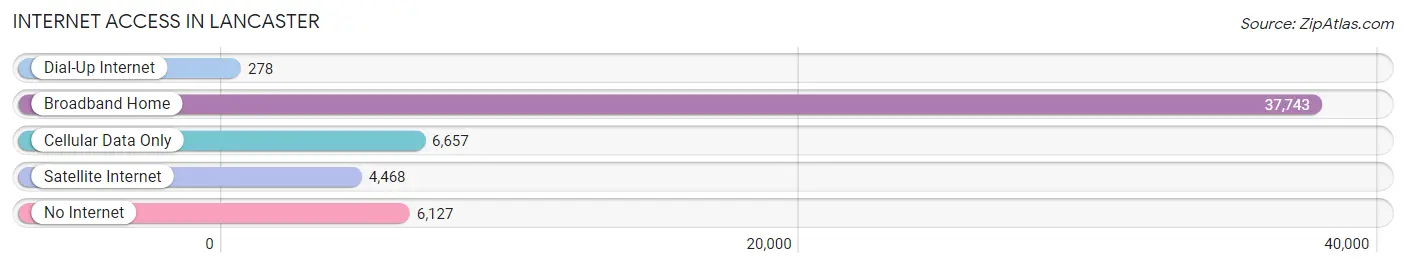
| Internet Type | # Households | % Households |
| Dial-Up Internet | 278 | 0.5% |
| Broadband Home | 37,743 | 72.1% |
| Cellular Data Only | 6,657 | 12.7% |
| Satellite Internet | 4,468 | 8.5% |
| No Internet | 6,127 | 11.7% |
| Total | 52,341 | 100.0% |
Lancaster Summary
Lancaster is a city located in the Antelope Valley of the western Mojave Desert in Los Angeles County, California. It is located approximately 70 miles (110 km) north of downtown Los Angeles. As of the 2010 census, Lancaster had a population of 156,633, making it the 31st largest city in California.
History
The area that is now Lancaster was originally inhabited by the Tataviam people, who were later displaced by the Chumash people. The first European to visit the area was explorer Antonio Fages in 1772. The area was later settled by the Spanish in 1776, and the city was founded in 1876 by settlers from the Midwest. The city was named after Lancaster, Pennsylvania, by settlers from that area.
The city was incorporated in 1977 and has since grown to become the largest city in the Antelope Valley. The city has experienced rapid growth in recent years, with its population increasing by more than 50% since 2000.
Geography
Lancaster is located in the western Mojave Desert, at an elevation of 2,461 feet (750 m). The city is located in the Antelope Valley, which is part of the larger Mojave Desert region. The city is bordered by the San Gabriel Mountains to the south and the Tehachapi Mountains to the north.
The city covers an area of 94.5 square miles (244 km2), of which 94.2 square miles (244 km2) is land and 0.3 square miles (0.78 km2) is water.
Economy
Lancaster is a major center for aerospace and defense industries, with companies such as Boeing, Lockheed Martin, Northrop Grumman, and Raytheon having major operations in the city. The city is also home to a number of other industries, including manufacturing, retail, and healthcare.
The city has a total labor force of over 50,000 people, with an unemployment rate of 6.2%. The median household income in the city is $54,845, and the median family income is $63,945.
Demographics
As of the 2010 census, there were 156,633 people, 51,845 households, and 37,945 families residing in the city. The population density was 1,664.3 people per square mile (642.2/km2). The racial makeup of the city was 57.2% White, 8.2% African American, 1.2% Native American, 5.2% Asian, 0.4% Pacific Islander, 25.2% from other races, and 3.0% from two or more races. Hispanic or Latino of any race were 44.3% of the population.
The median age in the city was 30.7 years, with 24.2% of the population under the age of 18, 10.3% between the ages of 18 and 24, 30.2% between the ages of 25 and 44, 20.3% between the ages of 45 and 64, and 14.9% 65 years of age or older. The gender makeup of the city was 49.2% male and 50.8% female.
Conclusion
Lancaster is a city located in the Antelope Valley of the western Mojave Desert in Los Angeles County, California. It is a major center for aerospace and defense industries, and has experienced rapid growth in recent years. As of the 2010 census, the city had a population of 156,633, with a median age of 30.7 years and a median household income of $54,845. The city is home to a diverse population, with a mix of races and ethnicities.
Common Questions
What is Per Capita Income in Lancaster?
Per Capita income in Lancaster is $28,082.
What is the Median Family Income in Lancaster?
Median Family Income in Lancaster is $78,572.
What is the Median Household income in Lancaster?
Median Household Income in Lancaster is $71,367.
What is Income or Wage Gap in Lancaster?
Income or Wage Gap in Lancaster is 16.5%.
Women in Lancaster earn 83.5 cents for every dollar earned by a man.
What is Family Income Deficit in Lancaster?
Family Income Deficit in Lancaster is $13,757.
Families that are below poverty line in Lancaster earn $13,757 less on average than the poverty threshold level.
What is Inequality or Gini Index in Lancaster?
Inequality or Gini Index in Lancaster is 0.45.
What is the Total Population of Lancaster?
Total Population of Lancaster is 171,465.
What is the Total Male Population of Lancaster?
Total Male Population of Lancaster is 86,180.
What is the Total Female Population of Lancaster?
Total Female Population of Lancaster is 85,285.
What is the Ratio of Males per 100 Females in Lancaster?
There are 101.05 Males per 100 Females in Lancaster.
What is the Ratio of Females per 100 Males in Lancaster?
There are 98.96 Females per 100 Males in Lancaster.
What is the Median Population Age in Lancaster?
Median Population Age in Lancaster is 33.6 Years.
What is the Average Family Size in Lancaster
Average Family Size in Lancaster is 3.7 People.
What is the Average Household Size in Lancaster
Average Household Size in Lancaster is 3.2 People.
How Large is the Labor Force in Lancaster?
There are 70,581 People in the Labor Forcein in Lancaster.
What is the Percentage of People in the Labor Force in Lancaster?
54.4% of People are in the Labor Force in Lancaster.
What is the Unemployment Rate in Lancaster?
Unemployment Rate in Lancaster is 7.5%.