Cities with the Highest Percentage of Central American Population in Michigan
RELATED REPORTS & OPTIONS
Central American
Michigan
Compare Cities
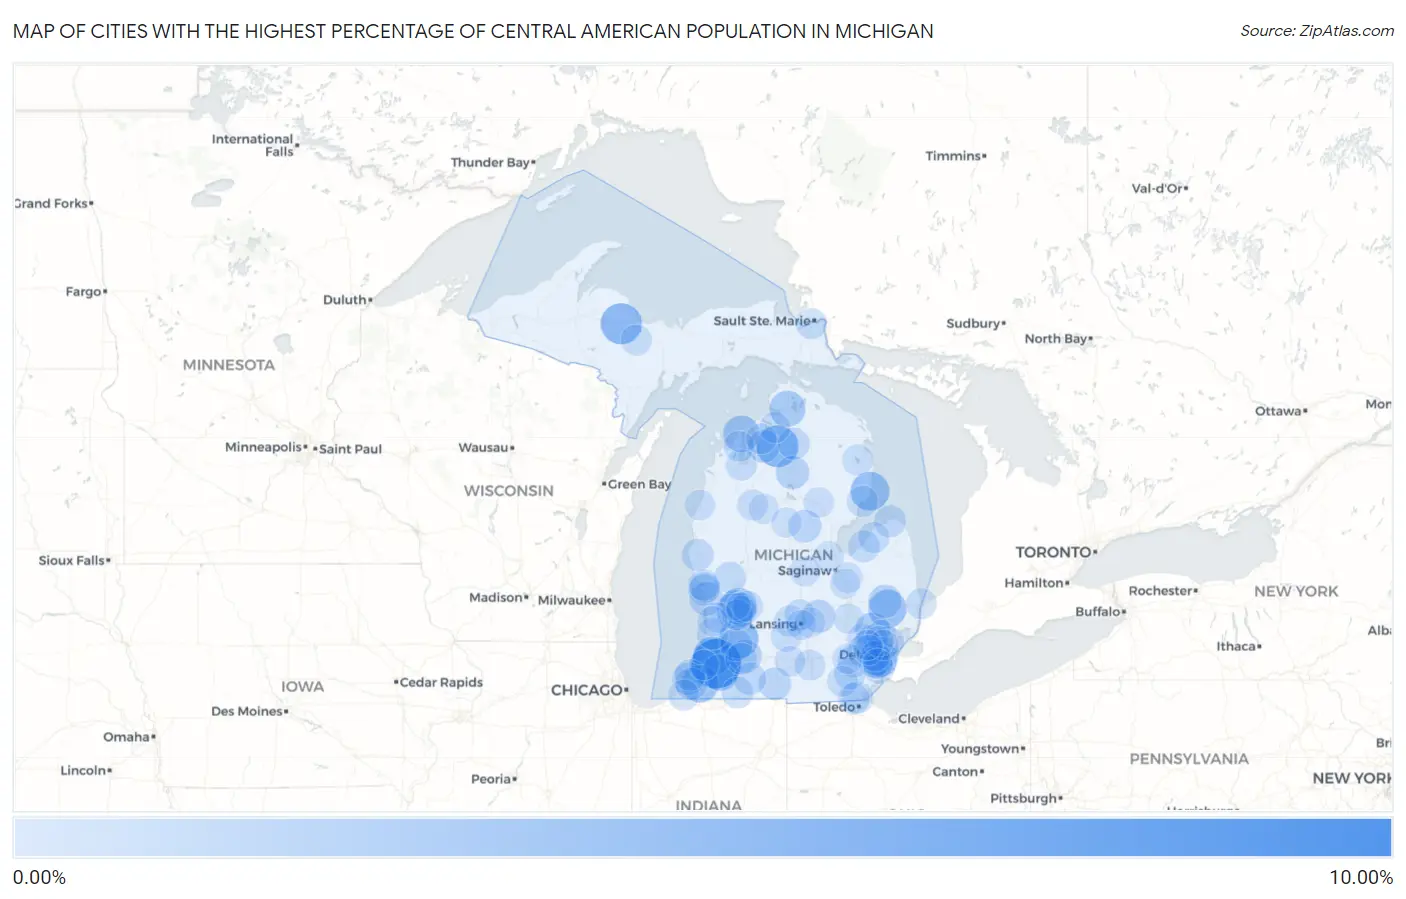
Map of Cities with the Highest Percentage of Central American Population in Michigan
0.00%
10.00%
Cities with the Highest Percentage of Central American Population in Michigan
| City | Central American | vs State | vs National | |
| 1. | Falmouth | 8.30% | 0.29%(+8.01)#1 | 1.81%(+6.49)#557 |
| 2. | Lawrence | 7.35% | 0.29%(+7.05)#2 | 1.81%(+5.54)#675 |
| 3. | Alba | 4.42% | 0.29%(+4.12)#3 | 1.81%(+2.61)#1,276 |
| 4. | West Ishpeming | 4.20% | 0.29%(+3.91)#4 | 1.81%(+2.39)#1,355 |
| 5. | Martin | 3.58% | 0.29%(+3.29)#5 | 1.81%(+1.77)#1,581 |
| 6. | Bangor | 3.38% | 0.29%(+3.09)#6 | 1.81%(+1.57)#1,678 |
| 7. | Oscoda | 3.38% | 0.29%(+3.08)#7 | 1.81%(+1.56)#1,686 |
| 8. | Almont | 3.11% | 0.29%(+2.82)#8 | 1.81%(+1.30)#1,814 |
| 9. | Ramsay | 2.94% | 0.29%(+2.65)#9 | 1.81%(+1.13)#1,916 |
| 10. | Berrien Springs | 2.92% | 0.29%(+2.62)#10 | 1.81%(+1.10)#1,930 |
| 11. | Melvindale | 2.89% | 0.29%(+2.59)#11 | 1.81%(+1.07)#1,946 |
| 12. | Wyoming | 2.64% | 0.29%(+2.35)#12 | 1.81%(+0.831)#2,115 |
| 13. | Grand Rapids | 2.61% | 0.29%(+2.31)#13 | 1.81%(+0.793)#2,140 |
| 14. | Northport | 2.58% | 0.29%(+2.28)#14 | 1.81%(+0.763)#2,166 |
| 15. | Decatur | 2.55% | 0.29%(+2.25)#15 | 1.81%(+0.732)#2,186 |
| 16. | Alanson | 2.32% | 0.29%(+2.03)#16 | 1.81%(+0.507)#2,358 |
| 17. | Pontiac | 2.04% | 0.29%(+1.74)#17 | 1.81%(+0.225)#2,617 |
| 18. | Grand Haven | 1.50% | 0.29%(+1.20)#18 | 1.81%(-0.317)#3,322 |
| 19. | Eastwood | 1.43% | 0.29%(+1.14)#19 | 1.81%(-0.382)#3,444 |
| 20. | Grayling | 1.42% | 0.29%(+1.13)#20 | 1.81%(-0.391)#3,458 |
| 21. | Imlay City | 1.35% | 0.29%(+1.06)#21 | 1.81%(-0.461)#3,592 |
| 22. | Perry | 1.27% | 0.29%(+0.977)#22 | 1.81%(-0.542)#3,760 |
| 23. | Gladwin | 1.17% | 0.29%(+0.880)#23 | 1.81%(-0.639)#3,930 |
| 24. | Stevensville | 1.15% | 0.29%(+0.861)#24 | 1.81%(-0.658)#3,972 |
| 25. | Bellaire | 1.15% | 0.29%(+0.858)#25 | 1.81%(-0.661)#3,981 |
| 26. | Coldwater | 1.10% | 0.29%(+0.808)#26 | 1.81%(-0.711)#4,097 |
| 27. | Otsego | 1.08% | 0.29%(+0.784)#27 | 1.81%(-0.735)#4,161 |
| 28. | Center Line | 1.05% | 0.29%(+0.754)#28 | 1.81%(-0.765)#4,234 |
| 29. | Mendon | 0.99% | 0.29%(+0.692)#29 | 1.81%(-0.827)#4,379 |
| 30. | Shelby | 0.95% | 0.29%(+0.658)#30 | 1.81%(-0.861)#4,480 |
| 31. | Port Austin | 0.90% | 0.29%(+0.606)#31 | 1.81%(-0.913)#4,625 |
| 32. | Baroda | 0.89% | 0.29%(+0.599)#32 | 1.81%(-0.920)#4,646 |
| 33. | Gaylord | 0.89% | 0.29%(+0.598)#33 | 1.81%(-0.921)#4,651 |
| 34. | Ypsilanti | 0.87% | 0.29%(+0.572)#34 | 1.81%(-0.947)#4,734 |
| 35. | Temperance | 0.81% | 0.29%(+0.517)#35 | 1.81%(-1.00)#4,933 |
| 36. | Fennville | 0.80% | 0.29%(+0.506)#36 | 1.81%(-1.01)#4,981 |
| 37. | Kalamazoo | 0.79% | 0.29%(+0.500)#37 | 1.81%(-1.02)#5,002 |
| 38. | Franklin | 0.79% | 0.29%(+0.498)#38 | 1.81%(-1.02)#5,015 |
| 39. | Plymouth | 0.77% | 0.29%(+0.480)#39 | 1.81%(-1.04)#5,076 |
| 40. | Sebewaing | 0.77% | 0.29%(+0.475)#40 | 1.81%(-1.04)#5,096 |
| 41. | Grant | 0.74% | 0.29%(+0.448)#41 | 1.81%(-1.07)#5,180 |
| 42. | Norton Shores | 0.74% | 0.29%(+0.446)#42 | 1.81%(-1.07)#5,187 |
| 43. | Constantine | 0.72% | 0.29%(+0.429)#43 | 1.81%(-1.09)#5,252 |
| 44. | Grand Ledge | 0.72% | 0.29%(+0.424)#44 | 1.81%(-1.09)#5,265 |
| 45. | Lambertville | 0.71% | 0.29%(+0.417)#45 | 1.81%(-1.10)#5,292 |
| 46. | East Tawas | 0.67% | 0.29%(+0.378)#46 | 1.81%(-1.14)#5,439 |
| 47. | Shoreham | 0.65% | 0.29%(+0.357)#47 | 1.81%(-1.16)#5,508 |
| 48. | Milan | 0.65% | 0.29%(+0.356)#48 | 1.81%(-1.16)#5,517 |
| 49. | Pigeon | 0.64% | 0.29%(+0.342)#49 | 1.81%(-1.18)#5,574 |
| 50. | Dewitt | 0.63% | 0.29%(+0.334)#50 | 1.81%(-1.19)#5,620 |
| 51. | Muskegon | 0.61% | 0.29%(+0.320)#51 | 1.81%(-1.20)#5,676 |
| 52. | Traverse City | 0.61% | 0.29%(+0.314)#52 | 1.81%(-1.21)#5,702 |
| 53. | Sault Ste Marie | 0.59% | 0.29%(+0.295)#53 | 1.81%(-1.22)#5,776 |
| 54. | Three Oaks | 0.58% | 0.29%(+0.286)#54 | 1.81%(-1.23)#5,813 |
| 55. | Boyne City | 0.58% | 0.29%(+0.282)#55 | 1.81%(-1.24)#5,835 |
| 56. | Hubbard Lake | 0.55% | 0.29%(+0.258)#56 | 1.81%(-1.26)#5,960 |
| 57. | Lincoln Park | 0.54% | 0.29%(+0.246)#57 | 1.81%(-1.27)#6,020 |
| 58. | Detroit | 0.51% | 0.29%(+0.218)#58 | 1.81%(-1.30)#6,145 |
| 59. | Gwinn | 0.51% | 0.29%(+0.217)#59 | 1.81%(-1.30)#6,151 |
| 60. | Cadillac | 0.51% | 0.29%(+0.216)#60 | 1.81%(-1.30)#6,157 |
| 61. | Kentwood | 0.50% | 0.29%(+0.206)#61 | 1.81%(-1.31)#6,213 |
| 62. | Cutlerville | 0.50% | 0.29%(+0.204)#62 | 1.81%(-1.32)#6,221 |
| 63. | Charlotte | 0.50% | 0.29%(+0.202)#63 | 1.81%(-1.32)#6,228 |
| 64. | Ecorse | 0.50% | 0.29%(+0.201)#64 | 1.81%(-1.32)#6,234 |
| 65. | Allen Park | 0.49% | 0.29%(+0.199)#65 | 1.81%(-1.32)#6,237 |
| 66. | Britton | 0.47% | 0.29%(+0.176)#66 | 1.81%(-1.34)#6,350 |
| 67. | Suttons Bay | 0.47% | 0.29%(+0.173)#67 | 1.81%(-1.35)#6,364 |
| 68. | Forest Hills | 0.46% | 0.29%(+0.163)#68 | 1.81%(-1.36)#6,410 |
| 69. | Port Huron | 0.46% | 0.29%(+0.163)#69 | 1.81%(-1.36)#6,413 |
| 70. | Vandercook Lake | 0.45% | 0.29%(+0.159)#70 | 1.81%(-1.36)#6,447 |
| 71. | Walker | 0.45% | 0.29%(+0.159)#71 | 1.81%(-1.36)#6,451 |
| 72. | Central Lake | 0.45% | 0.29%(+0.157)#72 | 1.81%(-1.36)#6,465 |
| 73. | Breckenridge | 0.42% | 0.29%(+0.131)#73 | 1.81%(-1.39)#6,625 |
| 74. | Taylor | 0.40% | 0.29%(+0.110)#74 | 1.81%(-1.41)#6,726 |
| 75. | Albion | 0.38% | 0.29%(+0.081)#75 | 1.81%(-1.44)#6,870 |
| 76. | Trenton | 0.37% | 0.29%(+0.081)#76 | 1.81%(-1.44)#6,877 |
| 77. | Muskegon Heights | 0.37% | 0.29%(+0.078)#77 | 1.81%(-1.44)#6,894 |
| 78. | Zeeland | 0.37% | 0.29%(+0.074)#78 | 1.81%(-1.44)#6,911 |
| 79. | Manistee | 0.37% | 0.29%(+0.074)#79 | 1.81%(-1.44)#6,915 |
| 80. | West Branch | 0.36% | 0.29%(+0.070)#80 | 1.81%(-1.45)#6,933 |
| 81. | Walled Lake | 0.36% | 0.29%(+0.064)#81 | 1.81%(-1.45)#6,976 |
| 82. | Haslett | 0.36% | 0.29%(+0.062)#82 | 1.81%(-1.46)#6,987 |
| 83. | Frankenmuth | 0.36% | 0.29%(+0.061)#83 | 1.81%(-1.46)#6,995 |
| 84. | Fenton | 0.34% | 0.29%(+0.049)#84 | 1.81%(-1.47)#7,085 |
| 85. | Holland | 0.34% | 0.29%(+0.045)#85 | 1.81%(-1.47)#7,107 |
| 86. | Troy | 0.31% | 0.29%(+0.019)#86 | 1.81%(-1.50)#7,281 |
| 87. | Auburn | 0.31% | 0.29%(+0.018)#87 | 1.81%(-1.50)#7,285 |
| 88. | Dearborn Heights | 0.30% | 0.29%(+0.009)#88 | 1.81%(-1.51)#7,356 |
| 89. | Ann Arbor | 0.29% | 0.29%(-0.001)#89 | 1.81%(-1.52)#7,428 |
| 90. | Hazel Park | 0.29% | 0.29%(-0.002)#90 | 1.81%(-1.52)#7,430 |
| 91. | Berkley | 0.28% | 0.29%(-0.010)#91 | 1.81%(-1.53)#7,479 |
| 92. | Mcbain | 0.27% | 0.29%(-0.026)#92 | 1.81%(-1.55)#7,584 |
| 93. | Watervliet | 0.27% | 0.29%(-0.028)#93 | 1.81%(-1.55)#7,596 |
| 94. | East Grand Rapids | 0.26% | 0.29%(-0.030)#94 | 1.81%(-1.55)#7,611 |
| 95. | Livonia | 0.26% | 0.29%(-0.032)#95 | 1.81%(-1.55)#7,618 |
| 96. | Southgate | 0.26% | 0.29%(-0.034)#96 | 1.81%(-1.55)#7,630 |
| 97. | Harrison | 0.26% | 0.29%(-0.034)#97 | 1.81%(-1.55)#7,636 |
| 98. | Birch Run | 0.25% | 0.29%(-0.040)#98 | 1.81%(-1.56)#7,673 |
| 99. | Farmington | 0.25% | 0.29%(-0.042)#99 | 1.81%(-1.56)#7,688 |
| 100. | Lansing | 0.25% | 0.29%(-0.043)#100 | 1.81%(-1.56)#7,695 |
Common Questions
What are the Top 10 Cities with the Highest Percentage of Central American Population in Michigan?
Top 10 Cities with the Highest Percentage of Central American Population in Michigan are:
#1
7.35%
#2
4.42%
#3
4.20%
#4
3.58%
#5
3.38%
#6
3.38%
#7
3.11%
#8
2.92%
#9
2.89%
#10
2.64%
What city has the Highest Percentage of Central American Population in Michigan?
Lawrence has the Highest Percentage of Central American Population in Michigan with 7.35%.
What is the Percentage of Central American Population in the State of Michigan?
Percentage of Central American Population in Michigan is 0.29%.
What is the Percentage of Central American Population in the United States?
Percentage of Central American Population in the United States is 1.81%.