San Rafael, CA Map & Demographics
San Rafael Map
San Rafael Overview
$66,398
PER CAPITA INCOME
$148,089
AVG FAMILY INCOME
$113,839
AVG HOUSEHOLD INCOME
15.0%
WAGE / INCOME GAP [ % ]
85.0¢/ $1
WAGE / INCOME GAP [ $ ]
$11,286
FAMILY INCOME DEFICIT
0.50
INEQUALITY / GINI INDEX
60,891
TOTAL POPULATION
30,110
MALE POPULATION
30,781
FEMALE POPULATION
97.82
MALES / 100 FEMALES
102.23
FEMALES / 100 MALES
44.0
MEDIAN AGE
3.1
AVG FAMILY SIZE
2.5
AVG HOUSEHOLD SIZE
33,187
LABOR FORCE [ PEOPLE ]
64.8%
PERCENT IN LABOR FORCE
4.8%
UNEMPLOYMENT RATE
San Rafael Area Codes
Income in San Rafael
Income Overview in San Rafael
Per Capita Income in San Rafael is $66,398, while median incomes of families and households are $148,089 and $113,839 respectively.
| Characteristic | Number | Measure |
| Per Capita Income | 60,891 | $66,398 |
| Median Family Income | 13,997 | $148,089 |
| Mean Family Income | 13,997 | $209,380 |
| Median Household Income | 23,370 | $113,839 |
| Mean Household Income | 23,370 | $170,207 |
| Income Deficit | 13,997 | $11,286 |
| Wage / Income Gap (%) | 60,891 | 14.95% |
| Wage / Income Gap ($) | 60,891 | 85.05¢ per $1 |
| Gini / Inequality Index | 60,891 | 0.50 |
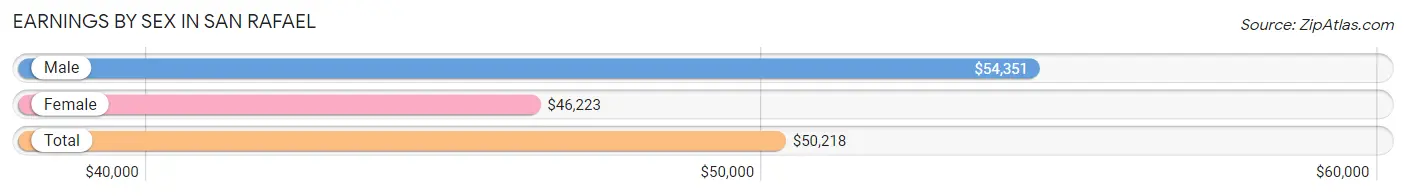
Earnings by Sex in San Rafael
Average Earnings in San Rafael are $50,218, $54,351 for men and $46,223 for women, a difference of 14.9%.
| Sex | Number | Average Earnings |
| Male | 18,631 (53.5%) | $54,351 |
| Female | 16,200 (46.5%) | $46,223 |
| Total | 34,831 (100.0%) | $50,218 |
Earnings by Sex by Income Bracket in San Rafael
The most common earnings brackets in San Rafael are $100,000+ for men (5,826 | 31.3%) and $100,000+ for women (3,723 | 23.0%).
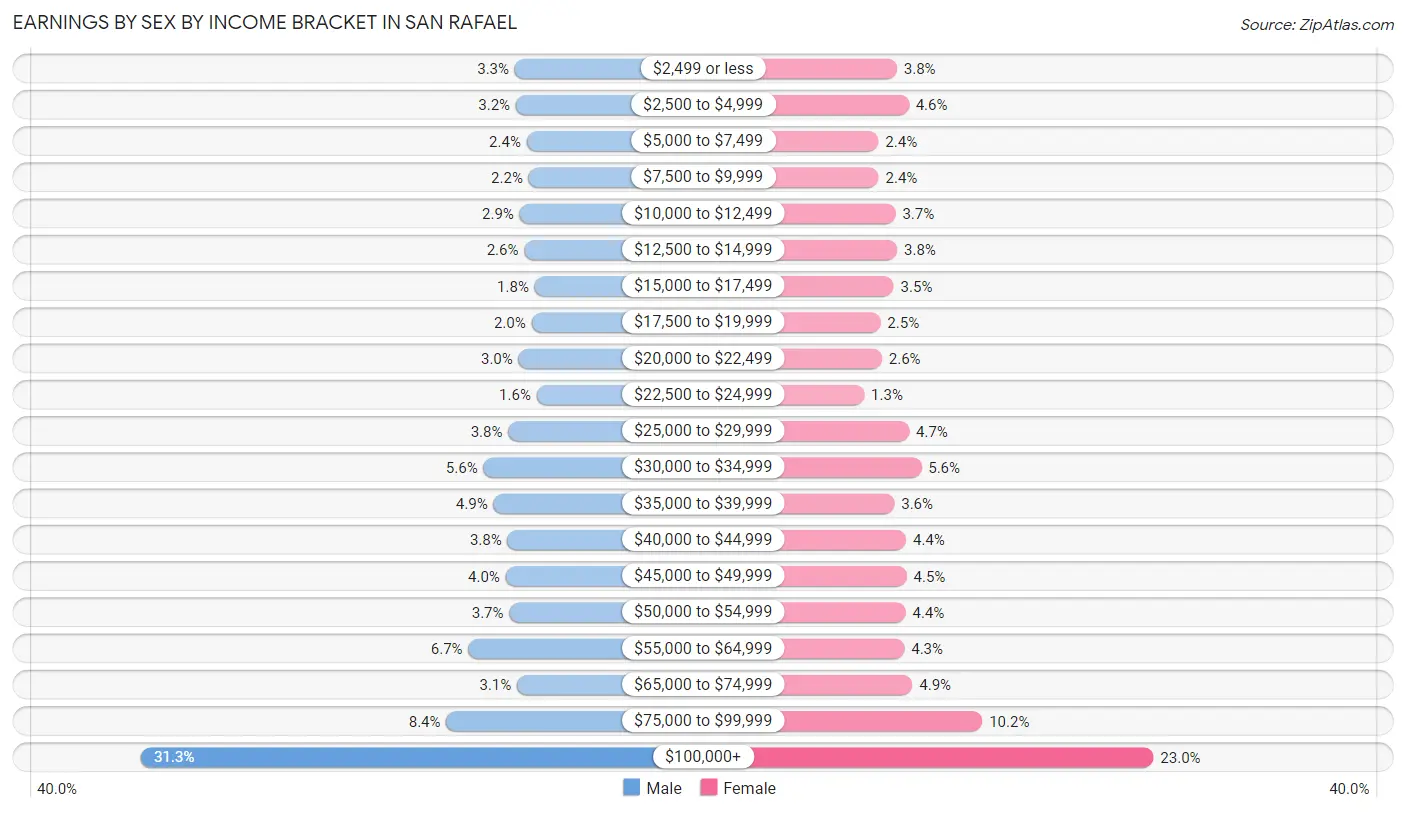
| Income | Male | Female |
| $2,499 or less | 607 (3.3%) | 607 (3.7%) |
| $2,500 to $4,999 | 592 (3.2%) | 752 (4.6%) |
| $5,000 to $7,499 | 441 (2.4%) | 384 (2.4%) |
| $7,500 to $9,999 | 414 (2.2%) | 385 (2.4%) |
| $10,000 to $12,499 | 541 (2.9%) | 591 (3.6%) |
| $12,500 to $14,999 | 476 (2.5%) | 611 (3.8%) |
| $15,000 to $17,499 | 330 (1.8%) | 568 (3.5%) |
| $17,500 to $19,999 | 375 (2.0%) | 409 (2.5%) |
| $20,000 to $22,499 | 556 (3.0%) | 426 (2.6%) |
| $22,500 to $24,999 | 302 (1.6%) | 210 (1.3%) |
| $25,000 to $29,999 | 699 (3.7%) | 756 (4.7%) |
| $30,000 to $34,999 | 1,045 (5.6%) | 904 (5.6%) |
| $35,000 to $39,999 | 905 (4.9%) | 576 (3.6%) |
| $40,000 to $44,999 | 710 (3.8%) | 720 (4.4%) |
| $45,000 to $49,999 | 736 (4.0%) | 726 (4.5%) |
| $50,000 to $54,999 | 683 (3.7%) | 713 (4.4%) |
| $55,000 to $64,999 | 1,255 (6.7%) | 699 (4.3%) |
| $65,000 to $74,999 | 575 (3.1%) | 795 (4.9%) |
| $75,000 to $99,999 | 1,563 (8.4%) | 1,645 (10.2%) |
| $100,000+ | 5,826 (31.3%) | 3,723 (23.0%) |
| Total | 18,631 (100.0%) | 16,200 (100.0%) |
Earnings by Sex by Educational Attainment in San Rafael
Average earnings in San Rafael are $62,101 for men and $53,320 for women, a difference of 14.1%. Men with an educational attainment of graduate degree enjoy the highest average annual earnings of $130,852, while those with less than high school education earn the least with $34,523. Women with an educational attainment of graduate degree earn the most with the average annual earnings of $92,698, while those with less than high school education have the smallest earnings of $23,626.
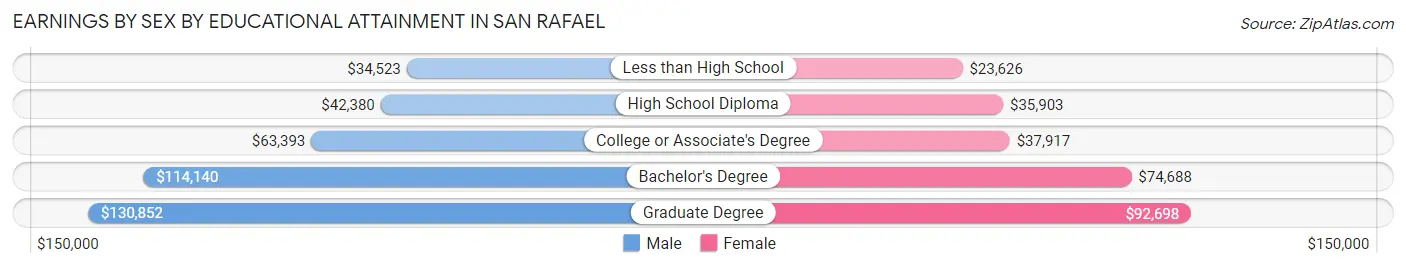
| Educational Attainment | Male Income | Female Income |
| Less than High School | $34,523 | $23,626 |
| High School Diploma | $42,380 | $35,903 |
| College or Associate's Degree | $63,393 | $37,917 |
| Bachelor's Degree | $114,140 | $74,688 |
| Graduate Degree | $130,852 | $92,698 |
| Total | $62,101 | $53,320 |
Family Income in San Rafael
Family Income Brackets in San Rafael
According to the San Rafael family income data, there are 5,165 families falling into the $200,000+ income range, which is the most common income bracket and makes up 36.9% of all families. Conversely, the $10,000 to $14,999 income bracket is the least frequent group with only 98 families (0.7%) belonging to this category.
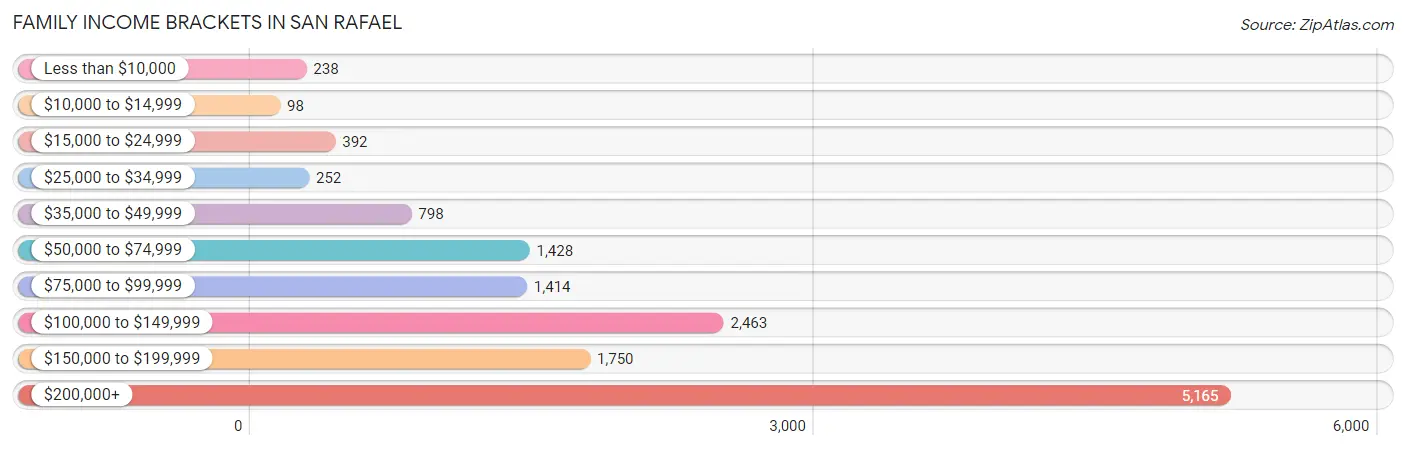
| Income Bracket | # Families | % Families |
| Less than $10,000 | 238 | 1.7% |
| $10,000 to $14,999 | 98 | 0.7% |
| $15,000 to $24,999 | 392 | 2.8% |
| $25,000 to $34,999 | 252 | 1.8% |
| $35,000 to $49,999 | 798 | 5.7% |
| $50,000 to $74,999 | 1,428 | 10.2% |
| $75,000 to $99,999 | 1,414 | 10.1% |
| $100,000 to $149,999 | 2,463 | 17.6% |
| $150,000 to $199,999 | 1,750 | 12.5% |
| $200,000+ | 5,165 | 36.9% |
Family Income by Famaliy Size in San Rafael
5-person families (1,025 | 7.3%) account for the highest median family income in San Rafael with $207,839 per family, while 2-person families (7,386 | 52.8%) have the highest median income of $71,153 per family member.
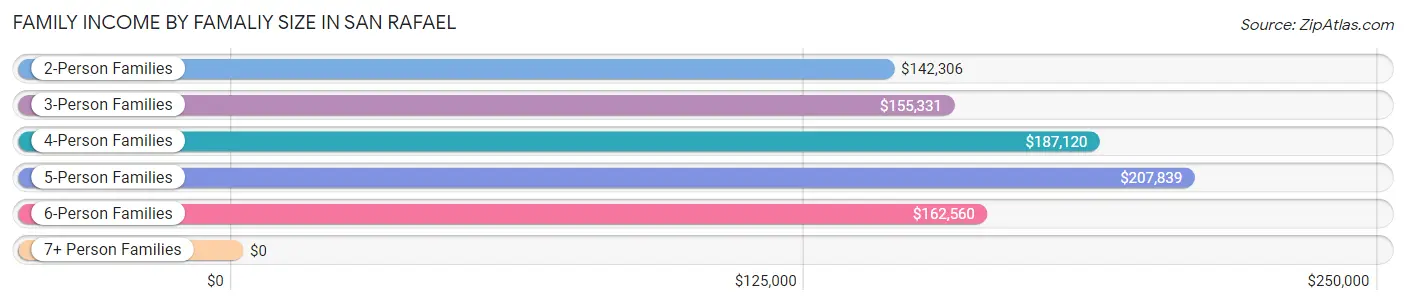
| Income Bracket | # Families | Median Income |
| 2-Person Families | 7,386 (52.8%) | $142,306 |
| 3-Person Families | 2,429 (17.3%) | $155,331 |
| 4-Person Families | 2,660 (19.0%) | $187,120 |
| 5-Person Families | 1,025 (7.3%) | $207,839 |
| 6-Person Families | 131 (0.9%) | $162,560 |
| 7+ Person Families | 366 (2.6%) | $0 |
| Total | 13,997 (100.0%) | $148,089 |
Family Income by Number of Earners in San Rafael
The median family income in San Rafael is $148,089, with families comprising 2 earners (6,670) having the highest median family income of $186,190, while families with no earners (1,799) have the lowest median family income of $113,438, accounting for 47.6% and 12.9% of families, respectively.
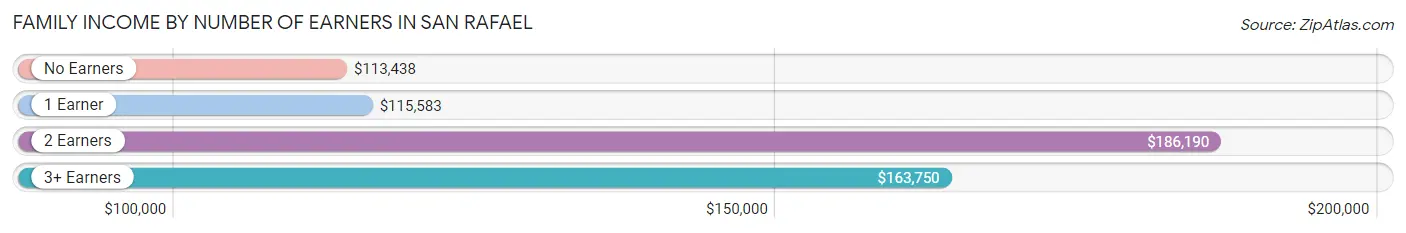
| Number of Earners | # Families | Median Income |
| No Earners | 1,799 (12.9%) | $113,438 |
| 1 Earner | 3,555 (25.4%) | $115,583 |
| 2 Earners | 6,670 (47.6%) | $186,190 |
| 3+ Earners | 1,973 (14.1%) | $163,750 |
| Total | 13,997 (100.0%) | $148,089 |
Household Income in San Rafael
Household Income Brackets in San Rafael
With 6,263 households falling in the category, the $200,000+ income range is the most frequent in San Rafael, accounting for 26.8% of all households. In contrast, only 444 households (1.9%) fall into the $10,000 to $14,999 income bracket, making it the least populous group.
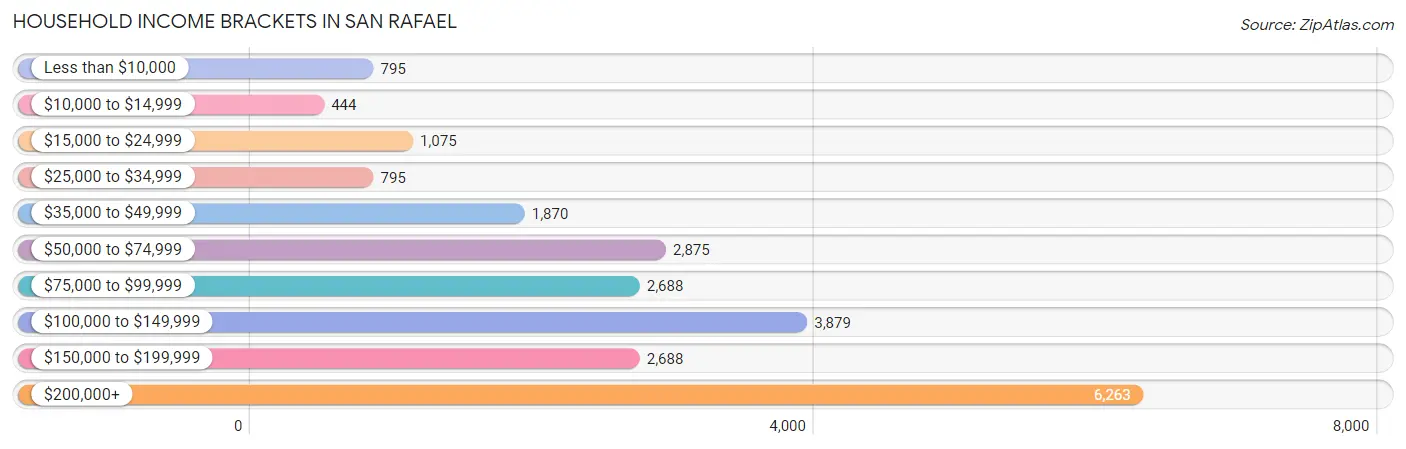
| Income Bracket | # Households | % Households |
| Less than $10,000 | 795 | 3.4% |
| $10,000 to $14,999 | 444 | 1.9% |
| $15,000 to $24,999 | 1,075 | 4.6% |
| $25,000 to $34,999 | 795 | 3.4% |
| $35,000 to $49,999 | 1,870 | 8.0% |
| $50,000 to $74,999 | 2,875 | 12.3% |
| $75,000 to $99,999 | 2,688 | 11.5% |
| $100,000 to $149,999 | 3,879 | 16.6% |
| $150,000 to $199,999 | 2,688 | 11.5% |
| $200,000+ | 6,263 | 26.8% |
Household Income by Householder Age in San Rafael
The median household income in San Rafael is $113,839, with the highest median household income of $131,223 found in the 45 to 64 years age bracket for the primary householder. A total of 9,387 households (40.2%) fall into this category. Meanwhile, the 15 to 24 years age bracket for the primary householder has the lowest median household income of $57,891, with 345 households (1.5%) in this group.
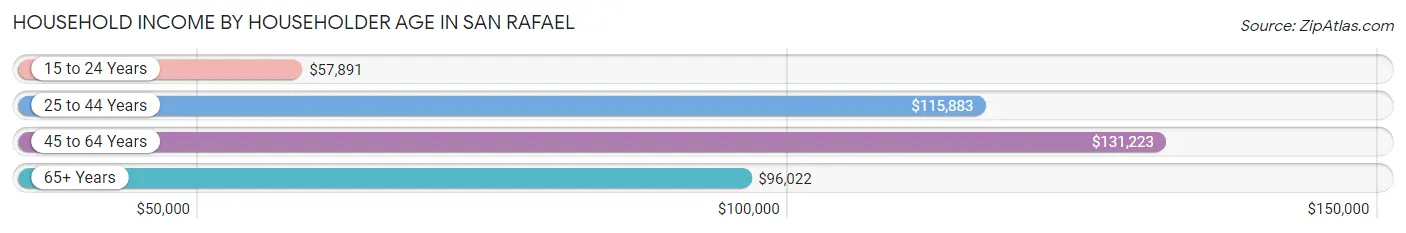
| Income Bracket | # Households | Median Income |
| 15 to 24 Years | 345 (1.5%) | $57,891 |
| 25 to 44 Years | 5,745 (24.6%) | $115,883 |
| 45 to 64 Years | 9,387 (40.2%) | $131,223 |
| 65+ Years | 7,893 (33.8%) | $96,022 |
| Total | 23,370 (100.0%) | $113,839 |
Poverty in San Rafael
Income Below Poverty by Sex and Age in San Rafael
With 9.1% poverty level for males and 8.6% for females among the residents of San Rafael, 6 to 11 year old males and 5 year old females are the most vulnerable to poverty, with 355 males (17.6%) and 84 females (16.3%) in their respective age groups living below the poverty level.
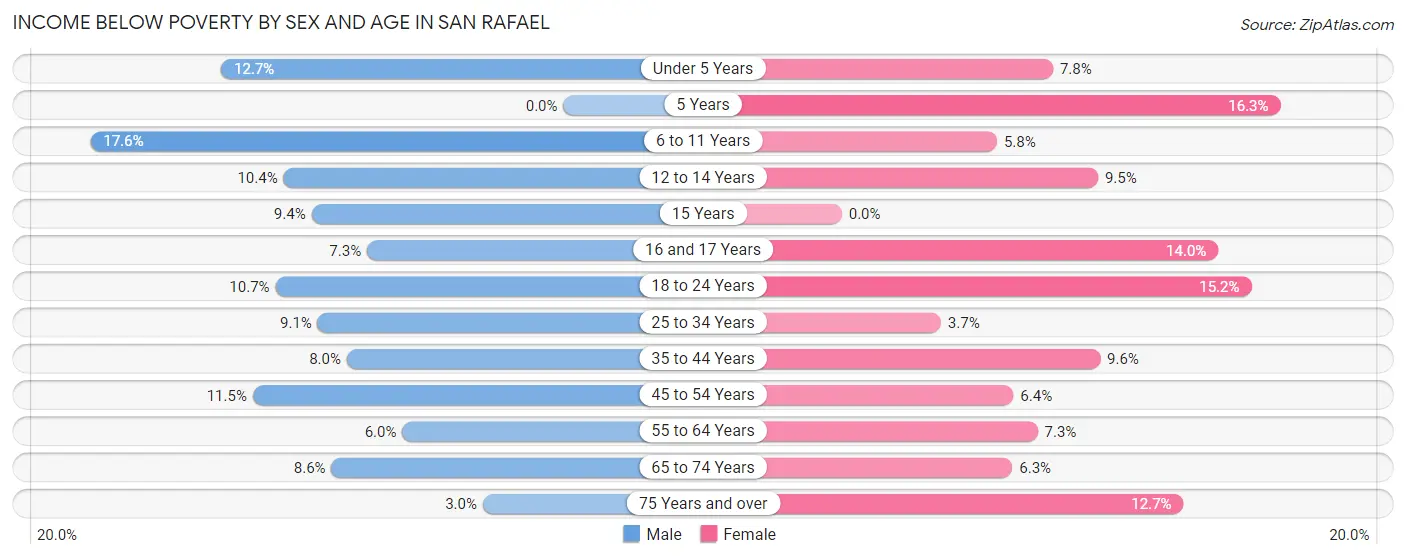
| Age Bracket | Male | Female |
| Under 5 Years | 167 (12.7%) | 80 (7.8%) |
| 5 Years | 0 (0.0%) | 84 (16.3%) |
| 6 to 11 Years | 355 (17.6%) | 85 (5.8%) |
| 12 to 14 Years | 119 (10.4%) | 108 (9.5%) |
| 15 Years | 36 (9.3%) | 0 (0.0%) |
| 16 and 17 Years | 52 (7.3%) | 115 (14.0%) |
| 18 to 24 Years | 268 (10.7%) | 369 (15.2%) |
| 25 to 34 Years | 311 (9.1%) | 100 (3.7%) |
| 35 to 44 Years | 357 (8.0%) | 356 (9.6%) |
| 45 to 54 Years | 424 (11.5%) | 277 (6.4%) |
| 55 to 64 Years | 247 (6.0%) | 350 (7.3%) |
| 65 to 74 Years | 270 (8.6%) | 210 (6.3%) |
| 75 Years and over | 60 (3.0%) | 471 (12.7%) |
| Total | 2,666 (9.1%) | 2,605 (8.6%) |
Income Above Poverty by Sex and Age in San Rafael
According to the poverty statistics in San Rafael, males aged 5 years and females aged 15 years are the age groups that are most secure financially, with 100.0% of males and 100.0% of females in these age groups living above the poverty line.
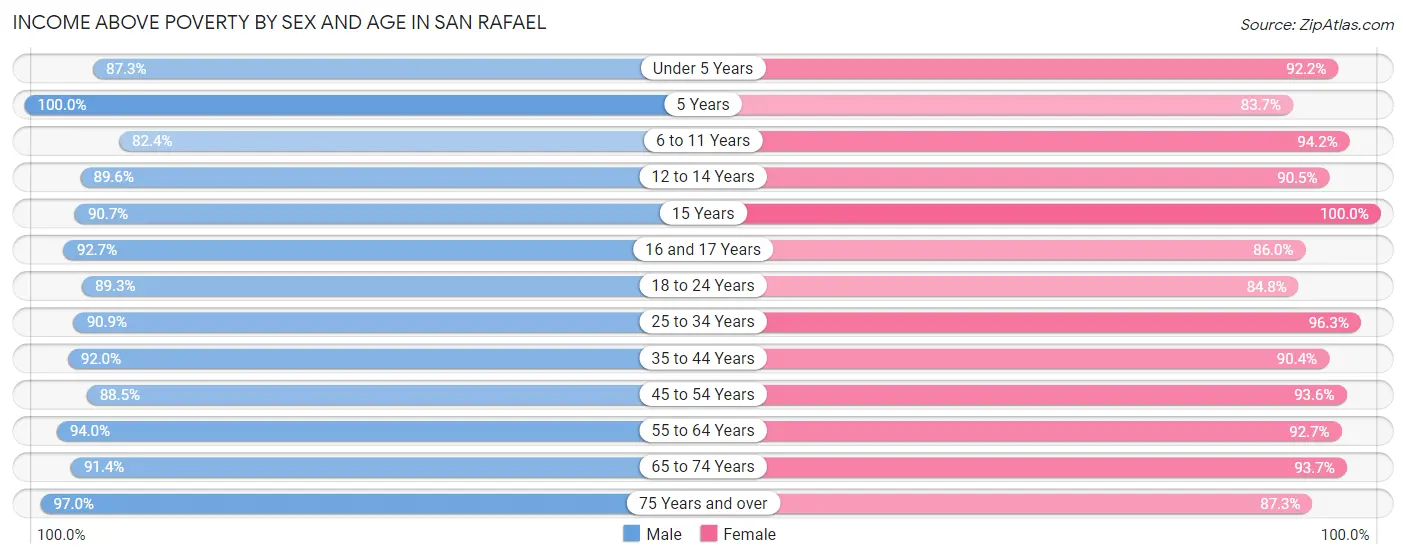
| Age Bracket | Male | Female |
| Under 5 Years | 1,147 (87.3%) | 941 (92.2%) |
| 5 Years | 288 (100.0%) | 432 (83.7%) |
| 6 to 11 Years | 1,667 (82.4%) | 1,390 (94.2%) |
| 12 to 14 Years | 1,026 (89.6%) | 1,028 (90.5%) |
| 15 Years | 349 (90.6%) | 156 (100.0%) |
| 16 and 17 Years | 661 (92.7%) | 708 (86.0%) |
| 18 to 24 Years | 2,240 (89.3%) | 2,059 (84.8%) |
| 25 to 34 Years | 3,098 (90.9%) | 2,621 (96.3%) |
| 35 to 44 Years | 4,085 (92.0%) | 3,355 (90.4%) |
| 45 to 54 Years | 3,254 (88.5%) | 4,071 (93.6%) |
| 55 to 64 Years | 3,886 (94.0%) | 4,462 (92.7%) |
| 65 to 74 Years | 2,866 (91.4%) | 3,110 (93.7%) |
| 75 Years and over | 1,945 (97.0%) | 3,243 (87.3%) |
| Total | 26,512 (90.9%) | 27,576 (91.4%) |
Income Below Poverty Among Married-Couple Families in San Rafael
The poverty statistics for married-couple families in San Rafael show that 2.4% or 258 of the total 10,831 families live below the poverty line. Families with 3 or 4 children have the highest poverty rate of 11.6%, comprising of 57 families. On the other hand, families with 5 or more children have the lowest poverty rate of 0.0%, which includes 0 families.
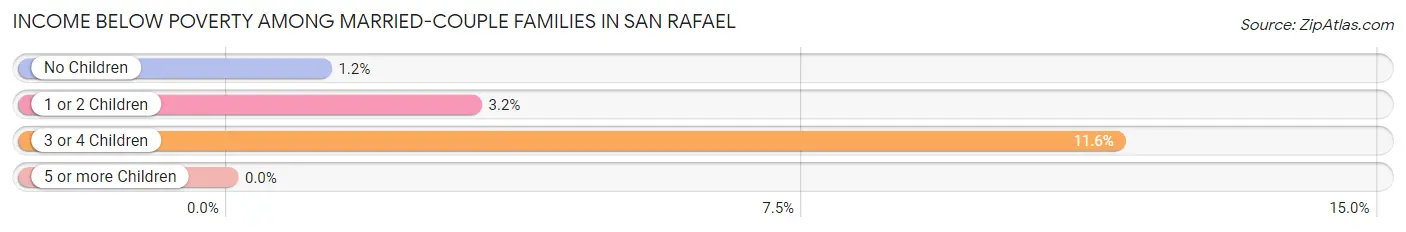
| Children | Above Poverty | Below Poverty |
| No Children | 6,332 (98.8%) | 78 (1.2%) |
| 1 or 2 Children | 3,747 (96.8%) | 123 (3.2%) |
| 3 or 4 Children | 435 (88.4%) | 57 (11.6%) |
| 5 or more Children | 59 (100.0%) | 0 (0.0%) |
| Total | 10,573 (97.6%) | 258 (2.4%) |
Income Below Poverty Among Single-Parent Households in San Rafael
According to the poverty data in San Rafael, 12.9% or 144 single-father households and 13.7% or 281 single-mother households are living below the poverty line. Among single-father households, those with 1 or 2 children have the highest poverty rate, with 82 households (17.0%) experiencing poverty. Likewise, among single-mother households, those with 3 or 4 children have the highest poverty rate, with 52 households (100.0%) falling below the poverty line.
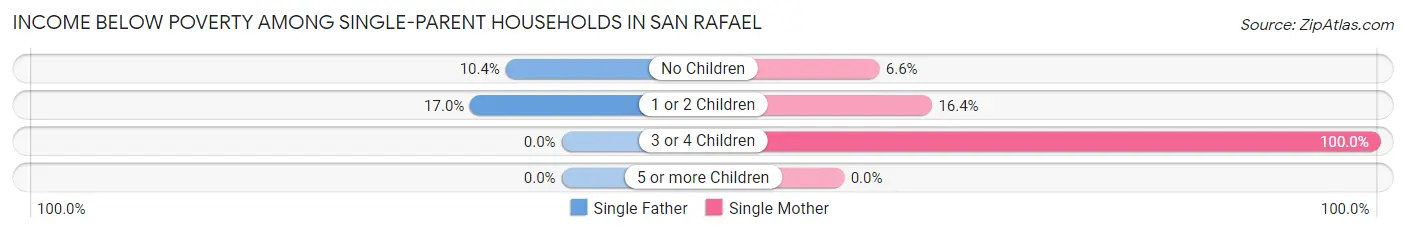
| Children | Single Father | Single Mother |
| No Children | 62 (10.4%) | 65 (6.6%) |
| 1 or 2 Children | 82 (17.0%) | 164 (16.4%) |
| 3 or 4 Children | 0 (0.0%) | 52 (100.0%) |
| 5 or more Children | 0 (0.0%) | 0 (0.0%) |
| Total | 144 (12.9%) | 281 (13.7%) |
Income Below Poverty Among Married-Couple vs Single-Parent Households in San Rafael
The poverty data for San Rafael shows that 258 of the married-couple family households (2.4%) and 425 of the single-parent households (13.4%) are living below the poverty level. Within the married-couple family households, those with 3 or 4 children have the highest poverty rate, with 57 households (11.6%) falling below the poverty line. Among the single-parent households, those with 3 or 4 children have the highest poverty rate, with 52 household (56.5%) living below poverty.
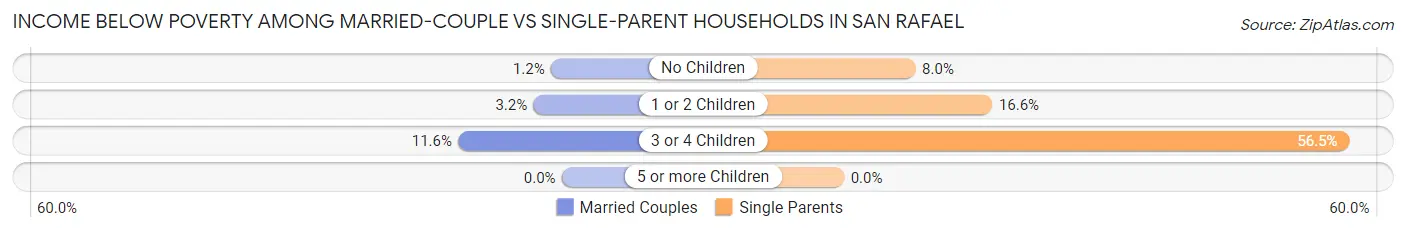
| Children | Married-Couple Families | Single-Parent Households |
| No Children | 78 (1.2%) | 127 (8.0%) |
| 1 or 2 Children | 123 (3.2%) | 246 (16.6%) |
| 3 or 4 Children | 57 (11.6%) | 52 (56.5%) |
| 5 or more Children | 0 (0.0%) | 0 (0.0%) |
| Total | 258 (2.4%) | 425 (13.4%) |
Race in San Rafael
The most populous races in San Rafael are White / Caucasian (37,996 | 62.4%), Hispanic or Latino (19,787 | 32.5%), and Some other Race (11,671 | 19.2%).
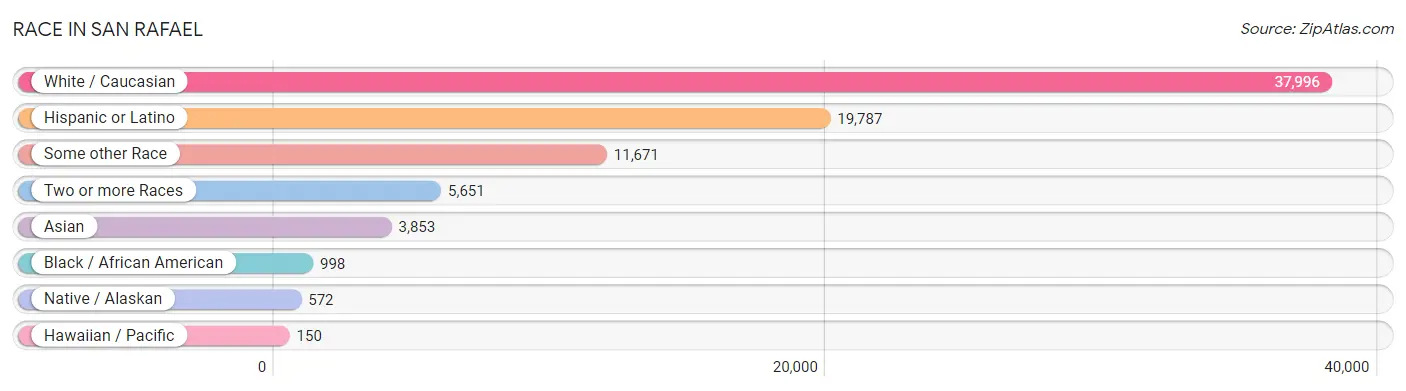
| Race | # Population | % Population |
| Asian | 3,853 | 6.3% |
| Black / African American | 998 | 1.6% |
| Hawaiian / Pacific | 150 | 0.3% |
| Hispanic or Latino | 19,787 | 32.5% |
| Native / Alaskan | 572 | 0.9% |
| White / Caucasian | 37,996 | 62.4% |
| Two or more Races | 5,651 | 9.3% |
| Some other Race | 11,671 | 19.2% |
| Total | 60,891 | 100.0% |
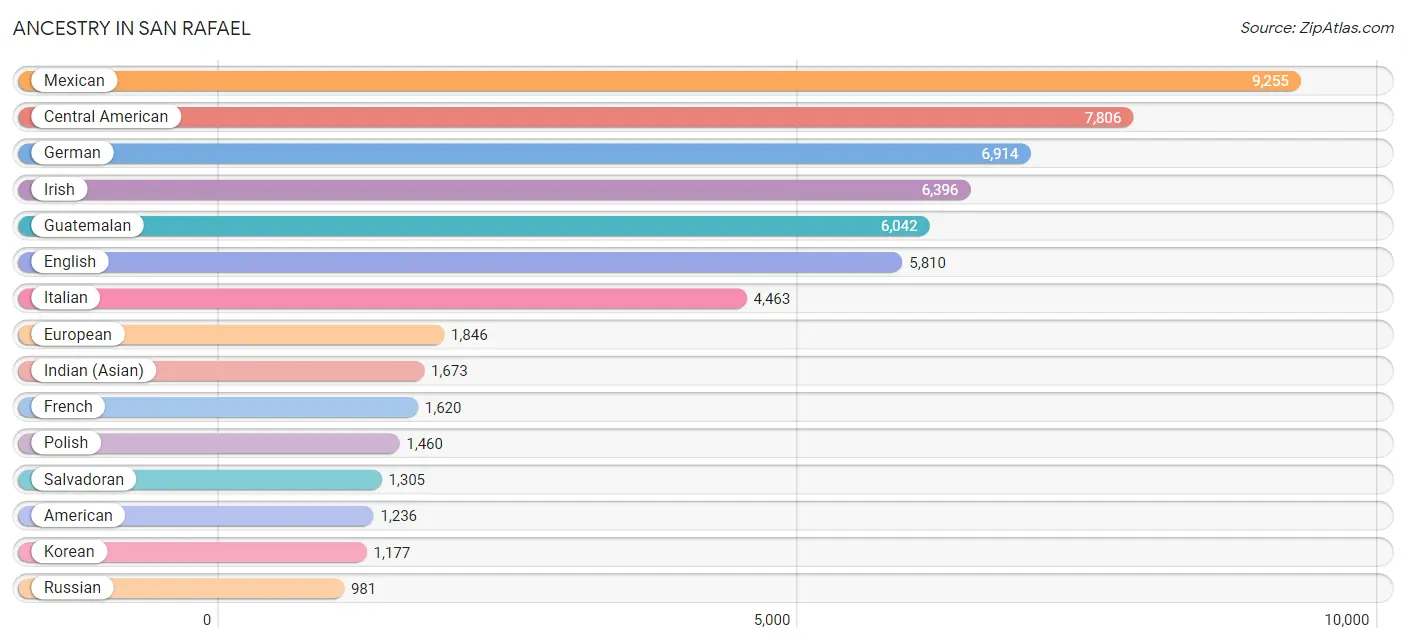
Ancestry in San Rafael
The most populous ancestries reported in San Rafael are Mexican (9,255 | 15.2%), Central American (7,806 | 12.8%), German (6,914 | 11.4%), Irish (6,396 | 10.5%), and Guatemalan (6,042 | 9.9%), together accounting for 59.8% of all San Rafael residents.
| Ancestry | # Population | % Population |
| Afghan | 20 | 0.0% |
| African | 104 | 0.2% |
| Alsatian | 31 | 0.1% |
| American | 1,236 | 2.0% |
| Arab | 732 | 1.2% |
| Argentinean | 47 | 0.1% |
| Armenian | 23 | 0.0% |
| Australian | 63 | 0.1% |
| Austrian | 233 | 0.4% |
| Bangladeshi | 9 | 0.0% |
| Basque | 112 | 0.2% |
| Belgian | 244 | 0.4% |
| Belizean | 13 | 0.0% |
| Bhutanese | 694 | 1.1% |
| Blackfeet | 13 | 0.0% |
| Bolivian | 118 | 0.2% |
| Brazilian | 61 | 0.1% |
| British | 507 | 0.8% |
| Burmese | 599 | 1.0% |
| Canadian | 232 | 0.4% |
| Central American | 7,806 | 12.8% |
| Central American Indian | 336 | 0.5% |
| Cherokee | 18 | 0.0% |
| Cheyenne | 14 | 0.0% |
| Chilean | 69 | 0.1% |
| Chippewa | 10 | 0.0% |
| Colombian | 58 | 0.1% |
| Comanche | 55 | 0.1% |
| Costa Rican | 170 | 0.3% |
| Croatian | 209 | 0.3% |
| Cuban | 222 | 0.4% |
| Czech | 232 | 0.4% |
| Czechoslovakian | 205 | 0.3% |
| Danish | 322 | 0.5% |
| Dominican | 73 | 0.1% |
| Dutch | 651 | 1.1% |
| Eastern European | 353 | 0.6% |
| Ecuadorian | 92 | 0.2% |
| Egyptian | 232 | 0.4% |
| English | 5,810 | 9.5% |
| Ethiopian | 18 | 0.0% |
| European | 1,846 | 3.0% |
| Filipino | 5 | 0.0% |
| Finnish | 43 | 0.1% |
| French | 1,620 | 2.7% |
| French Canadian | 375 | 0.6% |
| German | 6,914 | 11.4% |
| Greek | 509 | 0.8% |
| Guatemalan | 6,042 | 9.9% |
| Guyanese | 27 | 0.0% |
| Haitian | 5 | 0.0% |
| Honduran | 80 | 0.1% |
| Hungarian | 226 | 0.4% |
| Icelander | 24 | 0.0% |
| Indian (Asian) | 1,673 | 2.8% |
| Iranian | 217 | 0.4% |
| Irish | 6,396 | 10.5% |
| Iroquois | 20 | 0.0% |
| Israeli | 26 | 0.0% |
| Italian | 4,463 | 7.3% |
| Jamaican | 26 | 0.0% |
| Japanese | 203 | 0.3% |
| Jordanian | 105 | 0.2% |
| Korean | 1,177 | 1.9% |
| Latvian | 65 | 0.1% |
| Lebanese | 142 | 0.2% |
| Lithuanian | 239 | 0.4% |
| Luxembourger | 8 | 0.0% |
| Macedonian | 19 | 0.0% |
| Malaysian | 3 | 0.0% |
| Maltese | 13 | 0.0% |
| Mexican | 9,255 | 15.2% |
| Mexican American Indian | 269 | 0.4% |
| Mongolian | 16 | 0.0% |
| Native Hawaiian | 59 | 0.1% |
| Nicaraguan | 199 | 0.3% |
| Nigerian | 12 | 0.0% |
| Northern European | 214 | 0.4% |
| Norwegian | 557 | 0.9% |
| Pakistani | 121 | 0.2% |
| Palestinian | 18 | 0.0% |
| Pennsylvania German | 20 | 0.0% |
| Peruvian | 455 | 0.7% |
| Polish | 1,460 | 2.4% |
| Portuguese | 240 | 0.4% |
| Pueblo | 14 | 0.0% |
| Puerto Rican | 174 | 0.3% |
| Romanian | 89 | 0.2% |
| Russian | 981 | 1.6% |
| Salvadoran | 1,305 | 2.1% |
| Samoan | 22 | 0.0% |
| Scandinavian | 97 | 0.2% |
| Scotch-Irish | 456 | 0.7% |
| Scottish | 958 | 1.6% |
| Serbian | 13 | 0.0% |
| Slovak | 52 | 0.1% |
| Slovene | 7 | 0.0% |
| South African | 12 | 0.0% |
| South American | 852 | 1.4% |
| South American Indian | 6 | 0.0% |
| Soviet Union | 26 | 0.0% |
| Spaniard | 294 | 0.5% |
| Spanish | 251 | 0.4% |
| Sri Lankan | 476 | 0.8% |
| Subsaharan African | 146 | 0.2% |
| Swedish | 981 | 1.6% |
| Swiss | 318 | 0.5% |
| Syrian | 54 | 0.1% |
| Thai | 685 | 1.1% |
| Tlingit-Haida | 15 | 0.0% |
| Turkish | 8 | 0.0% |
| Ukrainian | 276 | 0.4% |
| Welsh | 497 | 0.8% |
| Yuman | 1 | 0.0% | View All 114 Rows |
Immigrants in San Rafael
The most numerous immigrant groups reported in San Rafael came from Latin America (10,126 | 16.6%), Central America (9,302 | 15.3%), Guatemala (4,026 | 6.6%), Mexico (3,670 | 6.0%), and Asia (2,861 | 4.7%), together accounting for 49.2% of all San Rafael residents.
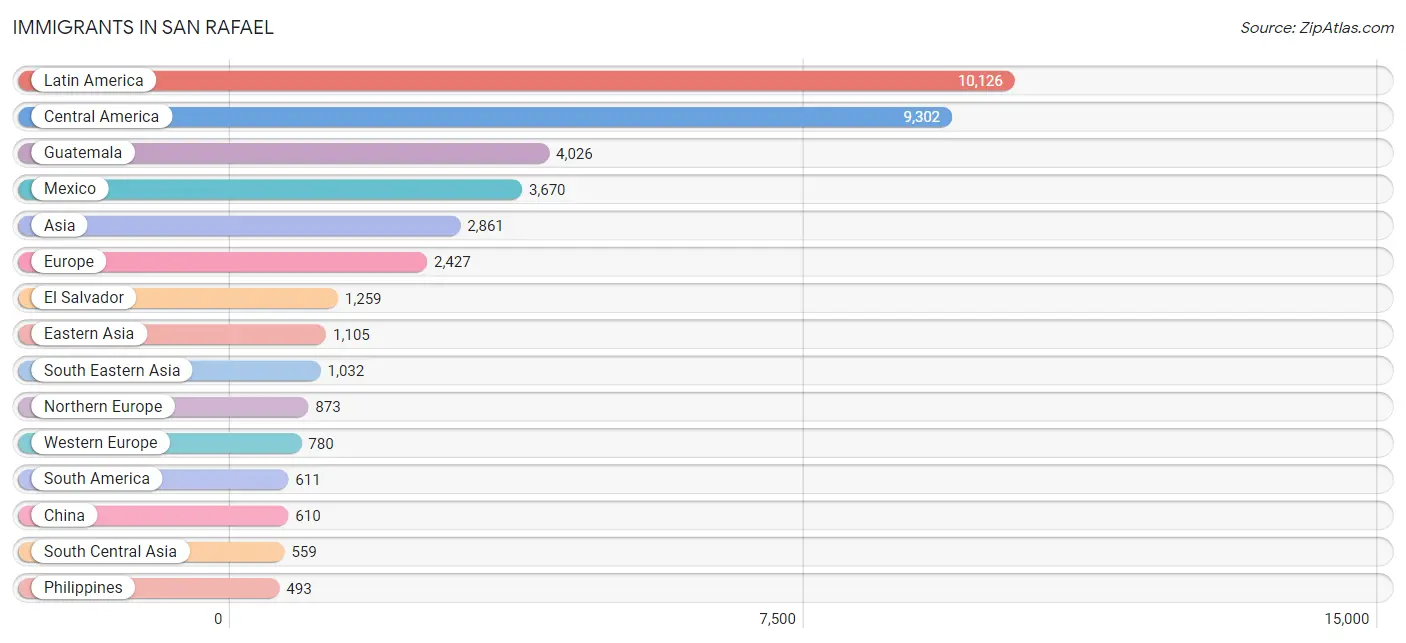
| Immigration Origin | # Population | % Population |
| Africa | 437 | 0.7% |
| Argentina | 47 | 0.1% |
| Asia | 2,861 | 4.7% |
| Australia | 48 | 0.1% |
| Austria | 69 | 0.1% |
| Azores | 16 | 0.0% |
| Bangladesh | 14 | 0.0% |
| Belarus | 13 | 0.0% |
| Belgium | 9 | 0.0% |
| Bolivia | 41 | 0.1% |
| Brazil | 139 | 0.2% |
| Cambodia | 64 | 0.1% |
| Cameroon | 28 | 0.1% |
| Canada | 323 | 0.5% |
| Caribbean | 213 | 0.4% |
| Central America | 9,302 | 15.3% |
| Chile | 46 | 0.1% |
| China | 610 | 1.0% |
| Colombia | 25 | 0.0% |
| Costa Rica | 6 | 0.0% |
| Cuba | 130 | 0.2% |
| Denmark | 16 | 0.0% |
| Dominican Republic | 73 | 0.1% |
| Eastern Africa | 26 | 0.0% |
| Eastern Asia | 1,105 | 1.8% |
| Eastern Europe | 362 | 0.6% |
| Ecuador | 29 | 0.1% |
| Egypt | 97 | 0.2% |
| El Salvador | 1,259 | 2.1% |
| England | 117 | 0.2% |
| Ethiopia | 11 | 0.0% |
| Europe | 2,427 | 4.0% |
| Fiji | 28 | 0.1% |
| France | 188 | 0.3% |
| Germany | 442 | 0.7% |
| Greece | 69 | 0.1% |
| Guatemala | 4,026 | 6.6% |
| Guyana | 27 | 0.0% |
| Honduras | 159 | 0.3% |
| Hong Kong | 73 | 0.1% |
| Hungary | 12 | 0.0% |
| India | 396 | 0.6% |
| Iran | 137 | 0.2% |
| Iraq | 9 | 0.0% |
| Ireland | 175 | 0.3% |
| Israel | 90 | 0.2% |
| Italy | 227 | 0.4% |
| Jamaica | 10 | 0.0% |
| Japan | 188 | 0.3% |
| Kenya | 15 | 0.0% |
| Korea | 307 | 0.5% |
| Laos | 3 | 0.0% |
| Latin America | 10,126 | 16.6% |
| Latvia | 22 | 0.0% |
| Lebanon | 14 | 0.0% |
| Liberia | 71 | 0.1% |
| Malaysia | 28 | 0.1% |
| Mexico | 3,670 | 6.0% |
| Middle Africa | 28 | 0.1% |
| Netherlands | 18 | 0.0% |
| Nicaragua | 182 | 0.3% |
| Nigeria | 3 | 0.0% |
| Northern Africa | 161 | 0.3% |
| Northern Europe | 873 | 1.4% |
| Oceania | 136 | 0.2% |
| Pakistan | 12 | 0.0% |
| Peru | 223 | 0.4% |
| Philippines | 493 | 0.8% |
| Poland | 89 | 0.2% |
| Portugal | 43 | 0.1% |
| Romania | 59 | 0.1% |
| Russia | 54 | 0.1% |
| Scotland | 39 | 0.1% |
| Serbia | 50 | 0.1% |
| Sierra Leone | 30 | 0.1% |
| South Africa | 91 | 0.2% |
| South America | 611 | 1.0% |
| South Central Asia | 559 | 0.9% |
| South Eastern Asia | 1,032 | 1.7% |
| Southern Europe | 412 | 0.7% |
| Spain | 73 | 0.1% |
| Sweden | 64 | 0.1% |
| Switzerland | 54 | 0.1% |
| Taiwan | 32 | 0.1% |
| Thailand | 110 | 0.2% |
| Turkey | 8 | 0.0% |
| Ukraine | 14 | 0.0% |
| Vietnam | 320 | 0.5% |
| Western Africa | 104 | 0.2% |
| Western Asia | 165 | 0.3% |
| Western Europe | 780 | 1.3% | View All 91 Rows |
Sex and Age in San Rafael
Sex and Age in San Rafael
The most populous age groups in San Rafael are 55 to 59 Years (2,329 | 7.7%) for men and 55 to 59 Years (2,563 | 8.3%) for women.
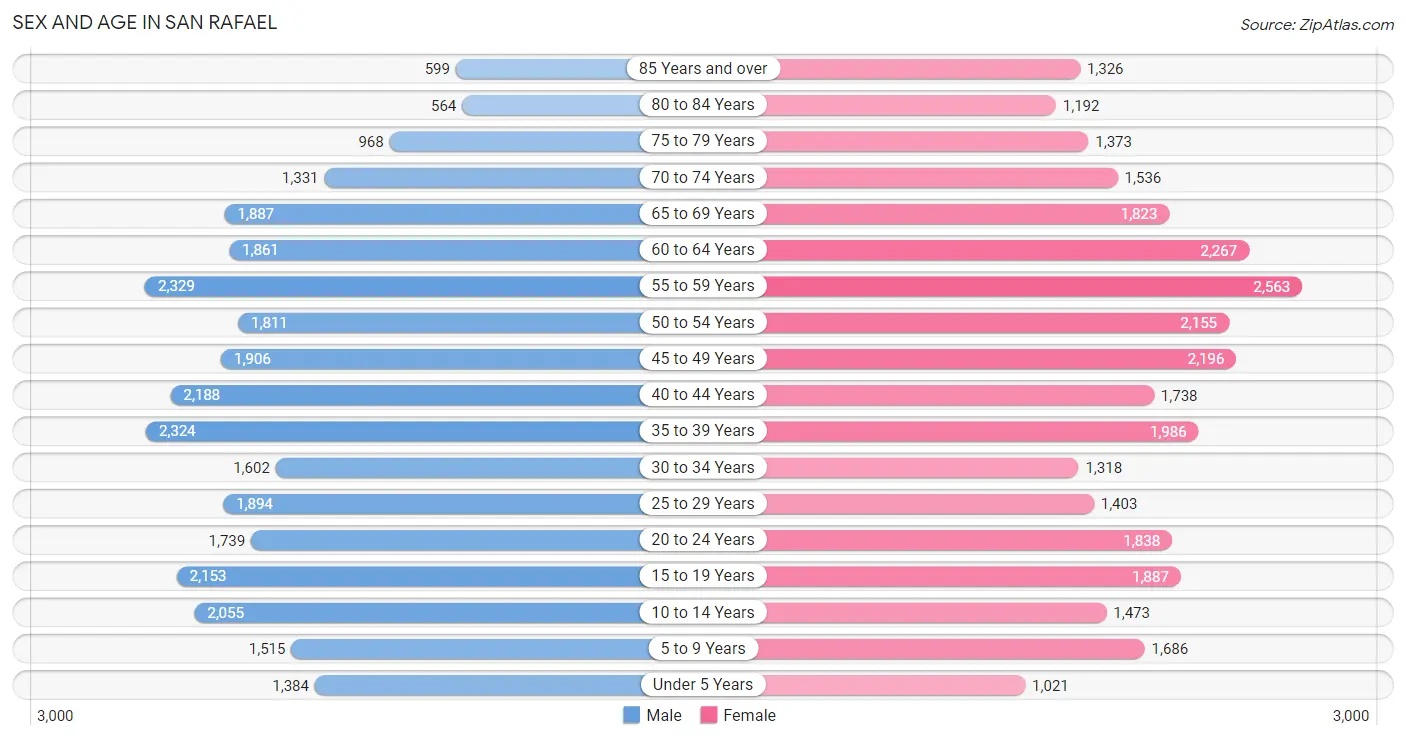
| Age Bracket | Male | Female |
| Under 5 Years | 1,384 (4.6%) | 1,021 (3.3%) |
| 5 to 9 Years | 1,515 (5.0%) | 1,686 (5.5%) |
| 10 to 14 Years | 2,055 (6.8%) | 1,473 (4.8%) |
| 15 to 19 Years | 2,153 (7.1%) | 1,887 (6.1%) |
| 20 to 24 Years | 1,739 (5.8%) | 1,838 (6.0%) |
| 25 to 29 Years | 1,894 (6.3%) | 1,403 (4.6%) |
| 30 to 34 Years | 1,602 (5.3%) | 1,318 (4.3%) |
| 35 to 39 Years | 2,324 (7.7%) | 1,986 (6.5%) |
| 40 to 44 Years | 2,188 (7.3%) | 1,738 (5.7%) |
| 45 to 49 Years | 1,906 (6.3%) | 2,196 (7.1%) |
| 50 to 54 Years | 1,811 (6.0%) | 2,155 (7.0%) |
| 55 to 59 Years | 2,329 (7.7%) | 2,563 (8.3%) |
| 60 to 64 Years | 1,861 (6.2%) | 2,267 (7.4%) |
| 65 to 69 Years | 1,887 (6.3%) | 1,823 (5.9%) |
| 70 to 74 Years | 1,331 (4.4%) | 1,536 (5.0%) |
| 75 to 79 Years | 968 (3.2%) | 1,373 (4.5%) |
| 80 to 84 Years | 564 (1.9%) | 1,192 (3.9%) |
| 85 Years and over | 599 (2.0%) | 1,326 (4.3%) |
| Total | 30,110 (100.0%) | 30,781 (100.0%) |
Families and Households in San Rafael
Median Family Size in San Rafael
The median family size in San Rafael is 3.14 persons per family, with married-couple families (10,831 | 77.4%) accounting for the largest median family size of 3.25 persons per family. On the other hand, single female/mother families (2,047 | 14.6%) represent the smallest median family size with 2.69 persons per family.
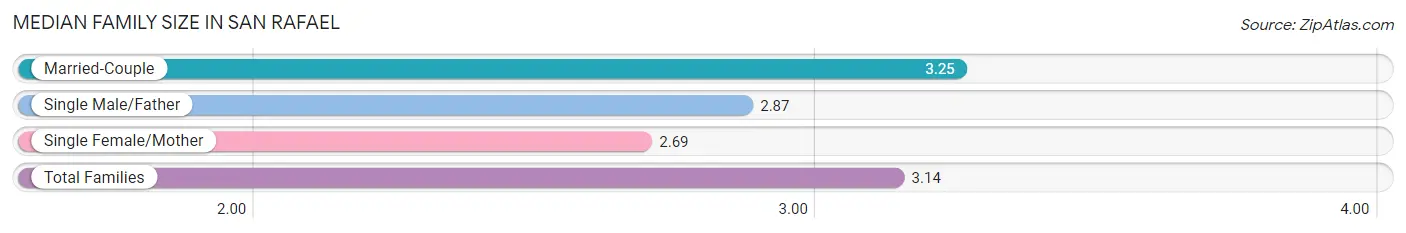
| Family Type | # Families | Family Size |
| Married-Couple | 10,831 (77.4%) | 3.25 |
| Single Male/Father | 1,119 (8.0%) | 2.87 |
| Single Female/Mother | 2,047 (14.6%) | 2.69 |
| Total Families | 13,997 (100.0%) | 3.14 |
Median Household Size in San Rafael
The median household size in San Rafael is 2.51 persons per household, with single male/father households (1,119 | 4.8%) accounting for the largest median household size of 3.63 persons per household. non-family households (9,373 | 40.1%) represent the smallest median household size with 1.30 persons per household.
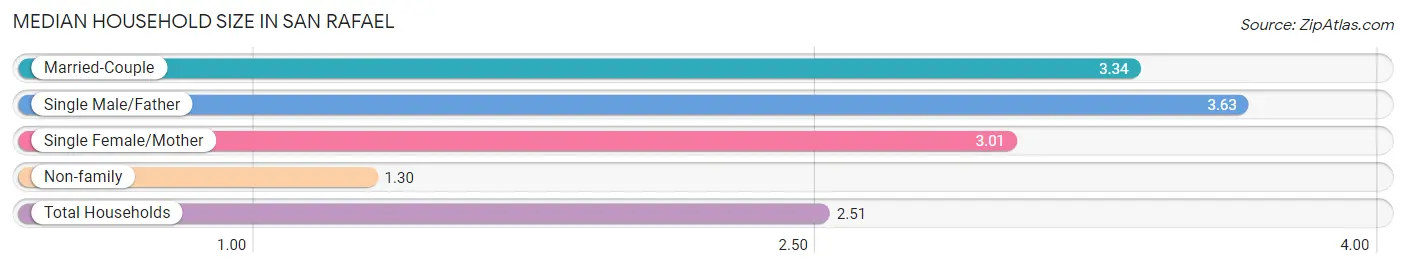
| Household Type | # Households | Household Size |
| Married-Couple | 10,831 (46.4%) | 3.34 |
| Single Male/Father | 1,119 (4.8%) | 3.63 |
| Single Female/Mother | 2,047 (8.8%) | 3.01 |
| Non-family | 9,373 (40.1%) | 1.30 |
| Total Households | 23,370 (100.0%) | 2.51 |
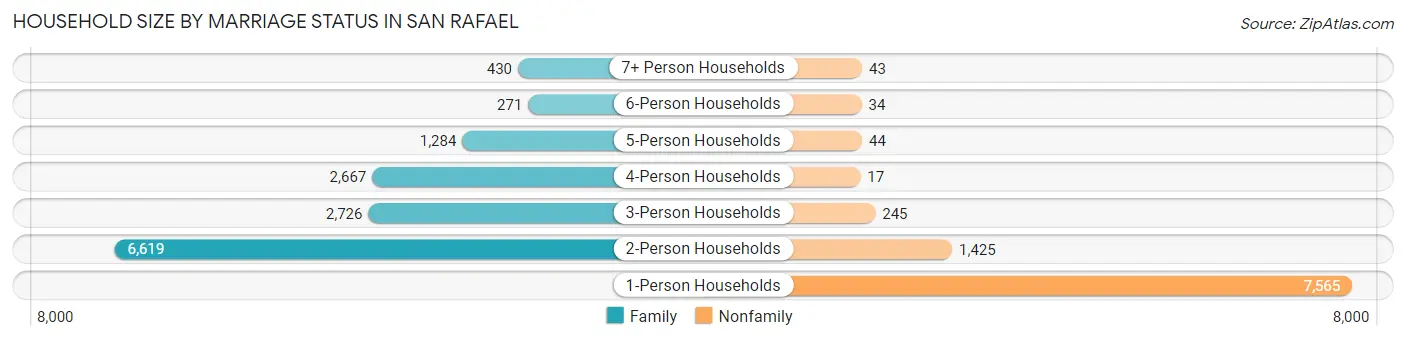
Household Size by Marriage Status in San Rafael
Out of a total of 23,370 households in San Rafael, 13,997 (59.9%) are family households, while 9,373 (40.1%) are nonfamily households. The most numerous type of family households are 2-person households, comprising 6,619, and the most common type of nonfamily households are 1-person households, comprising 7,565.
| Household Size | Family Households | Nonfamily Households |
| 1-Person Households | - | 7,565 (32.4%) |
| 2-Person Households | 6,619 (28.3%) | 1,425 (6.1%) |
| 3-Person Households | 2,726 (11.7%) | 245 (1.1%) |
| 4-Person Households | 2,667 (11.4%) | 17 (0.1%) |
| 5-Person Households | 1,284 (5.5%) | 44 (0.2%) |
| 6-Person Households | 271 (1.2%) | 34 (0.2%) |
| 7+ Person Households | 430 (1.8%) | 43 (0.2%) |
| Total | 13,997 (59.9%) | 9,373 (40.1%) |
Female Fertility in San Rafael
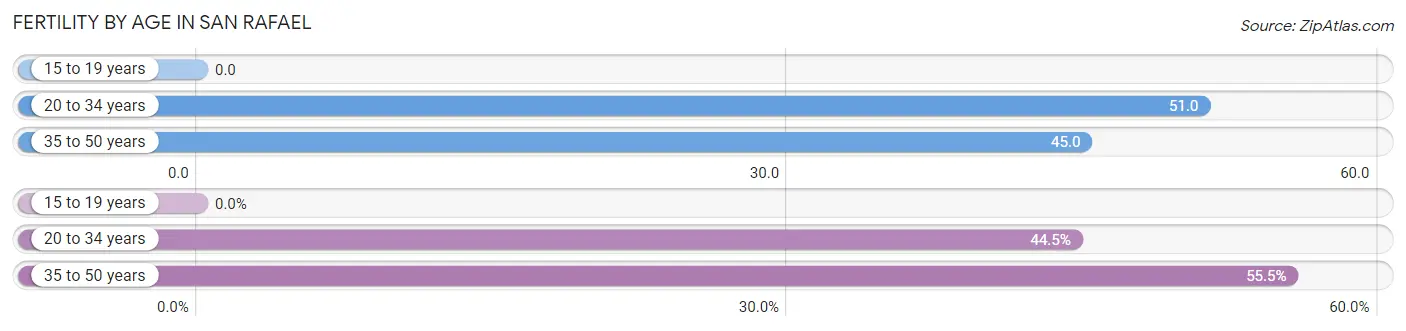
Fertility by Age in San Rafael
Average fertility rate in San Rafael is 40.0 births per 1,000 women. Women in the age bracket of 20 to 34 years have the highest fertility rate with 51.0 births per 1,000 women. Women in the age bracket of 35 to 50 years acount for 55.5% of all women with births.
| Age Bracket | Women with Births | Births / 1,000 Women |
| 15 to 19 years | 0 (0.0%) | 0.0 |
| 20 to 34 years | 231 (44.5%) | 51.0 |
| 35 to 50 years | 288 (55.5%) | 45.0 |
| Total | 519 (100.0%) | 40.0 |
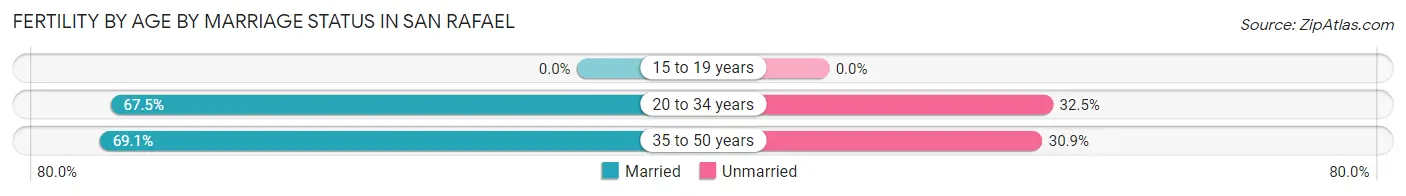
Fertility by Age by Marriage Status in San Rafael
68.4% of women with births (519) in San Rafael are married. The highest percentage of unmarried women with births falls into 20 to 34 years age bracket with 32.5% of them unmarried at the time of birth, while the lowest percentage of unmarried women with births belong to 35 to 50 years age bracket with 30.9% of them unmarried.
| Age Bracket | Married | Unmarried |
| 15 to 19 years | 0 (0.0%) | 0 (0.0%) |
| 20 to 34 years | 156 (67.5%) | 75 (32.5%) |
| 35 to 50 years | 199 (69.1%) | 89 (30.9%) |
| Total | 355 (68.4%) | 164 (31.6%) |
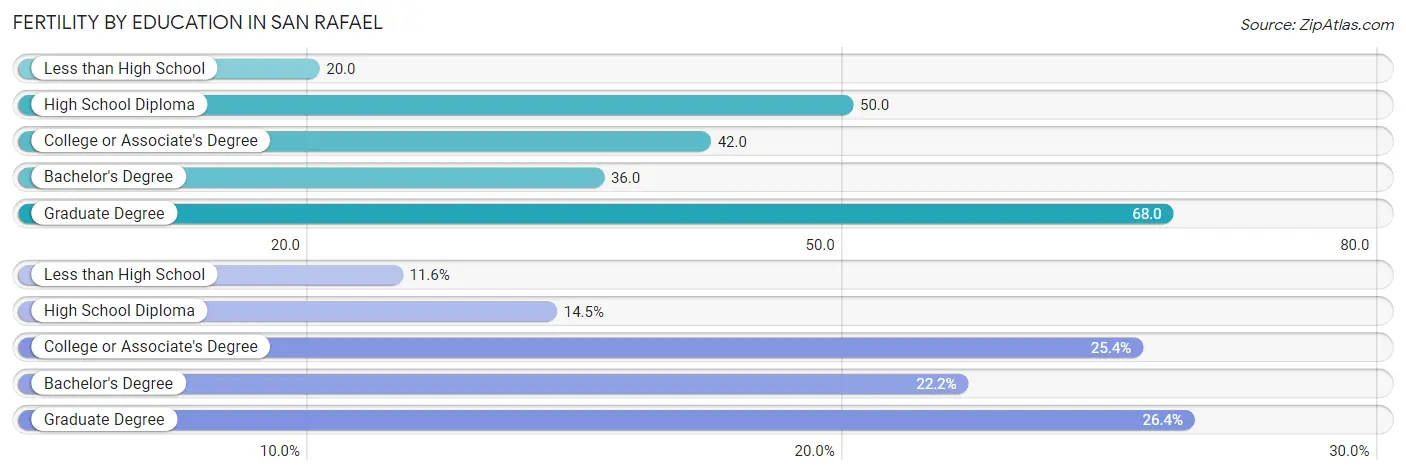
Fertility by Education in San Rafael
Average fertility rate in San Rafael is 40.0 births per 1,000 women. Women with the education attainment of graduate degree have the highest fertility rate of 68.0 births per 1,000 women, while women with the education attainment of less than high school have the lowest fertility at 20.0 births per 1,000 women. Women with the education attainment of graduate degree represent 26.4% of all women with births.
| Educational Attainment | Women with Births | Births / 1,000 Women |
| Less than High School | 60 (11.6%) | 20.0 |
| High School Diploma | 75 (14.4%) | 50.0 |
| College or Associate's Degree | 132 (25.4%) | 42.0 |
| Bachelor's Degree | 115 (22.2%) | 36.0 |
| Graduate Degree | 137 (26.4%) | 68.0 |
| Total | 519 (100.0%) | 40.0 |
Fertility by Education by Marriage Status in San Rafael
31.6% of women with births in San Rafael are unmarried. Women with the educational attainment of less than high school are most likely to be married with 100.0% of them married at childbirth, while women with the educational attainment of high school diploma are least likely to be married with 100.0% of them unmarried at childbirth.
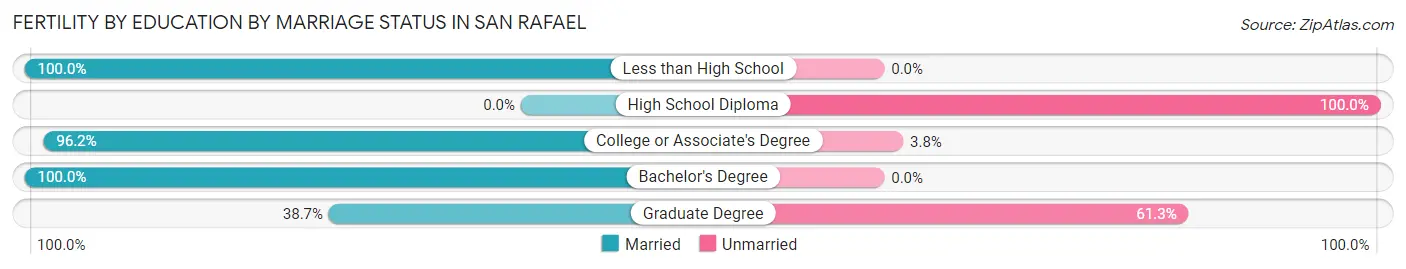
| Educational Attainment | Married | Unmarried |
| Less than High School | 60 (100.0%) | 0 (0.0%) |
| High School Diploma | 0 (0.0%) | 75 (100.0%) |
| College or Associate's Degree | 127 (96.2%) | 5 (3.8%) |
| Bachelor's Degree | 115 (100.0%) | 0 (0.0%) |
| Graduate Degree | 53 (38.7%) | 84 (61.3%) |
| Total | 355 (68.4%) | 164 (31.6%) |
Employment Characteristics in San Rafael
Employment by Class of Employer in San Rafael
Among the 31,092 employed individuals in San Rafael, private company employees (20,191 | 64.9%), self-employed (not incorporated) (3,988 | 12.8%), and not-for-profit organizations (2,432 | 7.8%) make up the most common classes of employment.
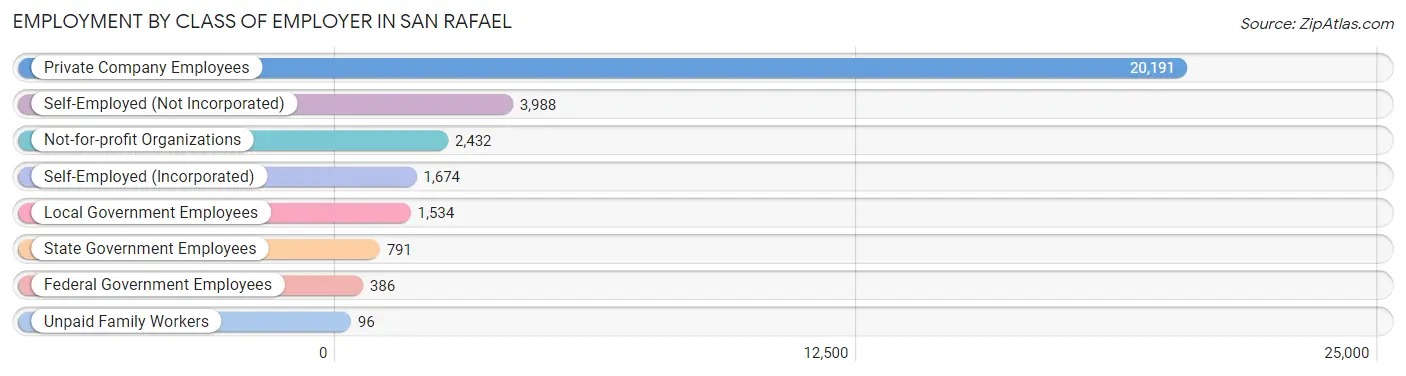
| Employer Class | # Employees | % Employees |
| Private Company Employees | 20,191 | 64.9% |
| Self-Employed (Incorporated) | 1,674 | 5.4% |
| Self-Employed (Not Incorporated) | 3,988 | 12.8% |
| Not-for-profit Organizations | 2,432 | 7.8% |
| Local Government Employees | 1,534 | 4.9% |
| State Government Employees | 791 | 2.5% |
| Federal Government Employees | 386 | 1.2% |
| Unpaid Family Workers | 96 | 0.3% |
| Total | 31,092 | 100.0% |
Employment Status by Age in San Rafael
According to the labor force statistics for San Rafael, out of the total population over 16 years of age (51,214), 64.8% or 33,187 individuals are in the labor force, with 4.8% or 1,593 of them unemployed. The age group with the highest labor force participation rate is 30 to 34 years, with 87.8% or 2,564 individuals in the labor force. Within the labor force, the 75 years and over age range has the highest percentage of unemployed individuals, with 11.2% or 101 of them being unemployed.
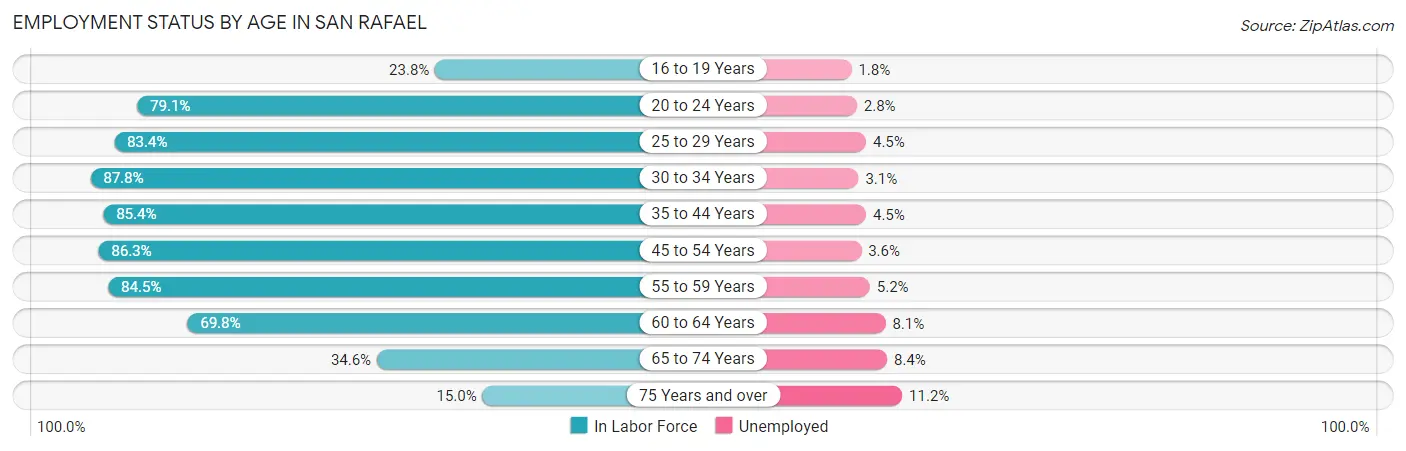
| Age Bracket | In Labor Force | Unemployed |
| 16 to 19 Years | 832 (23.8%) | 15 (1.8%) |
| 20 to 24 Years | 2,829 (79.1%) | 79 (2.8%) |
| 25 to 29 Years | 2,750 (83.4%) | 124 (4.5%) |
| 30 to 34 Years | 2,564 (87.8%) | 79 (3.1%) |
| 35 to 44 Years | 7,034 (85.4%) | 317 (4.5%) |
| 45 to 54 Years | 6,963 (86.3%) | 251 (3.6%) |
| 55 to 59 Years | 4,134 (84.5%) | 215 (5.2%) |
| 60 to 64 Years | 2,881 (69.8%) | 233 (8.1%) |
| 65 to 74 Years | 2,276 (34.6%) | 191 (8.4%) |
| 75 Years and over | 903 (15.0%) | 101 (11.2%) |
| Total | 33,187 (64.8%) | 1,593 (4.8%) |
Employment Status by Educational Attainment in San Rafael
According to labor force statistics for San Rafael, 83.5% of individuals (26,337) out of the total population between 25 and 64 years of age (31,541) are in the labor force, with 4.6% or 1,212 of them being unemployed. The group with the highest labor force participation rate are those with the educational attainment of bachelor's degree or higher, with 88.5% or 13,233 individuals in the labor force. Within the labor force, individuals with bachelor's degree or higher education have the highest percentage of unemployment, with 5.4% or 715 of them being unemployed.
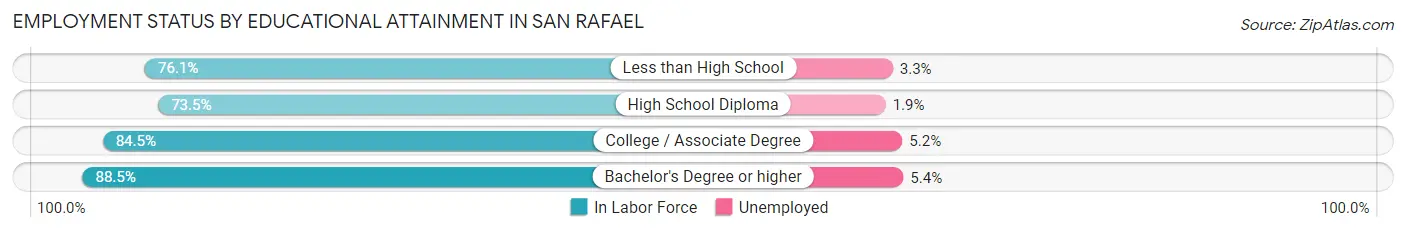
| Educational Attainment | In Labor Force | Unemployed |
| Less than High School | 4,345 (76.1%) | 188 (3.3%) |
| High School Diploma | 2,939 (73.5%) | 76 (1.9%) |
| College / Associate Degree | 5,814 (84.5%) | 358 (5.2%) |
| Bachelor's Degree or higher | 13,233 (88.5%) | 807 (5.4%) |
| Total | 26,337 (83.5%) | 1,451 (4.6%) |
Employment Occupations by Sex in San Rafael
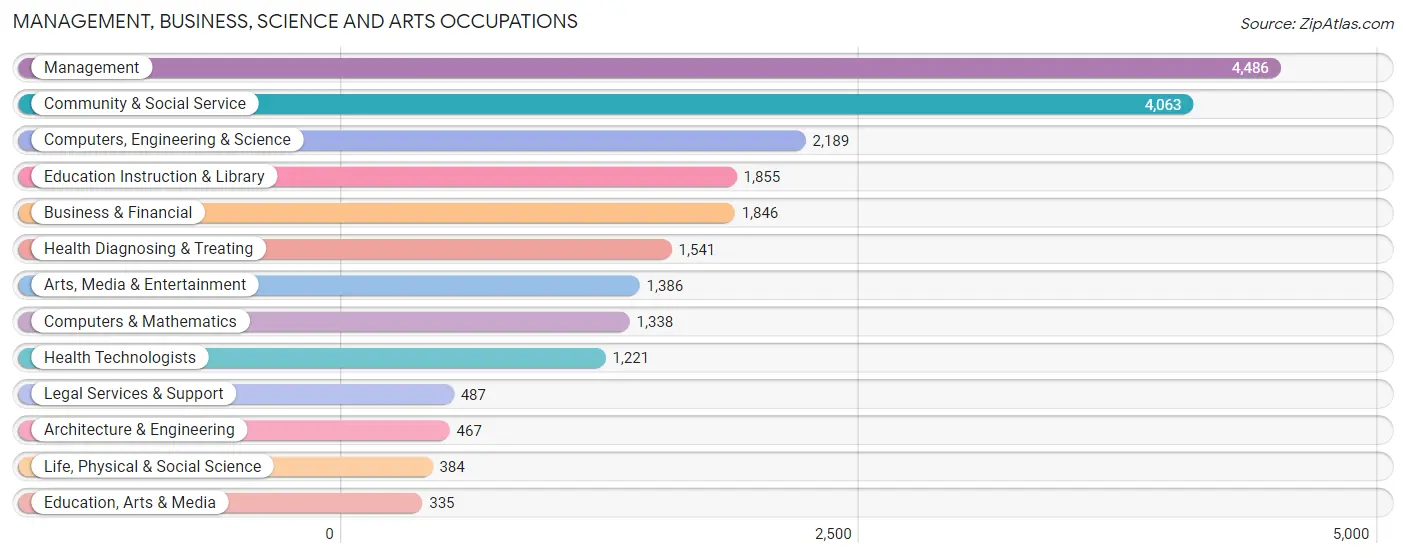
Management, Business, Science and Arts Occupations
The most common Management, Business, Science and Arts occupations in San Rafael are Management (4,486 | 14.2%), Community & Social Service (4,063 | 12.9%), Computers, Engineering & Science (2,189 | 6.9%), Education Instruction & Library (1,855 | 5.9%), and Business & Financial (1,846 | 5.9%).
Management, Business, Science and Arts Occupations by Sex
Within the Management, Business, Science and Arts occupations in San Rafael, the most male-oriented occupations are Architecture & Engineering (78.6%), Computers & Mathematics (77.0%), and Computers, Engineering & Science (70.7%), while the most female-oriented occupations are Education, Arts & Media (82.7%), Health Technologists (73.0%), and Health Diagnosing & Treating (68.6%).
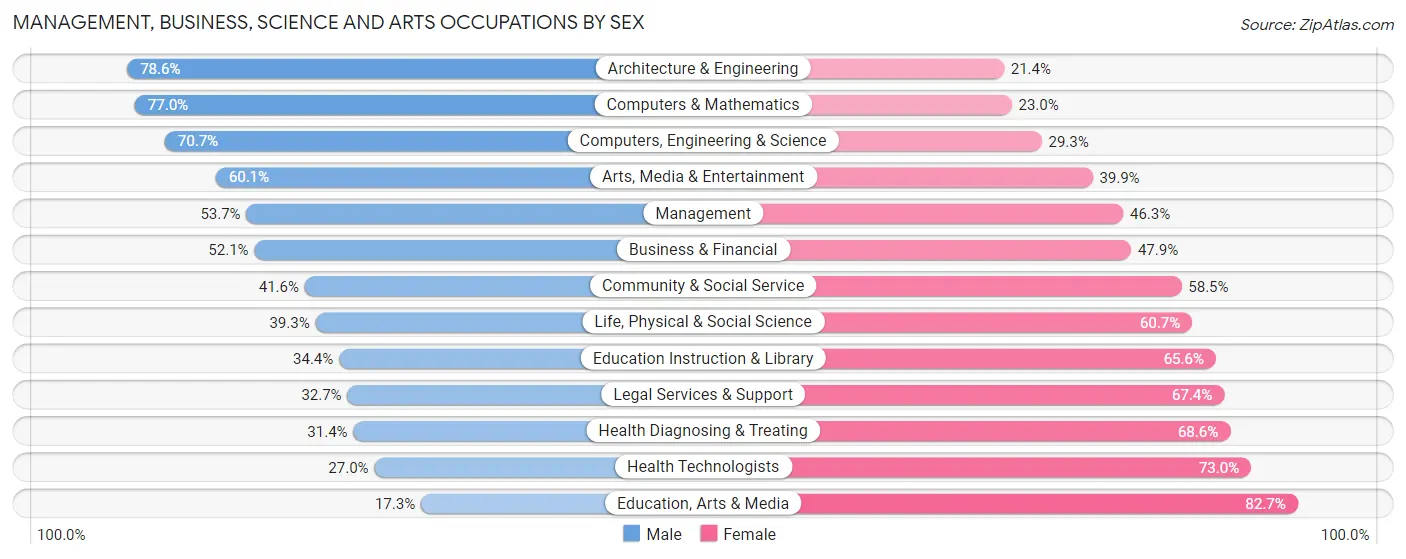
| Occupation | Male | Female |
| Management | 2,410 (53.7%) | 2,076 (46.3%) |
| Business & Financial | 961 (52.1%) | 885 (47.9%) |
| Computers, Engineering & Science | 1,548 (70.7%) | 641 (29.3%) |
| Computers & Mathematics | 1,030 (77.0%) | 308 (23.0%) |
| Architecture & Engineering | 367 (78.6%) | 100 (21.4%) |
| Life, Physical & Social Science | 151 (39.3%) | 233 (60.7%) |
| Community & Social Service | 1,688 (41.5%) | 2,375 (58.5%) |
| Education, Arts & Media | 58 (17.3%) | 277 (82.7%) |
| Legal Services & Support | 159 (32.7%) | 328 (67.3%) |
| Education Instruction & Library | 638 (34.4%) | 1,217 (65.6%) |
| Arts, Media & Entertainment | 833 (60.1%) | 553 (39.9%) |
| Health Diagnosing & Treating | 484 (31.4%) | 1,057 (68.6%) |
| Health Technologists | 330 (27.0%) | 891 (73.0%) |
| Total (Category) | 7,091 (50.2%) | 7,034 (49.8%) |
| Total (Overall) | 16,524 (52.3%) | 15,041 (47.6%) |
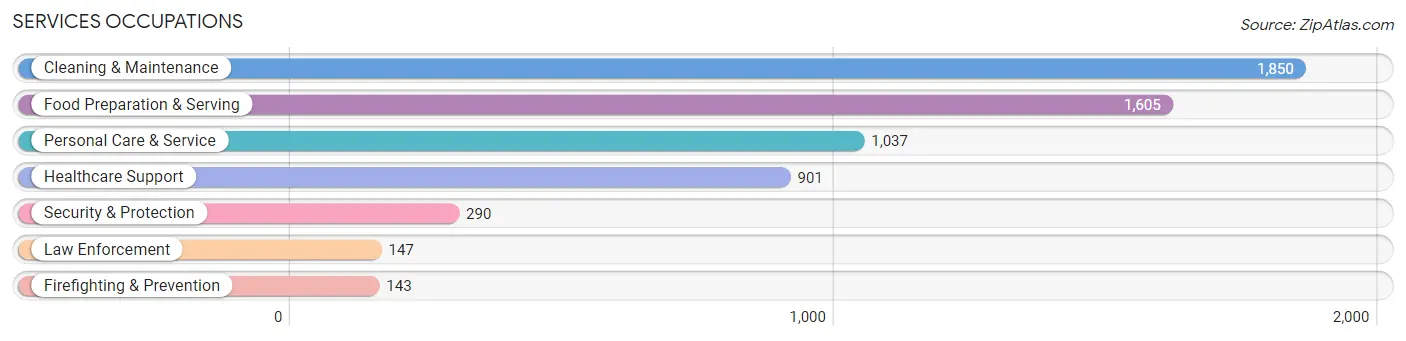
Services Occupations
The most common Services occupations in San Rafael are Cleaning & Maintenance (1,850 | 5.9%), Food Preparation & Serving (1,605 | 5.1%), Personal Care & Service (1,037 | 3.3%), Healthcare Support (901 | 2.9%), and Security & Protection (290 | 0.9%).
Services Occupations by Sex
Within the Services occupations in San Rafael, the most male-oriented occupations are Firefighting & Prevention (91.6%), Security & Protection (90.3%), and Law Enforcement (89.1%), while the most female-oriented occupations are Personal Care & Service (87.9%), Healthcare Support (77.8%), and Cleaning & Maintenance (50.2%).
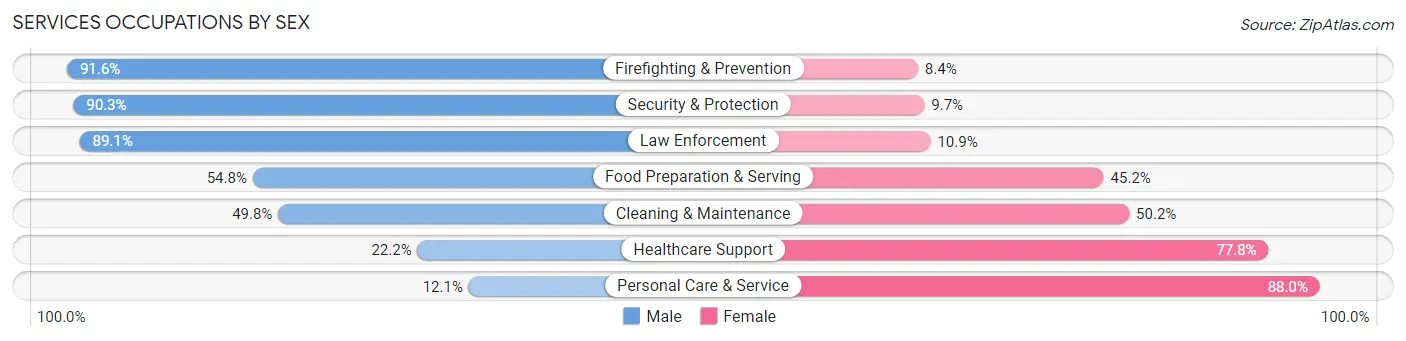
| Occupation | Male | Female |
| Healthcare Support | 200 (22.2%) | 701 (77.8%) |
| Security & Protection | 262 (90.3%) | 28 (9.7%) |
| Firefighting & Prevention | 131 (91.6%) | 12 (8.4%) |
| Law Enforcement | 131 (89.1%) | 16 (10.9%) |
| Food Preparation & Serving | 880 (54.8%) | 725 (45.2%) |
| Cleaning & Maintenance | 921 (49.8%) | 929 (50.2%) |
| Personal Care & Service | 125 (12.0%) | 912 (87.9%) |
| Total (Category) | 2,388 (42.0%) | 3,295 (58.0%) |
| Total (Overall) | 16,524 (52.3%) | 15,041 (47.6%) |
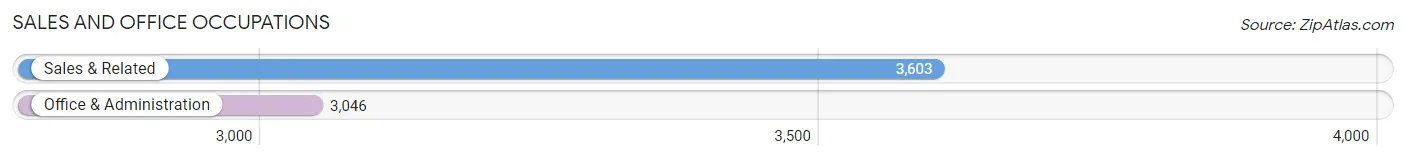
Sales and Office Occupations
The most common Sales and Office occupations in San Rafael are Sales & Related (3,603 | 11.4%), and Office & Administration (3,046 | 9.7%).
Sales and Office Occupations by Sex
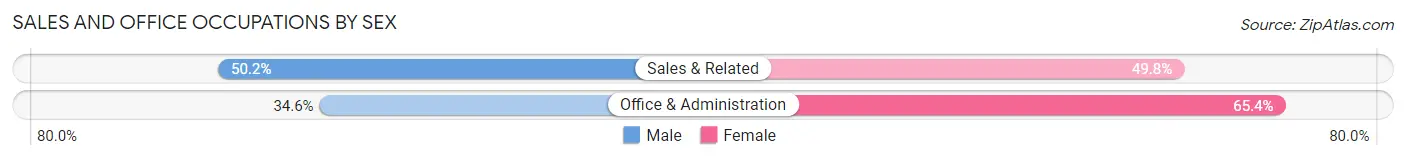
| Occupation | Male | Female |
| Sales & Related | 1,810 (50.2%) | 1,793 (49.8%) |
| Office & Administration | 1,055 (34.6%) | 1,991 (65.4%) |
| Total (Category) | 2,865 (43.1%) | 3,784 (56.9%) |
| Total (Overall) | 16,524 (52.3%) | 15,041 (47.6%) |
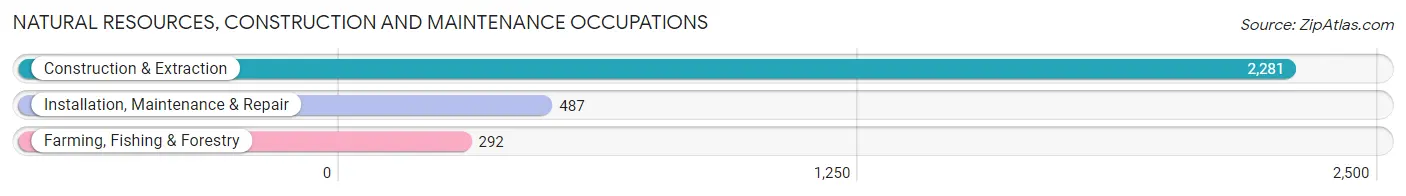
Natural Resources, Construction and Maintenance Occupations
The most common Natural Resources, Construction and Maintenance occupations in San Rafael are Construction & Extraction (2,281 | 7.2%), Installation, Maintenance & Repair (487 | 1.5%), and Farming, Fishing & Forestry (292 | 0.9%).
Natural Resources, Construction and Maintenance Occupations by Sex
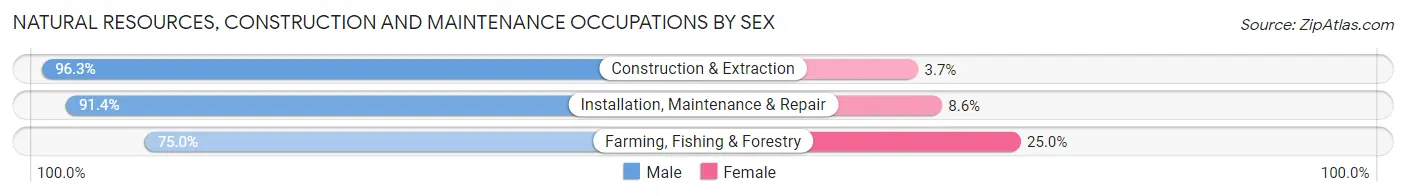
| Occupation | Male | Female |
| Farming, Fishing & Forestry | 219 (75.0%) | 73 (25.0%) |
| Construction & Extraction | 2,197 (96.3%) | 84 (3.7%) |
| Installation, Maintenance & Repair | 445 (91.4%) | 42 (8.6%) |
| Total (Category) | 2,861 (93.5%) | 199 (6.5%) |
| Total (Overall) | 16,524 (52.3%) | 15,041 (47.6%) |
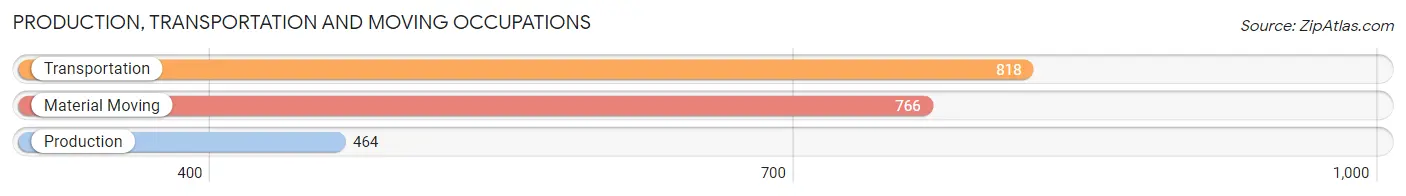
Production, Transportation and Moving Occupations
The most common Production, Transportation and Moving occupations in San Rafael are Transportation (818 | 2.6%), Material Moving (766 | 2.4%), and Production (464 | 1.5%).
Production, Transportation and Moving Occupations by Sex
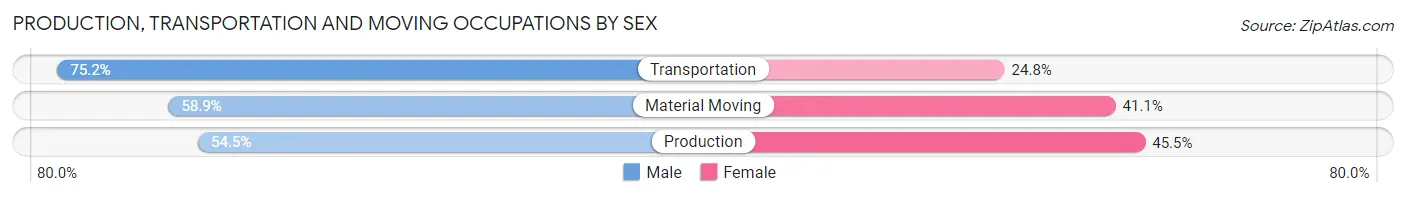
| Occupation | Male | Female |
| Production | 253 (54.5%) | 211 (45.5%) |
| Transportation | 615 (75.2%) | 203 (24.8%) |
| Material Moving | 451 (58.9%) | 315 (41.1%) |
| Total (Category) | 1,319 (64.4%) | 729 (35.6%) |
| Total (Overall) | 16,524 (52.3%) | 15,041 (47.6%) |
Employment Industries by Sex in San Rafael
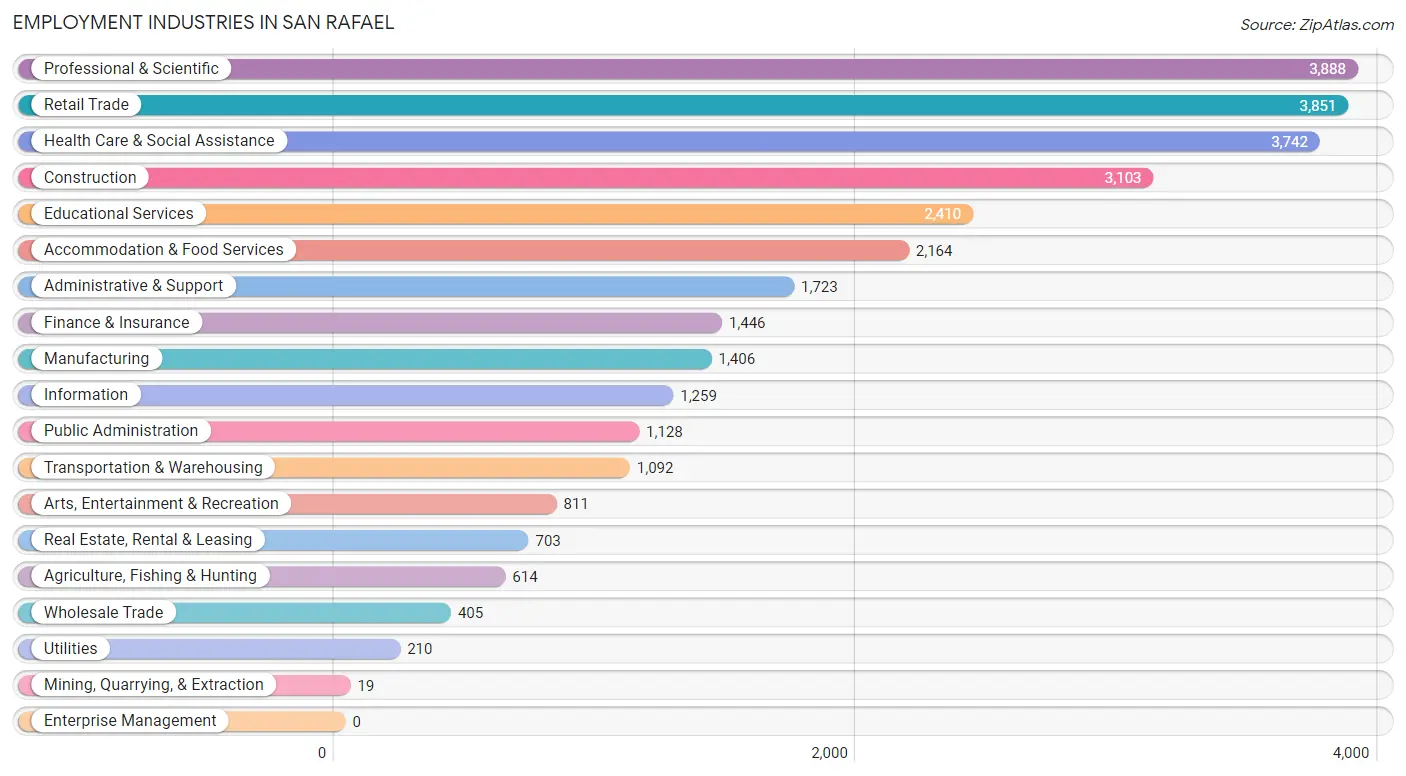
Employment Industries in San Rafael
The major employment industries in San Rafael include Professional & Scientific (3,888 | 12.3%), Retail Trade (3,851 | 12.2%), Health Care & Social Assistance (3,742 | 11.8%), Construction (3,103 | 9.8%), and Educational Services (2,410 | 7.6%).
Employment Industries by Sex in San Rafael
The San Rafael industries that see more men than women are Construction (94.5%), Utilities (80.9%), and Agriculture, Fishing & Hunting (76.7%), whereas the industries that tend to have a higher number of women are Mining, Quarrying, & Extraction (100.0%), Health Care & Social Assistance (70.9%), and Educational Services (66.3%).
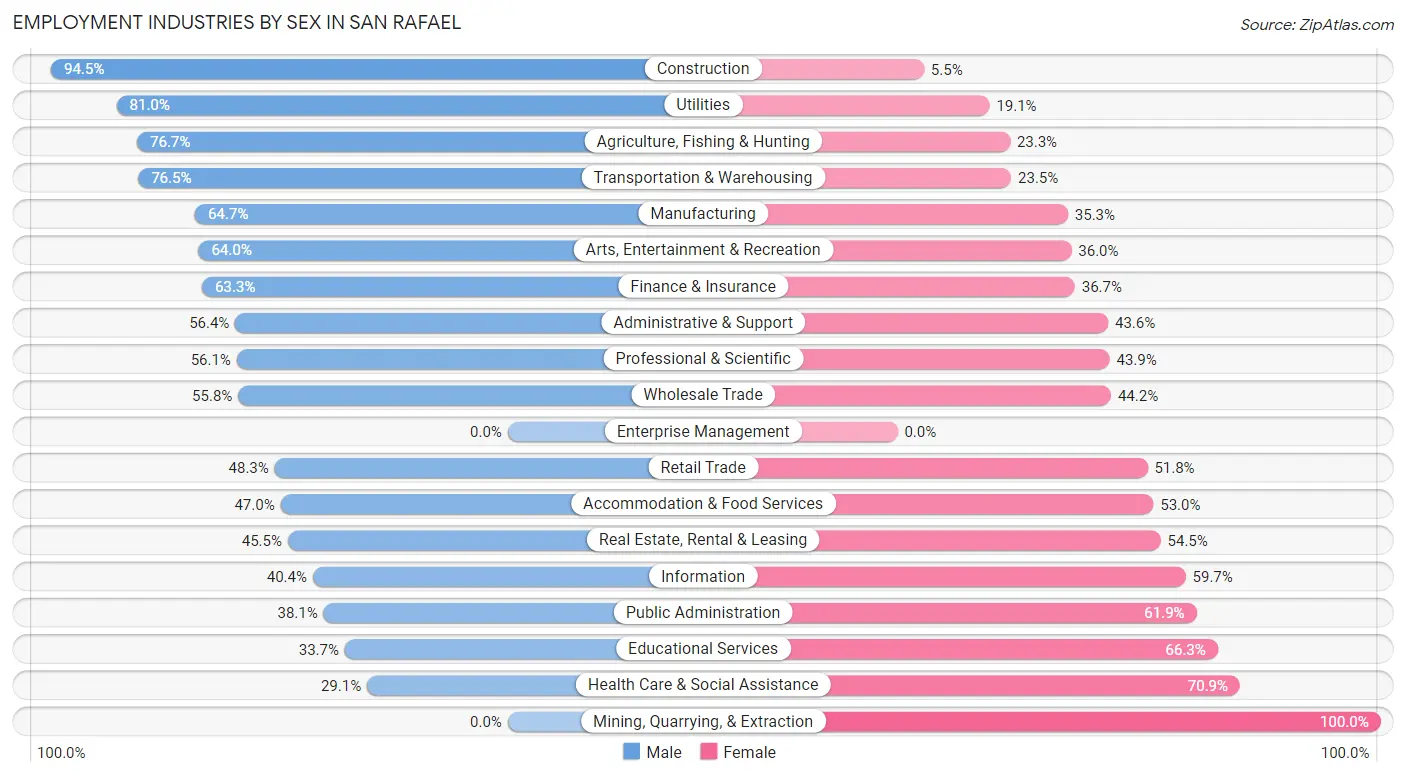
| Industry | Male | Female |
| Agriculture, Fishing & Hunting | 471 (76.7%) | 143 (23.3%) |
| Mining, Quarrying, & Extraction | 0 (0.0%) | 19 (100.0%) |
| Construction | 2,933 (94.5%) | 170 (5.5%) |
| Manufacturing | 910 (64.7%) | 496 (35.3%) |
| Wholesale Trade | 226 (55.8%) | 179 (44.2%) |
| Retail Trade | 1,858 (48.2%) | 1,993 (51.7%) |
| Transportation & Warehousing | 835 (76.5%) | 257 (23.5%) |
| Utilities | 170 (80.9%) | 40 (19.1%) |
| Information | 508 (40.4%) | 751 (59.7%) |
| Finance & Insurance | 915 (63.3%) | 531 (36.7%) |
| Real Estate, Rental & Leasing | 320 (45.5%) | 383 (54.5%) |
| Professional & Scientific | 2,181 (56.1%) | 1,707 (43.9%) |
| Enterprise Management | 0 (0.0%) | 0 (0.0%) |
| Administrative & Support | 972 (56.4%) | 751 (43.6%) |
| Educational Services | 813 (33.7%) | 1,597 (66.3%) |
| Health Care & Social Assistance | 1,090 (29.1%) | 2,652 (70.9%) |
| Arts, Entertainment & Recreation | 519 (64.0%) | 292 (36.0%) |
| Accommodation & Food Services | 1,018 (47.0%) | 1,146 (53.0%) |
| Public Administration | 430 (38.1%) | 698 (61.9%) |
| Total | 16,524 (52.3%) | 15,041 (47.6%) |
Education in San Rafael
School Enrollment in San Rafael
The most common levels of schooling among the 14,341 students in San Rafael are college / undergraduate (3,828 | 26.7%), high school (3,096 | 21.6%), and middle school (2,702 | 18.8%).
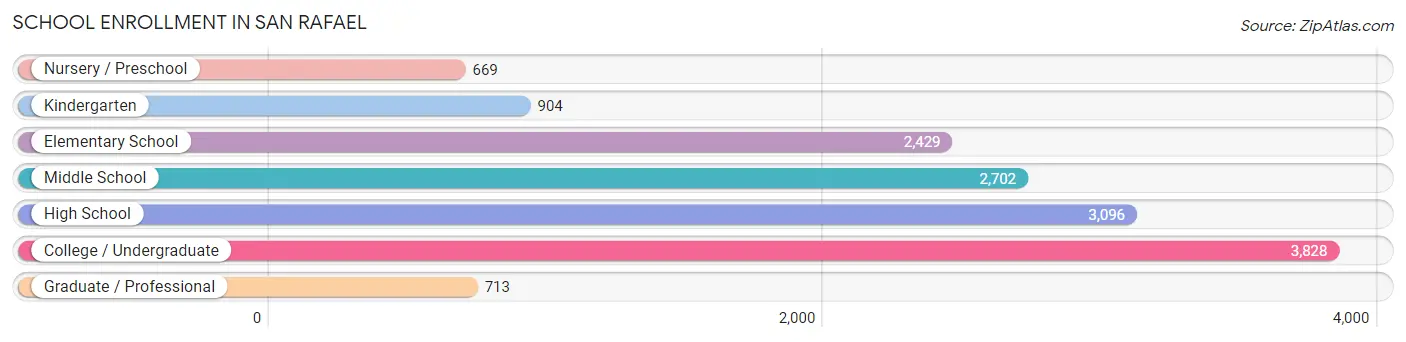
| School Level | # Students | % Students |
| Nursery / Preschool | 669 | 4.7% |
| Kindergarten | 904 | 6.3% |
| Elementary School | 2,429 | 16.9% |
| Middle School | 2,702 | 18.8% |
| High School | 3,096 | 21.6% |
| College / Undergraduate | 3,828 | 26.7% |
| Graduate / Professional | 713 | 5.0% |
| Total | 14,341 | 100.0% |
School Enrollment by Age by Funding Source in San Rafael
Out of a total of 14,341 students who are enrolled in schools in San Rafael, 2,667 (18.6%) attend a private institution, while the remaining 11,674 (81.4%) are enrolled in public schools. The age group of 25 to 34 year olds has the highest likelihood of being enrolled in private schools, with 283 (46.6% in the age bracket) enrolled. Conversely, the age group of 15 to 17 year olds has the lowest likelihood of being enrolled in a private school, with 1,985 (95.2% in the age bracket) attending a public institution.
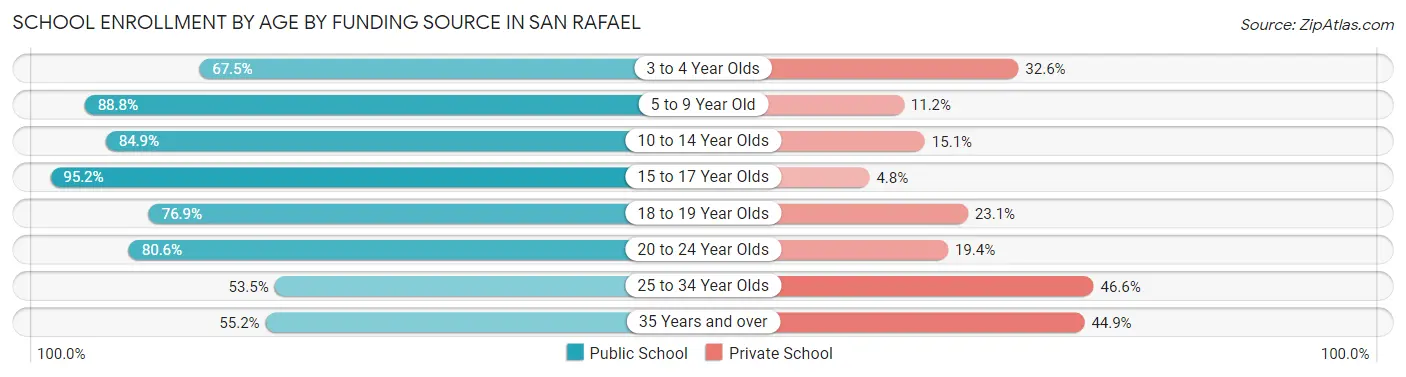
| Age Bracket | Public School | Private School |
| 3 to 4 Year Olds | 375 (67.4%) | 181 (32.6%) |
| 5 to 9 Year Old | 2,709 (88.8%) | 342 (11.2%) |
| 10 to 14 Year Olds | 2,951 (84.9%) | 526 (15.1%) |
| 15 to 17 Year Olds | 1,985 (95.2%) | 100 (4.8%) |
| 18 to 19 Year Olds | 1,229 (76.9%) | 370 (23.1%) |
| 20 to 24 Year Olds | 1,489 (80.6%) | 359 (19.4%) |
| 25 to 34 Year Olds | 325 (53.4%) | 283 (46.6%) |
| 35 Years and over | 616 (55.1%) | 501 (44.9%) |
| Total | 11,674 (81.4%) | 2,667 (18.6%) |
Educational Attainment by Field of Study in San Rafael
Business (3,571 | 14.9%), social sciences (2,747 | 11.5%), literature & languages (2,131 | 8.9%), bio, nature & agricultural (1,694 | 7.1%), and visual & performing arts (1,662 | 6.9%) are the most common fields of study among 23,931 individuals in San Rafael who have obtained a bachelor's degree or higher.
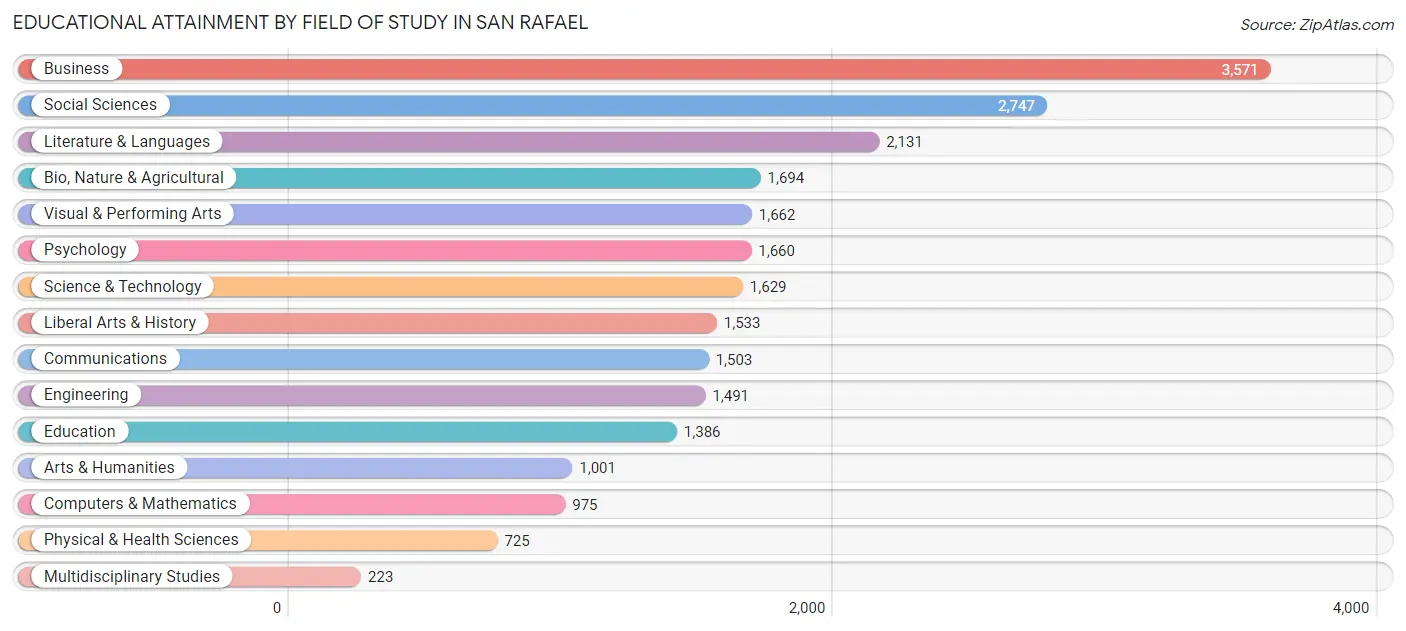
| Field of Study | # Graduates | % Graduates |
| Computers & Mathematics | 975 | 4.1% |
| Bio, Nature & Agricultural | 1,694 | 7.1% |
| Physical & Health Sciences | 725 | 3.0% |
| Psychology | 1,660 | 6.9% |
| Social Sciences | 2,747 | 11.5% |
| Engineering | 1,491 | 6.2% |
| Multidisciplinary Studies | 223 | 0.9% |
| Science & Technology | 1,629 | 6.8% |
| Business | 3,571 | 14.9% |
| Education | 1,386 | 5.8% |
| Literature & Languages | 2,131 | 8.9% |
| Liberal Arts & History | 1,533 | 6.4% |
| Visual & Performing Arts | 1,662 | 6.9% |
| Communications | 1,503 | 6.3% |
| Arts & Humanities | 1,001 | 4.2% |
| Total | 23,931 | 100.0% |
Transportation & Commute in San Rafael
Vehicle Availability by Sex in San Rafael
The most prevalent vehicle ownership categories in San Rafael are males with 2 vehicles (6,647, accounting for 41.2%) and females with 2 vehicles (5,767, making up 45.7%).
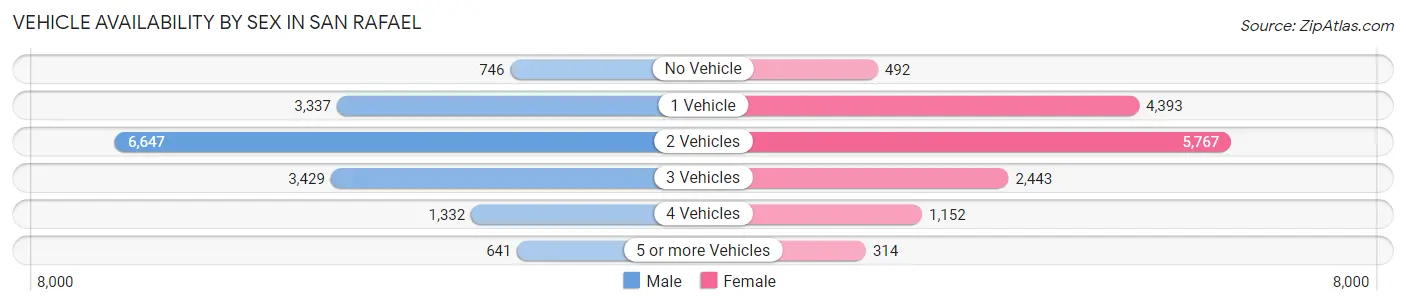
| Vehicles Available | Male | Female |
| No Vehicle | 746 (4.6%) | 492 (3.4%) |
| 1 Vehicle | 3,337 (20.7%) | 4,393 (30.2%) |
| 2 Vehicles | 6,647 (41.2%) | 5,767 (39.6%) |
| 3 Vehicles | 3,429 (21.3%) | 2,443 (16.8%) |
| 4 Vehicles | 1,332 (8.3%) | 1,152 (7.9%) |
| 5 or more Vehicles | 641 (4.0%) | 314 (2.2%) |
| Total | 16,132 (100.0%) | 14,561 (100.0%) |
Commute Time in San Rafael
The most frequently occuring commute durations in San Rafael are 15 to 19 minutes (4,575 commuters, 19.0%), 10 to 14 minutes (3,530 commuters, 14.7%), and 20 to 24 minutes (2,832 commuters, 11.8%).
| Commute Time | # Commuters | % Commuters |
| Less than 5 Minutes | 484 | 2.0% |
| 5 to 9 Minutes | 2,203 | 9.1% |
| 10 to 14 Minutes | 3,530 | 14.7% |
| 15 to 19 Minutes | 4,575 | 19.0% |
| 20 to 24 Minutes | 2,832 | 11.8% |
| 25 to 29 Minutes | 887 | 3.7% |
| 30 to 34 Minutes | 2,636 | 11.0% |
| 35 to 39 Minutes | 838 | 3.5% |
| 40 to 44 Minutes | 906 | 3.8% |
| 45 to 59 Minutes | 1,807 | 7.5% |
| 60 to 89 Minutes | 2,740 | 11.4% |
| 90 or more Minutes | 627 | 2.6% |
Commute Time by Sex in San Rafael
The most common commute times in San Rafael are 15 to 19 minutes (2,163 commuters, 17.1%) for males and 15 to 19 minutes (2,412 commuters, 21.1%) for females.
| Commute Time | Male | Female |
| Less than 5 Minutes | 249 (2.0%) | 235 (2.1%) |
| 5 to 9 Minutes | 1,099 (8.7%) | 1,104 (9.7%) |
| 10 to 14 Minutes | 1,762 (13.9%) | 1,768 (15.5%) |
| 15 to 19 Minutes | 2,163 (17.1%) | 2,412 (21.1%) |
| 20 to 24 Minutes | 1,532 (12.1%) | 1,300 (11.4%) |
| 25 to 29 Minutes | 536 (4.2%) | 351 (3.1%) |
| 30 to 34 Minutes | 1,121 (8.9%) | 1,515 (13.3%) |
| 35 to 39 Minutes | 472 (3.7%) | 366 (3.2%) |
| 40 to 44 Minutes | 557 (4.4%) | 349 (3.1%) |
| 45 to 59 Minutes | 1,195 (9.5%) | 612 (5.4%) |
| 60 to 89 Minutes | 1,493 (11.8%) | 1,247 (10.9%) |
| 90 or more Minutes | 470 (3.7%) | 157 (1.4%) |
Time of Departure to Work by Sex in San Rafael
The most frequent times of departure to work in San Rafael are 7:00 AM to 7:29 AM (2,219, 17.5%) for males and 8:00 AM to 8:29 AM (2,004, 17.5%) for females.
| Time of Departure | Male | Female |
| 12:00 AM to 4:59 AM | 298 (2.4%) | 389 (3.4%) |
| 5:00 AM to 5:29 AM | 262 (2.1%) | 185 (1.6%) |
| 5:30 AM to 5:59 AM | 269 (2.1%) | 218 (1.9%) |
| 6:00 AM to 6:29 AM | 1,715 (13.6%) | 475 (4.2%) |
| 6:30 AM to 6:59 AM | 1,229 (9.7%) | 564 (4.9%) |
| 7:00 AM to 7:29 AM | 2,219 (17.5%) | 1,672 (14.6%) |
| 7:30 AM to 7:59 AM | 1,233 (9.8%) | 1,778 (15.6%) |
| 8:00 AM to 8:29 AM | 1,793 (14.2%) | 2,004 (17.5%) |
| 8:30 AM to 8:59 AM | 831 (6.6%) | 860 (7.5%) |
| 9:00 AM to 9:59 AM | 1,243 (9.8%) | 1,426 (12.5%) |
| 10:00 AM to 10:59 AM | 580 (4.6%) | 549 (4.8%) |
| 11:00 AM to 11:59 AM | 288 (2.3%) | 123 (1.1%) |
| 12:00 PM to 3:59 PM | 415 (3.3%) | 887 (7.8%) |
| 4:00 PM to 11:59 PM | 274 (2.2%) | 286 (2.5%) |
| Total | 12,649 (100.0%) | 11,416 (100.0%) |
Housing Occupancy in San Rafael
Occupancy by Ownership in San Rafael
Of the total 23,370 dwellings in San Rafael, owner-occupied units account for 12,121 (51.9%), while renter-occupied units make up 11,249 (48.1%).
| Occupancy | # Housing Units | % Housing Units |
| Owner Occupied Housing Units | 12,121 | 51.9% |
| Renter-Occupied Housing Units | 11,249 | 48.1% |
| Total Occupied Housing Units | 23,370 | 100.0% |
Occupancy by Household Size in San Rafael
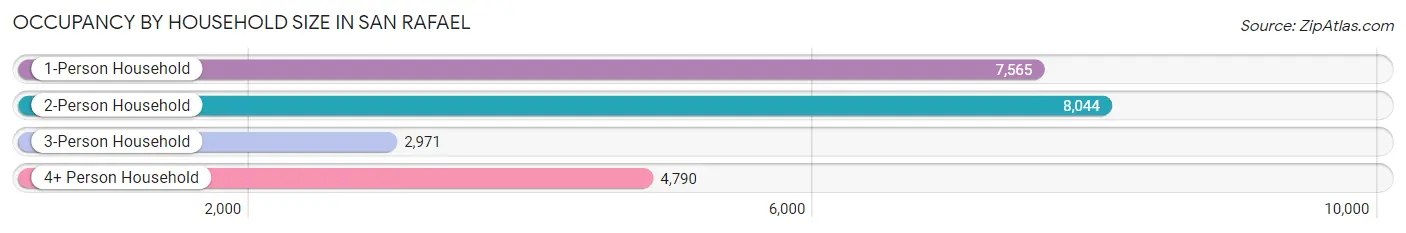
| Household Size | # Housing Units | % Housing Units |
| 1-Person Household | 7,565 | 32.4% |
| 2-Person Household | 8,044 | 34.4% |
| 3-Person Household | 2,971 | 12.7% |
| 4+ Person Household | 4,790 | 20.5% |
| Total Housing Units | 23,370 | 100.0% |
Occupancy by Ownership by Household Size in San Rafael
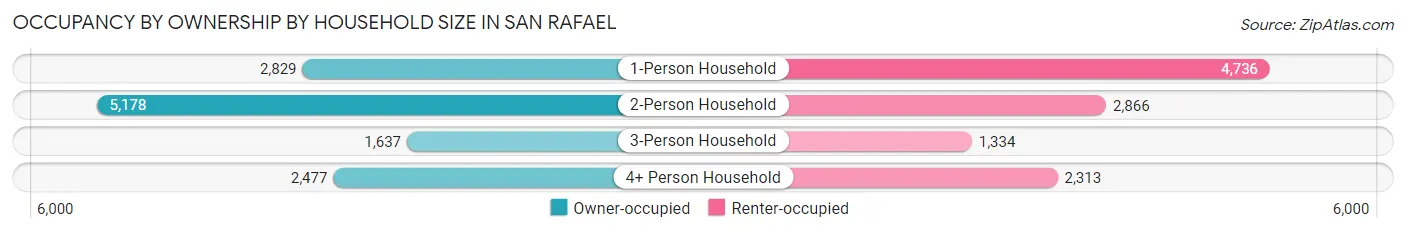
| Household Size | Owner-occupied | Renter-occupied |
| 1-Person Household | 2,829 (37.4%) | 4,736 (62.6%) |
| 2-Person Household | 5,178 (64.4%) | 2,866 (35.6%) |
| 3-Person Household | 1,637 (55.1%) | 1,334 (44.9%) |
| 4+ Person Household | 2,477 (51.7%) | 2,313 (48.3%) |
| Total Housing Units | 12,121 (51.9%) | 11,249 (48.1%) |
Occupancy by Educational Attainment in San Rafael
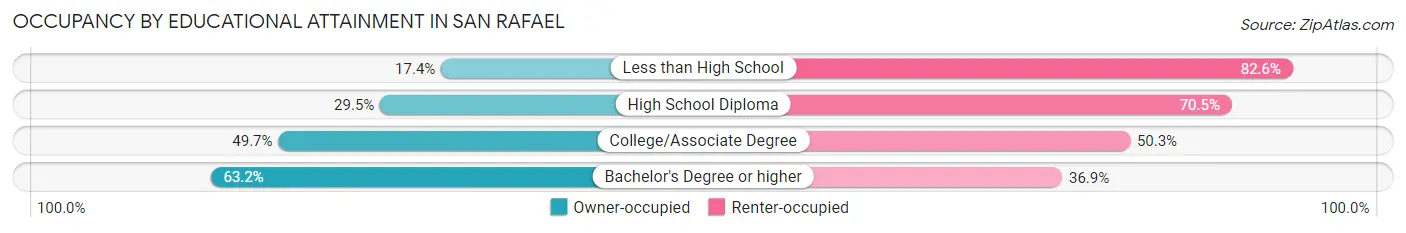
| Household Size | Owner-occupied | Renter-occupied |
| Less than High School | 394 (17.4%) | 1,869 (82.6%) |
| High School Diploma | 748 (29.5%) | 1,787 (70.5%) |
| College/Associate Degree | 2,767 (49.7%) | 2,801 (50.3%) |
| Bachelor's Degree or higher | 8,212 (63.1%) | 4,792 (36.8%) |
Occupancy by Age of Householder in San Rafael
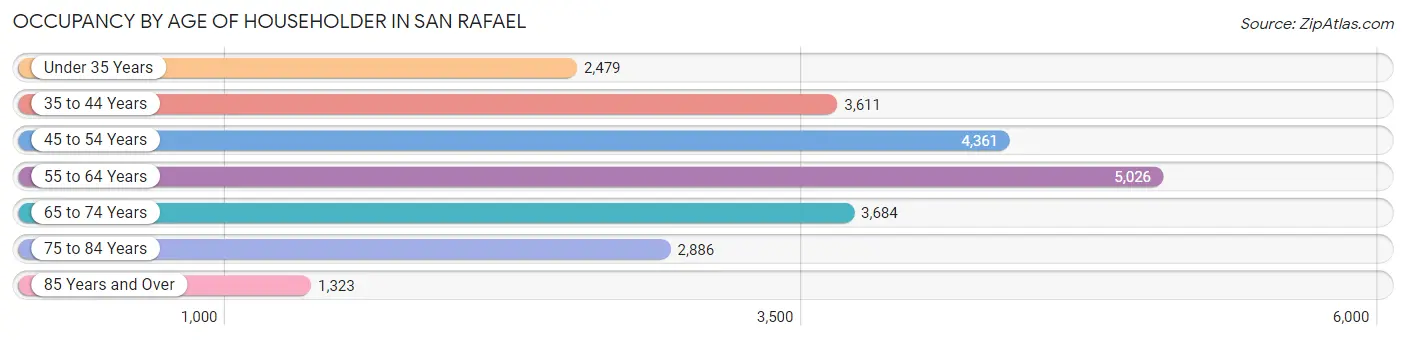
| Age Bracket | # Households | % Households |
| Under 35 Years | 2,479 | 10.6% |
| 35 to 44 Years | 3,611 | 15.4% |
| 45 to 54 Years | 4,361 | 18.7% |
| 55 to 64 Years | 5,026 | 21.5% |
| 65 to 74 Years | 3,684 | 15.8% |
| 75 to 84 Years | 2,886 | 12.3% |
| 85 Years and Over | 1,323 | 5.7% |
| Total | 23,370 | 100.0% |
Housing Finances in San Rafael
Median Income by Occupancy in San Rafael
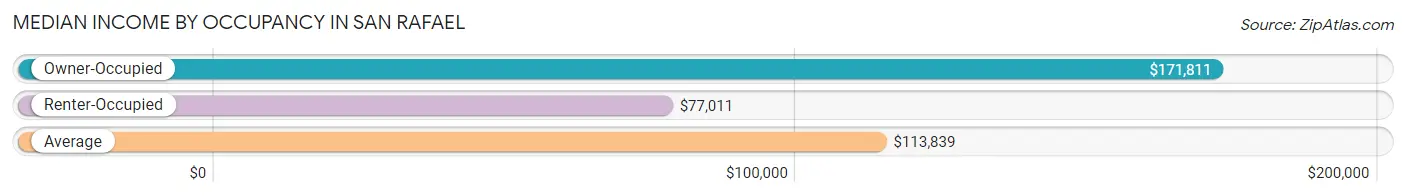
| Occupancy Type | # Households | Median Income |
| Owner-Occupied | 12,121 (51.9%) | $171,811 |
| Renter-Occupied | 11,249 (48.1%) | $77,011 |
| Average | 23,370 (100.0%) | $113,839 |
Occupancy by Householder Income Bracket in San Rafael
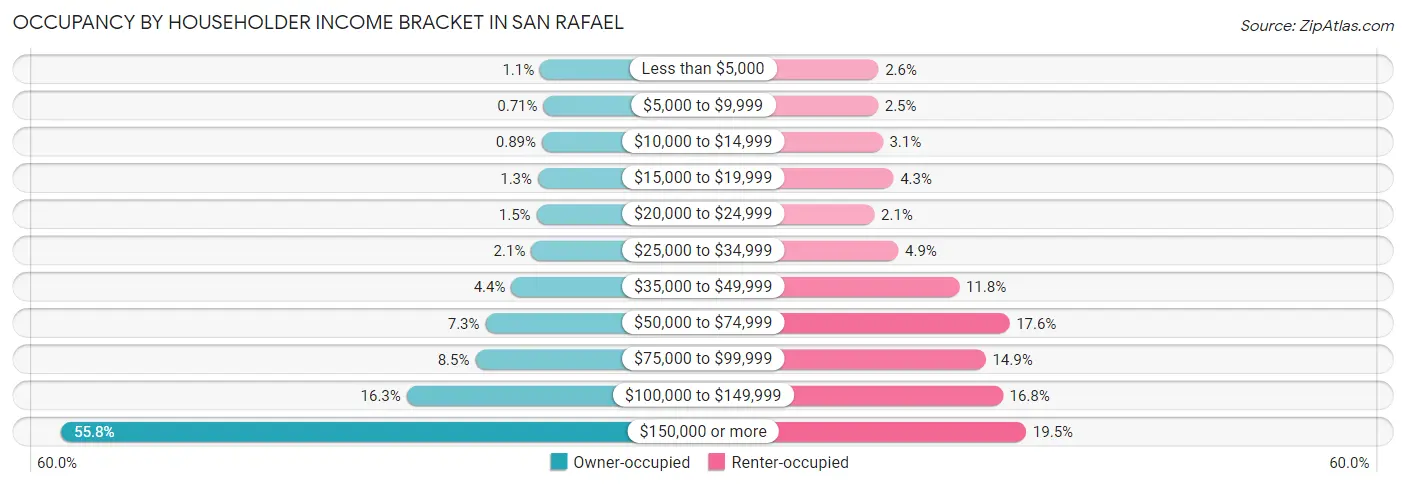
| Income Bracket | Owner-occupied | Renter-occupied |
| Less than $5,000 | 132 (1.1%) | 291 (2.6%) |
| $5,000 to $9,999 | 86 (0.7%) | 286 (2.5%) |
| $10,000 to $14,999 | 108 (0.9%) | 347 (3.1%) |
| $15,000 to $19,999 | 163 (1.3%) | 485 (4.3%) |
| $20,000 to $24,999 | 182 (1.5%) | 238 (2.1%) |
| $25,000 to $34,999 | 254 (2.1%) | 547 (4.9%) |
| $35,000 to $49,999 | 531 (4.4%) | 1,330 (11.8%) |
| $50,000 to $74,999 | 890 (7.3%) | 1,975 (17.6%) |
| $75,000 to $99,999 | 1,029 (8.5%) | 1,670 (14.8%) |
| $100,000 to $149,999 | 1,980 (16.3%) | 1,890 (16.8%) |
| $150,000 or more | 6,766 (55.8%) | 2,190 (19.5%) |
| Total | 12,121 (100.0%) | 11,249 (100.0%) |
Monthly Housing Cost Tiers in San Rafael
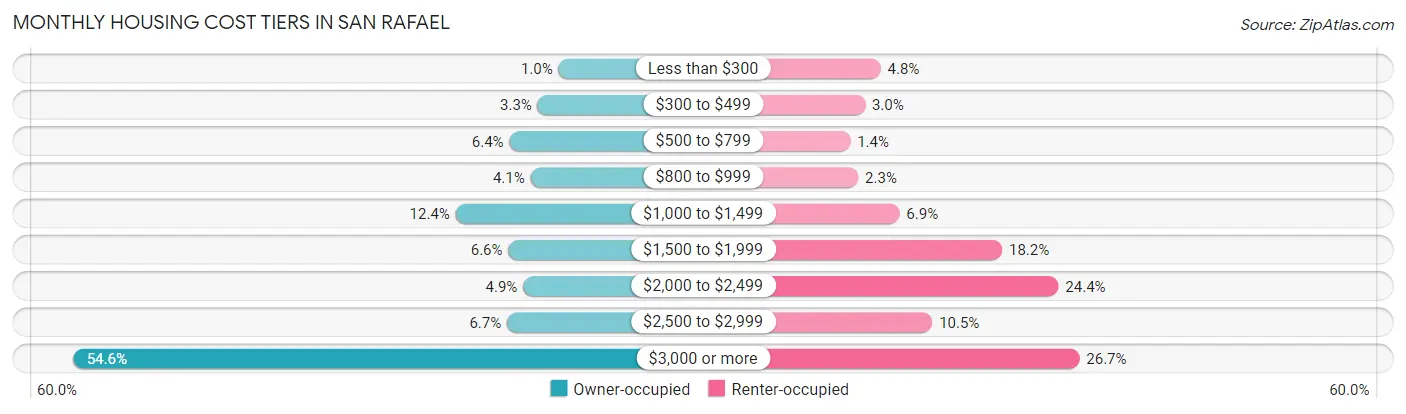
| Monthly Cost | Owner-occupied | Renter-occupied |
| Less than $300 | 122 (1.0%) | 537 (4.8%) |
| $300 to $499 | 402 (3.3%) | 342 (3.0%) |
| $500 to $799 | 781 (6.4%) | 159 (1.4%) |
| $800 to $999 | 498 (4.1%) | 258 (2.3%) |
| $1,000 to $1,499 | 1,500 (12.4%) | 770 (6.9%) |
| $1,500 to $1,999 | 795 (6.6%) | 2,046 (18.2%) |
| $2,000 to $2,499 | 596 (4.9%) | 2,746 (24.4%) |
| $2,500 to $2,999 | 812 (6.7%) | 1,178 (10.5%) |
| $3,000 or more | 6,615 (54.6%) | 3,007 (26.7%) |
| Total | 12,121 (100.0%) | 11,249 (100.0%) |
Physical Housing Characteristics in San Rafael
Housing Structures in San Rafael
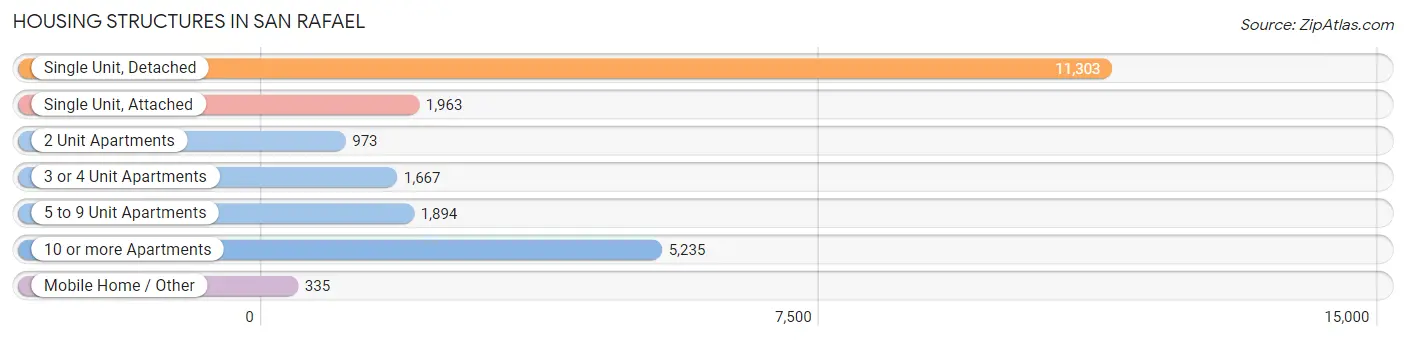
| Structure Type | # Housing Units | % Housing Units |
| Single Unit, Detached | 11,303 | 48.4% |
| Single Unit, Attached | 1,963 | 8.4% |
| 2 Unit Apartments | 973 | 4.2% |
| 3 or 4 Unit Apartments | 1,667 | 7.1% |
| 5 to 9 Unit Apartments | 1,894 | 8.1% |
| 10 or more Apartments | 5,235 | 22.4% |
| Mobile Home / Other | 335 | 1.4% |
| Total | 23,370 | 100.0% |
Housing Structures by Occupancy in San Rafael
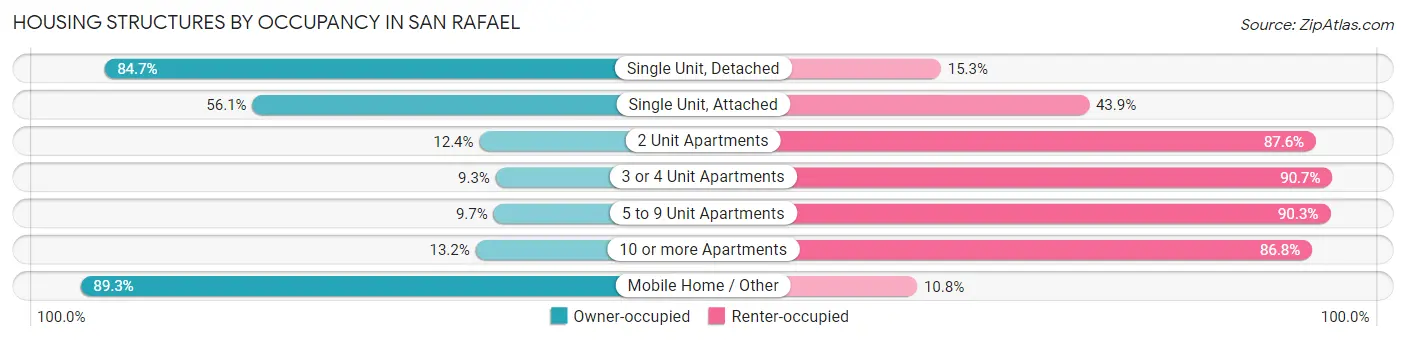
| Structure Type | Owner-occupied | Renter-occupied |
| Single Unit, Detached | 9,570 (84.7%) | 1,733 (15.3%) |
| Single Unit, Attached | 1,102 (56.1%) | 861 (43.9%) |
| 2 Unit Apartments | 121 (12.4%) | 852 (87.6%) |
| 3 or 4 Unit Apartments | 155 (9.3%) | 1,512 (90.7%) |
| 5 to 9 Unit Apartments | 184 (9.7%) | 1,710 (90.3%) |
| 10 or more Apartments | 690 (13.2%) | 4,545 (86.8%) |
| Mobile Home / Other | 299 (89.2%) | 36 (10.7%) |
| Total | 12,121 (51.9%) | 11,249 (48.1%) |
Housing Structures by Number of Rooms in San Rafael
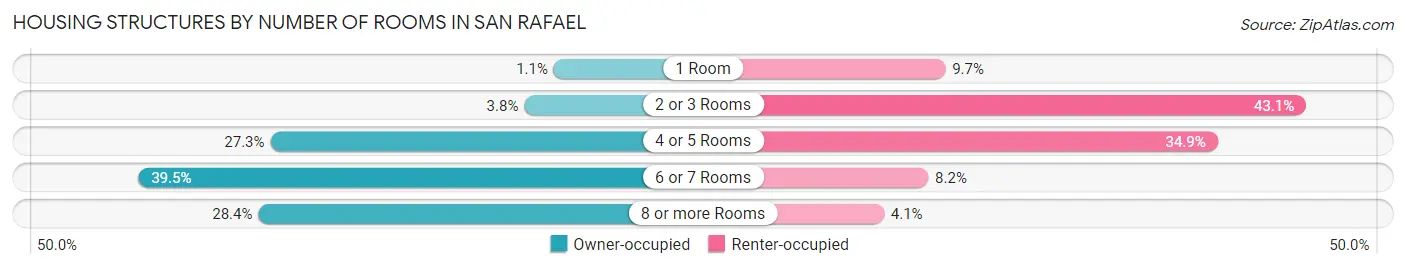
| Number of Rooms | Owner-occupied | Renter-occupied |
| 1 Room | 129 (1.1%) | 1,096 (9.7%) |
| 2 or 3 Rooms | 459 (3.8%) | 4,850 (43.1%) |
| 4 or 5 Rooms | 3,306 (27.3%) | 3,928 (34.9%) |
| 6 or 7 Rooms | 4,786 (39.5%) | 918 (8.2%) |
| 8 or more Rooms | 3,441 (28.4%) | 457 (4.1%) |
| Total | 12,121 (100.0%) | 11,249 (100.0%) |
Housing Structure by Heating Type in San Rafael
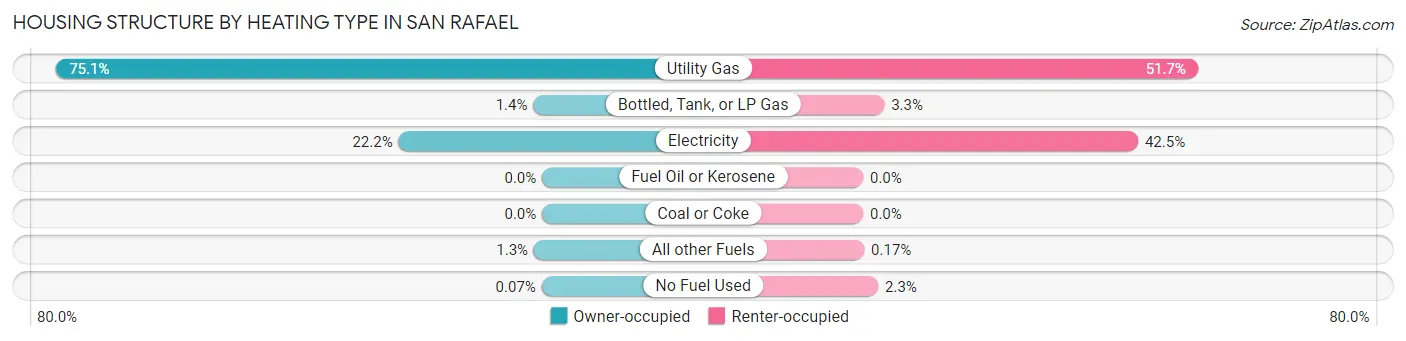
| Heating Type | Owner-occupied | Renter-occupied |
| Utility Gas | 9,104 (75.1%) | 5,819 (51.7%) |
| Bottled, Tank, or LP Gas | 165 (1.4%) | 368 (3.3%) |
| Electricity | 2,691 (22.2%) | 4,781 (42.5%) |
| Fuel Oil or Kerosene | 0 (0.0%) | 0 (0.0%) |
| Coal or Coke | 0 (0.0%) | 0 (0.0%) |
| All other Fuels | 153 (1.3%) | 19 (0.2%) |
| No Fuel Used | 8 (0.1%) | 262 (2.3%) |
| Total | 12,121 (100.0%) | 11,249 (100.0%) |
Household Vehicle Usage in San Rafael
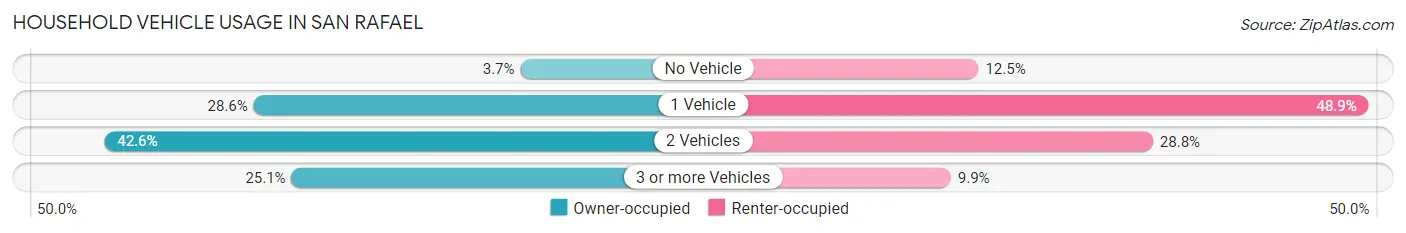
| Vehicles per Household | Owner-occupied | Renter-occupied |
| No Vehicle | 451 (3.7%) | 1,403 (12.5%) |
| 1 Vehicle | 3,470 (28.6%) | 5,499 (48.9%) |
| 2 Vehicles | 5,159 (42.6%) | 3,234 (28.7%) |
| 3 or more Vehicles | 3,041 (25.1%) | 1,113 (9.9%) |
| Total | 12,121 (100.0%) | 11,249 (100.0%) |
Real Estate & Mortgages in San Rafael
Real Estate and Mortgage Overview in San Rafael
| Characteristic | Without Mortgage | With Mortgage |
| Housing Units | 4,043 | 8,078 |
| Median Property Value | $1,094,800 | $1,271,500 |
| Median Household Income | $109,798 | $5,241 |
| Monthly Housing Costs | $1,092 | $6,323 |
| Real Estate Taxes | $6,213 | $63 |
Property Value by Mortgage Status in San Rafael
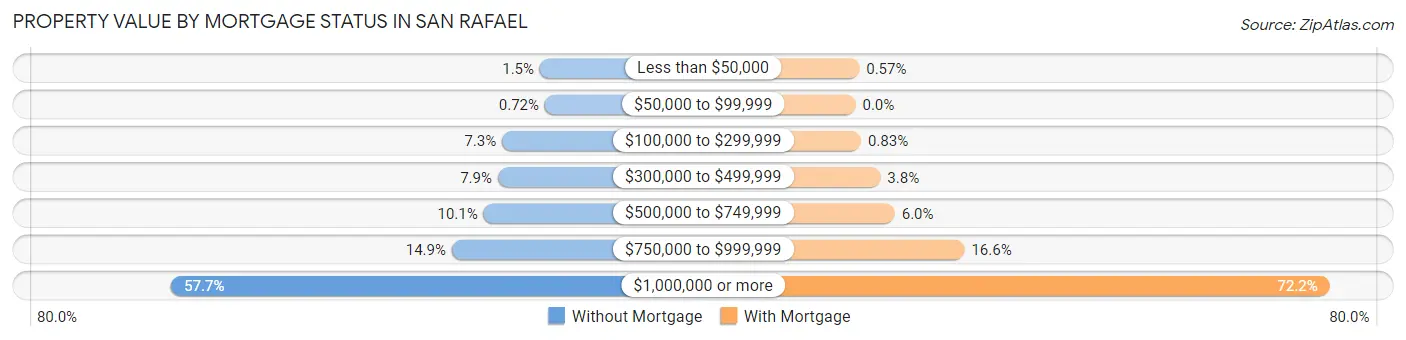
| Property Value | Without Mortgage | With Mortgage |
| Less than $50,000 | 60 (1.5%) | 46 (0.6%) |
| $50,000 to $99,999 | 29 (0.7%) | 0 (0.0%) |
| $100,000 to $299,999 | 293 (7.2%) | 67 (0.8%) |
| $300,000 to $499,999 | 319 (7.9%) | 306 (3.8%) |
| $500,000 to $749,999 | 407 (10.1%) | 483 (6.0%) |
| $750,000 to $999,999 | 603 (14.9%) | 1,341 (16.6%) |
| $1,000,000 or more | 2,332 (57.7%) | 5,835 (72.2%) |
| Total | 4,043 (100.0%) | 8,078 (100.0%) |
Household Income by Mortgage Status in San Rafael
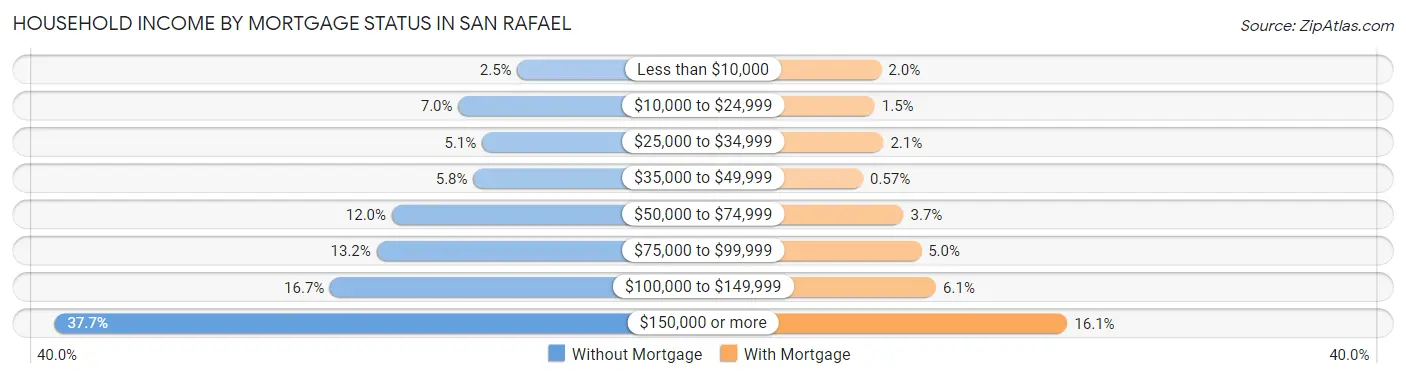
| Household Income | Without Mortgage | With Mortgage |
| Less than $10,000 | 99 (2.5%) | 159 (2.0%) |
| $10,000 to $24,999 | 281 (7.0%) | 119 (1.5%) |
| $25,000 to $34,999 | 208 (5.1%) | 172 (2.1%) |
| $35,000 to $49,999 | 235 (5.8%) | 46 (0.6%) |
| $50,000 to $74,999 | 486 (12.0%) | 296 (3.7%) |
| $75,000 to $99,999 | 533 (13.2%) | 404 (5.0%) |
| $100,000 to $149,999 | 676 (16.7%) | 496 (6.1%) |
| $150,000 or more | 1,525 (37.7%) | 1,304 (16.1%) |
| Total | 4,043 (100.0%) | 8,078 (100.0%) |
Property Value to Household Income Ratio in San Rafael
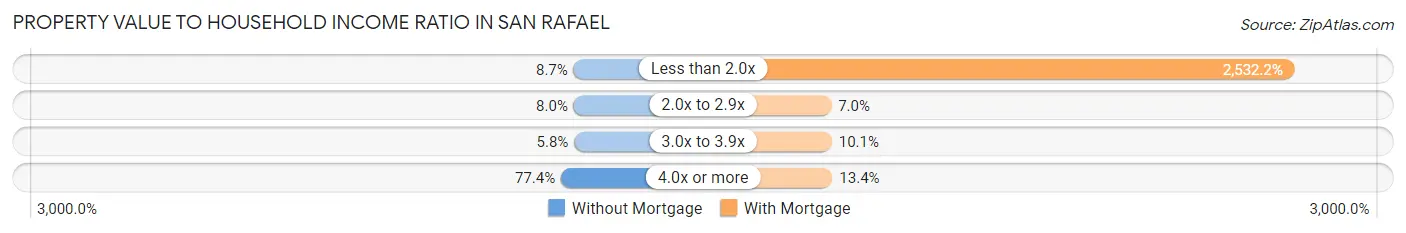
| Value-to-Income Ratio | Without Mortgage | With Mortgage |
| Less than 2.0x | 350 (8.7%) | 204,554 (2,532.2%) |
| 2.0x to 2.9x | 324 (8.0%) | 566 (7.0%) |
| 3.0x to 3.9x | 233 (5.8%) | 812 (10.1%) |
| 4.0x or more | 3,128 (77.4%) | 1,084 (13.4%) |
| Total | 4,043 (100.0%) | 8,078 (100.0%) |
Real Estate Taxes by Mortgage Status in San Rafael
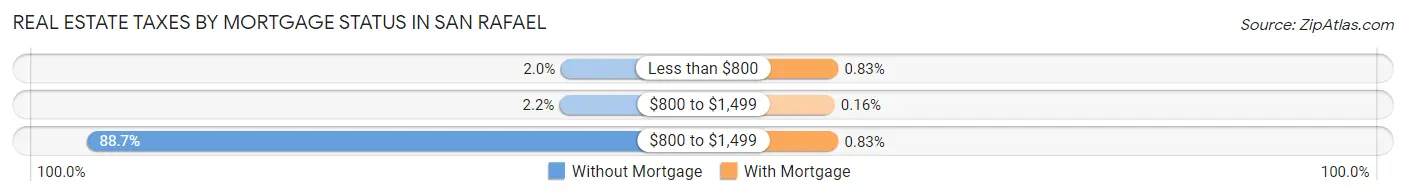
| Property Taxes | Without Mortgage | With Mortgage |
| Less than $800 | 82 (2.0%) | 67 (0.8%) |
| $800 to $1,499 | 88 (2.2%) | 13 (0.2%) |
| $800 to $1,499 | 3,585 (88.7%) | 67 (0.8%) |
| Total | 4,043 (100.0%) | 8,078 (100.0%) |
Health & Disability in San Rafael
Health Insurance Coverage by Age in San Rafael
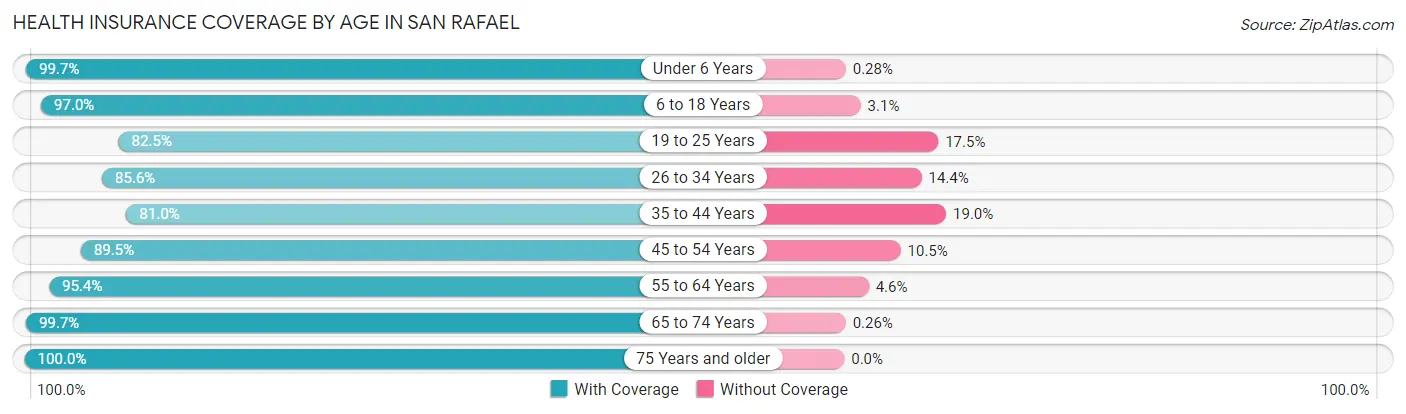
| Age Bracket | With Coverage | Without Coverage |
| Under 6 Years | 3,200 (99.7%) | 9 (0.3%) |
| 6 to 18 Years | 8,933 (97.0%) | 281 (3.0%) |
| 19 to 25 Years | 4,172 (82.5%) | 886 (17.5%) |
| 26 to 34 Years | 4,598 (85.6%) | 775 (14.4%) |
| 35 to 44 Years | 6,605 (81.0%) | 1,548 (19.0%) |
| 45 to 54 Years | 7,183 (89.5%) | 843 (10.5%) |
| 55 to 64 Years | 8,537 (95.4%) | 408 (4.6%) |
| 65 to 74 Years | 6,439 (99.7%) | 17 (0.3%) |
| 75 Years and older | 5,719 (100.0%) | 0 (0.0%) |
| Total | 55,386 (92.1%) | 4,767 (7.9%) |
Health Insurance Coverage by Citizenship Status in San Rafael
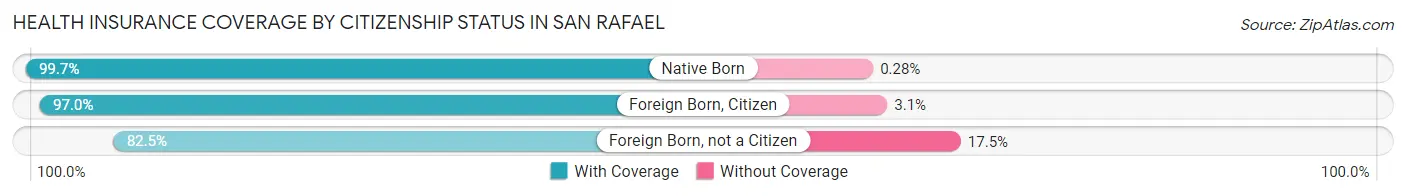
| Citizenship Status | With Coverage | Without Coverage |
| Native Born | 3,200 (99.7%) | 9 (0.3%) |
| Foreign Born, Citizen | 8,933 (97.0%) | 281 (3.0%) |
| Foreign Born, not a Citizen | 4,172 (82.5%) | 886 (17.5%) |
Health Insurance Coverage by Household Income in San Rafael
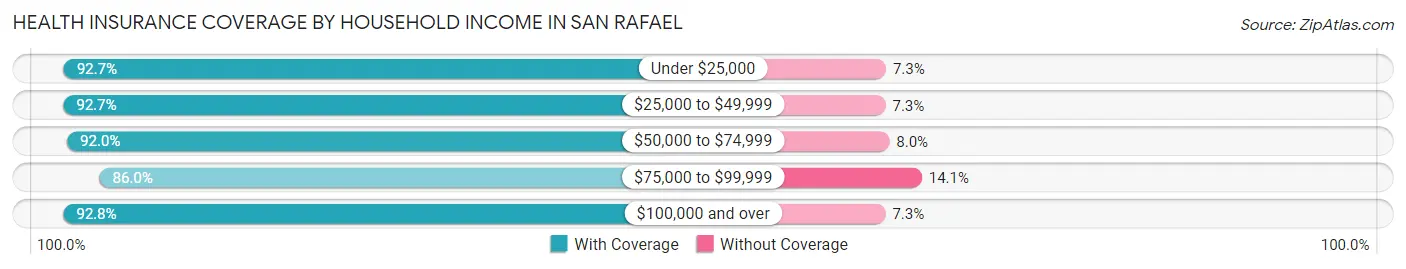
| Household Income | With Coverage | Without Coverage |
| Under $25,000 | 3,297 (92.7%) | 261 (7.3%) |
| $25,000 to $49,999 | 4,723 (92.7%) | 370 (7.3%) |
| $50,000 to $74,999 | 5,093 (92.0%) | 441 (8.0%) |
| $75,000 to $99,999 | 5,838 (86.0%) | 954 (14.1%) |
| $100,000 and over | 34,898 (92.7%) | 2,726 (7.2%) |
Public vs Private Health Insurance Coverage by Age in San Rafael
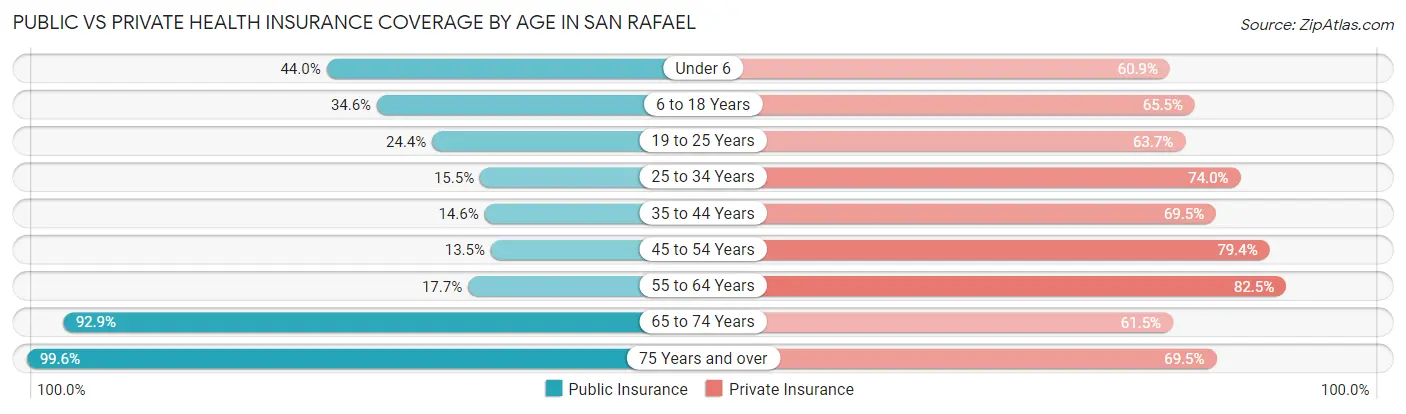
| Age Bracket | Public Insurance | Private Insurance |
| Under 6 | 1,411 (44.0%) | 1,954 (60.9%) |
| 6 to 18 Years | 3,188 (34.6%) | 6,038 (65.5%) |
| 19 to 25 Years | 1,232 (24.4%) | 3,223 (63.7%) |
| 25 to 34 Years | 831 (15.5%) | 3,975 (74.0%) |
| 35 to 44 Years | 1,194 (14.6%) | 5,662 (69.5%) |
| 45 to 54 Years | 1,081 (13.5%) | 6,371 (79.4%) |
| 55 to 64 Years | 1,583 (17.7%) | 7,375 (82.5%) |
| 65 to 74 Years | 5,999 (92.9%) | 3,967 (61.5%) |
| 75 Years and over | 5,696 (99.6%) | 3,976 (69.5%) |
| Total | 22,215 (36.9%) | 42,541 (70.7%) |
Disability Status by Sex by Age in San Rafael
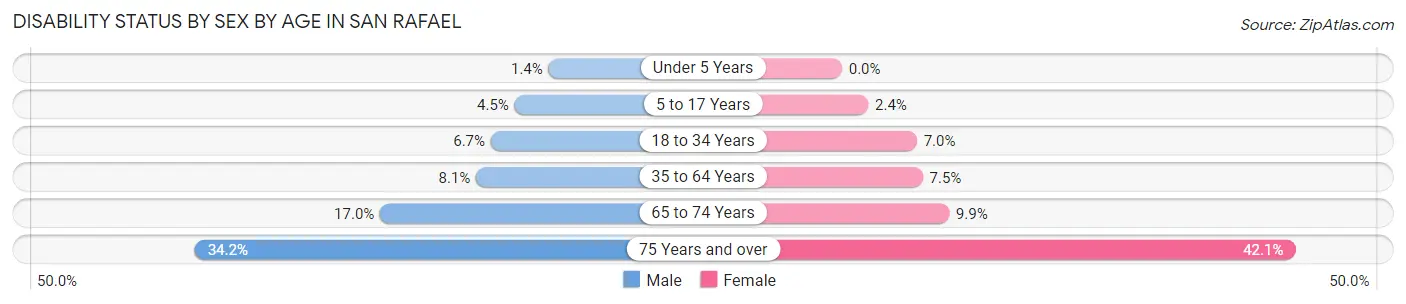
| Age Bracket | Male | Female |
| Under 5 Years | 19 (1.4%) | 0 (0.0%) |
| 5 to 17 Years | 211 (4.5%) | 101 (2.4%) |
| 18 to 34 Years | 415 (6.7%) | 380 (7.0%) |
| 35 to 64 Years | 991 (8.1%) | 965 (7.5%) |
| 65 to 74 Years | 533 (17.0%) | 330 (9.9%) |
| 75 Years and over | 686 (34.2%) | 1,563 (42.1%) |
Disability Class by Sex by Age in San Rafael
Disability Class: Hearing Difficulty
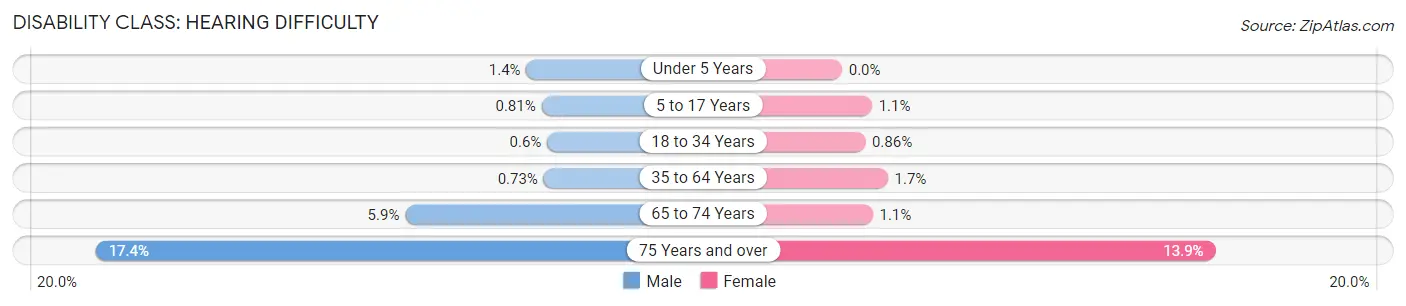
| Age Bracket | Male | Female |
| Under 5 Years | 19 (1.4%) | 0 (0.0%) |
| 5 to 17 Years | 38 (0.8%) | 46 (1.1%) |
| 18 to 34 Years | 37 (0.6%) | 47 (0.9%) |
| 35 to 64 Years | 89 (0.7%) | 219 (1.7%) |
| 65 to 74 Years | 184 (5.9%) | 38 (1.1%) |
| 75 Years and over | 348 (17.4%) | 515 (13.9%) |
Disability Class: Vision Difficulty
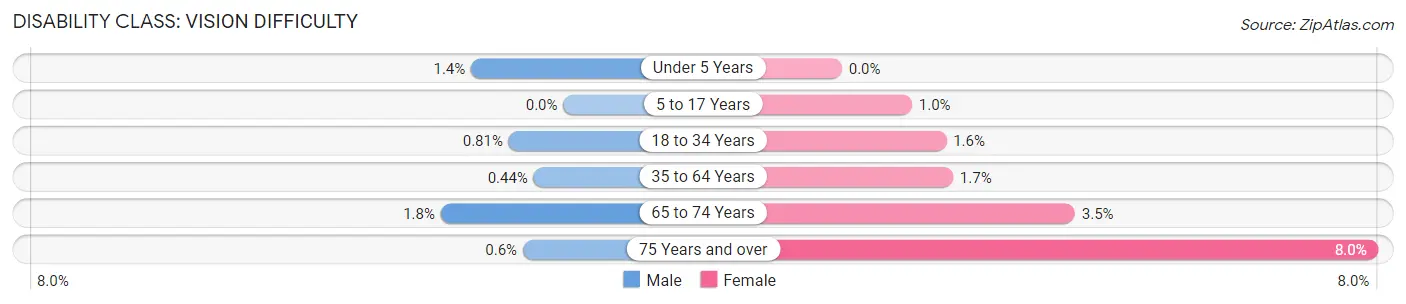
| Age Bracket | Male | Female |
| Under 5 Years | 19 (1.4%) | 0 (0.0%) |
| 5 to 17 Years | 0 (0.0%) | 43 (1.0%) |
| 18 to 34 Years | 50 (0.8%) | 85 (1.5%) |
| 35 to 64 Years | 54 (0.4%) | 213 (1.7%) |
| 65 to 74 Years | 57 (1.8%) | 115 (3.5%) |
| 75 Years and over | 12 (0.6%) | 296 (8.0%) |
Disability Class: Cognitive Difficulty
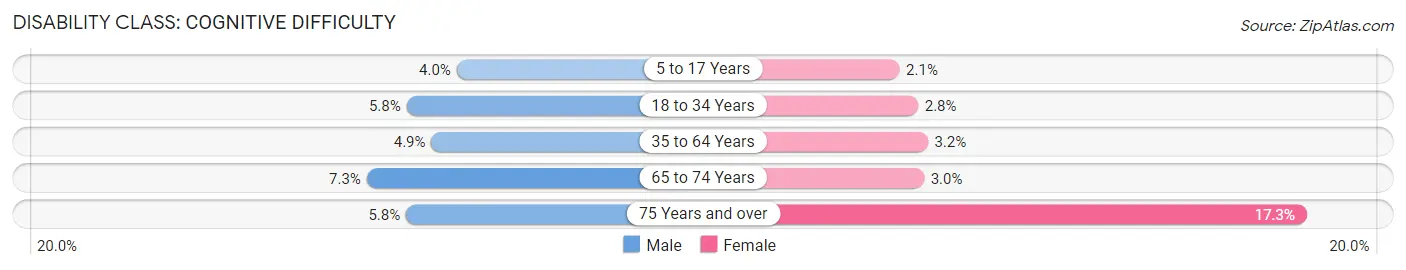
| Age Bracket | Male | Female |
| 5 to 17 Years | 185 (4.0%) | 88 (2.1%) |
| 18 to 34 Years | 359 (5.8%) | 154 (2.8%) |
| 35 to 64 Years | 601 (4.9%) | 409 (3.2%) |
| 65 to 74 Years | 229 (7.3%) | 101 (3.0%) |
| 75 Years and over | 117 (5.8%) | 641 (17.3%) |
Disability Class: Ambulatory Difficulty
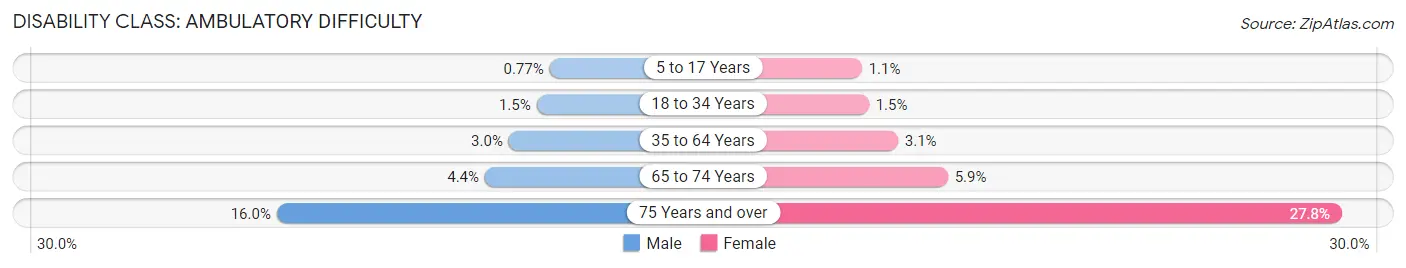
| Age Bracket | Male | Female |
| 5 to 17 Years | 36 (0.8%) | 46 (1.1%) |
| 18 to 34 Years | 92 (1.5%) | 82 (1.5%) |
| 35 to 64 Years | 372 (3.0%) | 402 (3.1%) |
| 65 to 74 Years | 137 (4.4%) | 196 (5.9%) |
| 75 Years and over | 320 (16.0%) | 1,034 (27.8%) |
Disability Class: Self-Care Difficulty
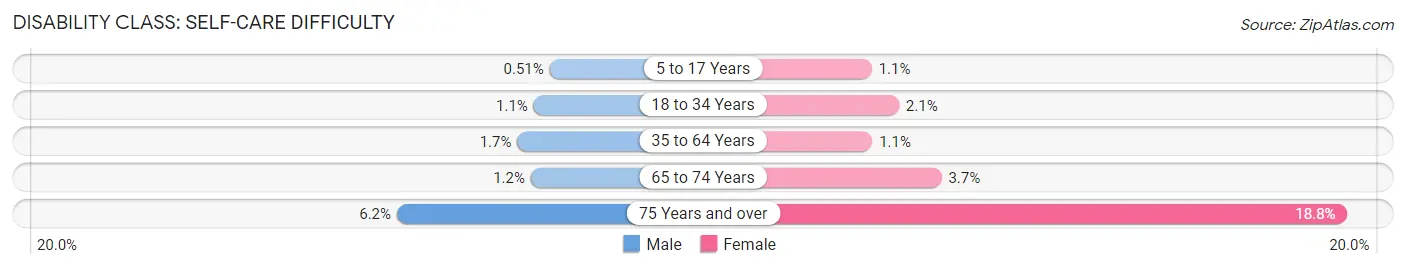
| Age Bracket | Male | Female |
| 5 to 17 Years | 24 (0.5%) | 46 (1.1%) |
| 18 to 34 Years | 68 (1.1%) | 116 (2.1%) |
| 35 to 64 Years | 210 (1.7%) | 145 (1.1%) |
| 65 to 74 Years | 38 (1.2%) | 123 (3.7%) |
| 75 Years and over | 124 (6.2%) | 697 (18.8%) |
Technology Access in San Rafael
Computing Device Access in San Rafael
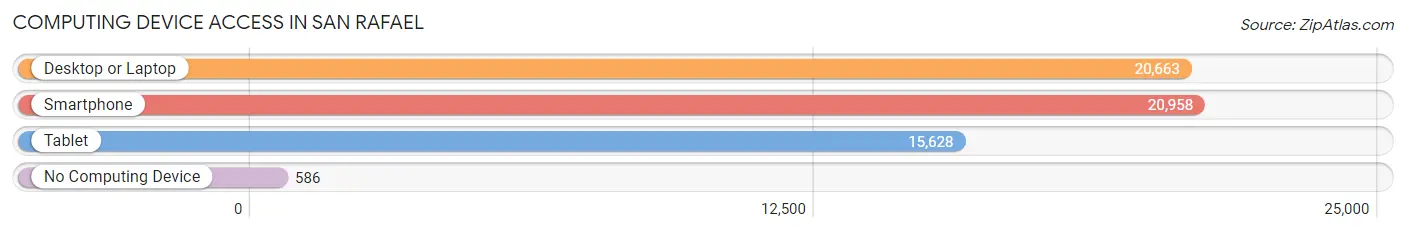
| Device Type | # Households | % Households |
| Desktop or Laptop | 20,663 | 88.4% |
| Smartphone | 20,958 | 89.7% |
| Tablet | 15,628 | 66.9% |
| No Computing Device | 586 | 2.5% |
| Total | 23,370 | 100.0% |
Internet Access in San Rafael
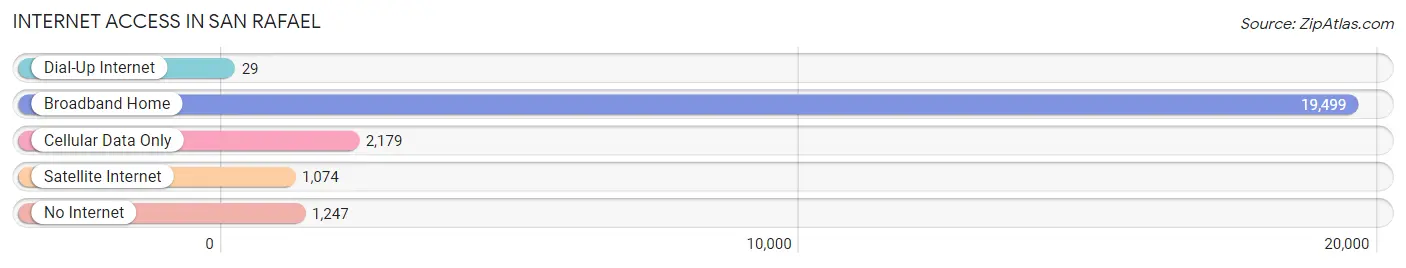
| Internet Type | # Households | % Households |
| Dial-Up Internet | 29 | 0.1% |
| Broadband Home | 19,499 | 83.4% |
| Cellular Data Only | 2,179 | 9.3% |
| Satellite Internet | 1,074 | 4.6% |
| No Internet | 1,247 | 5.3% |
| Total | 23,370 | 100.0% |
San Rafael Summary
San Rafael is a city located in Marin County, California, United States. It is the county seat of Marin County and is located in the San Francisco Bay Area. The city is situated in the North Bay region of the San Francisco Bay Area, approximately 10 miles (16 km) north of San Francisco. As of the 2010 census, the city's population was 57,713. San Rafael is the largest city in Marin County and is the fourth-largest city in the Bay Area, after San Francisco, Oakland, and Fremont.
History
San Rafael was founded in 1817 by the Spanish missionary Father Luis Antonio Martinez. The mission was named after Saint Rafael, the archangel. The mission was originally located in what is now the city of San Rafael, but was moved to its current location in 1822. The mission was secularized in 1834 and the land was divided into ranchos.
In 1859, the city of San Rafael was incorporated. The city was named after the mission and was the first city in Marin County. The city grew rapidly in the late 19th century and early 20th century, and by the 1920s it had become a major commercial and industrial center.
Geography
San Rafael is located in the North Bay region of the San Francisco Bay Area, approximately 10 miles (16 km) north of San Francisco. The city is situated on the San Rafael Bay, an arm of the San Francisco Bay. The city is surrounded by several hills, including Mount Tamalpais, which is the highest peak in the Bay Area.
The city has a total area of 22.2 square miles (57.5 km2), of which 21.2 square miles (54.9 km2) is land and 1.0 square mile (2.6 km2) is water.
Economy
San Rafael is a major economic center in Marin County and the North Bay region of the San Francisco Bay Area. The city is home to a variety of businesses, including technology, finance, healthcare, retail, and manufacturing.
The city is also home to several major employers, including Autodesk, BioMarin Pharmaceutical, and Kaiser Permanente. The city is also home to several educational institutions, including Dominican University of California, San Rafael High School, and San Rafael City College.
Demographics
As of the 2010 census, the city's population was 57,713. The population density was 2,611.3 people per square mile (1,006.2/km2). The racial makeup of the city was 68.2% White, 8.3% African American, 0.7% Native American, 11.2% Asian, 0.3% Pacific Islander, 6.2% from other races, and 5.2% from two or more races. Hispanic or Latino of any race were 17.7% of the population.
The median income for a household in the city was $68,945, and the median income for a family was $81,945. The per capita income for the city was $37,945. About 8.2% of families and 11.2% of the population were below the poverty line, including 15.2% of those under age 18 and 6.2% of those age 65 or over.
Common Questions
What is Per Capita Income in San Rafael?
Per Capita income in San Rafael is $66,398.
What is the Median Family Income in San Rafael?
Median Family Income in San Rafael is $148,089.
What is the Median Household income in San Rafael?
Median Household Income in San Rafael is $113,839.
What is Income or Wage Gap in San Rafael?
Income or Wage Gap in San Rafael is 15.0%.
Women in San Rafael earn 85.0 cents for every dollar earned by a man.
What is Family Income Deficit in San Rafael?
Family Income Deficit in San Rafael is $11,286.
Families that are below poverty line in San Rafael earn $11,286 less on average than the poverty threshold level.
What is Inequality or Gini Index in San Rafael?
Inequality or Gini Index in San Rafael is 0.50.
What is the Total Population of San Rafael?
Total Population of San Rafael is 60,891.
What is the Total Male Population of San Rafael?
Total Male Population of San Rafael is 30,110.
What is the Total Female Population of San Rafael?
Total Female Population of San Rafael is 30,781.
What is the Ratio of Males per 100 Females in San Rafael?
There are 97.82 Males per 100 Females in San Rafael.
What is the Ratio of Females per 100 Males in San Rafael?
There are 102.23 Females per 100 Males in San Rafael.
What is the Median Population Age in San Rafael?
Median Population Age in San Rafael is 44.0 Years.
What is the Average Family Size in San Rafael
Average Family Size in San Rafael is 3.1 People.
What is the Average Household Size in San Rafael
Average Household Size in San Rafael is 2.5 People.
How Large is the Labor Force in San Rafael?
There are 33,187 People in the Labor Forcein in San Rafael.
What is the Percentage of People in the Labor Force in San Rafael?
64.8% of People are in the Labor Force in San Rafael.
What is the Unemployment Rate in San Rafael?
Unemployment Rate in San Rafael is 4.8%.