Cities with the Highest Percentage of Central American Population in the United States
RELATED REPORTS & OPTIONS
Central American
United States
Compare Cities
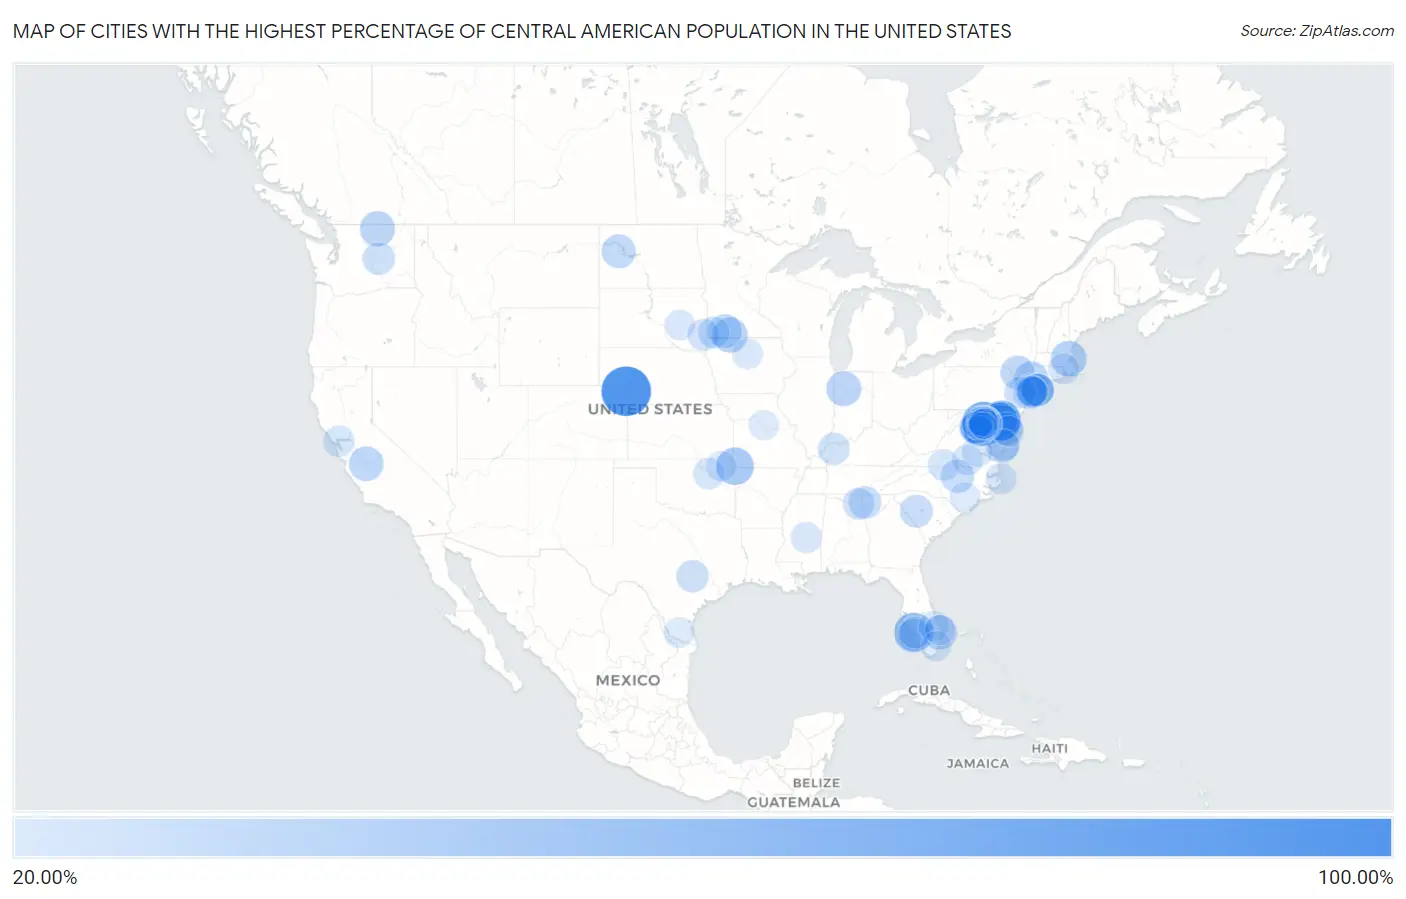
Map of Cities with the Highest Percentage of Central American Population in the United States
0.00%
100.00%
Cities with the Highest Percentage of Central American Population in the United States
| City | Central American | vs State | vs National | |
| 1. | Amherst | 100.00% | 0.88%(+99.1)#1 | 1.81%(+98.2)#1 |
| 2. | Acala | 90.32% | 2.57%(+87.8)#1 | 1.81%(+88.5)#2 |
| 3. | Langley Park | 77.31% | 5.18%(+72.1)#1 | 1.81%(+75.5)#3 |
| 4. | Marydel | 61.24% | 5.18%(+56.1)#2 | 1.81%(+59.4)#4 |
| 5. | Palmona Park | 59.89% | 2.84%(+57.1)#1 | 1.81%(+58.1)#5 |
| 6. | Templeville | 57.69% | 5.18%(+52.5)#3 | 1.81%(+55.9)#6 |
| 7. | Henderson | 55.70% | 5.18%(+50.5)#4 | 1.81%(+53.9)#7 |
| 8. | Ginger Blue | 52.21% | 0.50%(+51.7)#1 | 1.81%(+50.4)#8 |
| 9. | Willis Wharf | 48.89% | 3.59%(+45.3)#1 | 1.81%(+47.1)#9 |
| 10. | Teterboro Borough | 48.35% | 2.71%(+45.6)#1 | 1.81%(+46.5)#10 |
| 11. | Goldsboro | 46.92% | 5.18%(+41.7)#5 | 1.81%(+45.1)#11 |
| 12. | Landover Hills | 46.36% | 5.18%(+41.2)#6 | 1.81%(+44.6)#12 |
| 13. | Chelsea | 45.11% | 2.26%(+42.9)#1 | 1.81%(+43.3)#13 |
| 14. | Barclay | 43.43% | 5.18%(+38.2)#7 | 1.81%(+41.6)#14 |
| 15. | Alpha | 42.98% | 0.62%(+42.4)#1 | 1.81%(+41.2)#15 |
| 16. | Loomis | 42.86% | 0.95%(+41.9)#1 | 1.81%(+41.0)#16 |
| 17. | Monon | 41.78% | 0.61%(+41.2)#1 | 1.81%(+40.0)#17 |
| 18. | Adelphi | 41.22% | 5.18%(+36.0)#8 | 1.81%(+39.4)#18 |
| 19. | Edmonston | 41.12% | 5.18%(+35.9)#9 | 1.81%(+39.3)#19 |
| 20. | Mendota | 40.88% | 3.80%(+37.1)#1 | 1.81%(+39.1)#20 |
| 21. | Brewster | 40.78% | 2.17%(+38.6)#1 | 1.81%(+39.0)#21 |
| 22. | Westgate | 40.01% | 2.84%(+37.2)#2 | 1.81%(+38.2)#22 |
| 23. | Dudley | 39.63% | 1.71%(+37.9)#1 | 1.81%(+37.8)#23 |
| 24. | Berwyn Heights | 38.74% | 5.18%(+33.6)#10 | 1.81%(+36.9)#24 |
| 25. | Chillum | 38.65% | 5.18%(+33.5)#11 | 1.81%(+36.8)#25 |
| 26. | Mandaree | 38.45% | 0.28%(+38.2)#1 | 1.81%(+36.6)#26 |
| 27. | Wilder | 38.10% | 0.62%(+37.5)#2 | 1.81%(+36.3)#27 |
| 28. | South Fallsburg | 38.08% | 2.17%(+35.9)#2 | 1.81%(+36.3)#28 |
| 29. | Yorkshire | 37.61% | 3.59%(+34.0)#2 | 1.81%(+35.8)#29 |
| 30. | Sudley | 37.05% | 3.59%(+33.5)#3 | 1.81%(+35.2)#30 |
| 31. | North Brentwood | 36.81% | 5.18%(+31.6)#12 | 1.81%(+35.0)#31 |
| 32. | New Cassel | 36.64% | 2.17%(+34.5)#3 | 1.81%(+34.8)#32 |
| 33. | Canada De Los Alamos | 36.61% | 0.49%(+36.1)#1 | 1.81%(+34.8)#33 |
| 34. | North Bay Shore | 36.55% | 2.17%(+34.4)#4 | 1.81%(+34.7)#34 |
| 35. | Gorman | 36.32% | 1.71%(+34.6)#2 | 1.81%(+34.5)#35 |
| 36. | Brentwood | 35.96% | 5.18%(+30.8)#13 | 1.81%(+34.1)#36 |
| 37. | Inwood | 35.89% | 2.17%(+33.7)#5 | 1.81%(+34.1)#37 |
| 38. | East Riverdale | 35.51% | 5.18%(+30.3)#14 | 1.81%(+33.7)#38 |
| 39. | Hutchison | 35.21% | 3.59%(+31.6)#4 | 1.81%(+33.4)#39 |
| 40. | Accomac | 35.17% | 3.59%(+31.6)#5 | 1.81%(+33.4)#40 |
| 41. | Colmar Manor | 35.16% | 5.18%(+30.0)#15 | 1.81%(+33.3)#41 |
| 42. | Georgetown | 34.79% | 1.46%(+33.3)#1 | 1.81%(+33.0)#42 |
| 43. | Woodlawn Cdp Prince George S County | 34.40% | 5.18%(+29.2)#16 | 1.81%(+32.6)#43 |
| 44. | Saluda | 34.35% | 0.85%(+33.5)#1 | 1.81%(+32.5)#44 |
| 45. | Loch Lomond | 33.73% | 3.59%(+30.1)#6 | 1.81%(+31.9)#45 |
| 46. | Beltsville | 33.56% | 5.18%(+28.4)#17 | 1.81%(+31.7)#46 |
| 47. | Trion | 33.32% | 1.59%(+31.7)#1 | 1.81%(+31.5)#47 |
| 48. | Central Islip | 33.26% | 2.17%(+31.1)#6 | 1.81%(+31.4)#48 |
| 49. | Woodlawn Cdp Fairfax County | 32.90% | 3.59%(+29.3)#7 | 1.81%(+31.1)#49 |
| 50. | Harlem Heights | 32.88% | 2.84%(+30.0)#3 | 1.81%(+31.1)#50 |
| 51. | Wyldwood | 32.46% | 2.57%(+29.9)#2 | 1.81%(+30.7)#51 |
| 52. | Brentwood | 32.30% | 2.17%(+30.1)#7 | 1.81%(+30.5)#52 |
| 53. | Lakeview | 32.08% | 0.95%(+31.1)#2 | 1.81%(+30.3)#53 |
| 54. | Meadow View Addition | 31.07% | 0.78%(+30.3)#1 | 1.81%(+29.3)#54 |
| 55. | Wheaton | 31.04% | 5.18%(+25.9)#18 | 1.81%(+29.2)#55 |
| 56. | Sebree | 30.81% | 0.55%(+30.3)#1 | 1.81%(+29.0)#56 |
| 57. | Manassas Park | 30.69% | 3.59%(+27.1)#8 | 1.81%(+28.9)#57 |
| 58. | Plainfield | 30.63% | 2.71%(+27.9)#2 | 1.81%(+28.8)#58 |
| 59. | Pine Ridge | 30.55% | 0.71%(+29.8)#1 | 1.81%(+28.7)#59 |
| 60. | Tice | 30.38% | 2.84%(+27.5)#4 | 1.81%(+28.6)#60 |
| 61. | Metompkin | 30.33% | 3.59%(+26.7)#9 | 1.81%(+28.5)#61 |
| 62. | Riverdale Park | 30.31% | 5.18%(+25.1)#19 | 1.81%(+28.5)#62 |
| 63. | Bull Run | 30.29% | 3.59%(+26.7)#10 | 1.81%(+28.5)#63 |
| 64. | Hempstead | 30.29% | 2.17%(+28.1)#8 | 1.81%(+28.5)#64 |
| 65. | Rockfield | 30.26% | 0.61%(+29.6)#2 | 1.81%(+28.5)#65 |
| 66. | Hankins | 30.08% | 2.17%(+27.9)#9 | 1.81%(+28.3)#66 |
| 67. | Lismore | 29.45% | 0.62%(+28.8)#3 | 1.81%(+27.6)#67 |
| 68. | Sterling | 29.21% | 3.59%(+25.6)#11 | 1.81%(+27.4)#68 |
| 69. | Laurel Park | 28.99% | 3.59%(+25.4)#12 | 1.81%(+27.2)#69 |
| 70. | Roosevelt | 28.66% | 2.17%(+26.5)#10 | 1.81%(+26.8)#70 |
| 71. | North Richmond | 28.31% | 3.80%(+24.5)#2 | 1.81%(+26.5)#71 |
| 72. | Oak Grove | 28.12% | 0.89%(+27.2)#1 | 1.81%(+26.3)#72 |
| 73. | Hillsboro | 27.55% | 0.50%(+27.0)#1 | 1.81%(+25.7)#73 |
| 74. | Fair Oaks | 27.44% | 0.61%(+26.8)#3 | 1.81%(+25.6)#74 |
| 75. | Frankford | 27.43% | 1.46%(+26.0)#2 | 1.81%(+25.6)#75 |
| 76. | Manns Harbor | 27.34% | 1.71%(+25.6)#3 | 1.81%(+25.5)#76 |
| 77. | Deerwood | 27.17% | 2.57%(+24.6)#3 | 1.81%(+25.4)#77 |
| 78. | Central Falls | 26.99% | 3.29%(+23.7)#1 | 1.81%(+25.2)#78 |
| 79. | Millstone Borough | 26.88% | 2.71%(+24.2)#3 | 1.81%(+25.1)#79 |
| 80. | Bensley | 26.69% | 3.59%(+23.1)#13 | 1.81%(+24.9)#80 |
| 81. | Seven Corners | 26.36% | 3.59%(+22.8)#14 | 1.81%(+24.6)#81 |
| 82. | Kenbridge | 26.28% | 3.59%(+22.7)#15 | 1.81%(+24.5)#82 |
| 83. | Galt | 26.00% | 0.75%(+25.2)#1 | 1.81%(+24.2)#83 |
| 84. | Dumfries | 26.00% | 3.59%(+22.4)#16 | 1.81%(+24.2)#84 |
| 85. | Herndon | 25.91% | 3.59%(+22.3)#17 | 1.81%(+24.1)#85 |
| 86. | Lake Worth Beach | 25.82% | 2.84%(+23.0)#5 | 1.81%(+24.0)#86 |
| 87. | Indiantown | 25.63% | 2.84%(+22.8)#6 | 1.81%(+23.8)#87 |
| 88. | Uniondale | 25.60% | 2.17%(+23.4)#11 | 1.81%(+23.8)#88 |
| 89. | Alpena | 25.55% | 0.78%(+24.8)#2 | 1.81%(+23.7)#89 |
| 90. | Sweetwater | 25.13% | 2.84%(+22.3)#7 | 1.81%(+23.3)#90 |
| 91. | Cottage City | 25.11% | 5.18%(+19.9)#20 | 1.81%(+23.3)#91 |
| 92. | Juno Ridge | 25.06% | 2.84%(+22.2)#8 | 1.81%(+23.2)#92 |
| 93. | Delmita | 25.00% | 2.57%(+22.4)#4 | 1.81%(+23.2)#93 |
| 94. | New Alluwe | 25.00% | 0.89%(+24.1)#2 | 1.81%(+23.2)#94 |
| 95. | Huntsdale | 25.00% | 0.50%(+24.5)#2 | 1.81%(+23.2)#95 |
| 96. | Glenmont | 24.99% | 5.18%(+19.8)#21 | 1.81%(+23.2)#96 |
| 97. | Ingold | 24.97% | 1.71%(+23.3)#4 | 1.81%(+23.2)#97 |
| 98. | Hyattsville | 24.86% | 5.18%(+19.7)#22 | 1.81%(+23.0)#98 |
| 99. | Hybla Valley | 24.77% | 3.59%(+21.2)#18 | 1.81%(+23.0)#99 |
| 100. | Philadelphia | 24.75% | 0.61%(+24.1)#4 | 1.81%(+22.9)#100 |
Common Questions
What are the Top 10 Cities with the Highest Percentage of Central American Population in the United States?
Top 10 Cities with the Highest Percentage of Central American Population in the United States are:
#1
100.00%
#2
77.31%
#3
61.24%
#4
59.89%
#5
57.69%
#6
55.70%
#7
52.21%
#8
46.92%
#9
46.36%
#10
45.11%
What city has the Highest Percentage of Central American Population in the United States?
Amherst has the Highest Percentage of Central American Population in the United States with 100.00%.
What is the Percentage of Central American Population in the United States?
Percentage of Central American Population in the United States is 1.81%.