Cities with the Highest Percentage of Central American Population in Kansas
RELATED REPORTS & OPTIONS
Central American
Kansas
Compare Cities
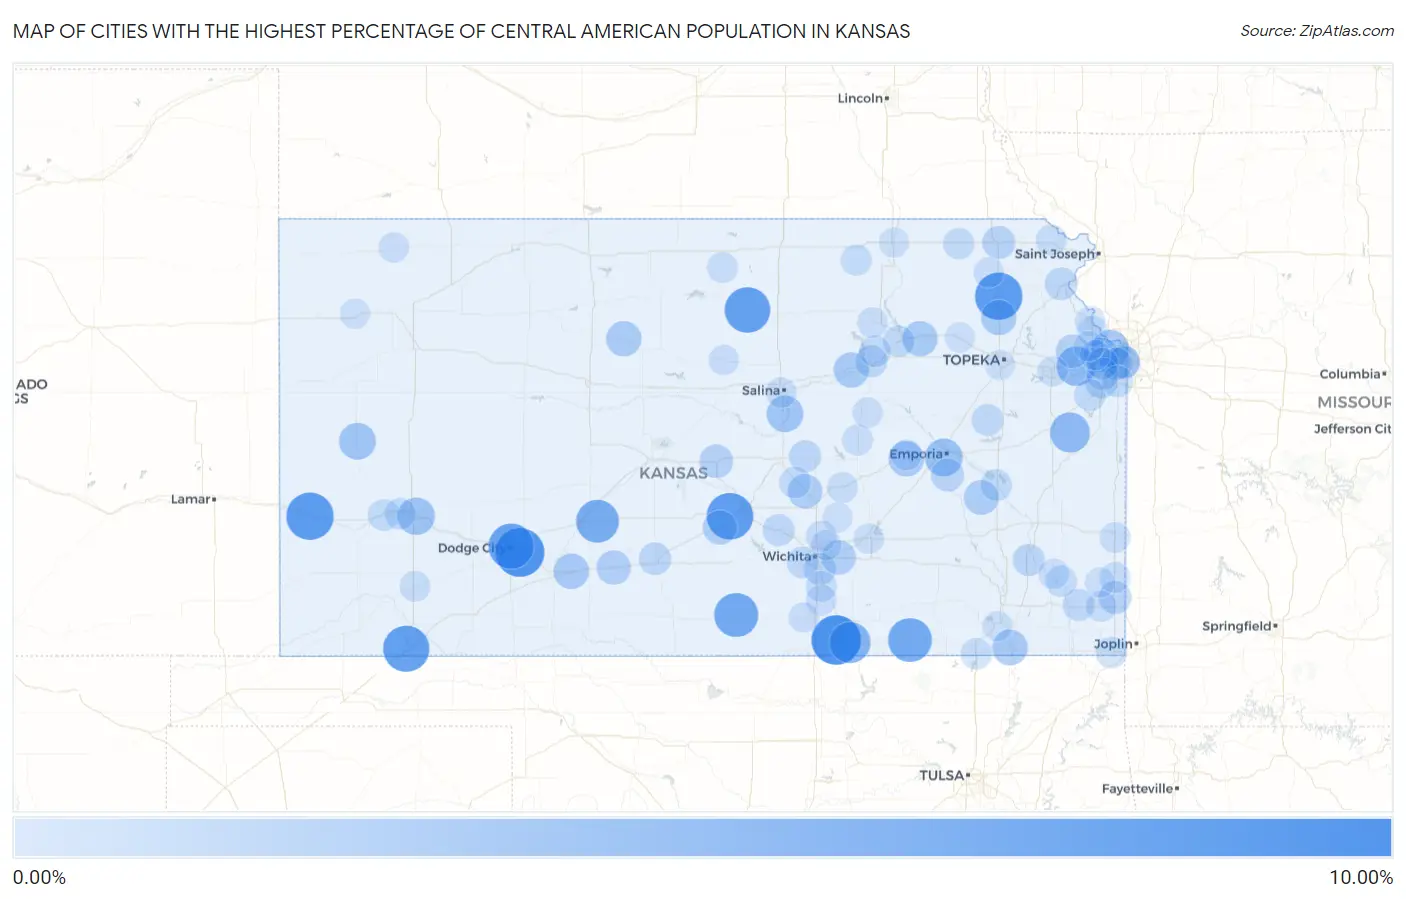
Map of Cities with the Highest Percentage of Central American Population in Kansas
0.00%
10.00%
Cities with the Highest Percentage of Central American Population in Kansas
| City | Central American | vs State | vs National | |
| 1. | Geuda Springs | 9.41% | 0.90%(+8.51)#1 | 1.81%(+7.59)#472 |
| 2. | Wilroads Gardens | 9.03% | 0.90%(+8.13)#2 | 1.81%(+7.22)#501 |
| 3. | Syracuse | 8.34% | 0.90%(+7.44)#3 | 1.81%(+6.53)#552 |
| 4. | Holton | 8.33% | 0.90%(+7.43)#4 | 1.81%(+6.52)#553 |
| 5. | Partridge | 7.95% | 0.90%(+7.06)#5 | 1.81%(+6.14)#595 |
| 6. | Liberal | 7.80% | 0.90%(+6.90)#6 | 1.81%(+5.98)#614 |
| 7. | Simpson | 7.50% | 0.90%(+6.60)#7 | 1.81%(+5.69)#658 |
| 8. | Dodge City | 7.33% | 0.90%(+6.44)#8 | 1.81%(+5.52)#680 |
| 9. | Harper | 6.70% | 0.90%(+5.81)#9 | 1.81%(+4.89)#776 |
| 10. | Cedar Vale | 6.58% | 0.90%(+5.68)#10 | 1.81%(+4.76)#796 |
| 11. | Lewis | 6.15% | 0.90%(+5.25)#11 | 1.81%(+4.34)#862 |
| 12. | Arkansas City | 5.31% | 0.90%(+4.41)#12 | 1.81%(+3.50)#1,051 |
| 13. | Rantoul | 4.63% | 0.90%(+3.73)#13 | 1.81%(+2.82)#1,216 |
| 14. | Linwood | 4.43% | 0.90%(+3.54)#14 | 1.81%(+2.62)#1,270 |
| 15. | Emporia | 3.72% | 0.90%(+2.82)#15 | 1.81%(+1.90)#1,525 |
| 16. | Kansas City | 3.63% | 0.90%(+2.73)#16 | 1.81%(+1.82)#1,559 |
| 17. | Garden City | 3.48% | 0.90%(+2.59)#17 | 1.81%(+1.67)#1,623 |
| 18. | Leoti | 3.26% | 0.90%(+2.36)#18 | 1.81%(+1.44)#1,752 |
| 19. | Assaria | 3.19% | 0.90%(+2.29)#19 | 1.81%(+1.37)#1,776 |
| 20. | Coffeyville | 2.69% | 0.90%(+1.79)#20 | 1.81%(+0.879)#2,073 |
| 21. | Mullinville | 2.60% | 0.90%(+1.70)#21 | 1.81%(+0.784)#2,150 |
| 22. | Cottonwood Falls | 2.59% | 0.90%(+1.69)#22 | 1.81%(+0.777)#2,156 |
| 23. | Mayetta | 2.55% | 0.90%(+1.65)#23 | 1.81%(+0.733)#2,183 |
| 24. | Chapman | 2.54% | 0.90%(+1.65)#24 | 1.81%(+0.731)#2,189 |
| 25. | St George | 2.52% | 0.90%(+1.62)#25 | 1.81%(+0.708)#2,207 |
| 26. | Natoma | 2.50% | 0.90%(+1.60)#26 | 1.81%(+0.687)#2,229 |
| 27. | Edwardsville | 2.32% | 0.90%(+1.42)#27 | 1.81%(+0.506)#2,361 |
| 28. | Gridley | 2.31% | 0.90%(+1.42)#28 | 1.81%(+0.502)#2,365 |
| 29. | Hesston | 2.19% | 0.90%(+1.29)#29 | 1.81%(+0.374)#2,474 |
| 30. | Haviland | 2.11% | 0.90%(+1.21)#30 | 1.81%(+0.297)#2,539 |
| 31. | Arlington | 2.11% | 0.90%(+1.21)#31 | 1.81%(+0.292)#2,542 |
| 32. | Andover | 2.08% | 0.90%(+1.19)#32 | 1.81%(+0.270)#2,567 |
| 33. | Lyons | 1.78% | 0.90%(+0.883)#33 | 1.81%(-0.033)#2,926 |
| 34. | Tonganoxie | 1.73% | 0.90%(+0.836)#34 | 1.81%(-0.081)#2,980 |
| 35. | Roeland Park | 1.65% | 0.90%(+0.753)#35 | 1.81%(-0.163)#3,096 |
| 36. | Fairview | 1.50% | 0.90%(+0.600)#36 | 1.81%(-0.316)#3,320 |
| 37. | Olpe | 1.45% | 0.90%(+0.555)#37 | 1.81%(-0.361)#3,400 |
| 38. | Pittsburg | 1.41% | 0.90%(+0.515)#38 | 1.81%(-0.401)#3,480 |
| 39. | Fairway | 1.35% | 0.90%(+0.449)#39 | 1.81%(-0.467)#3,603 |
| 40. | Atchison | 1.31% | 0.90%(+0.414)#40 | 1.81%(-0.502)#3,673 |
| 41. | Pratt | 1.26% | 0.90%(+0.363)#41 | 1.81%(-0.553)#3,781 |
| 42. | Canton | 1.18% | 0.90%(+0.282)#42 | 1.81%(-0.634)#3,919 |
| 43. | Oaklawn Sunview | 1.17% | 0.90%(+0.276)#43 | 1.81%(-0.640)#3,932 |
| 44. | Merriam | 1.15% | 0.90%(+0.250)#44 | 1.81%(-0.666)#3,996 |
| 45. | Chanute | 1.11% | 0.90%(+0.216)#45 | 1.81%(-0.700)#4,069 |
| 46. | Olathe | 1.07% | 0.90%(+0.173)#46 | 1.81%(-0.743)#4,178 |
| 47. | Lenexa | 1.06% | 0.90%(+0.162)#47 | 1.81%(-0.754)#4,201 |
| 48. | Junction City | 1.05% | 0.90%(+0.154)#48 | 1.81%(-0.762)#4,225 |
| 49. | Osage City | 1.02% | 0.90%(+0.119)#49 | 1.81%(-0.797)#4,318 |
| 50. | Mccune | 1.01% | 0.90%(+0.113)#50 | 1.81%(-0.803)#4,337 |
| 51. | Mount Hope | 0.98% | 0.90%(+0.081)#51 | 1.81%(-0.835)#4,403 |
| 52. | Manhattan | 0.90% | 0.90%(+0.008)#52 | 1.81%(-0.908)#4,608 |
| 53. | Shawnee | 0.90% | 0.90%(+0.008)#53 | 1.81%(-0.909)#4,609 |
| 54. | Wichita | 0.89% | 0.90%(-0.003)#54 | 1.81%(-0.920)#4,645 |
| 55. | Burlington | 0.88% | 0.90%(-0.018)#55 | 1.81%(-0.934)#4,698 |
| 56. | Gardner | 0.86% | 0.90%(-0.041)#56 | 1.81%(-0.957)#4,764 |
| 57. | Fort Riley | 0.82% | 0.90%(-0.073)#57 | 1.81%(-0.990)#4,883 |
| 58. | Overland Park | 0.82% | 0.90%(-0.081)#58 | 1.81%(-0.997)#4,913 |
| 59. | Deerfield | 0.82% | 0.90%(-0.082)#59 | 1.81%(-0.998)#4,916 |
| 60. | Moundridge | 0.81% | 0.90%(-0.088)#60 | 1.81%(-1.00)#4,947 |
| 61. | Holcomb | 0.75% | 0.90%(-0.145)#61 | 1.81%(-1.06)#5,152 |
| 62. | Seneca | 0.73% | 0.90%(-0.163)#62 | 1.81%(-1.08)#5,210 |
| 63. | Baxter Springs | 0.72% | 0.90%(-0.179)#63 | 1.81%(-1.10)#5,268 |
| 64. | St Paul | 0.66% | 0.90%(-0.235)#64 | 1.81%(-1.15)#5,469 |
| 65. | Caney | 0.65% | 0.90%(-0.249)#65 | 1.81%(-1.16)#5,526 |
| 66. | Greenleaf | 0.64% | 0.90%(-0.258)#66 | 1.81%(-1.17)#5,568 |
| 67. | Cherokee | 0.57% | 0.90%(-0.328)#67 | 1.81%(-1.24)#5,869 |
| 68. | Mulvane | 0.57% | 0.90%(-0.330)#68 | 1.81%(-1.25)#5,892 |
| 69. | Arma | 0.55% | 0.90%(-0.350)#69 | 1.81%(-1.27)#5,985 |
| 70. | Kechi | 0.54% | 0.90%(-0.354)#70 | 1.81%(-1.27)#6,009 |
| 71. | Lincolnville | 0.54% | 0.90%(-0.359)#71 | 1.81%(-1.28)#6,035 |
| 72. | Jewell | 0.49% | 0.90%(-0.410)#72 | 1.81%(-1.33)#6,277 |
| 73. | Lansing | 0.48% | 0.90%(-0.417)#73 | 1.81%(-1.33)#6,302 |
| 74. | Peabody | 0.48% | 0.90%(-0.420)#74 | 1.81%(-1.34)#6,320 |
| 75. | Fort Scott | 0.46% | 0.90%(-0.434)#75 | 1.81%(-1.35)#6,381 |
| 76. | Highland | 0.45% | 0.90%(-0.445)#76 | 1.81%(-1.36)#6,456 |
| 77. | Sublette | 0.43% | 0.90%(-0.464)#77 | 1.81%(-1.38)#6,569 |
| 78. | Strong City | 0.43% | 0.90%(-0.467)#78 | 1.81%(-1.38)#6,589 |
| 79. | Belle Plaine | 0.42% | 0.90%(-0.482)#79 | 1.81%(-1.40)#6,672 |
| 80. | Bel Aire | 0.38% | 0.90%(-0.513)#80 | 1.81%(-1.43)#6,825 |
| 81. | Lincoln Center | 0.38% | 0.90%(-0.520)#81 | 1.81%(-1.44)#6,867 |
| 82. | Salina | 0.37% | 0.90%(-0.524)#82 | 1.81%(-1.44)#6,891 |
| 83. | Erie | 0.36% | 0.90%(-0.539)#83 | 1.81%(-1.45)#6,975 |
| 84. | El Dorado | 0.35% | 0.90%(-0.547)#84 | 1.81%(-1.46)#7,040 |
| 85. | Wetmore | 0.34% | 0.90%(-0.553)#85 | 1.81%(-1.47)#7,078 |
| 86. | Riley | 0.34% | 0.90%(-0.554)#86 | 1.81%(-1.47)#7,082 |
| 87. | Herington | 0.34% | 0.90%(-0.559)#87 | 1.81%(-1.48)#7,124 |
| 88. | Atwood | 0.32% | 0.90%(-0.574)#88 | 1.81%(-1.49)#7,209 |
| 89. | Wellington | 0.31% | 0.90%(-0.586)#89 | 1.81%(-1.50)#7,294 |
| 90. | Lawrence | 0.30% | 0.90%(-0.595)#90 | 1.81%(-1.51)#7,362 |
| 91. | St Marys | 0.26% | 0.90%(-0.634)#91 | 1.81%(-1.55)#7,614 |
| 92. | Bonner Springs | 0.24% | 0.90%(-0.652)#92 | 1.81%(-1.57)#7,751 |
| 93. | Brewster | 0.24% | 0.90%(-0.655)#93 | 1.81%(-1.57)#7,770 |
| 94. | Leavenworth | 0.22% | 0.90%(-0.674)#94 | 1.81%(-1.59)#7,913 |
| 95. | Independence | 0.22% | 0.90%(-0.675)#95 | 1.81%(-1.59)#7,922 |
| 96. | Whitewater | 0.21% | 0.90%(-0.689)#96 | 1.81%(-1.61)#8,015 |
| 97. | Marysville | 0.21% | 0.90%(-0.692)#97 | 1.81%(-1.61)#8,031 |
| 98. | Basehor | 0.20% | 0.90%(-0.697)#98 | 1.81%(-1.61)#8,058 |
| 99. | Topeka | 0.19% | 0.90%(-0.702)#99 | 1.81%(-1.62)#8,101 |
| 100. | Girard | 0.19% | 0.90%(-0.707)#100 | 1.81%(-1.62)#8,133 |
Common Questions
What are the Top 10 Cities with the Highest Percentage of Central American Population in Kansas?
Top 10 Cities with the Highest Percentage of Central American Population in Kansas are:
#1
9.41%
#2
9.03%
#3
8.34%
#4
8.33%
#5
7.95%
#6
7.80%
#7
7.50%
#8
7.33%
#9
6.70%
#10
6.58%
What city has the Highest Percentage of Central American Population in Kansas?
Geuda Springs has the Highest Percentage of Central American Population in Kansas with 9.41%.
What is the Percentage of Central American Population in the State of Kansas?
Percentage of Central American Population in Kansas is 0.90%.
What is the Percentage of Central American Population in the United States?
Percentage of Central American Population in the United States is 1.81%.