East Los Angeles, CA Map & Demographics
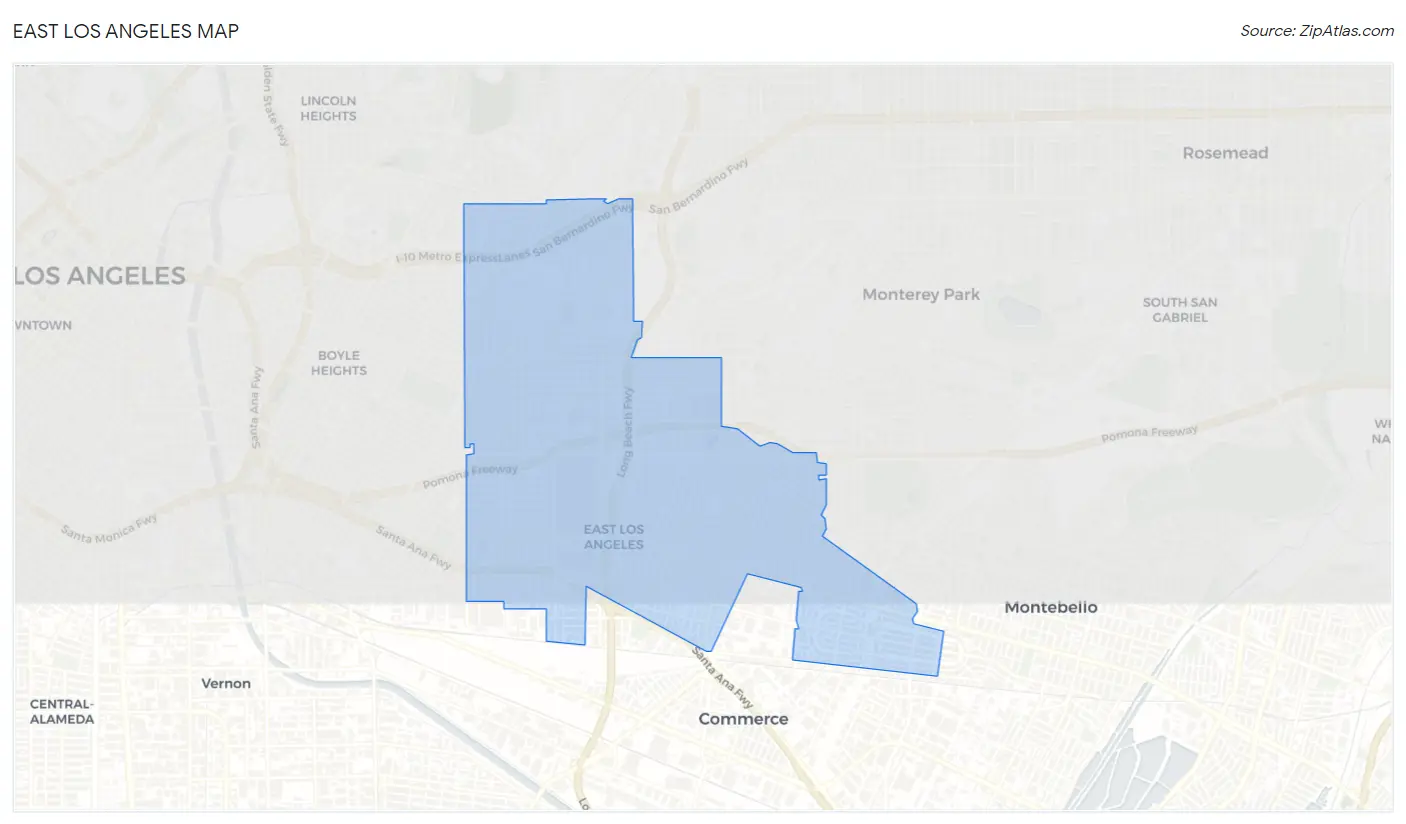
East Los Angeles Map
East Los Angeles Overview
$21,650
PER CAPITA INCOME
$67,096
AVG FAMILY INCOME
$64,119
AVG HOUSEHOLD INCOME
22.1%
WAGE / INCOME GAP [ % ]
77.9¢/ $1
WAGE / INCOME GAP [ $ ]
$11,093
FAMILY INCOME DEFICIT
0.42
INEQUALITY / GINI INDEX
117,222
TOTAL POPULATION
59,807
MALE POPULATION
57,415
FEMALE POPULATION
104.17
MALES / 100 FEMALES
96.00
FEMALES / 100 MALES
33.2
MEDIAN AGE
4.1
AVG FAMILY SIZE
3.8
AVG HOUSEHOLD SIZE
58,170
LABOR FORCE [ PEOPLE ]
62.8%
PERCENT IN LABOR FORCE
6.3%
UNEMPLOYMENT RATE
Income in East Los Angeles
Income Overview in East Los Angeles
Per Capita Income in East Los Angeles is $21,650, while median incomes of families and households are $67,096 and $64,119 respectively.
| Characteristic | Number | Measure |
| Per Capita Income | 117,222 | $21,650 |
| Median Family Income | 24,913 | $67,096 |
| Mean Family Income | 24,913 | $79,630 |
| Median Household Income | 31,013 | $64,119 |
| Mean Household Income | 31,013 | $77,355 |
| Income Deficit | 24,913 | $11,093 |
| Wage / Income Gap (%) | 117,222 | 22.06% |
| Wage / Income Gap ($) | 117,222 | 77.94¢ per $1 |
| Gini / Inequality Index | 117,222 | 0.42 |
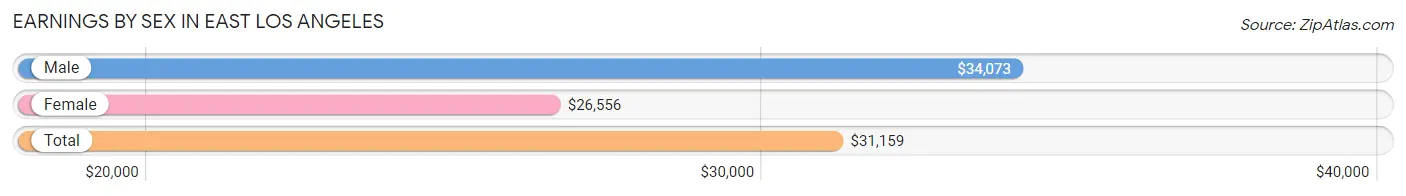
Earnings by Sex in East Los Angeles
Average Earnings in East Los Angeles are $31,159, $34,073 for men and $26,556 for women, a difference of 22.1%.
| Sex | Number | Average Earnings |
| Male | 33,441 (57.4%) | $34,073 |
| Female | 24,831 (42.6%) | $26,556 |
| Total | 58,272 (100.0%) | $31,159 |
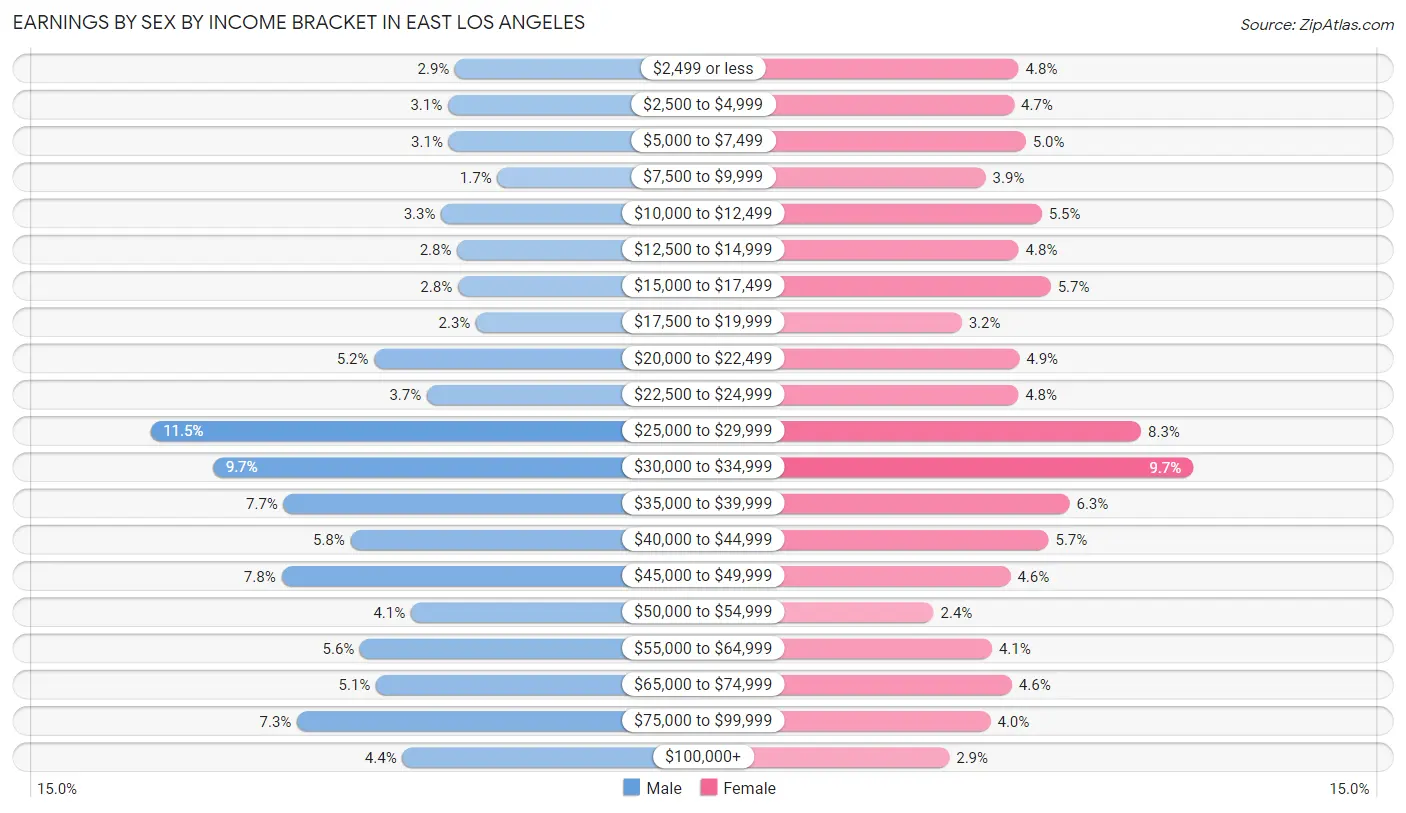
Earnings by Sex by Income Bracket in East Los Angeles
The most common earnings brackets in East Los Angeles are $25,000 to $29,999 for men (3,837 | 11.5%) and $30,000 to $34,999 for women (2,416 | 9.7%).
| Income | Male | Female |
| $2,499 or less | 970 (2.9%) | 1,200 (4.8%) |
| $2,500 to $4,999 | 1,037 (3.1%) | 1,168 (4.7%) |
| $5,000 to $7,499 | 1,029 (3.1%) | 1,248 (5.0%) |
| $7,500 to $9,999 | 572 (1.7%) | 968 (3.9%) |
| $10,000 to $12,499 | 1,101 (3.3%) | 1,360 (5.5%) |
| $12,500 to $14,999 | 949 (2.8%) | 1,200 (4.8%) |
| $15,000 to $17,499 | 944 (2.8%) | 1,422 (5.7%) |
| $17,500 to $19,999 | 771 (2.3%) | 802 (3.2%) |
| $20,000 to $22,499 | 1,730 (5.2%) | 1,204 (4.9%) |
| $22,500 to $24,999 | 1,234 (3.7%) | 1,196 (4.8%) |
| $25,000 to $29,999 | 3,837 (11.5%) | 2,054 (8.3%) |
| $30,000 to $34,999 | 3,248 (9.7%) | 2,416 (9.7%) |
| $35,000 to $39,999 | 2,583 (7.7%) | 1,555 (6.3%) |
| $40,000 to $44,999 | 1,953 (5.8%) | 1,409 (5.7%) |
| $45,000 to $49,999 | 2,602 (7.8%) | 1,141 (4.6%) |
| $50,000 to $54,999 | 1,385 (4.1%) | 606 (2.4%) |
| $55,000 to $64,999 | 1,864 (5.6%) | 1,012 (4.1%) |
| $65,000 to $74,999 | 1,711 (5.1%) | 1,152 (4.6%) |
| $75,000 to $99,999 | 2,455 (7.3%) | 1,003 (4.0%) |
| $100,000+ | 1,466 (4.4%) | 715 (2.9%) |
| Total | 33,441 (100.0%) | 24,831 (100.0%) |
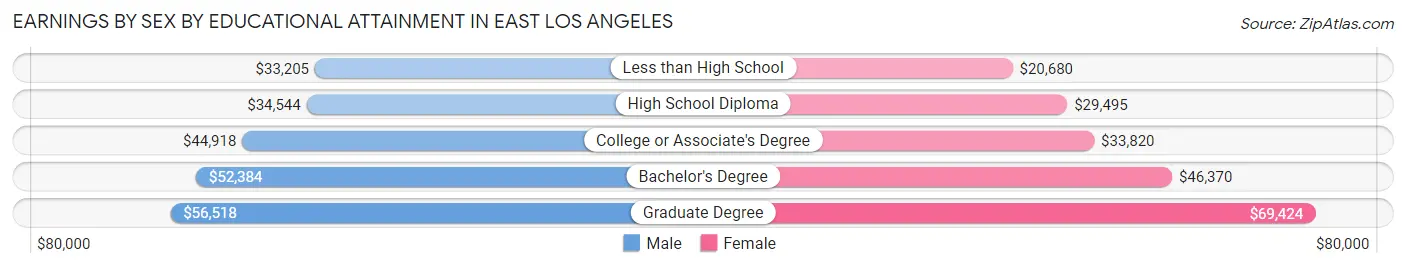
Earnings by Sex by Educational Attainment in East Los Angeles
Average earnings in East Los Angeles are $36,835 for men and $29,844 for women, a difference of 19.0%. Men with an educational attainment of graduate degree enjoy the highest average annual earnings of $56,518, while those with less than high school education earn the least with $33,205. Women with an educational attainment of graduate degree earn the most with the average annual earnings of $69,424, while those with less than high school education have the smallest earnings of $20,680.
| Educational Attainment | Male Income | Female Income |
| Less than High School | $33,205 | $20,680 |
| High School Diploma | $34,544 | $29,495 |
| College or Associate's Degree | $44,918 | $33,820 |
| Bachelor's Degree | $52,384 | $46,370 |
| Graduate Degree | $56,518 | $69,424 |
| Total | $36,835 | $29,844 |
Family Income in East Los Angeles
Family Income Brackets in East Los Angeles
According to the East Los Angeles family income data, there are 4,958 families falling into the $50,000 to $74,999 income range, which is the most common income bracket and makes up 19.9% of all families. Conversely, the $10,000 to $14,999 income bracket is the least frequent group with only 623 families (2.5%) belonging to this category.
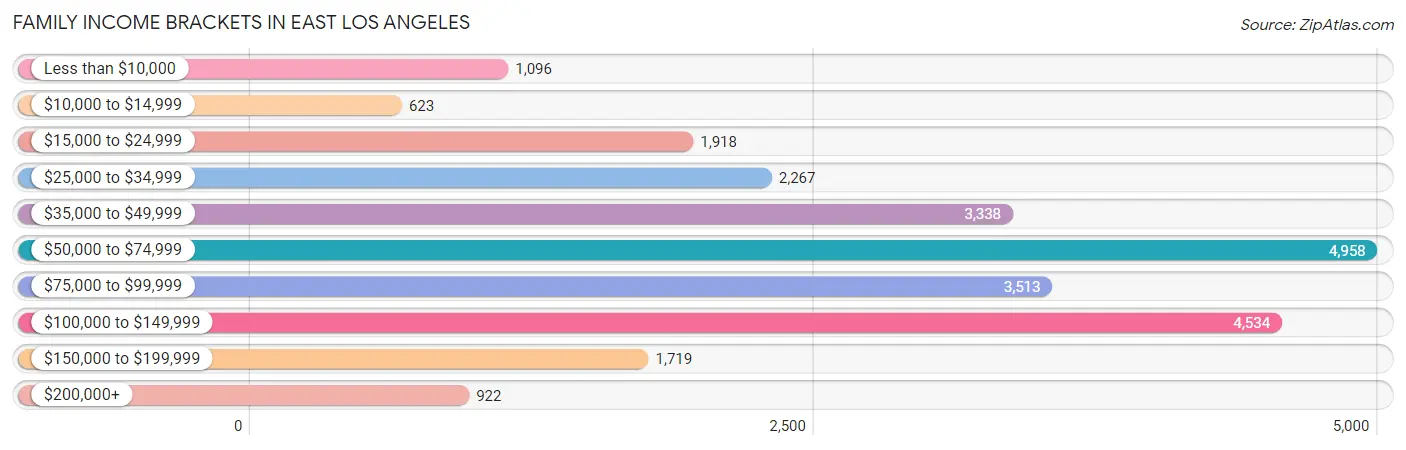
| Income Bracket | # Families | % Families |
| Less than $10,000 | 1,096 | 4.4% |
| $10,000 to $14,999 | 623 | 2.5% |
| $15,000 to $24,999 | 1,918 | 7.7% |
| $25,000 to $34,999 | 2,267 | 9.1% |
| $35,000 to $49,999 | 3,338 | 13.4% |
| $50,000 to $74,999 | 4,958 | 19.9% |
| $75,000 to $99,999 | 3,513 | 14.1% |
| $100,000 to $149,999 | 4,534 | 18.2% |
| $150,000 to $199,999 | 1,719 | 6.9% |
| $200,000+ | 922 | 3.7% |
Family Income by Famaliy Size in East Los Angeles
7+ person families (1,715 | 6.9%) account for the highest median family income in East Los Angeles with $114,258 per family, while 2-person families (6,183 | 24.8%) have the highest median income of $24,501 per family member.
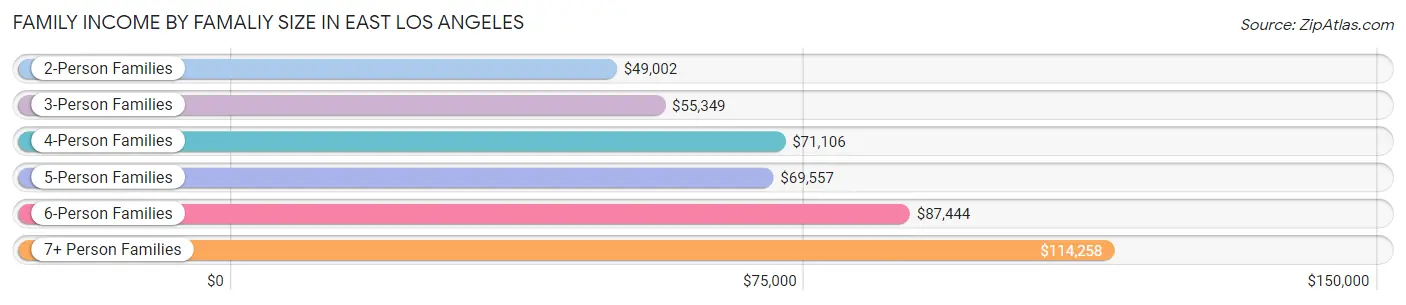
| Income Bracket | # Families | Median Income |
| 2-Person Families | 6,183 (24.8%) | $49,002 |
| 3-Person Families | 5,658 (22.7%) | $55,349 |
| 4-Person Families | 5,673 (22.8%) | $71,106 |
| 5-Person Families | 3,533 (14.2%) | $69,557 |
| 6-Person Families | 2,151 (8.6%) | $87,444 |
| 7+ Person Families | 1,715 (6.9%) | $114,258 |
| Total | 24,913 (100.0%) | $67,096 |
Family Income by Number of Earners in East Los Angeles
The median family income in East Los Angeles is $67,096, with families comprising 3+ earners (6,607) having the highest median family income of $107,972, while families with no earners (2,402) have the lowest median family income of $23,098, accounting for 26.5% and 9.6% of families, respectively.
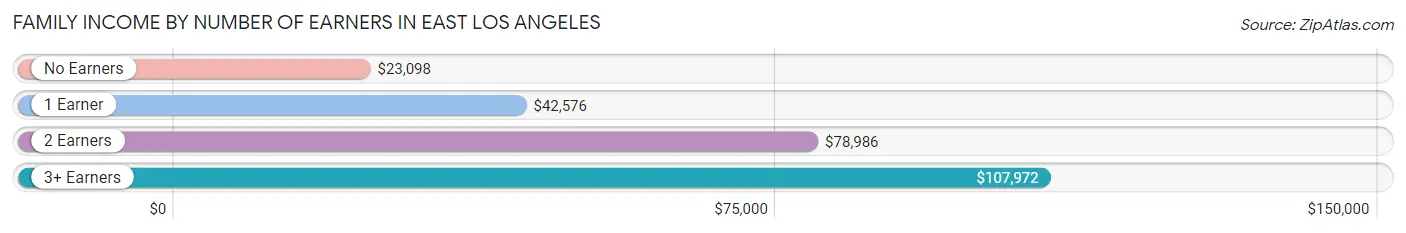
| Number of Earners | # Families | Median Income |
| No Earners | 2,402 (9.6%) | $23,098 |
| 1 Earner | 8,278 (33.2%) | $42,576 |
| 2 Earners | 7,626 (30.6%) | $78,986 |
| 3+ Earners | 6,607 (26.5%) | $107,972 |
| Total | 24,913 (100.0%) | $67,096 |
Household Income in East Los Angeles
Household Income Brackets in East Los Angeles
With 5,582 households falling in the category, the $50,000 to $74,999 income range is the most frequent in East Los Angeles, accounting for 18.0% of all households. In contrast, only 1,147 households (3.7%) fall into the $200,000+ income bracket, making it the least populous group.
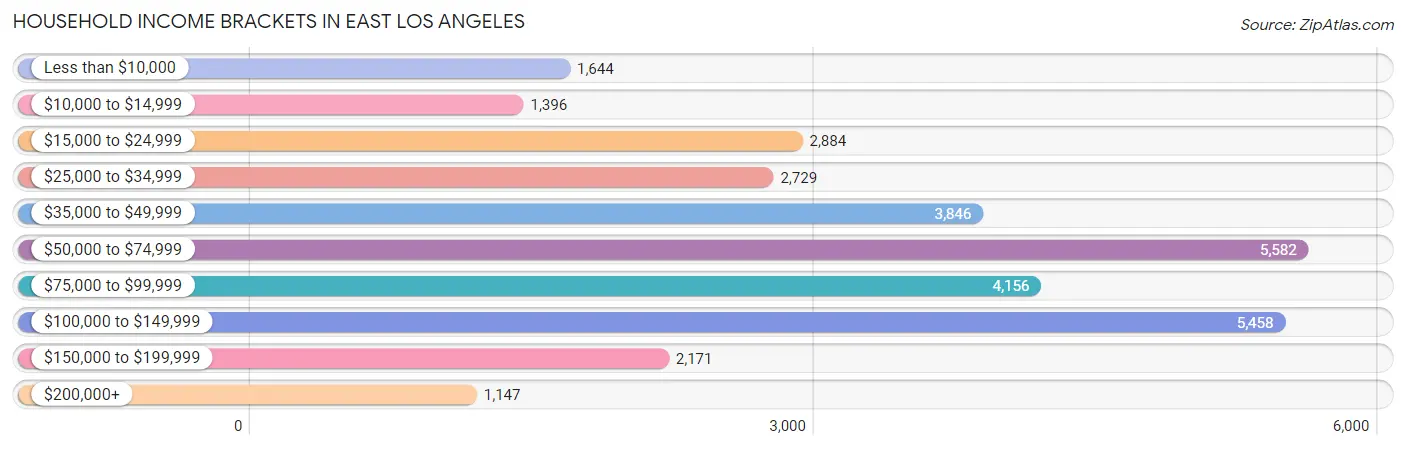
| Income Bracket | # Households | % Households |
| Less than $10,000 | 1,644 | 5.3% |
| $10,000 to $14,999 | 1,396 | 4.5% |
| $15,000 to $24,999 | 2,884 | 9.3% |
| $25,000 to $34,999 | 2,729 | 8.8% |
| $35,000 to $49,999 | 3,846 | 12.4% |
| $50,000 to $74,999 | 5,582 | 18.0% |
| $75,000 to $99,999 | 4,156 | 13.4% |
| $100,000 to $149,999 | 5,458 | 17.6% |
| $150,000 to $199,999 | 2,171 | 7.0% |
| $200,000+ | 1,147 | 3.7% |
Household Income by Householder Age in East Los Angeles
The median household income in East Los Angeles is $64,119, with the highest median household income of $71,941 found in the 45 to 64 years age bracket for the primary householder. A total of 13,388 households (43.2%) fall into this category. Meanwhile, the 65+ years age bracket for the primary householder has the lowest median household income of $35,441, with 6,412 households (20.7%) in this group.
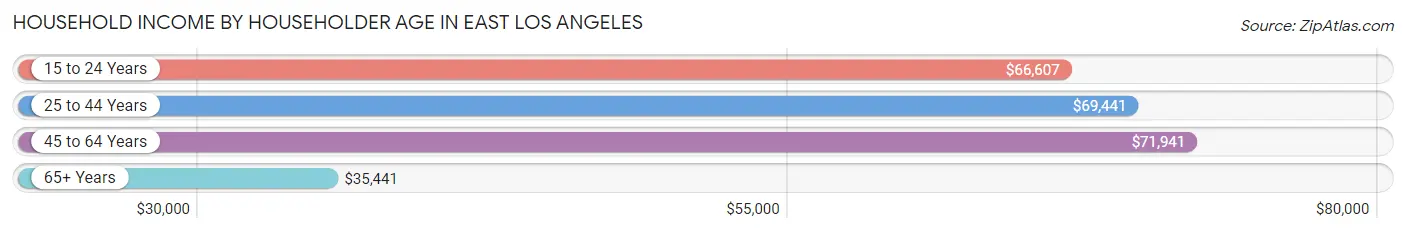
| Income Bracket | # Households | Median Income |
| 15 to 24 Years | 776 (2.5%) | $66,607 |
| 25 to 44 Years | 10,437 (33.7%) | $69,441 |
| 45 to 64 Years | 13,388 (43.2%) | $71,941 |
| 65+ Years | 6,412 (20.7%) | $35,441 |
| Total | 31,013 (100.0%) | $64,119 |
Poverty in East Los Angeles
Income Below Poverty by Sex and Age in East Los Angeles
With 15.2% poverty level for males and 19.3% for females among the residents of East Los Angeles, 12 to 14 year old males and 5 year old females are the most vulnerable to poverty, with 730 males (26.1%) and 244 females (34.6%) in their respective age groups living below the poverty level.
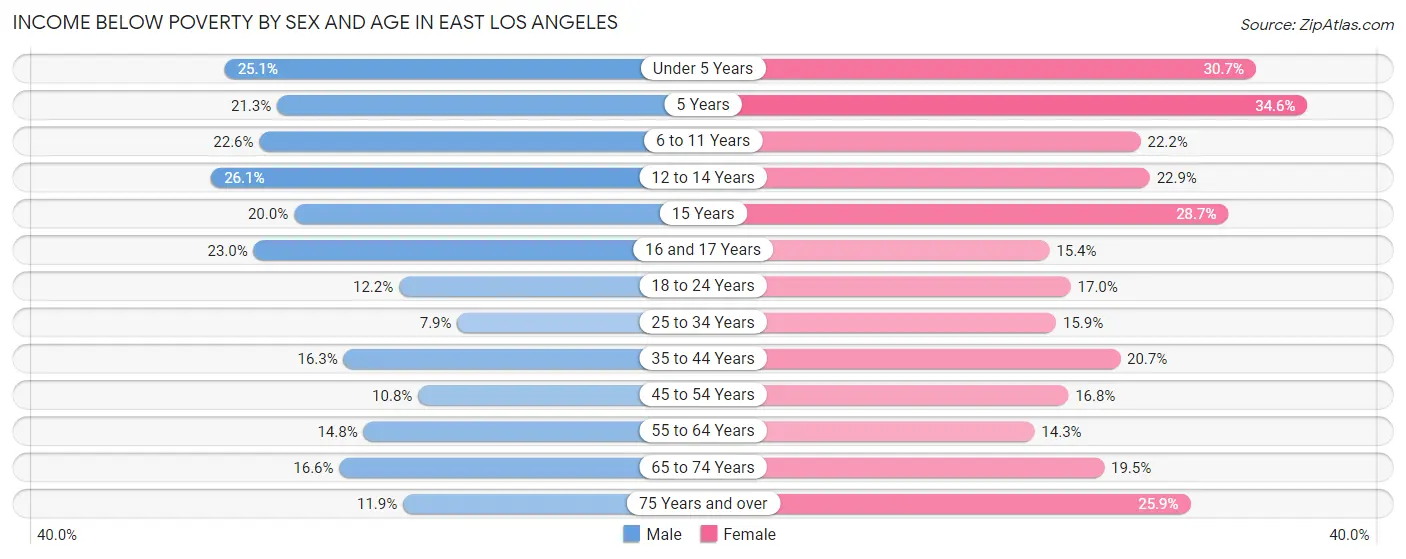
| Age Bracket | Male | Female |
| Under 5 Years | 916 (25.1%) | 766 (30.7%) |
| 5 Years | 172 (21.3%) | 244 (34.6%) |
| 6 to 11 Years | 1,119 (22.6%) | 974 (22.2%) |
| 12 to 14 Years | 730 (26.1%) | 530 (22.9%) |
| 15 Years | 146 (20.0%) | 342 (28.7%) |
| 16 and 17 Years | 480 (23.0%) | 329 (15.4%) |
| 18 to 24 Years | 797 (12.2%) | 1,115 (17.0%) |
| 25 to 34 Years | 823 (7.9%) | 1,408 (15.9%) |
| 35 to 44 Years | 1,300 (16.3%) | 1,582 (20.7%) |
| 45 to 54 Years | 832 (10.8%) | 1,288 (16.8%) |
| 55 to 64 Years | 950 (14.8%) | 841 (14.3%) |
| 65 to 74 Years | 561 (16.6%) | 757 (19.5%) |
| 75 Years and over | 246 (11.9%) | 839 (25.9%) |
| Total | 9,072 (15.2%) | 11,015 (19.3%) |
Income Above Poverty by Sex and Age in East Los Angeles
According to the poverty statistics in East Los Angeles, males aged 25 to 34 years and females aged 55 to 64 years are the age groups that are most secure financially, with 92.1% of males and 85.7% of females in these age groups living above the poverty line.
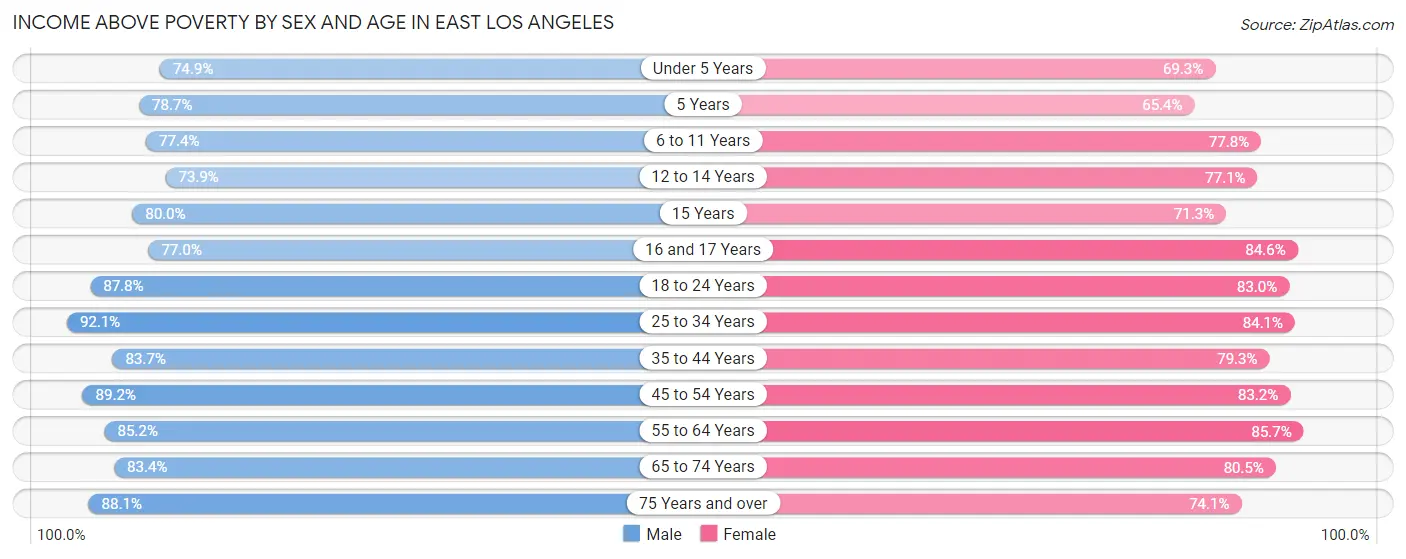
| Age Bracket | Male | Female |
| Under 5 Years | 2,728 (74.9%) | 1,727 (69.3%) |
| 5 Years | 637 (78.7%) | 462 (65.4%) |
| 6 to 11 Years | 3,839 (77.4%) | 3,418 (77.8%) |
| 12 to 14 Years | 2,063 (73.9%) | 1,788 (77.1%) |
| 15 Years | 584 (80.0%) | 850 (71.3%) |
| 16 and 17 Years | 1,607 (77.0%) | 1,806 (84.6%) |
| 18 to 24 Years | 5,736 (87.8%) | 5,447 (83.0%) |
| 25 to 34 Years | 9,628 (92.1%) | 7,439 (84.1%) |
| 35 to 44 Years | 6,667 (83.7%) | 6,074 (79.3%) |
| 45 to 54 Years | 6,886 (89.2%) | 6,373 (83.2%) |
| 55 to 64 Years | 5,451 (85.2%) | 5,042 (85.7%) |
| 65 to 74 Years | 2,813 (83.4%) | 3,131 (80.5%) |
| 75 Years and over | 1,822 (88.1%) | 2,404 (74.1%) |
| Total | 50,461 (84.8%) | 45,961 (80.7%) |
Income Below Poverty Among Married-Couple Families in East Los Angeles
The poverty statistics for married-couple families in East Los Angeles show that 11.6% or 1,608 of the total 13,821 families live below the poverty line. Families with 3 or 4 children have the highest poverty rate of 24.5%, comprising of 393 families. On the other hand, families with 5 or more children have the lowest poverty rate of 1.9%, which includes 4 families.
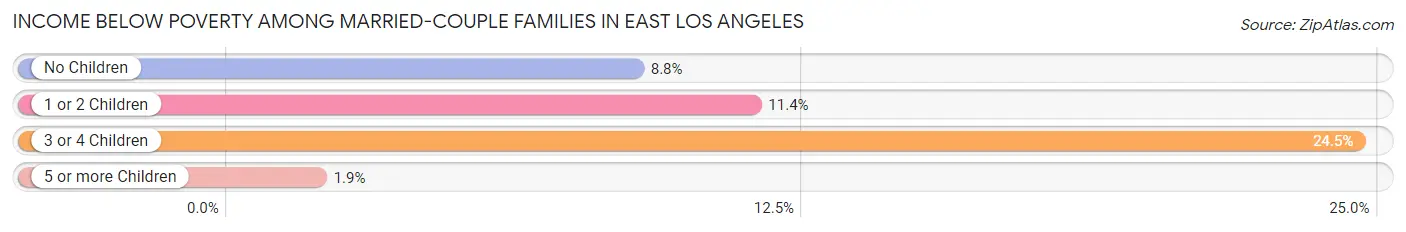
| Children | Above Poverty | Below Poverty |
| No Children | 5,614 (91.2%) | 544 (8.8%) |
| 1 or 2 Children | 5,187 (88.6%) | 667 (11.4%) |
| 3 or 4 Children | 1,209 (75.5%) | 393 (24.5%) |
| 5 or more Children | 203 (98.1%) | 4 (1.9%) |
| Total | 12,213 (88.4%) | 1,608 (11.6%) |
Income Below Poverty Among Single-Parent Households in East Los Angeles
According to the poverty data in East Los Angeles, 9.0% or 386 single-father households and 24.5% or 1,674 single-mother households are living below the poverty line. Among single-father households, those with 5 or more children have the highest poverty rate, with 38 households (45.8%) experiencing poverty. Likewise, among single-mother households, those with 3 or 4 children have the highest poverty rate, with 345 households (40.5%) falling below the poverty line.
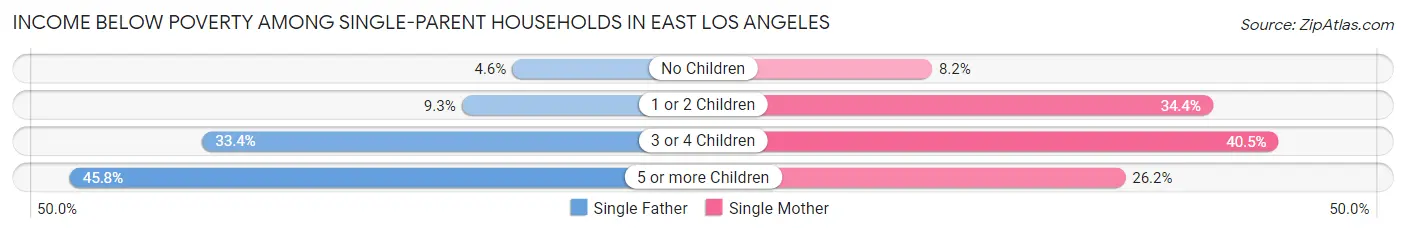
| Children | Single Father | Single Mother |
| No Children | 112 (4.6%) | 226 (8.2%) |
| 1 or 2 Children | 135 (9.3%) | 1,087 (34.4%) |
| 3 or 4 Children | 101 (33.4%) | 345 (40.5%) |
| 5 or more Children | 38 (45.8%) | 16 (26.2%) |
| Total | 386 (9.0%) | 1,674 (24.5%) |
Income Below Poverty Among Married-Couple vs Single-Parent Households in East Los Angeles
The poverty data for East Los Angeles shows that 1,608 of the married-couple family households (11.6%) and 2,060 of the single-parent households (18.6%) are living below the poverty level. Within the married-couple family households, those with 3 or 4 children have the highest poverty rate, with 393 households (24.5%) falling below the poverty line. Among the single-parent households, those with 3 or 4 children have the highest poverty rate, with 446 household (38.7%) living below poverty.
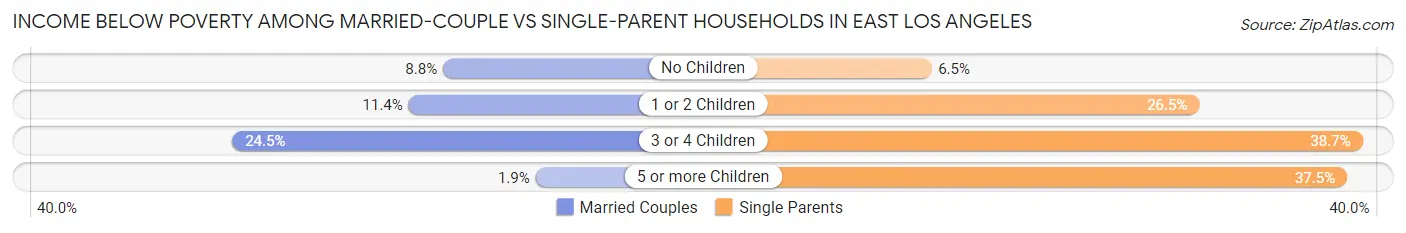
| Children | Married-Couple Families | Single-Parent Households |
| No Children | 544 (8.8%) | 338 (6.5%) |
| 1 or 2 Children | 667 (11.4%) | 1,222 (26.5%) |
| 3 or 4 Children | 393 (24.5%) | 446 (38.7%) |
| 5 or more Children | 4 (1.9%) | 54 (37.5%) |
| Total | 1,608 (11.6%) | 2,060 (18.6%) |
Race in East Los Angeles
The most populous races in East Los Angeles are Hispanic or Latino (111,912 | 95.5%), Some other Race (63,690 | 54.3%), and White / Caucasian (33,511 | 28.6%).
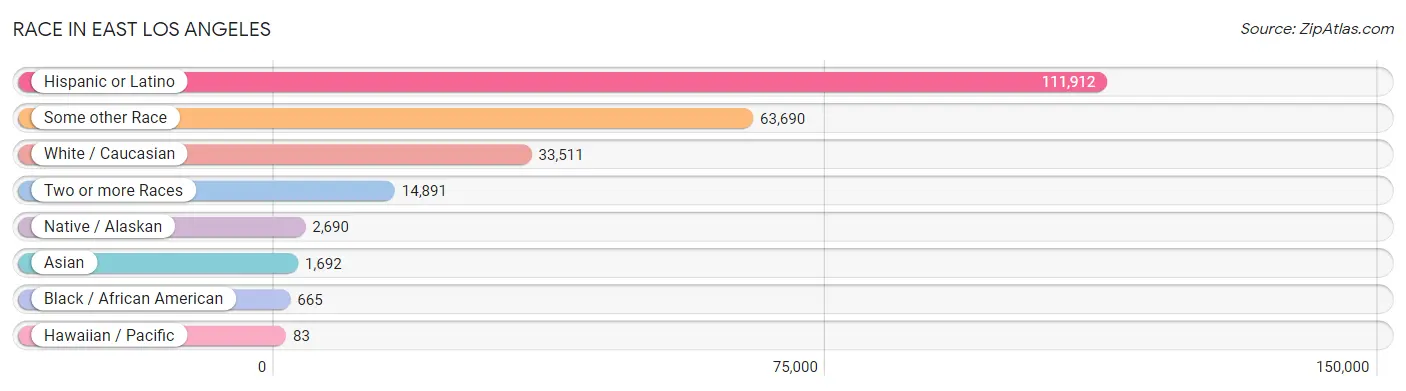
| Race | # Population | % Population |
| Asian | 1,692 | 1.4% |
| Black / African American | 665 | 0.6% |
| Hawaiian / Pacific | 83 | 0.1% |
| Hispanic or Latino | 111,912 | 95.5% |
| Native / Alaskan | 2,690 | 2.3% |
| White / Caucasian | 33,511 | 28.6% |
| Two or more Races | 14,891 | 12.7% |
| Some other Race | 63,690 | 54.3% |
| Total | 117,222 | 100.0% |
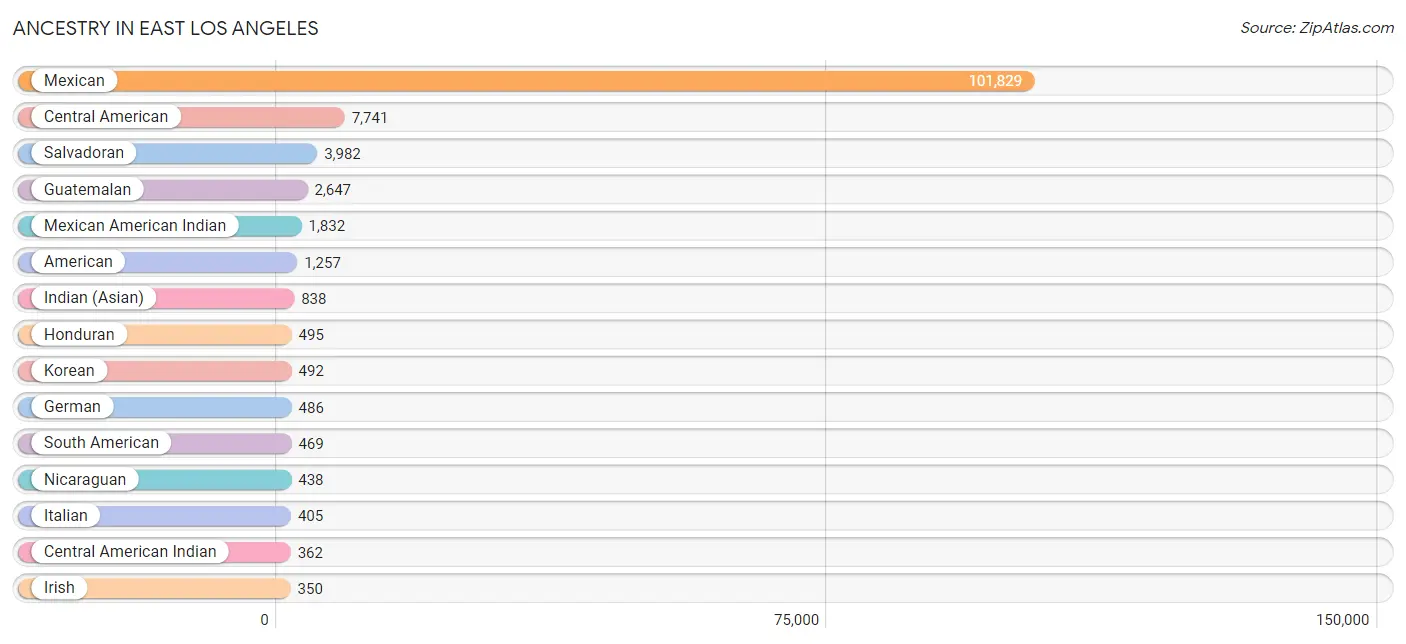
Ancestry in East Los Angeles
The most populous ancestries reported in East Los Angeles are Mexican (101,829 | 86.9%), Central American (7,741 | 6.6%), Salvadoran (3,982 | 3.4%), Guatemalan (2,647 | 2.3%), and Mexican American Indian (1,832 | 1.6%), together accounting for 100.7% of all East Los Angeles residents.
| Ancestry | # Population | % Population |
| African | 122 | 0.1% |
| Alaskan Athabascan | 6 | 0.0% |
| American | 1,257 | 1.1% |
| Apache | 78 | 0.1% |
| Arab | 53 | 0.1% |
| Argentinean | 46 | 0.0% |
| Armenian | 56 | 0.1% |
| Australian | 4 | 0.0% |
| Austrian | 10 | 0.0% |
| Belgian | 8 | 0.0% |
| Bhutanese | 337 | 0.3% |
| Blackfeet | 17 | 0.0% |
| Bolivian | 26 | 0.0% |
| Brazilian | 102 | 0.1% |
| British | 41 | 0.0% |
| Burmese | 32 | 0.0% |
| Canadian | 29 | 0.0% |
| Central American | 7,741 | 6.6% |
| Central American Indian | 362 | 0.3% |
| Chilean | 8 | 0.0% |
| Colombian | 137 | 0.1% |
| Costa Rican | 89 | 0.1% |
| Croatian | 17 | 0.0% |
| Cuban | 127 | 0.1% |
| Czechoslovakian | 9 | 0.0% |
| Danish | 45 | 0.0% |
| Dutch | 97 | 0.1% |
| Eastern European | 3 | 0.0% |
| Ecuadorian | 136 | 0.1% |
| Egyptian | 10 | 0.0% |
| English | 278 | 0.2% |
| European | 155 | 0.1% |
| Filipino | 31 | 0.0% |
| French | 176 | 0.2% |
| German | 486 | 0.4% |
| Greek | 6 | 0.0% |
| Guamanian / Chamorro | 6 | 0.0% |
| Guatemalan | 2,647 | 2.3% |
| Honduran | 495 | 0.4% |
| Hopi | 4 | 0.0% |
| Hungarian | 11 | 0.0% |
| Indian (Asian) | 838 | 0.7% |
| Iranian | 18 | 0.0% |
| Irish | 350 | 0.3% |
| Israeli | 1 | 0.0% |
| Italian | 405 | 0.4% |
| Jamaican | 43 | 0.0% |
| Japanese | 46 | 0.0% |
| Korean | 492 | 0.4% |
| Laotian | 94 | 0.1% |
| Latvian | 5 | 0.0% |
| Lebanese | 24 | 0.0% |
| Lithuanian | 31 | 0.0% |
| Mexican | 101,829 | 86.9% |
| Mexican American Indian | 1,832 | 1.6% |
| Native Hawaiian | 38 | 0.0% |
| Navajo | 29 | 0.0% |
| Nicaraguan | 438 | 0.4% |
| Nigerian | 26 | 0.0% |
| Norwegian | 10 | 0.0% |
| Pakistani | 15 | 0.0% |
| Panamanian | 6 | 0.0% |
| Peruvian | 95 | 0.1% |
| Polish | 139 | 0.1% |
| Portuguese | 45 | 0.0% |
| Pueblo | 10 | 0.0% |
| Puerto Rican | 308 | 0.3% |
| Romanian | 65 | 0.1% |
| Russian | 104 | 0.1% |
| Salvadoran | 3,982 | 3.4% |
| Samoan | 45 | 0.0% |
| Scotch-Irish | 20 | 0.0% |
| Scottish | 32 | 0.0% |
| Sioux | 5 | 0.0% |
| South American | 469 | 0.4% |
| Spaniard | 345 | 0.3% |
| Spanish | 33 | 0.0% |
| Spanish American | 27 | 0.0% |
| Spanish American Indian | 18 | 0.0% |
| Sri Lankan | 254 | 0.2% |
| Subsaharan African | 148 | 0.1% |
| Swedish | 6 | 0.0% |
| Swiss | 19 | 0.0% |
| Syrian | 12 | 0.0% |
| Thai | 151 | 0.1% |
| Ukrainian | 38 | 0.0% |
| Uruguayan | 9 | 0.0% |
| Venezuelan | 9 | 0.0% |
| Welsh | 42 | 0.0% |
| West Indian | 18 | 0.0% |
| Yaqui | 27 | 0.0% | View All 91 Rows |
Immigrants in East Los Angeles
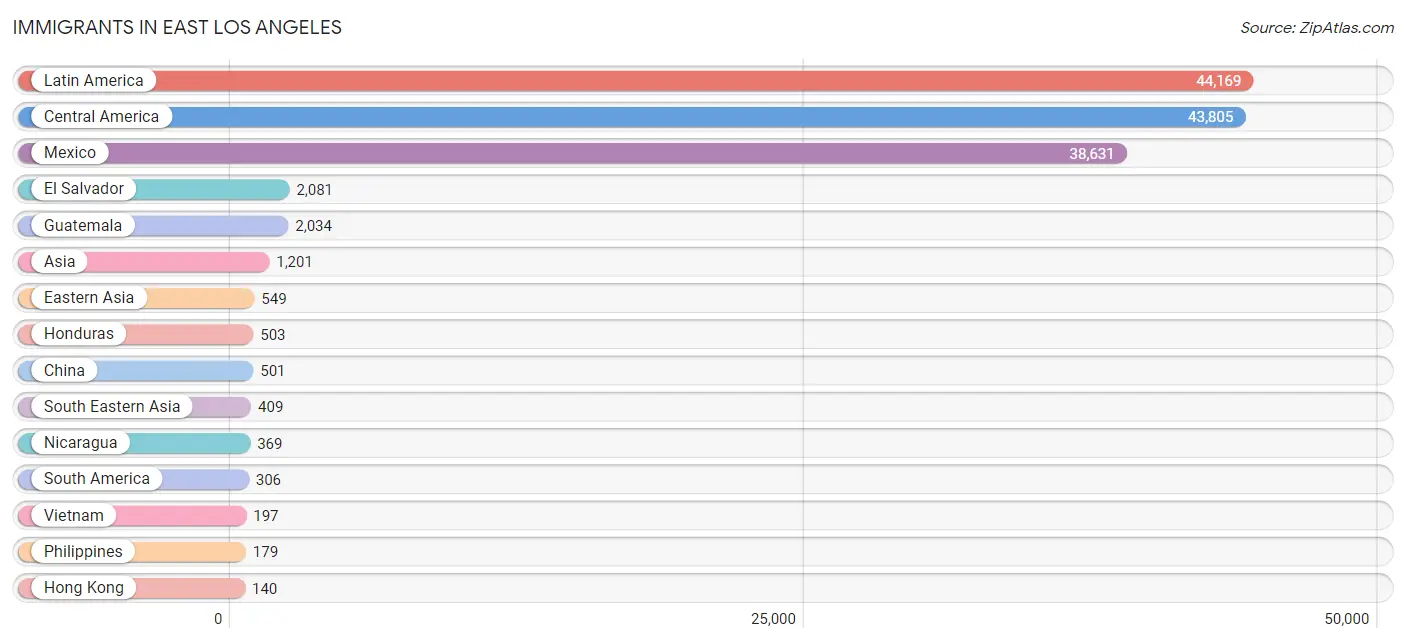
The most numerous immigrant groups reported in East Los Angeles came from Latin America (44,169 | 37.7%), Central America (43,805 | 37.4%), Mexico (38,631 | 33.0%), El Salvador (2,081 | 1.8%), and Guatemala (2,034 | 1.7%), together accounting for 111.5% of all East Los Angeles residents.
| Immigration Origin | # Population | % Population |
| Africa | 32 | 0.0% |
| Argentina | 21 | 0.0% |
| Armenia | 16 | 0.0% |
| Asia | 1,201 | 1.0% |
| Australia | 4 | 0.0% |
| Belize | 45 | 0.0% |
| Bolivia | 12 | 0.0% |
| Brazil | 26 | 0.0% |
| Cambodia | 23 | 0.0% |
| Canada | 77 | 0.1% |
| Caribbean | 58 | 0.1% |
| Central America | 43,805 | 37.4% |
| Chile | 5 | 0.0% |
| China | 501 | 0.4% |
| Colombia | 109 | 0.1% |
| Costa Rica | 61 | 0.1% |
| Cuba | 58 | 0.1% |
| Eastern Asia | 549 | 0.5% |
| Eastern Europe | 31 | 0.0% |
| Ecuador | 60 | 0.1% |
| El Salvador | 2,081 | 1.8% |
| Europe | 100 | 0.1% |
| Germany | 46 | 0.0% |
| Guatemala | 2,034 | 1.7% |
| Honduras | 503 | 0.4% |
| Hong Kong | 140 | 0.1% |
| India | 90 | 0.1% |
| Indonesia | 10 | 0.0% |
| Iran | 18 | 0.0% |
| Japan | 16 | 0.0% |
| Korea | 32 | 0.0% |
| Latin America | 44,169 | 37.7% |
| Lebanon | 4 | 0.0% |
| Lithuania | 10 | 0.0% |
| Mexico | 38,631 | 33.0% |
| Moldova | 6 | 0.0% |
| Nicaragua | 369 | 0.3% |
| Nigeria | 32 | 0.0% |
| Northern Europe | 6 | 0.0% |
| Oceania | 4 | 0.0% |
| Panama | 8 | 0.0% |
| Peru | 55 | 0.1% |
| Philippines | 179 | 0.2% |
| Romania | 4 | 0.0% |
| South America | 306 | 0.3% |
| South Central Asia | 108 | 0.1% |
| South Eastern Asia | 409 | 0.4% |
| Southern Europe | 17 | 0.0% |
| Syria | 12 | 0.0% |
| Taiwan | 31 | 0.0% |
| Turkey | 23 | 0.0% |
| Ukraine | 11 | 0.0% |
| Uruguay | 9 | 0.0% |
| Venezuela | 9 | 0.0% |
| Vietnam | 197 | 0.2% |
| Western Africa | 32 | 0.0% |
| Western Asia | 135 | 0.1% |
| Western Europe | 46 | 0.0% | View All 58 Rows |
Sex and Age in East Los Angeles
Sex and Age in East Los Angeles
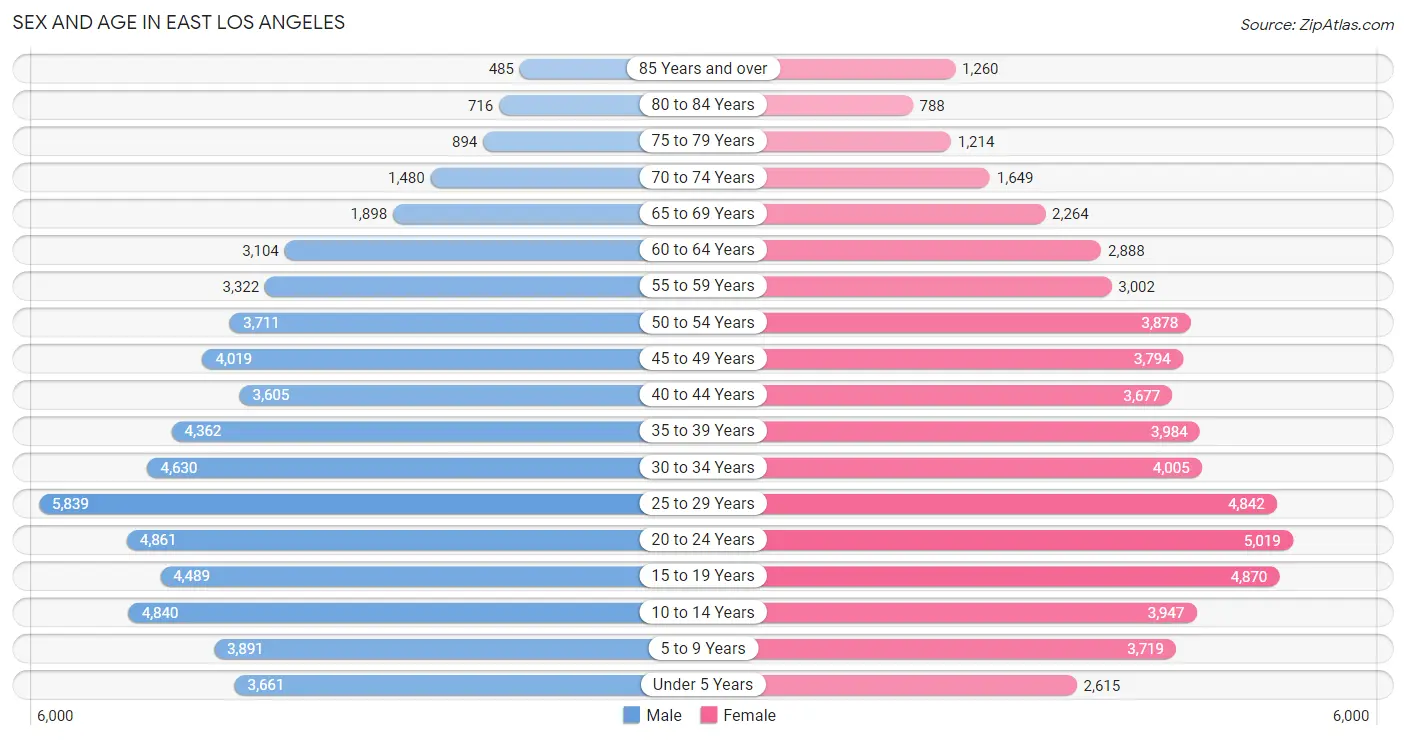
The most populous age groups in East Los Angeles are 25 to 29 Years (5,839 | 9.8%) for men and 20 to 24 Years (5,019 | 8.7%) for women.
| Age Bracket | Male | Female |
| Under 5 Years | 3,661 (6.1%) | 2,615 (4.5%) |
| 5 to 9 Years | 3,891 (6.5%) | 3,719 (6.5%) |
| 10 to 14 Years | 4,840 (8.1%) | 3,947 (6.9%) |
| 15 to 19 Years | 4,489 (7.5%) | 4,870 (8.5%) |
| 20 to 24 Years | 4,861 (8.1%) | 5,019 (8.7%) |
| 25 to 29 Years | 5,839 (9.8%) | 4,842 (8.4%) |
| 30 to 34 Years | 4,630 (7.7%) | 4,005 (7.0%) |
| 35 to 39 Years | 4,362 (7.3%) | 3,984 (6.9%) |
| 40 to 44 Years | 3,605 (6.0%) | 3,677 (6.4%) |
| 45 to 49 Years | 4,019 (6.7%) | 3,794 (6.6%) |
| 50 to 54 Years | 3,711 (6.2%) | 3,878 (6.8%) |
| 55 to 59 Years | 3,322 (5.6%) | 3,002 (5.2%) |
| 60 to 64 Years | 3,104 (5.2%) | 2,888 (5.0%) |
| 65 to 69 Years | 1,898 (3.2%) | 2,264 (3.9%) |
| 70 to 74 Years | 1,480 (2.5%) | 1,649 (2.9%) |
| 75 to 79 Years | 894 (1.5%) | 1,214 (2.1%) |
| 80 to 84 Years | 716 (1.2%) | 788 (1.4%) |
| 85 Years and over | 485 (0.8%) | 1,260 (2.2%) |
| Total | 59,807 (100.0%) | 57,415 (100.0%) |
Families and Households in East Los Angeles
Median Family Size in East Los Angeles
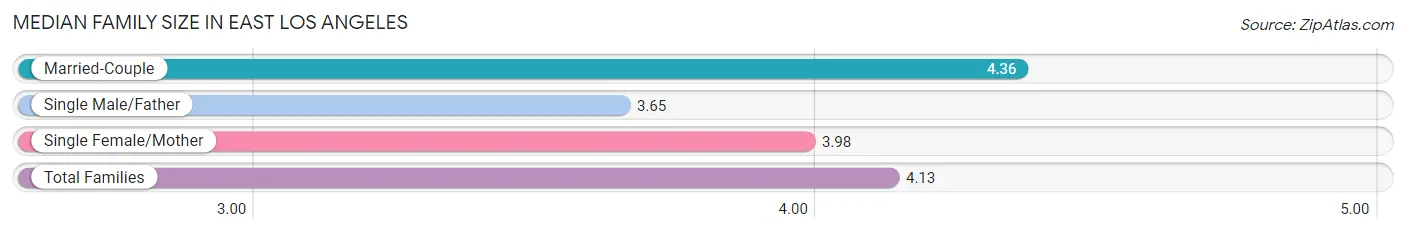
The median family size in East Los Angeles is 4.13 persons per family, with married-couple families (13,821 | 55.5%) accounting for the largest median family size of 4.36 persons per family. On the other hand, single male/father families (4,268 | 17.1%) represent the smallest median family size with 3.65 persons per family.
| Family Type | # Families | Family Size |
| Married-Couple | 13,821 (55.5%) | 4.36 |
| Single Male/Father | 4,268 (17.1%) | 3.65 |
| Single Female/Mother | 6,824 (27.4%) | 3.98 |
| Total Families | 24,913 (100.0%) | 4.13 |
Median Household Size in East Los Angeles
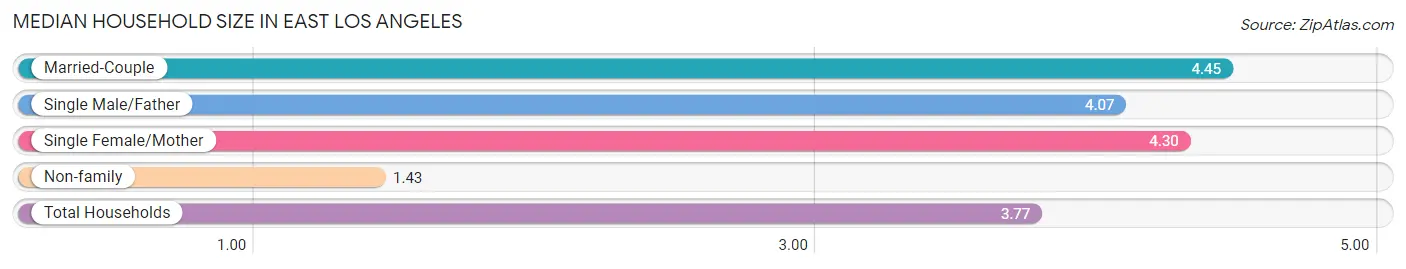
The median household size in East Los Angeles is 3.77 persons per household, with married-couple households (13,821 | 44.6%) accounting for the largest median household size of 4.45 persons per household. non-family households (6,100 | 19.7%) represent the smallest median household size with 1.43 persons per household.
| Household Type | # Households | Household Size |
| Married-Couple | 13,821 (44.6%) | 4.45 |
| Single Male/Father | 4,268 (13.8%) | 4.07 |
| Single Female/Mother | 6,824 (22.0%) | 4.30 |
| Non-family | 6,100 (19.7%) | 1.43 |
| Total Households | 31,013 (100.0%) | 3.77 |
Household Size by Marriage Status in East Los Angeles
Out of a total of 31,013 households in East Los Angeles, 24,913 (80.3%) are family households, while 6,100 (19.7%) are nonfamily households. The most numerous type of family households are 4-person households, comprising 5,856, and the most common type of nonfamily households are 1-person households, comprising 4,383.
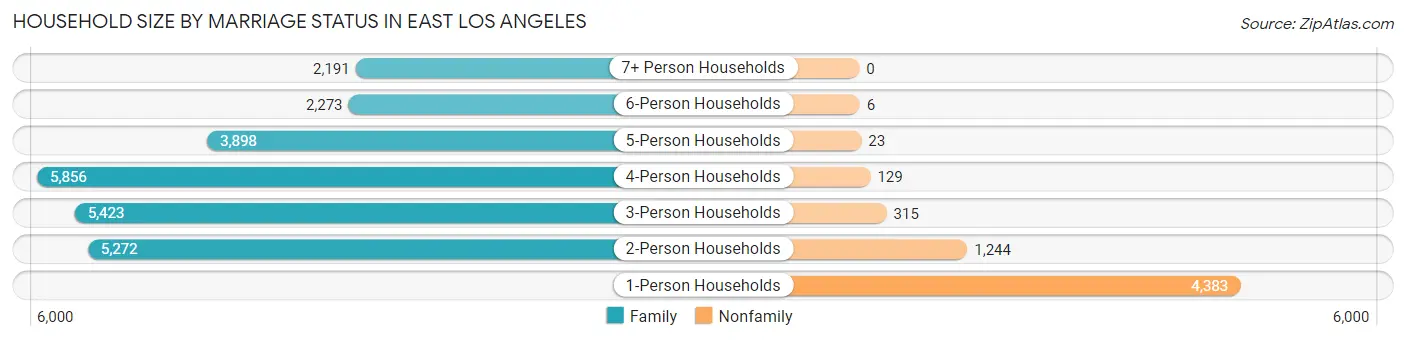
| Household Size | Family Households | Nonfamily Households |
| 1-Person Households | - | 4,383 (14.1%) |
| 2-Person Households | 5,272 (17.0%) | 1,244 (4.0%) |
| 3-Person Households | 5,423 (17.5%) | 315 (1.0%) |
| 4-Person Households | 5,856 (18.9%) | 129 (0.4%) |
| 5-Person Households | 3,898 (12.6%) | 23 (0.1%) |
| 6-Person Households | 2,273 (7.3%) | 6 (0.0%) |
| 7+ Person Households | 2,191 (7.1%) | 0 (0.0%) |
| Total | 24,913 (80.3%) | 6,100 (19.7%) |
Female Fertility in East Los Angeles
Fertility by Age in East Los Angeles
Average fertility rate in East Los Angeles is 44.0 births per 1,000 women. Women in the age bracket of 20 to 34 years have the highest fertility rate with 80.0 births per 1,000 women. Women in the age bracket of 20 to 34 years acount for 79.5% of all women with births.
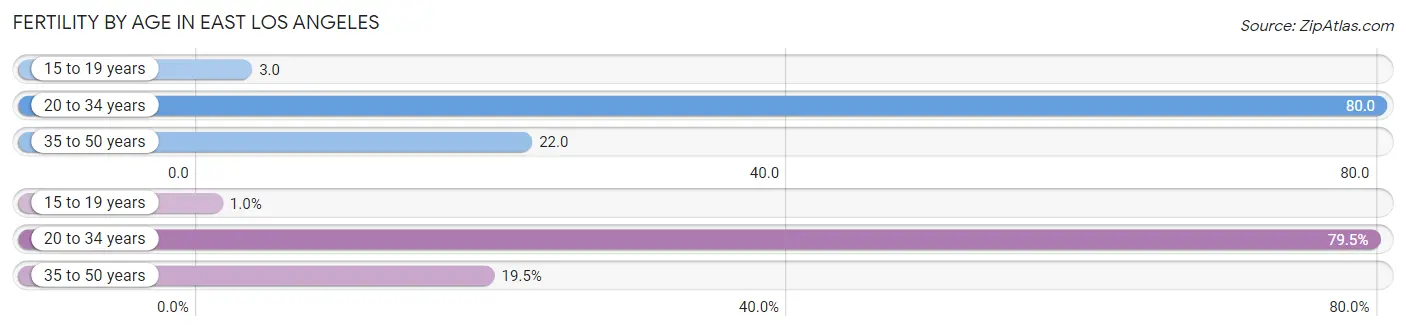
| Age Bracket | Women with Births | Births / 1,000 Women |
| 15 to 19 years | 14 (1.0%) | 3.0 |
| 20 to 34 years | 1,104 (79.5%) | 80.0 |
| 35 to 50 years | 270 (19.5%) | 22.0 |
| Total | 1,388 (100.0%) | 44.0 |
Fertility by Age by Marriage Status in East Los Angeles
42.8% of women with births (1,388) in East Los Angeles are married. The highest percentage of unmarried women with births falls into 15 to 19 years age bracket with 100.0% of them unmarried at the time of birth, while the lowest percentage of unmarried women with births belong to 20 to 34 years age bracket with 52.0% of them unmarried.
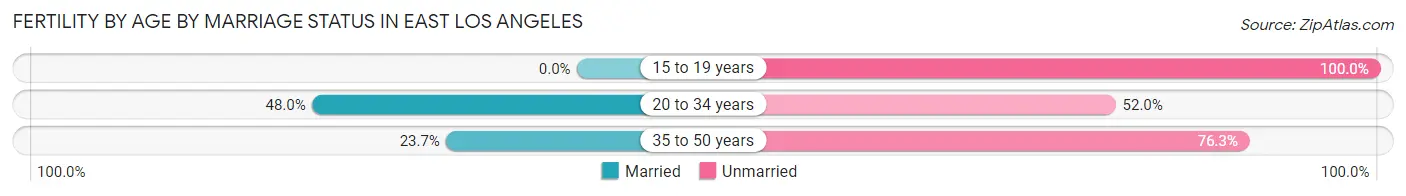
| Age Bracket | Married | Unmarried |
| 15 to 19 years | 0 (0.0%) | 14 (100.0%) |
| 20 to 34 years | 530 (48.0%) | 574 (52.0%) |
| 35 to 50 years | 64 (23.7%) | 206 (76.3%) |
| Total | 594 (42.8%) | 794 (57.2%) |
Fertility by Education in East Los Angeles
Average fertility rate in East Los Angeles is 44.0 births per 1,000 women. Women with the education attainment of high school diploma have the highest fertility rate of 65.0 births per 1,000 women, while women with the education attainment of less than high school have the lowest fertility at 21.0 births per 1,000 women. Women with the education attainment of college or associate's degree represent 36.1% of all women with births.
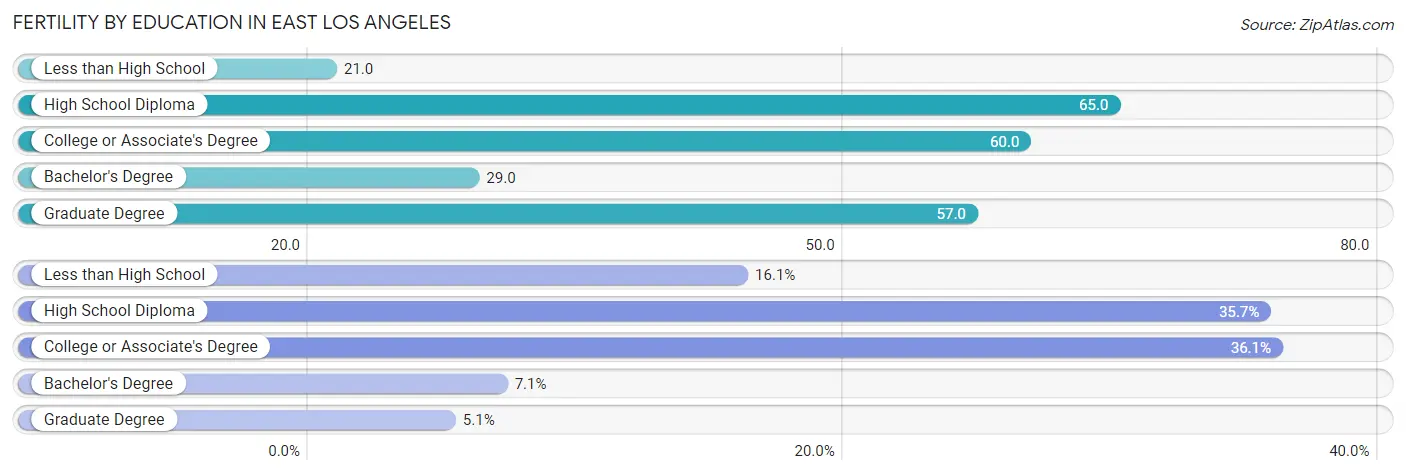
| Educational Attainment | Women with Births | Births / 1,000 Women |
| Less than High School | 223 (16.1%) | 21.0 |
| High School Diploma | 495 (35.7%) | 65.0 |
| College or Associate's Degree | 501 (36.1%) | 60.0 |
| Bachelor's Degree | 98 (7.1%) | 29.0 |
| Graduate Degree | 71 (5.1%) | 57.0 |
| Total | 1,388 (100.0%) | 44.0 |
Fertility by Education by Marriage Status in East Los Angeles
57.2% of women with births in East Los Angeles are unmarried. Women with the educational attainment of bachelor's degree are most likely to be married with 64.3% of them married at childbirth, while women with the educational attainment of less than high school are least likely to be married with 75.3% of them unmarried at childbirth.
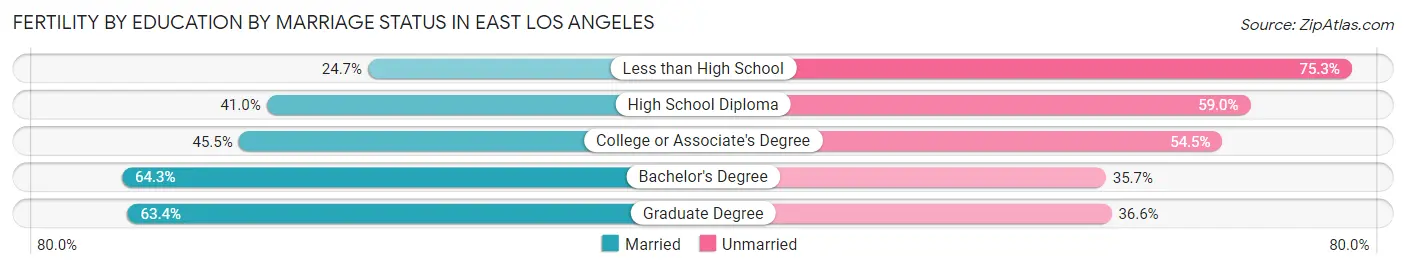
| Educational Attainment | Married | Unmarried |
| Less than High School | 55 (24.7%) | 168 (75.3%) |
| High School Diploma | 203 (41.0%) | 292 (59.0%) |
| College or Associate's Degree | 228 (45.5%) | 273 (54.5%) |
| Bachelor's Degree | 63 (64.3%) | 35 (35.7%) |
| Graduate Degree | 45 (63.4%) | 26 (36.6%) |
| Total | 594 (42.8%) | 794 (57.2%) |
Employment Characteristics in East Los Angeles
Employment by Class of Employer in East Los Angeles
Among the 53,212 employed individuals in East Los Angeles, private company employees (39,663 | 74.5%), local government employees (4,275 | 8.0%), and self-employed (not incorporated) (3,749 | 7.0%) make up the most common classes of employment.
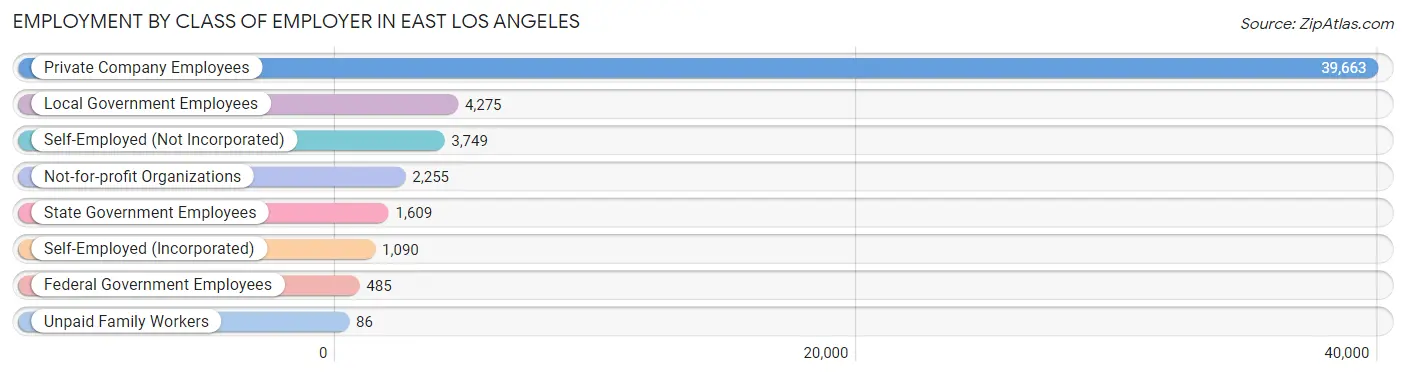
| Employer Class | # Employees | % Employees |
| Private Company Employees | 39,663 | 74.5% |
| Self-Employed (Incorporated) | 1,090 | 2.1% |
| Self-Employed (Not Incorporated) | 3,749 | 7.0% |
| Not-for-profit Organizations | 2,255 | 4.2% |
| Local Government Employees | 4,275 | 8.0% |
| State Government Employees | 1,609 | 3.0% |
| Federal Government Employees | 485 | 0.9% |
| Unpaid Family Workers | 86 | 0.2% |
| Total | 53,212 | 100.0% |
Employment Status by Age in East Los Angeles
According to the labor force statistics for East Los Angeles, out of the total population over 16 years of age (92,627), 62.8% or 58,170 individuals are in the labor force, with 6.3% or 3,665 of them unemployed. The age group with the highest labor force participation rate is 25 to 29 years, with 81.6% or 8,716 individuals in the labor force. Within the labor force, the 16 to 19 years age range has the highest percentage of unemployed individuals, with 23.8% or 393 of them being unemployed.
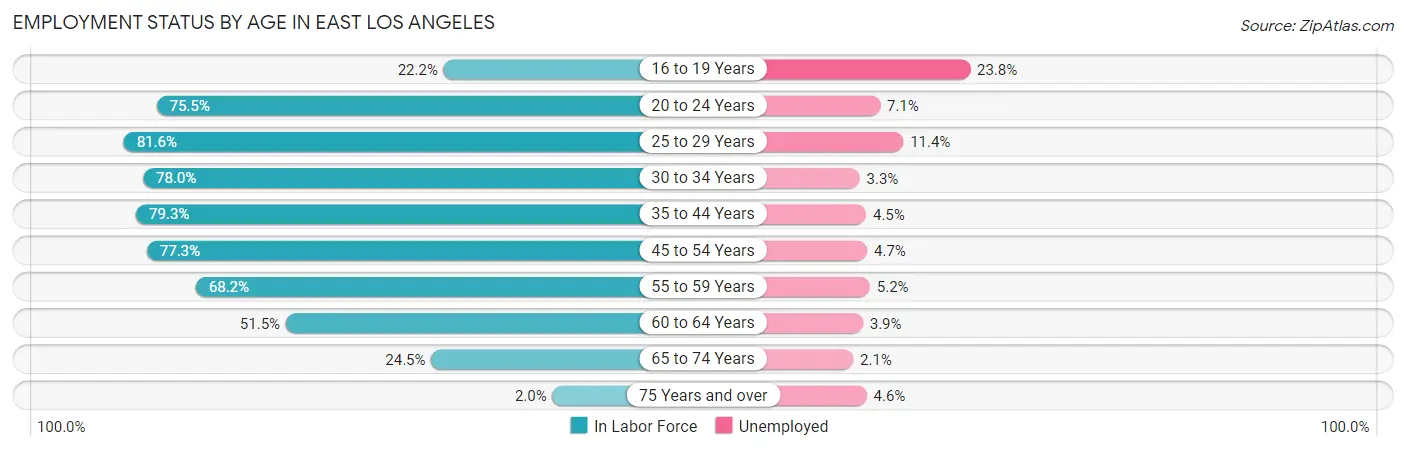
| Age Bracket | In Labor Force | Unemployed |
| 16 to 19 Years | 1,651 (22.2%) | 393 (23.8%) |
| 20 to 24 Years | 7,459 (75.5%) | 530 (7.1%) |
| 25 to 29 Years | 8,716 (81.6%) | 994 (11.4%) |
| 30 to 34 Years | 6,735 (78.0%) | 222 (3.3%) |
| 35 to 44 Years | 12,393 (79.3%) | 558 (4.5%) |
| 45 to 54 Years | 11,906 (77.3%) | 560 (4.7%) |
| 55 to 59 Years | 4,313 (68.2%) | 224 (5.2%) |
| 60 to 64 Years | 3,086 (51.5%) | 120 (3.9%) |
| 65 to 74 Years | 1,786 (24.5%) | 38 (2.1%) |
| 75 Years and over | 107 (2.0%) | 5 (4.6%) |
| Total | 58,170 (62.8%) | 3,665 (6.3%) |
Employment Status by Educational Attainment in East Los Angeles
According to labor force statistics for East Los Angeles, 75.2% of individuals (47,122) out of the total population between 25 and 64 years of age (62,662) are in the labor force, with 5.7% or 2,686 of them being unemployed. The group with the highest labor force participation rate are those with the educational attainment of bachelor's degree or higher, with 90.7% or 6,923 individuals in the labor force. Within the labor force, individuals with college / associate degree education have the highest percentage of unemployment, with 6.2% or 711 of them being unemployed.
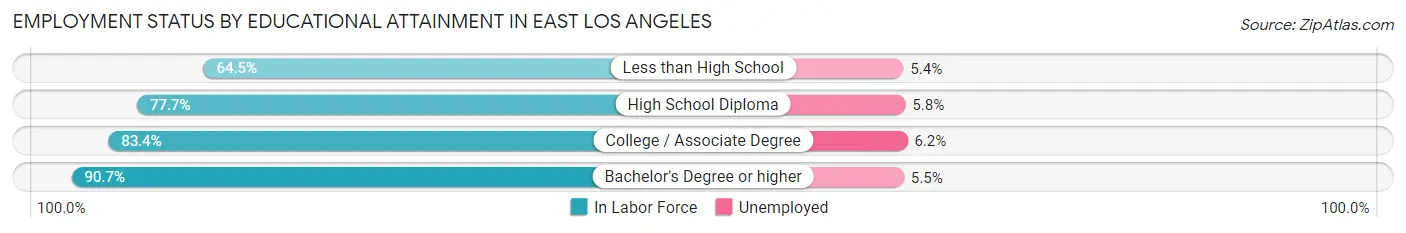
| Educational Attainment | In Labor Force | Unemployed |
| Less than High School | 16,329 (64.5%) | 1,367 (5.4%) |
| High School Diploma | 12,395 (77.7%) | 925 (5.8%) |
| College / Associate Degree | 11,475 (83.4%) | 853 (6.2%) |
| Bachelor's Degree or higher | 6,923 (90.7%) | 420 (5.5%) |
| Total | 47,122 (75.2%) | 3,572 (5.7%) |
Employment Occupations by Sex in East Los Angeles
Management, Business, Science and Arts Occupations
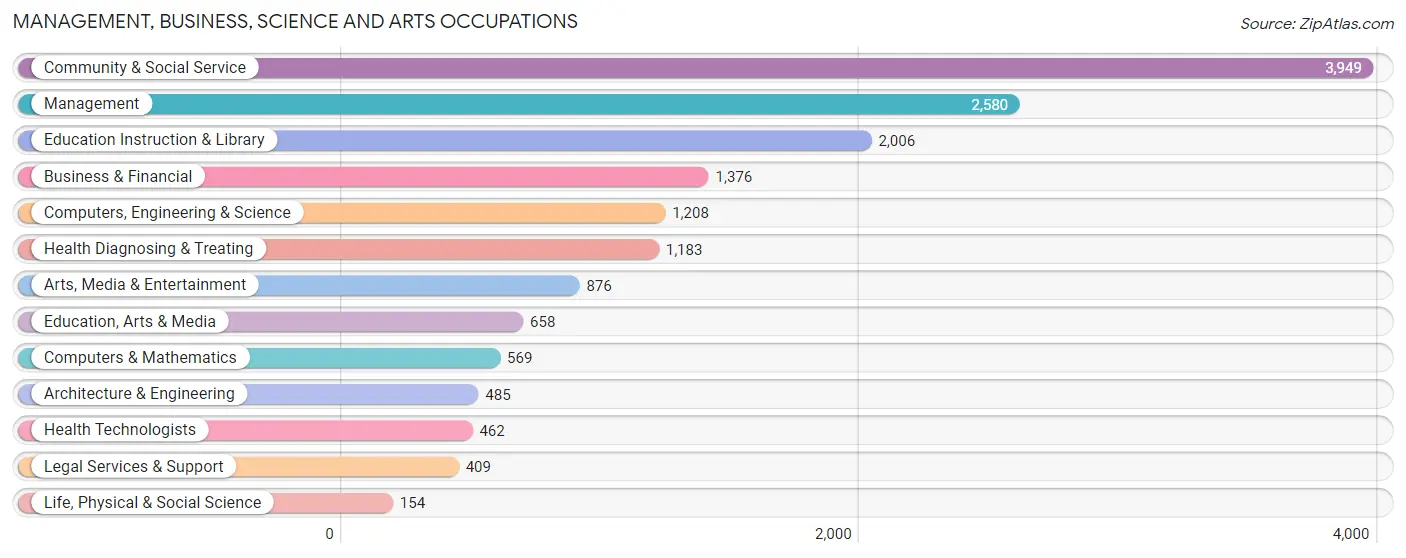
The most common Management, Business, Science and Arts occupations in East Los Angeles are Community & Social Service (3,949 | 7.2%), Management (2,580 | 4.7%), Education Instruction & Library (2,006 | 3.7%), Business & Financial (1,376 | 2.5%), and Computers, Engineering & Science (1,208 | 2.2%).
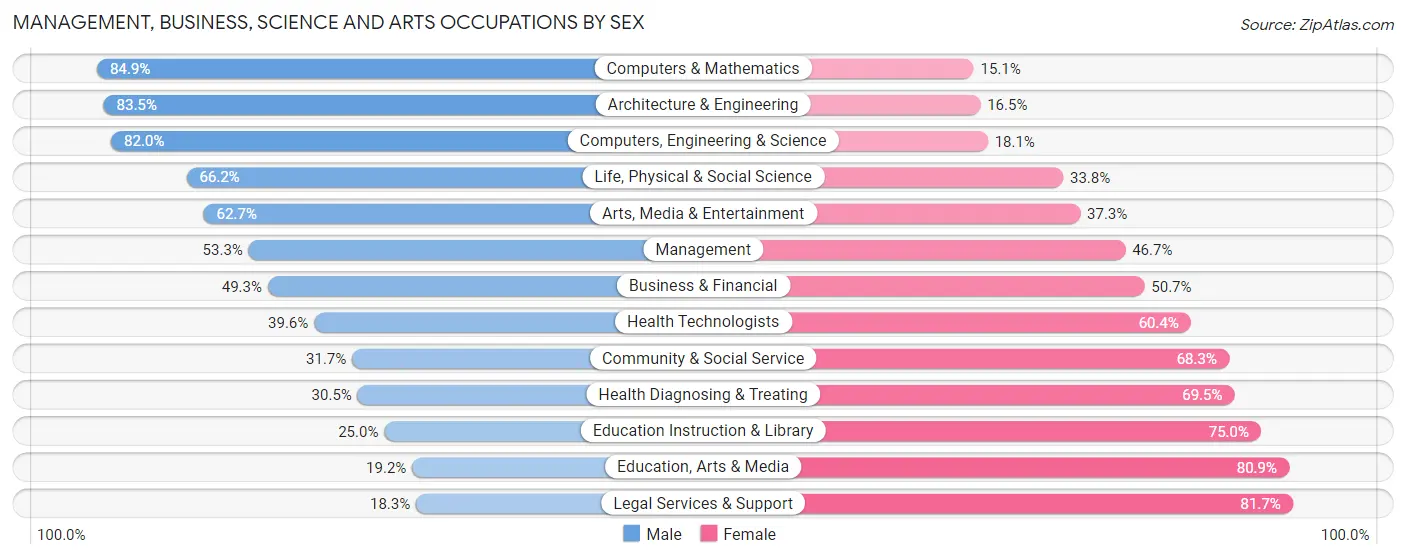
Management, Business, Science and Arts Occupations by Sex
Within the Management, Business, Science and Arts occupations in East Los Angeles, the most male-oriented occupations are Computers & Mathematics (84.9%), Architecture & Engineering (83.5%), and Computers, Engineering & Science (82.0%), while the most female-oriented occupations are Legal Services & Support (81.7%), Education, Arts & Media (80.8%), and Education Instruction & Library (75.0%).
| Occupation | Male | Female |
| Management | 1,374 (53.3%) | 1,206 (46.7%) |
| Business & Financial | 678 (49.3%) | 698 (50.7%) |
| Computers, Engineering & Science | 990 (82.0%) | 218 (18.0%) |
| Computers & Mathematics | 483 (84.9%) | 86 (15.1%) |
| Architecture & Engineering | 405 (83.5%) | 80 (16.5%) |
| Life, Physical & Social Science | 102 (66.2%) | 52 (33.8%) |
| Community & Social Service | 1,251 (31.7%) | 2,698 (68.3%) |
| Education, Arts & Media | 126 (19.2%) | 532 (80.8%) |
| Legal Services & Support | 75 (18.3%) | 334 (81.7%) |
| Education Instruction & Library | 501 (25.0%) | 1,505 (75.0%) |
| Arts, Media & Entertainment | 549 (62.7%) | 327 (37.3%) |
| Health Diagnosing & Treating | 361 (30.5%) | 822 (69.5%) |
| Health Technologists | 183 (39.6%) | 279 (60.4%) |
| Total (Category) | 4,654 (45.2%) | 5,642 (54.8%) |
| Total (Overall) | 31,493 (57.8%) | 22,989 (42.2%) |
Services Occupations
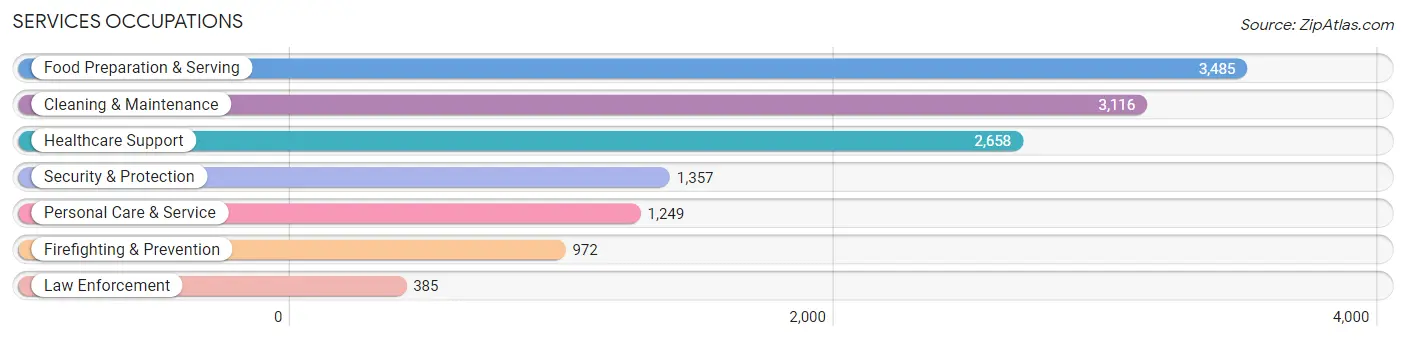
The most common Services occupations in East Los Angeles are Food Preparation & Serving (3,485 | 6.4%), Cleaning & Maintenance (3,116 | 5.7%), Healthcare Support (2,658 | 4.9%), Security & Protection (1,357 | 2.5%), and Personal Care & Service (1,249 | 2.3%).
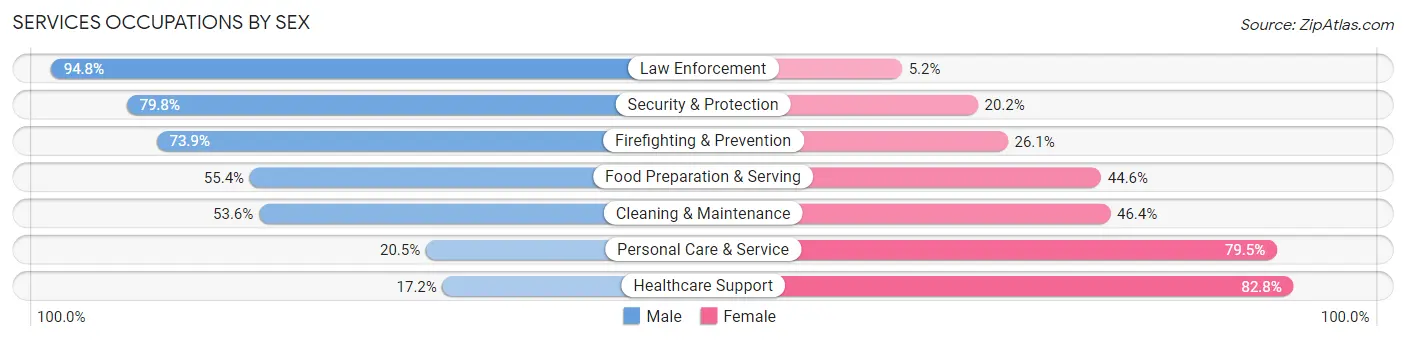
Services Occupations by Sex
Within the Services occupations in East Los Angeles, the most male-oriented occupations are Law Enforcement (94.8%), Security & Protection (79.8%), and Firefighting & Prevention (73.9%), while the most female-oriented occupations are Healthcare Support (82.8%), Personal Care & Service (79.5%), and Cleaning & Maintenance (46.4%).
| Occupation | Male | Female |
| Healthcare Support | 458 (17.2%) | 2,200 (82.8%) |
| Security & Protection | 1,083 (79.8%) | 274 (20.2%) |
| Firefighting & Prevention | 718 (73.9%) | 254 (26.1%) |
| Law Enforcement | 365 (94.8%) | 20 (5.2%) |
| Food Preparation & Serving | 1,930 (55.4%) | 1,555 (44.6%) |
| Cleaning & Maintenance | 1,669 (53.6%) | 1,447 (46.4%) |
| Personal Care & Service | 256 (20.5%) | 993 (79.5%) |
| Total (Category) | 5,396 (45.5%) | 6,469 (54.5%) |
| Total (Overall) | 31,493 (57.8%) | 22,989 (42.2%) |
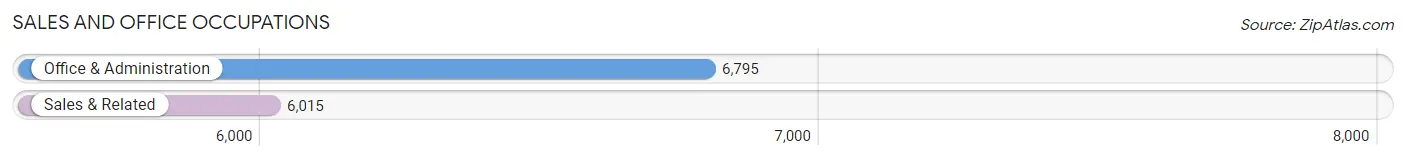
Sales and Office Occupations
The most common Sales and Office occupations in East Los Angeles are Office & Administration (6,795 | 12.5%), and Sales & Related (6,015 | 11.0%).
Sales and Office Occupations by Sex
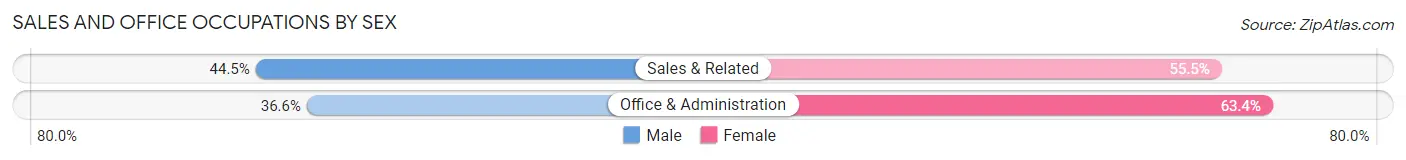
| Occupation | Male | Female |
| Sales & Related | 2,674 (44.5%) | 3,341 (55.5%) |
| Office & Administration | 2,486 (36.6%) | 4,309 (63.4%) |
| Total (Category) | 5,160 (40.3%) | 7,650 (59.7%) |
| Total (Overall) | 31,493 (57.8%) | 22,989 (42.2%) |
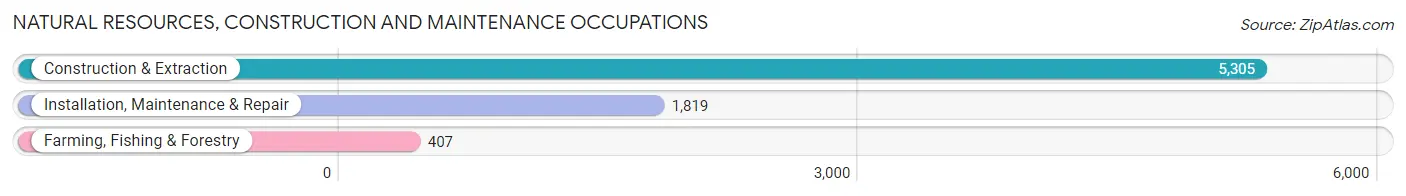
Natural Resources, Construction and Maintenance Occupations
The most common Natural Resources, Construction and Maintenance occupations in East Los Angeles are Construction & Extraction (5,305 | 9.7%), Installation, Maintenance & Repair (1,819 | 3.3%), and Farming, Fishing & Forestry (407 | 0.7%).
Natural Resources, Construction and Maintenance Occupations by Sex
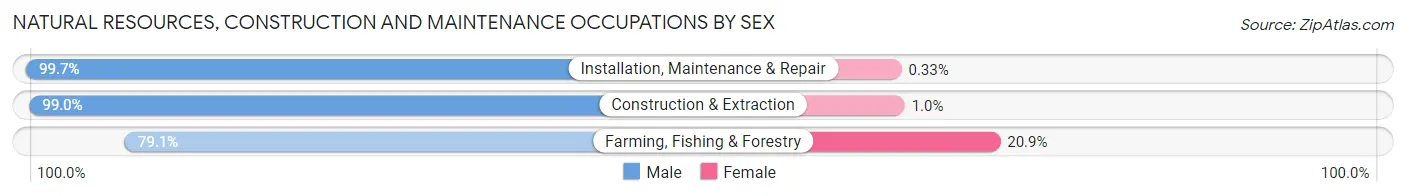
| Occupation | Male | Female |
| Farming, Fishing & Forestry | 322 (79.1%) | 85 (20.9%) |
| Construction & Extraction | 5,252 (99.0%) | 53 (1.0%) |
| Installation, Maintenance & Repair | 1,813 (99.7%) | 6 (0.3%) |
| Total (Category) | 7,387 (98.1%) | 144 (1.9%) |
| Total (Overall) | 31,493 (57.8%) | 22,989 (42.2%) |
Production, Transportation and Moving Occupations
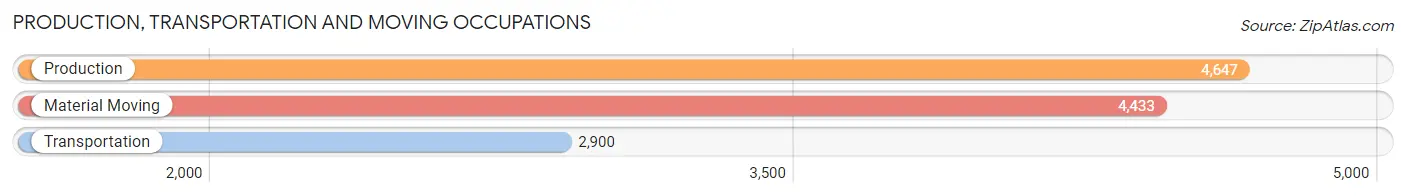
The most common Production, Transportation and Moving occupations in East Los Angeles are Production (4,647 | 8.5%), Material Moving (4,433 | 8.1%), and Transportation (2,900 | 5.3%).
Production, Transportation and Moving Occupations by Sex
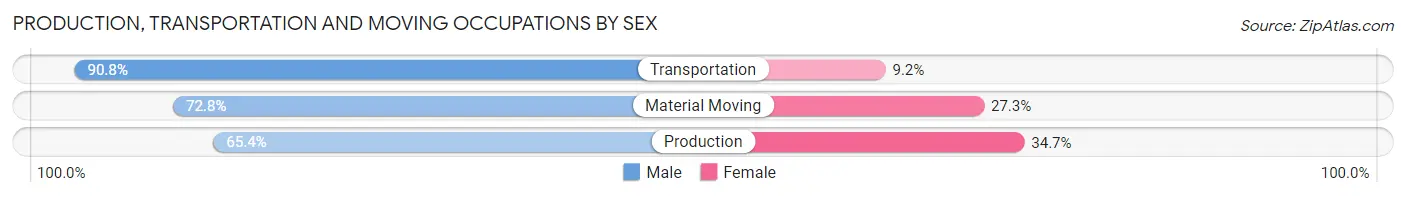
| Occupation | Male | Female |
| Production | 3,037 (65.3%) | 1,610 (34.6%) |
| Transportation | 2,634 (90.8%) | 266 (9.2%) |
| Material Moving | 3,225 (72.8%) | 1,208 (27.3%) |
| Total (Category) | 8,896 (74.3%) | 3,084 (25.7%) |
| Total (Overall) | 31,493 (57.8%) | 22,989 (42.2%) |
Employment Industries by Sex in East Los Angeles
Employment Industries in East Los Angeles
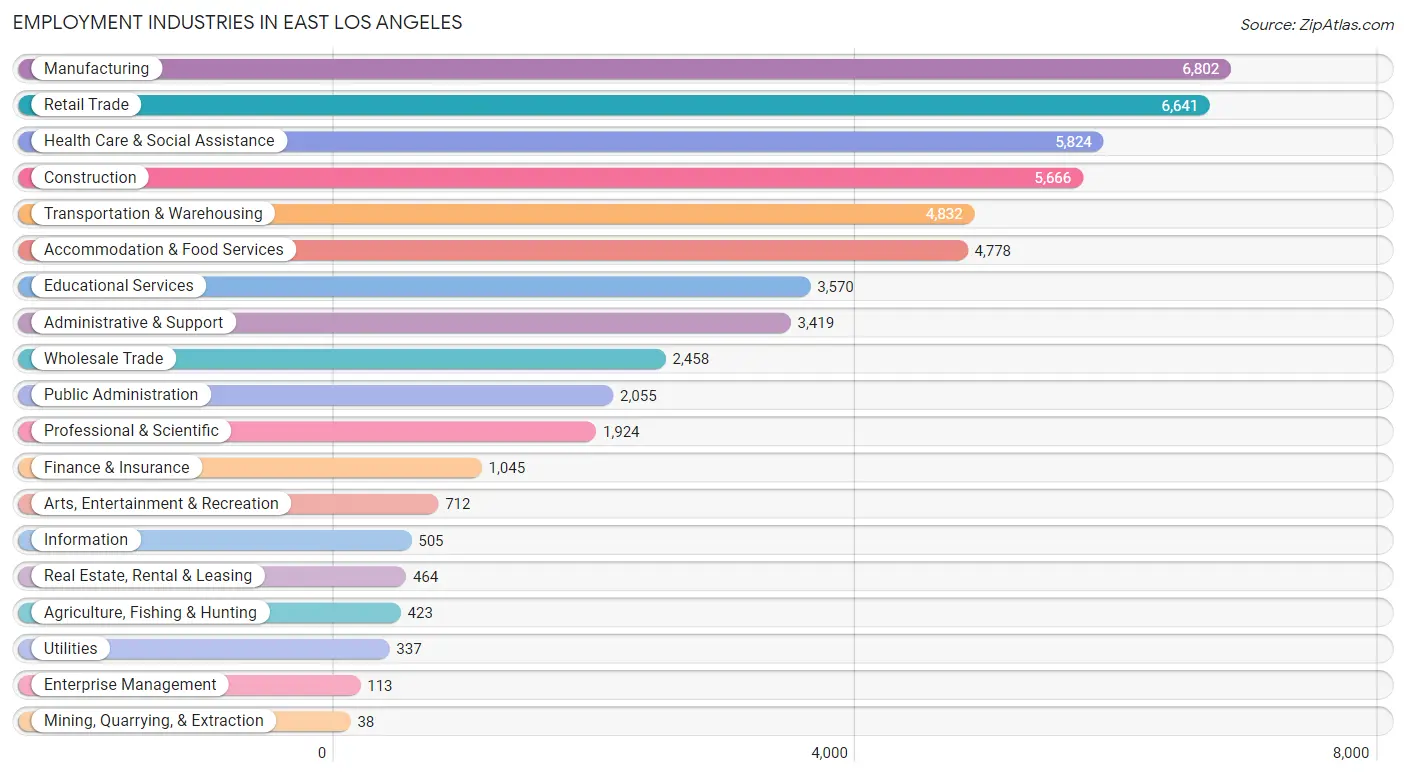
The major employment industries in East Los Angeles include Manufacturing (6,802 | 12.5%), Retail Trade (6,641 | 12.2%), Health Care & Social Assistance (5,824 | 10.7%), Construction (5,666 | 10.4%), and Transportation & Warehousing (4,832 | 8.9%).
Employment Industries by Sex in East Los Angeles
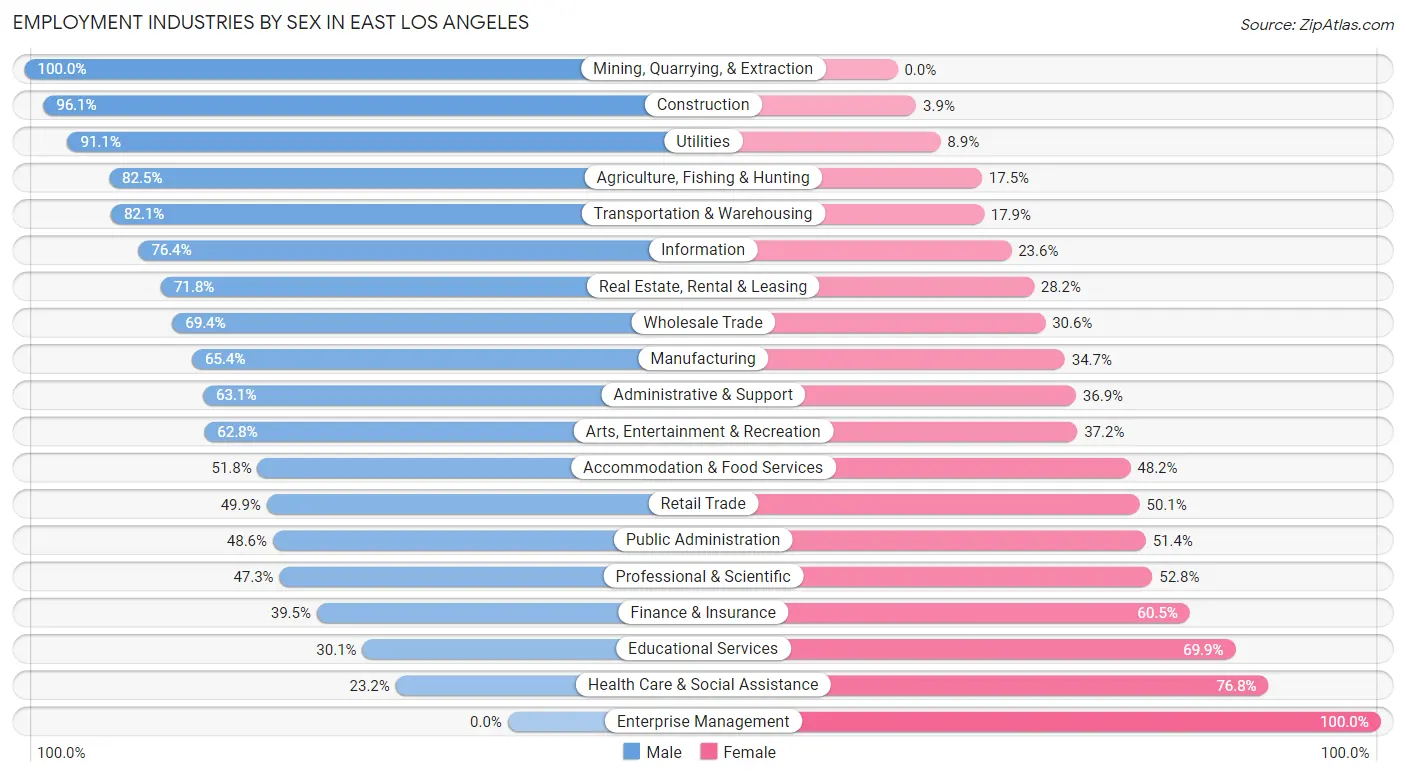
The East Los Angeles industries that see more men than women are Mining, Quarrying, & Extraction (100.0%), Construction (96.1%), and Utilities (91.1%), whereas the industries that tend to have a higher number of women are Enterprise Management (100.0%), Health Care & Social Assistance (76.8%), and Educational Services (69.9%).
| Industry | Male | Female |
| Agriculture, Fishing & Hunting | 349 (82.5%) | 74 (17.5%) |
| Mining, Quarrying, & Extraction | 38 (100.0%) | 0 (0.0%) |
| Construction | 5,446 (96.1%) | 220 (3.9%) |
| Manufacturing | 4,445 (65.3%) | 2,357 (34.6%) |
| Wholesale Trade | 1,706 (69.4%) | 752 (30.6%) |
| Retail Trade | 3,313 (49.9%) | 3,328 (50.1%) |
| Transportation & Warehousing | 3,968 (82.1%) | 864 (17.9%) |
| Utilities | 307 (91.1%) | 30 (8.9%) |
| Information | 386 (76.4%) | 119 (23.6%) |
| Finance & Insurance | 413 (39.5%) | 632 (60.5%) |
| Real Estate, Rental & Leasing | 333 (71.8%) | 131 (28.2%) |
| Professional & Scientific | 909 (47.2%) | 1,015 (52.7%) |
| Enterprise Management | 0 (0.0%) | 113 (100.0%) |
| Administrative & Support | 2,156 (63.1%) | 1,263 (36.9%) |
| Educational Services | 1,074 (30.1%) | 2,496 (69.9%) |
| Health Care & Social Assistance | 1,352 (23.2%) | 4,472 (76.8%) |
| Arts, Entertainment & Recreation | 447 (62.8%) | 265 (37.2%) |
| Accommodation & Food Services | 2,474 (51.8%) | 2,304 (48.2%) |
| Public Administration | 999 (48.6%) | 1,056 (51.4%) |
| Total | 31,493 (57.8%) | 22,989 (42.2%) |
Education in East Los Angeles
School Enrollment in East Los Angeles
The most common levels of schooling among the 32,953 students in East Los Angeles are high school (8,027 | 24.4%), college / undergraduate (7,670 | 23.3%), and middle school (6,926 | 21.0%).
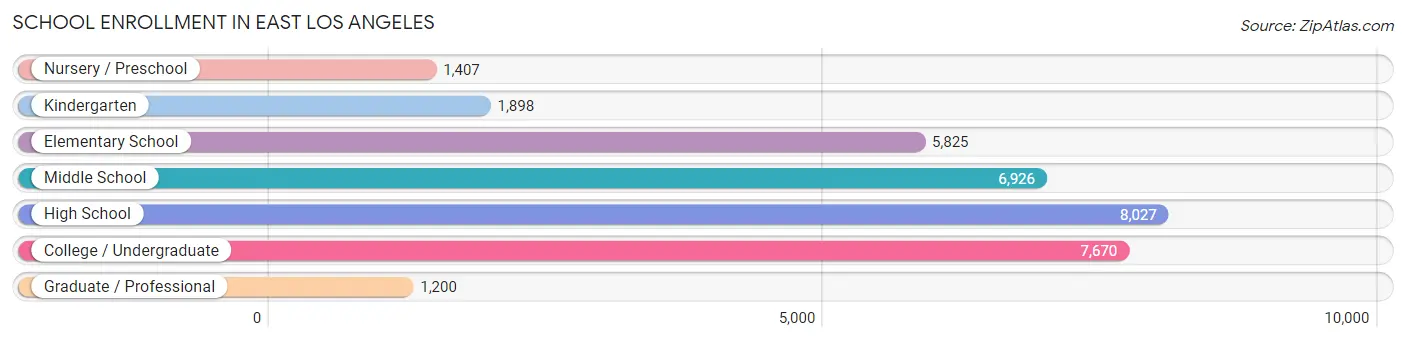
| School Level | # Students | % Students |
| Nursery / Preschool | 1,407 | 4.3% |
| Kindergarten | 1,898 | 5.8% |
| Elementary School | 5,825 | 17.7% |
| Middle School | 6,926 | 21.0% |
| High School | 8,027 | 24.4% |
| College / Undergraduate | 7,670 | 23.3% |
| Graduate / Professional | 1,200 | 3.6% |
| Total | 32,953 | 100.0% |
School Enrollment by Age by Funding Source in East Los Angeles
Out of a total of 32,953 students who are enrolled in schools in East Los Angeles, 1,714 (5.2%) attend a private institution, while the remaining 31,239 (94.8%) are enrolled in public schools. The age group of 25 to 34 year olds has the highest likelihood of being enrolled in private schools, with 294 (12.8% in the age bracket) enrolled. Conversely, the age group of 10 to 14 year olds has the lowest likelihood of being enrolled in a private school, with 8,182 (96.4% in the age bracket) attending a public institution.
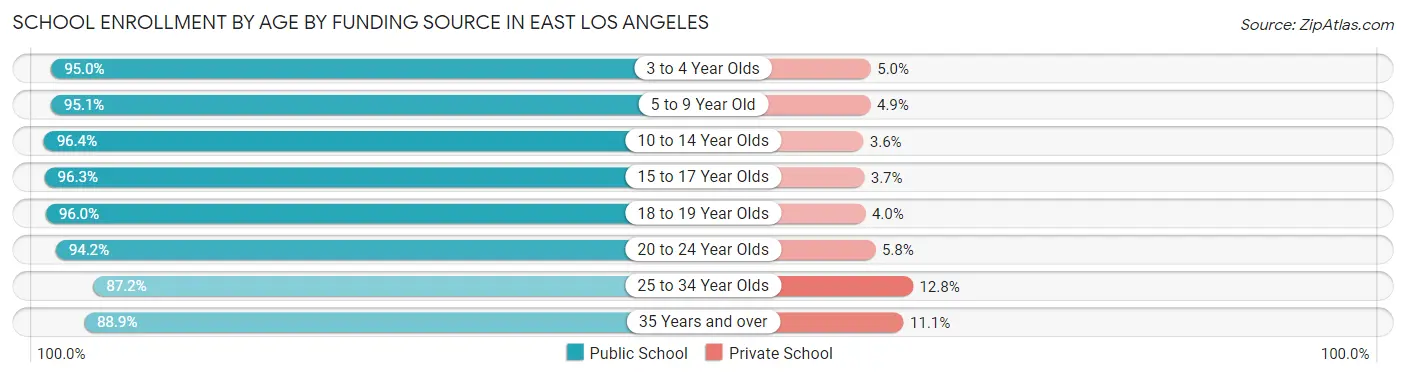
| Age Bracket | Public School | Private School |
| 3 to 4 Year Olds | 1,092 (95.0%) | 57 (5.0%) |
| 5 to 9 Year Old | 6,976 (95.1%) | 360 (4.9%) |
| 10 to 14 Year Olds | 8,182 (96.4%) | 303 (3.6%) |
| 15 to 17 Year Olds | 5,763 (96.3%) | 224 (3.7%) |
| 18 to 19 Year Olds | 2,153 (96.0%) | 89 (4.0%) |
| 20 to 24 Year Olds | 3,748 (94.2%) | 232 (5.8%) |
| 25 to 34 Year Olds | 1,999 (87.2%) | 294 (12.8%) |
| 35 Years and over | 1,317 (88.9%) | 164 (11.1%) |
| Total | 31,239 (94.8%) | 1,714 (5.2%) |
Educational Attainment by Field of Study in East Los Angeles
Business (1,546 | 18.1%), social sciences (1,186 | 13.9%), arts & humanities (1,180 | 13.8%), education (805 | 9.4%), and psychology (607 | 7.1%) are the most common fields of study among 8,551 individuals in East Los Angeles who have obtained a bachelor's degree or higher.
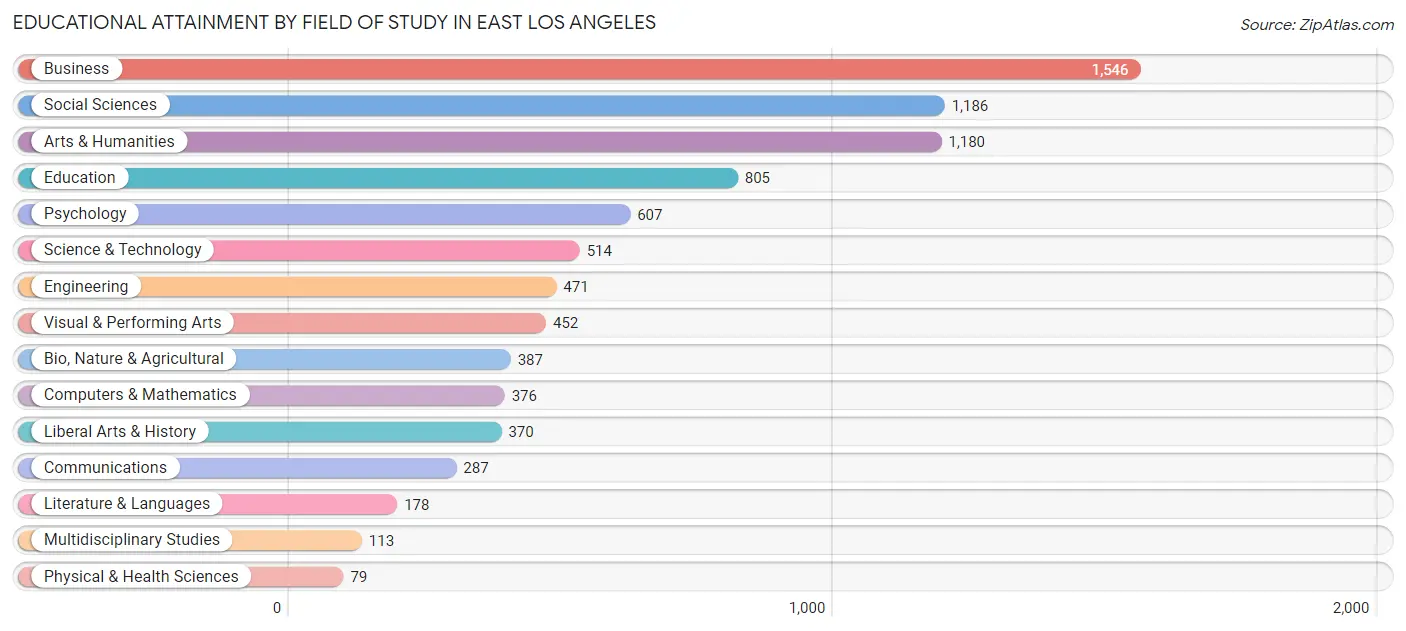
| Field of Study | # Graduates | % Graduates |
| Computers & Mathematics | 376 | 4.4% |
| Bio, Nature & Agricultural | 387 | 4.5% |
| Physical & Health Sciences | 79 | 0.9% |
| Psychology | 607 | 7.1% |
| Social Sciences | 1,186 | 13.9% |
| Engineering | 471 | 5.5% |
| Multidisciplinary Studies | 113 | 1.3% |
| Science & Technology | 514 | 6.0% |
| Business | 1,546 | 18.1% |
| Education | 805 | 9.4% |
| Literature & Languages | 178 | 2.1% |
| Liberal Arts & History | 370 | 4.3% |
| Visual & Performing Arts | 452 | 5.3% |
| Communications | 287 | 3.4% |
| Arts & Humanities | 1,180 | 13.8% |
| Total | 8,551 | 100.0% |
Transportation & Commute in East Los Angeles
Vehicle Availability by Sex in East Los Angeles
The most prevalent vehicle ownership categories in East Los Angeles are males with 2 vehicles (10,529, accounting for 34.0%) and females with 2 vehicles (7,579, making up 47.3%).
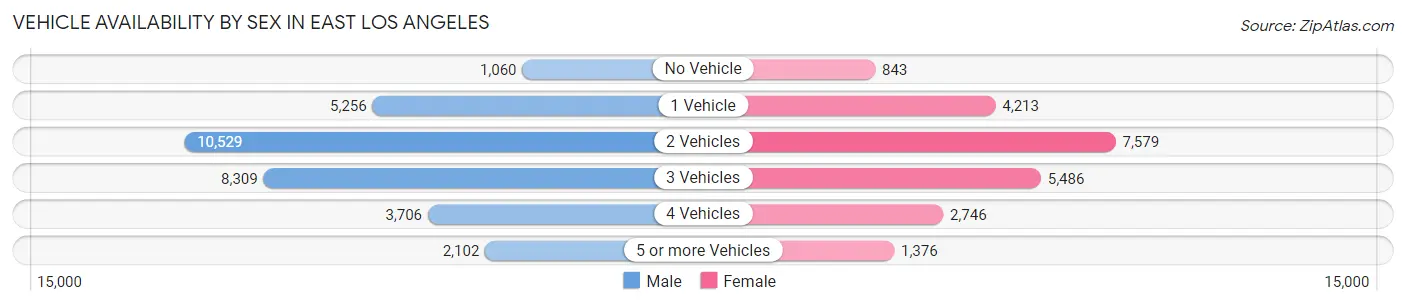
| Vehicles Available | Male | Female |
| No Vehicle | 1,060 (3.4%) | 843 (3.8%) |
| 1 Vehicle | 5,256 (17.0%) | 4,213 (18.9%) |
| 2 Vehicles | 10,529 (34.0%) | 7,579 (34.1%) |
| 3 Vehicles | 8,309 (26.8%) | 5,486 (24.7%) |
| 4 Vehicles | 3,706 (12.0%) | 2,746 (12.3%) |
| 5 or more Vehicles | 2,102 (6.8%) | 1,376 (6.2%) |
| Total | 30,962 (100.0%) | 22,243 (100.0%) |
Commute Time in East Los Angeles
The most frequently occuring commute durations in East Los Angeles are 30 to 34 minutes (9,562 commuters, 19.1%), 20 to 24 minutes (7,643 commuters, 15.3%), and 15 to 19 minutes (6,772 commuters, 13.5%).
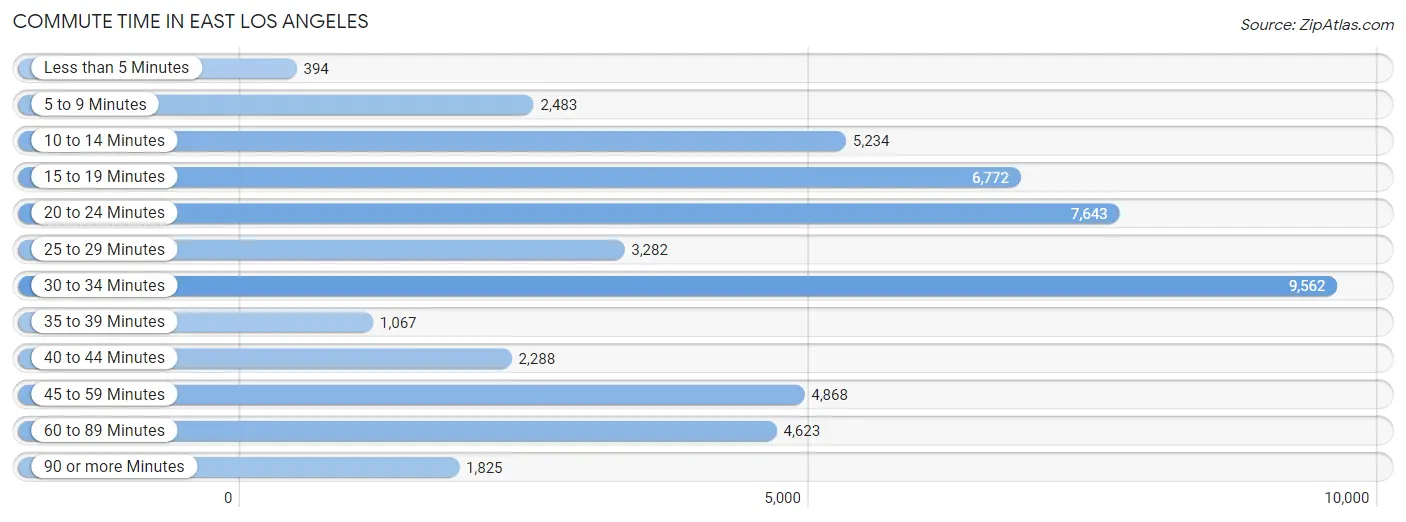
| Commute Time | # Commuters | % Commuters |
| Less than 5 Minutes | 394 | 0.8% |
| 5 to 9 Minutes | 2,483 | 5.0% |
| 10 to 14 Minutes | 5,234 | 10.5% |
| 15 to 19 Minutes | 6,772 | 13.5% |
| 20 to 24 Minutes | 7,643 | 15.3% |
| 25 to 29 Minutes | 3,282 | 6.6% |
| 30 to 34 Minutes | 9,562 | 19.1% |
| 35 to 39 Minutes | 1,067 | 2.1% |
| 40 to 44 Minutes | 2,288 | 4.6% |
| 45 to 59 Minutes | 4,868 | 9.7% |
| 60 to 89 Minutes | 4,623 | 9.2% |
| 90 or more Minutes | 1,825 | 3.6% |
Commute Time by Sex in East Los Angeles
The most common commute times in East Los Angeles are 30 to 34 minutes (6,253 commuters, 21.0%) for males and 30 to 34 minutes (3,309 commuters, 16.3%) for females.
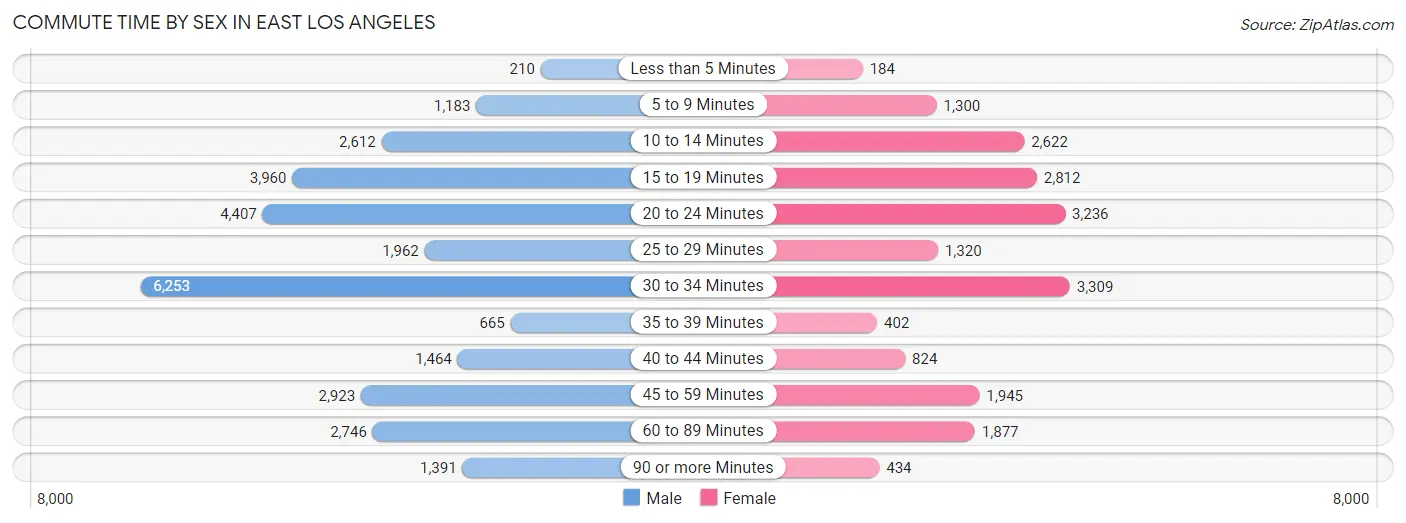
| Commute Time | Male | Female |
| Less than 5 Minutes | 210 (0.7%) | 184 (0.9%) |
| 5 to 9 Minutes | 1,183 (4.0%) | 1,300 (6.4%) |
| 10 to 14 Minutes | 2,612 (8.8%) | 2,622 (12.9%) |
| 15 to 19 Minutes | 3,960 (13.3%) | 2,812 (13.9%) |
| 20 to 24 Minutes | 4,407 (14.8%) | 3,236 (16.0%) |
| 25 to 29 Minutes | 1,962 (6.6%) | 1,320 (6.5%) |
| 30 to 34 Minutes | 6,253 (21.0%) | 3,309 (16.3%) |
| 35 to 39 Minutes | 665 (2.2%) | 402 (2.0%) |
| 40 to 44 Minutes | 1,464 (4.9%) | 824 (4.1%) |
| 45 to 59 Minutes | 2,923 (9.8%) | 1,945 (9.6%) |
| 60 to 89 Minutes | 2,746 (9.2%) | 1,877 (9.3%) |
| 90 or more Minutes | 1,391 (4.7%) | 434 (2.1%) |
Time of Departure to Work by Sex in East Los Angeles
The most frequent times of departure to work in East Los Angeles are 7:00 AM to 7:29 AM (3,897, 13.1%) for males and 7:00 AM to 7:29 AM (3,367, 16.6%) for females.
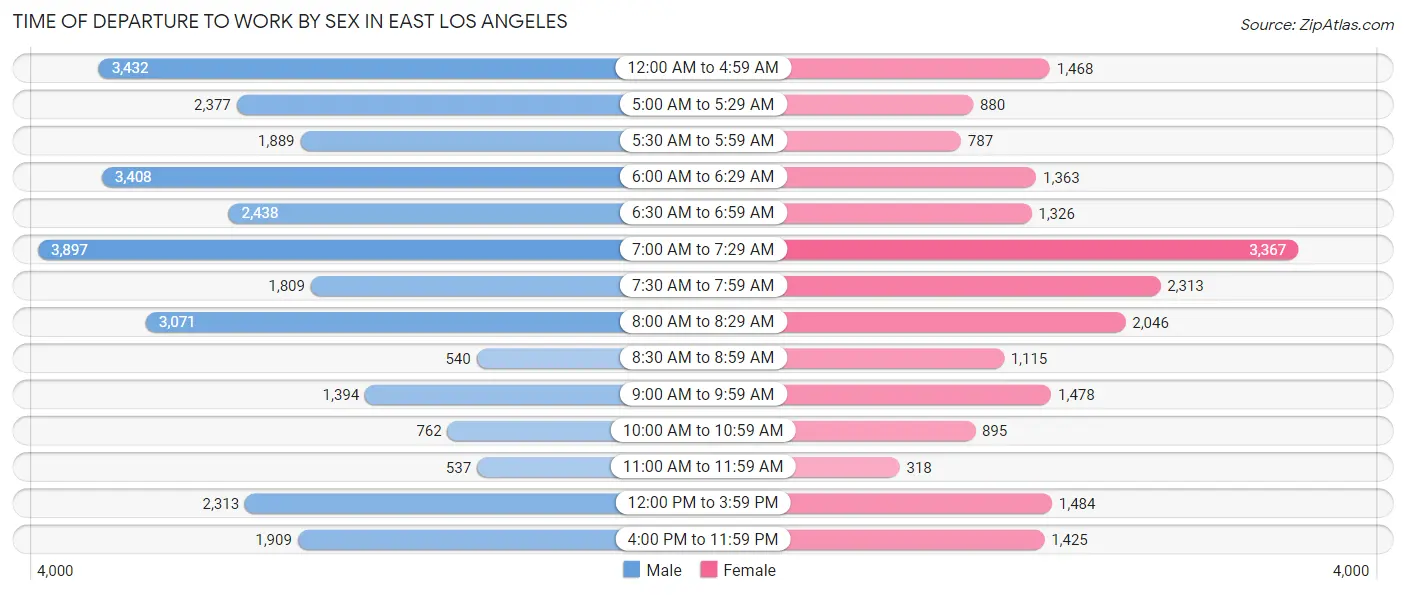
| Time of Departure | Male | Female |
| 12:00 AM to 4:59 AM | 3,432 (11.5%) | 1,468 (7.2%) |
| 5:00 AM to 5:29 AM | 2,377 (8.0%) | 880 (4.3%) |
| 5:30 AM to 5:59 AM | 1,889 (6.3%) | 787 (3.9%) |
| 6:00 AM to 6:29 AM | 3,408 (11.5%) | 1,363 (6.7%) |
| 6:30 AM to 6:59 AM | 2,438 (8.2%) | 1,326 (6.5%) |
| 7:00 AM to 7:29 AM | 3,897 (13.1%) | 3,367 (16.6%) |
| 7:30 AM to 7:59 AM | 1,809 (6.1%) | 2,313 (11.4%) |
| 8:00 AM to 8:29 AM | 3,071 (10.3%) | 2,046 (10.1%) |
| 8:30 AM to 8:59 AM | 540 (1.8%) | 1,115 (5.5%) |
| 9:00 AM to 9:59 AM | 1,394 (4.7%) | 1,478 (7.3%) |
| 10:00 AM to 10:59 AM | 762 (2.6%) | 895 (4.4%) |
| 11:00 AM to 11:59 AM | 537 (1.8%) | 318 (1.6%) |
| 12:00 PM to 3:59 PM | 2,313 (7.8%) | 1,484 (7.3%) |
| 4:00 PM to 11:59 PM | 1,909 (6.4%) | 1,425 (7.0%) |
| Total | 29,776 (100.0%) | 20,265 (100.0%) |
Housing Occupancy in East Los Angeles
Occupancy by Ownership in East Los Angeles
Of the total 31,013 dwellings in East Los Angeles, owner-occupied units account for 10,822 (34.9%), while renter-occupied units make up 20,191 (65.1%).
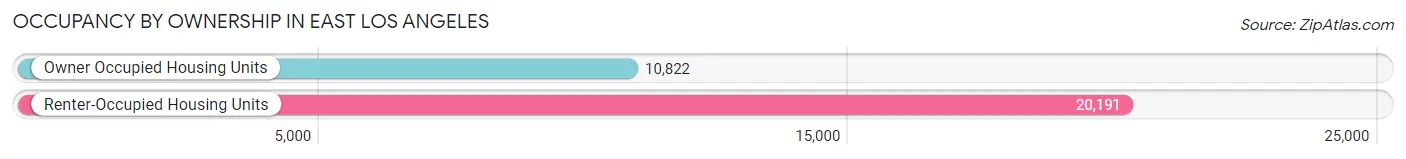
| Occupancy | # Housing Units | % Housing Units |
| Owner Occupied Housing Units | 10,822 | 34.9% |
| Renter-Occupied Housing Units | 20,191 | 65.1% |
| Total Occupied Housing Units | 31,013 | 100.0% |
Occupancy by Household Size in East Los Angeles
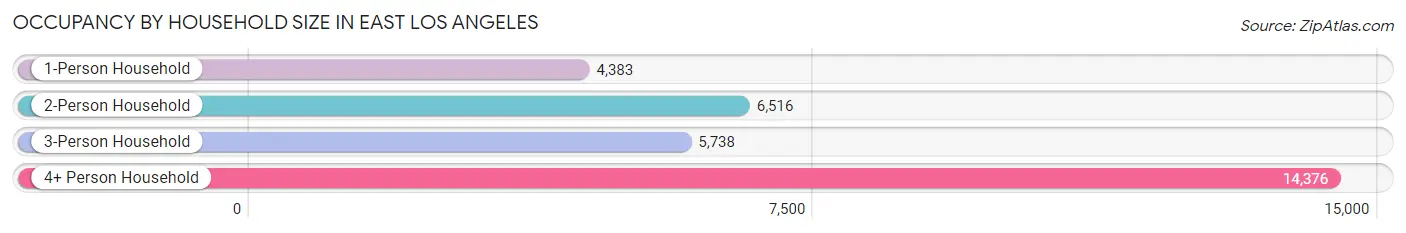
| Household Size | # Housing Units | % Housing Units |
| 1-Person Household | 4,383 | 14.1% |
| 2-Person Household | 6,516 | 21.0% |
| 3-Person Household | 5,738 | 18.5% |
| 4+ Person Household | 14,376 | 46.4% |
| Total Housing Units | 31,013 | 100.0% |
Occupancy by Ownership by Household Size in East Los Angeles
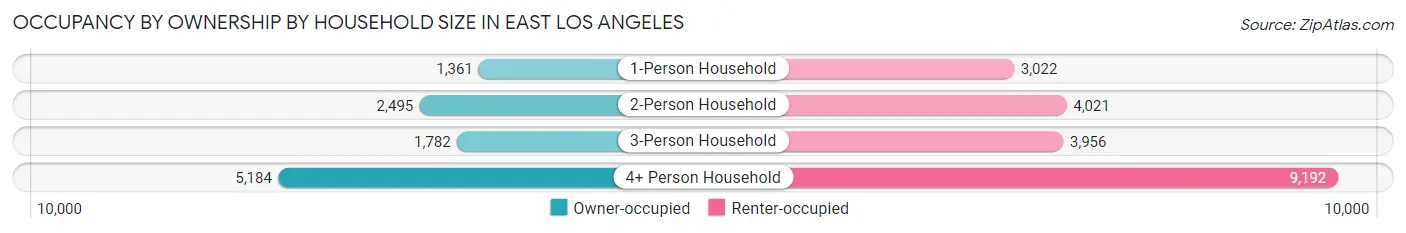
| Household Size | Owner-occupied | Renter-occupied |
| 1-Person Household | 1,361 (31.0%) | 3,022 (69.0%) |
| 2-Person Household | 2,495 (38.3%) | 4,021 (61.7%) |
| 3-Person Household | 1,782 (31.1%) | 3,956 (68.9%) |
| 4+ Person Household | 5,184 (36.1%) | 9,192 (63.9%) |
| Total Housing Units | 10,822 (34.9%) | 20,191 (65.1%) |
Occupancy by Educational Attainment in East Los Angeles
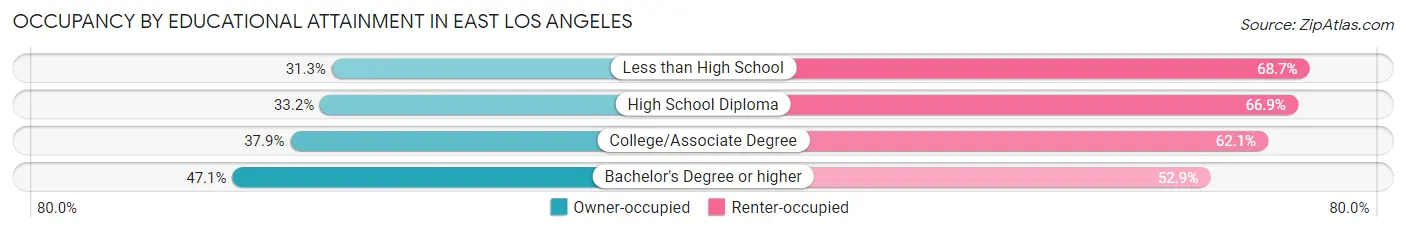
| Household Size | Owner-occupied | Renter-occupied |
| Less than High School | 4,424 (31.3%) | 9,716 (68.7%) |
| High School Diploma | 2,154 (33.2%) | 4,343 (66.8%) |
| College/Associate Degree | 2,634 (37.9%) | 4,321 (62.1%) |
| Bachelor's Degree or higher | 1,610 (47.1%) | 1,811 (52.9%) |
Occupancy by Age of Householder in East Los Angeles
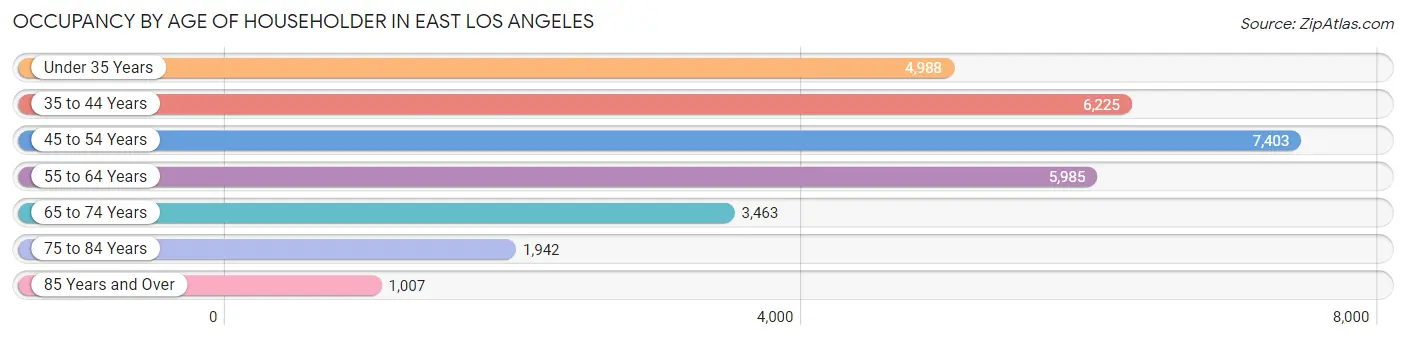
| Age Bracket | # Households | % Households |
| Under 35 Years | 4,988 | 16.1% |
| 35 to 44 Years | 6,225 | 20.1% |
| 45 to 54 Years | 7,403 | 23.9% |
| 55 to 64 Years | 5,985 | 19.3% |
| 65 to 74 Years | 3,463 | 11.2% |
| 75 to 84 Years | 1,942 | 6.3% |
| 85 Years and Over | 1,007 | 3.3% |
| Total | 31,013 | 100.0% |
Housing Finances in East Los Angeles
Median Income by Occupancy in East Los Angeles
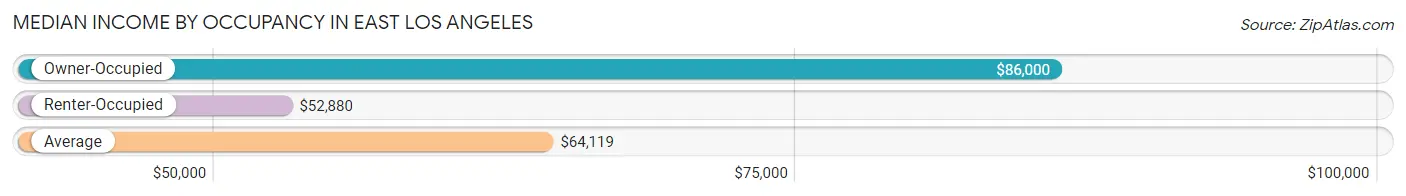
| Occupancy Type | # Households | Median Income |
| Owner-Occupied | 10,822 (34.9%) | $86,000 |
| Renter-Occupied | 20,191 (65.1%) | $52,880 |
| Average | 31,013 (100.0%) | $64,119 |
Occupancy by Householder Income Bracket in East Los Angeles
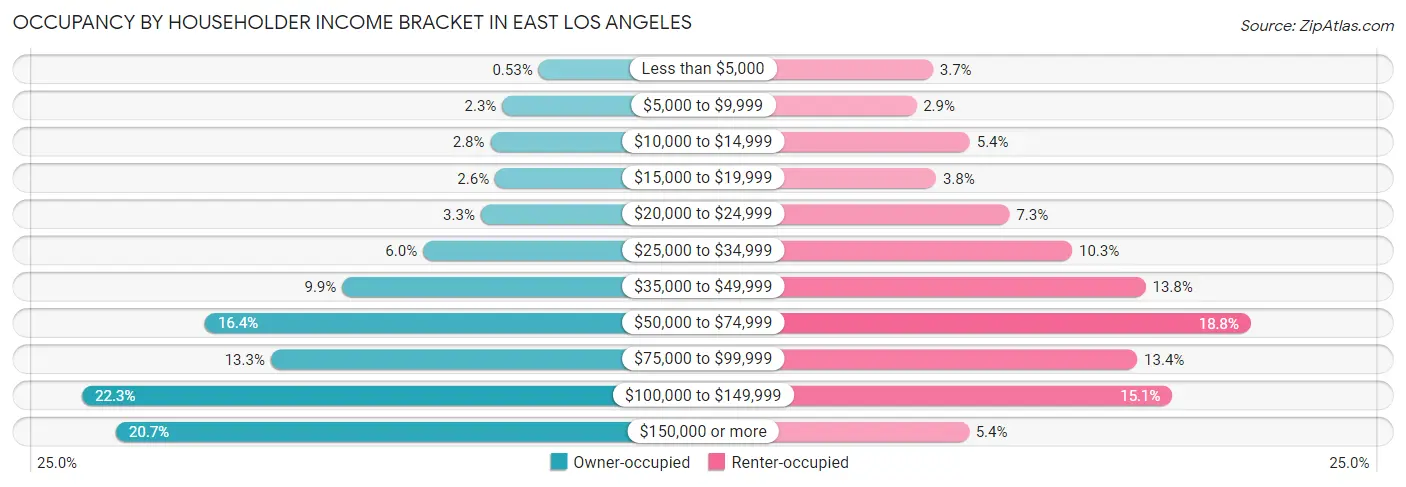
| Income Bracket | Owner-occupied | Renter-occupied |
| Less than $5,000 | 57 (0.5%) | 744 (3.7%) |
| $5,000 to $9,999 | 245 (2.3%) | 584 (2.9%) |
| $10,000 to $14,999 | 305 (2.8%) | 1,098 (5.4%) |
| $15,000 to $19,999 | 281 (2.6%) | 774 (3.8%) |
| $20,000 to $24,999 | 355 (3.3%) | 1,481 (7.3%) |
| $25,000 to $34,999 | 653 (6.0%) | 2,082 (10.3%) |
| $35,000 to $49,999 | 1,069 (9.9%) | 2,788 (13.8%) |
| $50,000 to $74,999 | 1,776 (16.4%) | 3,800 (18.8%) |
| $75,000 to $99,999 | 1,437 (13.3%) | 2,707 (13.4%) |
| $100,000 to $149,999 | 2,409 (22.3%) | 3,045 (15.1%) |
| $150,000 or more | 2,235 (20.6%) | 1,088 (5.4%) |
| Total | 10,822 (100.0%) | 20,191 (100.0%) |
Monthly Housing Cost Tiers in East Los Angeles
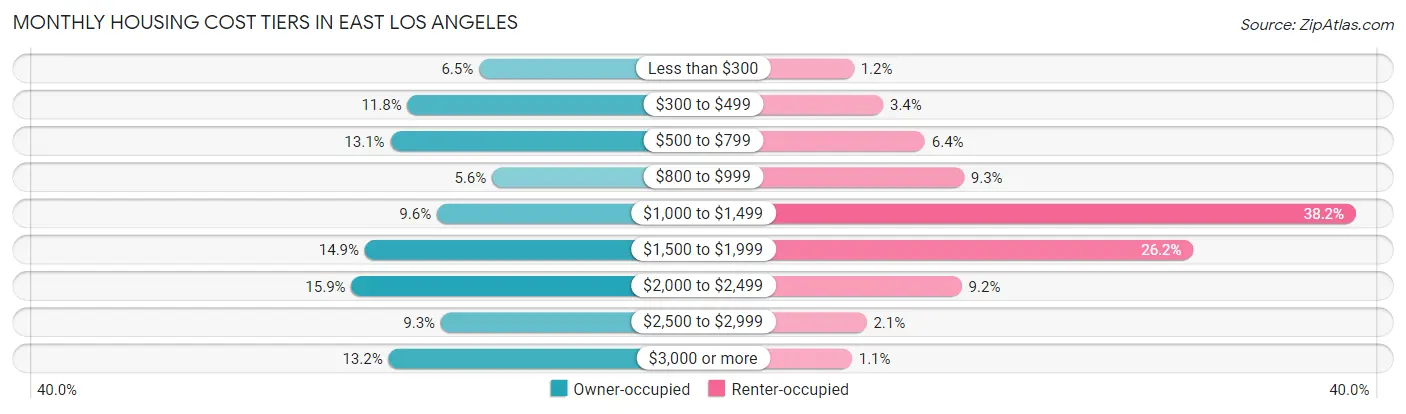
| Monthly Cost | Owner-occupied | Renter-occupied |
| Less than $300 | 707 (6.5%) | 242 (1.2%) |
| $300 to $499 | 1,277 (11.8%) | 679 (3.4%) |
| $500 to $799 | 1,413 (13.1%) | 1,300 (6.4%) |
| $800 to $999 | 603 (5.6%) | 1,879 (9.3%) |
| $1,000 to $1,499 | 1,042 (9.6%) | 7,708 (38.2%) |
| $1,500 to $1,999 | 1,617 (14.9%) | 5,292 (26.2%) |
| $2,000 to $2,499 | 1,724 (15.9%) | 1,847 (9.1%) |
| $2,500 to $2,999 | 1,011 (9.3%) | 433 (2.1%) |
| $3,000 or more | 1,428 (13.2%) | 214 (1.1%) |
| Total | 10,822 (100.0%) | 20,191 (100.0%) |
Physical Housing Characteristics in East Los Angeles
Housing Structures in East Los Angeles
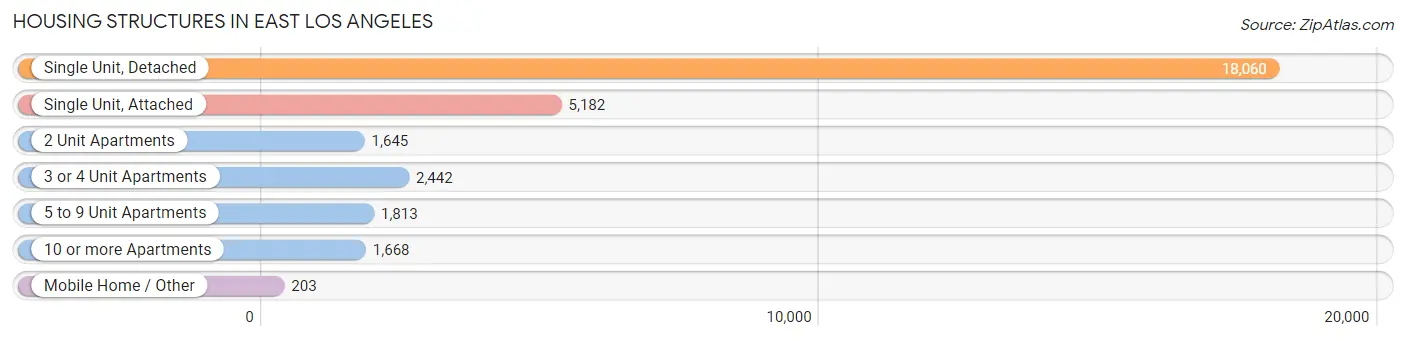
| Structure Type | # Housing Units | % Housing Units |
| Single Unit, Detached | 18,060 | 58.2% |
| Single Unit, Attached | 5,182 | 16.7% |
| 2 Unit Apartments | 1,645 | 5.3% |
| 3 or 4 Unit Apartments | 2,442 | 7.9% |
| 5 to 9 Unit Apartments | 1,813 | 5.9% |
| 10 or more Apartments | 1,668 | 5.4% |
| Mobile Home / Other | 203 | 0.6% |
| Total | 31,013 | 100.0% |
Housing Structures by Occupancy in East Los Angeles
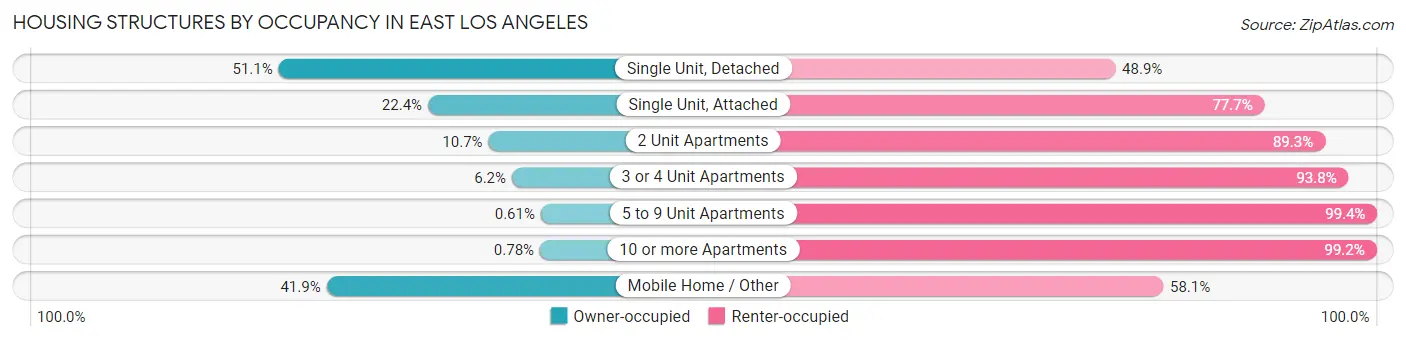
| Structure Type | Owner-occupied | Renter-occupied |
| Single Unit, Detached | 9,228 (51.1%) | 8,832 (48.9%) |
| Single Unit, Attached | 1,158 (22.4%) | 4,024 (77.6%) |
| 2 Unit Apartments | 176 (10.7%) | 1,469 (89.3%) |
| 3 or 4 Unit Apartments | 151 (6.2%) | 2,291 (93.8%) |
| 5 to 9 Unit Apartments | 11 (0.6%) | 1,802 (99.4%) |
| 10 or more Apartments | 13 (0.8%) | 1,655 (99.2%) |
| Mobile Home / Other | 85 (41.9%) | 118 (58.1%) |
| Total | 10,822 (34.9%) | 20,191 (65.1%) |
Housing Structures by Number of Rooms in East Los Angeles
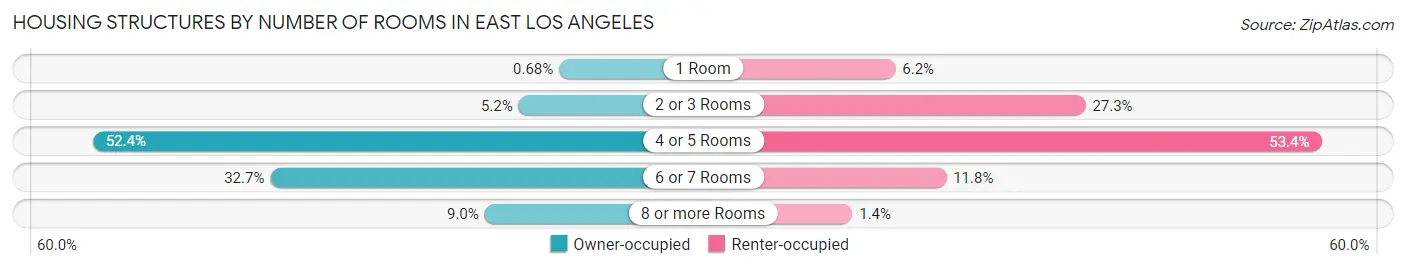
| Number of Rooms | Owner-occupied | Renter-occupied |
| 1 Room | 74 (0.7%) | 1,241 (6.1%) |
| 2 or 3 Rooms | 561 (5.2%) | 5,503 (27.3%) |
| 4 or 5 Rooms | 5,675 (52.4%) | 10,787 (53.4%) |
| 6 or 7 Rooms | 3,543 (32.7%) | 2,383 (11.8%) |
| 8 or more Rooms | 969 (8.9%) | 277 (1.4%) |
| Total | 10,822 (100.0%) | 20,191 (100.0%) |
Housing Structure by Heating Type in East Los Angeles
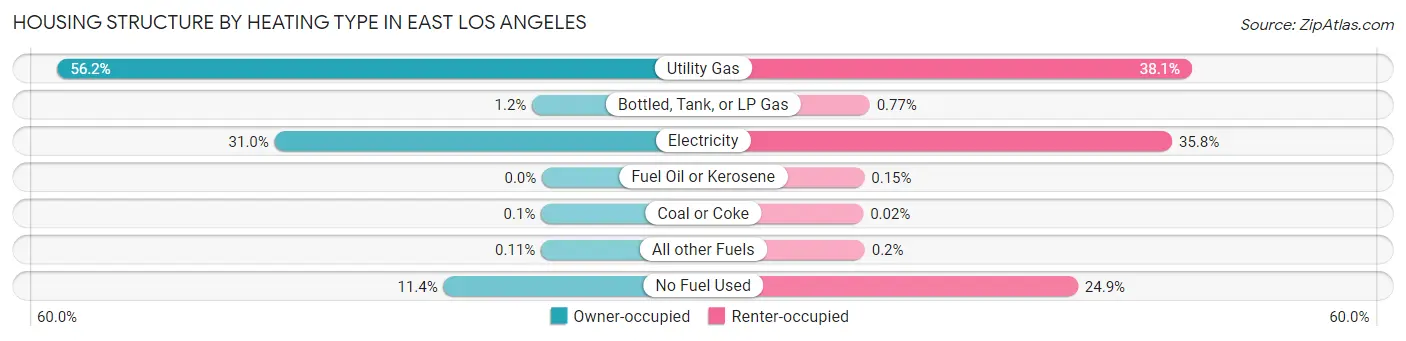
| Heating Type | Owner-occupied | Renter-occupied |
| Utility Gas | 6,082 (56.2%) | 7,697 (38.1%) |
| Bottled, Tank, or LP Gas | 124 (1.1%) | 155 (0.8%) |
| Electricity | 3,356 (31.0%) | 7,234 (35.8%) |
| Fuel Oil or Kerosene | 0 (0.0%) | 31 (0.2%) |
| Coal or Coke | 11 (0.1%) | 5 (0.0%) |
| All other Fuels | 12 (0.1%) | 40 (0.2%) |
| No Fuel Used | 1,237 (11.4%) | 5,029 (24.9%) |
| Total | 10,822 (100.0%) | 20,191 (100.0%) |
Household Vehicle Usage in East Los Angeles
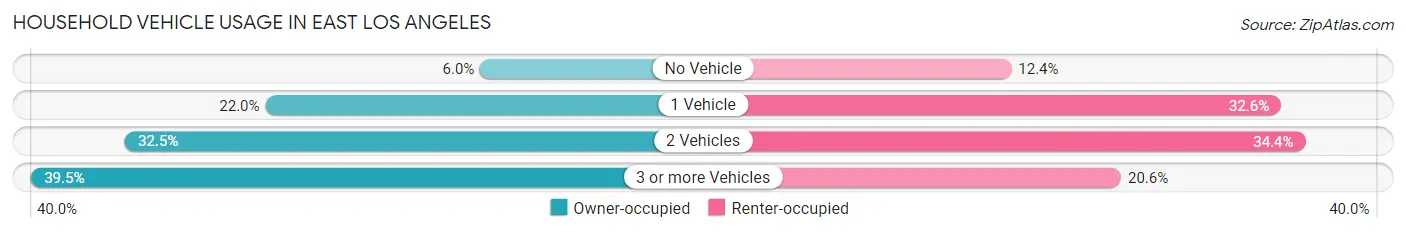
| Vehicles per Household | Owner-occupied | Renter-occupied |
| No Vehicle | 647 (6.0%) | 2,509 (12.4%) |
| 1 Vehicle | 2,383 (22.0%) | 6,576 (32.6%) |
| 2 Vehicles | 3,517 (32.5%) | 6,942 (34.4%) |
| 3 or more Vehicles | 4,275 (39.5%) | 4,164 (20.6%) |
| Total | 10,822 (100.0%) | 20,191 (100.0%) |
Real Estate & Mortgages in East Los Angeles
Real Estate and Mortgage Overview in East Los Angeles
| Characteristic | Without Mortgage | With Mortgage |
| Housing Units | 4,005 | 6,817 |
| Median Property Value | $545,200 | $598,900 |
| Median Household Income | $63,285 | $1,623 |
| Monthly Housing Costs | $510 | $1,420 |
| Real Estate Taxes | $3,181 | $157 |
Property Value by Mortgage Status in East Los Angeles
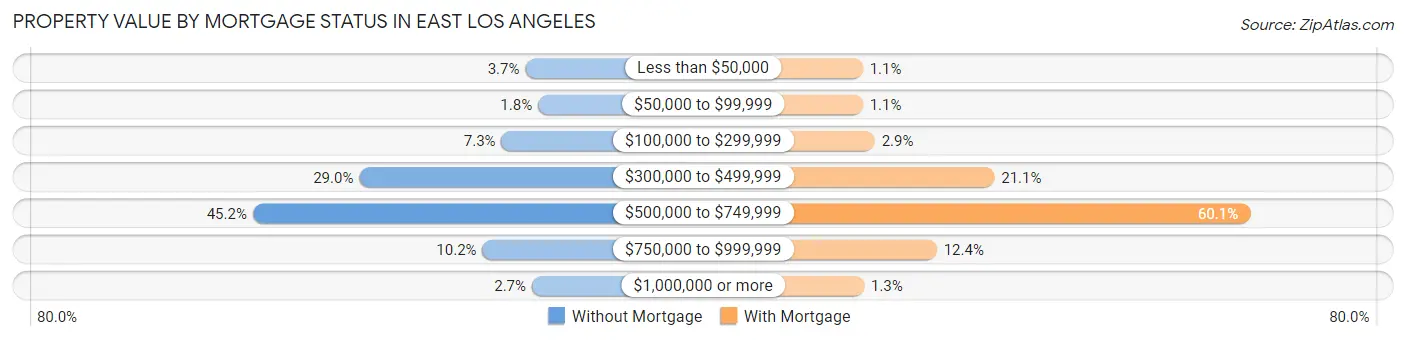
| Property Value | Without Mortgage | With Mortgage |
| Less than $50,000 | 148 (3.7%) | 74 (1.1%) |
| $50,000 to $99,999 | 71 (1.8%) | 74 (1.1%) |
| $100,000 to $299,999 | 294 (7.3%) | 199 (2.9%) |
| $300,000 to $499,999 | 1,162 (29.0%) | 1,441 (21.1%) |
| $500,000 to $749,999 | 1,812 (45.2%) | 4,098 (60.1%) |
| $750,000 to $999,999 | 410 (10.2%) | 843 (12.4%) |
| $1,000,000 or more | 108 (2.7%) | 88 (1.3%) |
| Total | 4,005 (100.0%) | 6,817 (100.0%) |
Household Income by Mortgage Status in East Los Angeles
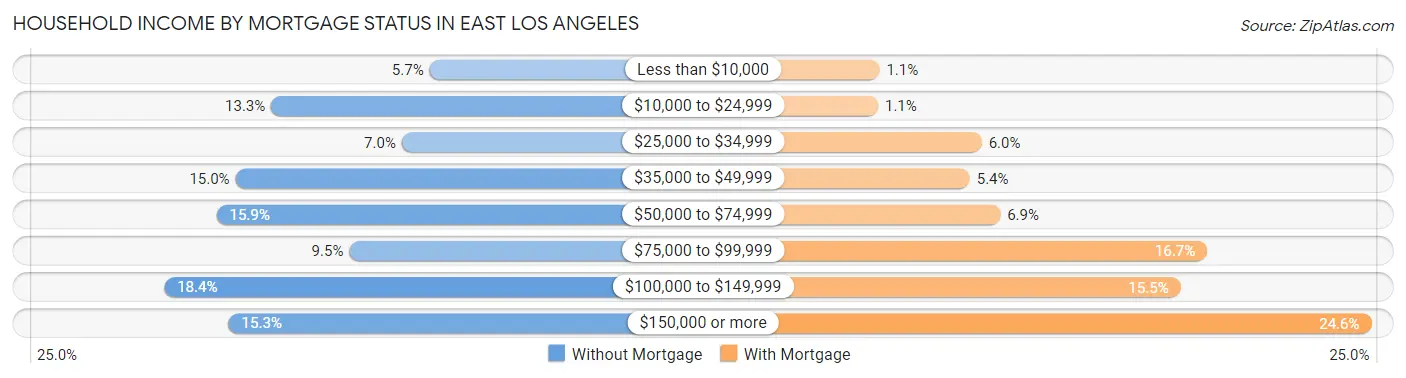
| Household Income | Without Mortgage | With Mortgage |
| Less than $10,000 | 229 (5.7%) | 78 (1.1%) |
| $10,000 to $24,999 | 531 (13.3%) | 73 (1.1%) |
| $25,000 to $34,999 | 282 (7.0%) | 410 (6.0%) |
| $35,000 to $49,999 | 599 (15.0%) | 371 (5.4%) |
| $50,000 to $74,999 | 635 (15.9%) | 470 (6.9%) |
| $75,000 to $99,999 | 382 (9.5%) | 1,141 (16.7%) |
| $100,000 to $149,999 | 735 (18.3%) | 1,055 (15.5%) |
| $150,000 or more | 612 (15.3%) | 1,674 (24.6%) |
| Total | 4,005 (100.0%) | 6,817 (100.0%) |
Property Value to Household Income Ratio in East Los Angeles
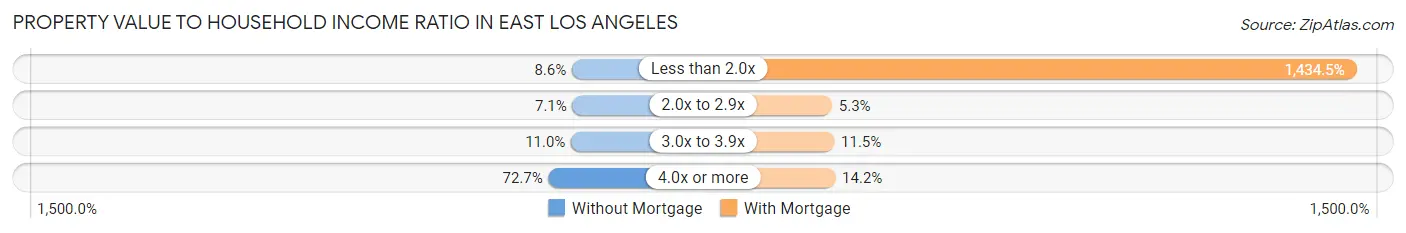
| Value-to-Income Ratio | Without Mortgage | With Mortgage |
| Less than 2.0x | 344 (8.6%) | 97,788 (1,434.5%) |
| 2.0x to 2.9x | 285 (7.1%) | 364 (5.3%) |
| 3.0x to 3.9x | 440 (11.0%) | 782 (11.5%) |
| 4.0x or more | 2,912 (72.7%) | 969 (14.2%) |
| Total | 4,005 (100.0%) | 6,817 (100.0%) |
Real Estate Taxes by Mortgage Status in East Los Angeles
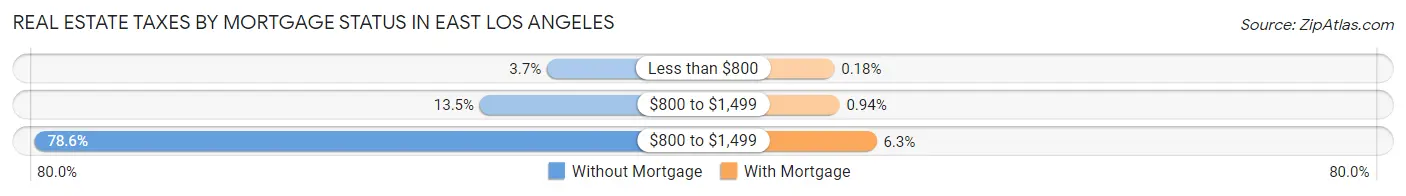
| Property Taxes | Without Mortgage | With Mortgage |
| Less than $800 | 147 (3.7%) | 12 (0.2%) |
| $800 to $1,499 | 540 (13.5%) | 64 (0.9%) |
| $800 to $1,499 | 3,146 (78.5%) | 432 (6.3%) |
| Total | 4,005 (100.0%) | 6,817 (100.0%) |
Health & Disability in East Los Angeles
Health Insurance Coverage by Age in East Los Angeles
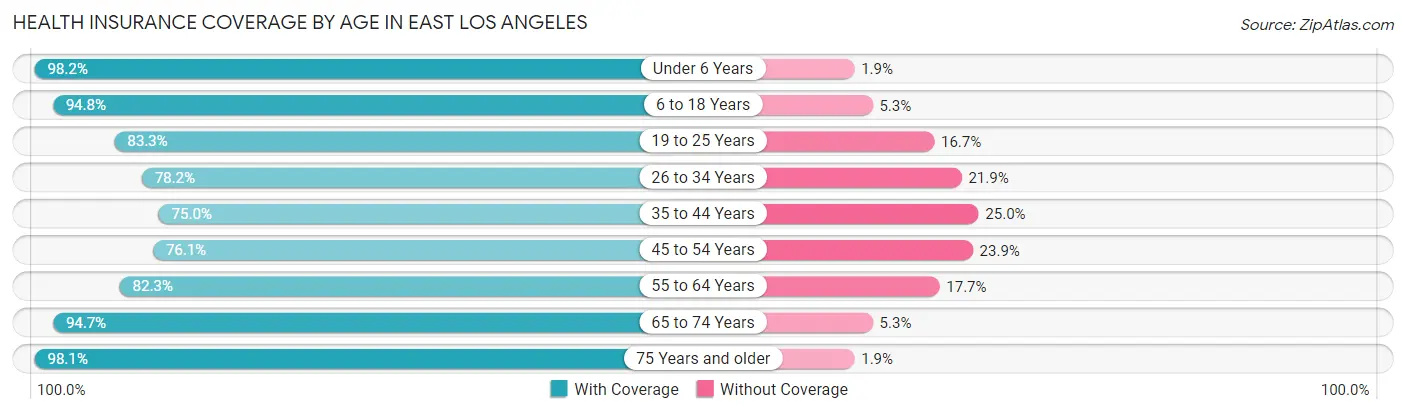
| Age Bracket | With Coverage | Without Coverage |
| Under 6 Years | 7,653 (98.2%) | 144 (1.8%) |
| 6 to 18 Years | 21,396 (94.8%) | 1,185 (5.2%) |
| 19 to 25 Years | 11,446 (83.3%) | 2,302 (16.7%) |
| 26 to 34 Years | 13,351 (78.1%) | 3,733 (21.8%) |
| 35 to 44 Years | 11,706 (75.0%) | 3,904 (25.0%) |
| 45 to 54 Years | 11,697 (76.1%) | 3,682 (23.9%) |
| 55 to 64 Years | 10,106 (82.3%) | 2,178 (17.7%) |
| 65 to 74 Years | 6,878 (94.7%) | 384 (5.3%) |
| 75 Years and older | 5,212 (98.1%) | 99 (1.9%) |
| Total | 99,445 (85.0%) | 17,611 (15.0%) |
Health Insurance Coverage by Citizenship Status in East Los Angeles
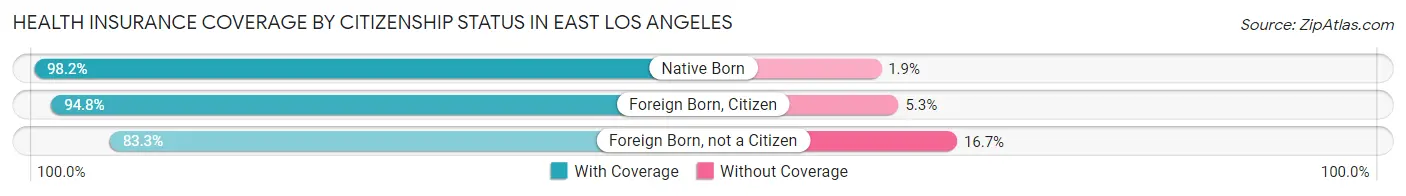
| Citizenship Status | With Coverage | Without Coverage |
| Native Born | 7,653 (98.2%) | 144 (1.8%) |
| Foreign Born, Citizen | 21,396 (94.8%) | 1,185 (5.2%) |
| Foreign Born, not a Citizen | 11,446 (83.3%) | 2,302 (16.7%) |
Health Insurance Coverage by Household Income in East Los Angeles
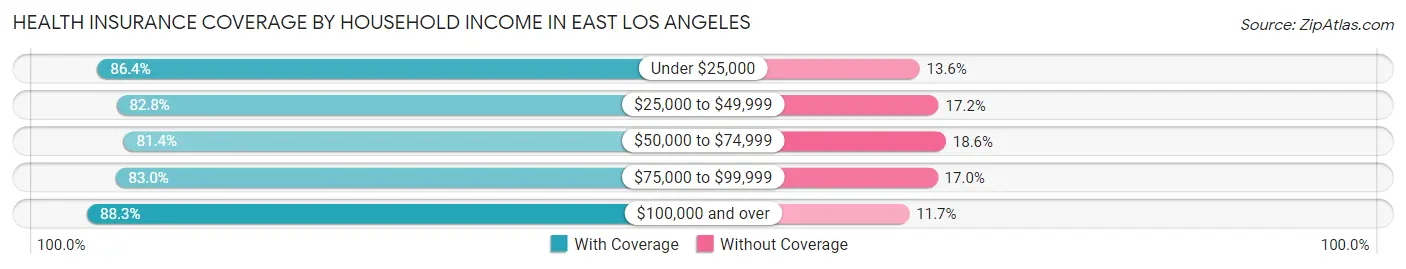
| Household Income | With Coverage | Without Coverage |
| Under $25,000 | 11,743 (86.4%) | 1,854 (13.6%) |
| $25,000 to $49,999 | 17,974 (82.8%) | 3,736 (17.2%) |
| $50,000 to $74,999 | 18,907 (81.4%) | 4,310 (18.6%) |
| $75,000 to $99,999 | 13,296 (83.0%) | 2,727 (17.0%) |
| $100,000 and over | 37,475 (88.3%) | 4,977 (11.7%) |
Public vs Private Health Insurance Coverage by Age in East Los Angeles

| Age Bracket | Public Insurance | Private Insurance |
| Under 6 | 5,798 (74.4%) | 2,050 (26.3%) |
| 6 to 18 Years | 15,114 (66.9%) | 6,880 (30.5%) |
| 19 to 25 Years | 5,684 (41.3%) | 5,953 (43.3%) |
| 25 to 34 Years | 5,994 (35.1%) | 7,598 (44.5%) |
| 35 to 44 Years | 4,562 (29.2%) | 7,328 (46.9%) |
| 45 to 54 Years | 4,835 (31.4%) | 7,111 (46.2%) |
| 55 to 64 Years | 5,292 (43.1%) | 5,031 (41.0%) |
| 65 to 74 Years | 6,307 (86.9%) | 1,510 (20.8%) |
| 75 Years and over | 5,175 (97.4%) | 853 (16.1%) |
| Total | 58,761 (50.2%) | 44,314 (37.9%) |
Disability Status by Sex by Age in East Los Angeles
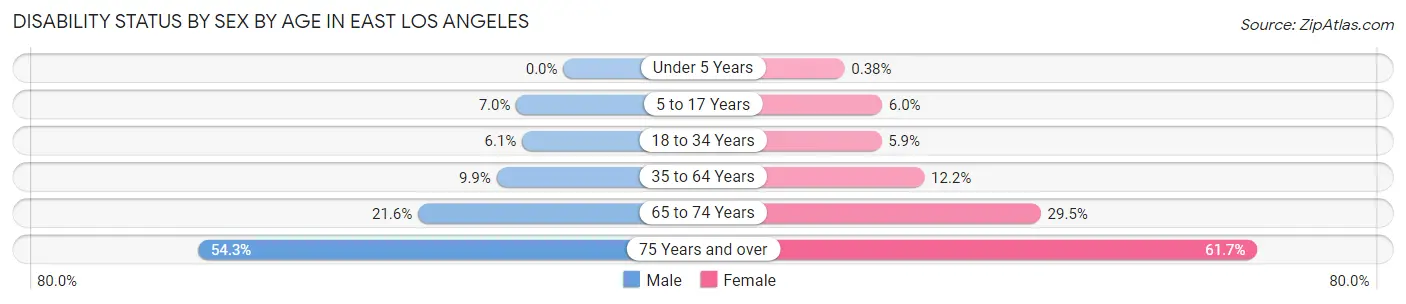
| Age Bracket | Male | Female |
| Under 5 Years | 0 (0.0%) | 10 (0.4%) |
| 5 to 17 Years | 807 (7.0%) | 654 (5.9%) |
| 18 to 34 Years | 1,038 (6.1%) | 903 (5.9%) |
| 35 to 64 Years | 2,188 (9.9%) | 2,591 (12.2%) |
| 65 to 74 Years | 728 (21.6%) | 1,148 (29.5%) |
| 75 Years and over | 1,122 (54.3%) | 2,001 (61.7%) |
Disability Class by Sex by Age in East Los Angeles
Disability Class: Hearing Difficulty
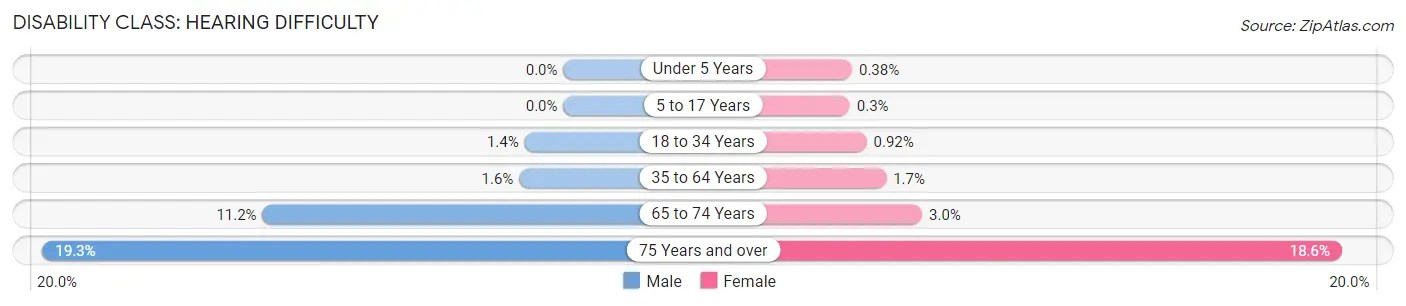
| Age Bracket | Male | Female |
| Under 5 Years | 0 (0.0%) | 10 (0.4%) |
| 5 to 17 Years | 0 (0.0%) | 33 (0.3%) |
| 18 to 34 Years | 244 (1.4%) | 141 (0.9%) |
| 35 to 64 Years | 362 (1.6%) | 350 (1.7%) |
| 65 to 74 Years | 377 (11.2%) | 116 (3.0%) |
| 75 Years and over | 400 (19.3%) | 602 (18.6%) |
Disability Class: Vision Difficulty
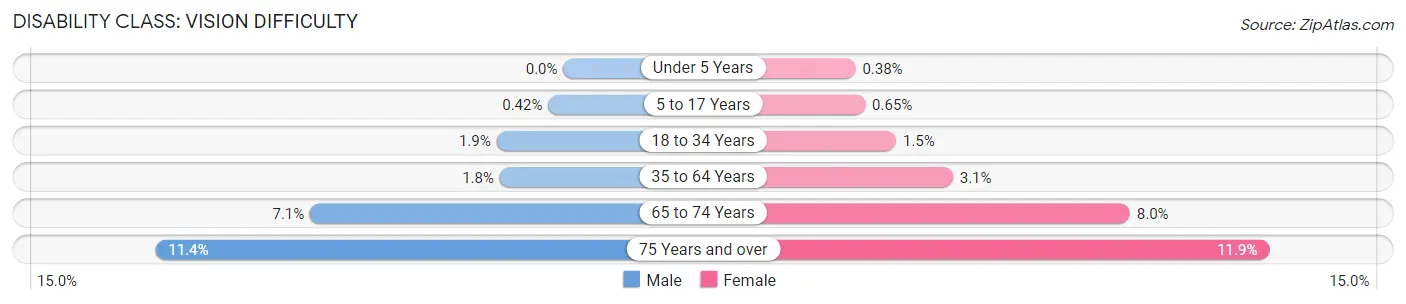
| Age Bracket | Male | Female |
| Under 5 Years | 0 (0.0%) | 10 (0.4%) |
| 5 to 17 Years | 48 (0.4%) | 71 (0.6%) |
| 18 to 34 Years | 316 (1.9%) | 233 (1.5%) |
| 35 to 64 Years | 390 (1.8%) | 655 (3.1%) |
| 65 to 74 Years | 238 (7.0%) | 312 (8.0%) |
| 75 Years and over | 235 (11.4%) | 386 (11.9%) |
Disability Class: Cognitive Difficulty
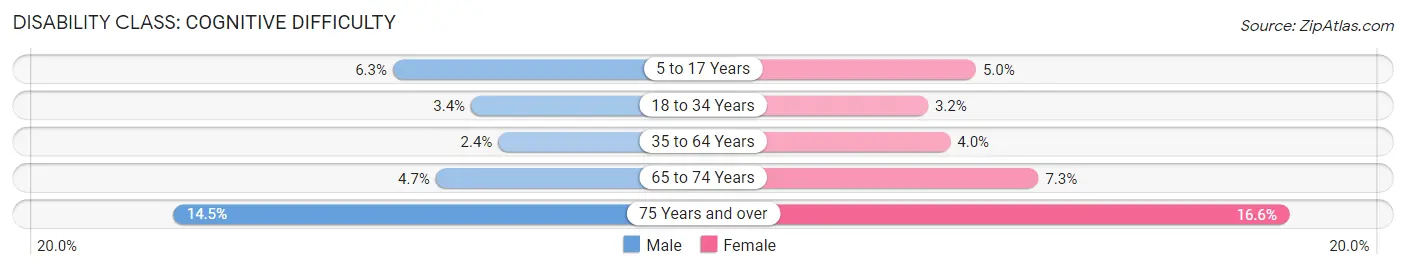
| Age Bracket | Male | Female |
| 5 to 17 Years | 731 (6.3%) | 548 (5.0%) |
| 18 to 34 Years | 583 (3.4%) | 493 (3.2%) |
| 35 to 64 Years | 534 (2.4%) | 855 (4.0%) |
| 65 to 74 Years | 160 (4.7%) | 284 (7.3%) |
| 75 Years and over | 299 (14.5%) | 538 (16.6%) |
Disability Class: Ambulatory Difficulty
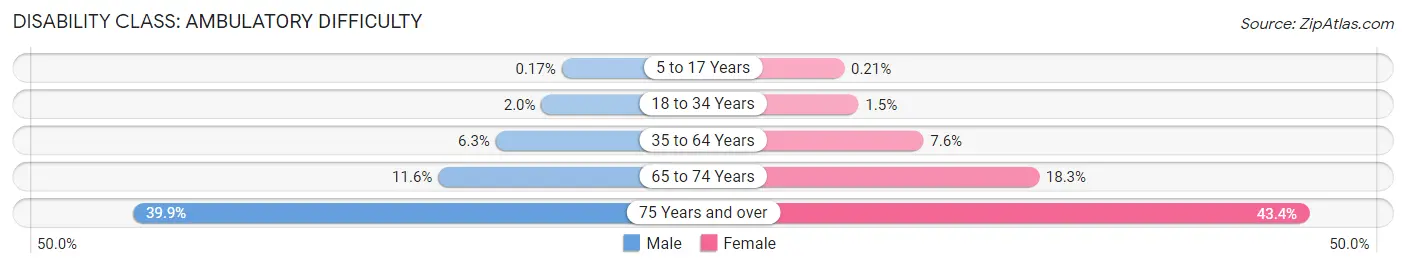
| Age Bracket | Male | Female |
| 5 to 17 Years | 20 (0.2%) | 23 (0.2%) |
| 18 to 34 Years | 346 (2.0%) | 237 (1.5%) |
| 35 to 64 Years | 1,386 (6.3%) | 1,605 (7.6%) |
| 65 to 74 Years | 392 (11.6%) | 711 (18.3%) |
| 75 Years and over | 826 (39.9%) | 1,406 (43.3%) |
Disability Class: Self-Care Difficulty
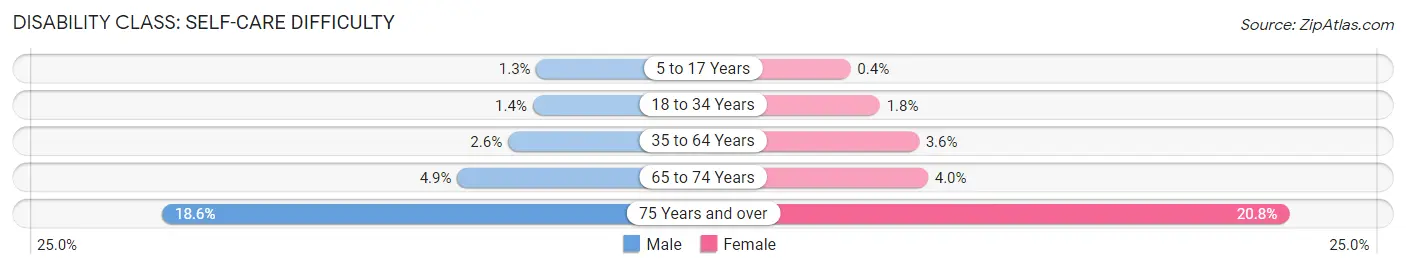
| Age Bracket | Male | Female |
| 5 to 17 Years | 144 (1.3%) | 44 (0.4%) |
| 18 to 34 Years | 242 (1.4%) | 271 (1.8%) |
| 35 to 64 Years | 567 (2.6%) | 757 (3.6%) |
| 65 to 74 Years | 166 (4.9%) | 155 (4.0%) |
| 75 Years and over | 385 (18.6%) | 673 (20.7%) |
Technology Access in East Los Angeles
Computing Device Access in East Los Angeles
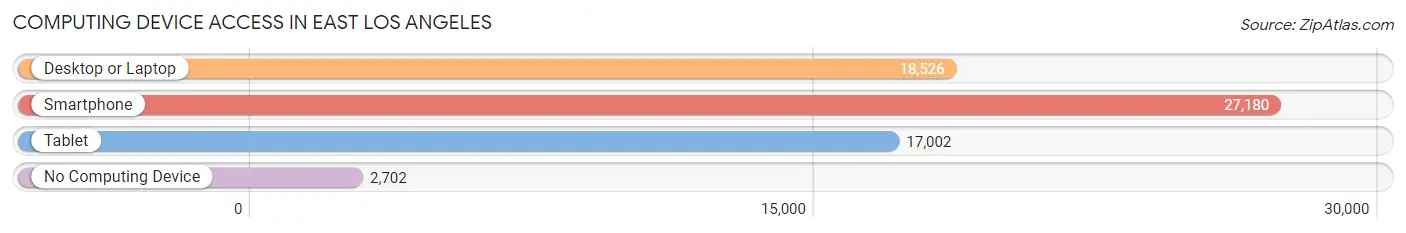
| Device Type | # Households | % Households |
| Desktop or Laptop | 18,526 | 59.7% |
| Smartphone | 27,180 | 87.6% |
| Tablet | 17,002 | 54.8% |
| No Computing Device | 2,702 | 8.7% |
| Total | 31,013 | 100.0% |
Internet Access in East Los Angeles
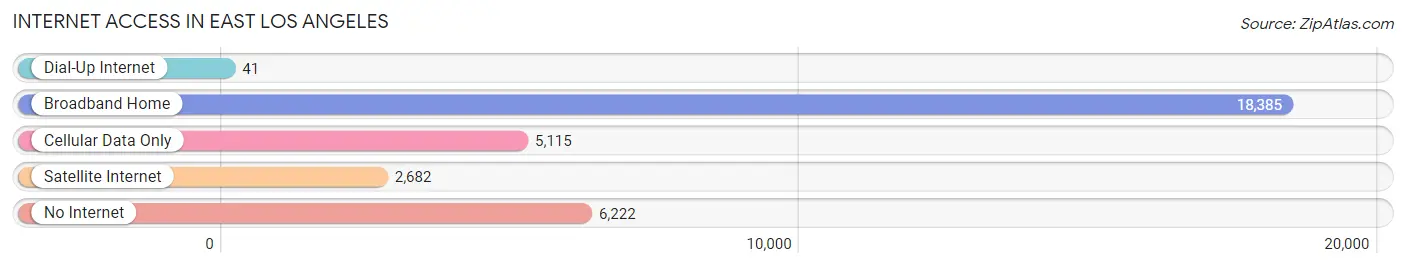
| Internet Type | # Households | % Households |
| Dial-Up Internet | 41 | 0.1% |
| Broadband Home | 18,385 | 59.3% |
| Cellular Data Only | 5,115 | 16.5% |
| Satellite Internet | 2,682 | 8.6% |
| No Internet | 6,222 | 20.1% |
| Total | 31,013 | 100.0% |
East Los Angeles Summary
Los Angeles is the second largest city in the United States and is located in the state of California. East Los Angeles is a neighborhood located within the city of Los Angeles and is the largest predominantly Latino community in the United States. East Los Angeles is located east of downtown Los Angeles and is bordered by the cities of Montebello, Commerce, and Monterey Park. The area is known for its vibrant culture, diverse population, and strong sense of community.
History
East Los Angeles has a long and rich history that dates back to the late 19th century. The area was originally inhabited by the Tongva people, who were the original inhabitants of the Los Angeles basin. In the late 1800s, the area was settled by Mexican immigrants who were attracted to the area by the availability of jobs in the growing city of Los Angeles. The area was officially incorporated as the City of East Los Angeles in 1896.
In the early 20th century, East Los Angeles became a hub for Mexican-American culture and was home to a vibrant music scene. The area was also home to a large number of Mexican-American businesses, including restaurants, grocery stores, and other small businesses.
In the 1950s, East Los Angeles experienced a period of rapid growth and development. The area was home to a large number of new immigrants from Mexico and Central America, as well as a growing African-American population. This influx of new residents led to the development of a vibrant and diverse culture in East Los Angeles.
Geography
East Los Angeles is located in the eastern part of the city of Los Angeles. The area is bordered by the cities of Montebello, Commerce, and Monterey Park. The area is approximately 7.5 square miles in size and is home to a population of over 125,000 people.
The area is characterized by its flat terrain and is located in the Los Angeles Basin. The area is also home to several parks, including the East Los Angeles Community Park, which is the largest park in the area.
Economy
East Los Angeles is home to a diverse and vibrant economy. The area is home to a large number of small businesses, including restaurants, grocery stores, and other retail establishments. The area is also home to a number of manufacturing and industrial businesses, including food processing plants and auto repair shops.
The area is also home to a number of educational institutions, including East Los Angeles College and the University of Southern California. The area is also home to a number of healthcare facilities, including the East Los Angeles Medical Center.
Demographics
East Los Angeles is home to a diverse population. The area is predominantly Latino, with over 90% of the population identifying as Hispanic or Latino. The area is also home to a large number of immigrants from Mexico and Central America. The area is also home to a growing African-American population, as well as a small Asian-American population.
The median household income in East Los Angeles is approximately $35,000, which is significantly lower than the median household income for the city of Los Angeles. The area also has a higher poverty rate than the city of Los Angeles, with over 25% of the population living below the poverty line.
Conclusion
East Los Angeles is a vibrant and diverse community located in the eastern part of the city of Los Angeles. The area has a long and rich history and is home to a diverse population. The area is home to a vibrant economy and is home to a number of small businesses, educational institutions, and healthcare facilities. The area is also home to a large number of immigrants from Mexico and Central America, as well as a growing African-American population. The area has a median household income that is significantly lower than the city of Los Angeles and a higher poverty rate.
Common Questions
What is Per Capita Income in East Los Angeles?
Per Capita income in East Los Angeles is $21,650.
What is the Median Family Income in East Los Angeles?
Median Family Income in East Los Angeles is $67,096.
What is the Median Household income in East Los Angeles?
Median Household Income in East Los Angeles is $64,119.
What is Income or Wage Gap in East Los Angeles?
Income or Wage Gap in East Los Angeles is 22.1%.
Women in East Los Angeles earn 77.9 cents for every dollar earned by a man.
What is Family Income Deficit in East Los Angeles?
Family Income Deficit in East Los Angeles is $11,093.
Families that are below poverty line in East Los Angeles earn $11,093 less on average than the poverty threshold level.
What is Inequality or Gini Index in East Los Angeles?
Inequality or Gini Index in East Los Angeles is 0.42.
What is the Total Population of East Los Angeles?
Total Population of East Los Angeles is 117,222.
What is the Total Male Population of East Los Angeles?
Total Male Population of East Los Angeles is 59,807.
What is the Total Female Population of East Los Angeles?
Total Female Population of East Los Angeles is 57,415.
What is the Ratio of Males per 100 Females in East Los Angeles?
There are 104.17 Males per 100 Females in East Los Angeles.
What is the Ratio of Females per 100 Males in East Los Angeles?
There are 96.00 Females per 100 Males in East Los Angeles.
What is the Median Population Age in East Los Angeles?
Median Population Age in East Los Angeles is 33.2 Years.
What is the Average Family Size in East Los Angeles
Average Family Size in East Los Angeles is 4.1 People.
What is the Average Household Size in East Los Angeles
Average Household Size in East Los Angeles is 3.8 People.
How Large is the Labor Force in East Los Angeles?
There are 58,170 People in the Labor Forcein in East Los Angeles.
What is the Percentage of People in the Labor Force in East Los Angeles?
62.8% of People are in the Labor Force in East Los Angeles.
What is the Unemployment Rate in East Los Angeles?
Unemployment Rate in East Los Angeles is 6.3%.