Cities with the Highest Percentage of Central American Population in New York
RELATED REPORTS & OPTIONS
Central American
New York
Compare Cities
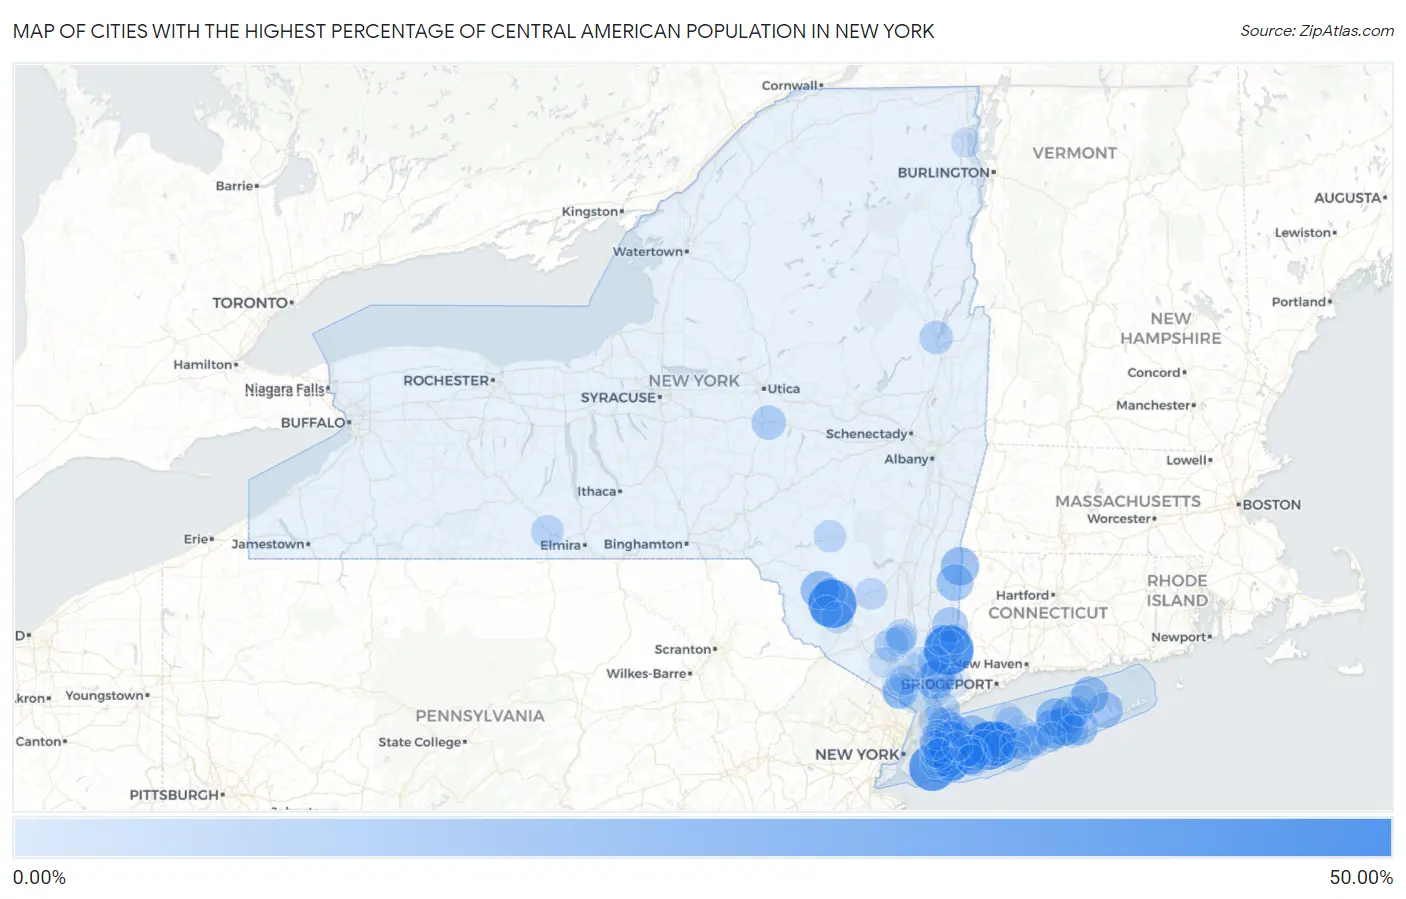
Map of Cities with the Highest Percentage of Central American Population in New York
0.00%
50.00%
Cities with the Highest Percentage of Central American Population in New York
| City | Central American | vs State | vs National | |
| 1. | Brewster | 40.78% | 2.17%(+38.6)#1 | 1.81%(+39.0)#21 |
| 2. | South Fallsburg | 38.08% | 2.17%(+35.9)#2 | 1.81%(+36.3)#28 |
| 3. | New Cassel | 36.64% | 2.17%(+34.5)#3 | 1.81%(+34.8)#32 |
| 4. | North Bay Shore | 36.55% | 2.17%(+34.4)#4 | 1.81%(+34.7)#34 |
| 5. | Inwood | 35.89% | 2.17%(+33.7)#5 | 1.81%(+34.1)#37 |
| 6. | Central Islip | 33.26% | 2.17%(+31.1)#6 | 1.81%(+31.4)#48 |
| 7. | Brentwood | 32.30% | 2.17%(+30.1)#7 | 1.81%(+30.5)#52 |
| 8. | Hempstead | 30.29% | 2.17%(+28.1)#8 | 1.81%(+28.5)#64 |
| 9. | Hankins | 30.08% | 2.17%(+27.9)#9 | 1.81%(+28.3)#66 |
| 10. | Roosevelt | 28.66% | 2.17%(+26.5)#10 | 1.81%(+26.8)#70 |
| 11. | Uniondale | 25.60% | 2.17%(+23.4)#11 | 1.81%(+23.8)#88 |
| 12. | Northampton | 21.14% | 2.17%(+19.0)#12 | 1.81%(+19.3)#126 |
| 13. | Flanders | 20.95% | 2.17%(+18.8)#13 | 1.81%(+19.1)#129 |
| 14. | Millerton | 19.95% | 2.17%(+17.8)#14 | 1.81%(+18.1)#141 |
| 15. | Liberty | 19.92% | 2.17%(+17.8)#15 | 1.81%(+18.1)#142 |
| 16. | North Amityville | 19.71% | 2.17%(+17.5)#16 | 1.81%(+17.9)#146 |
| 17. | Riverhead | 19.70% | 2.17%(+17.5)#17 | 1.81%(+17.9)#148 |
| 18. | Mount Kisco | 19.33% | 2.17%(+17.2)#18 | 1.81%(+17.5)#158 |
| 19. | Wyandanch | 19.10% | 2.17%(+16.9)#19 | 1.81%(+17.3)#161 |
| 20. | Laurel | 17.65% | 2.17%(+15.5)#20 | 1.81%(+15.8)#188 |
| 21. | Greenport | 17.52% | 2.17%(+15.4)#21 | 1.81%(+15.7)#189 |
| 22. | Huntington Station | 17.16% | 2.17%(+15.0)#22 | 1.81%(+15.3)#194 |
| 23. | Amenia | 16.85% | 2.17%(+14.7)#23 | 1.81%(+15.0)#200 |
| 24. | Freeport | 16.21% | 2.17%(+14.0)#24 | 1.81%(+14.4)#209 |
| 25. | Glen Cove | 15.75% | 2.17%(+13.6)#25 | 1.81%(+13.9)#220 |
| 26. | North Bellport | 15.73% | 2.17%(+13.6)#26 | 1.81%(+13.9)#222 |
| 27. | Shinnecock Hills | 15.32% | 2.17%(+13.1)#27 | 1.81%(+13.5)#234 |
| 28. | Northwest Harbor | 15.22% | 2.17%(+13.1)#28 | 1.81%(+13.4)#239 |
| 29. | Islandia | 15.02% | 2.17%(+12.9)#29 | 1.81%(+13.2)#242 |
| 30. | Hillcrest | 15.00% | 2.17%(+12.8)#30 | 1.81%(+13.2)#243 |
| 31. | Pawling | 14.94% | 2.17%(+12.8)#31 | 1.81%(+13.1)#245 |
| 32. | Bedford Hills | 14.58% | 2.17%(+12.4)#32 | 1.81%(+12.8)#255 |
| 33. | Baywood | 13.56% | 2.17%(+11.4)#33 | 1.81%(+11.7)#285 |
| 34. | Port Chester | 13.13% | 2.17%(+11.0)#34 | 1.81%(+11.3)#298 |
| 35. | Westbury | 12.93% | 2.17%(+10.8)#35 | 1.81%(+11.1)#311 |
| 36. | West Winfield | 12.57% | 2.17%(+10.4)#36 | 1.81%(+10.8)#326 |
| 37. | Salisbury Mills | 11.81% | 2.17%(+9.64)#37 | 1.81%(+9.99)#355 |
| 38. | North Lynbrook | 11.06% | 2.17%(+8.90)#38 | 1.81%(+9.25)#382 |
| 39. | Lake George | 10.92% | 2.17%(+8.76)#39 | 1.81%(+9.11)#389 |
| 40. | Brewster Heights | 10.70% | 2.17%(+8.53)#40 | 1.81%(+8.88)#403 |
| 41. | Locust Valley | 9.91% | 2.17%(+7.75)#41 | 1.81%(+8.10)#440 |
| 42. | Copiague | 9.74% | 2.17%(+7.58)#42 | 1.81%(+7.93)#449 |
| 43. | Mamaroneck | 9.62% | 2.17%(+7.45)#43 | 1.81%(+7.81)#459 |
| 44. | Mastic | 9.59% | 2.17%(+7.43)#44 | 1.81%(+7.78)#461 |
| 45. | Hampton Bays | 9.40% | 2.17%(+7.23)#45 | 1.81%(+7.59)#474 |
| 46. | Loch Sheldrake | 9.37% | 2.17%(+7.20)#46 | 1.81%(+7.55)#477 |
| 47. | Brewster Hill | 9.31% | 2.17%(+7.14)#47 | 1.81%(+7.49)#482 |
| 48. | Coopers Plains | 9.26% | 2.17%(+7.09)#48 | 1.81%(+7.45)#485 |
| 49. | Margaretville | 8.84% | 2.17%(+6.68)#49 | 1.81%(+7.03)#516 |
| 50. | Rock Hill | 8.43% | 2.17%(+6.26)#50 | 1.81%(+6.62)#547 |
| 51. | Newburgh | 8.21% | 2.17%(+6.05)#51 | 1.81%(+6.40)#565 |
| 52. | Kerhonkson | 8.15% | 2.17%(+5.98)#52 | 1.81%(+6.33)#572 |
| 53. | Grahamsville | 7.96% | 2.17%(+5.80)#53 | 1.81%(+6.15)#594 |
| 54. | North Lindenhurst | 7.92% | 2.17%(+5.76)#54 | 1.81%(+6.11)#601 |
| 55. | Elmont | 7.89% | 2.17%(+5.72)#55 | 1.81%(+6.07)#607 |
| 56. | Gordon Heights | 7.77% | 2.17%(+5.60)#56 | 1.81%(+5.96)#617 |
| 57. | Great Neck | 7.75% | 2.17%(+5.58)#57 | 1.81%(+5.94)#621 |
| 58. | Port Jefferson Station | 7.70% | 2.17%(+5.53)#58 | 1.81%(+5.89)#628 |
| 59. | Shrub Oak | 7.69% | 2.17%(+5.53)#59 | 1.81%(+5.88)#629 |
| 60. | Spring Valley | 7.54% | 2.17%(+5.37)#60 | 1.81%(+5.73)#654 |
| 61. | Shenorock | 7.43% | 2.17%(+5.27)#61 | 1.81%(+5.62)#665 |
| 62. | South Valley Stream | 7.40% | 2.17%(+5.23)#62 | 1.81%(+5.58)#669 |
| 63. | Old Brookville | 7.31% | 2.17%(+5.14)#63 | 1.81%(+5.49)#685 |
| 64. | Salisbury | 7.26% | 2.17%(+5.10)#64 | 1.81%(+5.45)#690 |
| 65. | East Farmingdale | 7.18% | 2.17%(+5.02)#65 | 1.81%(+5.37)#696 |
| 66. | Mount Ivy | 7.18% | 2.17%(+5.01)#66 | 1.81%(+5.37)#697 |
| 67. | Wurtsboro Hills | 7.06% | 2.17%(+4.90)#67 | 1.81%(+5.25)#708 |
| 68. | Lake Carmel | 7.00% | 2.17%(+4.83)#68 | 1.81%(+5.18)#718 |
| 69. | New Suffolk | 6.89% | 2.17%(+4.72)#69 | 1.81%(+5.07)#739 |
| 70. | Shirley | 6.74% | 2.17%(+4.58)#70 | 1.81%(+4.93)#765 |
| 71. | North Great River | 6.71% | 2.17%(+4.55)#71 | 1.81%(+4.90)#772 |
| 72. | West Hempstead | 6.68% | 2.17%(+4.51)#72 | 1.81%(+4.87)#781 |
| 73. | Vails Gate | 6.66% | 2.17%(+4.50)#73 | 1.81%(+4.85)#786 |
| 74. | Monticello | 6.42% | 2.17%(+4.26)#74 | 1.81%(+4.61)#816 |
| 75. | Nyack | 6.38% | 2.17%(+4.21)#75 | 1.81%(+4.56)#820 |
| 76. | North Patchogue | 6.03% | 2.17%(+3.86)#76 | 1.81%(+4.21)#882 |
| 77. | New Windsor | 5.99% | 2.17%(+3.82)#77 | 1.81%(+4.17)#887 |
| 78. | Great Neck Plaza | 5.98% | 2.17%(+3.81)#78 | 1.81%(+4.17)#891 |
| 79. | Scotts Corners | 5.97% | 2.17%(+3.80)#79 | 1.81%(+4.15)#893 |
| 80. | Bellerose Terrace | 5.71% | 2.17%(+3.55)#80 | 1.81%(+3.90)#956 |
| 81. | Fire Island | 5.70% | 2.17%(+3.54)#81 | 1.81%(+3.89)#960 |
| 82. | Monroe | 5.65% | 2.17%(+3.48)#82 | 1.81%(+3.83)#971 |
| 83. | Amityville | 5.42% | 2.17%(+3.25)#83 | 1.81%(+3.60)#1,027 |
| 84. | Williston Park | 5.41% | 2.17%(+3.24)#84 | 1.81%(+3.60)#1,029 |
| 85. | Oyster Bay | 5.41% | 2.17%(+3.24)#85 | 1.81%(+3.59)#1,030 |
| 86. | Mountain Dale | 5.38% | 2.17%(+3.22)#86 | 1.81%(+3.57)#1,033 |
| 87. | Manorhaven | 5.27% | 2.17%(+3.10)#87 | 1.81%(+3.45)#1,063 |
| 88. | Parc | 5.26% | 2.17%(+3.10)#88 | 1.81%(+3.45)#1,067 |
| 89. | Farmingdale | 5.19% | 2.17%(+3.02)#89 | 1.81%(+3.37)#1,085 |
| 90. | West Haverstraw | 5.18% | 2.17%(+3.02)#90 | 1.81%(+3.37)#1,086 |
| 91. | Baldwin | 5.15% | 2.17%(+2.99)#91 | 1.81%(+3.34)#1,093 |
| 92. | Southold | 5.12% | 2.17%(+2.95)#92 | 1.81%(+3.31)#1,096 |
| 93. | South Floral Park | 4.98% | 2.17%(+2.81)#93 | 1.81%(+3.17)#1,125 |
| 94. | Peekskill | 4.96% | 2.17%(+2.79)#94 | 1.81%(+3.15)#1,127 |
| 95. | Putnam Lake | 4.89% | 2.17%(+2.72)#95 | 1.81%(+3.07)#1,144 |
| 96. | Poquott | 4.88% | 2.17%(+2.71)#96 | 1.81%(+3.07)#1,146 |
| 97. | Remsenburg Speonk | 4.85% | 2.17%(+2.68)#97 | 1.81%(+3.04)#1,153 |
| 98. | Armonk | 4.84% | 2.17%(+2.68)#98 | 1.81%(+3.03)#1,154 |
| 99. | University Gardens | 4.75% | 2.17%(+2.58)#99 | 1.81%(+2.93)#1,181 |
| 100. | Hicksville | 4.73% | 2.17%(+2.56)#100 | 1.81%(+2.91)#1,187 |
Common Questions
What are the Top 10 Cities with the Highest Percentage of Central American Population in New York?
Top 10 Cities with the Highest Percentage of Central American Population in New York are:
#1
40.78%
#2
38.08%
#3
36.64%
#4
36.55%
#5
35.89%
#6
33.26%
#7
32.30%
#8
30.29%
#9
28.66%
#10
25.60%
What city has the Highest Percentage of Central American Population in New York?
Brewster has the Highest Percentage of Central American Population in New York with 40.78%.
What is the Percentage of Central American Population in the State of New York?
Percentage of Central American Population in New York is 2.17%.
What is the Percentage of Central American Population in the United States?
Percentage of Central American Population in the United States is 1.81%.