Bell Gardens, CA Map & Demographics
Bell Gardens Map
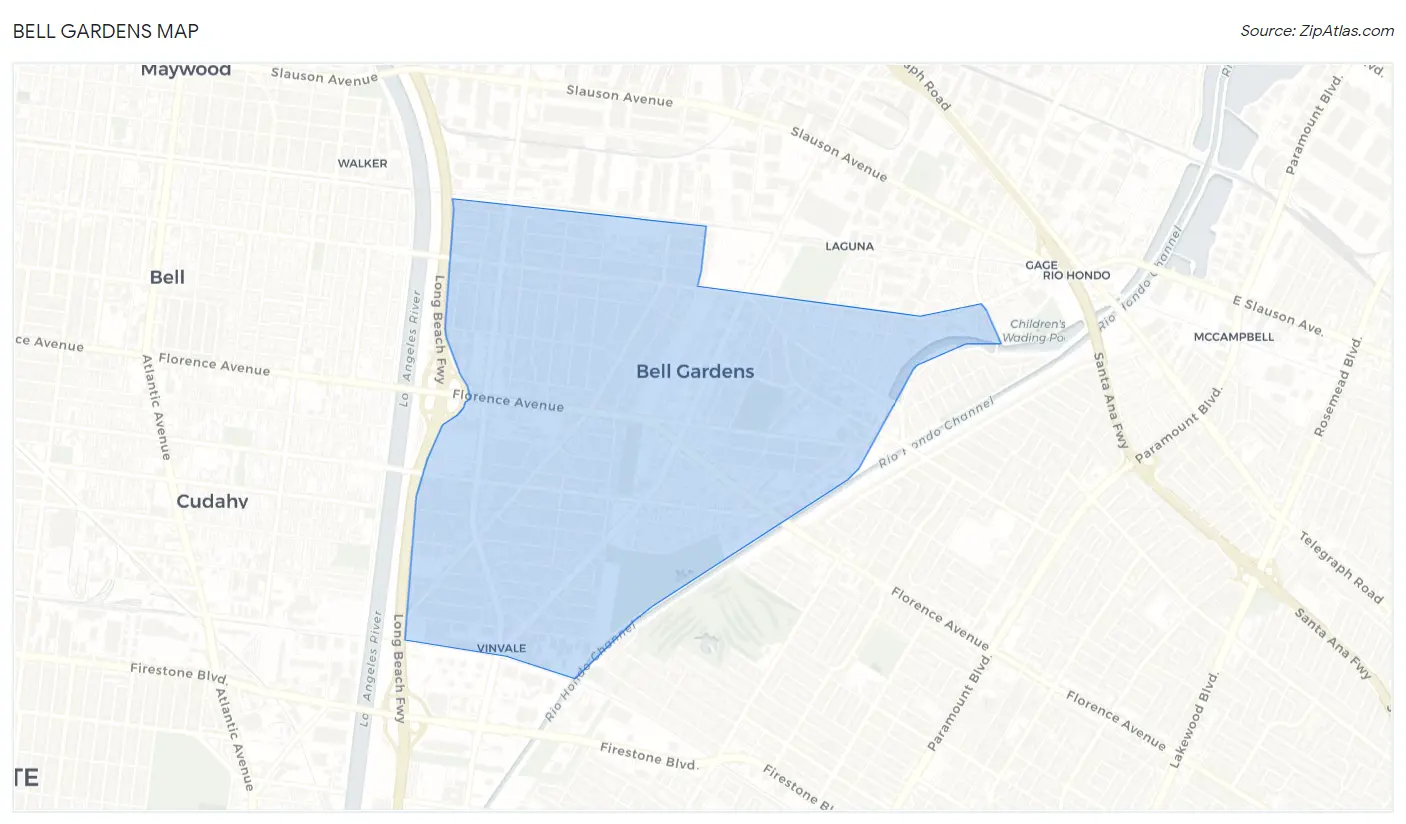
Bell Gardens Overview
$17,196
PER CAPITA INCOME
$52,422
AVG FAMILY INCOME
$53,935
AVG HOUSEHOLD INCOME
20.9%
WAGE / INCOME GAP [ % ]
79.1¢/ $1
WAGE / INCOME GAP [ $ ]
$10,224
FAMILY INCOME DEFICIT
0.40
INEQUALITY / GINI INDEX
39,263
TOTAL POPULATION
19,772
MALE POPULATION
19,491
FEMALE POPULATION
101.44
MALES / 100 FEMALES
98.58
FEMALES / 100 MALES
31.1
MEDIAN AGE
4.3
AVG FAMILY SIZE
4.1
AVG HOUSEHOLD SIZE
18,018
LABOR FORCE [ PEOPLE ]
61.1%
PERCENT IN LABOR FORCE
5.7%
UNEMPLOYMENT RATE
Bell Gardens Zip Codes
Bell Gardens Area Codes
Income in Bell Gardens
Income Overview in Bell Gardens
Per Capita Income in Bell Gardens is $17,196, while median incomes of families and households are $52,422 and $53,935 respectively.
| Characteristic | Number | Measure |
| Per Capita Income | 39,263 | $17,196 |
| Median Family Income | 8,105 | $52,422 |
| Mean Family Income | 8,105 | $63,411 |
| Median Household Income | 9,523 | $53,935 |
| Mean Household Income | 9,523 | $65,725 |
| Income Deficit | 8,105 | $10,224 |
| Wage / Income Gap (%) | 39,263 | 20.92% |
| Wage / Income Gap ($) | 39,263 | 79.08¢ per $1 |
| Gini / Inequality Index | 39,263 | 0.40 |
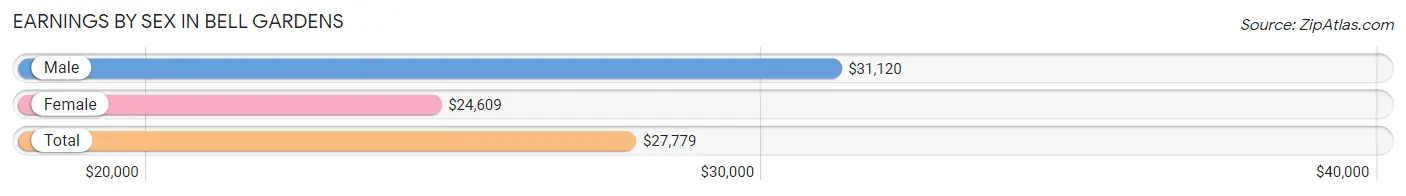
Earnings by Sex in Bell Gardens
Average Earnings in Bell Gardens are $27,779, $31,120 for men and $24,609 for women, a difference of 20.9%.
| Sex | Number | Average Earnings |
| Male | 10,546 (57.8%) | $31,120 |
| Female | 7,709 (42.2%) | $24,609 |
| Total | 18,255 (100.0%) | $27,779 |
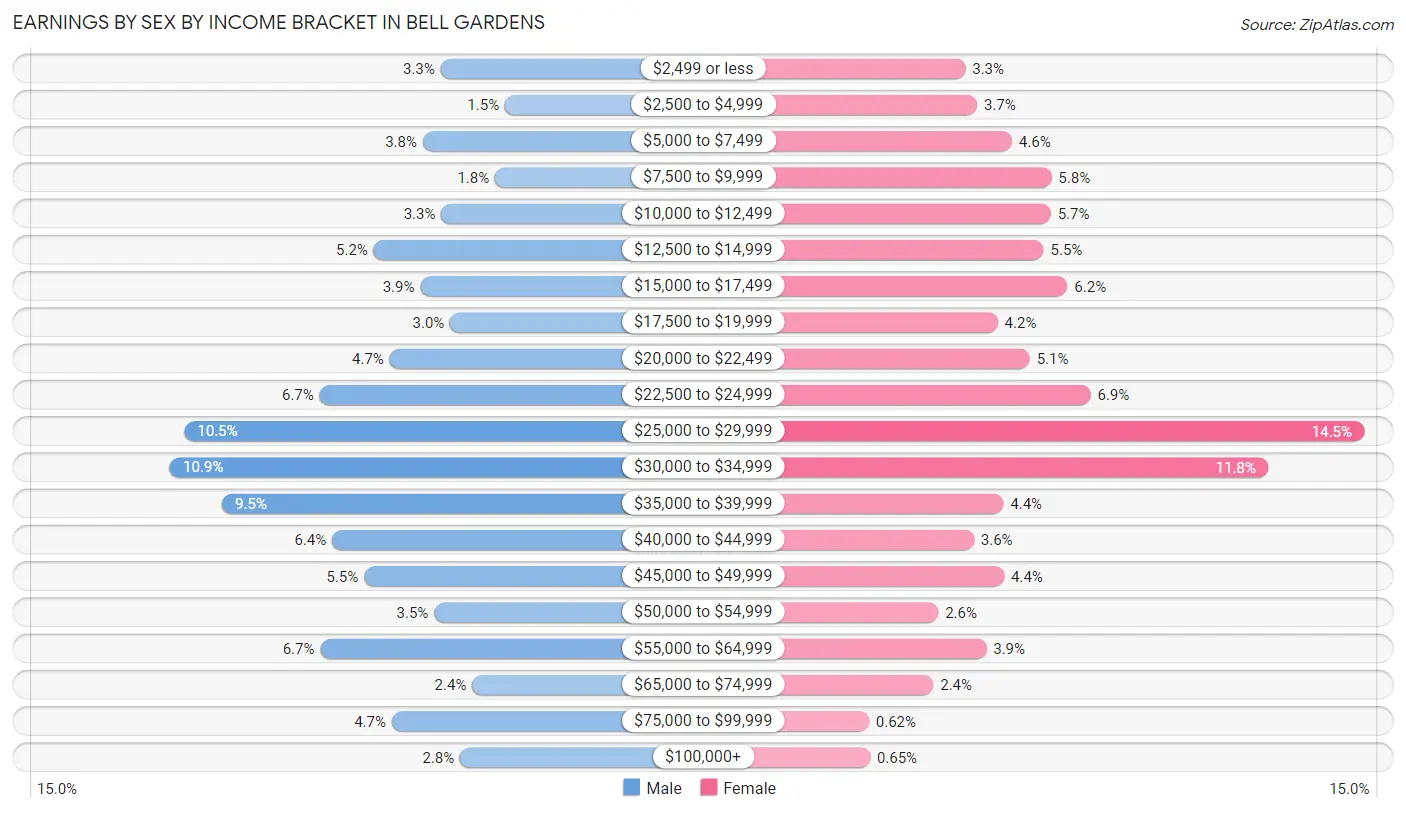
Earnings by Sex by Income Bracket in Bell Gardens
The most common earnings brackets in Bell Gardens are $30,000 to $34,999 for men (1,151 | 10.9%) and $25,000 to $29,999 for women (1,120 | 14.5%).
| Income | Male | Female |
| $2,499 or less | 349 (3.3%) | 257 (3.3%) |
| $2,500 to $4,999 | 158 (1.5%) | 282 (3.7%) |
| $5,000 to $7,499 | 402 (3.8%) | 358 (4.6%) |
| $7,500 to $9,999 | 188 (1.8%) | 443 (5.8%) |
| $10,000 to $12,499 | 347 (3.3%) | 442 (5.7%) |
| $12,500 to $14,999 | 547 (5.2%) | 426 (5.5%) |
| $15,000 to $17,499 | 409 (3.9%) | 478 (6.2%) |
| $17,500 to $19,999 | 321 (3.0%) | 327 (4.2%) |
| $20,000 to $22,499 | 500 (4.7%) | 396 (5.1%) |
| $22,500 to $24,999 | 708 (6.7%) | 528 (6.9%) |
| $25,000 to $29,999 | 1,108 (10.5%) | 1,120 (14.5%) |
| $30,000 to $34,999 | 1,151 (10.9%) | 912 (11.8%) |
| $35,000 to $39,999 | 997 (9.5%) | 339 (4.4%) |
| $40,000 to $44,999 | 671 (6.4%) | 275 (3.6%) |
| $45,000 to $49,999 | 576 (5.5%) | 341 (4.4%) |
| $50,000 to $54,999 | 368 (3.5%) | 198 (2.6%) |
| $55,000 to $64,999 | 706 (6.7%) | 302 (3.9%) |
| $65,000 to $74,999 | 255 (2.4%) | 187 (2.4%) |
| $75,000 to $99,999 | 494 (4.7%) | 48 (0.6%) |
| $100,000+ | 291 (2.8%) | 50 (0.6%) |
| Total | 10,546 (100.0%) | 7,709 (100.0%) |
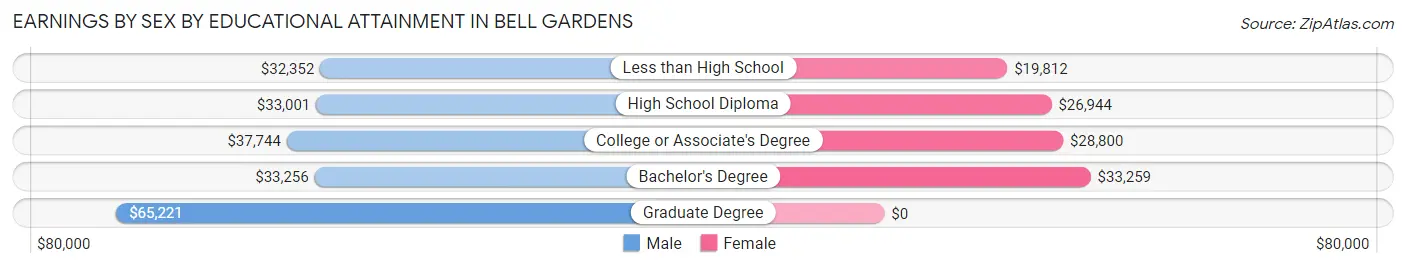
Earnings by Sex by Educational Attainment in Bell Gardens
Average earnings in Bell Gardens are $33,643 for men and $25,742 for women, a difference of 23.5%. Men with an educational attainment of graduate degree enjoy the highest average annual earnings of $65,221, while those with less than high school education earn the least with $32,352. Women with an educational attainment of bachelor's degree earn the most with the average annual earnings of $33,259, while those with less than high school education have the smallest earnings of $19,812.
| Educational Attainment | Male Income | Female Income |
| Less than High School | $32,352 | $19,812 |
| High School Diploma | $33,001 | $26,944 |
| College or Associate's Degree | $37,744 | $28,800 |
| Bachelor's Degree | $33,256 | $33,259 |
| Graduate Degree | $65,221 | $0 |
| Total | $33,643 | $25,742 |
Family Income in Bell Gardens
Family Income Brackets in Bell Gardens
According to the Bell Gardens family income data, there are 1,816 families falling into the $50,000 to $74,999 income range, which is the most common income bracket and makes up 22.4% of all families. Conversely, the $200,000+ income bracket is the least frequent group with only 178 families (2.2%) belonging to this category.
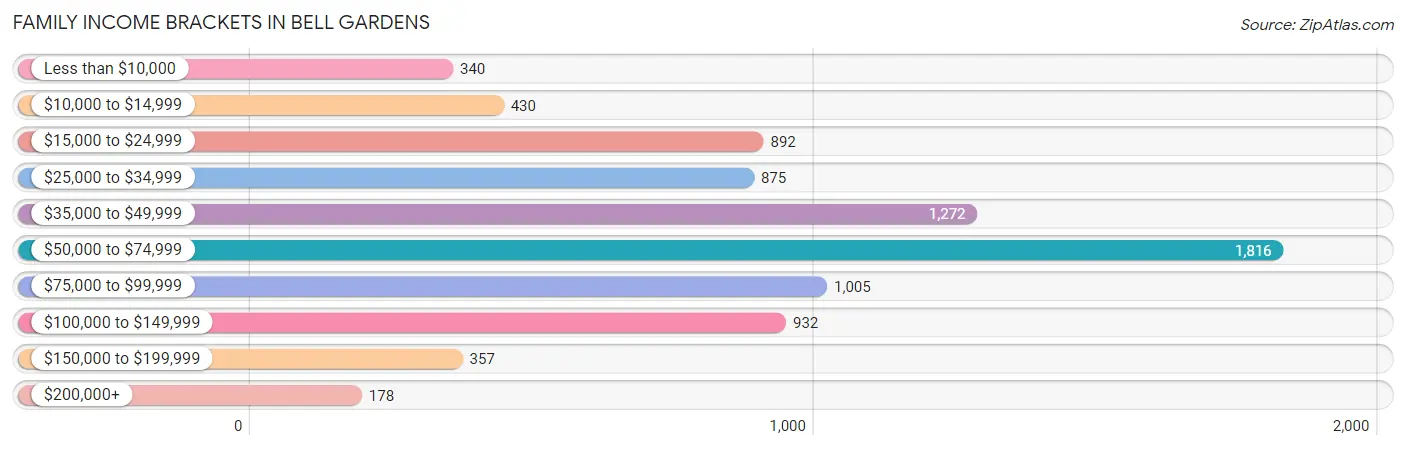
| Income Bracket | # Families | % Families |
| Less than $10,000 | 340 | 4.2% |
| $10,000 to $14,999 | 430 | 5.3% |
| $15,000 to $24,999 | 892 | 11.0% |
| $25,000 to $34,999 | 875 | 10.8% |
| $35,000 to $49,999 | 1,272 | 15.7% |
| $50,000 to $74,999 | 1,816 | 22.4% |
| $75,000 to $99,999 | 1,005 | 12.4% |
| $100,000 to $149,999 | 932 | 11.5% |
| $150,000 to $199,999 | 357 | 4.4% |
| $200,000+ | 178 | 2.2% |
Family Income by Famaliy Size in Bell Gardens
7+ person families (486 | 6.0%) account for the highest median family income in Bell Gardens with $105,694 per family, while 2-person families (1,574 | 19.4%) have the highest median income of $18,566 per family member.
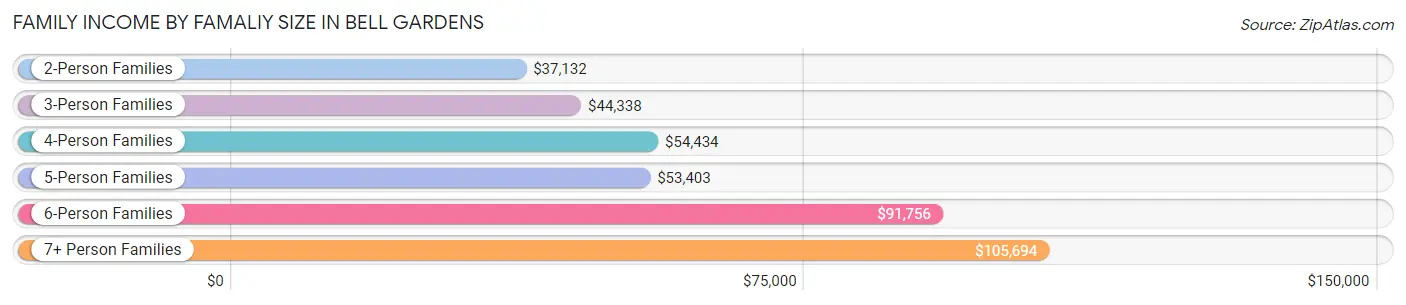
| Income Bracket | # Families | Median Income |
| 2-Person Families | 1,574 (19.4%) | $37,132 |
| 3-Person Families | 2,031 (25.1%) | $44,338 |
| 4-Person Families | 1,758 (21.7%) | $54,434 |
| 5-Person Families | 1,563 (19.3%) | $53,403 |
| 6-Person Families | 693 (8.6%) | $91,756 |
| 7+ Person Families | 486 (6.0%) | $105,694 |
| Total | 8,105 (100.0%) | $52,422 |
Family Income by Number of Earners in Bell Gardens
The median family income in Bell Gardens is $52,422, with families comprising 3+ earners (1,619) having the highest median family income of $99,732, while families with no earners (659) have the lowest median family income of $14,708, accounting for 20.0% and 8.1% of families, respectively.
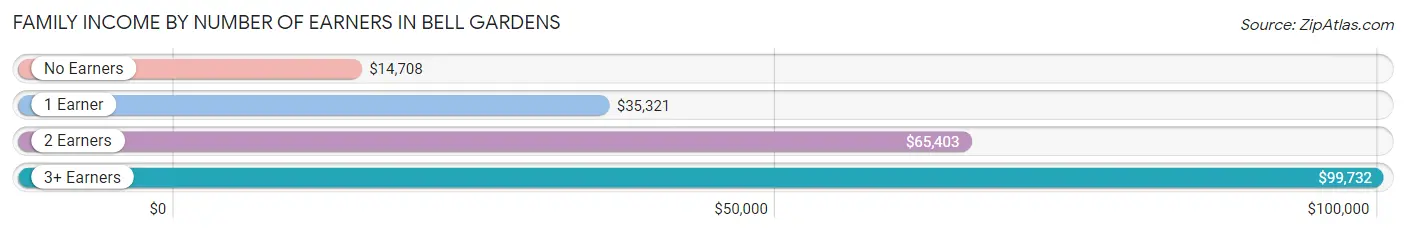
| Number of Earners | # Families | Median Income |
| No Earners | 659 (8.1%) | $14,708 |
| 1 Earner | 3,189 (39.4%) | $35,321 |
| 2 Earners | 2,638 (32.6%) | $65,403 |
| 3+ Earners | 1,619 (20.0%) | $99,732 |
| Total | 8,105 (100.0%) | $52,422 |
Household Income in Bell Gardens
Household Income Brackets in Bell Gardens
With 2,162 households falling in the category, the $50,000 to $74,999 income range is the most frequent in Bell Gardens, accounting for 22.7% of all households. In contrast, only 276 households (2.9%) fall into the $200,000+ income bracket, making it the least populous group.
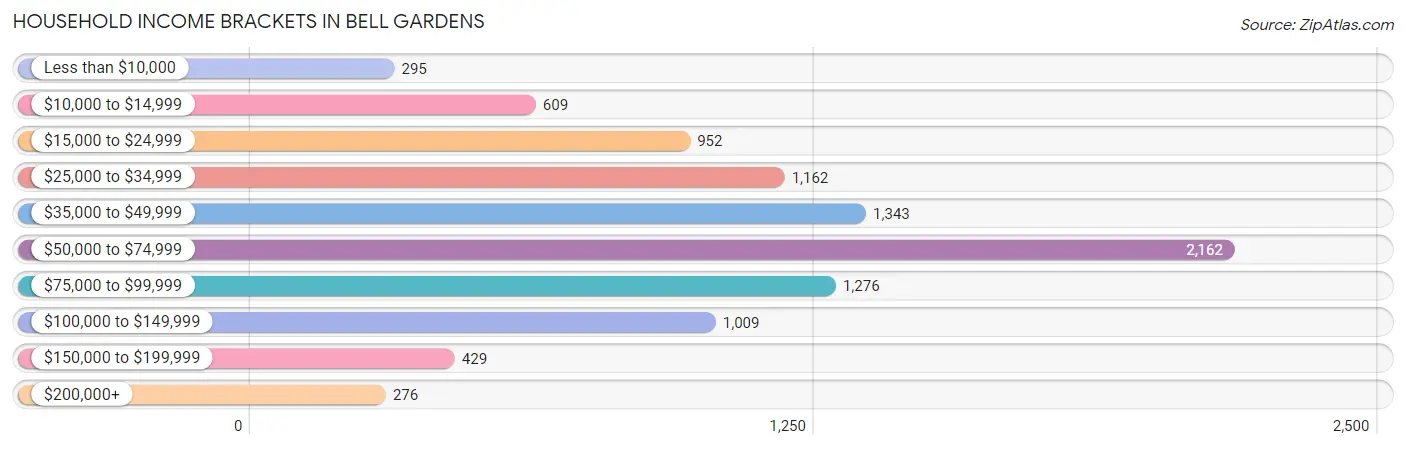
| Income Bracket | # Households | % Households |
| Less than $10,000 | 295 | 3.1% |
| $10,000 to $14,999 | 609 | 6.4% |
| $15,000 to $24,999 | 952 | 10.0% |
| $25,000 to $34,999 | 1,162 | 12.2% |
| $35,000 to $49,999 | 1,343 | 14.1% |
| $50,000 to $74,999 | 2,162 | 22.7% |
| $75,000 to $99,999 | 1,276 | 13.4% |
| $100,000 to $149,999 | 1,009 | 10.6% |
| $150,000 to $199,999 | 429 | 4.5% |
| $200,000+ | 276 | 2.9% |
Household Income by Householder Age in Bell Gardens
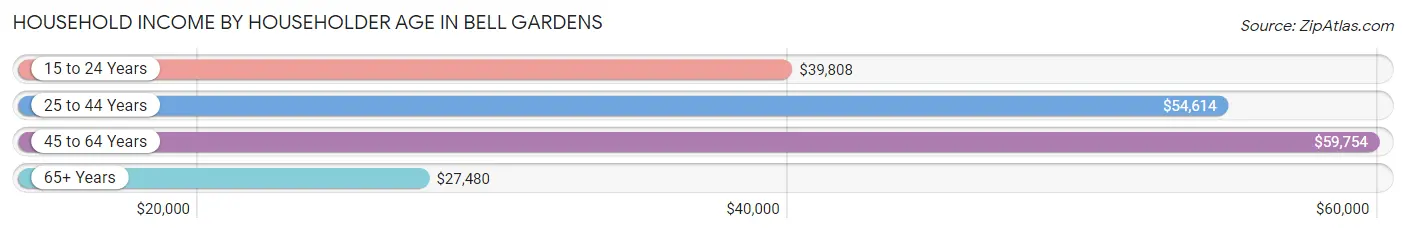
The median household income in Bell Gardens is $53,935, with the highest median household income of $59,754 found in the 45 to 64 years age bracket for the primary householder. A total of 4,293 households (45.1%) fall into this category. Meanwhile, the 65+ years age bracket for the primary householder has the lowest median household income of $27,480, with 1,529 households (16.1%) in this group.
| Income Bracket | # Households | Median Income |
| 15 to 24 Years | 292 (3.1%) | $39,808 |
| 25 to 44 Years | 3,409 (35.8%) | $54,614 |
| 45 to 64 Years | 4,293 (45.1%) | $59,754 |
| 65+ Years | 1,529 (16.1%) | $27,480 |
| Total | 9,523 (100.0%) | $53,935 |
Poverty in Bell Gardens
Income Below Poverty by Sex and Age in Bell Gardens
With 19.2% poverty level for males and 28.1% for females among the residents of Bell Gardens, 5 year old males and 15 year old females are the most vulnerable to poverty, with 139 males (52.4%) and 125 females (56.6%) in their respective age groups living below the poverty level.
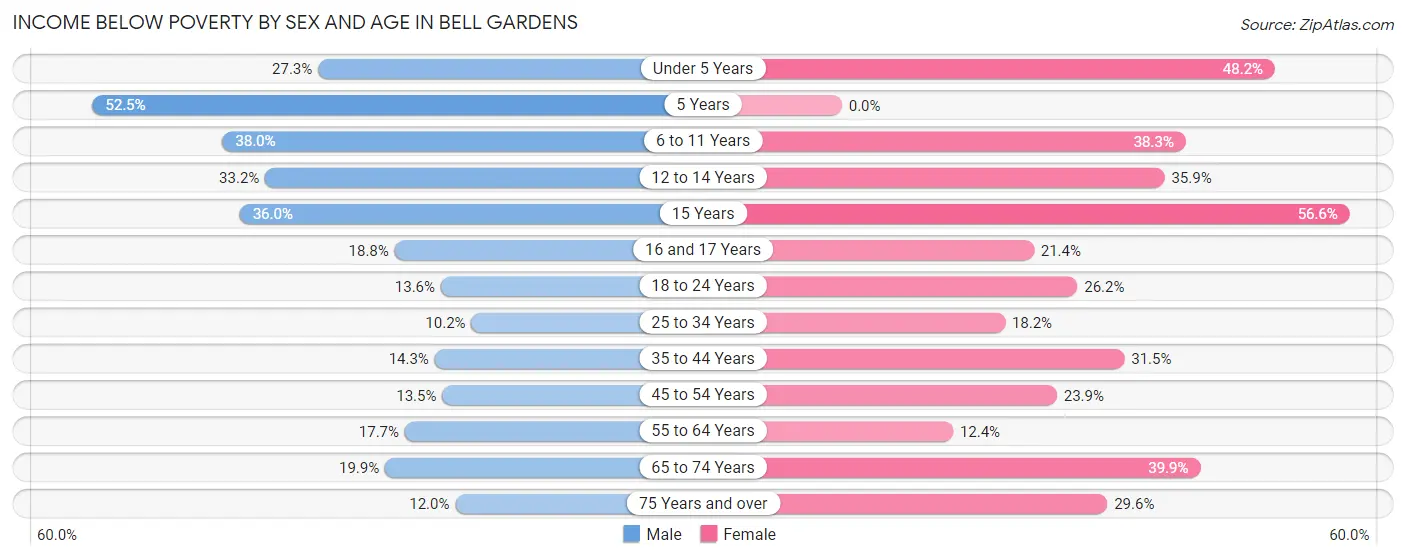
| Age Bracket | Male | Female |
| Under 5 Years | 298 (27.3%) | 682 (48.2%) |
| 5 Years | 139 (52.4%) | 0 (0.0%) |
| 6 to 11 Years | 756 (38.0%) | 722 (38.3%) |
| 12 to 14 Years | 366 (33.2%) | 345 (35.9%) |
| 15 Years | 151 (36.0%) | 125 (56.6%) |
| 16 and 17 Years | 112 (18.8%) | 139 (21.4%) |
| 18 to 24 Years | 295 (13.6%) | 545 (26.2%) |
| 25 to 34 Years | 342 (10.2%) | 557 (18.2%) |
| 35 to 44 Years | 373 (14.3%) | 761 (31.5%) |
| 45 to 54 Years | 369 (13.5%) | 624 (23.9%) |
| 55 to 64 Years | 303 (17.6%) | 226 (12.4%) |
| 65 to 74 Years | 167 (19.9%) | 410 (39.9%) |
| 75 Years and over | 71 (12.0%) | 282 (29.6%) |
| Total | 3,742 (19.2%) | 5,418 (28.1%) |
Income Above Poverty by Sex and Age in Bell Gardens
According to the poverty statistics in Bell Gardens, males aged 25 to 34 years and females aged 5 years are the age groups that are most secure financially, with 89.8% of males and 100.0% of females in these age groups living above the poverty line.
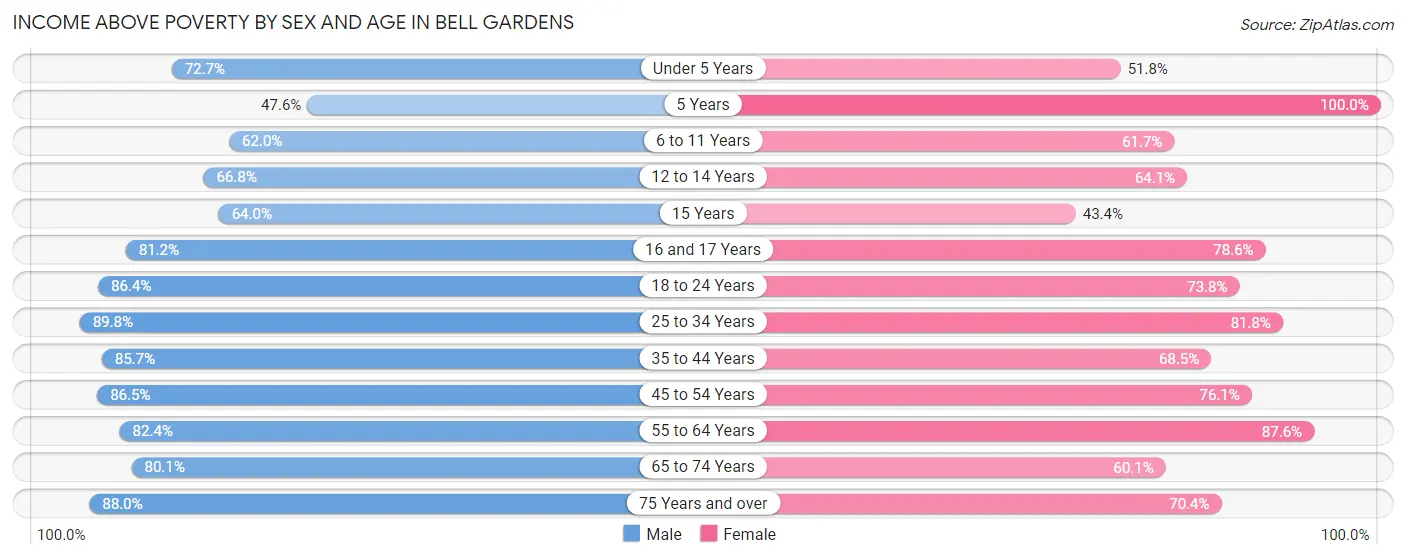
| Age Bracket | Male | Female |
| Under 5 Years | 793 (72.7%) | 732 (51.8%) |
| 5 Years | 126 (47.5%) | 196 (100.0%) |
| 6 to 11 Years | 1,235 (62.0%) | 1,163 (61.7%) |
| 12 to 14 Years | 736 (66.8%) | 615 (64.1%) |
| 15 Years | 268 (64.0%) | 96 (43.4%) |
| 16 and 17 Years | 484 (81.2%) | 511 (78.6%) |
| 18 to 24 Years | 1,867 (86.4%) | 1,533 (73.8%) |
| 25 to 34 Years | 2,998 (89.8%) | 2,508 (81.8%) |
| 35 to 44 Years | 2,230 (85.7%) | 1,658 (68.5%) |
| 45 to 54 Years | 2,369 (86.5%) | 1,983 (76.1%) |
| 55 to 64 Years | 1,414 (82.4%) | 1,599 (87.6%) |
| 65 to 74 Years | 674 (80.1%) | 617 (60.1%) |
| 75 Years and over | 519 (88.0%) | 672 (70.4%) |
| Total | 15,713 (80.8%) | 13,883 (71.9%) |
Income Below Poverty Among Married-Couple Families in Bell Gardens
The poverty statistics for married-couple families in Bell Gardens show that 13.4% or 556 of the total 4,140 families live below the poverty line. Families with 5 or more children have the highest poverty rate of 85.2%, comprising of 23 families. On the other hand, families with no children have the lowest poverty rate of 6.2%, which includes 107 families.
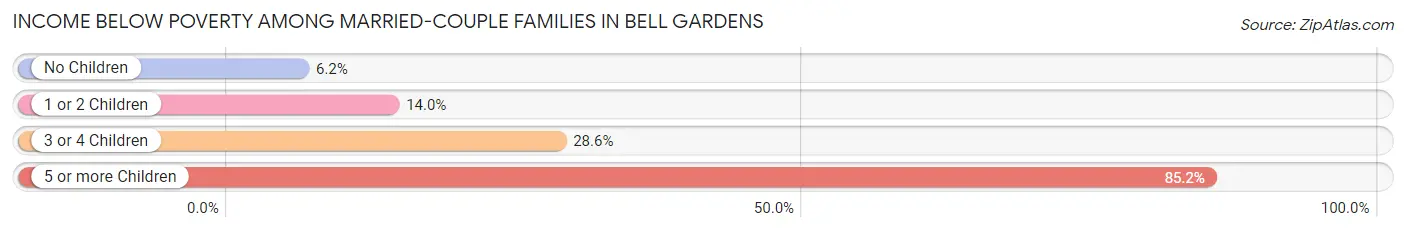
| Children | Above Poverty | Below Poverty |
| No Children | 1,623 (93.8%) | 107 (6.2%) |
| 1 or 2 Children | 1,507 (86.0%) | 246 (14.0%) |
| 3 or 4 Children | 450 (71.4%) | 180 (28.6%) |
| 5 or more Children | 4 (14.8%) | 23 (85.2%) |
| Total | 3,584 (86.6%) | 556 (13.4%) |
Income Below Poverty Among Single-Parent Households in Bell Gardens
According to the poverty data in Bell Gardens, 16.3% or 197 single-father households and 38.2% or 1,052 single-mother households are living below the poverty line. Among single-father households, those with 3 or 4 children have the highest poverty rate, with 51 households (25.9%) experiencing poverty. Likewise, among single-mother households, those with 3 or 4 children have the highest poverty rate, with 343 households (62.5%) falling below the poverty line.
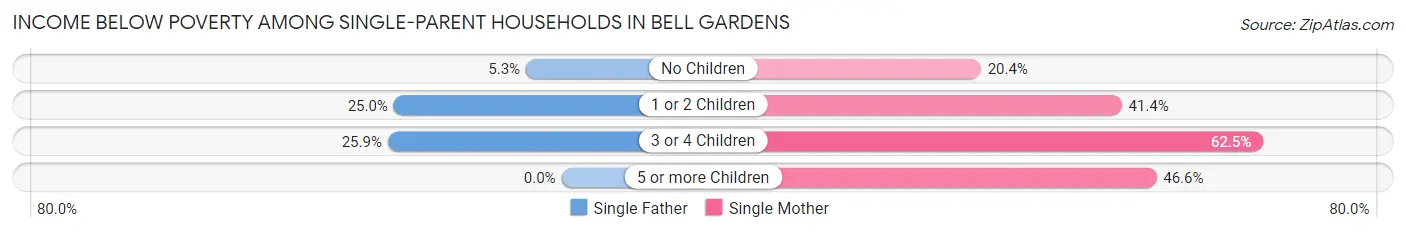
| Children | Single Father | Single Mother |
| No Children | 29 (5.3%) | 202 (20.4%) |
| 1 or 2 Children | 117 (25.0%) | 473 (41.4%) |
| 3 or 4 Children | 51 (25.9%) | 343 (62.5%) |
| 5 or more Children | 0 (0.0%) | 34 (46.6%) |
| Total | 197 (16.3%) | 1,052 (38.2%) |
Income Below Poverty Among Married-Couple vs Single-Parent Households in Bell Gardens
The poverty data for Bell Gardens shows that 556 of the married-couple family households (13.4%) and 1,249 of the single-parent households (31.5%) are living below the poverty level. Within the married-couple family households, those with 5 or more children have the highest poverty rate, with 23 households (85.2%) falling below the poverty line. Among the single-parent households, those with 3 or 4 children have the highest poverty rate, with 394 household (52.8%) living below poverty.
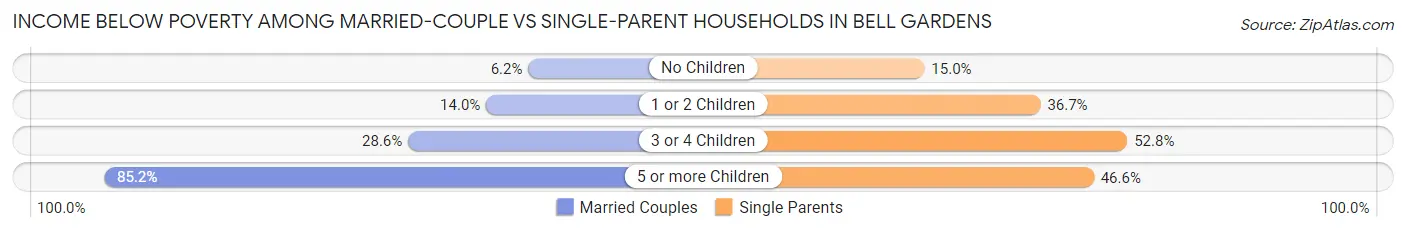
| Children | Married-Couple Families | Single-Parent Households |
| No Children | 107 (6.2%) | 231 (15.0%) |
| 1 or 2 Children | 246 (14.0%) | 590 (36.6%) |
| 3 or 4 Children | 180 (28.6%) | 394 (52.8%) |
| 5 or more Children | 23 (85.2%) | 34 (46.6%) |
| Total | 556 (13.4%) | 1,249 (31.5%) |
Race in Bell Gardens
The most populous races in Bell Gardens are Hispanic or Latino (37,731 | 96.1%), White / Caucasian (17,369 | 44.2%), and Two or more Races (12,843 | 32.7%).
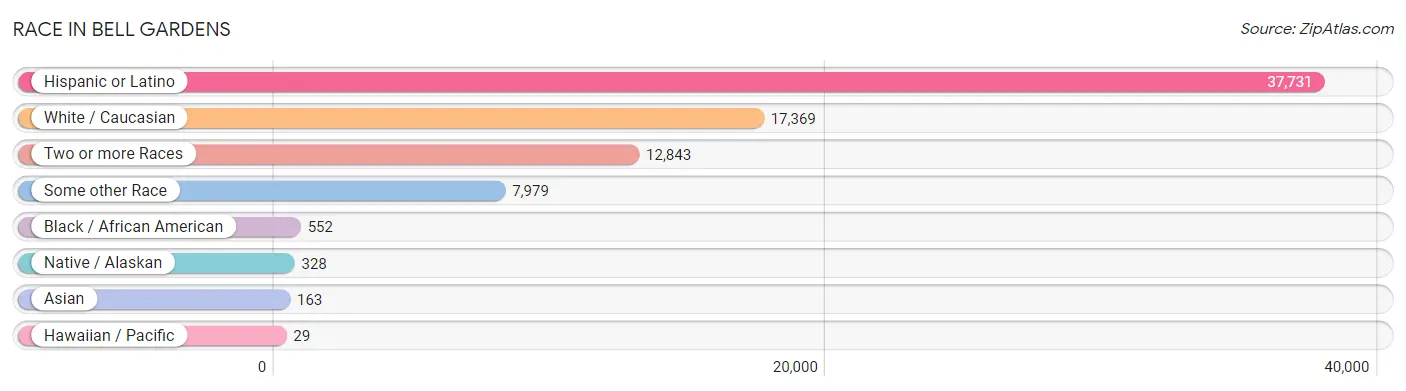
| Race | # Population | % Population |
| Asian | 163 | 0.4% |
| Black / African American | 552 | 1.4% |
| Hawaiian / Pacific | 29 | 0.1% |
| Hispanic or Latino | 37,731 | 96.1% |
| Native / Alaskan | 328 | 0.8% |
| White / Caucasian | 17,369 | 44.2% |
| Two or more Races | 12,843 | 32.7% |
| Some other Race | 7,979 | 20.3% |
| Total | 39,263 | 100.0% |
Ancestry in Bell Gardens
The most populous ancestries reported in Bell Gardens are Mexican (31,900 | 81.2%), Central American (5,043 | 12.8%), Salvadoran (3,062 | 7.8%), American (1,180 | 3.0%), and Guatemalan (1,107 | 2.8%), together accounting for 107.7% of all Bell Gardens residents.
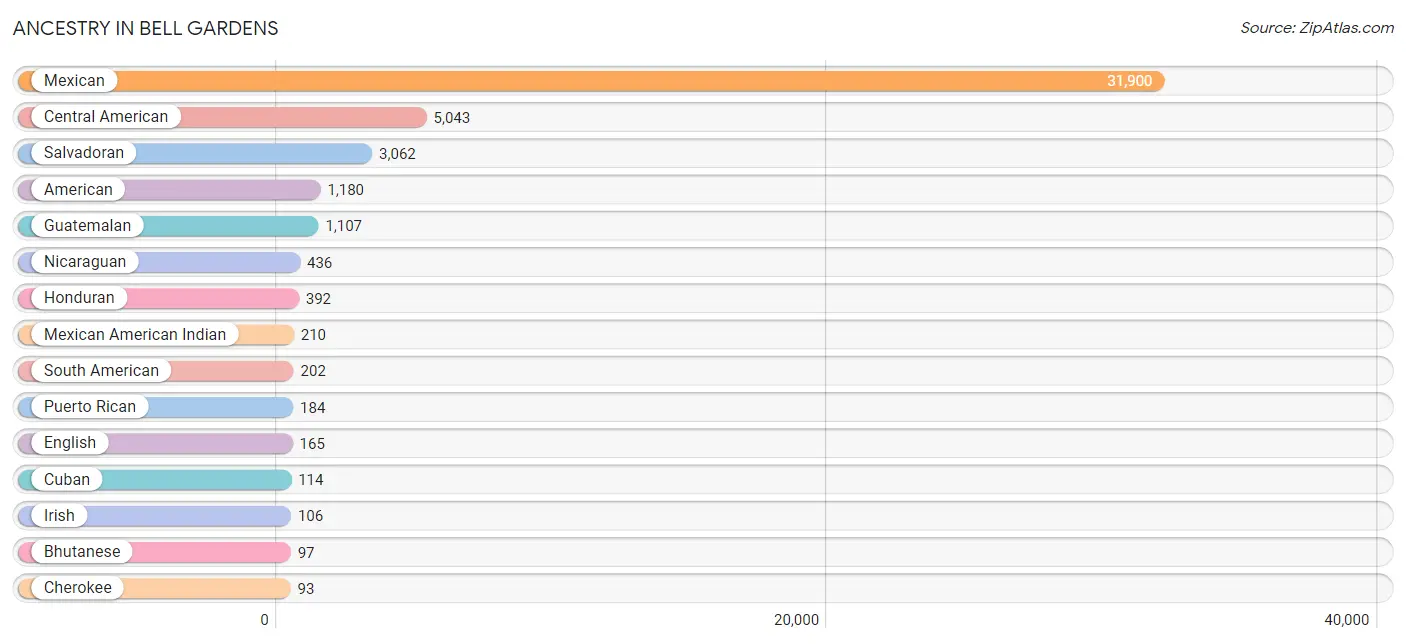
| Ancestry | # Population | % Population |
| African | 28 | 0.1% |
| American | 1,180 | 3.0% |
| Apache | 62 | 0.2% |
| Argentinean | 5 | 0.0% |
| Armenian | 32 | 0.1% |
| Bhutanese | 97 | 0.3% |
| Blackfeet | 62 | 0.2% |
| Central American | 5,043 | 12.8% |
| Central American Indian | 90 | 0.2% |
| Cherokee | 93 | 0.2% |
| Chilean | 4 | 0.0% |
| Colombian | 26 | 0.1% |
| Costa Rican | 46 | 0.1% |
| Cuban | 114 | 0.3% |
| Dominican | 79 | 0.2% |
| Dutch | 6 | 0.0% |
| Ecuadorian | 15 | 0.0% |
| English | 165 | 0.4% |
| European | 24 | 0.1% |
| French | 7 | 0.0% |
| French Canadian | 14 | 0.0% |
| German | 7 | 0.0% |
| Guatemalan | 1,107 | 2.8% |
| Honduran | 392 | 1.0% |
| Indian (Asian) | 47 | 0.1% |
| Irish | 106 | 0.3% |
| Italian | 28 | 0.1% |
| Korean | 86 | 0.2% |
| Mexican | 31,900 | 81.2% |
| Mexican American Indian | 210 | 0.5% |
| Native Hawaiian | 14 | 0.0% |
| Navajo | 33 | 0.1% |
| Nicaraguan | 436 | 1.1% |
| Nigerian | 22 | 0.1% |
| Peruvian | 29 | 0.1% |
| Puerto Rican | 184 | 0.5% |
| Salvadoran | 3,062 | 7.8% |
| Samoan | 61 | 0.2% |
| Scottish | 48 | 0.1% |
| South American | 202 | 0.5% |
| Spaniard | 3 | 0.0% |
| Subsaharan African | 50 | 0.1% |
| Thai | 4 | 0.0% |
| Venezuelan | 20 | 0.1% |
| Yaqui | 11 | 0.0% | View All 45 Rows |
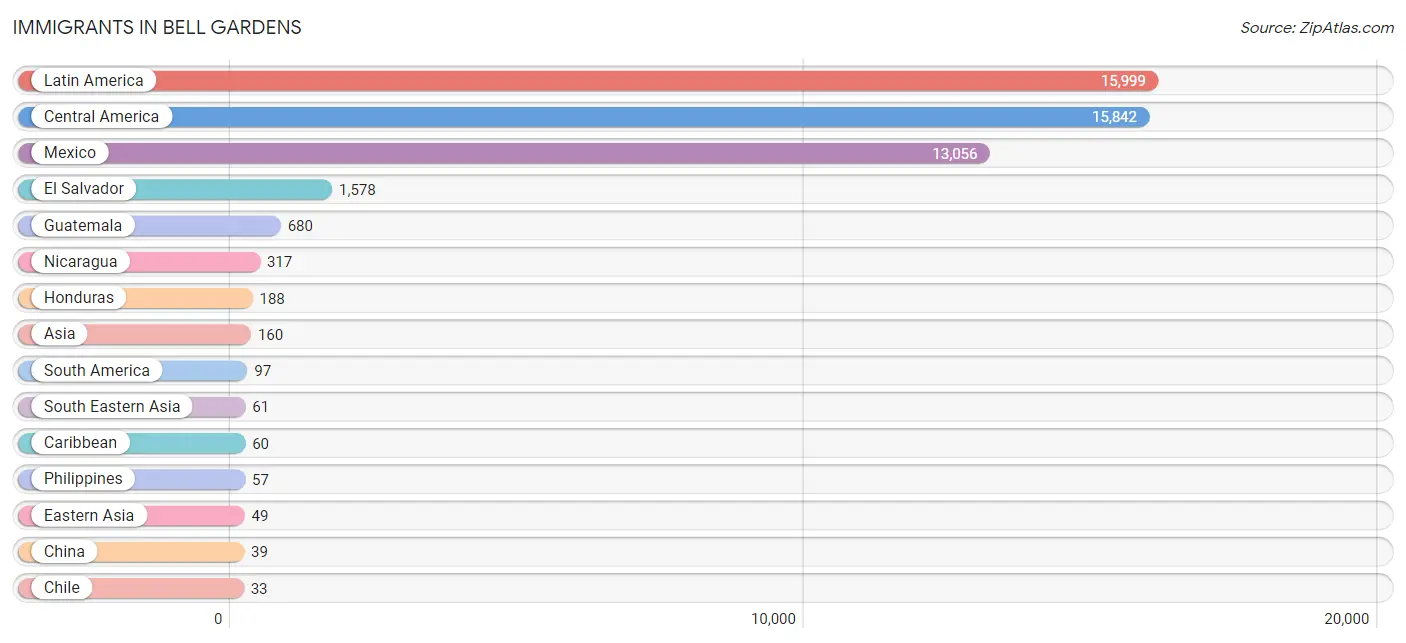
Immigrants in Bell Gardens
The most numerous immigrant groups reported in Bell Gardens came from Latin America (15,999 | 40.7%), Central America (15,842 | 40.4%), Mexico (13,056 | 33.3%), El Salvador (1,578 | 4.0%), and Guatemala (680 | 1.7%), together accounting for 120.1% of all Bell Gardens residents.
| Immigration Origin | # Population | % Population |
| Africa | 22 | 0.1% |
| Armenia | 32 | 0.1% |
| Asia | 160 | 0.4% |
| Caribbean | 60 | 0.2% |
| Central America | 15,842 | 40.4% |
| Chile | 33 | 0.1% |
| China | 39 | 0.1% |
| Costa Rica | 23 | 0.1% |
| Cuba | 30 | 0.1% |
| Dominican Republic | 30 | 0.1% |
| Eastern Asia | 49 | 0.1% |
| Ecuador | 15 | 0.0% |
| El Salvador | 1,578 | 4.0% |
| Europe | 8 | 0.0% |
| Guatemala | 680 | 1.7% |
| Honduras | 188 | 0.5% |
| India | 18 | 0.1% |
| Italy | 8 | 0.0% |
| Japan | 7 | 0.0% |
| Korea | 3 | 0.0% |
| Latin America | 15,999 | 40.7% |
| Mexico | 13,056 | 33.3% |
| Nicaragua | 317 | 0.8% |
| Nigeria | 22 | 0.1% |
| Peru | 29 | 0.1% |
| Philippines | 57 | 0.2% |
| South America | 97 | 0.3% |
| South Central Asia | 18 | 0.1% |
| South Eastern Asia | 61 | 0.2% |
| Southern Europe | 8 | 0.0% |
| Venezuela | 20 | 0.1% |
| Vietnam | 4 | 0.0% |
| Western Africa | 22 | 0.1% |
| Western Asia | 32 | 0.1% | View All 34 Rows |
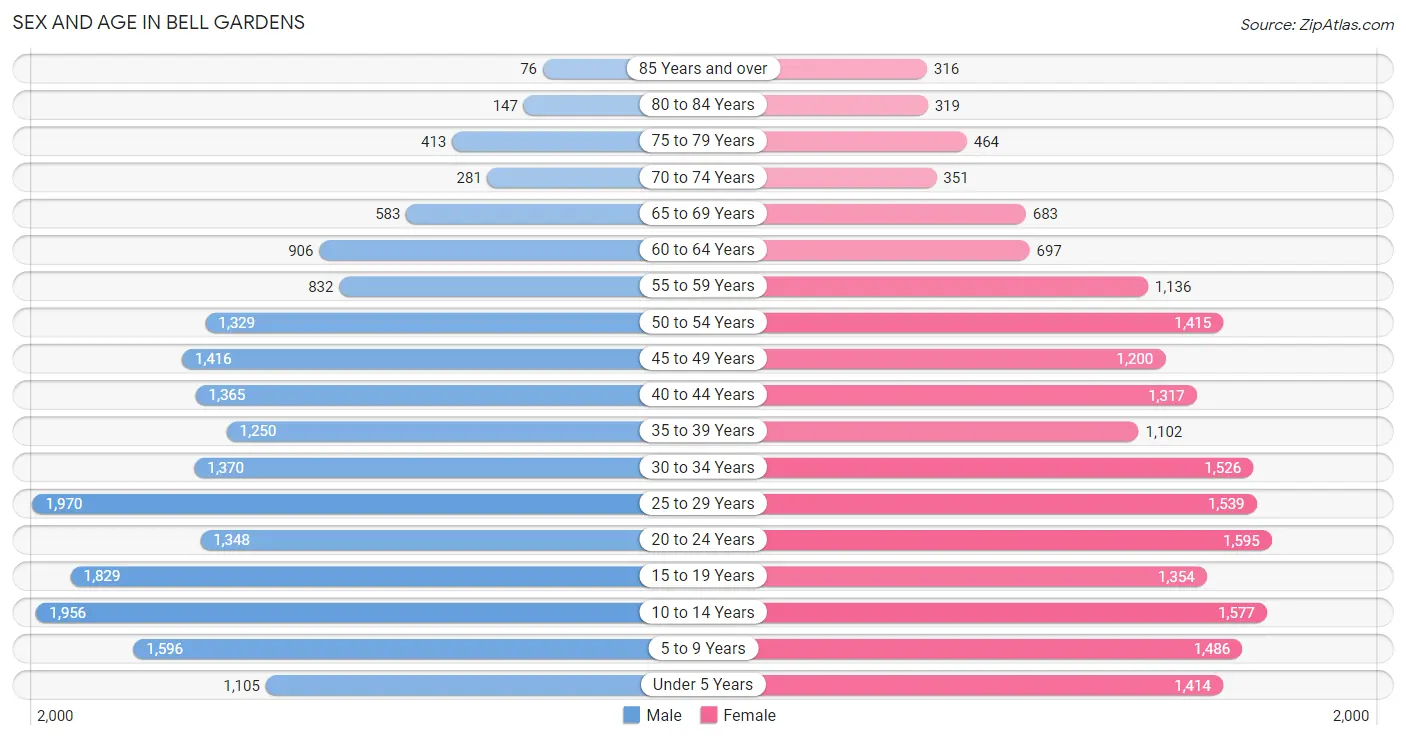
Sex and Age in Bell Gardens
Sex and Age in Bell Gardens
The most populous age groups in Bell Gardens are 25 to 29 Years (1,970 | 10.0%) for men and 20 to 24 Years (1,595 | 8.2%) for women.
| Age Bracket | Male | Female |
| Under 5 Years | 1,105 (5.6%) | 1,414 (7.2%) |
| 5 to 9 Years | 1,596 (8.1%) | 1,486 (7.6%) |
| 10 to 14 Years | 1,956 (9.9%) | 1,577 (8.1%) |
| 15 to 19 Years | 1,829 (9.2%) | 1,354 (7.0%) |
| 20 to 24 Years | 1,348 (6.8%) | 1,595 (8.2%) |
| 25 to 29 Years | 1,970 (10.0%) | 1,539 (7.9%) |
| 30 to 34 Years | 1,370 (6.9%) | 1,526 (7.8%) |
| 35 to 39 Years | 1,250 (6.3%) | 1,102 (5.7%) |
| 40 to 44 Years | 1,365 (6.9%) | 1,317 (6.8%) |
| 45 to 49 Years | 1,416 (7.2%) | 1,200 (6.2%) |
| 50 to 54 Years | 1,329 (6.7%) | 1,415 (7.3%) |
| 55 to 59 Years | 832 (4.2%) | 1,136 (5.8%) |
| 60 to 64 Years | 906 (4.6%) | 697 (3.6%) |
| 65 to 69 Years | 583 (2.9%) | 683 (3.5%) |
| 70 to 74 Years | 281 (1.4%) | 351 (1.8%) |
| 75 to 79 Years | 413 (2.1%) | 464 (2.4%) |
| 80 to 84 Years | 147 (0.7%) | 319 (1.6%) |
| 85 Years and over | 76 (0.4%) | 316 (1.6%) |
| Total | 19,772 (100.0%) | 19,491 (100.0%) |
Families and Households in Bell Gardens
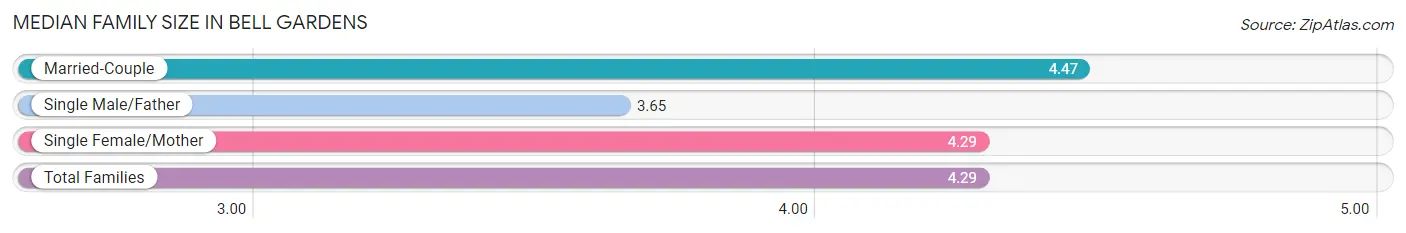
Median Family Size in Bell Gardens
The median family size in Bell Gardens is 4.29 persons per family, with married-couple families (4,140 | 51.1%) accounting for the largest median family size of 4.47 persons per family. On the other hand, single male/father families (1,212 | 14.9%) represent the smallest median family size with 3.65 persons per family.
| Family Type | # Families | Family Size |
| Married-Couple | 4,140 (51.1%) | 4.47 |
| Single Male/Father | 1,212 (14.9%) | 3.65 |
| Single Female/Mother | 2,753 (34.0%) | 4.29 |
| Total Families | 8,105 (100.0%) | 4.29 |
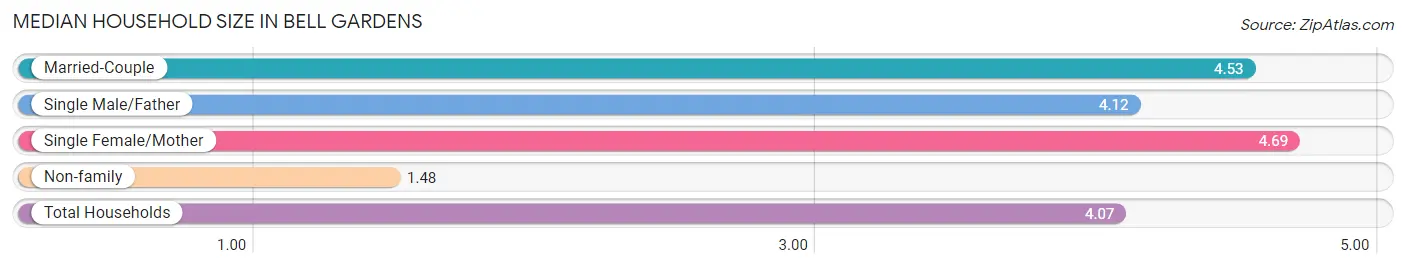
Median Household Size in Bell Gardens
The median household size in Bell Gardens is 4.07 persons per household, with single female/mother households (2,753 | 28.9%) accounting for the largest median household size of 4.69 persons per household. non-family households (1,418 | 14.9%) represent the smallest median household size with 1.48 persons per household.
| Household Type | # Households | Household Size |
| Married-Couple | 4,140 (43.5%) | 4.53 |
| Single Male/Father | 1,212 (12.7%) | 4.12 |
| Single Female/Mother | 2,753 (28.9%) | 4.69 |
| Non-family | 1,418 (14.9%) | 1.48 |
| Total Households | 9,523 (100.0%) | 4.07 |
Household Size by Marriage Status in Bell Gardens
Out of a total of 9,523 households in Bell Gardens, 8,105 (85.1%) are family households, while 1,418 (14.9%) are nonfamily households. The most numerous type of family households are 4-person households, comprising 1,820, and the most common type of nonfamily households are 1-person households, comprising 995.
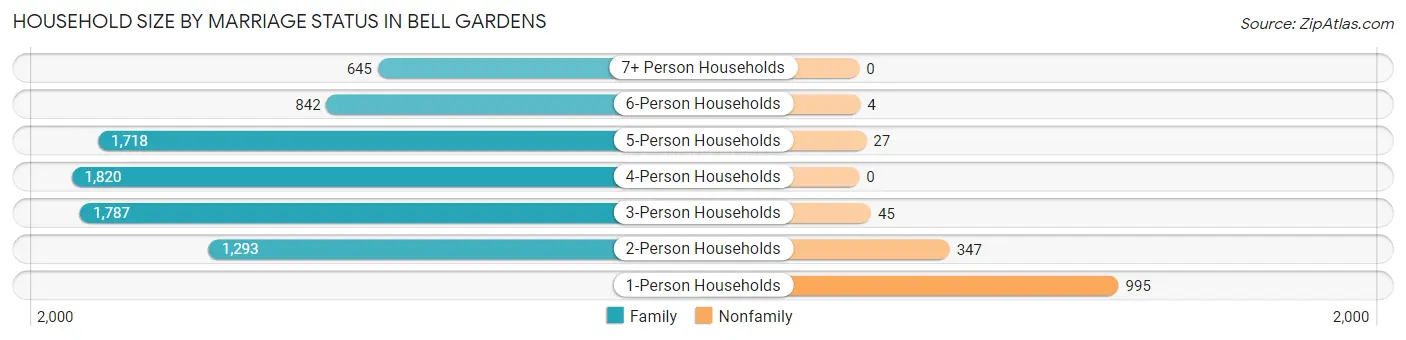
| Household Size | Family Households | Nonfamily Households |
| 1-Person Households | - | 995 (10.4%) |
| 2-Person Households | 1,293 (13.6%) | 347 (3.6%) |
| 3-Person Households | 1,787 (18.8%) | 45 (0.5%) |
| 4-Person Households | 1,820 (19.1%) | 0 (0.0%) |
| 5-Person Households | 1,718 (18.0%) | 27 (0.3%) |
| 6-Person Households | 842 (8.8%) | 4 (0.0%) |
| 7+ Person Households | 645 (6.8%) | 0 (0.0%) |
| Total | 8,105 (85.1%) | 1,418 (14.9%) |
Female Fertility in Bell Gardens
Fertility by Age in Bell Gardens
Average fertility rate in Bell Gardens is 48.0 births per 1,000 women. Women in the age bracket of 20 to 34 years have the highest fertility rate with 59.0 births per 1,000 women. Women in the age bracket of 20 to 34 years acount for 57.2% of all women with births.
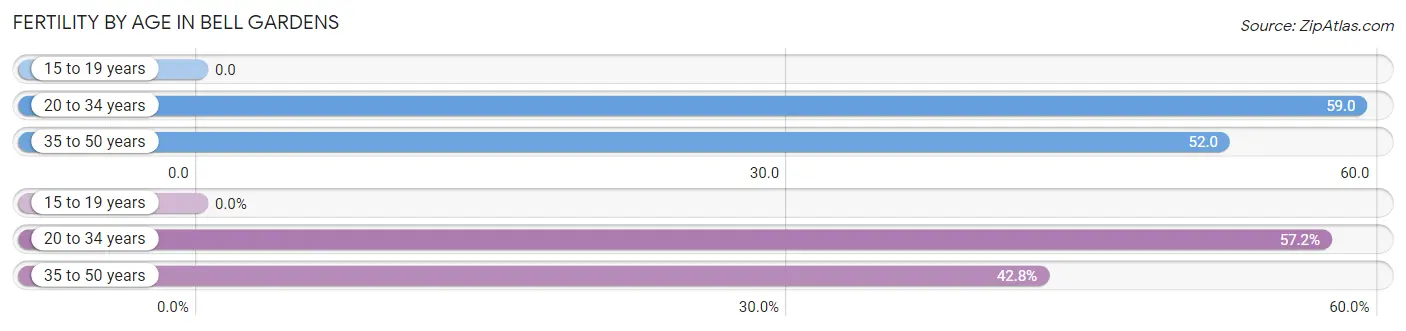
| Age Bracket | Women with Births | Births / 1,000 Women |
| 15 to 19 years | 0 (0.0%) | 0.0 |
| 20 to 34 years | 274 (57.2%) | 59.0 |
| 35 to 50 years | 205 (42.8%) | 52.0 |
| Total | 479 (100.0%) | 48.0 |
Fertility by Age by Marriage Status in Bell Gardens
59.1% of women with births (479) in Bell Gardens are married. The highest percentage of unmarried women with births falls into 20 to 34 years age bracket with 48.9% of them unmarried at the time of birth, while the lowest percentage of unmarried women with births belong to 35 to 50 years age bracket with 30.2% of them unmarried.
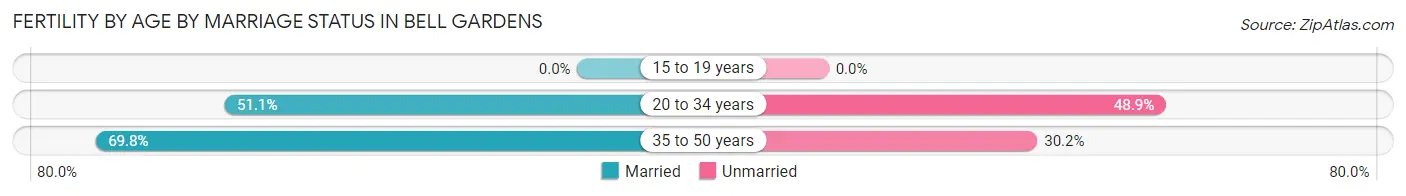
| Age Bracket | Married | Unmarried |
| 15 to 19 years | 0 (0.0%) | 0 (0.0%) |
| 20 to 34 years | 140 (51.1%) | 134 (48.9%) |
| 35 to 50 years | 143 (69.8%) | 62 (30.2%) |
| Total | 283 (59.1%) | 196 (40.9%) |
Fertility by Education in Bell Gardens
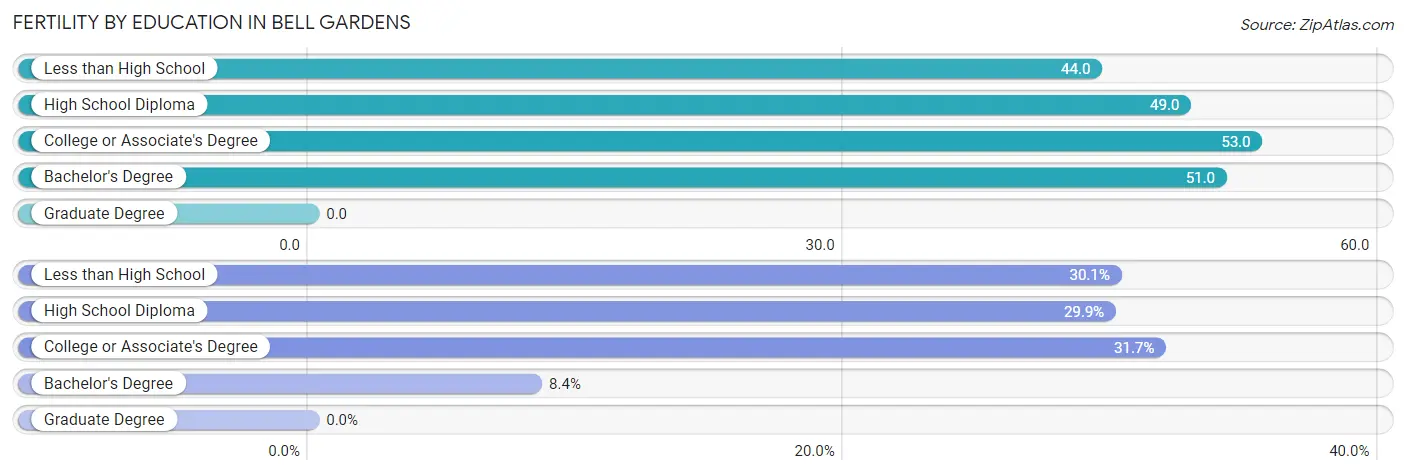
| Educational Attainment | Women with Births | Births / 1,000 Women |
| Less than High School | 144 (30.1%) | 44.0 |
| High School Diploma | 143 (29.8%) | 49.0 |
| College or Associate's Degree | 152 (31.7%) | 53.0 |
| Bachelor's Degree | 40 (8.4%) | 51.0 |
| Graduate Degree | 0 (0.0%) | 0.0 |
| Total | 479 (100.0%) | 48.0 |
Fertility by Education by Marriage Status in Bell Gardens
40.9% of women with births in Bell Gardens are unmarried. Women with the educational attainment of college or associate's degree are most likely to be married with 92.8% of them married at childbirth, while women with the educational attainment of less than high school are least likely to be married with 68.1% of them unmarried at childbirth.
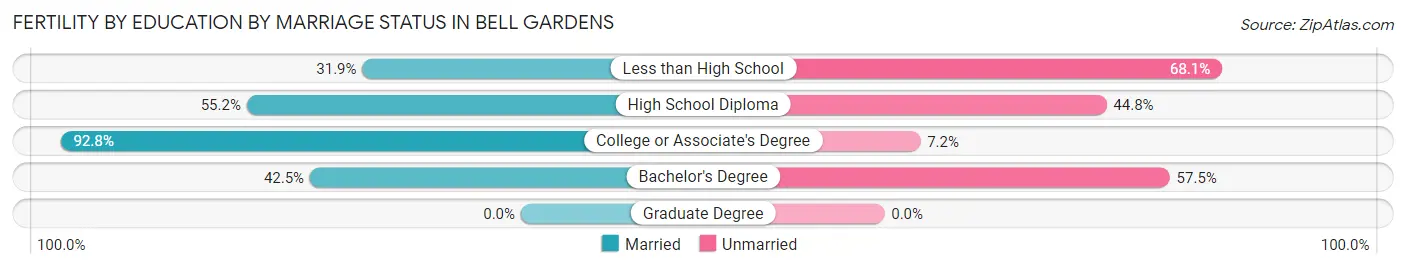
| Educational Attainment | Married | Unmarried |
| Less than High School | 46 (31.9%) | 98 (68.1%) |
| High School Diploma | 79 (55.2%) | 64 (44.8%) |
| College or Associate's Degree | 141 (92.8%) | 11 (7.2%) |
| Bachelor's Degree | 17 (42.5%) | 23 (57.5%) |
| Graduate Degree | 0 (0.0%) | 0 (0.0%) |
| Total | 283 (59.1%) | 196 (40.9%) |
Employment Characteristics in Bell Gardens
Employment by Class of Employer in Bell Gardens
Among the 16,487 employed individuals in Bell Gardens, private company employees (13,827 | 83.9%), self-employed (not incorporated) (911 | 5.5%), and local government employees (752 | 4.6%) make up the most common classes of employment.
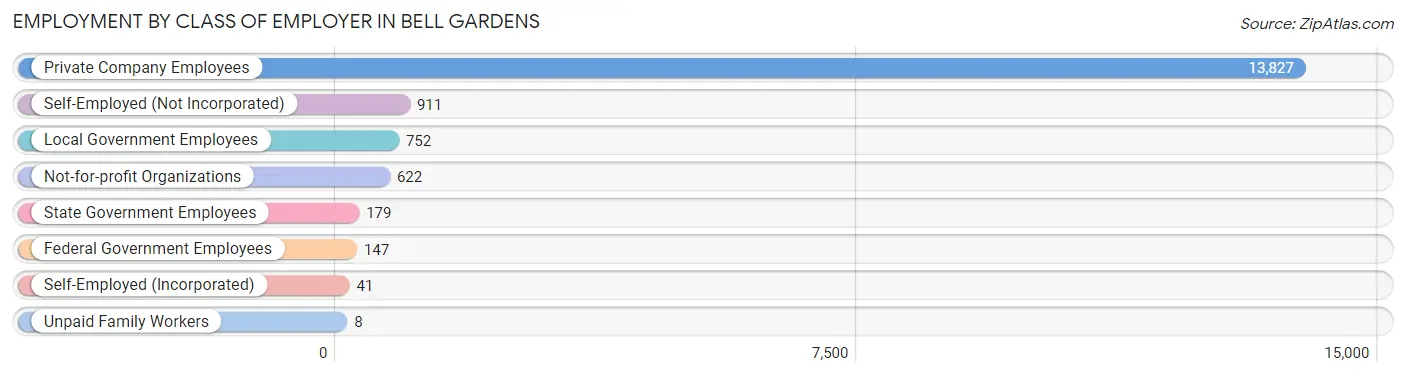
| Employer Class | # Employees | % Employees |
| Private Company Employees | 13,827 | 83.9% |
| Self-Employed (Incorporated) | 41 | 0.3% |
| Self-Employed (Not Incorporated) | 911 | 5.5% |
| Not-for-profit Organizations | 622 | 3.8% |
| Local Government Employees | 752 | 4.6% |
| State Government Employees | 179 | 1.1% |
| Federal Government Employees | 147 | 0.9% |
| Unpaid Family Workers | 8 | 0.1% |
| Total | 16,487 | 100.0% |
Employment Status by Age in Bell Gardens
According to the labor force statistics for Bell Gardens, out of the total population over 16 years of age (29,489), 61.1% or 18,018 individuals are in the labor force, with 5.7% or 1,027 of them unemployed. The age group with the highest labor force participation rate is 25 to 29 years, with 85.6% or 3,004 individuals in the labor force. Within the labor force, the 16 to 19 years age range has the highest percentage of unemployed individuals, with 25.3% or 143 of them being unemployed.
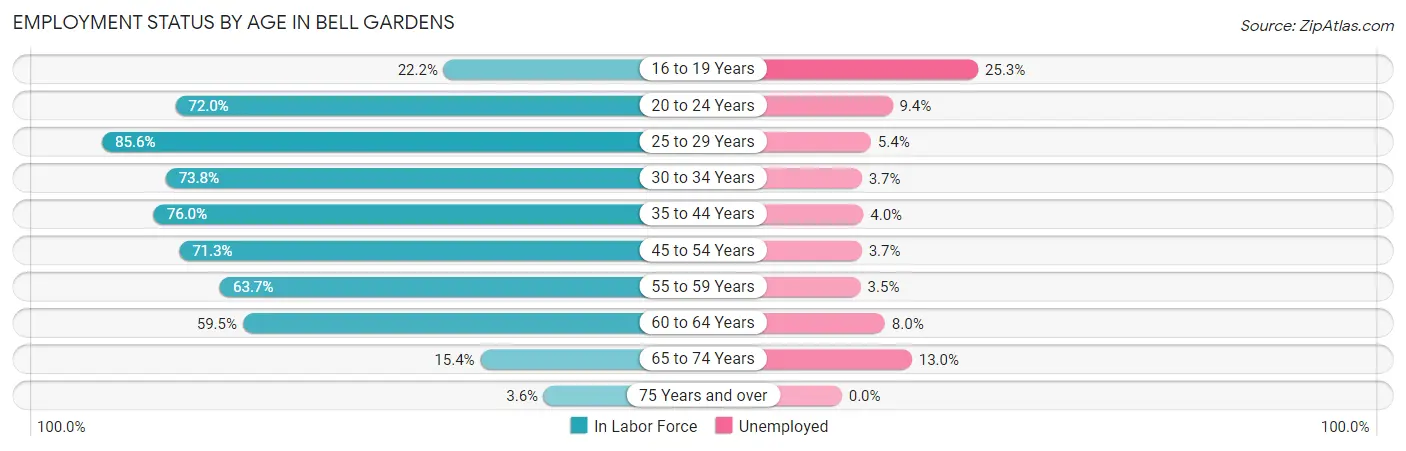
| Age Bracket | In Labor Force | Unemployed |
| 16 to 19 Years | 565 (22.2%) | 143 (25.3%) |
| 20 to 24 Years | 2,119 (72.0%) | 199 (9.4%) |
| 25 to 29 Years | 3,004 (85.6%) | 162 (5.4%) |
| 30 to 34 Years | 2,137 (73.8%) | 79 (3.7%) |
| 35 to 44 Years | 3,826 (76.0%) | 153 (4.0%) |
| 45 to 54 Years | 3,822 (71.3%) | 141 (3.7%) |
| 55 to 59 Years | 1,254 (63.7%) | 44 (3.5%) |
| 60 to 64 Years | 954 (59.5%) | 76 (8.0%) |
| 65 to 74 Years | 292 (15.4%) | 38 (13.0%) |
| 75 Years and over | 62 (3.6%) | 0 (0.0%) |
| Total | 18,018 (61.1%) | 1,027 (5.7%) |
Employment Status by Educational Attainment in Bell Gardens
According to labor force statistics for Bell Gardens, 73.6% of individuals (14,992) out of the total population between 25 and 64 years of age (20,370) are in the labor force, with 4.4% or 660 of them being unemployed. The group with the highest labor force participation rate are those with the educational attainment of bachelor's degree or higher, with 87.6% or 1,242 individuals in the labor force. Within the labor force, individuals with bachelor's degree or higher education have the highest percentage of unemployment, with 6.6% or 82 of them being unemployed.
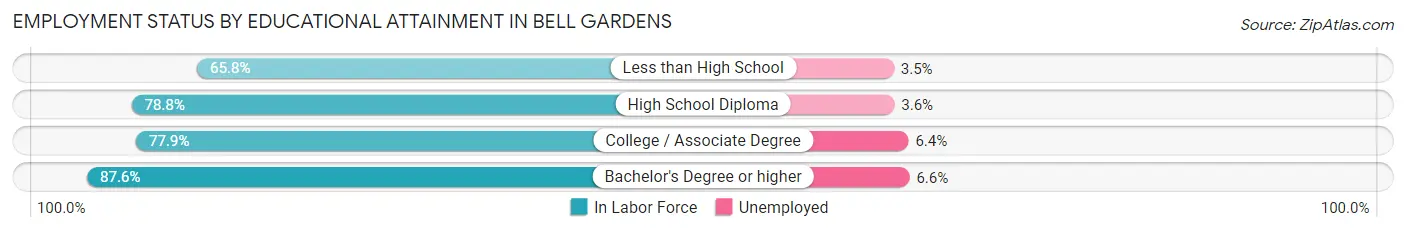
| Educational Attainment | In Labor Force | Unemployed |
| Less than High School | 5,813 (65.8%) | 309 (3.5%) |
| High School Diploma | 4,909 (78.8%) | 224 (3.6%) |
| College / Associate Degree | 3,028 (77.9%) | 249 (6.4%) |
| Bachelor's Degree or higher | 1,242 (87.6%) | 94 (6.6%) |
| Total | 14,992 (73.6%) | 896 (4.4%) |
Employment Occupations by Sex in Bell Gardens
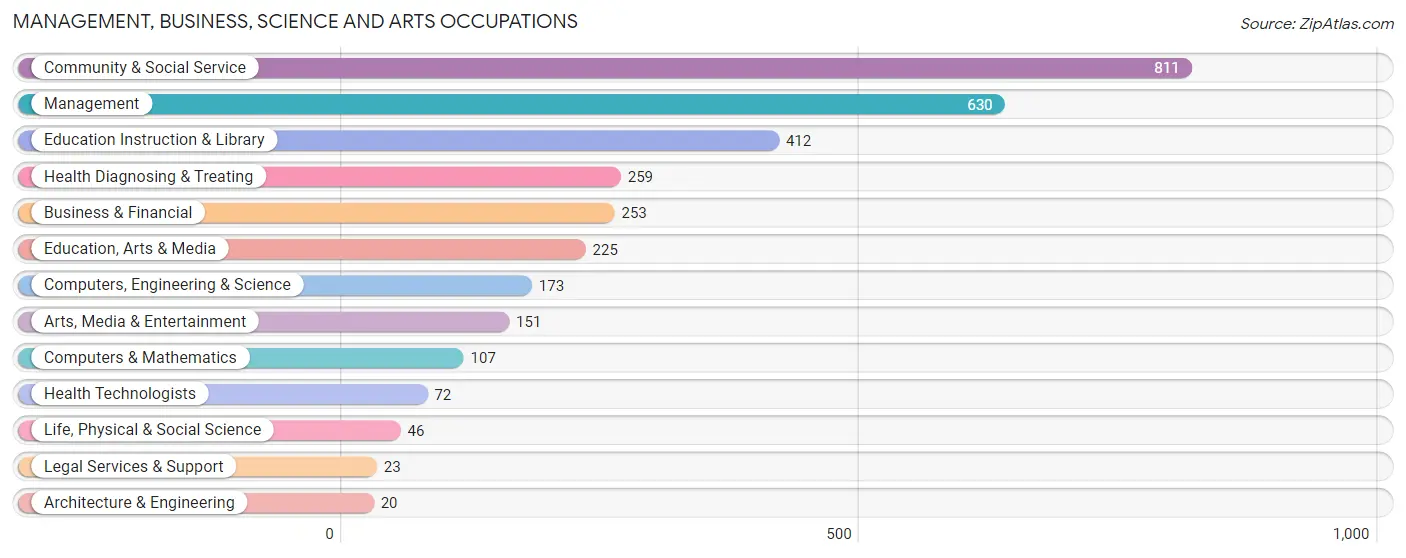
Management, Business, Science and Arts Occupations
The most common Management, Business, Science and Arts occupations in Bell Gardens are Community & Social Service (811 | 4.8%), Management (630 | 3.7%), Education Instruction & Library (412 | 2.4%), Health Diagnosing & Treating (259 | 1.5%), and Business & Financial (253 | 1.5%).
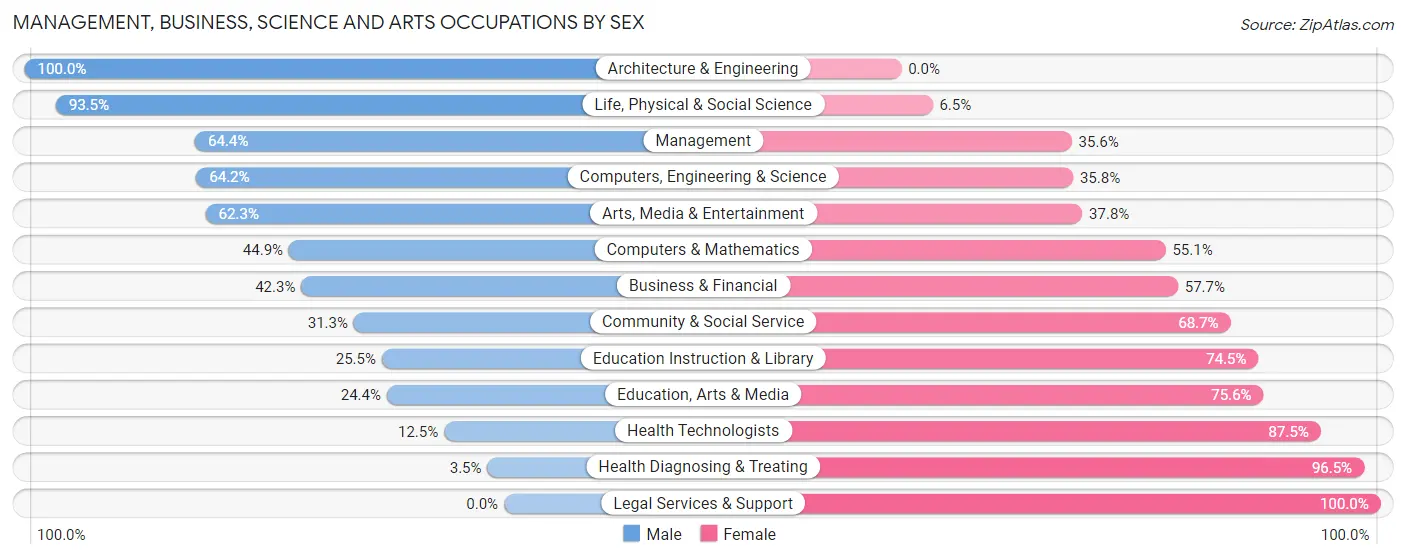
Management, Business, Science and Arts Occupations by Sex
Within the Management, Business, Science and Arts occupations in Bell Gardens, the most male-oriented occupations are Architecture & Engineering (100.0%), Life, Physical & Social Science (93.5%), and Management (64.4%), while the most female-oriented occupations are Legal Services & Support (100.0%), Health Diagnosing & Treating (96.5%), and Health Technologists (87.5%).
| Occupation | Male | Female |
| Management | 406 (64.4%) | 224 (35.6%) |
| Business & Financial | 107 (42.3%) | 146 (57.7%) |
| Computers, Engineering & Science | 111 (64.2%) | 62 (35.8%) |
| Computers & Mathematics | 48 (44.9%) | 59 (55.1%) |
| Architecture & Engineering | 20 (100.0%) | 0 (0.0%) |
| Life, Physical & Social Science | 43 (93.5%) | 3 (6.5%) |
| Community & Social Service | 254 (31.3%) | 557 (68.7%) |
| Education, Arts & Media | 55 (24.4%) | 170 (75.6%) |
| Legal Services & Support | 0 (0.0%) | 23 (100.0%) |
| Education Instruction & Library | 105 (25.5%) | 307 (74.5%) |
| Arts, Media & Entertainment | 94 (62.3%) | 57 (37.8%) |
| Health Diagnosing & Treating | 9 (3.5%) | 250 (96.5%) |
| Health Technologists | 9 (12.5%) | 63 (87.5%) |
| Total (Category) | 887 (41.7%) | 1,239 (58.3%) |
| Total (Overall) | 9,962 (58.6%) | 7,033 (41.4%) |
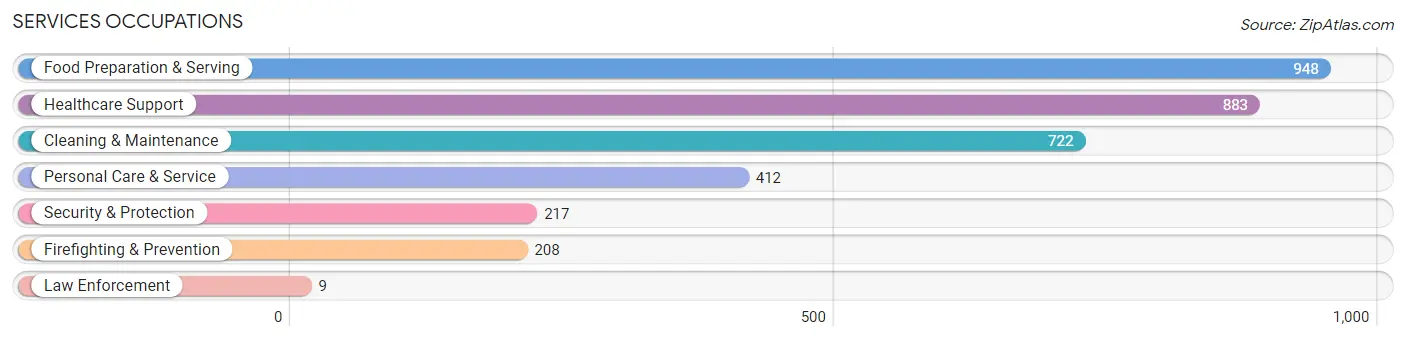
Services Occupations
The most common Services occupations in Bell Gardens are Food Preparation & Serving (948 | 5.6%), Healthcare Support (883 | 5.2%), Cleaning & Maintenance (722 | 4.3%), Personal Care & Service (412 | 2.4%), and Security & Protection (217 | 1.3%).
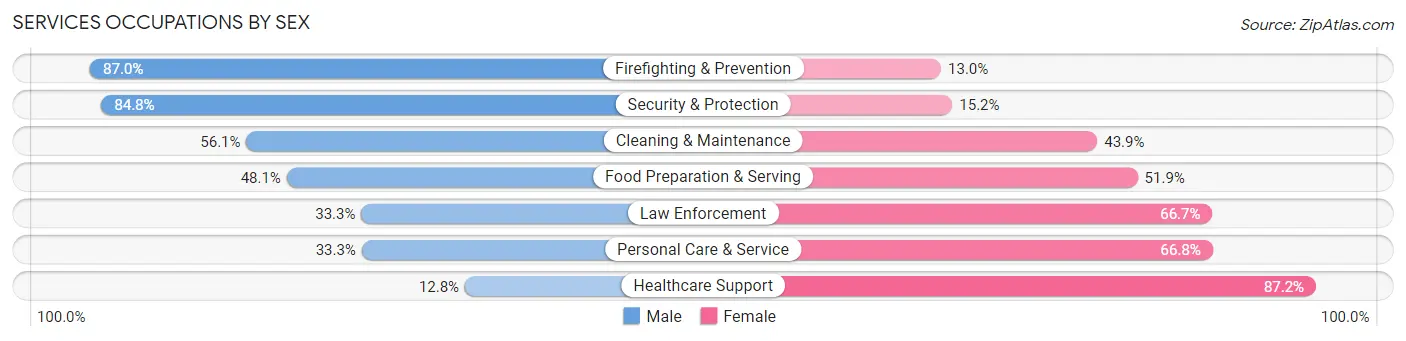
Services Occupations by Sex
Within the Services occupations in Bell Gardens, the most male-oriented occupations are Firefighting & Prevention (87.0%), Security & Protection (84.8%), and Cleaning & Maintenance (56.1%), while the most female-oriented occupations are Healthcare Support (87.2%), Personal Care & Service (66.7%), and Law Enforcement (66.7%).
| Occupation | Male | Female |
| Healthcare Support | 113 (12.8%) | 770 (87.2%) |
| Security & Protection | 184 (84.8%) | 33 (15.2%) |
| Firefighting & Prevention | 181 (87.0%) | 27 (13.0%) |
| Law Enforcement | 3 (33.3%) | 6 (66.7%) |
| Food Preparation & Serving | 456 (48.1%) | 492 (51.9%) |
| Cleaning & Maintenance | 405 (56.1%) | 317 (43.9%) |
| Personal Care & Service | 137 (33.3%) | 275 (66.7%) |
| Total (Category) | 1,295 (40.7%) | 1,887 (59.3%) |
| Total (Overall) | 9,962 (58.6%) | 7,033 (41.4%) |
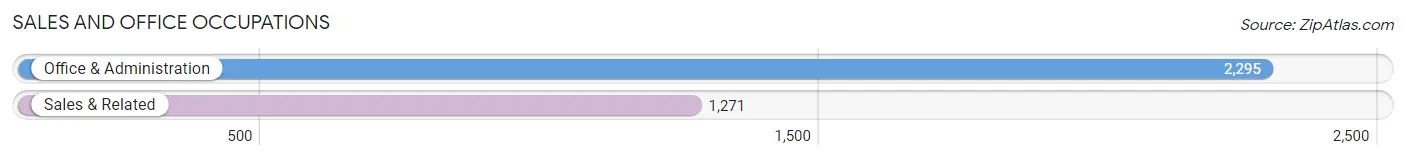
Sales and Office Occupations
The most common Sales and Office occupations in Bell Gardens are Office & Administration (2,295 | 13.5%), and Sales & Related (1,271 | 7.5%).
Sales and Office Occupations by Sex
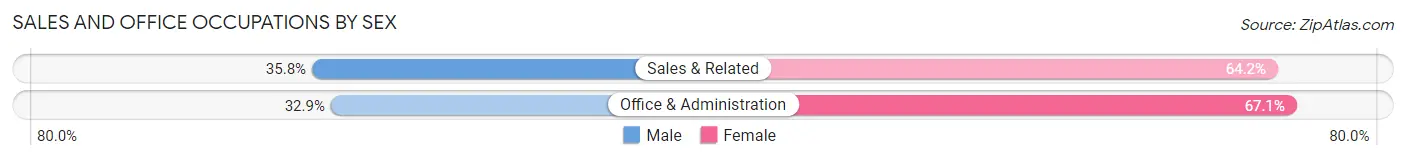
| Occupation | Male | Female |
| Sales & Related | 455 (35.8%) | 816 (64.2%) |
| Office & Administration | 755 (32.9%) | 1,540 (67.1%) |
| Total (Category) | 1,210 (33.9%) | 2,356 (66.1%) |
| Total (Overall) | 9,962 (58.6%) | 7,033 (41.4%) |
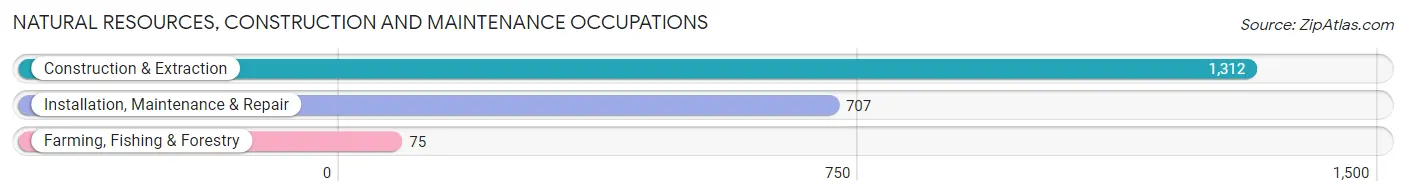
Natural Resources, Construction and Maintenance Occupations
The most common Natural Resources, Construction and Maintenance occupations in Bell Gardens are Construction & Extraction (1,312 | 7.7%), Installation, Maintenance & Repair (707 | 4.2%), and Farming, Fishing & Forestry (75 | 0.4%).
Natural Resources, Construction and Maintenance Occupations by Sex
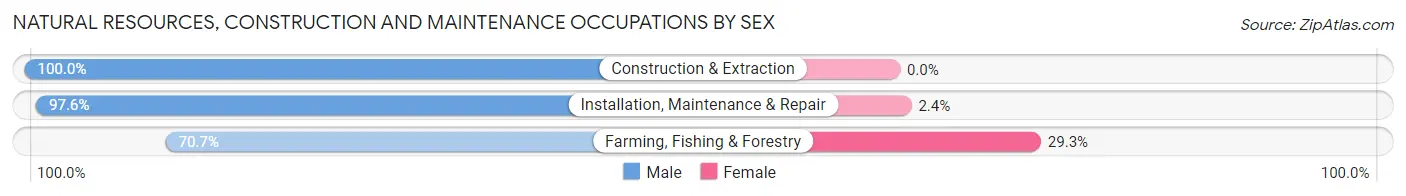
| Occupation | Male | Female |
| Farming, Fishing & Forestry | 53 (70.7%) | 22 (29.3%) |
| Construction & Extraction | 1,312 (100.0%) | 0 (0.0%) |
| Installation, Maintenance & Repair | 690 (97.6%) | 17 (2.4%) |
| Total (Category) | 2,055 (98.1%) | 39 (1.9%) |
| Total (Overall) | 9,962 (58.6%) | 7,033 (41.4%) |
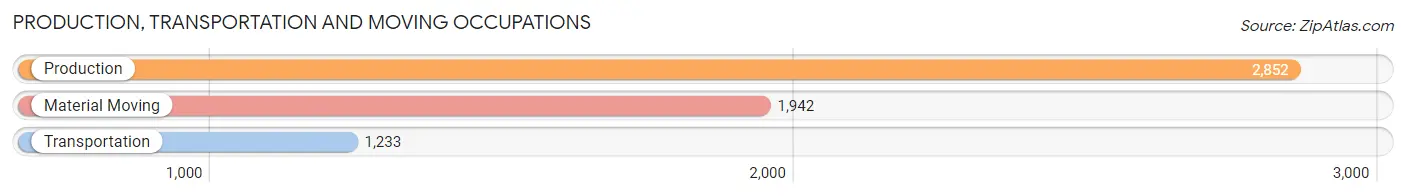
Production, Transportation and Moving Occupations
The most common Production, Transportation and Moving occupations in Bell Gardens are Production (2,852 | 16.8%), Material Moving (1,942 | 11.4%), and Transportation (1,233 | 7.3%).
Production, Transportation and Moving Occupations by Sex
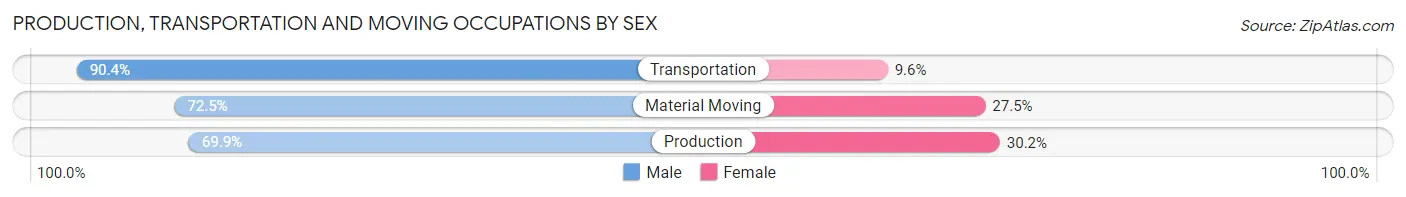
| Occupation | Male | Female |
| Production | 1,992 (69.9%) | 860 (30.1%) |
| Transportation | 1,115 (90.4%) | 118 (9.6%) |
| Material Moving | 1,408 (72.5%) | 534 (27.5%) |
| Total (Category) | 4,515 (74.9%) | 1,512 (25.1%) |
| Total (Overall) | 9,962 (58.6%) | 7,033 (41.4%) |
Employment Industries by Sex in Bell Gardens
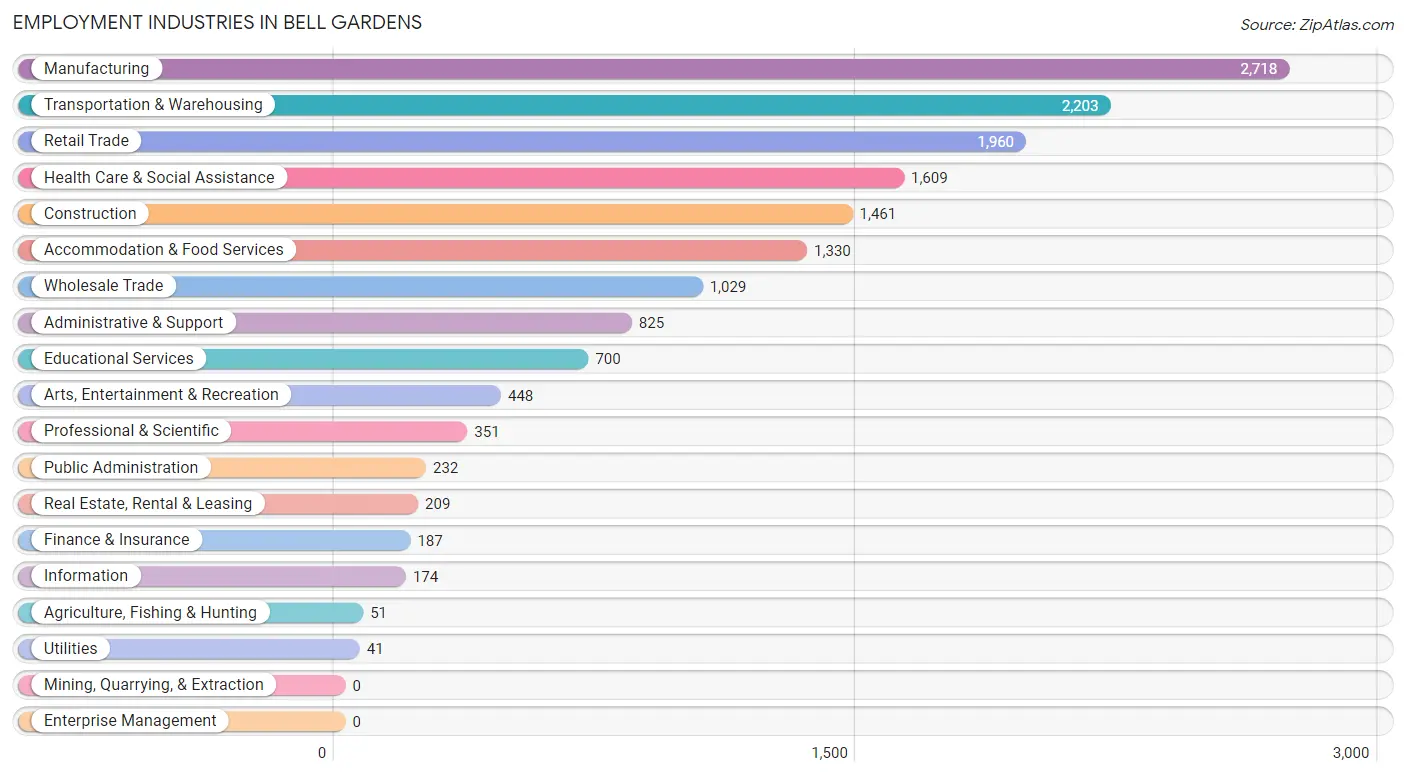
Employment Industries in Bell Gardens
The major employment industries in Bell Gardens include Manufacturing (2,718 | 16.0%), Transportation & Warehousing (2,203 | 13.0%), Retail Trade (1,960 | 11.5%), Health Care & Social Assistance (1,609 | 9.5%), and Construction (1,461 | 8.6%).
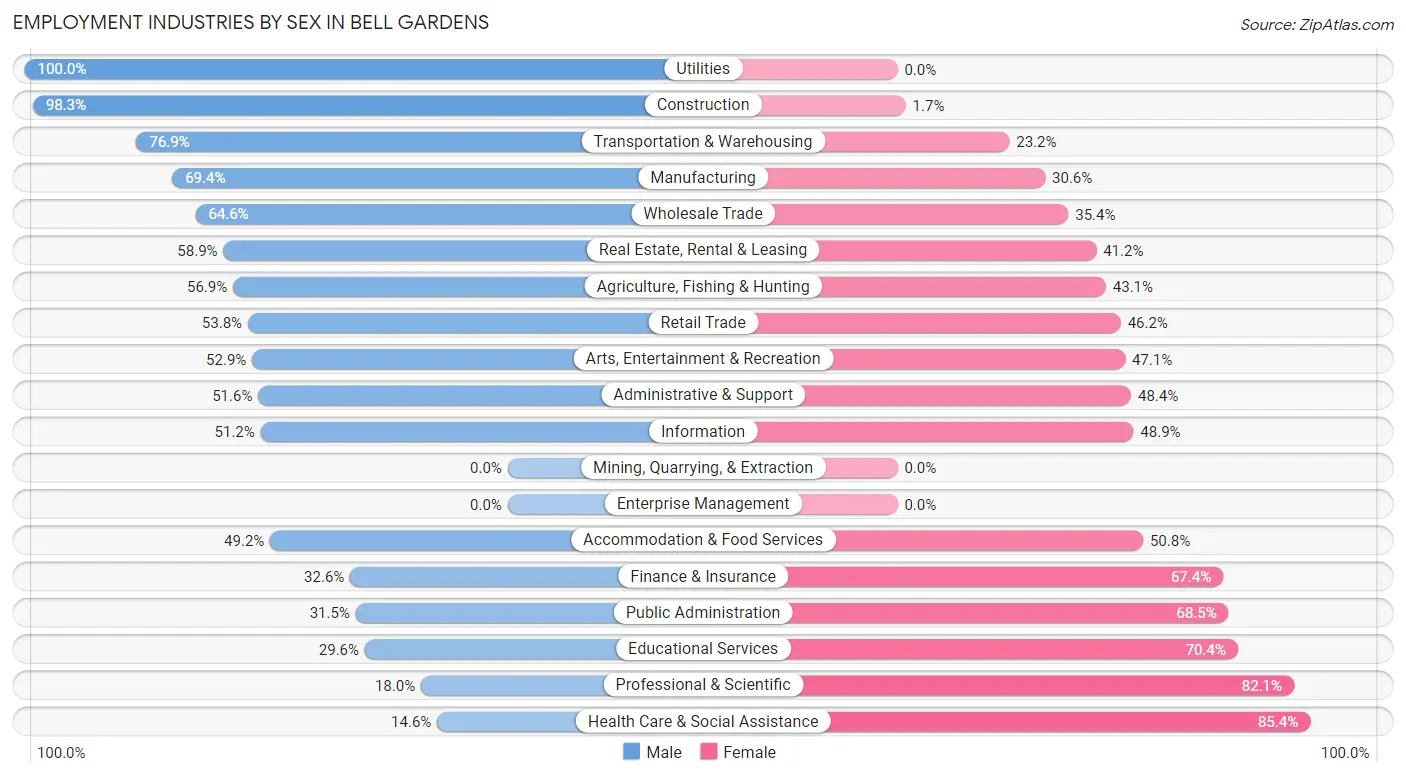
Employment Industries by Sex in Bell Gardens
The Bell Gardens industries that see more men than women are Utilities (100.0%), Construction (98.3%), and Transportation & Warehousing (76.8%), whereas the industries that tend to have a higher number of women are Health Care & Social Assistance (85.4%), Professional & Scientific (82.1%), and Educational Services (70.4%).
| Industry | Male | Female |
| Agriculture, Fishing & Hunting | 29 (56.9%) | 22 (43.1%) |
| Mining, Quarrying, & Extraction | 0 (0.0%) | 0 (0.0%) |
| Construction | 1,436 (98.3%) | 25 (1.7%) |
| Manufacturing | 1,887 (69.4%) | 831 (30.6%) |
| Wholesale Trade | 665 (64.6%) | 364 (35.4%) |
| Retail Trade | 1,054 (53.8%) | 906 (46.2%) |
| Transportation & Warehousing | 1,693 (76.8%) | 510 (23.2%) |
| Utilities | 41 (100.0%) | 0 (0.0%) |
| Information | 89 (51.1%) | 85 (48.8%) |
| Finance & Insurance | 61 (32.6%) | 126 (67.4%) |
| Real Estate, Rental & Leasing | 123 (58.9%) | 86 (41.1%) |
| Professional & Scientific | 63 (17.9%) | 288 (82.1%) |
| Enterprise Management | 0 (0.0%) | 0 (0.0%) |
| Administrative & Support | 426 (51.6%) | 399 (48.4%) |
| Educational Services | 207 (29.6%) | 493 (70.4%) |
| Health Care & Social Assistance | 235 (14.6%) | 1,374 (85.4%) |
| Arts, Entertainment & Recreation | 237 (52.9%) | 211 (47.1%) |
| Accommodation & Food Services | 654 (49.2%) | 676 (50.8%) |
| Public Administration | 73 (31.5%) | 159 (68.5%) |
| Total | 9,962 (58.6%) | 7,033 (41.4%) |
Education in Bell Gardens
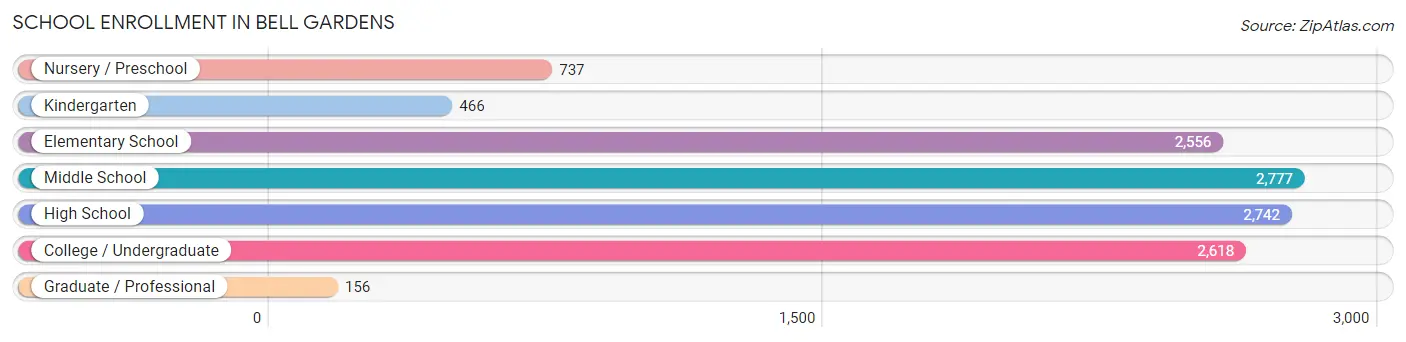
School Enrollment in Bell Gardens
The most common levels of schooling among the 12,052 students in Bell Gardens are middle school (2,777 | 23.0%), high school (2,742 | 22.8%), and college / undergraduate (2,618 | 21.7%).
| School Level | # Students | % Students |
| Nursery / Preschool | 737 | 6.1% |
| Kindergarten | 466 | 3.9% |
| Elementary School | 2,556 | 21.2% |
| Middle School | 2,777 | 23.0% |
| High School | 2,742 | 22.8% |
| College / Undergraduate | 2,618 | 21.7% |
| Graduate / Professional | 156 | 1.3% |
| Total | 12,052 | 100.0% |
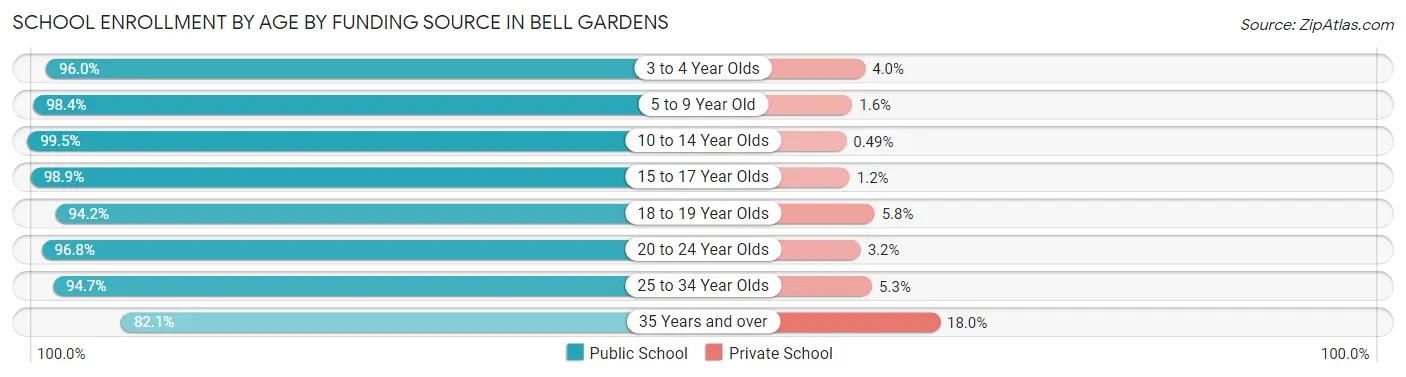
School Enrollment by Age by Funding Source in Bell Gardens
Out of a total of 12,052 students who are enrolled in schools in Bell Gardens, 301 (2.5%) attend a private institution, while the remaining 11,751 (97.5%) are enrolled in public schools. The age group of 35 years and over has the highest likelihood of being enrolled in private schools, with 56 (17.9% in the age bracket) enrolled. Conversely, the age group of 10 to 14 year olds has the lowest likelihood of being enrolled in a private school, with 3,443 (99.5% in the age bracket) attending a public institution.
| Age Bracket | Public School | Private School |
| 3 to 4 Year Olds | 620 (96.0%) | 26 (4.0%) |
| 5 to 9 Year Old | 2,875 (98.4%) | 47 (1.6%) |
| 10 to 14 Year Olds | 3,443 (99.5%) | 17 (0.5%) |
| 15 to 17 Year Olds | 1,804 (98.9%) | 21 (1.1%) |
| 18 to 19 Year Olds | 911 (94.2%) | 56 (5.8%) |
| 20 to 24 Year Olds | 1,129 (96.8%) | 37 (3.2%) |
| 25 to 34 Year Olds | 714 (94.7%) | 40 (5.3%) |
| 35 Years and over | 256 (82.1%) | 56 (17.9%) |
| Total | 11,751 (97.5%) | 301 (2.5%) |
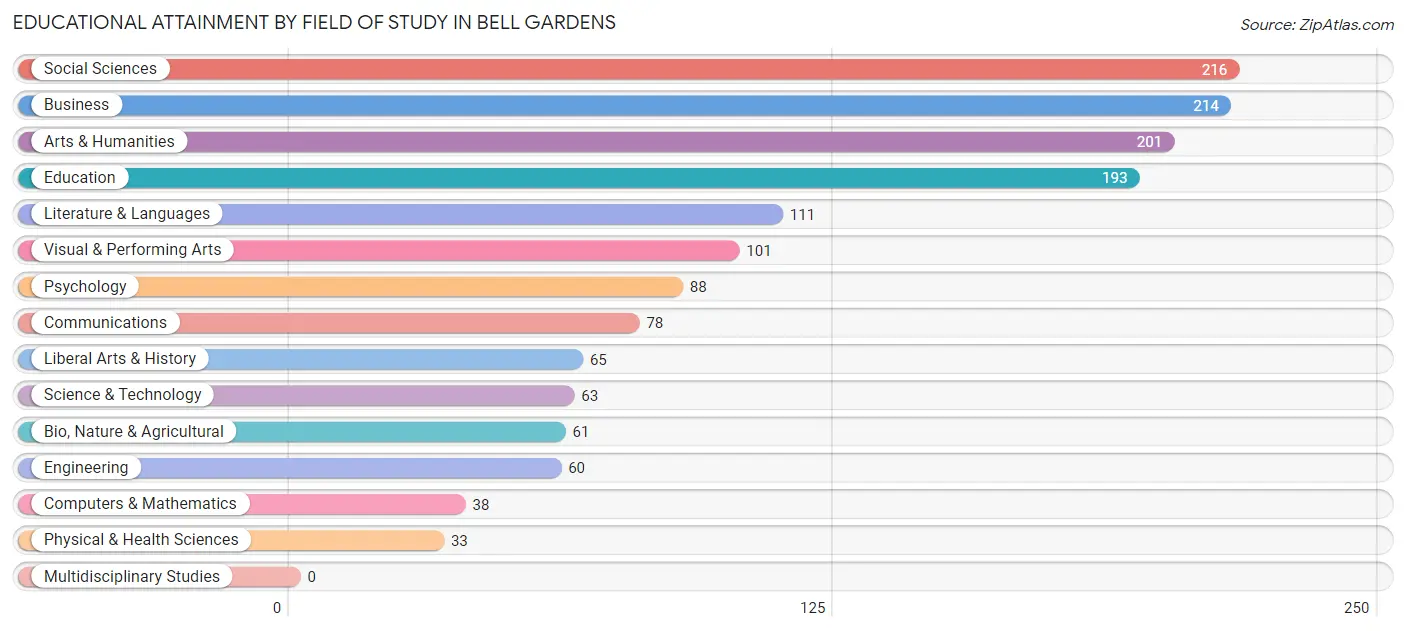
Educational Attainment by Field of Study in Bell Gardens
Social sciences (216 | 14.2%), business (214 | 14.1%), arts & humanities (201 | 13.2%), education (193 | 12.7%), and literature & languages (111 | 7.3%) are the most common fields of study among 1,522 individuals in Bell Gardens who have obtained a bachelor's degree or higher.
| Field of Study | # Graduates | % Graduates |
| Computers & Mathematics | 38 | 2.5% |
| Bio, Nature & Agricultural | 61 | 4.0% |
| Physical & Health Sciences | 33 | 2.2% |
| Psychology | 88 | 5.8% |
| Social Sciences | 216 | 14.2% |
| Engineering | 60 | 3.9% |
| Multidisciplinary Studies | 0 | 0.0% |
| Science & Technology | 63 | 4.1% |
| Business | 214 | 14.1% |
| Education | 193 | 12.7% |
| Literature & Languages | 111 | 7.3% |
| Liberal Arts & History | 65 | 4.3% |
| Visual & Performing Arts | 101 | 6.6% |
| Communications | 78 | 5.1% |
| Arts & Humanities | 201 | 13.2% |
| Total | 1,522 | 100.0% |
Transportation & Commute in Bell Gardens
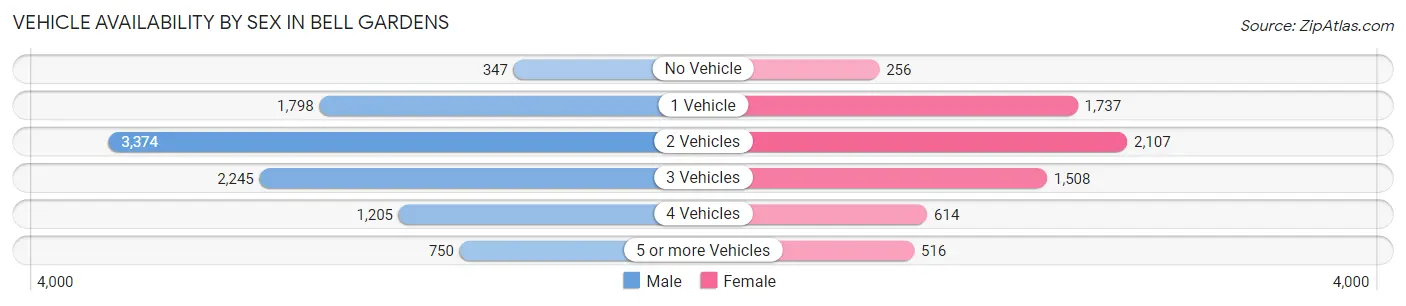
Vehicle Availability by Sex in Bell Gardens
The most prevalent vehicle ownership categories in Bell Gardens are males with 2 vehicles (3,374, accounting for 34.7%) and females with 2 vehicles (2,107, making up 50.1%).
| Vehicles Available | Male | Female |
| No Vehicle | 347 (3.6%) | 256 (3.8%) |
| 1 Vehicle | 1,798 (18.5%) | 1,737 (25.8%) |
| 2 Vehicles | 3,374 (34.7%) | 2,107 (31.3%) |
| 3 Vehicles | 2,245 (23.1%) | 1,508 (22.4%) |
| 4 Vehicles | 1,205 (12.4%) | 614 (9.1%) |
| 5 or more Vehicles | 750 (7.7%) | 516 (7.7%) |
| Total | 9,719 (100.0%) | 6,738 (100.0%) |
Commute Time in Bell Gardens
The most frequently occuring commute durations in Bell Gardens are 30 to 34 minutes (4,513 commuters, 28.8%), 20 to 24 minutes (3,271 commuters, 20.9%), and 15 to 19 minutes (1,830 commuters, 11.7%).
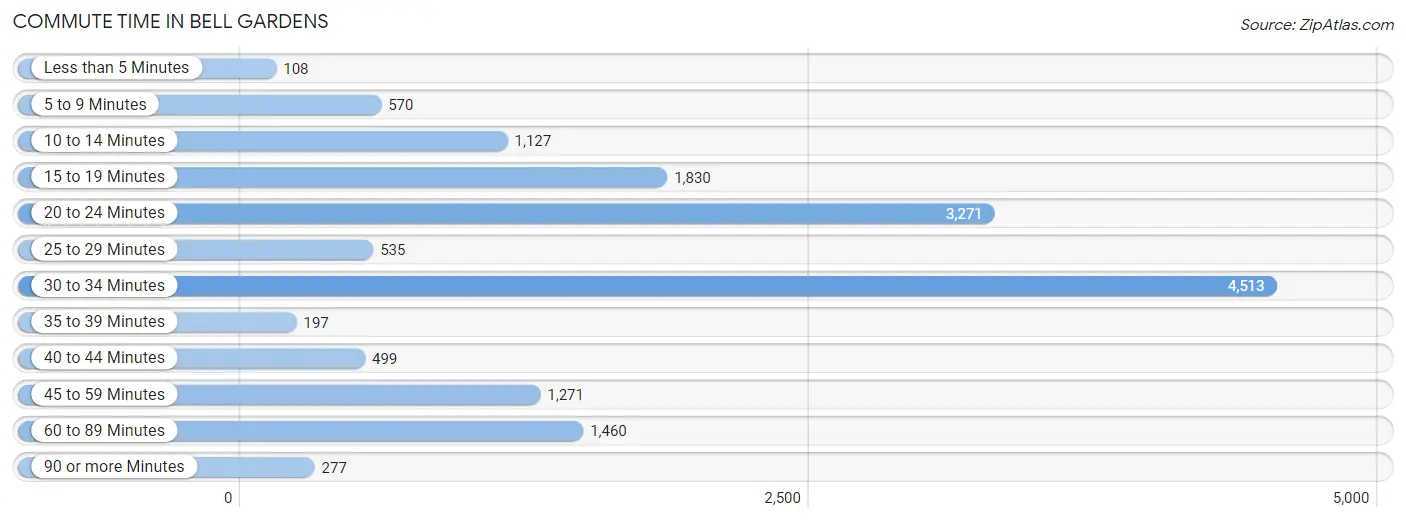
| Commute Time | # Commuters | % Commuters |
| Less than 5 Minutes | 108 | 0.7% |
| 5 to 9 Minutes | 570 | 3.6% |
| 10 to 14 Minutes | 1,127 | 7.2% |
| 15 to 19 Minutes | 1,830 | 11.7% |
| 20 to 24 Minutes | 3,271 | 20.9% |
| 25 to 29 Minutes | 535 | 3.4% |
| 30 to 34 Minutes | 4,513 | 28.8% |
| 35 to 39 Minutes | 197 | 1.3% |
| 40 to 44 Minutes | 499 | 3.2% |
| 45 to 59 Minutes | 1,271 | 8.1% |
| 60 to 89 Minutes | 1,460 | 9.3% |
| 90 or more Minutes | 277 | 1.8% |
Commute Time by Sex in Bell Gardens
The most common commute times in Bell Gardens are 30 to 34 minutes (3,019 commuters, 31.9%) for males and 30 to 34 minutes (1,494 commuters, 24.1%) for females.
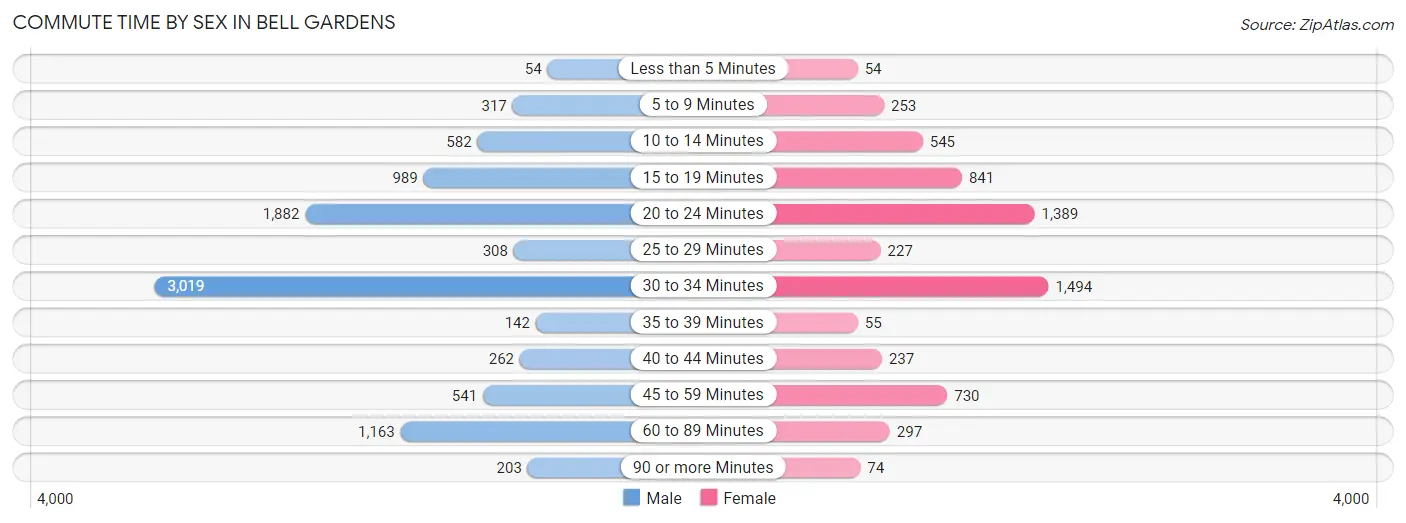
| Commute Time | Male | Female |
| Less than 5 Minutes | 54 (0.6%) | 54 (0.9%) |
| 5 to 9 Minutes | 317 (3.4%) | 253 (4.1%) |
| 10 to 14 Minutes | 582 (6.1%) | 545 (8.8%) |
| 15 to 19 Minutes | 989 (10.4%) | 841 (13.6%) |
| 20 to 24 Minutes | 1,882 (19.9%) | 1,389 (22.4%) |
| 25 to 29 Minutes | 308 (3.3%) | 227 (3.7%) |
| 30 to 34 Minutes | 3,019 (31.9%) | 1,494 (24.1%) |
| 35 to 39 Minutes | 142 (1.5%) | 55 (0.9%) |
| 40 to 44 Minutes | 262 (2.8%) | 237 (3.8%) |
| 45 to 59 Minutes | 541 (5.7%) | 730 (11.8%) |
| 60 to 89 Minutes | 1,163 (12.3%) | 297 (4.8%) |
| 90 or more Minutes | 203 (2.1%) | 74 (1.2%) |
Time of Departure to Work by Sex in Bell Gardens
The most frequent times of departure to work in Bell Gardens are 12:00 AM to 4:59 AM (1,527, 16.1%) for males and 7:00 AM to 7:29 AM (952, 15.4%) for females.
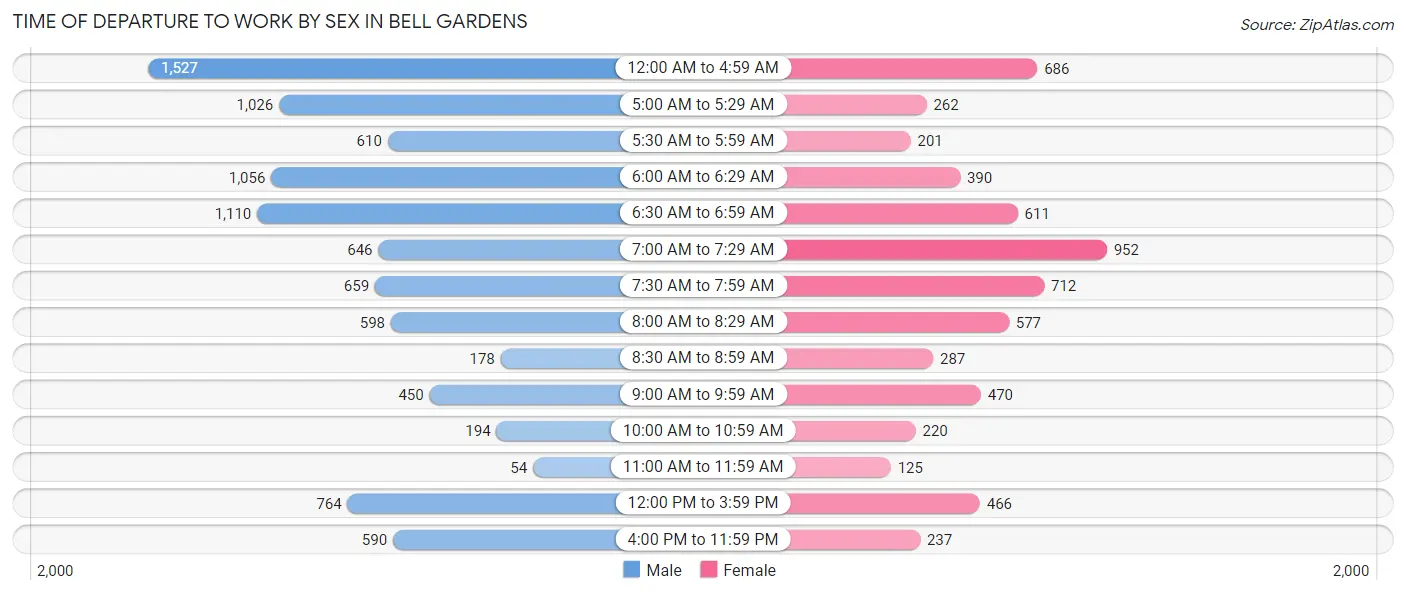
| Time of Departure | Male | Female |
| 12:00 AM to 4:59 AM | 1,527 (16.1%) | 686 (11.1%) |
| 5:00 AM to 5:29 AM | 1,026 (10.8%) | 262 (4.2%) |
| 5:30 AM to 5:59 AM | 610 (6.5%) | 201 (3.2%) |
| 6:00 AM to 6:29 AM | 1,056 (11.2%) | 390 (6.3%) |
| 6:30 AM to 6:59 AM | 1,110 (11.7%) | 611 (9.9%) |
| 7:00 AM to 7:29 AM | 646 (6.8%) | 952 (15.4%) |
| 7:30 AM to 7:59 AM | 659 (7.0%) | 712 (11.5%) |
| 8:00 AM to 8:29 AM | 598 (6.3%) | 577 (9.3%) |
| 8:30 AM to 8:59 AM | 178 (1.9%) | 287 (4.6%) |
| 9:00 AM to 9:59 AM | 450 (4.8%) | 470 (7.6%) |
| 10:00 AM to 10:59 AM | 194 (2.1%) | 220 (3.5%) |
| 11:00 AM to 11:59 AM | 54 (0.6%) | 125 (2.0%) |
| 12:00 PM to 3:59 PM | 764 (8.1%) | 466 (7.5%) |
| 4:00 PM to 11:59 PM | 590 (6.2%) | 237 (3.8%) |
| Total | 9,462 (100.0%) | 6,196 (100.0%) |
Housing Occupancy in Bell Gardens
Occupancy by Ownership in Bell Gardens
Of the total 9,523 dwellings in Bell Gardens, owner-occupied units account for 1,864 (19.6%), while renter-occupied units make up 7,659 (80.4%).
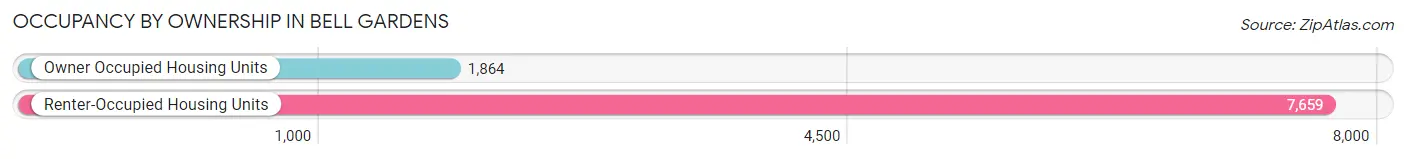
| Occupancy | # Housing Units | % Housing Units |
| Owner Occupied Housing Units | 1,864 | 19.6% |
| Renter-Occupied Housing Units | 7,659 | 80.4% |
| Total Occupied Housing Units | 9,523 | 100.0% |
Occupancy by Household Size in Bell Gardens
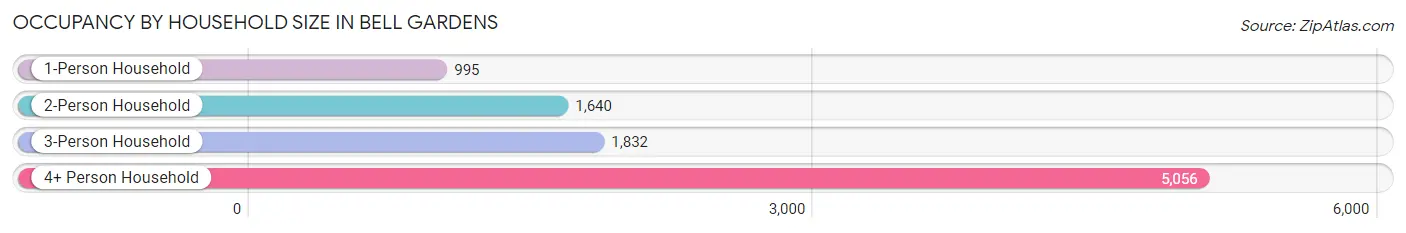
| Household Size | # Housing Units | % Housing Units |
| 1-Person Household | 995 | 10.4% |
| 2-Person Household | 1,640 | 17.2% |
| 3-Person Household | 1,832 | 19.2% |
| 4+ Person Household | 5,056 | 53.1% |
| Total Housing Units | 9,523 | 100.0% |
Occupancy by Ownership by Household Size in Bell Gardens
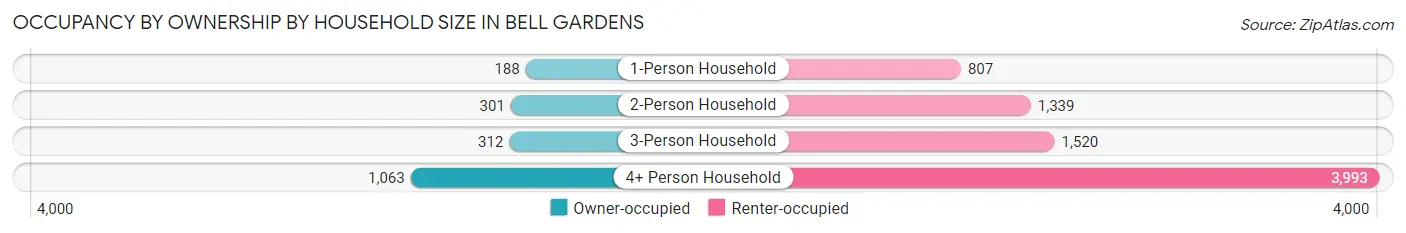
| Household Size | Owner-occupied | Renter-occupied |
| 1-Person Household | 188 (18.9%) | 807 (81.1%) |
| 2-Person Household | 301 (18.3%) | 1,339 (81.7%) |
| 3-Person Household | 312 (17.0%) | 1,520 (83.0%) |
| 4+ Person Household | 1,063 (21.0%) | 3,993 (79.0%) |
| Total Housing Units | 1,864 (19.6%) | 7,659 (80.4%) |
Occupancy by Educational Attainment in Bell Gardens
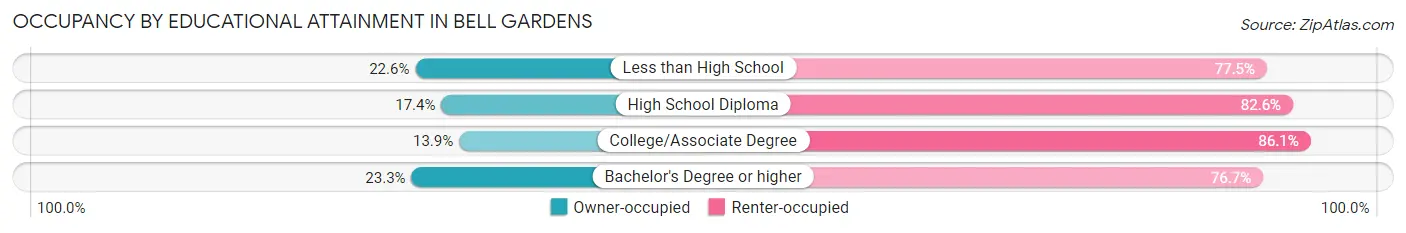
| Household Size | Owner-occupied | Renter-occupied |
| Less than High School | 1,082 (22.6%) | 3,717 (77.4%) |
| High School Diploma | 413 (17.4%) | 1,963 (82.6%) |
| College/Associate Degree | 262 (13.9%) | 1,627 (86.1%) |
| Bachelor's Degree or higher | 107 (23.3%) | 352 (76.7%) |
Occupancy by Age of Householder in Bell Gardens
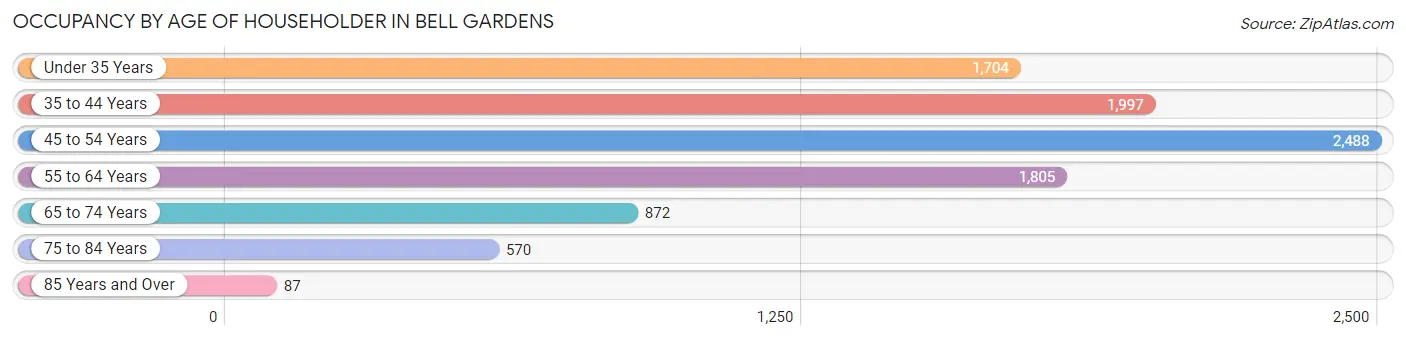
| Age Bracket | # Households | % Households |
| Under 35 Years | 1,704 | 17.9% |
| 35 to 44 Years | 1,997 | 21.0% |
| 45 to 54 Years | 2,488 | 26.1% |
| 55 to 64 Years | 1,805 | 19.0% |
| 65 to 74 Years | 872 | 9.2% |
| 75 to 84 Years | 570 | 6.0% |
| 85 Years and Over | 87 | 0.9% |
| Total | 9,523 | 100.0% |
Housing Finances in Bell Gardens
Median Income by Occupancy in Bell Gardens
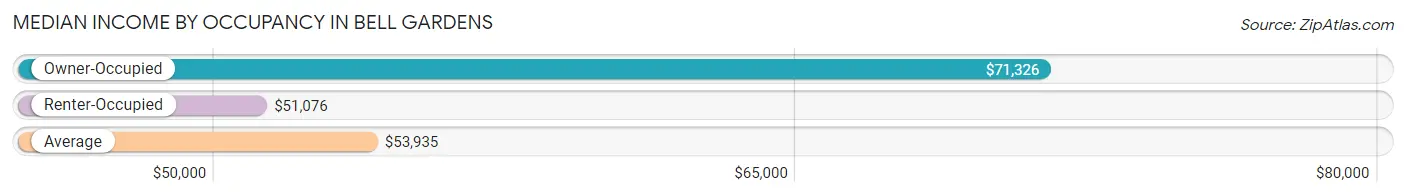
| Occupancy Type | # Households | Median Income |
| Owner-Occupied | 1,864 (19.6%) | $71,326 |
| Renter-Occupied | 7,659 (80.4%) | $51,076 |
| Average | 9,523 (100.0%) | $53,935 |
Occupancy by Householder Income Bracket in Bell Gardens
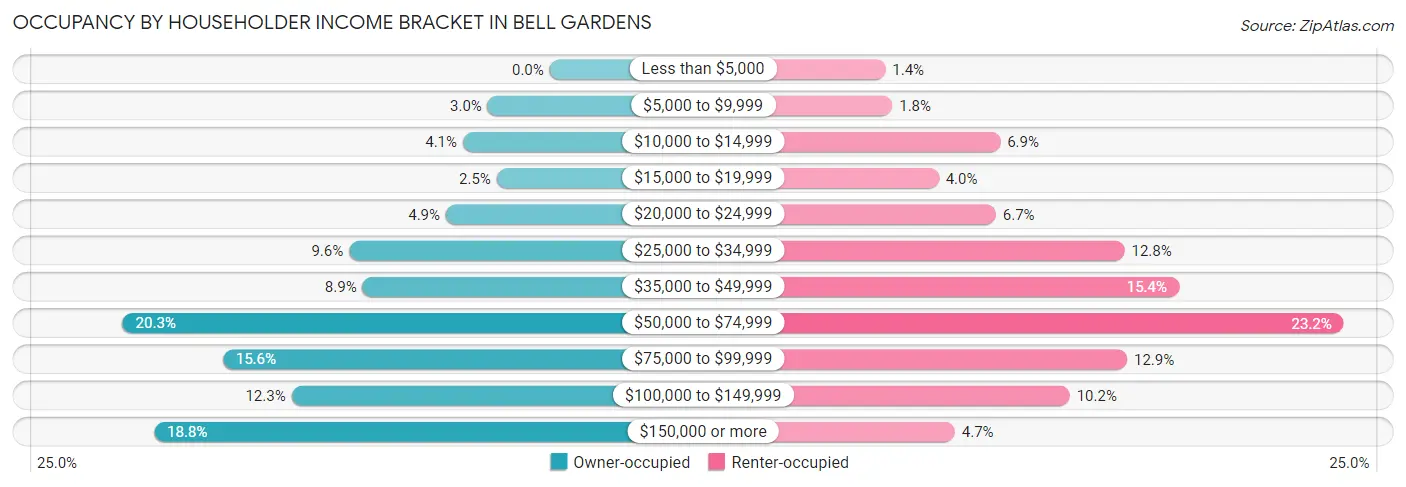
| Income Bracket | Owner-occupied | Renter-occupied |
| Less than $5,000 | 0 (0.0%) | 109 (1.4%) |
| $5,000 to $9,999 | 55 (2.9%) | 134 (1.8%) |
| $10,000 to $14,999 | 77 (4.1%) | 528 (6.9%) |
| $15,000 to $19,999 | 47 (2.5%) | 303 (4.0%) |
| $20,000 to $24,999 | 92 (4.9%) | 512 (6.7%) |
| $25,000 to $34,999 | 178 (9.6%) | 981 (12.8%) |
| $35,000 to $49,999 | 166 (8.9%) | 1,179 (15.4%) |
| $50,000 to $74,999 | 379 (20.3%) | 1,780 (23.2%) |
| $75,000 to $99,999 | 290 (15.6%) | 990 (12.9%) |
| $100,000 to $149,999 | 229 (12.3%) | 781 (10.2%) |
| $150,000 or more | 351 (18.8%) | 362 (4.7%) |
| Total | 1,864 (100.0%) | 7,659 (100.0%) |
Monthly Housing Cost Tiers in Bell Gardens
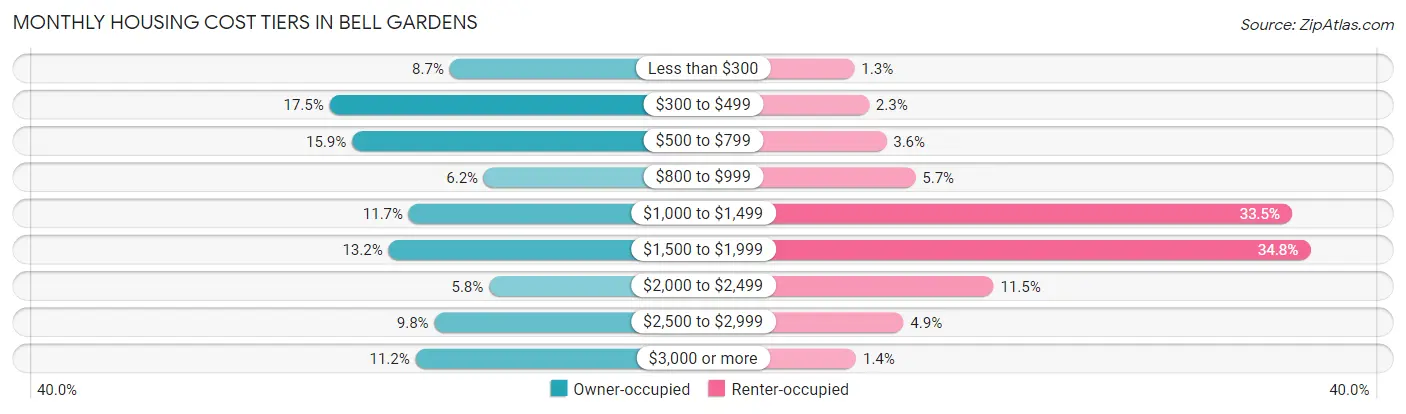
| Monthly Cost | Owner-occupied | Renter-occupied |
| Less than $300 | 162 (8.7%) | 96 (1.3%) |
| $300 to $499 | 327 (17.5%) | 178 (2.3%) |
| $500 to $799 | 296 (15.9%) | 276 (3.6%) |
| $800 to $999 | 115 (6.2%) | 440 (5.7%) |
| $1,000 to $1,499 | 218 (11.7%) | 2,563 (33.5%) |
| $1,500 to $1,999 | 246 (13.2%) | 2,666 (34.8%) |
| $2,000 to $2,499 | 108 (5.8%) | 881 (11.5%) |
| $2,500 to $2,999 | 183 (9.8%) | 372 (4.9%) |
| $3,000 or more | 209 (11.2%) | 105 (1.4%) |
| Total | 1,864 (100.0%) | 7,659 (100.0%) |
Physical Housing Characteristics in Bell Gardens
Housing Structures in Bell Gardens
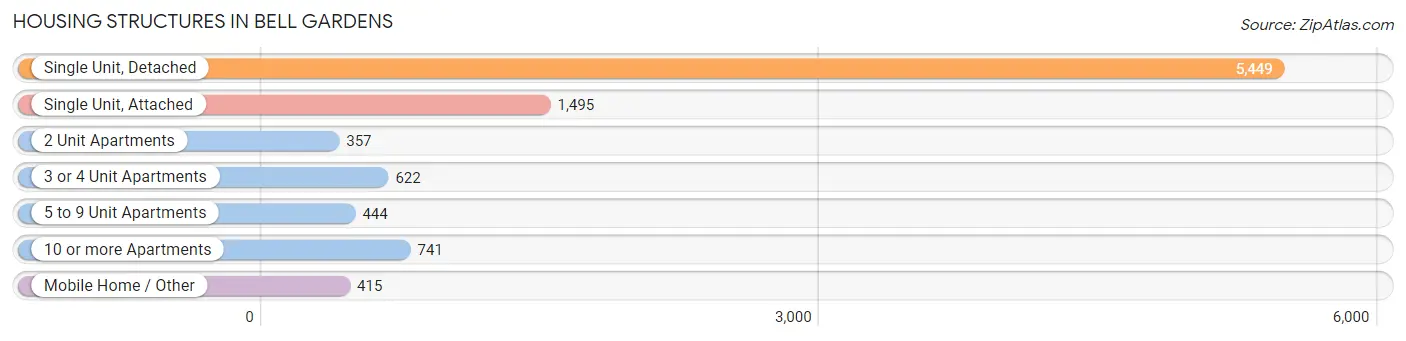
| Structure Type | # Housing Units | % Housing Units |
| Single Unit, Detached | 5,449 | 57.2% |
| Single Unit, Attached | 1,495 | 15.7% |
| 2 Unit Apartments | 357 | 3.7% |
| 3 or 4 Unit Apartments | 622 | 6.5% |
| 5 to 9 Unit Apartments | 444 | 4.7% |
| 10 or more Apartments | 741 | 7.8% |
| Mobile Home / Other | 415 | 4.4% |
| Total | 9,523 | 100.0% |
Housing Structures by Occupancy in Bell Gardens
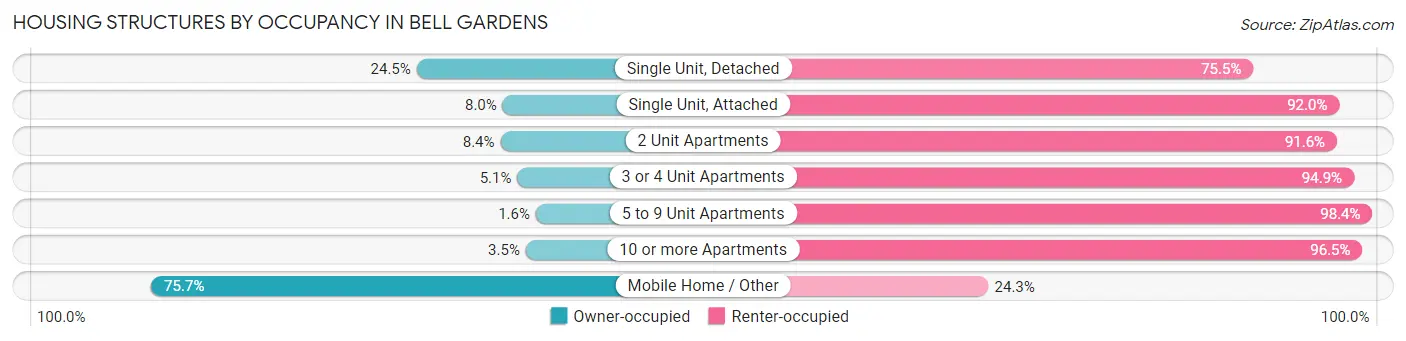
| Structure Type | Owner-occupied | Renter-occupied |
| Single Unit, Detached | 1,336 (24.5%) | 4,113 (75.5%) |
| Single Unit, Attached | 119 (8.0%) | 1,376 (92.0%) |
| 2 Unit Apartments | 30 (8.4%) | 327 (91.6%) |
| 3 or 4 Unit Apartments | 32 (5.1%) | 590 (94.9%) |
| 5 to 9 Unit Apartments | 7 (1.6%) | 437 (98.4%) |
| 10 or more Apartments | 26 (3.5%) | 715 (96.5%) |
| Mobile Home / Other | 314 (75.7%) | 101 (24.3%) |
| Total | 1,864 (19.6%) | 7,659 (80.4%) |
Housing Structures by Number of Rooms in Bell Gardens
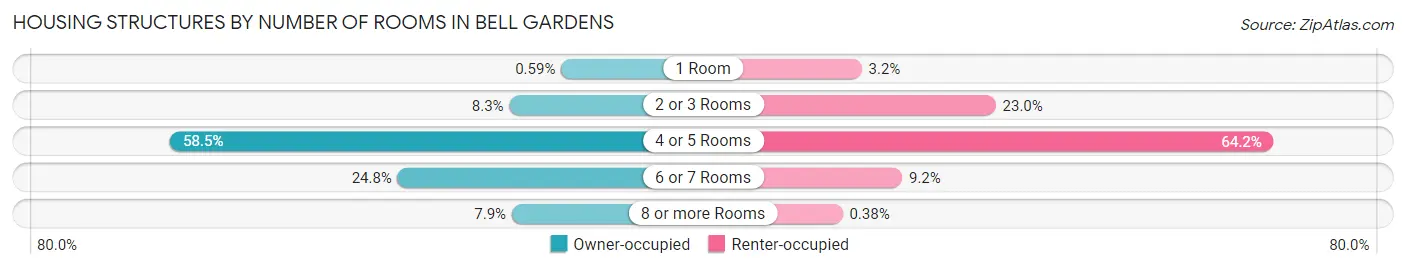
| Number of Rooms | Owner-occupied | Renter-occupied |
| 1 Room | 11 (0.6%) | 246 (3.2%) |
| 2 or 3 Rooms | 154 (8.3%) | 1,765 (23.0%) |
| 4 or 5 Rooms | 1,090 (58.5%) | 4,915 (64.2%) |
| 6 or 7 Rooms | 462 (24.8%) | 704 (9.2%) |
| 8 or more Rooms | 147 (7.9%) | 29 (0.4%) |
| Total | 1,864 (100.0%) | 7,659 (100.0%) |
Housing Structure by Heating Type in Bell Gardens
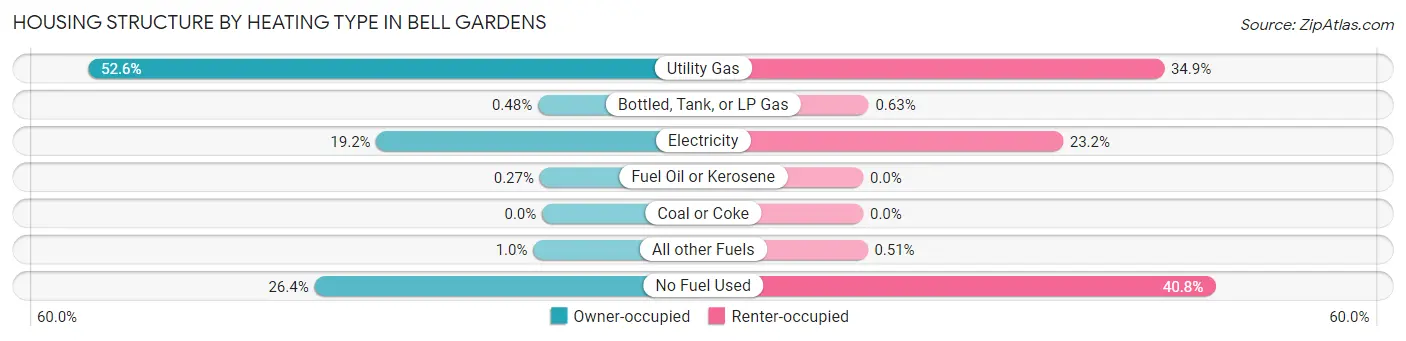
| Heating Type | Owner-occupied | Renter-occupied |
| Utility Gas | 981 (52.6%) | 2,672 (34.9%) |
| Bottled, Tank, or LP Gas | 9 (0.5%) | 48 (0.6%) |
| Electricity | 358 (19.2%) | 1,774 (23.2%) |
| Fuel Oil or Kerosene | 5 (0.3%) | 0 (0.0%) |
| Coal or Coke | 0 (0.0%) | 0 (0.0%) |
| All other Fuels | 19 (1.0%) | 39 (0.5%) |
| No Fuel Used | 492 (26.4%) | 3,126 (40.8%) |
| Total | 1,864 (100.0%) | 7,659 (100.0%) |
Household Vehicle Usage in Bell Gardens
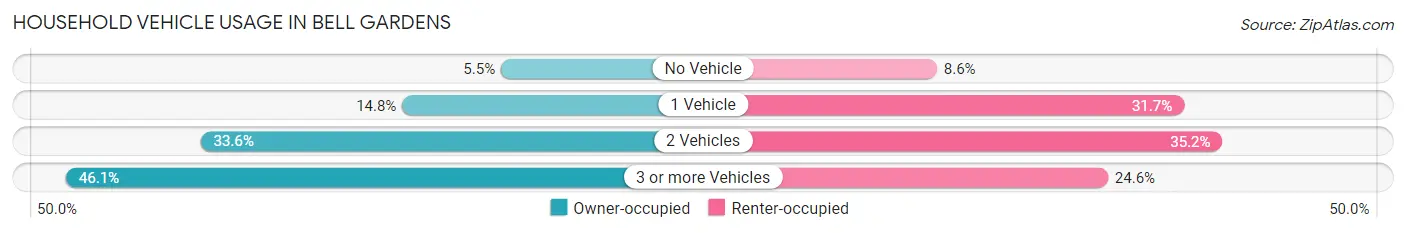
| Vehicles per Household | Owner-occupied | Renter-occupied |
| No Vehicle | 103 (5.5%) | 657 (8.6%) |
| 1 Vehicle | 275 (14.7%) | 2,424 (31.7%) |
| 2 Vehicles | 626 (33.6%) | 2,698 (35.2%) |
| 3 or more Vehicles | 860 (46.1%) | 1,880 (24.5%) |
| Total | 1,864 (100.0%) | 7,659 (100.0%) |
Real Estate & Mortgages in Bell Gardens
Real Estate and Mortgage Overview in Bell Gardens
| Characteristic | Without Mortgage | With Mortgage |
| Housing Units | 956 | 908 |
| Median Property Value | $430,800 | $491,200 |
| Median Household Income | $58,917 | $193 |
| Monthly Housing Costs | $499 | $209 |
| Real Estate Taxes | $2,631 | $0 |
Property Value by Mortgage Status in Bell Gardens
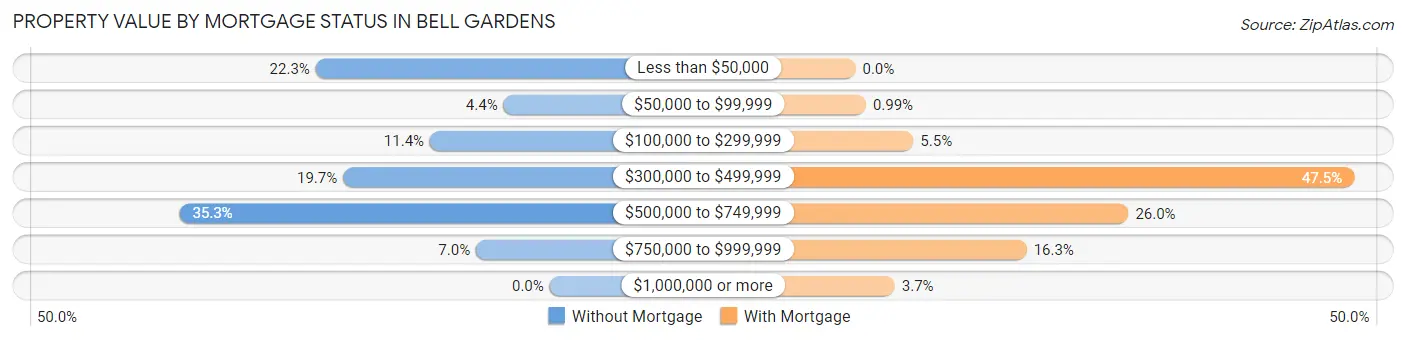
| Property Value | Without Mortgage | With Mortgage |
| Less than $50,000 | 213 (22.3%) | 0 (0.0%) |
| $50,000 to $99,999 | 42 (4.4%) | 9 (1.0%) |
| $100,000 to $299,999 | 109 (11.4%) | 50 (5.5%) |
| $300,000 to $499,999 | 188 (19.7%) | 431 (47.5%) |
| $500,000 to $749,999 | 337 (35.2%) | 236 (26.0%) |
| $750,000 to $999,999 | 67 (7.0%) | 148 (16.3%) |
| $1,000,000 or more | 0 (0.0%) | 34 (3.7%) |
| Total | 956 (100.0%) | 908 (100.0%) |
Household Income by Mortgage Status in Bell Gardens
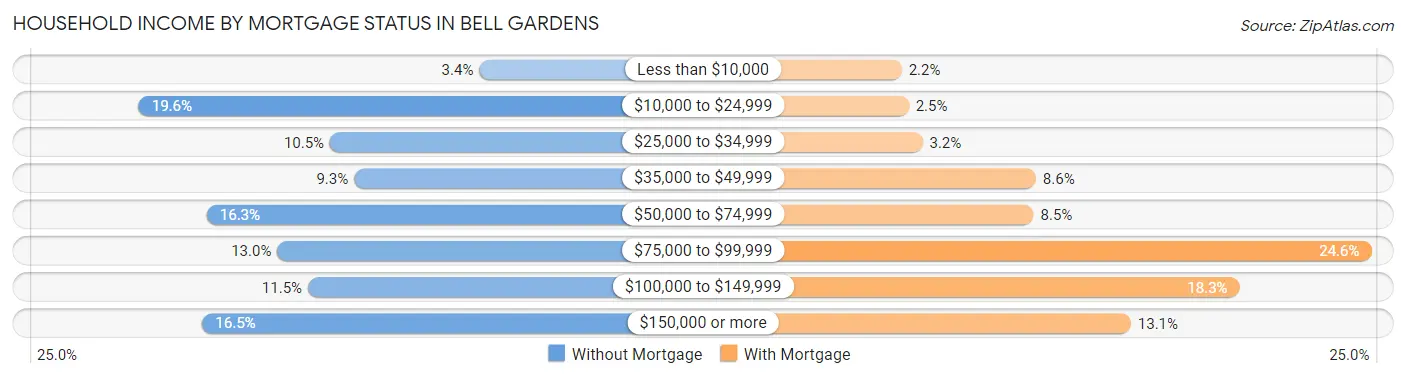
| Household Income | Without Mortgage | With Mortgage |
| Less than $10,000 | 32 (3.4%) | 20 (2.2%) |
| $10,000 to $24,999 | 187 (19.6%) | 23 (2.5%) |
| $25,000 to $34,999 | 100 (10.5%) | 29 (3.2%) |
| $35,000 to $49,999 | 89 (9.3%) | 78 (8.6%) |
| $50,000 to $74,999 | 156 (16.3%) | 77 (8.5%) |
| $75,000 to $99,999 | 124 (13.0%) | 223 (24.6%) |
| $100,000 to $149,999 | 110 (11.5%) | 166 (18.3%) |
| $150,000 or more | 158 (16.5%) | 119 (13.1%) |
| Total | 956 (100.0%) | 908 (100.0%) |
Property Value to Household Income Ratio in Bell Gardens
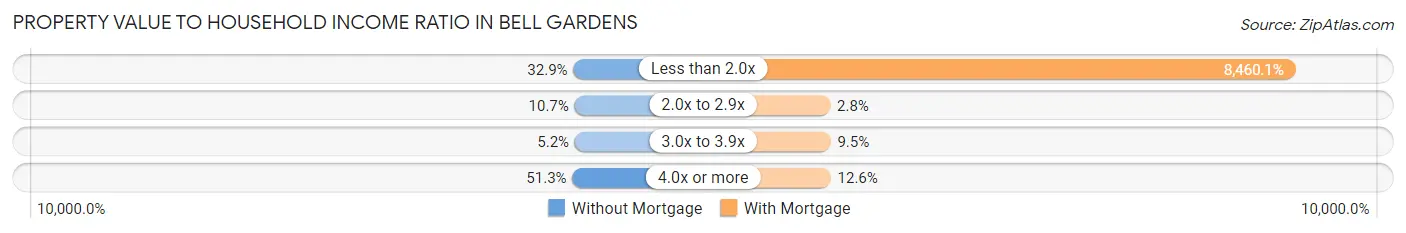
| Value-to-Income Ratio | Without Mortgage | With Mortgage |
| Less than 2.0x | 314 (32.9%) | 76,818 (8,460.1%) |
| 2.0x to 2.9x | 102 (10.7%) | 25 (2.8%) |
| 3.0x to 3.9x | 50 (5.2%) | 86 (9.5%) |
| 4.0x or more | 490 (51.3%) | 114 (12.6%) |
| Total | 956 (100.0%) | 908 (100.0%) |
Real Estate Taxes by Mortgage Status in Bell Gardens
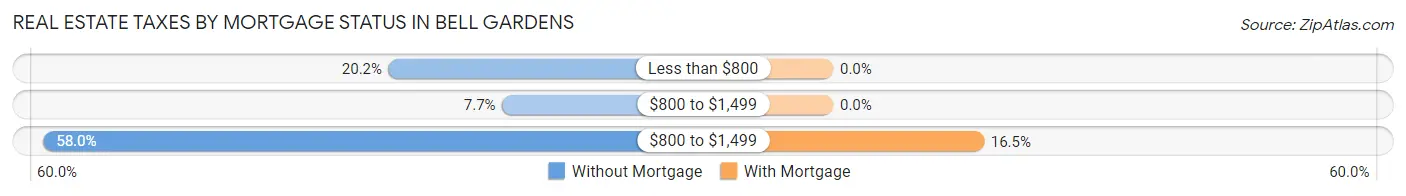
| Property Taxes | Without Mortgage | With Mortgage |
| Less than $800 | 193 (20.2%) | 0 (0.0%) |
| $800 to $1,499 | 74 (7.7%) | 0 (0.0%) |
| $800 to $1,499 | 554 (58.0%) | 150 (16.5%) |
| Total | 956 (100.0%) | 908 (100.0%) |
Health & Disability in Bell Gardens
Health Insurance Coverage by Age in Bell Gardens
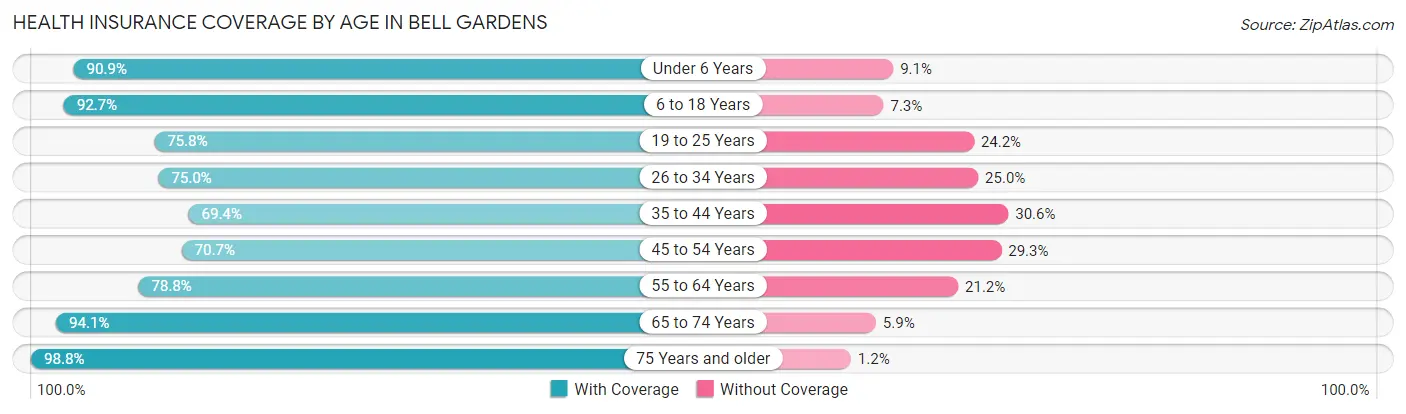
| Age Bracket | With Coverage | Without Coverage |
| Under 6 Years | 2,708 (90.9%) | 272 (9.1%) |
| 6 to 18 Years | 8,189 (92.7%) | 647 (7.3%) |
| 19 to 25 Years | 3,202 (75.8%) | 1,021 (24.2%) |
| 26 to 34 Years | 4,222 (75.0%) | 1,404 (25.0%) |
| 35 to 44 Years | 3,486 (69.4%) | 1,536 (30.6%) |
| 45 to 54 Years | 3,780 (70.7%) | 1,565 (29.3%) |
| 55 to 64 Years | 2,790 (78.8%) | 752 (21.2%) |
| 65 to 74 Years | 1,758 (94.1%) | 110 (5.9%) |
| 75 Years and older | 1,525 (98.8%) | 19 (1.2%) |
| Total | 31,660 (81.2%) | 7,326 (18.8%) |
Health Insurance Coverage by Citizenship Status in Bell Gardens
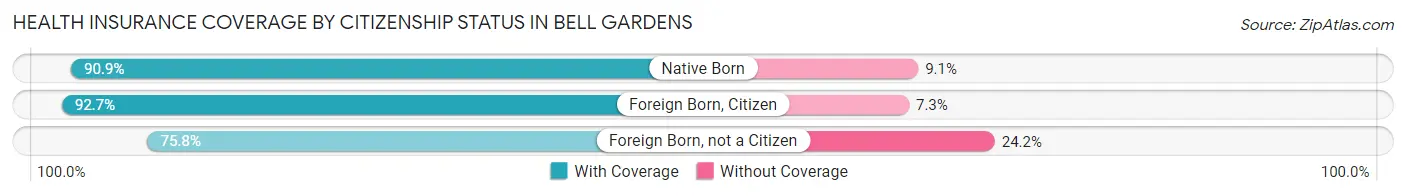
| Citizenship Status | With Coverage | Without Coverage |
| Native Born | 2,708 (90.9%) | 272 (9.1%) |
| Foreign Born, Citizen | 8,189 (92.7%) | 647 (7.3%) |
| Foreign Born, not a Citizen | 3,202 (75.8%) | 1,021 (24.2%) |
Health Insurance Coverage by Household Income in Bell Gardens
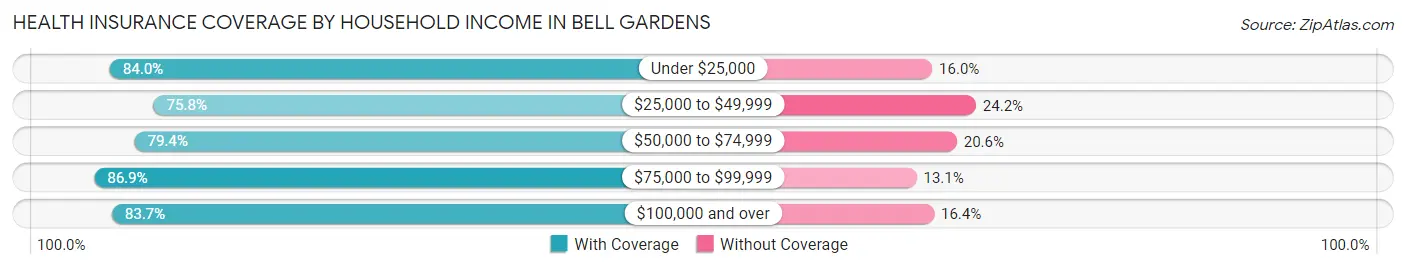
| Household Income | With Coverage | Without Coverage |
| Under $25,000 | 3,987 (84.0%) | 759 (16.0%) |
| $25,000 to $49,999 | 7,472 (75.8%) | 2,384 (24.2%) |
| $50,000 to $74,999 | 7,298 (79.4%) | 1,895 (20.6%) |
| $75,000 to $99,999 | 4,885 (86.9%) | 734 (13.1%) |
| $100,000 and over | 7,816 (83.7%) | 1,528 (16.4%) |
Public vs Private Health Insurance Coverage by Age in Bell Gardens
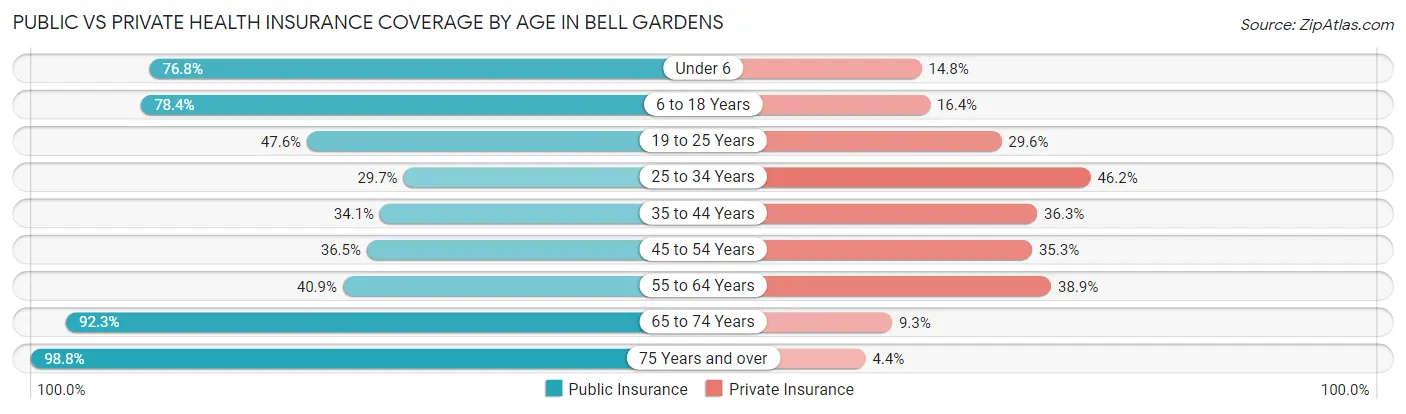
| Age Bracket | Public Insurance | Private Insurance |
| Under 6 | 2,289 (76.8%) | 441 (14.8%) |
| 6 to 18 Years | 6,923 (78.3%) | 1,446 (16.4%) |
| 19 to 25 Years | 2,010 (47.6%) | 1,251 (29.6%) |
| 25 to 34 Years | 1,670 (29.7%) | 2,597 (46.2%) |
| 35 to 44 Years | 1,710 (34.1%) | 1,821 (36.3%) |
| 45 to 54 Years | 1,950 (36.5%) | 1,887 (35.3%) |
| 55 to 64 Years | 1,450 (40.9%) | 1,376 (38.9%) |
| 65 to 74 Years | 1,724 (92.3%) | 174 (9.3%) |
| 75 Years and over | 1,525 (98.8%) | 68 (4.4%) |
| Total | 21,251 (54.5%) | 11,061 (28.4%) |
Disability Status by Sex by Age in Bell Gardens
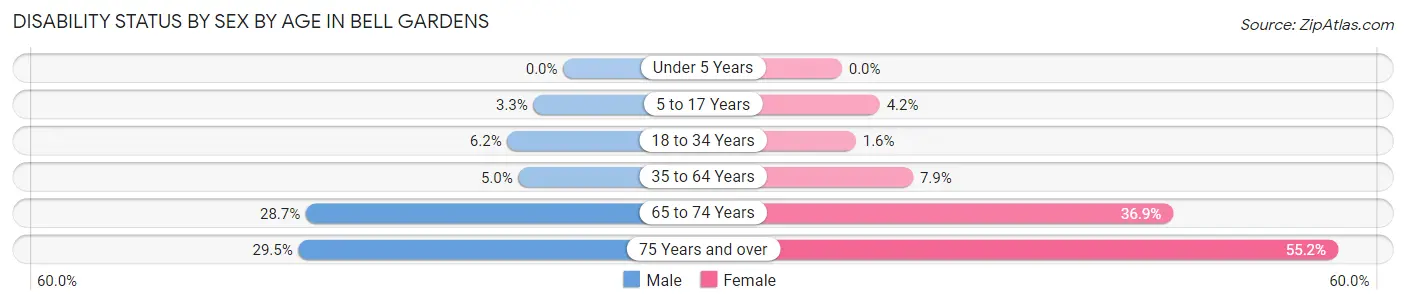
| Age Bracket | Male | Female |
| Under 5 Years | 0 (0.0%) | 0 (0.0%) |
| 5 to 17 Years | 151 (3.3%) | 166 (4.2%) |
| 18 to 34 Years | 342 (6.2%) | 80 (1.6%) |
| 35 to 64 Years | 352 (5.0%) | 543 (7.9%) |
| 65 to 74 Years | 241 (28.7%) | 379 (36.9%) |
| 75 Years and over | 174 (29.5%) | 527 (55.2%) |
Disability Class by Sex by Age in Bell Gardens
Disability Class: Hearing Difficulty
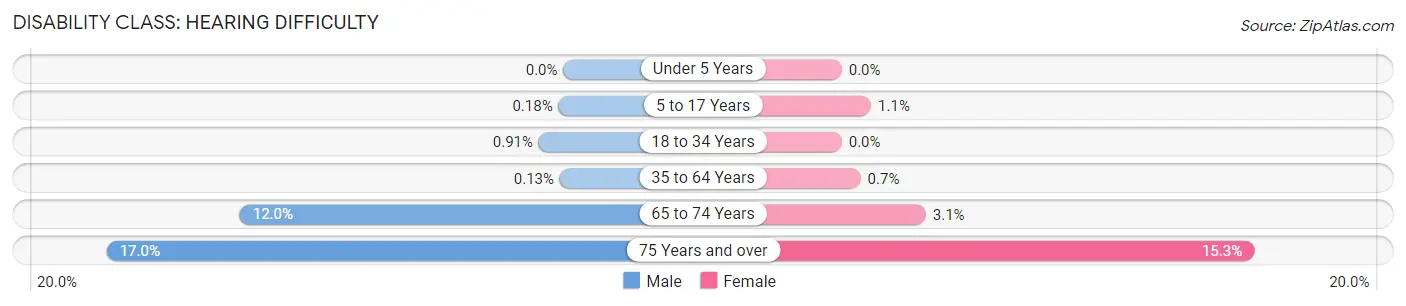
| Age Bracket | Male | Female |
| Under 5 Years | 0 (0.0%) | 0 (0.0%) |
| 5 to 17 Years | 8 (0.2%) | 43 (1.1%) |
| 18 to 34 Years | 50 (0.9%) | 0 (0.0%) |
| 35 to 64 Years | 9 (0.1%) | 48 (0.7%) |
| 65 to 74 Years | 101 (12.0%) | 32 (3.1%) |
| 75 Years and over | 100 (17.0%) | 146 (15.3%) |
Disability Class: Vision Difficulty
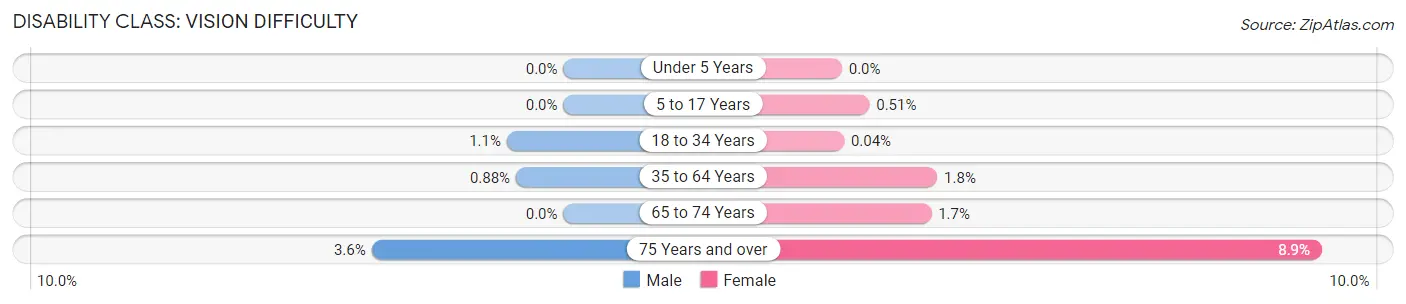
| Age Bracket | Male | Female |
| Under 5 Years | 0 (0.0%) | 0 (0.0%) |
| 5 to 17 Years | 0 (0.0%) | 20 (0.5%) |
| 18 to 34 Years | 58 (1.1%) | 2 (0.0%) |
| 35 to 64 Years | 62 (0.9%) | 121 (1.8%) |
| 65 to 74 Years | 0 (0.0%) | 17 (1.7%) |
| 75 Years and over | 21 (3.6%) | 85 (8.9%) |
Disability Class: Cognitive Difficulty
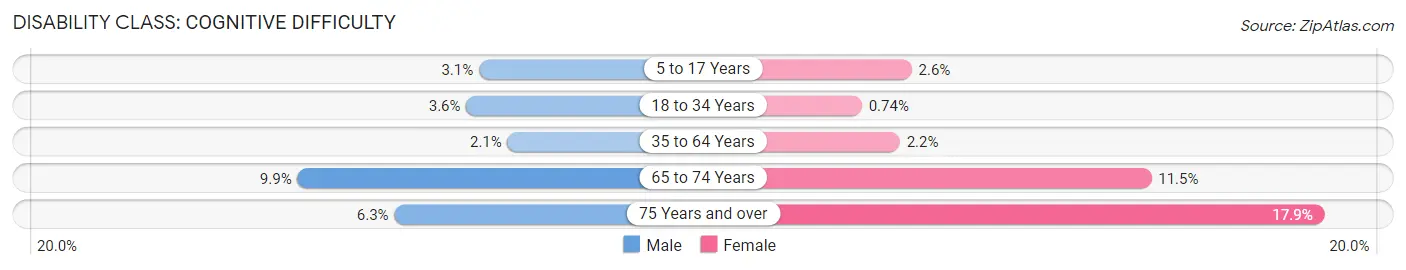
| Age Bracket | Male | Female |
| 5 to 17 Years | 143 (3.1%) | 102 (2.6%) |
| 18 to 34 Years | 198 (3.6%) | 38 (0.7%) |
| 35 to 64 Years | 146 (2.1%) | 147 (2.1%) |
| 65 to 74 Years | 83 (9.9%) | 118 (11.5%) |
| 75 Years and over | 37 (6.3%) | 171 (17.9%) |
Disability Class: Ambulatory Difficulty
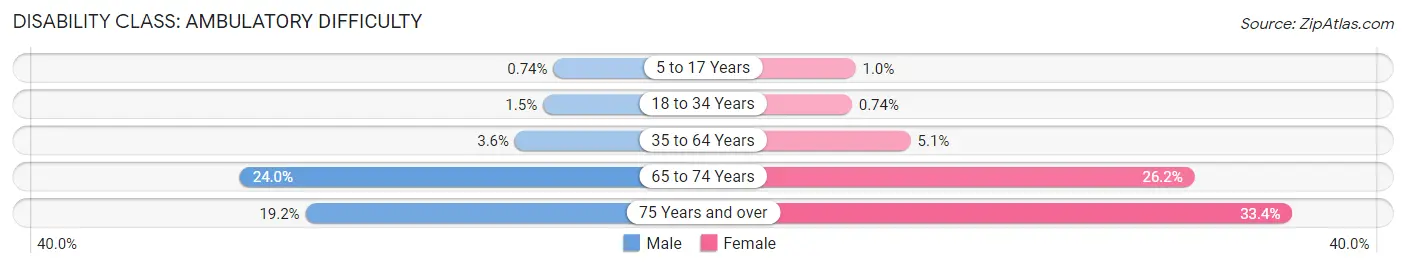
| Age Bracket | Male | Female |
| 5 to 17 Years | 34 (0.7%) | 40 (1.0%) |
| 18 to 34 Years | 83 (1.5%) | 38 (0.7%) |
| 35 to 64 Years | 254 (3.6%) | 350 (5.1%) |
| 65 to 74 Years | 202 (24.0%) | 269 (26.2%) |
| 75 Years and over | 113 (19.2%) | 319 (33.4%) |
Disability Class: Self-Care Difficulty
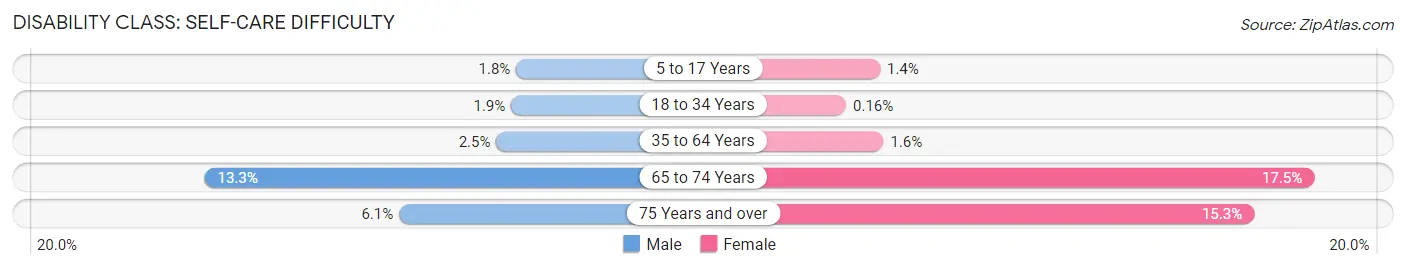
| Age Bracket | Male | Female |
| 5 to 17 Years | 80 (1.8%) | 56 (1.4%) |
| 18 to 34 Years | 107 (1.9%) | 8 (0.2%) |
| 35 to 64 Years | 176 (2.5%) | 106 (1.5%) |
| 65 to 74 Years | 112 (13.3%) | 180 (17.5%) |
| 75 Years and over | 36 (6.1%) | 146 (15.3%) |
Technology Access in Bell Gardens
Computing Device Access in Bell Gardens
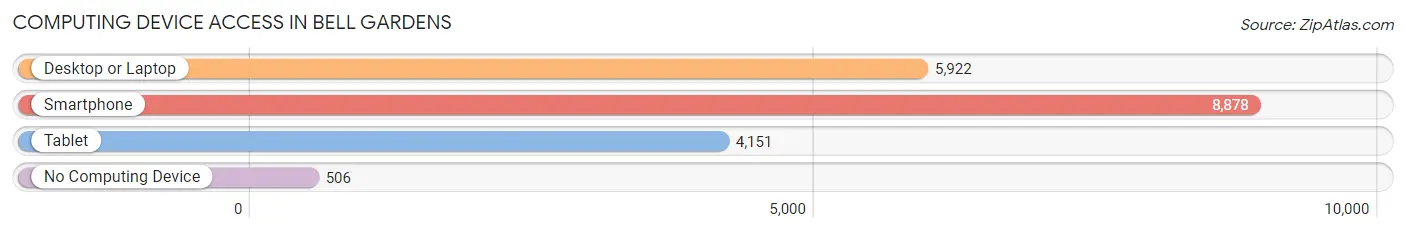
| Device Type | # Households | % Households |
| Desktop or Laptop | 5,922 | 62.2% |
| Smartphone | 8,878 | 93.2% |
| Tablet | 4,151 | 43.6% |
| No Computing Device | 506 | 5.3% |
| Total | 9,523 | 100.0% |
Internet Access in Bell Gardens
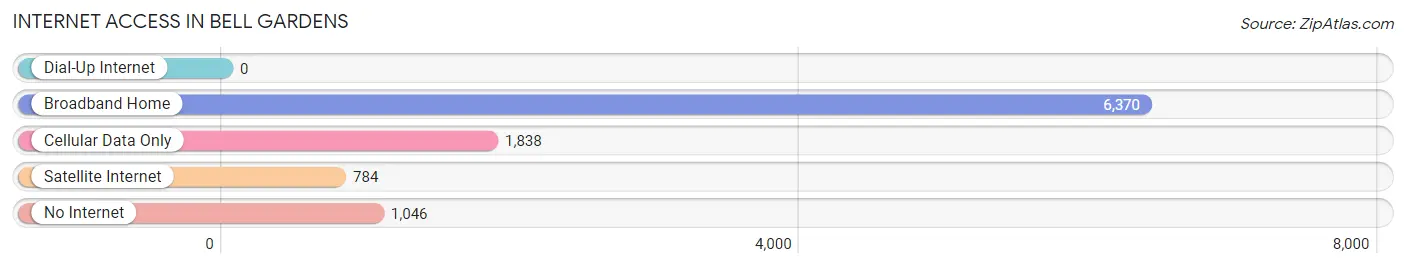
| Internet Type | # Households | % Households |
| Dial-Up Internet | 0 | 0.0% |
| Broadband Home | 6,370 | 66.9% |
| Cellular Data Only | 1,838 | 19.3% |
| Satellite Internet | 784 | 8.2% |
| No Internet | 1,046 | 11.0% |
| Total | 9,523 | 100.0% |
Bell Gardens Summary
History
Bell Gardens is a city located in Los Angeles County, California. It is bordered by the cities of Commerce, Downey, and Bell. The city was incorporated in 1961 and has a population of 42,072 as of the 2010 census.
The area that is now Bell Gardens was originally part of the Rancho San Antonio, a large Spanish land grant given to Antonio Maria Lugo in 1845. The area was later subdivided and sold to various farmers and ranchers. In the early 1900s, the area was known as "Rio Hondo" and was home to a large number of Japanese farmers.
In the 1920s, the area began to be developed as a residential area. The first subdivision was called "Bell Gardens" and was developed by the Bell Gardens Land Company. The company was owned by the Bell family, who had previously owned a large ranch in the area. The Bell family also owned the Bell Gardens Hotel, which was located on the corner of Eastern Avenue and Florence Avenue.
The city was officially incorporated in 1961 and has since grown to become a thriving community. The city is home to a variety of businesses, including a large casino, a racetrack, and a variety of restaurants and shops.
Geography
Bell Gardens is located in southeastern Los Angeles County, California. It is bordered by the cities of Commerce, Downey, and Bell. The city has a total area of 2.5 square miles, all of which is land.
The city is located in the Rio Hondo Valley, which is part of the Los Angeles Basin. The city is located at an elevation of approximately 200 feet above sea level.
The climate in Bell Gardens is classified as a Mediterranean climate, with warm, dry summers and mild, wet winters. The average annual temperature is 68°F, with an average high of 79°F in the summer and an average low of 57°F in the winter.
Economy
The economy of Bell Gardens is largely based on the service industry. The city is home to a variety of restaurants, shops, and other businesses. The city is also home to a large casino, a racetrack, and a variety of other entertainment venues.
The city is also home to a variety of manufacturing and industrial businesses. The city is home to a number of automotive parts manufacturers, as well as a variety of other industrial businesses.
Demographics
As of the 2010 census, the population of Bell Gardens was 42,072. The racial makeup of the city was 63.3% Hispanic or Latino, 24.2% White, 5.2% Asian, 4.2% African American, and 3.1% other.
The median household income in Bell Gardens was $41,945, and the median family income was $45,945. The per capita income was $17,845. The poverty rate was 28.3%.
The city is served by the Los Angeles Unified School District. The city is home to two elementary schools, one middle school, and one high school.
Common Questions
What is Per Capita Income in Bell Gardens?
Per Capita income in Bell Gardens is $17,196.
What is the Median Family Income in Bell Gardens?
Median Family Income in Bell Gardens is $52,422.
What is the Median Household income in Bell Gardens?
Median Household Income in Bell Gardens is $53,935.
What is Income or Wage Gap in Bell Gardens?
Income or Wage Gap in Bell Gardens is 20.9%.
Women in Bell Gardens earn 79.1 cents for every dollar earned by a man.
What is Family Income Deficit in Bell Gardens?
Family Income Deficit in Bell Gardens is $10,224.
Families that are below poverty line in Bell Gardens earn $10,224 less on average than the poverty threshold level.
What is Inequality or Gini Index in Bell Gardens?
Inequality or Gini Index in Bell Gardens is 0.40.
What is the Total Population of Bell Gardens?
Total Population of Bell Gardens is 39,263.
What is the Total Male Population of Bell Gardens?
Total Male Population of Bell Gardens is 19,772.
What is the Total Female Population of Bell Gardens?
Total Female Population of Bell Gardens is 19,491.
What is the Ratio of Males per 100 Females in Bell Gardens?
There are 101.44 Males per 100 Females in Bell Gardens.
What is the Ratio of Females per 100 Males in Bell Gardens?
There are 98.58 Females per 100 Males in Bell Gardens.
What is the Median Population Age in Bell Gardens?
Median Population Age in Bell Gardens is 31.1 Years.
What is the Average Family Size in Bell Gardens
Average Family Size in Bell Gardens is 4.3 People.
What is the Average Household Size in Bell Gardens
Average Household Size in Bell Gardens is 4.1 People.
How Large is the Labor Force in Bell Gardens?
There are 18,018 People in the Labor Forcein in Bell Gardens.
What is the Percentage of People in the Labor Force in Bell Gardens?
61.1% of People are in the Labor Force in Bell Gardens.
What is the Unemployment Rate in Bell Gardens?
Unemployment Rate in Bell Gardens is 5.7%.