Casa Conejo, CA Map & Demographics
Casa Conejo Map
Casa Conejo Overview
$44,635
PER CAPITA INCOME
$150,757
AVG FAMILY INCOME
$142,847
AVG HOUSEHOLD INCOME
40.7%
WAGE / INCOME GAP [ % ]
59.3¢/ $1
WAGE / INCOME GAP [ $ ]
0.31
INEQUALITY / GINI INDEX
2,711
TOTAL POPULATION
1,304
MALE POPULATION
1,407
FEMALE POPULATION
92.68
MALES / 100 FEMALES
107.90
FEMALES / 100 MALES
39.3
MEDIAN AGE
3.4
AVG FAMILY SIZE
3.3
AVG HOUSEHOLD SIZE
1,497
LABOR FORCE [ PEOPLE ]
73.4%
PERCENT IN LABOR FORCE
4.4%
UNEMPLOYMENT RATE
Income in Casa Conejo
Income Overview in Casa Conejo
Per Capita Income in Casa Conejo is $44,635, while median incomes of families and households are $150,757 and $142,847 respectively.
| Characteristic | Number | Measure |
| Per Capita Income | 2,711 | $44,635 |
| Median Family Income | 757 | $150,757 |
| Mean Family Income | 757 | $147,543 |
| Median Household Income | 825 | $142,847 |
| Mean Household Income | 825 | $144,350 |
| Income Deficit | 757 | $0 |
| Wage / Income Gap (%) | 2,711 | 40.71% |
| Wage / Income Gap ($) | 2,711 | 59.29¢ per $1 |
| Gini / Inequality Index | 2,711 | 0.31 |
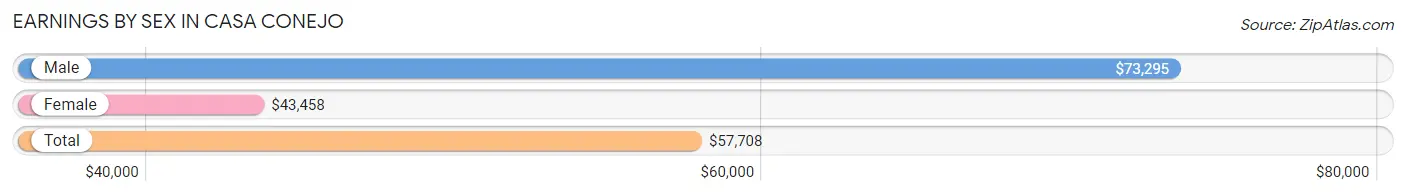
Earnings by Sex in Casa Conejo
Average Earnings in Casa Conejo are $57,708, $73,295 for men and $43,458 for women, a difference of 40.7%.
| Sex | Number | Average Earnings |
| Male | 777 (52.6%) | $73,295 |
| Female | 701 (47.4%) | $43,458 |
| Total | 1,478 (100.0%) | $57,708 |
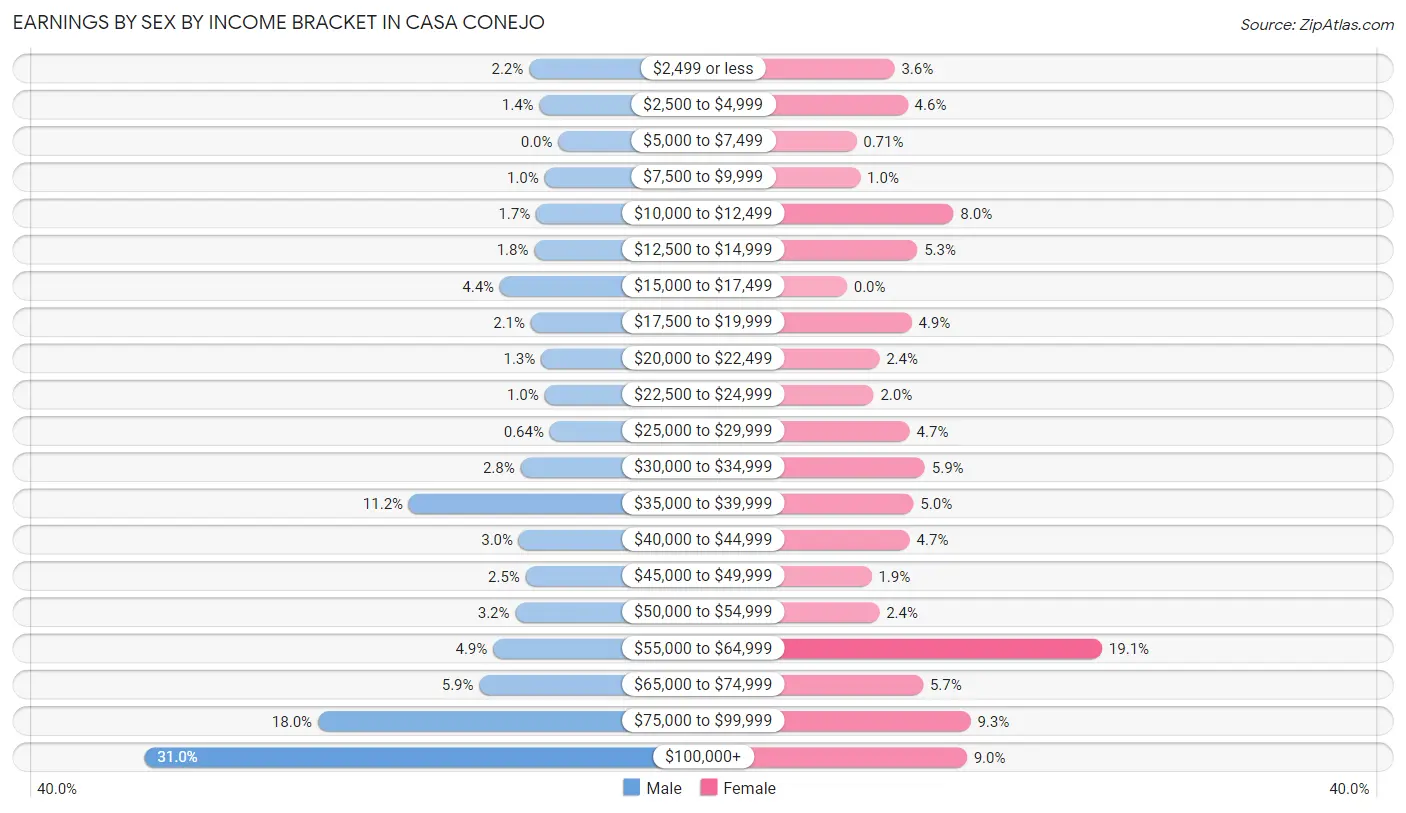
Earnings by Sex by Income Bracket in Casa Conejo
The most common earnings brackets in Casa Conejo are $100,000+ for men (241 | 31.0%) and $55,000 to $64,999 for women (134 | 19.1%).
| Income | Male | Female |
| $2,499 or less | 17 (2.2%) | 25 (3.6%) |
| $2,500 to $4,999 | 11 (1.4%) | 32 (4.6%) |
| $5,000 to $7,499 | 0 (0.0%) | 5 (0.7%) |
| $7,500 to $9,999 | 8 (1.0%) | 7 (1.0%) |
| $10,000 to $12,499 | 13 (1.7%) | 56 (8.0%) |
| $12,500 to $14,999 | 14 (1.8%) | 37 (5.3%) |
| $15,000 to $17,499 | 34 (4.4%) | 0 (0.0%) |
| $17,500 to $19,999 | 16 (2.1%) | 34 (4.9%) |
| $20,000 to $22,499 | 10 (1.3%) | 17 (2.4%) |
| $22,500 to $24,999 | 8 (1.0%) | 14 (2.0%) |
| $25,000 to $29,999 | 5 (0.6%) | 33 (4.7%) |
| $30,000 to $34,999 | 22 (2.8%) | 41 (5.9%) |
| $35,000 to $39,999 | 87 (11.2%) | 35 (5.0%) |
| $40,000 to $44,999 | 23 (3.0%) | 33 (4.7%) |
| $45,000 to $49,999 | 19 (2.5%) | 13 (1.8%) |
| $50,000 to $54,999 | 25 (3.2%) | 17 (2.4%) |
| $55,000 to $64,999 | 38 (4.9%) | 134 (19.1%) |
| $65,000 to $74,999 | 46 (5.9%) | 40 (5.7%) |
| $75,000 to $99,999 | 140 (18.0%) | 65 (9.3%) |
| $100,000+ | 241 (31.0%) | 63 (9.0%) |
| Total | 777 (100.0%) | 701 (100.0%) |
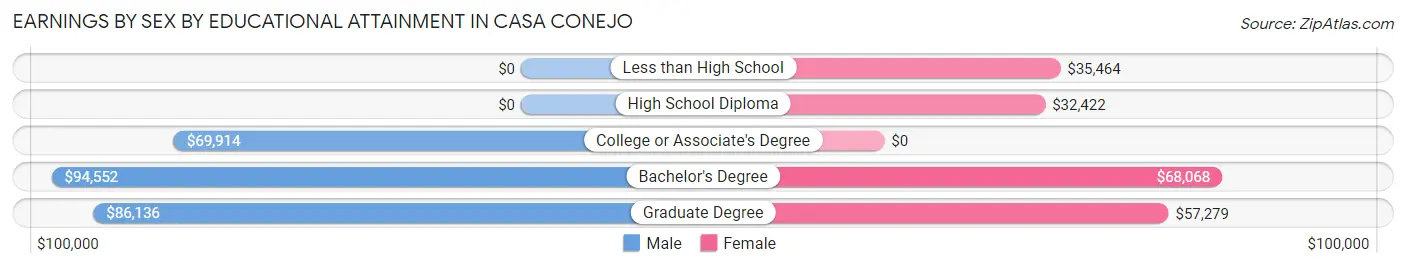
Earnings by Sex by Educational Attainment in Casa Conejo
Average earnings in Casa Conejo are $85,313 for men and $54,779 for women, a difference of 35.8%. Men with an educational attainment of bachelor's degree enjoy the highest average annual earnings of $94,552, while those with college or associate's degree education earn the least with $69,914. Women with an educational attainment of bachelor's degree earn the most with the average annual earnings of $68,068, while those with high school diploma education have the smallest earnings of $32,422.
| Educational Attainment | Male Income | Female Income |
| Less than High School | - | - |
| High School Diploma | - | - |
| College or Associate's Degree | $69,914 | $0 |
| Bachelor's Degree | $94,552 | $68,068 |
| Graduate Degree | $86,136 | $57,279 |
| Total | $85,313 | $54,779 |
Family Income in Casa Conejo
Family Income Brackets in Casa Conejo
According to the Casa Conejo family income data, there are 248 families falling into the $150,000 to $199,999 income range, which is the most common income bracket and makes up 32.8% of all families.
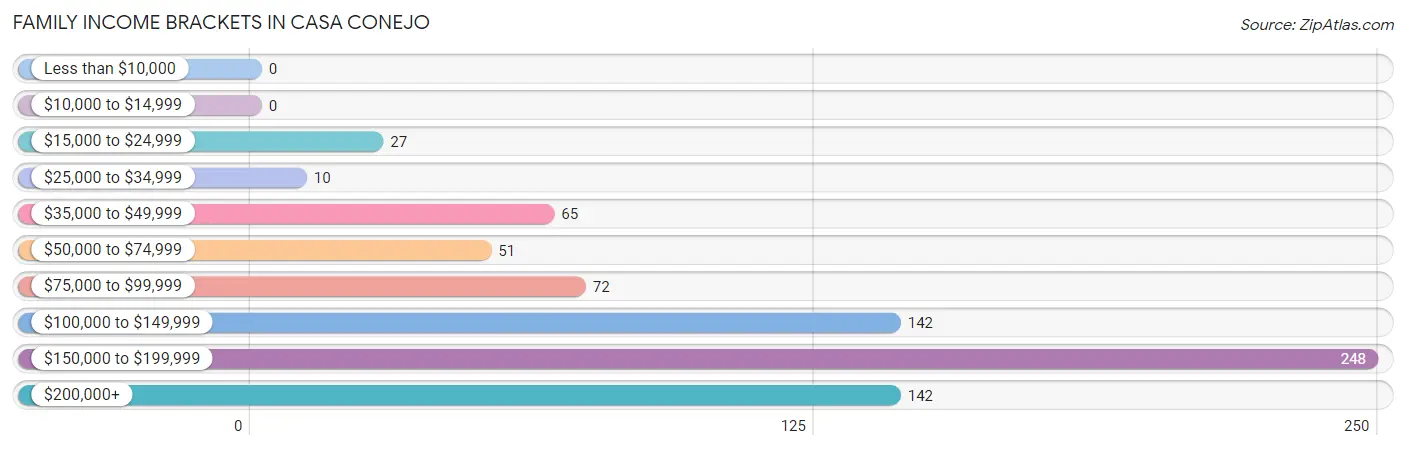
| Income Bracket | # Families | % Families |
| Less than $10,000 | 0 | 0.0% |
| $10,000 to $14,999 | 0 | 0.0% |
| $15,000 to $24,999 | 27 | 3.6% |
| $25,000 to $34,999 | 10 | 1.3% |
| $35,000 to $49,999 | 65 | 8.6% |
| $50,000 to $74,999 | 51 | 6.7% |
| $75,000 to $99,999 | 72 | 9.5% |
| $100,000 to $149,999 | 142 | 18.8% |
| $150,000 to $199,999 | 248 | 32.8% |
| $200,000+ | 142 | 18.8% |
Family Income by Famaliy Size in Casa Conejo
4-person families (305 | 40.3%) account for the highest median family income in Casa Conejo with $181,023 per family, while 2-person families (261 | 34.5%) have the highest median income of $76,312 per family member.
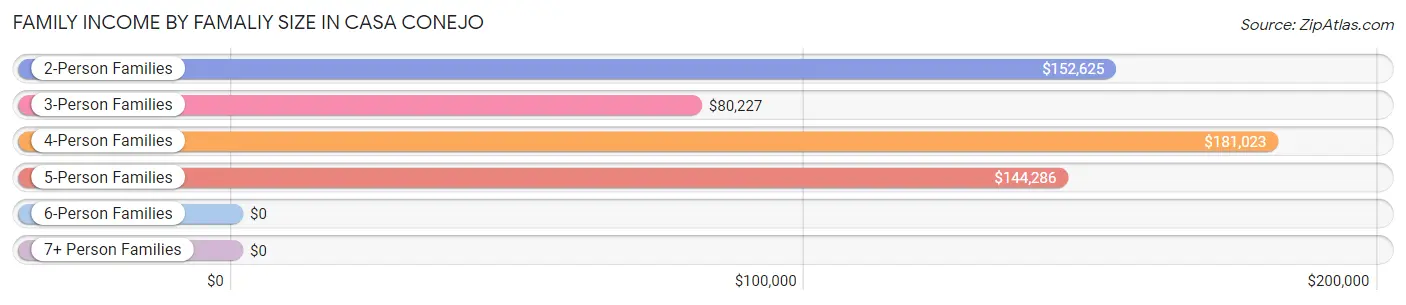
| Income Bracket | # Families | Median Income |
| 2-Person Families | 261 (34.5%) | $152,625 |
| 3-Person Families | 148 (19.6%) | $80,227 |
| 4-Person Families | 305 (40.3%) | $181,023 |
| 5-Person Families | 32 (4.2%) | $144,286 |
| 6-Person Families | 11 (1.5%) | $0 |
| 7+ Person Families | 0 (0.0%) | $0 |
| Total | 757 (100.0%) | $150,757 |
Family Income by Number of Earners in Casa Conejo
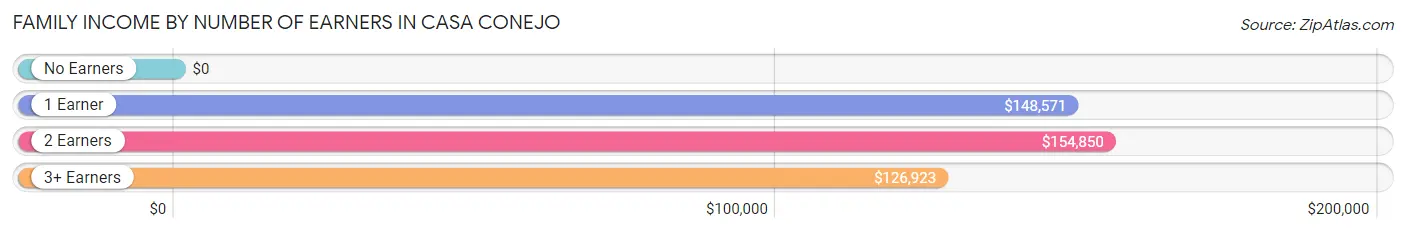
| Number of Earners | # Families | Median Income |
| No Earners | 75 (9.9%) | $0 |
| 1 Earner | 180 (23.8%) | $148,571 |
| 2 Earners | 376 (49.7%) | $154,850 |
| 3+ Earners | 126 (16.6%) | $126,923 |
| Total | 757 (100.0%) | $150,757 |
Household Income in Casa Conejo
Household Income Brackets in Casa Conejo
With 244 households falling in the category, the $150,000 to $199,999 income range is the most frequent in Casa Conejo, accounting for 29.6% of all households.
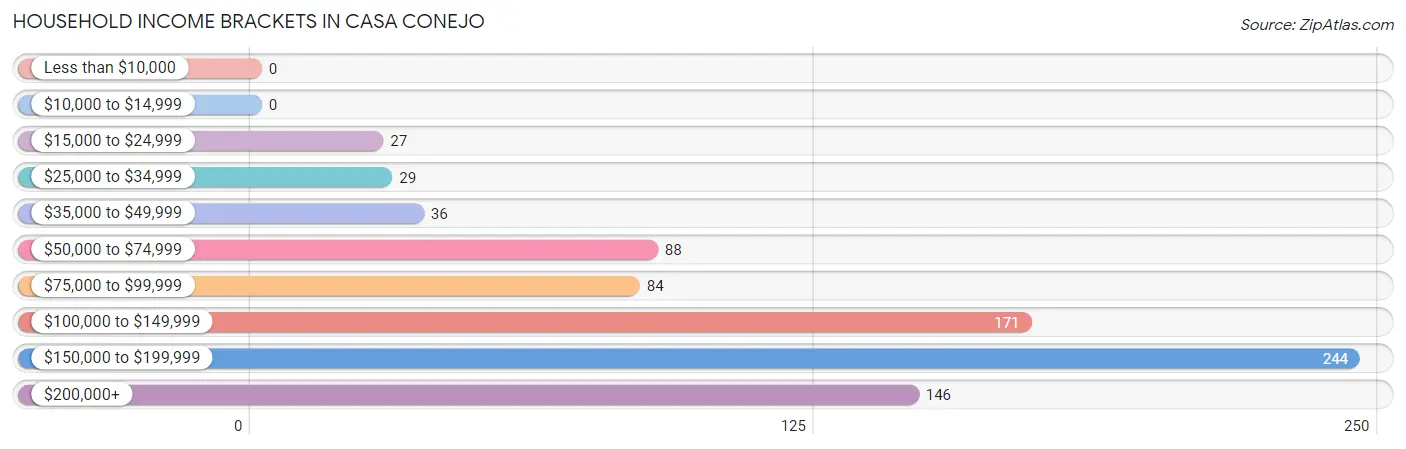
| Income Bracket | # Households | % Households |
| Less than $10,000 | 0 | 0.0% |
| $10,000 to $14,999 | 0 | 0.0% |
| $15,000 to $24,999 | 27 | 3.3% |
| $25,000 to $34,999 | 29 | 3.5% |
| $35,000 to $49,999 | 36 | 4.4% |
| $50,000 to $74,999 | 88 | 10.7% |
| $75,000 to $99,999 | 84 | 10.2% |
| $100,000 to $149,999 | 171 | 20.7% |
| $150,000 to $199,999 | 244 | 29.6% |
| $200,000+ | 146 | 17.7% |
Household Income by Householder Age in Casa Conejo
The median household income in Casa Conejo is $142,847, with the highest median household income of $152,925 found in the 45 to 64 years age bracket for the primary householder. A total of 389 households (47.1%) fall into this category.
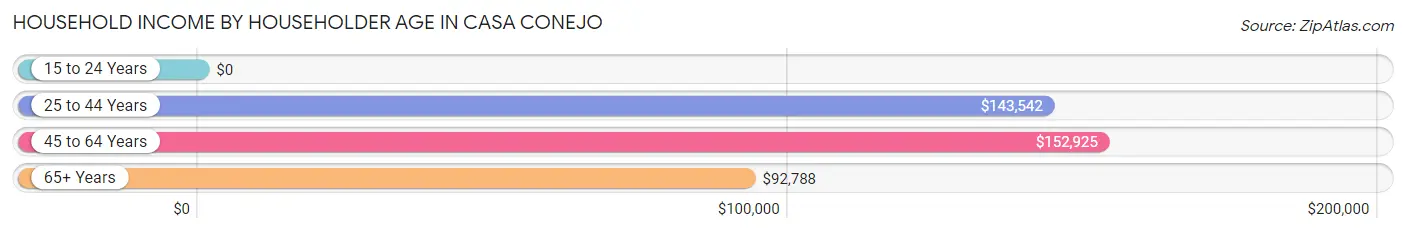
| Income Bracket | # Households | Median Income |
| 15 to 24 Years | 0 (0.0%) | $0 |
| 25 to 44 Years | 269 (32.6%) | $143,542 |
| 45 to 64 Years | 389 (47.1%) | $152,925 |
| 65+ Years | 167 (20.2%) | $92,788 |
| Total | 825 (100.0%) | $142,847 |
Poverty in Casa Conejo
Income Below Poverty by Sex and Age in Casa Conejo
With 6.8% poverty level for males and 3.4% for females among the residents of Casa Conejo, 35 to 44 year old males and 75 year old and over females are the most vulnerable to poverty, with 37 males (16.0%) and 27 females (27.8%) in their respective age groups living below the poverty level.
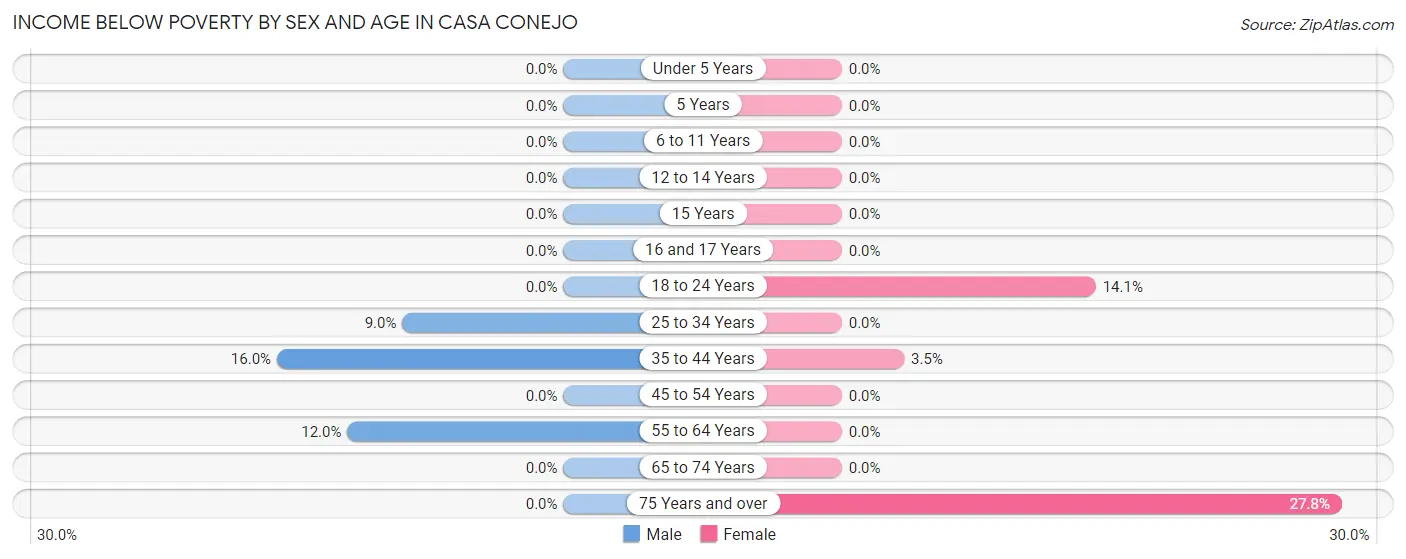
| Age Bracket | Male | Female |
| Under 5 Years | 0 (0.0%) | 0 (0.0%) |
| 5 Years | 0 (0.0%) | 0 (0.0%) |
| 6 to 11 Years | 0 (0.0%) | 0 (0.0%) |
| 12 to 14 Years | 0 (0.0%) | 0 (0.0%) |
| 15 Years | 0 (0.0%) | 0 (0.0%) |
| 16 and 17 Years | 0 (0.0%) | 0 (0.0%) |
| 18 to 24 Years | 0 (0.0%) | 14 (14.1%) |
| 25 to 34 Years | 14 (9.0%) | 0 (0.0%) |
| 35 to 44 Years | 37 (16.0%) | 7 (3.5%) |
| 45 to 54 Years | 0 (0.0%) | 0 (0.0%) |
| 55 to 64 Years | 38 (12.0%) | 0 (0.0%) |
| 65 to 74 Years | 0 (0.0%) | 0 (0.0%) |
| 75 Years and over | 0 (0.0%) | 27 (27.8%) |
| Total | 89 (6.8%) | 48 (3.4%) |
Income Above Poverty by Sex and Age in Casa Conejo
According to the poverty statistics in Casa Conejo, males aged under 5 years and females aged under 5 years are the age groups that are most secure financially, with 100.0% of males and 100.0% of females in these age groups living above the poverty line.
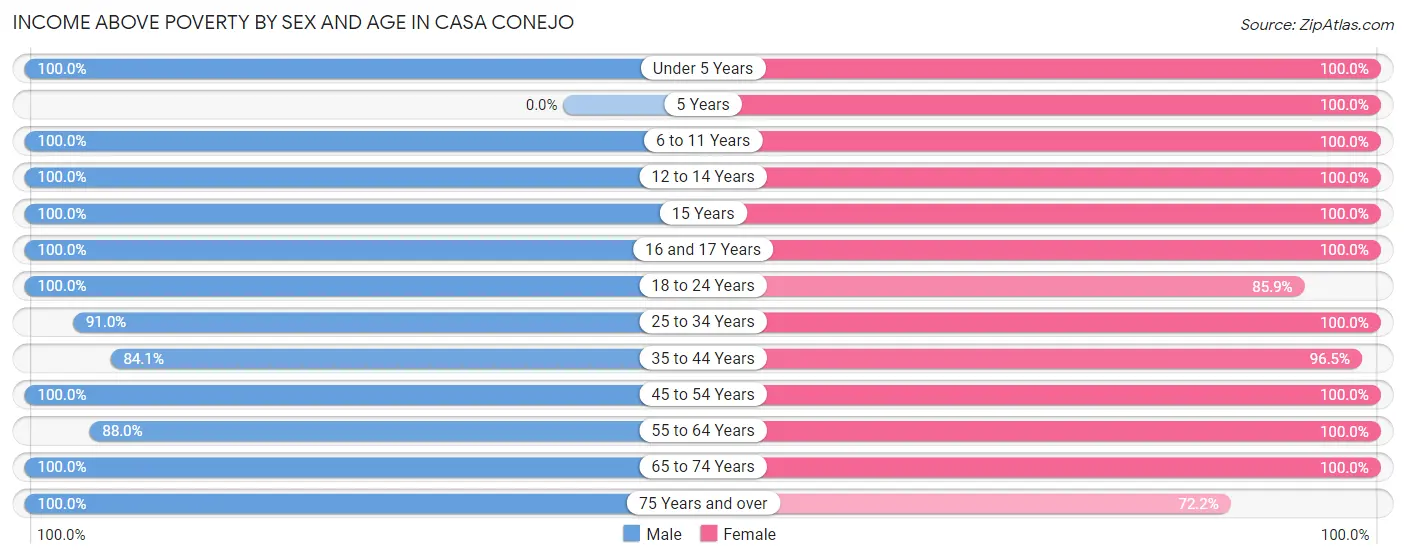
| Age Bracket | Male | Female |
| Under 5 Years | 67 (100.0%) | 117 (100.0%) |
| 5 Years | 0 (0.0%) | 8 (100.0%) |
| 6 to 11 Years | 123 (100.0%) | 224 (100.0%) |
| 12 to 14 Years | 19 (100.0%) | 81 (100.0%) |
| 15 Years | 17 (100.0%) | 16 (100.0%) |
| 16 and 17 Years | 20 (100.0%) | 14 (100.0%) |
| 18 to 24 Years | 94 (100.0%) | 85 (85.9%) |
| 25 to 34 Years | 142 (91.0%) | 117 (100.0%) |
| 35 to 44 Years | 195 (84.1%) | 195 (96.5%) |
| 45 to 54 Years | 114 (100.0%) | 136 (100.0%) |
| 55 to 64 Years | 278 (88.0%) | 222 (100.0%) |
| 65 to 74 Years | 84 (100.0%) | 74 (100.0%) |
| 75 Years and over | 62 (100.0%) | 70 (72.2%) |
| Total | 1,215 (93.2%) | 1,359 (96.6%) |
Income Below Poverty Among Married-Couple Families in Casa Conejo
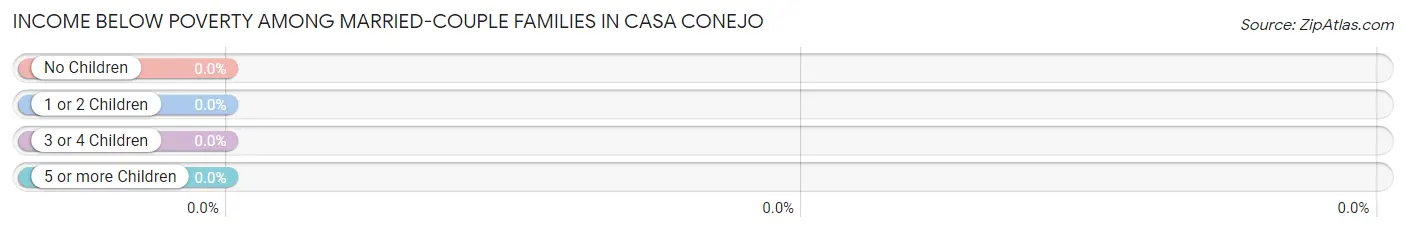
| Children | Above Poverty | Below Poverty |
| No Children | 288 (100.0%) | 0 (0.0%) |
| 1 or 2 Children | 274 (100.0%) | 0 (0.0%) |
| 3 or 4 Children | 21 (100.0%) | 0 (0.0%) |
| 5 or more Children | 0 (0.0%) | 0 (0.0%) |
| Total | 583 (100.0%) | 0 (0.0%) |
Income Below Poverty Among Single-Parent Households in Casa Conejo
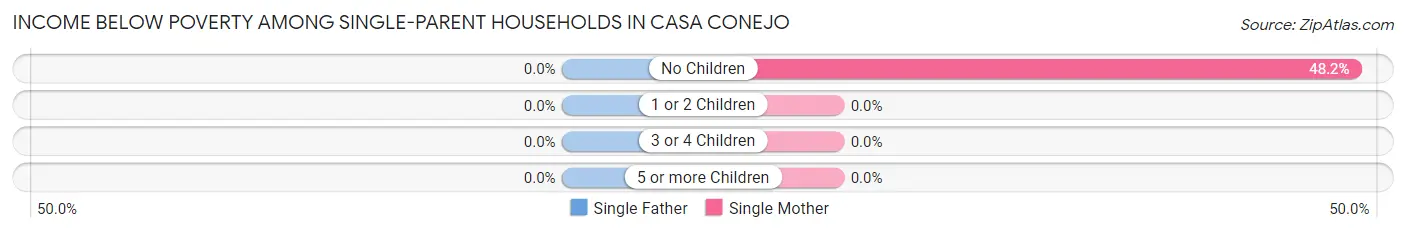
| Children | Single Father | Single Mother |
| No Children | 0 (0.0%) | 27 (48.2%) |
| 1 or 2 Children | 0 (0.0%) | 0 (0.0%) |
| 3 or 4 Children | 0 (0.0%) | 0 (0.0%) |
| 5 or more Children | 0 (0.0%) | 0 (0.0%) |
| Total | 0 (0.0%) | 27 (36.0%) |
Income Below Poverty Among Married-Couple vs Single-Parent Households in Casa Conejo
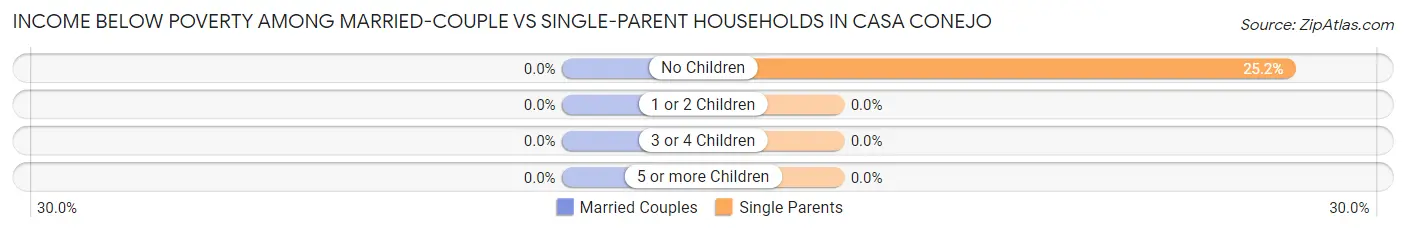
| Children | Married-Couple Families | Single-Parent Households |
| No Children | 0 (0.0%) | 27 (25.2%) |
| 1 or 2 Children | 0 (0.0%) | 0 (0.0%) |
| 3 or 4 Children | 0 (0.0%) | 0 (0.0%) |
| 5 or more Children | 0 (0.0%) | 0 (0.0%) |
| Total | 0 (0.0%) | 27 (15.5%) |
Race in Casa Conejo
The most populous races in Casa Conejo are White / Caucasian (2,012 | 74.2%), Hispanic or Latino (390 | 14.4%), and Two or more Races (276 | 10.2%).
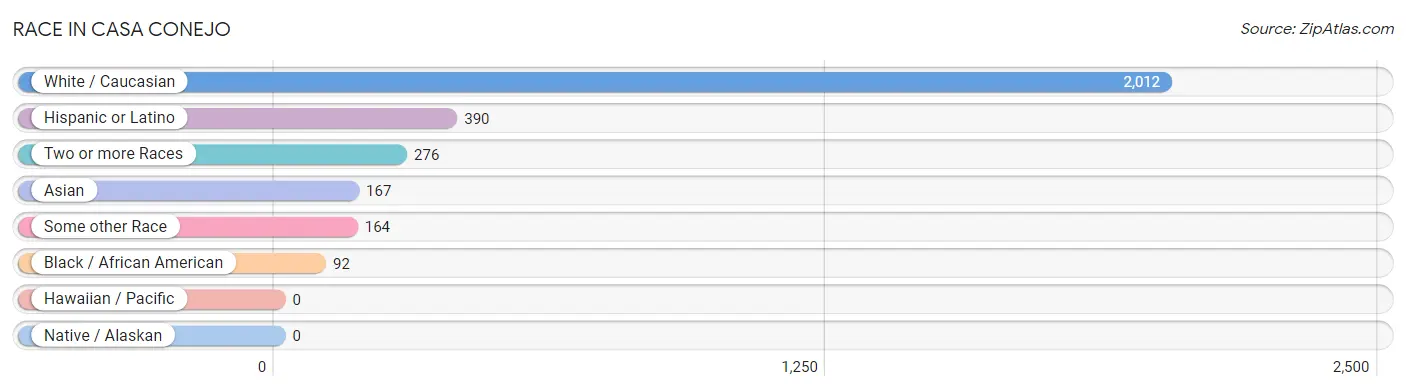
| Race | # Population | % Population |
| Asian | 167 | 6.2% |
| Black / African American | 92 | 3.4% |
| Hawaiian / Pacific | 0 | 0.0% |
| Hispanic or Latino | 390 | 14.4% |
| Native / Alaskan | 0 | 0.0% |
| White / Caucasian | 2,012 | 74.2% |
| Two or more Races | 276 | 10.2% |
| Some other Race | 164 | 6.0% |
| Total | 2,711 | 100.0% |
Ancestry in Casa Conejo
The most populous ancestries reported in Casa Conejo are Irish (524 | 19.3%), English (399 | 14.7%), German (390 | 14.4%), Italian (215 | 7.9%), and Mexican (213 | 7.9%), together accounting for 64.2% of all Casa Conejo residents.
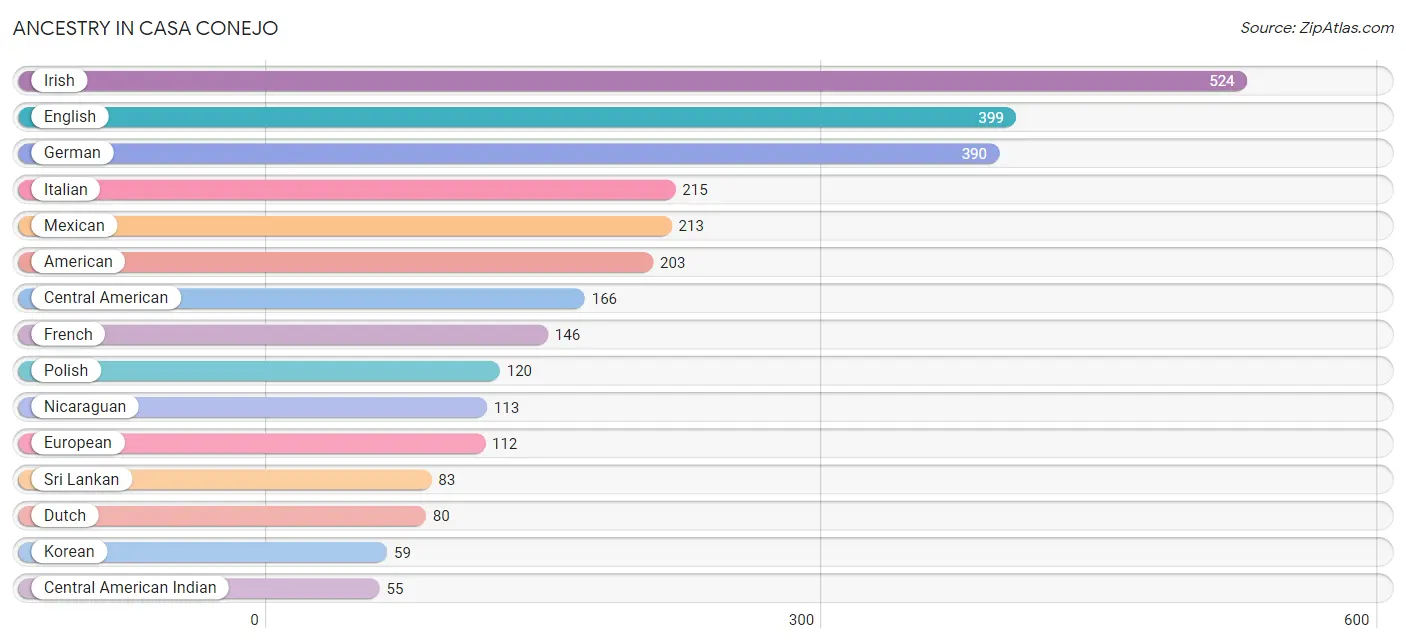
| Ancestry | # Population | % Population |
| American | 203 | 7.5% |
| Austrian | 36 | 1.3% |
| Belgian | 6 | 0.2% |
| Bhutanese | 18 | 0.7% |
| British | 14 | 0.5% |
| Central American | 166 | 6.1% |
| Central American Indian | 55 | 2.0% |
| Danish | 46 | 1.7% |
| Dutch | 80 | 2.9% |
| English | 399 | 14.7% |
| Estonian | 4 | 0.2% |
| European | 112 | 4.1% |
| Finnish | 30 | 1.1% |
| French | 146 | 5.4% |
| German | 390 | 14.4% |
| Greek | 21 | 0.8% |
| Guamanian / Chamorro | 29 | 1.1% |
| Guatemalan | 21 | 0.8% |
| Hungarian | 11 | 0.4% |
| Irish | 524 | 19.3% |
| Israeli | 15 | 0.5% |
| Italian | 215 | 7.9% |
| Japanese | 39 | 1.4% |
| Korean | 59 | 2.2% |
| Mexican | 213 | 7.9% |
| Nicaraguan | 113 | 4.2% |
| Norwegian | 53 | 1.9% |
| Panamanian | 12 | 0.4% |
| Polish | 120 | 4.4% |
| Portuguese | 13 | 0.5% |
| Russian | 27 | 1.0% |
| Salvadoran | 20 | 0.7% |
| Scotch-Irish | 16 | 0.6% |
| Scottish | 41 | 1.5% |
| Slovene | 31 | 1.1% |
| Spaniard | 11 | 0.4% |
| Sri Lankan | 83 | 3.1% |
| Swedish | 19 | 0.7% |
| Welsh | 23 | 0.9% | View All 39 Rows |
Immigrants in Casa Conejo
The most numerous immigrant groups reported in Casa Conejo came from Central America (180 | 6.6%), Latin America (180 | 6.6%), Asia (130 | 4.8%), South Eastern Asia (130 | 4.8%), and Mexico (92 | 3.4%), together accounting for 26.3% of all Casa Conejo residents.
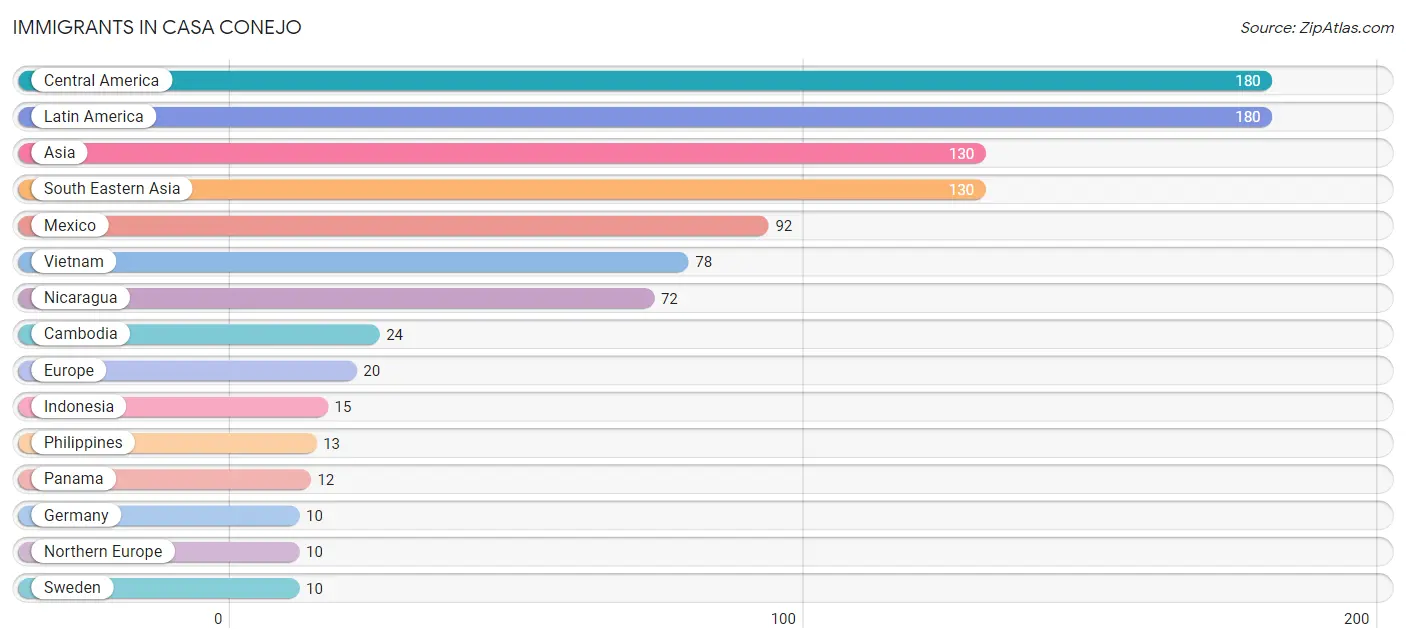
| Immigration Origin | # Population | % Population |
| Asia | 130 | 4.8% |
| Cambodia | 24 | 0.9% |
| Central America | 180 | 6.6% |
| El Salvador | 4 | 0.2% |
| Europe | 20 | 0.7% |
| Germany | 10 | 0.4% |
| Indonesia | 15 | 0.5% |
| Latin America | 180 | 6.6% |
| Mexico | 92 | 3.4% |
| Nicaragua | 72 | 2.7% |
| Northern Europe | 10 | 0.4% |
| Panama | 12 | 0.4% |
| Philippines | 13 | 0.5% |
| South Eastern Asia | 130 | 4.8% |
| Sweden | 10 | 0.4% |
| Vietnam | 78 | 2.9% |
| Western Europe | 10 | 0.4% | View All 17 Rows |
Sex and Age in Casa Conejo
Sex and Age in Casa Conejo
The most populous age groups in Casa Conejo are 55 to 59 Years (212 | 16.3%) for men and 10 to 14 Years (168 | 11.9%) for women.
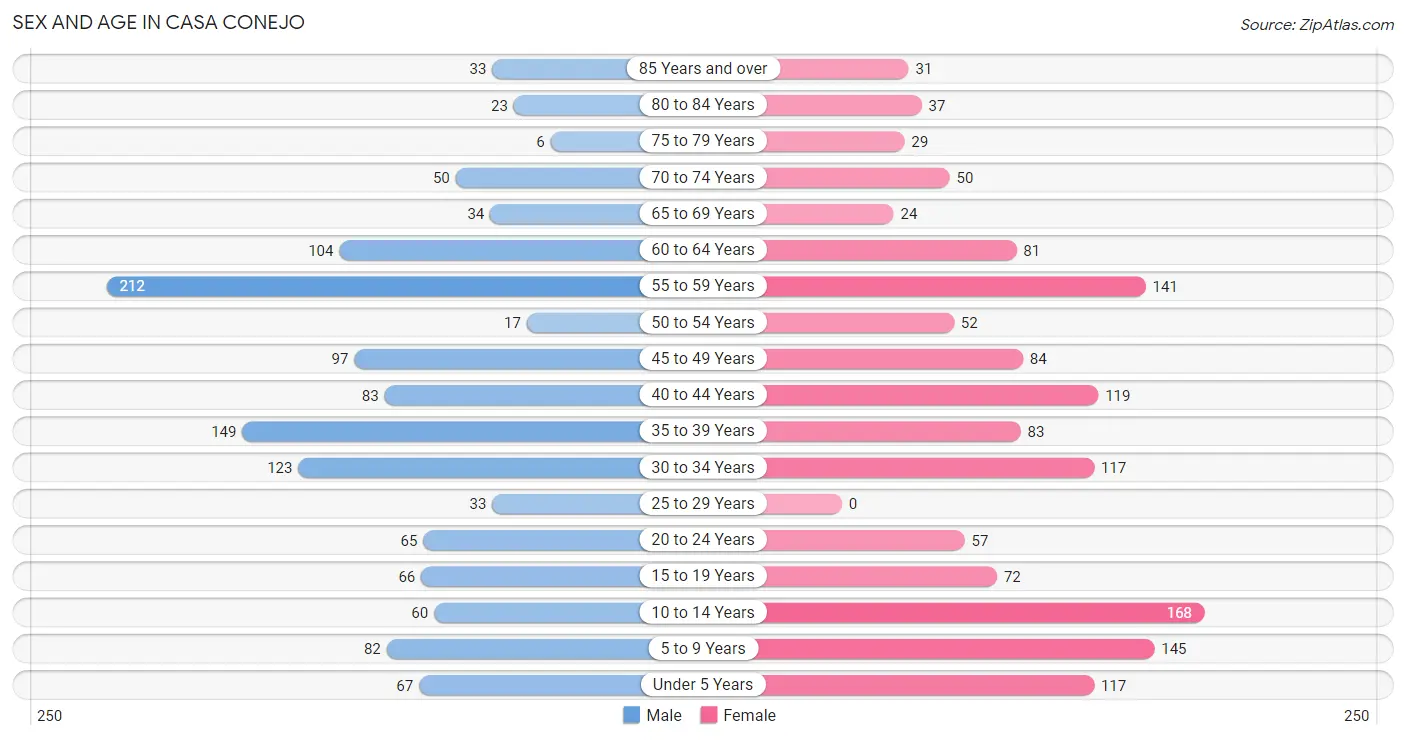
| Age Bracket | Male | Female |
| Under 5 Years | 67 (5.1%) | 117 (8.3%) |
| 5 to 9 Years | 82 (6.3%) | 145 (10.3%) |
| 10 to 14 Years | 60 (4.6%) | 168 (11.9%) |
| 15 to 19 Years | 66 (5.1%) | 72 (5.1%) |
| 20 to 24 Years | 65 (5.0%) | 57 (4.1%) |
| 25 to 29 Years | 33 (2.5%) | 0 (0.0%) |
| 30 to 34 Years | 123 (9.4%) | 117 (8.3%) |
| 35 to 39 Years | 149 (11.4%) | 83 (5.9%) |
| 40 to 44 Years | 83 (6.4%) | 119 (8.5%) |
| 45 to 49 Years | 97 (7.4%) | 84 (6.0%) |
| 50 to 54 Years | 17 (1.3%) | 52 (3.7%) |
| 55 to 59 Years | 212 (16.3%) | 141 (10.0%) |
| 60 to 64 Years | 104 (8.0%) | 81 (5.8%) |
| 65 to 69 Years | 34 (2.6%) | 24 (1.7%) |
| 70 to 74 Years | 50 (3.8%) | 50 (3.5%) |
| 75 to 79 Years | 6 (0.5%) | 29 (2.1%) |
| 80 to 84 Years | 23 (1.8%) | 37 (2.6%) |
| 85 Years and over | 33 (2.5%) | 31 (2.2%) |
| Total | 1,304 (100.0%) | 1,407 (100.0%) |
Families and Households in Casa Conejo
Median Family Size in Casa Conejo
The median family size in Casa Conejo is 3.39 persons per family, with married-couple families (583 | 77.0%) accounting for the largest median family size of 3.45 persons per family. On the other hand, single female/mother families (75 | 9.9%) represent the smallest median family size with 3.12 persons per family.
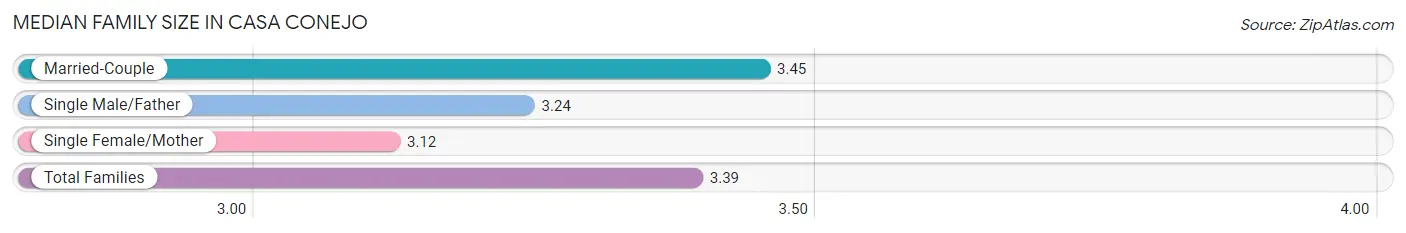
| Family Type | # Families | Family Size |
| Married-Couple | 583 (77.0%) | 3.45 |
| Single Male/Father | 99 (13.1%) | 3.24 |
| Single Female/Mother | 75 (9.9%) | 3.12 |
| Total Families | 757 (100.0%) | 3.39 |
Median Household Size in Casa Conejo
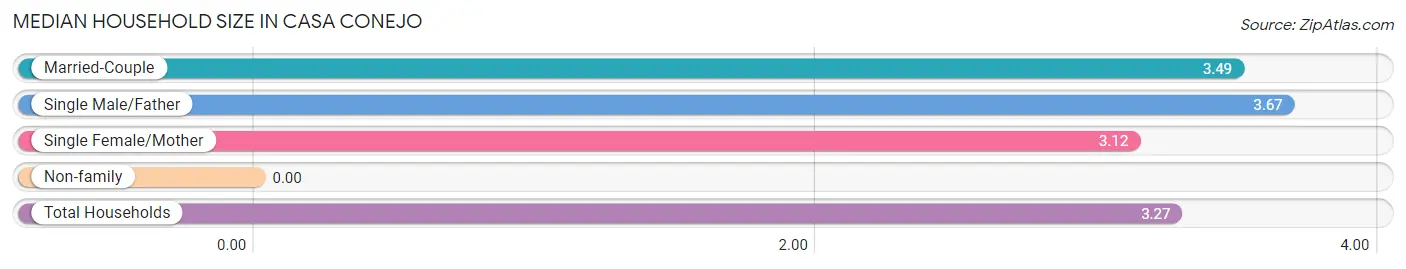
| Household Type | # Households | Household Size |
| Married-Couple | 583 (70.7%) | 3.49 |
| Single Male/Father | 99 (12.0%) | 3.67 |
| Single Female/Mother | 75 (9.1%) | 3.12 |
| Non-family | 68 (8.2%) | - |
| Total Households | 825 (100.0%) | 3.27 |
Household Size by Marriage Status in Casa Conejo
Out of a total of 825 households in Casa Conejo, 757 (91.8%) are family households, while 68 (8.2%) are nonfamily households. The most numerous type of family households are 4-person households, comprising 309, and the most common type of nonfamily households are 1-person households, comprising 68.
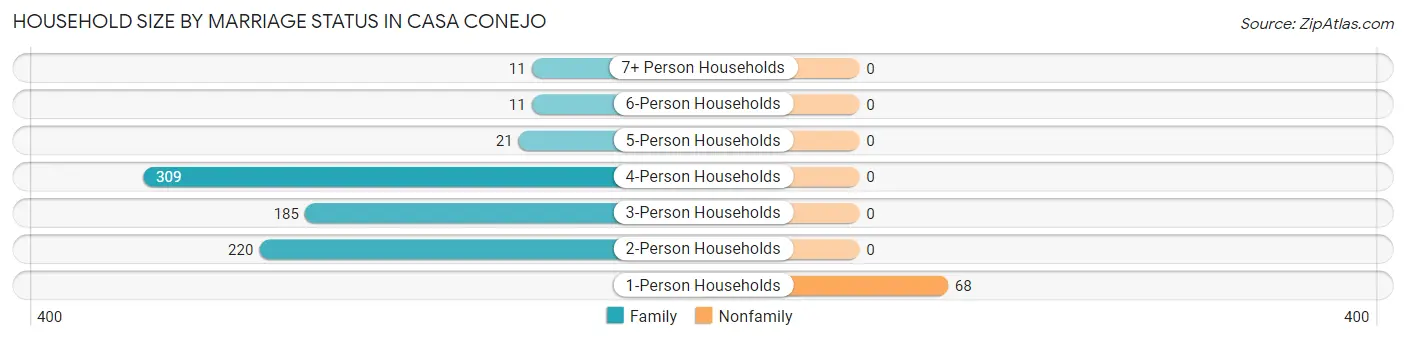
| Household Size | Family Households | Nonfamily Households |
| 1-Person Households | - | 68 (8.2%) |
| 2-Person Households | 220 (26.7%) | 0 (0.0%) |
| 3-Person Households | 185 (22.4%) | 0 (0.0%) |
| 4-Person Households | 309 (37.4%) | 0 (0.0%) |
| 5-Person Households | 21 (2.5%) | 0 (0.0%) |
| 6-Person Households | 11 (1.3%) | 0 (0.0%) |
| 7+ Person Households | 11 (1.3%) | 0 (0.0%) |
| Total | 757 (91.8%) | 68 (8.2%) |
Female Fertility in Casa Conejo
Fertility by Age in Casa Conejo
Average fertility rate in Casa Conejo is 108.0 births per 1,000 women. Women in the age bracket of 20 to 34 years have the highest fertility rate with 190.0 births per 1,000 women. Women in the age bracket of 20 to 34 years acount for 55.9% of all women with births.
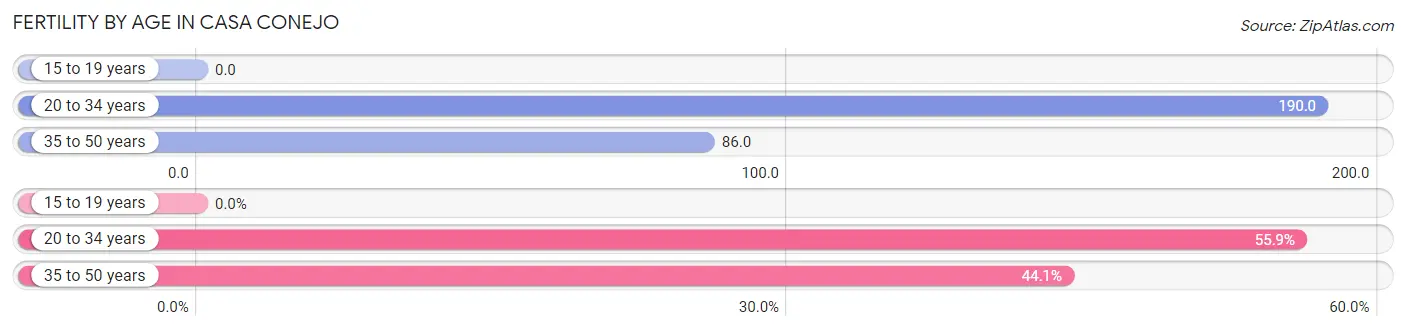
| Age Bracket | Women with Births | Births / 1,000 Women |
| 15 to 19 years | 0 (0.0%) | 0.0 |
| 20 to 34 years | 33 (55.9%) | 190.0 |
| 35 to 50 years | 26 (44.1%) | 86.0 |
| Total | 59 (100.0%) | 108.0 |
Fertility by Age by Marriage Status in Casa Conejo
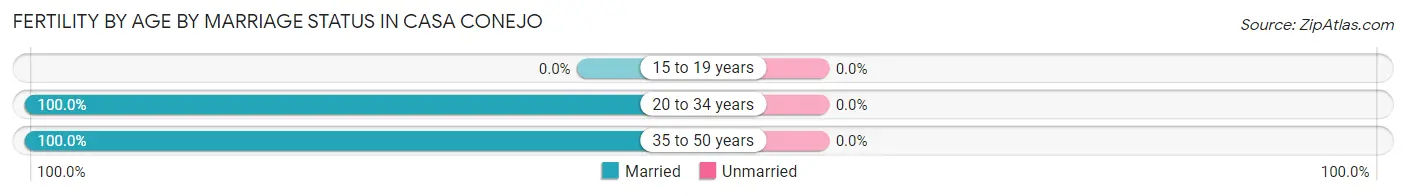
| Age Bracket | Married | Unmarried |
| 15 to 19 years | 0 (0.0%) | 0 (0.0%) |
| 20 to 34 years | 33 (100.0%) | 0 (0.0%) |
| 35 to 50 years | 26 (100.0%) | 0 (0.0%) |
| Total | 59 (100.0%) | 0 (0.0%) |
Fertility by Education in Casa Conejo
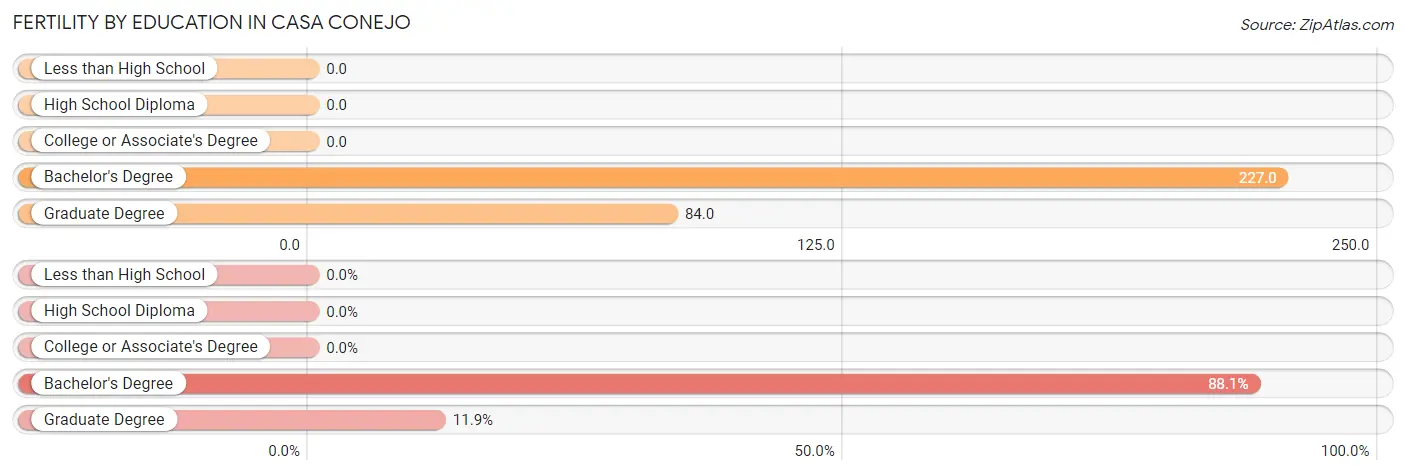
| Educational Attainment | Women with Births | Births / 1,000 Women |
| Less than High School | 0 (0.0%) | 0.0 |
| High School Diploma | 0 (0.0%) | 0.0 |
| College or Associate's Degree | 0 (0.0%) | 0.0 |
| Bachelor's Degree | 52 (88.1%) | 227.0 |
| Graduate Degree | 7 (11.9%) | 84.0 |
| Total | 59 (100.0%) | 108.0 |
Fertility by Education by Marriage Status in Casa Conejo
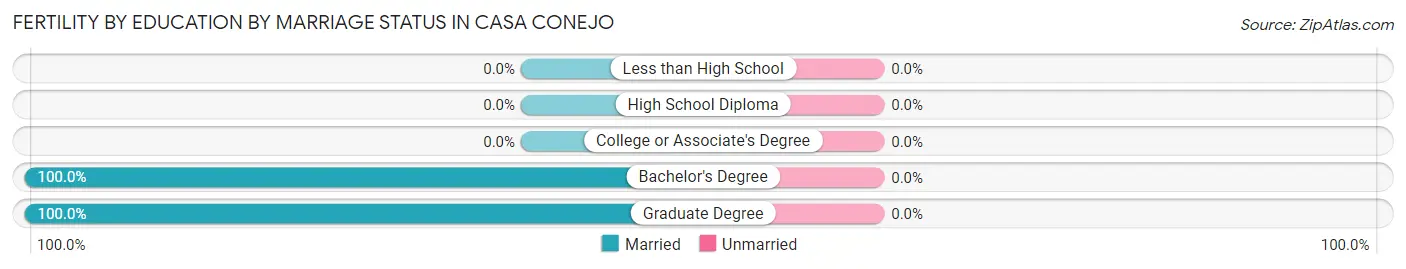
| Educational Attainment | Married | Unmarried |
| Less than High School | 0 (0.0%) | 0 (0.0%) |
| High School Diploma | 0 (0.0%) | 0 (0.0%) |
| College or Associate's Degree | 0 (0.0%) | 0 (0.0%) |
| Bachelor's Degree | 52 (100.0%) | 0 (0.0%) |
| Graduate Degree | 7 (100.0%) | 0 (0.0%) |
| Total | 59 (100.0%) | 0 (0.0%) |
Employment Characteristics in Casa Conejo
Employment by Class of Employer in Casa Conejo
Among the 1,308 employed individuals in Casa Conejo, private company employees (868 | 66.4%), local government employees (179 | 13.7%), and self-employed (incorporated) (87 | 6.7%) make up the most common classes of employment.
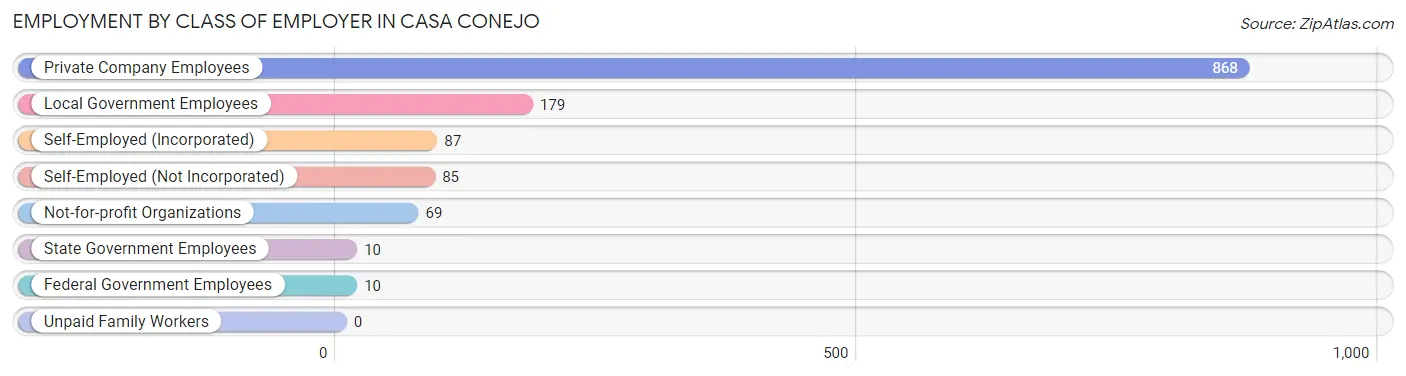
| Employer Class | # Employees | % Employees |
| Private Company Employees | 868 | 66.4% |
| Self-Employed (Incorporated) | 87 | 6.7% |
| Self-Employed (Not Incorporated) | 85 | 6.5% |
| Not-for-profit Organizations | 69 | 5.3% |
| Local Government Employees | 179 | 13.7% |
| State Government Employees | 10 | 0.8% |
| Federal Government Employees | 10 | 0.8% |
| Unpaid Family Workers | 0 | 0.0% |
| Total | 1,308 | 100.0% |
Employment Status by Age in Casa Conejo
According to the labor force statistics for Casa Conejo, out of the total population over 16 years of age (2,039), 73.4% or 1,497 individuals are in the labor force, with 4.4% or 66 of them unemployed. The age group with the highest labor force participation rate is 25 to 29 years, with 100.0% or 33 individuals in the labor force. Within the labor force, the 20 to 24 years age range has the highest percentage of unemployed individuals, with 21.8% or 19 of them being unemployed.
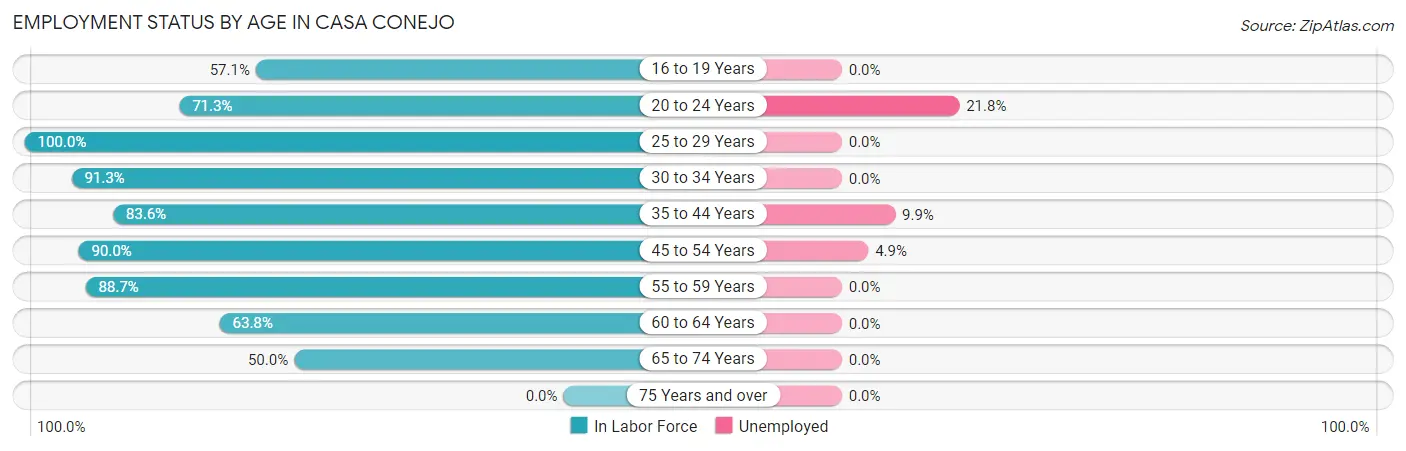
| Age Bracket | In Labor Force | Unemployed |
| 16 to 19 Years | 60 (57.1%) | 0 (0.0%) |
| 20 to 24 Years | 87 (71.3%) | 19 (21.8%) |
| 25 to 29 Years | 33 (100.0%) | 0 (0.0%) |
| 30 to 34 Years | 219 (91.3%) | 0 (0.0%) |
| 35 to 44 Years | 363 (83.6%) | 36 (9.9%) |
| 45 to 54 Years | 225 (90.0%) | 11 (4.9%) |
| 55 to 59 Years | 313 (88.7%) | 0 (0.0%) |
| 60 to 64 Years | 118 (63.8%) | 0 (0.0%) |
| 65 to 74 Years | 79 (50.0%) | 0 (0.0%) |
| 75 Years and over | 0 (0.0%) | 0 (0.0%) |
| Total | 1,497 (73.4%) | 66 (4.4%) |
Employment Status by Educational Attainment in Casa Conejo
According to labor force statistics for Casa Conejo, 85.0% of individuals (1,271) out of the total population between 25 and 64 years of age (1,495) are in the labor force, with 3.7% or 47 of them being unemployed. The group with the highest labor force participation rate are those with the educational attainment of less than high school, with 93.3% or 70 individuals in the labor force. Within the labor force, individuals with bachelor's degree or higher education have the highest percentage of unemployment, with 5.9% or 36 of them being unemployed.
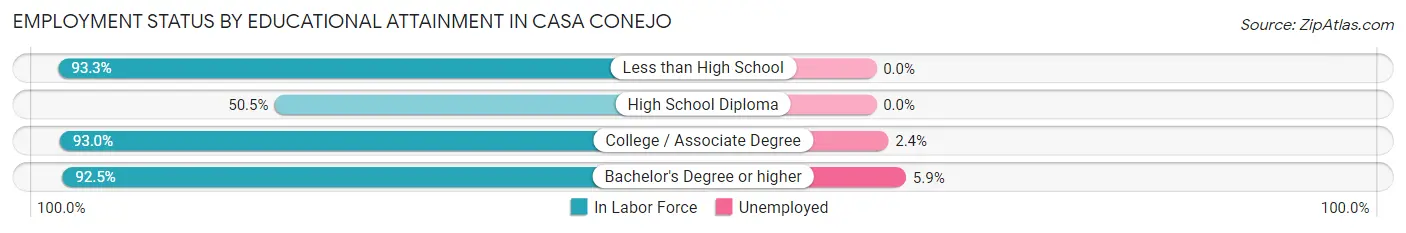
| Educational Attainment | In Labor Force | Unemployed |
| Less than High School | 70 (93.3%) | 0 (0.0%) |
| High School Diploma | 139 (50.5%) | 0 (0.0%) |
| College / Associate Degree | 455 (93.0%) | 12 (2.4%) |
| Bachelor's Degree or higher | 607 (92.5%) | 39 (5.9%) |
| Total | 1,271 (85.0%) | 55 (3.7%) |
Employment Occupations by Sex in Casa Conejo
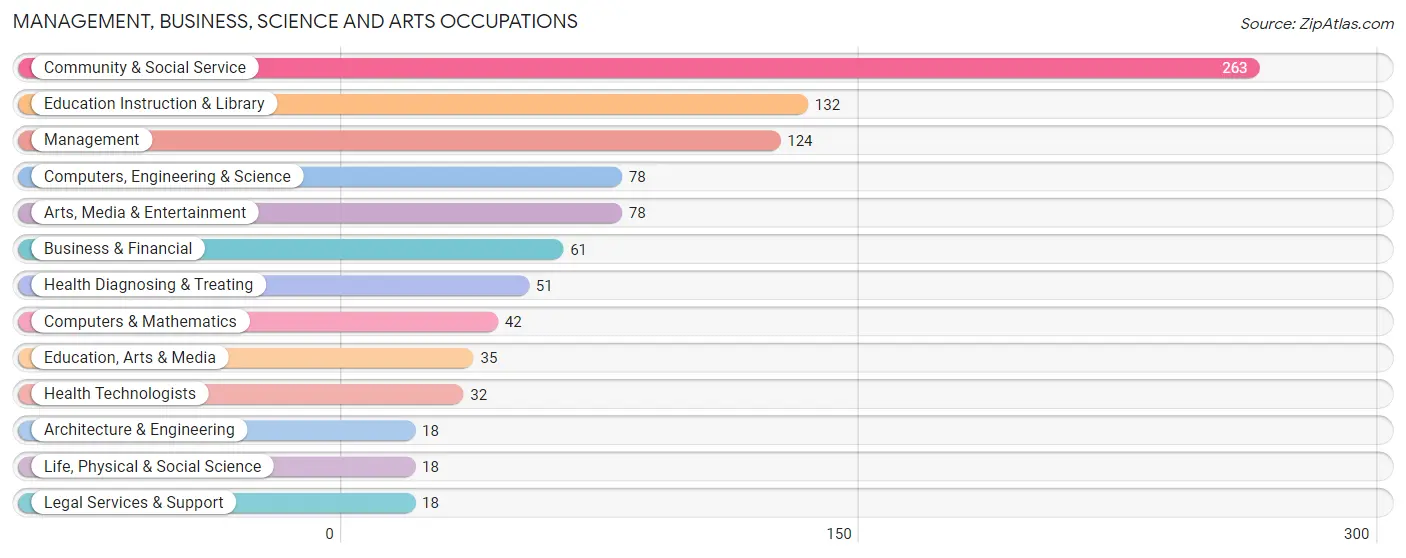
Management, Business, Science and Arts Occupations
The most common Management, Business, Science and Arts occupations in Casa Conejo are Community & Social Service (263 | 18.4%), Education Instruction & Library (132 | 9.2%), Management (124 | 8.7%), Computers, Engineering & Science (78 | 5.4%), and Arts, Media & Entertainment (78 | 5.4%).
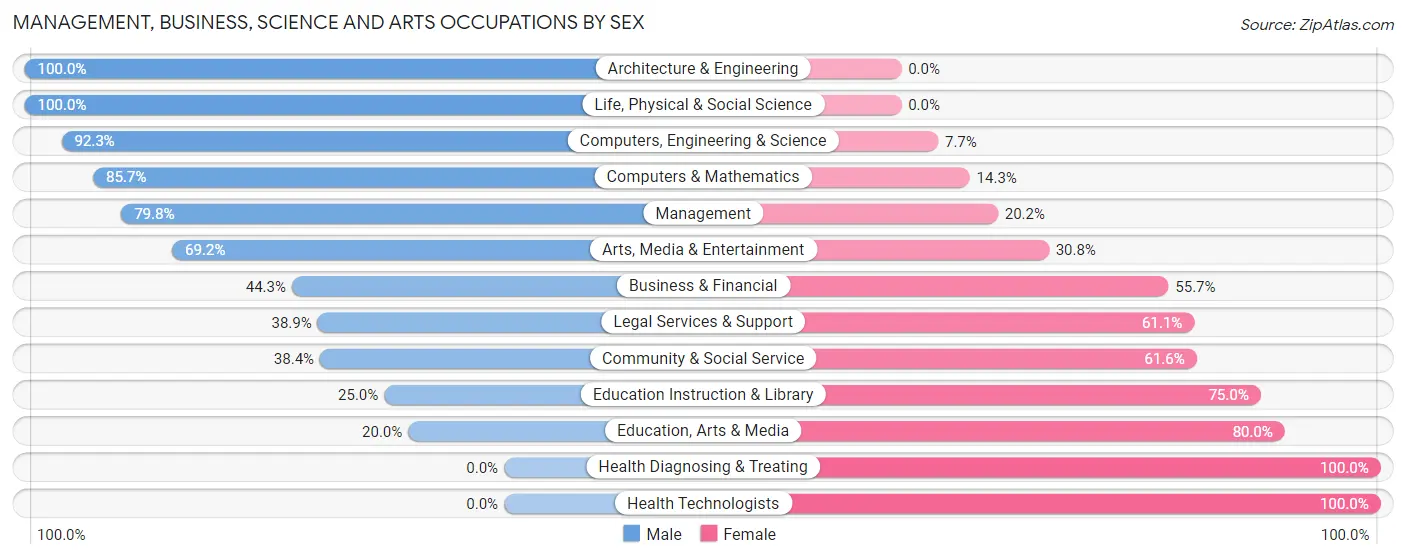
Management, Business, Science and Arts Occupations by Sex
Within the Management, Business, Science and Arts occupations in Casa Conejo, the most male-oriented occupations are Architecture & Engineering (100.0%), Life, Physical & Social Science (100.0%), and Computers, Engineering & Science (92.3%), while the most female-oriented occupations are Health Diagnosing & Treating (100.0%), Health Technologists (100.0%), and Education, Arts & Media (80.0%).
| Occupation | Male | Female |
| Management | 99 (79.8%) | 25 (20.2%) |
| Business & Financial | 27 (44.3%) | 34 (55.7%) |
| Computers, Engineering & Science | 72 (92.3%) | 6 (7.7%) |
| Computers & Mathematics | 36 (85.7%) | 6 (14.3%) |
| Architecture & Engineering | 18 (100.0%) | 0 (0.0%) |
| Life, Physical & Social Science | 18 (100.0%) | 0 (0.0%) |
| Community & Social Service | 101 (38.4%) | 162 (61.6%) |
| Education, Arts & Media | 7 (20.0%) | 28 (80.0%) |
| Legal Services & Support | 7 (38.9%) | 11 (61.1%) |
| Education Instruction & Library | 33 (25.0%) | 99 (75.0%) |
| Arts, Media & Entertainment | 54 (69.2%) | 24 (30.8%) |
| Health Diagnosing & Treating | 0 (0.0%) | 51 (100.0%) |
| Health Technologists | 0 (0.0%) | 32 (100.0%) |
| Total (Category) | 299 (51.8%) | 278 (48.2%) |
| Total (Overall) | 771 (53.9%) | 660 (46.1%) |
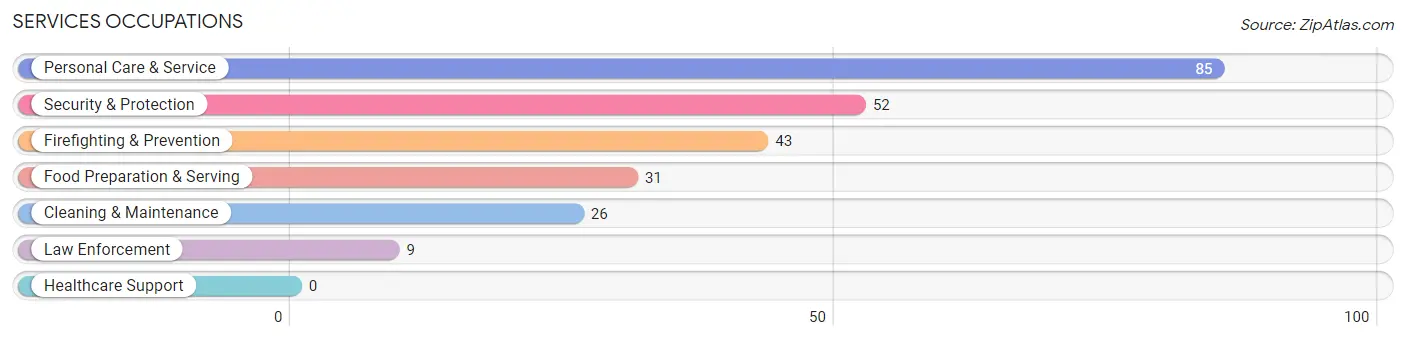
Services Occupations
The most common Services occupations in Casa Conejo are Personal Care & Service (85 | 5.9%), Security & Protection (52 | 3.6%), Firefighting & Prevention (43 | 3.0%), Food Preparation & Serving (31 | 2.2%), and Cleaning & Maintenance (26 | 1.8%).
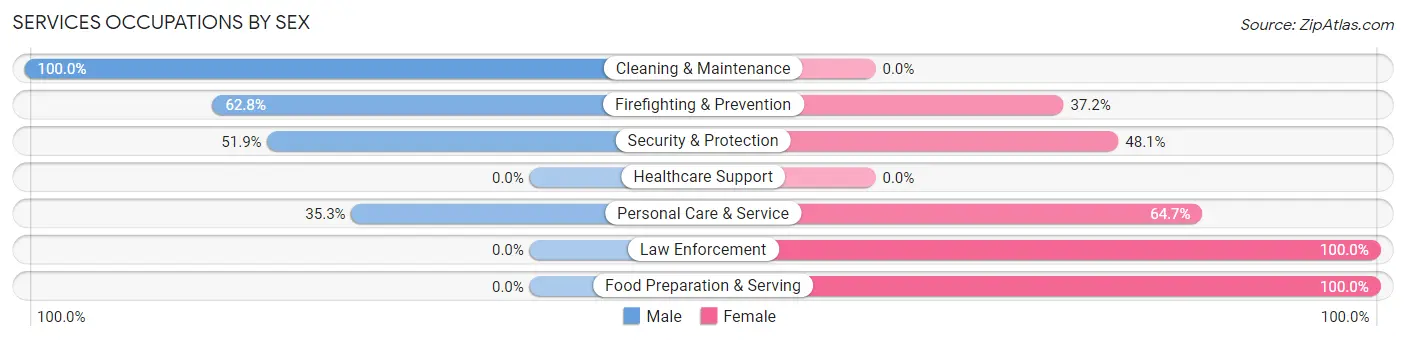
Services Occupations by Sex
Within the Services occupations in Casa Conejo, the most male-oriented occupations are Cleaning & Maintenance (100.0%), Firefighting & Prevention (62.8%), and Security & Protection (51.9%), while the most female-oriented occupations are Law Enforcement (100.0%), Food Preparation & Serving (100.0%), and Personal Care & Service (64.7%).
| Occupation | Male | Female |
| Healthcare Support | 0 (0.0%) | 0 (0.0%) |
| Security & Protection | 27 (51.9%) | 25 (48.1%) |
| Firefighting & Prevention | 27 (62.8%) | 16 (37.2%) |
| Law Enforcement | 0 (0.0%) | 9 (100.0%) |
| Food Preparation & Serving | 0 (0.0%) | 31 (100.0%) |
| Cleaning & Maintenance | 26 (100.0%) | 0 (0.0%) |
| Personal Care & Service | 30 (35.3%) | 55 (64.7%) |
| Total (Category) | 83 (42.8%) | 111 (57.2%) |
| Total (Overall) | 771 (53.9%) | 660 (46.1%) |
Sales and Office Occupations
The most common Sales and Office occupations in Casa Conejo are Sales & Related (264 | 18.4%), and Office & Administration (191 | 13.4%).

Sales and Office Occupations by Sex
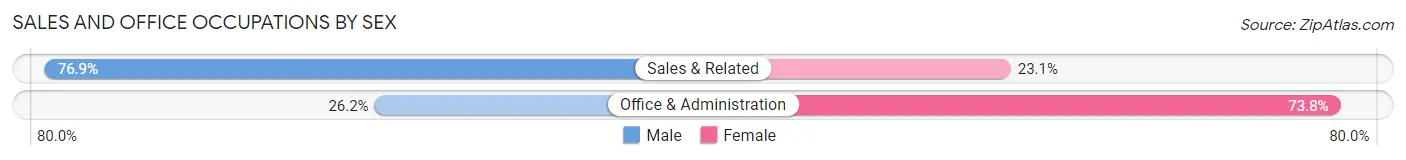
| Occupation | Male | Female |
| Sales & Related | 203 (76.9%) | 61 (23.1%) |
| Office & Administration | 50 (26.2%) | 141 (73.8%) |
| Total (Category) | 253 (55.6%) | 202 (44.4%) |
| Total (Overall) | 771 (53.9%) | 660 (46.1%) |
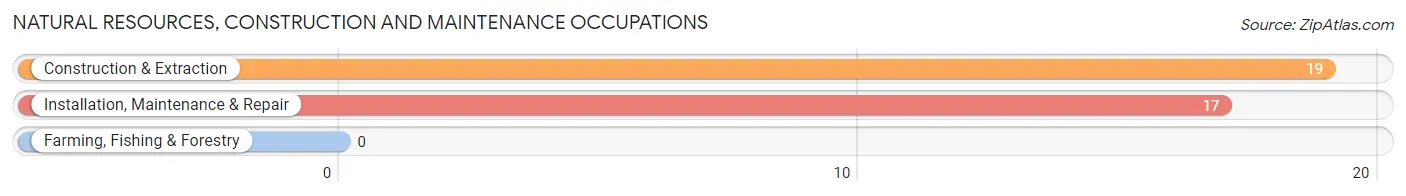
Natural Resources, Construction and Maintenance Occupations
The most common Natural Resources, Construction and Maintenance occupations in Casa Conejo are Construction & Extraction (19 | 1.3%), and Installation, Maintenance & Repair (17 | 1.2%).
Natural Resources, Construction and Maintenance Occupations by Sex
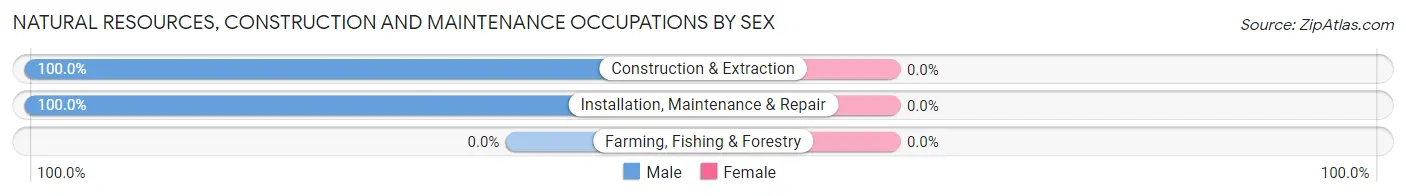
| Occupation | Male | Female |
| Farming, Fishing & Forestry | 0 (0.0%) | 0 (0.0%) |
| Construction & Extraction | 19 (100.0%) | 0 (0.0%) |
| Installation, Maintenance & Repair | 17 (100.0%) | 0 (0.0%) |
| Total (Category) | 36 (100.0%) | 0 (0.0%) |
| Total (Overall) | 771 (53.9%) | 660 (46.1%) |
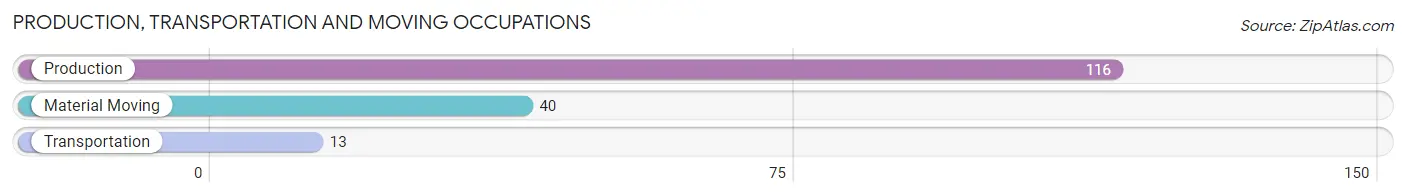
Production, Transportation and Moving Occupations
The most common Production, Transportation and Moving occupations in Casa Conejo are Production (116 | 8.1%), Material Moving (40 | 2.8%), and Transportation (13 | 0.9%).
Production, Transportation and Moving Occupations by Sex
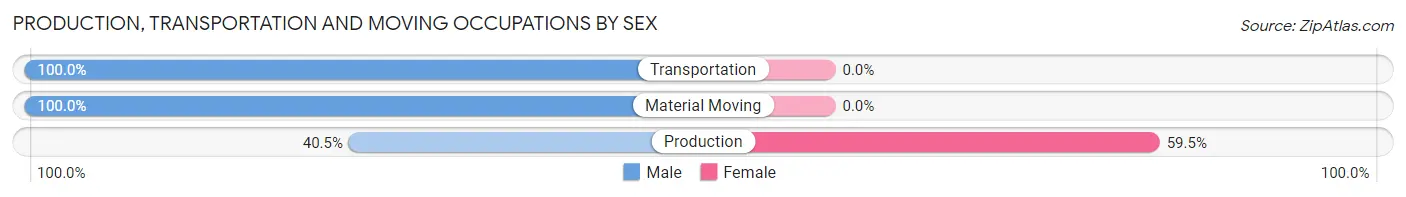
| Occupation | Male | Female |
| Production | 47 (40.5%) | 69 (59.5%) |
| Transportation | 13 (100.0%) | 0 (0.0%) |
| Material Moving | 40 (100.0%) | 0 (0.0%) |
| Total (Category) | 100 (59.2%) | 69 (40.8%) |
| Total (Overall) | 771 (53.9%) | 660 (46.1%) |
Employment Industries by Sex in Casa Conejo
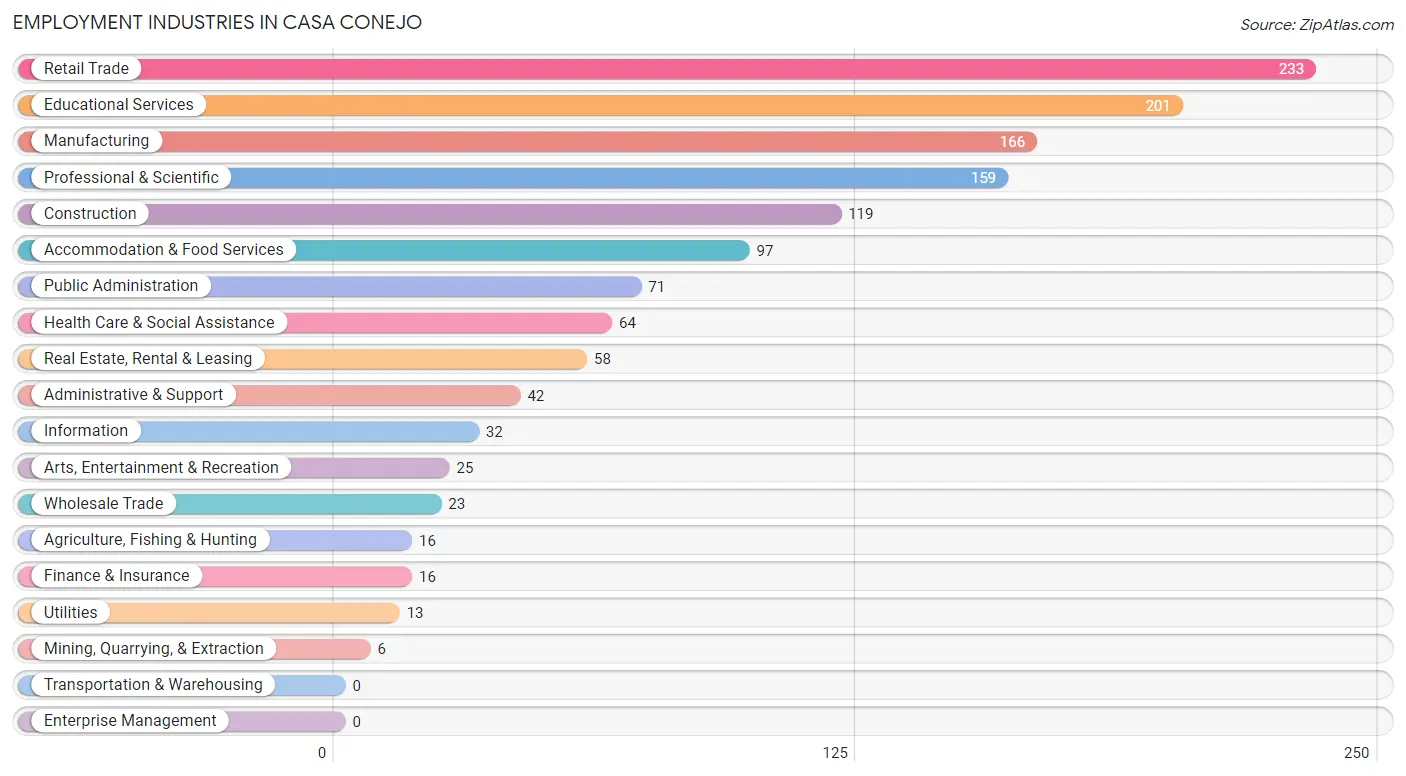
Employment Industries in Casa Conejo
The major employment industries in Casa Conejo include Retail Trade (233 | 16.3%), Educational Services (201 | 14.1%), Manufacturing (166 | 11.6%), Professional & Scientific (159 | 11.1%), and Construction (119 | 8.3%).
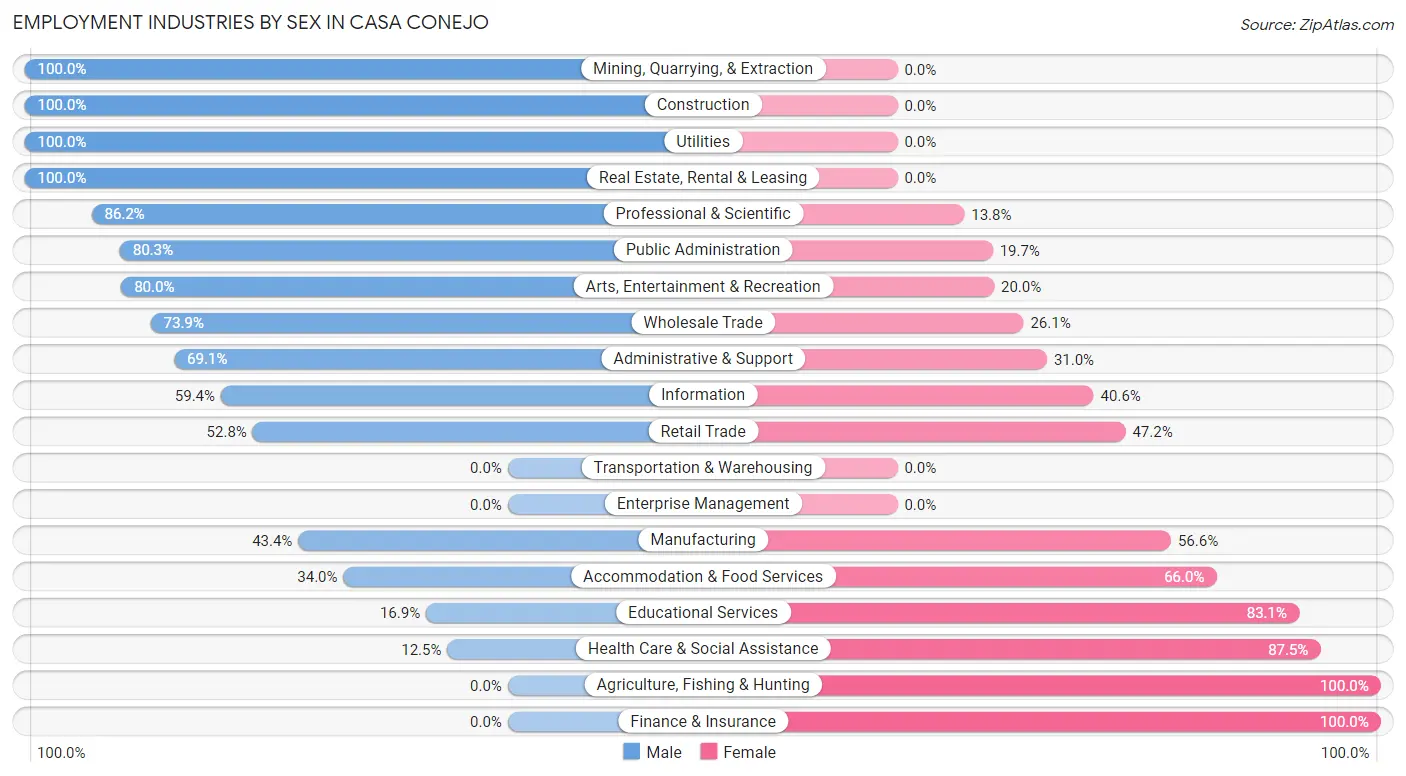
Employment Industries by Sex in Casa Conejo
The Casa Conejo industries that see more men than women are Mining, Quarrying, & Extraction (100.0%), Construction (100.0%), and Utilities (100.0%), whereas the industries that tend to have a higher number of women are Agriculture, Fishing & Hunting (100.0%), Finance & Insurance (100.0%), and Health Care & Social Assistance (87.5%).
| Industry | Male | Female |
| Agriculture, Fishing & Hunting | 0 (0.0%) | 16 (100.0%) |
| Mining, Quarrying, & Extraction | 6 (100.0%) | 0 (0.0%) |
| Construction | 119 (100.0%) | 0 (0.0%) |
| Manufacturing | 72 (43.4%) | 94 (56.6%) |
| Wholesale Trade | 17 (73.9%) | 6 (26.1%) |
| Retail Trade | 123 (52.8%) | 110 (47.2%) |
| Transportation & Warehousing | 0 (0.0%) | 0 (0.0%) |
| Utilities | 13 (100.0%) | 0 (0.0%) |
| Information | 19 (59.4%) | 13 (40.6%) |
| Finance & Insurance | 0 (0.0%) | 16 (100.0%) |
| Real Estate, Rental & Leasing | 58 (100.0%) | 0 (0.0%) |
| Professional & Scientific | 137 (86.2%) | 22 (13.8%) |
| Enterprise Management | 0 (0.0%) | 0 (0.0%) |
| Administrative & Support | 29 (69.1%) | 13 (30.9%) |
| Educational Services | 34 (16.9%) | 167 (83.1%) |
| Health Care & Social Assistance | 8 (12.5%) | 56 (87.5%) |
| Arts, Entertainment & Recreation | 20 (80.0%) | 5 (20.0%) |
| Accommodation & Food Services | 33 (34.0%) | 64 (66.0%) |
| Public Administration | 57 (80.3%) | 14 (19.7%) |
| Total | 771 (53.9%) | 660 (46.1%) |
Education in Casa Conejo
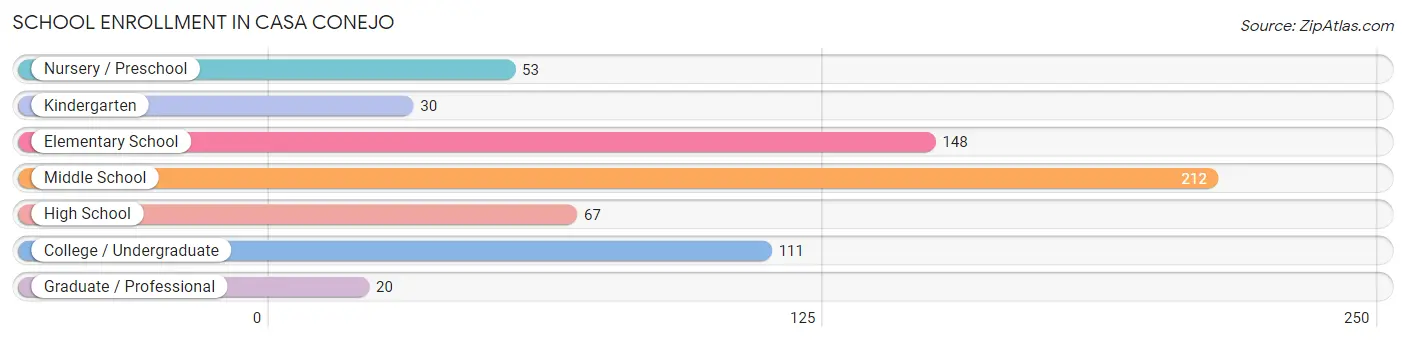
School Enrollment in Casa Conejo
The most common levels of schooling among the 641 students in Casa Conejo are middle school (212 | 33.1%), elementary school (148 | 23.1%), and college / undergraduate (111 | 17.3%).
| School Level | # Students | % Students |
| Nursery / Preschool | 53 | 8.3% |
| Kindergarten | 30 | 4.7% |
| Elementary School | 148 | 23.1% |
| Middle School | 212 | 33.1% |
| High School | 67 | 10.4% |
| College / Undergraduate | 111 | 17.3% |
| Graduate / Professional | 20 | 3.1% |
| Total | 641 | 100.0% |
School Enrollment by Age by Funding Source in Casa Conejo
Out of a total of 641 students who are enrolled in schools in Casa Conejo, 149 (23.2%) attend a private institution, while the remaining 492 (76.8%) are enrolled in public schools. The age group of 3 to 4 year olds has the highest likelihood of being enrolled in private schools, with 45 (84.9% in the age bracket) enrolled. Conversely, the age group of 5 to 9 year old has the lowest likelihood of being enrolled in a private school, with 162 (100.0% in the age bracket) attending a public institution.
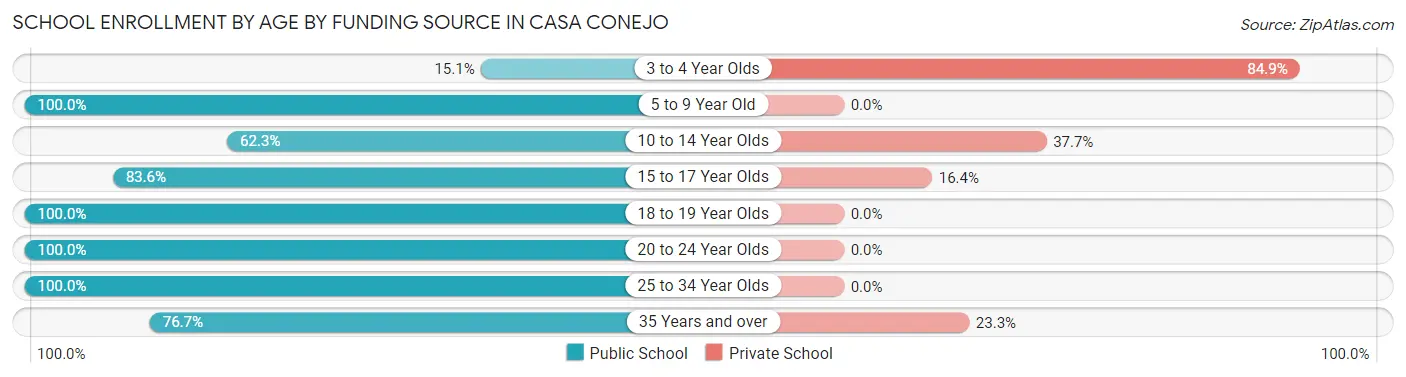
| Age Bracket | Public School | Private School |
| 3 to 4 Year Olds | 8 (15.1%) | 45 (84.9%) |
| 5 to 9 Year Old | 162 (100.0%) | 0 (0.0%) |
| 10 to 14 Year Olds | 142 (62.3%) | 86 (37.7%) |
| 15 to 17 Year Olds | 56 (83.6%) | 11 (16.4%) |
| 18 to 19 Year Olds | 50 (100.0%) | 0 (0.0%) |
| 20 to 24 Year Olds | 44 (100.0%) | 0 (0.0%) |
| 25 to 34 Year Olds | 7 (100.0%) | 0 (0.0%) |
| 35 Years and over | 23 (76.7%) | 7 (23.3%) |
| Total | 492 (76.8%) | 149 (23.2%) |
Educational Attainment by Field of Study in Casa Conejo
Business (99 | 12.9%), bio, nature & agricultural (95 | 12.4%), communications (84 | 10.9%), psychology (78 | 10.2%), and visual & performing arts (74 | 9.6%) are the most common fields of study among 768 individuals in Casa Conejo who have obtained a bachelor's degree or higher.
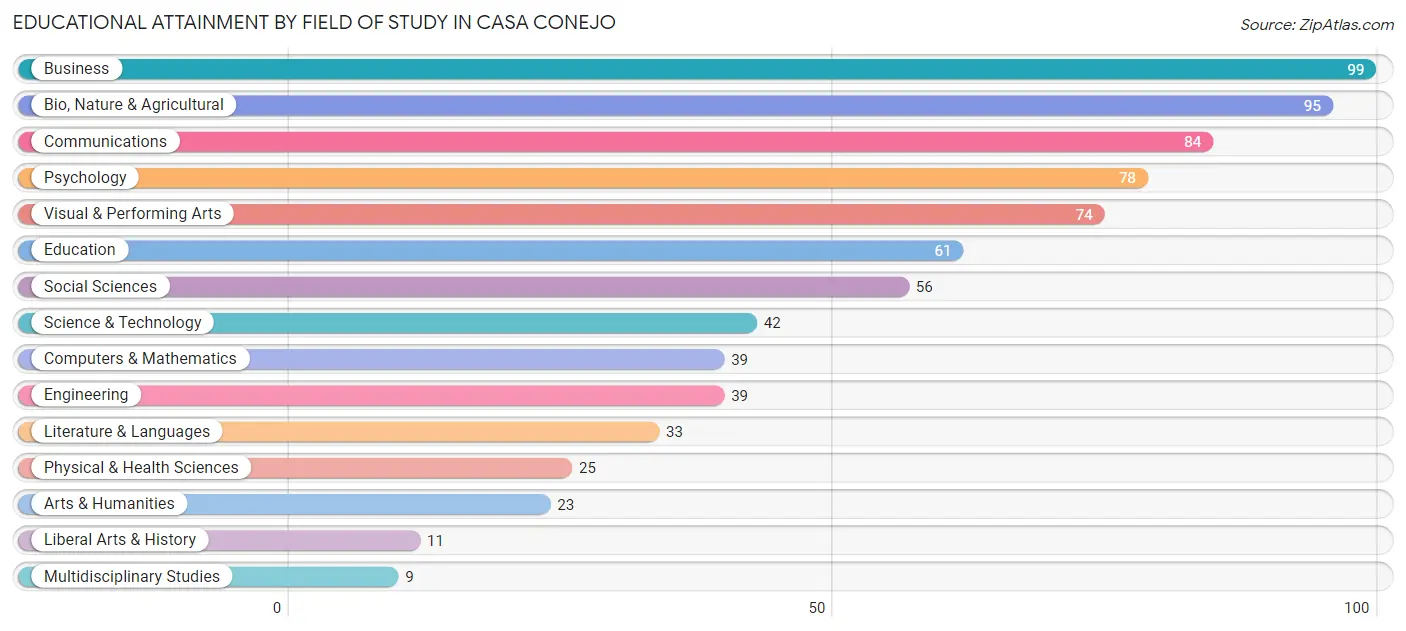
| Field of Study | # Graduates | % Graduates |
| Computers & Mathematics | 39 | 5.1% |
| Bio, Nature & Agricultural | 95 | 12.4% |
| Physical & Health Sciences | 25 | 3.3% |
| Psychology | 78 | 10.2% |
| Social Sciences | 56 | 7.3% |
| Engineering | 39 | 5.1% |
| Multidisciplinary Studies | 9 | 1.2% |
| Science & Technology | 42 | 5.5% |
| Business | 99 | 12.9% |
| Education | 61 | 7.9% |
| Literature & Languages | 33 | 4.3% |
| Liberal Arts & History | 11 | 1.4% |
| Visual & Performing Arts | 74 | 9.6% |
| Communications | 84 | 10.9% |
| Arts & Humanities | 23 | 3.0% |
| Total | 768 | 100.0% |
Transportation & Commute in Casa Conejo
Vehicle Availability by Sex in Casa Conejo
The most prevalent vehicle ownership categories in Casa Conejo are males with 2 vehicles (308, accounting for 43.6%) and females with 2 vehicles (244, making up 51.2%).
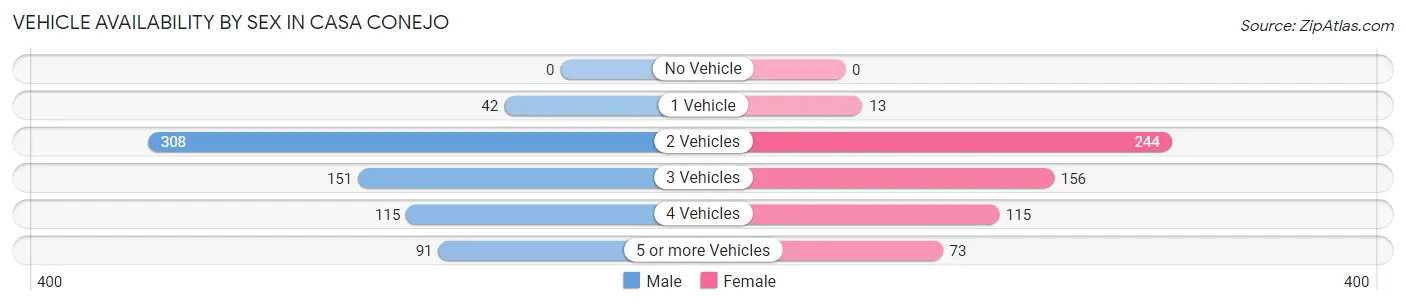
| Vehicles Available | Male | Female |
| No Vehicle | 0 (0.0%) | 0 (0.0%) |
| 1 Vehicle | 42 (5.9%) | 13 (2.2%) |
| 2 Vehicles | 308 (43.6%) | 244 (40.6%) |
| 3 Vehicles | 151 (21.4%) | 156 (26.0%) |
| 4 Vehicles | 115 (16.3%) | 115 (19.1%) |
| 5 or more Vehicles | 91 (12.9%) | 73 (12.1%) |
| Total | 707 (100.0%) | 601 (100.0%) |
Commute Time in Casa Conejo
The most frequently occuring commute durations in Casa Conejo are 5 to 9 minutes (394 commuters, 34.3%), 15 to 19 minutes (219 commuters, 19.0%), and 10 to 14 minutes (210 commuters, 18.3%).
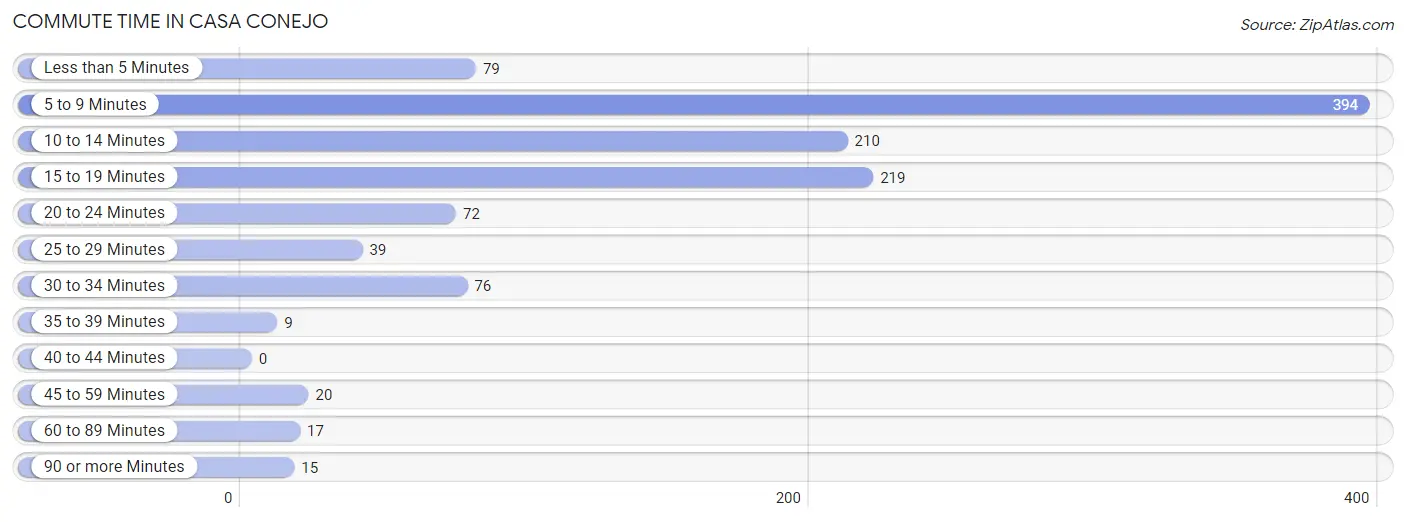
| Commute Time | # Commuters | % Commuters |
| Less than 5 Minutes | 79 | 6.9% |
| 5 to 9 Minutes | 394 | 34.3% |
| 10 to 14 Minutes | 210 | 18.3% |
| 15 to 19 Minutes | 219 | 19.0% |
| 20 to 24 Minutes | 72 | 6.3% |
| 25 to 29 Minutes | 39 | 3.4% |
| 30 to 34 Minutes | 76 | 6.6% |
| 35 to 39 Minutes | 9 | 0.8% |
| 40 to 44 Minutes | 0 | 0.0% |
| 45 to 59 Minutes | 20 | 1.7% |
| 60 to 89 Minutes | 17 | 1.5% |
| 90 or more Minutes | 15 | 1.3% |
Commute Time by Sex in Casa Conejo
The most common commute times in Casa Conejo are 5 to 9 minutes (223 commuters, 36.2%) for males and 5 to 9 minutes (171 commuters, 32.0%) for females.
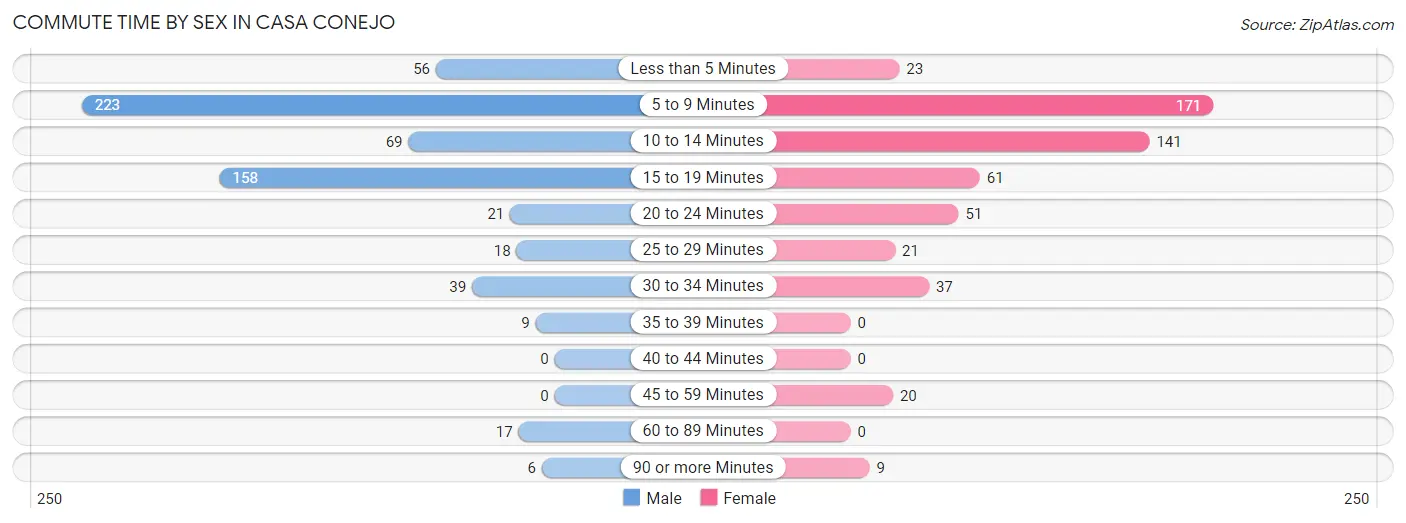
| Commute Time | Male | Female |
| Less than 5 Minutes | 56 (9.1%) | 23 (4.3%) |
| 5 to 9 Minutes | 223 (36.2%) | 171 (32.0%) |
| 10 to 14 Minutes | 69 (11.2%) | 141 (26.4%) |
| 15 to 19 Minutes | 158 (25.7%) | 61 (11.4%) |
| 20 to 24 Minutes | 21 (3.4%) | 51 (9.6%) |
| 25 to 29 Minutes | 18 (2.9%) | 21 (3.9%) |
| 30 to 34 Minutes | 39 (6.3%) | 37 (6.9%) |
| 35 to 39 Minutes | 9 (1.5%) | 0 (0.0%) |
| 40 to 44 Minutes | 0 (0.0%) | 0 (0.0%) |
| 45 to 59 Minutes | 0 (0.0%) | 20 (3.7%) |
| 60 to 89 Minutes | 17 (2.8%) | 0 (0.0%) |
| 90 or more Minutes | 6 (1.0%) | 9 (1.7%) |
Time of Departure to Work by Sex in Casa Conejo
The most frequent times of departure to work in Casa Conejo are 9:00 AM to 9:59 AM (159, 25.8%) for males and 8:00 AM to 8:29 AM (111, 20.8%) for females.
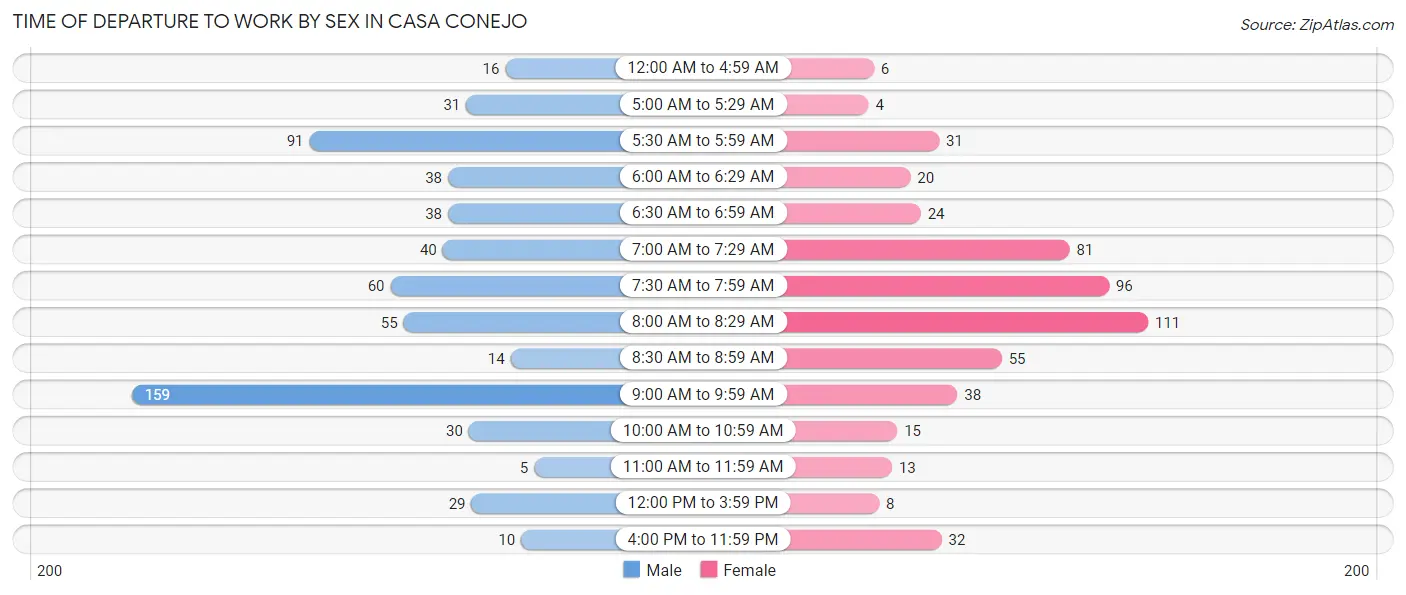
| Time of Departure | Male | Female |
| 12:00 AM to 4:59 AM | 16 (2.6%) | 6 (1.1%) |
| 5:00 AM to 5:29 AM | 31 (5.0%) | 4 (0.7%) |
| 5:30 AM to 5:59 AM | 91 (14.8%) | 31 (5.8%) |
| 6:00 AM to 6:29 AM | 38 (6.2%) | 20 (3.7%) |
| 6:30 AM to 6:59 AM | 38 (6.2%) | 24 (4.5%) |
| 7:00 AM to 7:29 AM | 40 (6.5%) | 81 (15.2%) |
| 7:30 AM to 7:59 AM | 60 (9.7%) | 96 (18.0%) |
| 8:00 AM to 8:29 AM | 55 (8.9%) | 111 (20.8%) |
| 8:30 AM to 8:59 AM | 14 (2.3%) | 55 (10.3%) |
| 9:00 AM to 9:59 AM | 159 (25.8%) | 38 (7.1%) |
| 10:00 AM to 10:59 AM | 30 (4.9%) | 15 (2.8%) |
| 11:00 AM to 11:59 AM | 5 (0.8%) | 13 (2.4%) |
| 12:00 PM to 3:59 PM | 29 (4.7%) | 8 (1.5%) |
| 4:00 PM to 11:59 PM | 10 (1.6%) | 32 (6.0%) |
| Total | 616 (100.0%) | 534 (100.0%) |
Housing Occupancy in Casa Conejo
Occupancy by Ownership in Casa Conejo
Of the total 825 dwellings in Casa Conejo, owner-occupied units account for 702 (85.1%), while renter-occupied units make up 123 (14.9%).
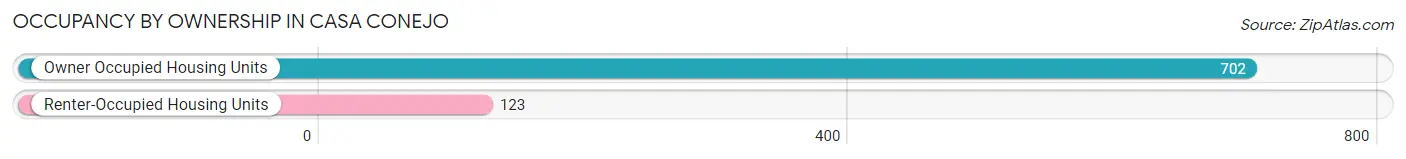
| Occupancy | # Housing Units | % Housing Units |
| Owner Occupied Housing Units | 702 | 85.1% |
| Renter-Occupied Housing Units | 123 | 14.9% |
| Total Occupied Housing Units | 825 | 100.0% |
Occupancy by Household Size in Casa Conejo
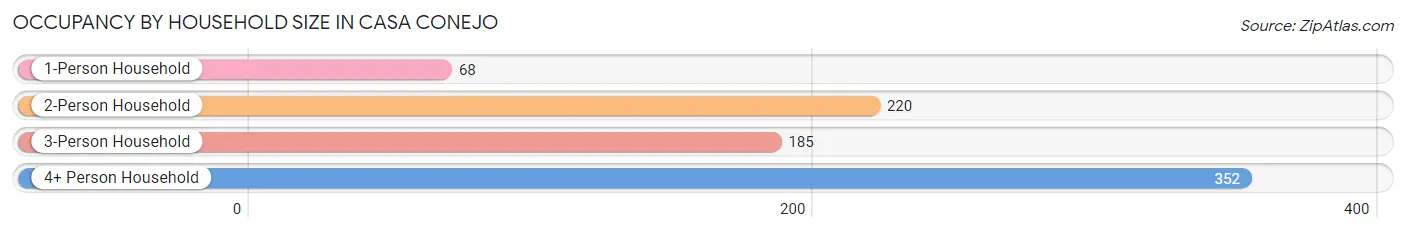
| Household Size | # Housing Units | % Housing Units |
| 1-Person Household | 68 | 8.2% |
| 2-Person Household | 220 | 26.7% |
| 3-Person Household | 185 | 22.4% |
| 4+ Person Household | 352 | 42.7% |
| Total Housing Units | 825 | 100.0% |
Occupancy by Ownership by Household Size in Casa Conejo
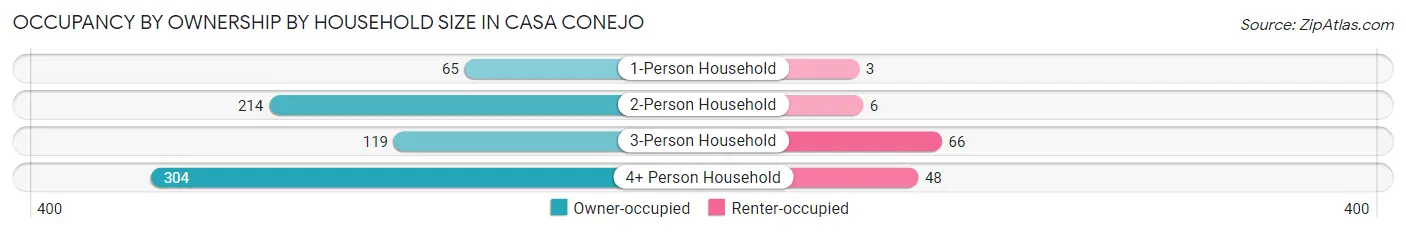
| Household Size | Owner-occupied | Renter-occupied |
| 1-Person Household | 65 (95.6%) | 3 (4.4%) |
| 2-Person Household | 214 (97.3%) | 6 (2.7%) |
| 3-Person Household | 119 (64.3%) | 66 (35.7%) |
| 4+ Person Household | 304 (86.4%) | 48 (13.6%) |
| Total Housing Units | 702 (85.1%) | 123 (14.9%) |
Occupancy by Educational Attainment in Casa Conejo
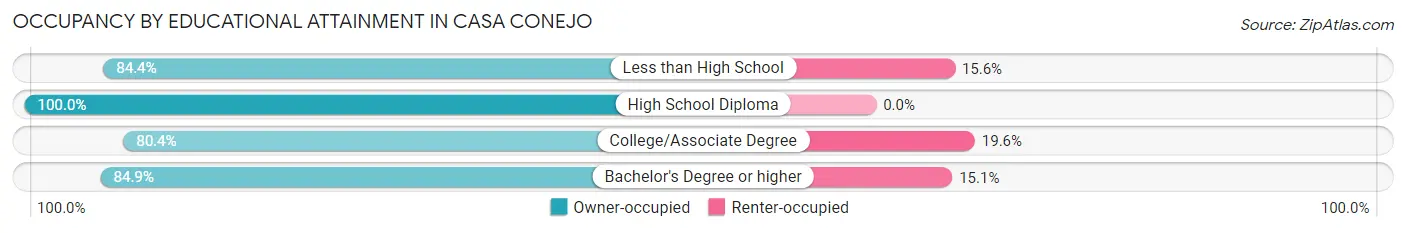
| Household Size | Owner-occupied | Renter-occupied |
| Less than High School | 27 (84.4%) | 5 (15.6%) |
| High School Diploma | 108 (100.0%) | 0 (0.0%) |
| College/Associate Degree | 263 (80.4%) | 64 (19.6%) |
| Bachelor's Degree or higher | 304 (84.9%) | 54 (15.1%) |
Occupancy by Age of Householder in Casa Conejo
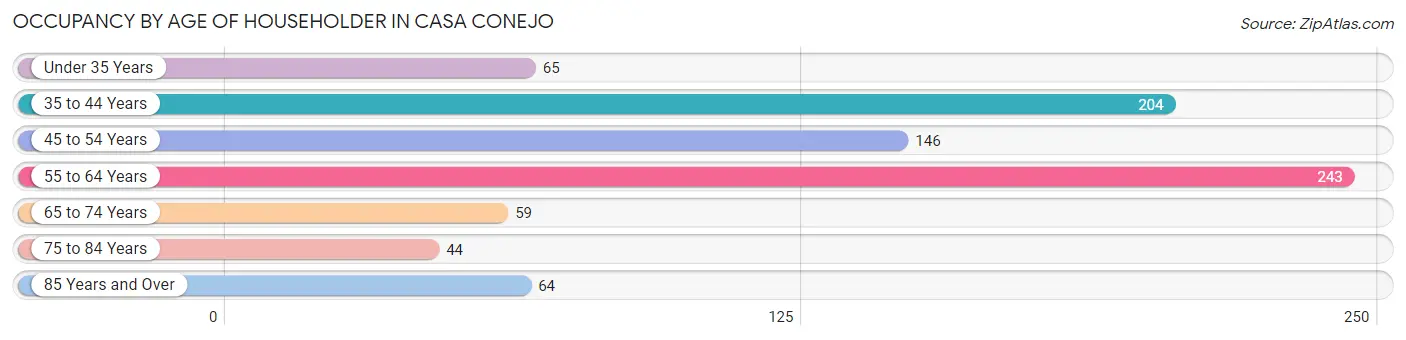
| Age Bracket | # Households | % Households |
| Under 35 Years | 65 | 7.9% |
| 35 to 44 Years | 204 | 24.7% |
| 45 to 54 Years | 146 | 17.7% |
| 55 to 64 Years | 243 | 29.4% |
| 65 to 74 Years | 59 | 7.1% |
| 75 to 84 Years | 44 | 5.3% |
| 85 Years and Over | 64 | 7.8% |
| Total | 825 | 100.0% |
Housing Finances in Casa Conejo
Median Income by Occupancy in Casa Conejo
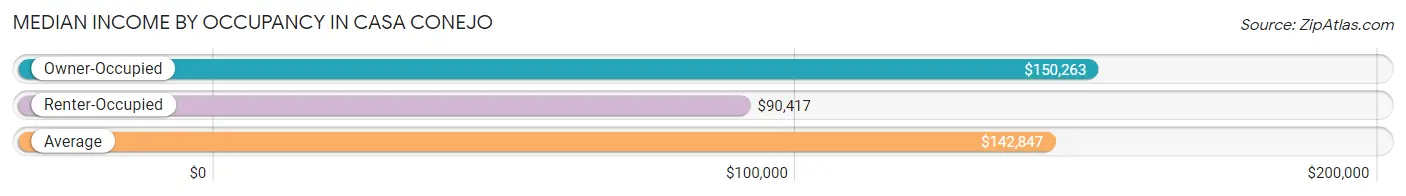
| Occupancy Type | # Households | Median Income |
| Owner-Occupied | 702 (85.1%) | $150,263 |
| Renter-Occupied | 123 (14.9%) | $90,417 |
| Average | 825 (100.0%) | $142,847 |
Occupancy by Householder Income Bracket in Casa Conejo
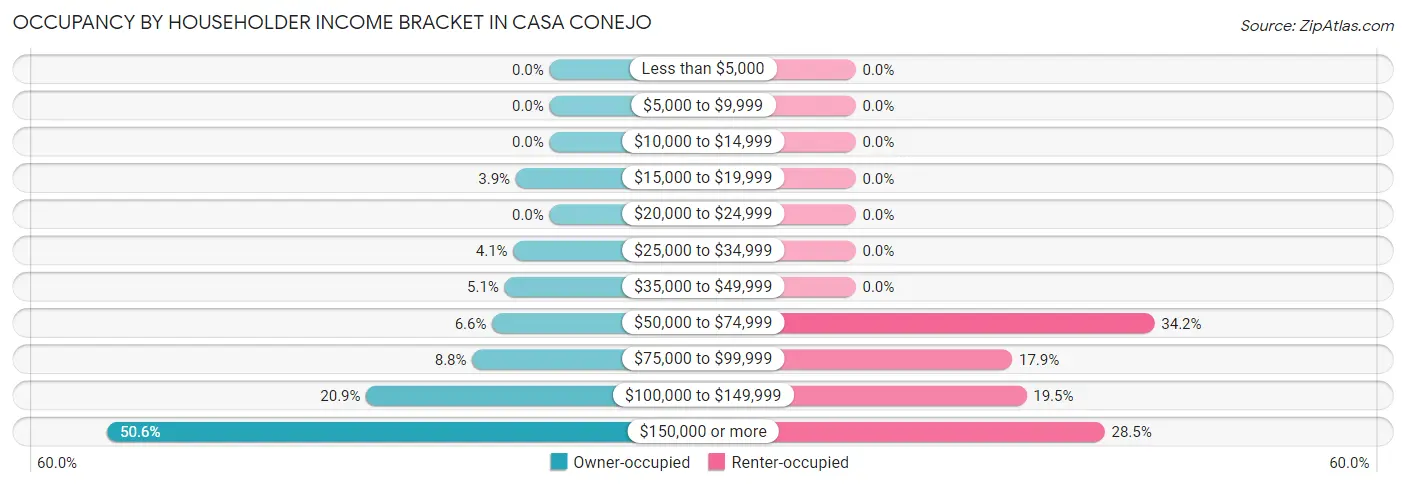
| Income Bracket | Owner-occupied | Renter-occupied |
| Less than $5,000 | 0 (0.0%) | 0 (0.0%) |
| $5,000 to $9,999 | 0 (0.0%) | 0 (0.0%) |
| $10,000 to $14,999 | 0 (0.0%) | 0 (0.0%) |
| $15,000 to $19,999 | 27 (3.8%) | 0 (0.0%) |
| $20,000 to $24,999 | 0 (0.0%) | 0 (0.0%) |
| $25,000 to $34,999 | 29 (4.1%) | 0 (0.0%) |
| $35,000 to $49,999 | 36 (5.1%) | 0 (0.0%) |
| $50,000 to $74,999 | 46 (6.6%) | 42 (34.2%) |
| $75,000 to $99,999 | 62 (8.8%) | 22 (17.9%) |
| $100,000 to $149,999 | 147 (20.9%) | 24 (19.5%) |
| $150,000 or more | 355 (50.6%) | 35 (28.5%) |
| Total | 702 (100.0%) | 123 (100.0%) |
Monthly Housing Cost Tiers in Casa Conejo
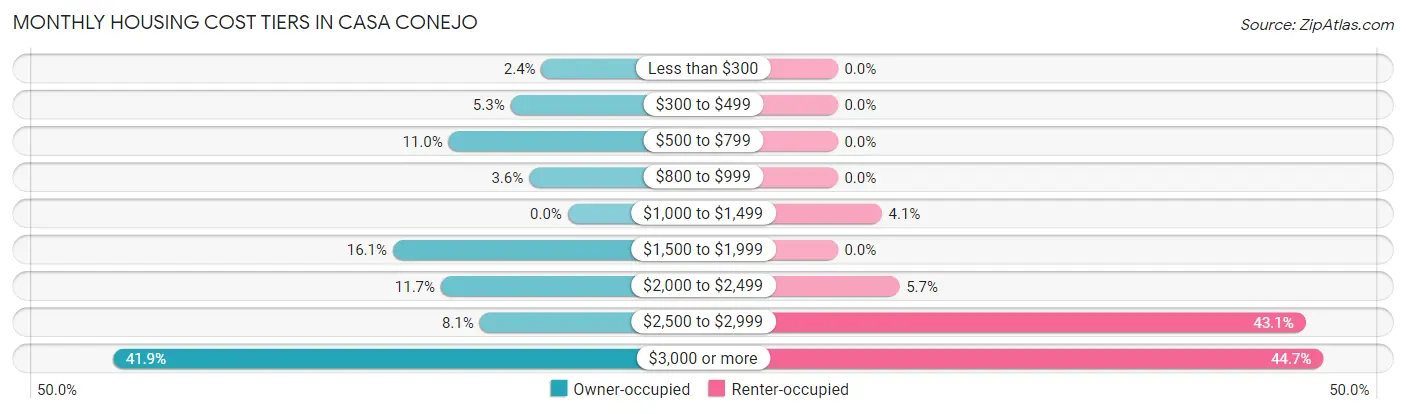
| Monthly Cost | Owner-occupied | Renter-occupied |
| Less than $300 | 17 (2.4%) | 0 (0.0%) |
| $300 to $499 | 37 (5.3%) | 0 (0.0%) |
| $500 to $799 | 77 (11.0%) | 0 (0.0%) |
| $800 to $999 | 25 (3.6%) | 0 (0.0%) |
| $1,000 to $1,499 | 0 (0.0%) | 5 (4.1%) |
| $1,500 to $1,999 | 113 (16.1%) | 0 (0.0%) |
| $2,000 to $2,499 | 82 (11.7%) | 7 (5.7%) |
| $2,500 to $2,999 | 57 (8.1%) | 53 (43.1%) |
| $3,000 or more | 294 (41.9%) | 55 (44.7%) |
| Total | 702 (100.0%) | 123 (100.0%) |
Physical Housing Characteristics in Casa Conejo
Housing Structures in Casa Conejo
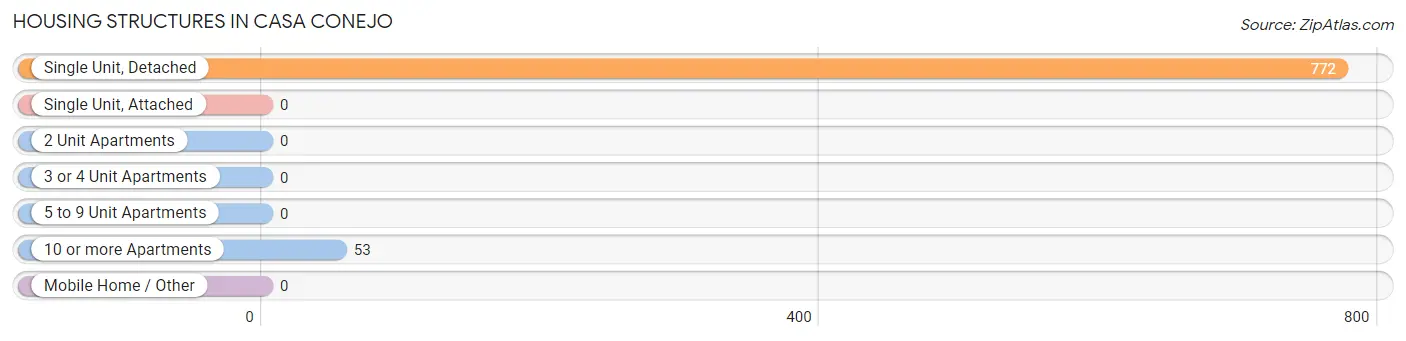
| Structure Type | # Housing Units | % Housing Units |
| Single Unit, Detached | 772 | 93.6% |
| Single Unit, Attached | 0 | 0.0% |
| 2 Unit Apartments | 0 | 0.0% |
| 3 or 4 Unit Apartments | 0 | 0.0% |
| 5 to 9 Unit Apartments | 0 | 0.0% |
| 10 or more Apartments | 53 | 6.4% |
| Mobile Home / Other | 0 | 0.0% |
| Total | 825 | 100.0% |
Housing Structures by Occupancy in Casa Conejo
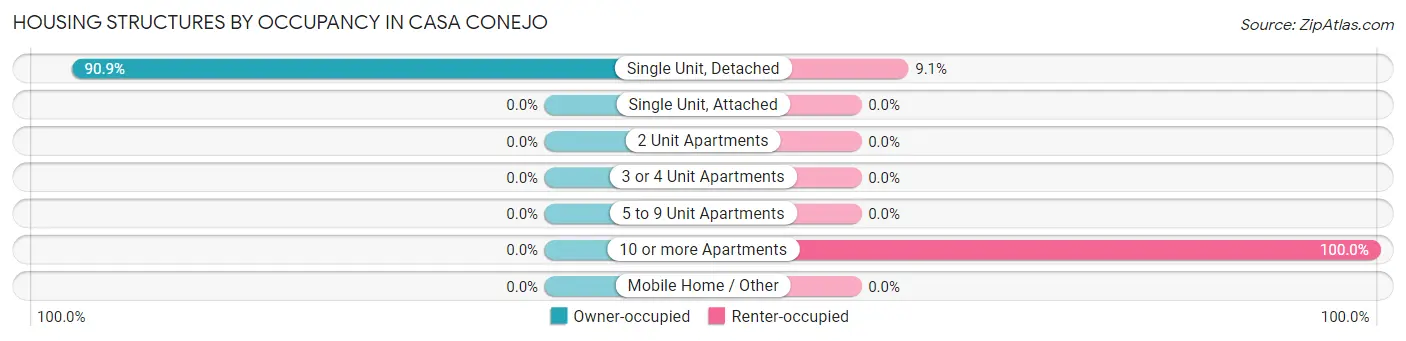
| Structure Type | Owner-occupied | Renter-occupied |
| Single Unit, Detached | 702 (90.9%) | 70 (9.1%) |
| Single Unit, Attached | 0 (0.0%) | 0 (0.0%) |
| 2 Unit Apartments | 0 (0.0%) | 0 (0.0%) |
| 3 or 4 Unit Apartments | 0 (0.0%) | 0 (0.0%) |
| 5 to 9 Unit Apartments | 0 (0.0%) | 0 (0.0%) |
| 10 or more Apartments | 0 (0.0%) | 53 (100.0%) |
| Mobile Home / Other | 0 (0.0%) | 0 (0.0%) |
| Total | 702 (85.1%) | 123 (14.9%) |
Housing Structures by Number of Rooms in Casa Conejo
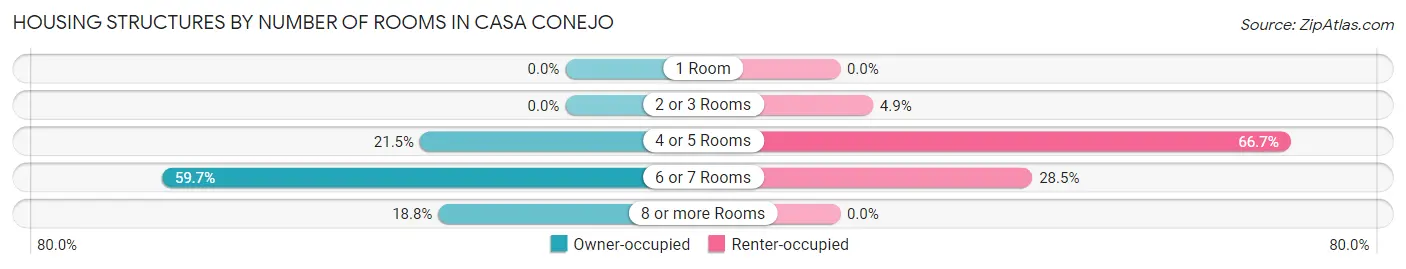
| Number of Rooms | Owner-occupied | Renter-occupied |
| 1 Room | 0 (0.0%) | 0 (0.0%) |
| 2 or 3 Rooms | 0 (0.0%) | 6 (4.9%) |
| 4 or 5 Rooms | 151 (21.5%) | 82 (66.7%) |
| 6 or 7 Rooms | 419 (59.7%) | 35 (28.5%) |
| 8 or more Rooms | 132 (18.8%) | 0 (0.0%) |
| Total | 702 (100.0%) | 123 (100.0%) |
Housing Structure by Heating Type in Casa Conejo
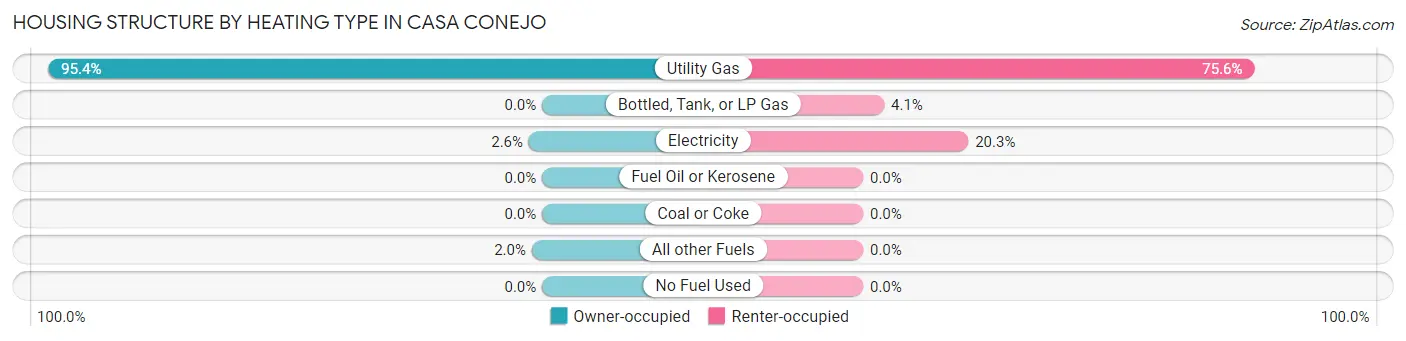
| Heating Type | Owner-occupied | Renter-occupied |
| Utility Gas | 670 (95.4%) | 93 (75.6%) |
| Bottled, Tank, or LP Gas | 0 (0.0%) | 5 (4.1%) |
| Electricity | 18 (2.6%) | 25 (20.3%) |
| Fuel Oil or Kerosene | 0 (0.0%) | 0 (0.0%) |
| Coal or Coke | 0 (0.0%) | 0 (0.0%) |
| All other Fuels | 14 (2.0%) | 0 (0.0%) |
| No Fuel Used | 0 (0.0%) | 0 (0.0%) |
| Total | 702 (100.0%) | 123 (100.0%) |
Household Vehicle Usage in Casa Conejo
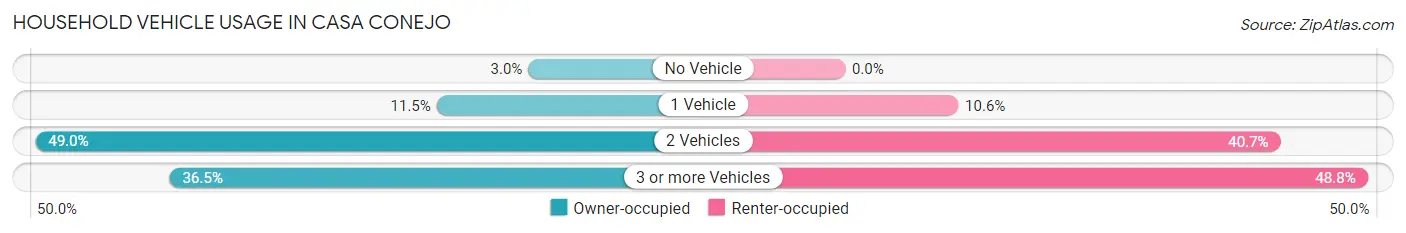
| Vehicles per Household | Owner-occupied | Renter-occupied |
| No Vehicle | 21 (3.0%) | 0 (0.0%) |
| 1 Vehicle | 81 (11.5%) | 13 (10.6%) |
| 2 Vehicles | 344 (49.0%) | 50 (40.6%) |
| 3 or more Vehicles | 256 (36.5%) | 60 (48.8%) |
| Total | 702 (100.0%) | 123 (100.0%) |
Real Estate & Mortgages in Casa Conejo
Real Estate and Mortgage Overview in Casa Conejo
| Characteristic | Without Mortgage | With Mortgage |
| Housing Units | 148 | 554 |
| Median Property Value | $656,900 | $723,100 |
| Median Household Income | $101,071 | $312 |
| Monthly Housing Costs | $577 | $294 |
| Real Estate Taxes | $2,370 | $0 |
Property Value by Mortgage Status in Casa Conejo
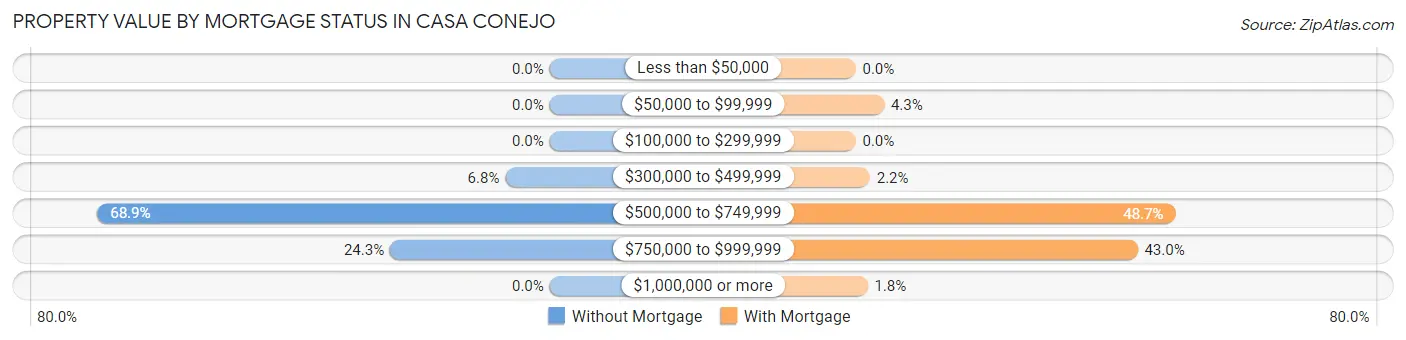
| Property Value | Without Mortgage | With Mortgage |
| Less than $50,000 | 0 (0.0%) | 0 (0.0%) |
| $50,000 to $99,999 | 0 (0.0%) | 24 (4.3%) |
| $100,000 to $299,999 | 0 (0.0%) | 0 (0.0%) |
| $300,000 to $499,999 | 10 (6.8%) | 12 (2.2%) |
| $500,000 to $749,999 | 102 (68.9%) | 270 (48.7%) |
| $750,000 to $999,999 | 36 (24.3%) | 238 (43.0%) |
| $1,000,000 or more | 0 (0.0%) | 10 (1.8%) |
| Total | 148 (100.0%) | 554 (100.0%) |
Household Income by Mortgage Status in Casa Conejo
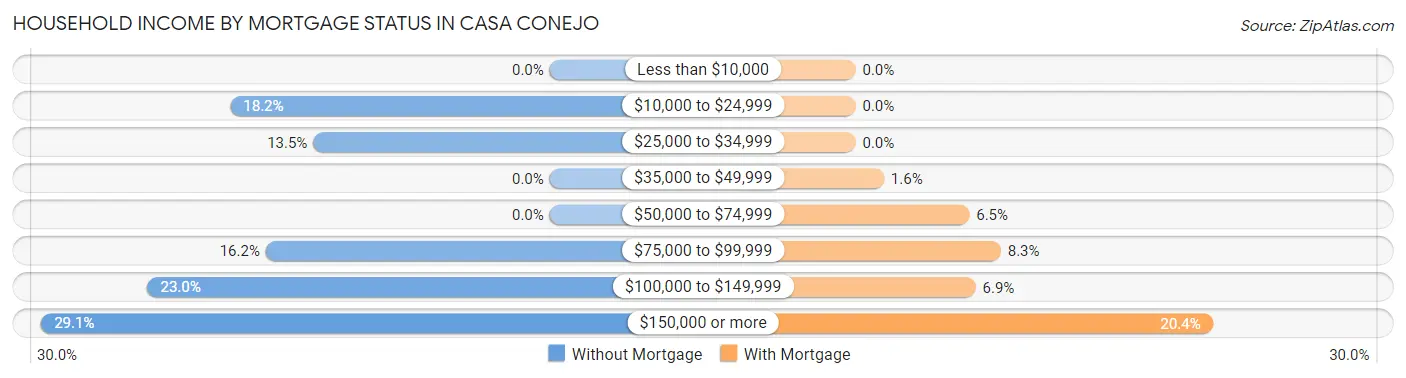
| Household Income | Without Mortgage | With Mortgage |
| Less than $10,000 | 0 (0.0%) | 0 (0.0%) |
| $10,000 to $24,999 | 27 (18.2%) | 0 (0.0%) |
| $25,000 to $34,999 | 20 (13.5%) | 0 (0.0%) |
| $35,000 to $49,999 | 0 (0.0%) | 9 (1.6%) |
| $50,000 to $74,999 | 0 (0.0%) | 36 (6.5%) |
| $75,000 to $99,999 | 24 (16.2%) | 46 (8.3%) |
| $100,000 to $149,999 | 34 (23.0%) | 38 (6.9%) |
| $150,000 or more | 43 (29.0%) | 113 (20.4%) |
| Total | 148 (100.0%) | 554 (100.0%) |
Property Value to Household Income Ratio in Casa Conejo

| Value-to-Income Ratio | Without Mortgage | With Mortgage |
| Less than 2.0x | 0 (0.0%) | 152,303 (27,491.5%) |
| 2.0x to 2.9x | 0 (0.0%) | 40 (7.2%) |
| 3.0x to 3.9x | 0 (0.0%) | 25 (4.5%) |
| 4.0x or more | 148 (100.0%) | 79 (14.3%) |
| Total | 148 (100.0%) | 554 (100.0%) |
Real Estate Taxes by Mortgage Status in Casa Conejo
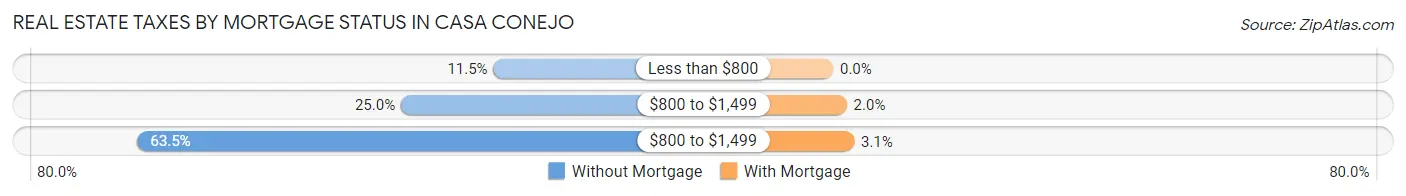
| Property Taxes | Without Mortgage | With Mortgage |
| Less than $800 | 17 (11.5%) | 0 (0.0%) |
| $800 to $1,499 | 37 (25.0%) | 11 (2.0%) |
| $800 to $1,499 | 94 (63.5%) | 17 (3.1%) |
| Total | 148 (100.0%) | 554 (100.0%) |
Health & Disability in Casa Conejo
Health Insurance Coverage by Age in Casa Conejo
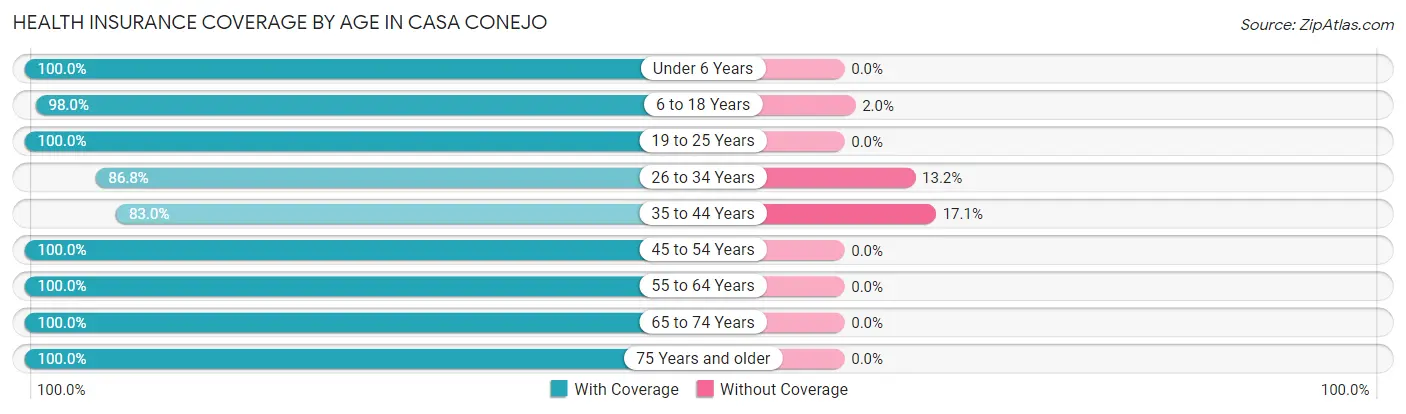
| Age Bracket | With Coverage | Without Coverage |
| Under 6 Years | 192 (100.0%) | 0 (0.0%) |
| 6 to 18 Years | 528 (98.0%) | 11 (2.0%) |
| 19 to 25 Years | 176 (100.0%) | 0 (0.0%) |
| 26 to 34 Years | 230 (86.8%) | 35 (13.2%) |
| 35 to 44 Years | 360 (83.0%) | 74 (17.1%) |
| 45 to 54 Years | 250 (100.0%) | 0 (0.0%) |
| 55 to 64 Years | 538 (100.0%) | 0 (0.0%) |
| 65 to 74 Years | 158 (100.0%) | 0 (0.0%) |
| 75 Years and older | 159 (100.0%) | 0 (0.0%) |
| Total | 2,591 (95.6%) | 120 (4.4%) |
Health Insurance Coverage by Citizenship Status in Casa Conejo

| Citizenship Status | With Coverage | Without Coverage |
| Native Born | 192 (100.0%) | 0 (0.0%) |
| Foreign Born, Citizen | 528 (98.0%) | 11 (2.0%) |
| Foreign Born, not a Citizen | 176 (100.0%) | 0 (0.0%) |
Health Insurance Coverage by Household Income in Casa Conejo
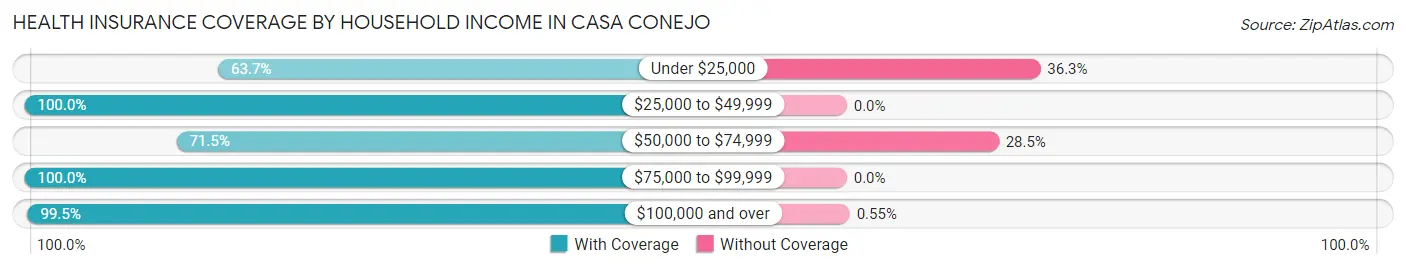
| Household Income | With Coverage | Without Coverage |
| Under $25,000 | 65 (63.7%) | 37 (36.3%) |
| $25,000 to $49,999 | 127 (100.0%) | 0 (0.0%) |
| $50,000 to $74,999 | 181 (71.5%) | 72 (28.5%) |
| $75,000 to $99,999 | 215 (100.0%) | 0 (0.0%) |
| $100,000 and over | 1,989 (99.5%) | 11 (0.5%) |
Public vs Private Health Insurance Coverage by Age in Casa Conejo
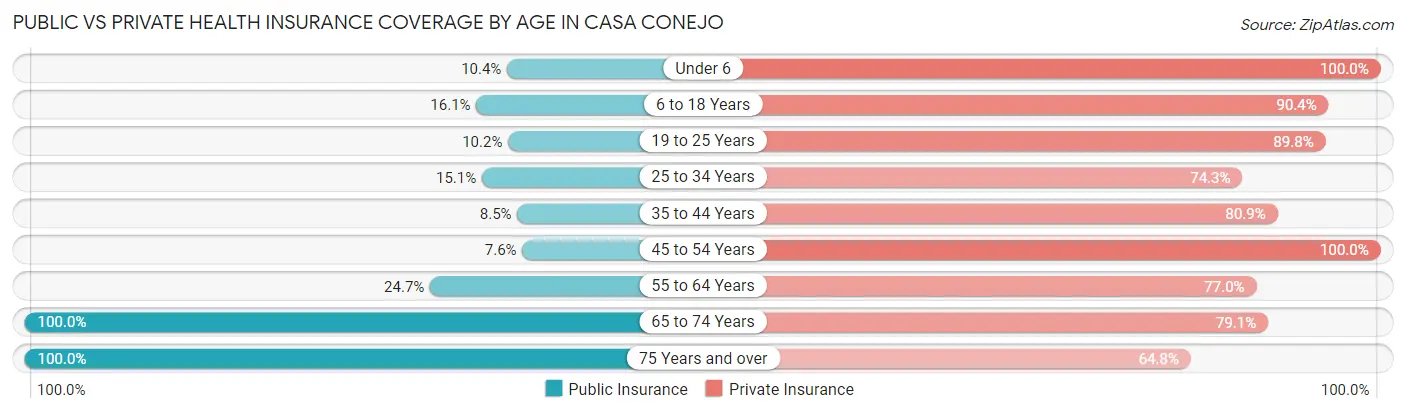
| Age Bracket | Public Insurance | Private Insurance |
| Under 6 | 20 (10.4%) | 192 (100.0%) |
| 6 to 18 Years | 87 (16.1%) | 487 (90.3%) |
| 19 to 25 Years | 18 (10.2%) | 158 (89.8%) |
| 25 to 34 Years | 40 (15.1%) | 197 (74.3%) |
| 35 to 44 Years | 37 (8.5%) | 351 (80.9%) |
| 45 to 54 Years | 19 (7.6%) | 250 (100.0%) |
| 55 to 64 Years | 133 (24.7%) | 414 (76.9%) |
| 65 to 74 Years | 158 (100.0%) | 125 (79.1%) |
| 75 Years and over | 159 (100.0%) | 103 (64.8%) |
| Total | 671 (24.7%) | 2,277 (84.0%) |
Disability Status by Sex by Age in Casa Conejo
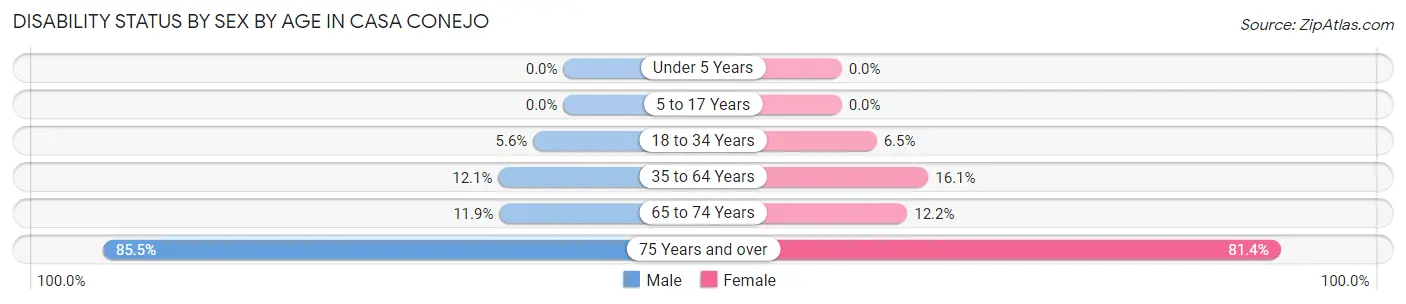
| Age Bracket | Male | Female |
| Under 5 Years | 0 (0.0%) | 0 (0.0%) |
| 5 to 17 Years | 0 (0.0%) | 0 (0.0%) |
| 18 to 34 Years | 14 (5.6%) | 14 (6.5%) |
| 35 to 64 Years | 80 (12.1%) | 90 (16.1%) |
| 65 to 74 Years | 10 (11.9%) | 9 (12.2%) |
| 75 Years and over | 53 (85.5%) | 79 (81.4%) |
Disability Class by Sex by Age in Casa Conejo
Disability Class: Hearing Difficulty

| Age Bracket | Male | Female |
| Under 5 Years | 0 (0.0%) | 0 (0.0%) |
| 5 to 17 Years | 0 (0.0%) | 0 (0.0%) |
| 18 to 34 Years | 0 (0.0%) | 0 (0.0%) |
| 35 to 64 Years | 19 (2.9%) | 50 (8.9%) |
| 65 to 74 Years | 10 (11.9%) | 0 (0.0%) |
| 75 Years and over | 11 (17.7%) | 21 (21.6%) |
Disability Class: Vision Difficulty
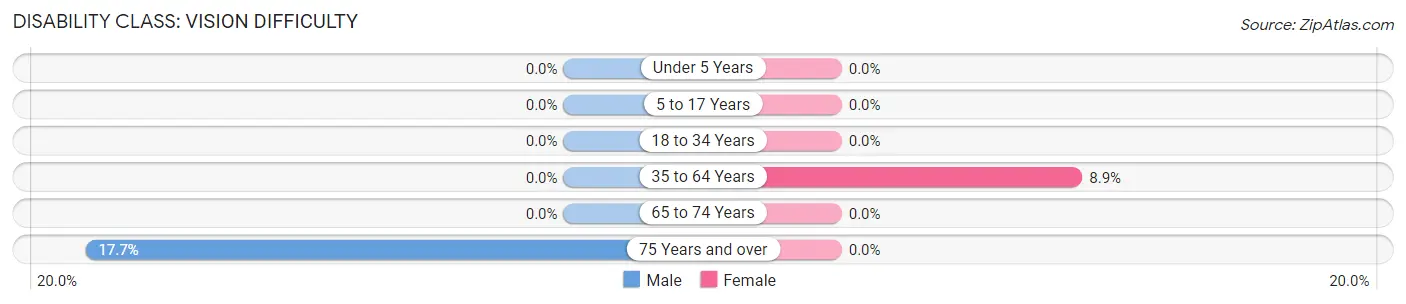
| Age Bracket | Male | Female |
| Under 5 Years | 0 (0.0%) | 0 (0.0%) |
| 5 to 17 Years | 0 (0.0%) | 0 (0.0%) |
| 18 to 34 Years | 0 (0.0%) | 0 (0.0%) |
| 35 to 64 Years | 0 (0.0%) | 50 (8.9%) |
| 65 to 74 Years | 0 (0.0%) | 0 (0.0%) |
| 75 Years and over | 11 (17.7%) | 0 (0.0%) |
Disability Class: Cognitive Difficulty
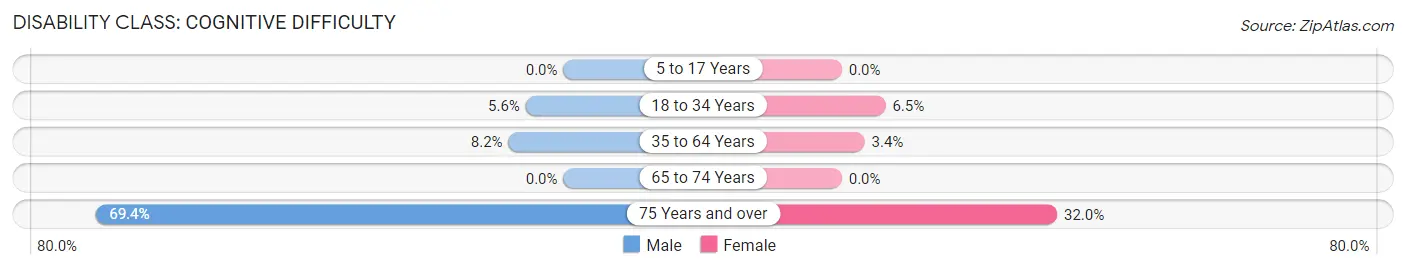
| Age Bracket | Male | Female |
| 5 to 17 Years | 0 (0.0%) | 0 (0.0%) |
| 18 to 34 Years | 14 (5.6%) | 14 (6.5%) |
| 35 to 64 Years | 54 (8.2%) | 19 (3.4%) |
| 65 to 74 Years | 0 (0.0%) | 0 (0.0%) |
| 75 Years and over | 43 (69.4%) | 31 (32.0%) |
Disability Class: Ambulatory Difficulty
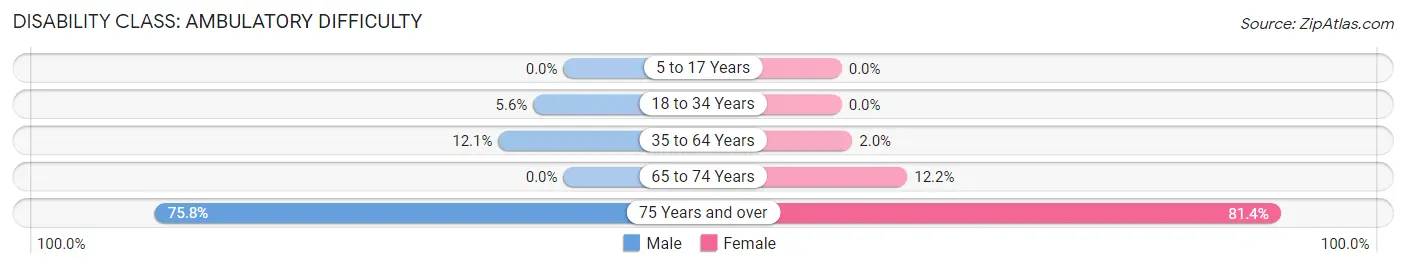
| Age Bracket | Male | Female |
| 5 to 17 Years | 0 (0.0%) | 0 (0.0%) |
| 18 to 34 Years | 14 (5.6%) | 0 (0.0%) |
| 35 to 64 Years | 80 (12.1%) | 11 (2.0%) |
| 65 to 74 Years | 0 (0.0%) | 9 (12.2%) |
| 75 Years and over | 47 (75.8%) | 79 (81.4%) |
Disability Class: Self-Care Difficulty
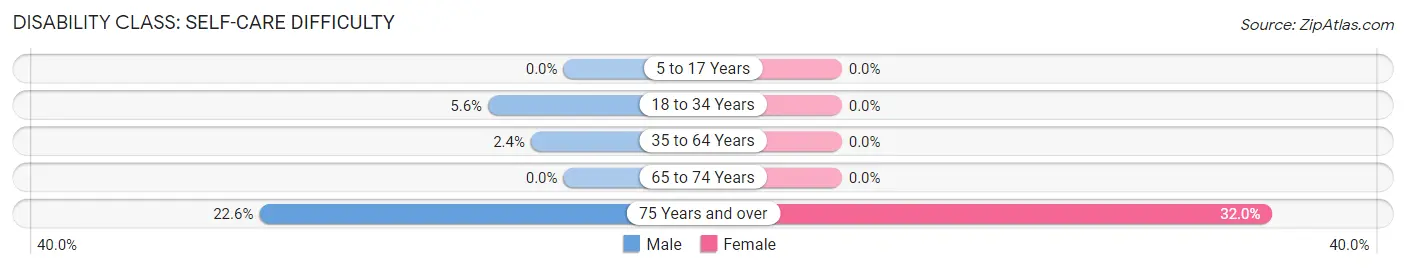
| Age Bracket | Male | Female |
| 5 to 17 Years | 0 (0.0%) | 0 (0.0%) |
| 18 to 34 Years | 14 (5.6%) | 0 (0.0%) |
| 35 to 64 Years | 16 (2.4%) | 0 (0.0%) |
| 65 to 74 Years | 0 (0.0%) | 0 (0.0%) |
| 75 Years and over | 14 (22.6%) | 31 (32.0%) |
Technology Access in Casa Conejo
Computing Device Access in Casa Conejo
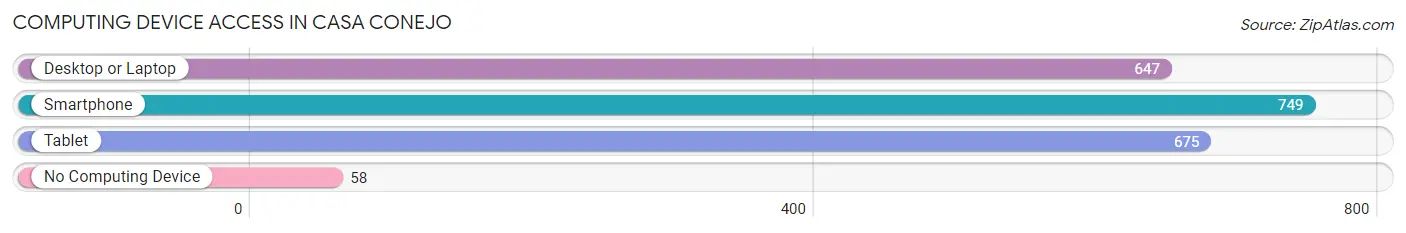
| Device Type | # Households | % Households |
| Desktop or Laptop | 647 | 78.4% |
| Smartphone | 749 | 90.8% |
| Tablet | 675 | 81.8% |
| No Computing Device | 58 | 7.0% |
| Total | 825 | 100.0% |
Internet Access in Casa Conejo
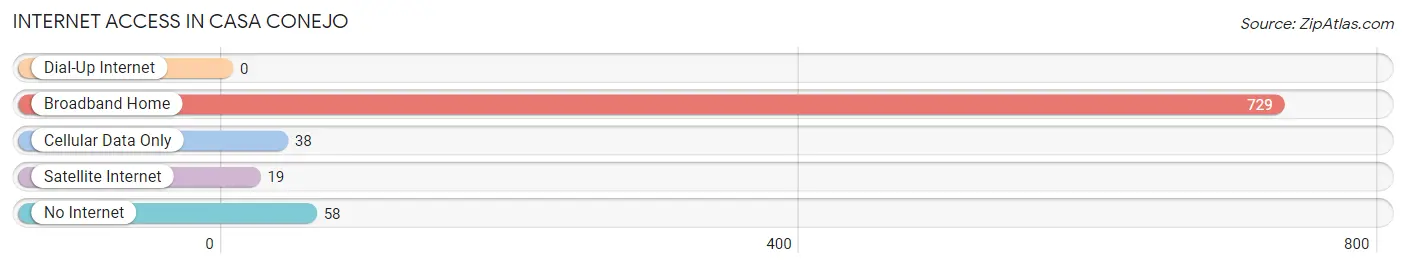
| Internet Type | # Households | % Households |
| Dial-Up Internet | 0 | 0.0% |
| Broadband Home | 729 | 88.4% |
| Cellular Data Only | 38 | 4.6% |
| Satellite Internet | 19 | 2.3% |
| No Internet | 58 | 7.0% |
| Total | 825 | 100.0% |
Casa Conejo Summary
Casa Conejo is a census-designated place located in Ventura County, California. It is located in the Conejo Valley, which is part of the Greater Los Angeles Area. The population of Casa Conejo was estimated to be 8,845 in 2019.
Geography
Casa Conejo is located in the Conejo Valley, which is part of the Greater Los Angeles Area. It is bordered by Thousand Oaks to the east, Newbury Park to the south, and Westlake Village to the west. The Conejo Valley is located in the foothills of the Santa Monica Mountains and is known for its rolling hills and scenic views. The area is also home to numerous parks and trails, including the Conejo Valley Botanic Garden, Wildwood Regional Park, and the Santa Monica Mountains National Recreation Area.
The climate in Casa Conejo is Mediterranean, with hot, dry summers and mild, wet winters. The average high temperature in the summer is around 85°F (29°C), while the average low temperature in the winter is around 45°F (7°C).
History
The area now known as Casa Conejo was originally inhabited by the Chumash people, who lived in the area for thousands of years before the arrival of Europeans. The first Europeans to settle in the area were Spanish missionaries, who established the Mission San Buenaventura in 1782. The mission was later secularized in 1834, and the land was divided into large ranchos.
In the late 19th century, the area began to be developed for agriculture, and the first subdivisions were built in the early 20th century. The area was officially named Casa Conejo in the 1950s, and the population began to grow rapidly in the following decades.
Economy
Casa Conejo is home to a variety of businesses, including retail stores, restaurants, and professional services. The area is also home to several corporate headquarters, including Amgen, Dole Food Company, and Teledyne Technologies.
The median household income in Casa Conejo is $103,845, which is significantly higher than the national median of $61,937. The unemployment rate in the area is 3.2%, which is lower than the national average of 3.7%.
Demographics
As of 2019, the population of Casa Conejo was estimated to be 8,845. The racial makeup of the area is 73.3% White, 11.2% Asian, 8.2% Hispanic or Latino, and 4.3% African American. The median age in the area is 44.7 years, and the median household income is $103,845.
The area is also home to a large number of families, with 44.3% of households having children under the age of 18. The homeownership rate in the area is 73.2%, which is higher than the national average of 63.9%.
Conclusion
Casa Conejo is a census-designated place located in Ventura County, California. It is located in the Conejo Valley, which is part of the Greater Los Angeles Area. The area was originally inhabited by the Chumash people, and was later developed for agriculture in the late 19th century. The population of Casa Conejo was estimated to be 8,845 in 2019, and the median household income is $103,845. The area is home to a variety of businesses, and the homeownership rate is 73.2%.
Common Questions
What is Per Capita Income in Casa Conejo?
Per Capita income in Casa Conejo is $44,635.
What is the Median Family Income in Casa Conejo?
Median Family Income in Casa Conejo is $150,757.
What is the Median Household income in Casa Conejo?
Median Household Income in Casa Conejo is $142,847.
What is Income or Wage Gap in Casa Conejo?
Income or Wage Gap in Casa Conejo is 40.7%.
Women in Casa Conejo earn 59.3 cents for every dollar earned by a man.
What is Inequality or Gini Index in Casa Conejo?
Inequality or Gini Index in Casa Conejo is 0.31.
What is the Total Population of Casa Conejo?
Total Population of Casa Conejo is 2,711.
What is the Total Male Population of Casa Conejo?
Total Male Population of Casa Conejo is 1,304.
What is the Total Female Population of Casa Conejo?
Total Female Population of Casa Conejo is 1,407.
What is the Ratio of Males per 100 Females in Casa Conejo?
There are 92.68 Males per 100 Females in Casa Conejo.
What is the Ratio of Females per 100 Males in Casa Conejo?
There are 107.90 Females per 100 Males in Casa Conejo.
What is the Median Population Age in Casa Conejo?
Median Population Age in Casa Conejo is 39.3 Years.
What is the Average Family Size in Casa Conejo
Average Family Size in Casa Conejo is 3.4 People.
What is the Average Household Size in Casa Conejo
Average Household Size in Casa Conejo is 3.3 People.
How Large is the Labor Force in Casa Conejo?
There are 1,497 People in the Labor Forcein in Casa Conejo.
What is the Percentage of People in the Labor Force in Casa Conejo?
73.4% of People are in the Labor Force in Casa Conejo.
What is the Unemployment Rate in Casa Conejo?
Unemployment Rate in Casa Conejo is 4.4%.