Cities with the Highest Percentage of Central American Population in Massachusetts
RELATED REPORTS & OPTIONS
Central American
Massachusetts
Compare Cities
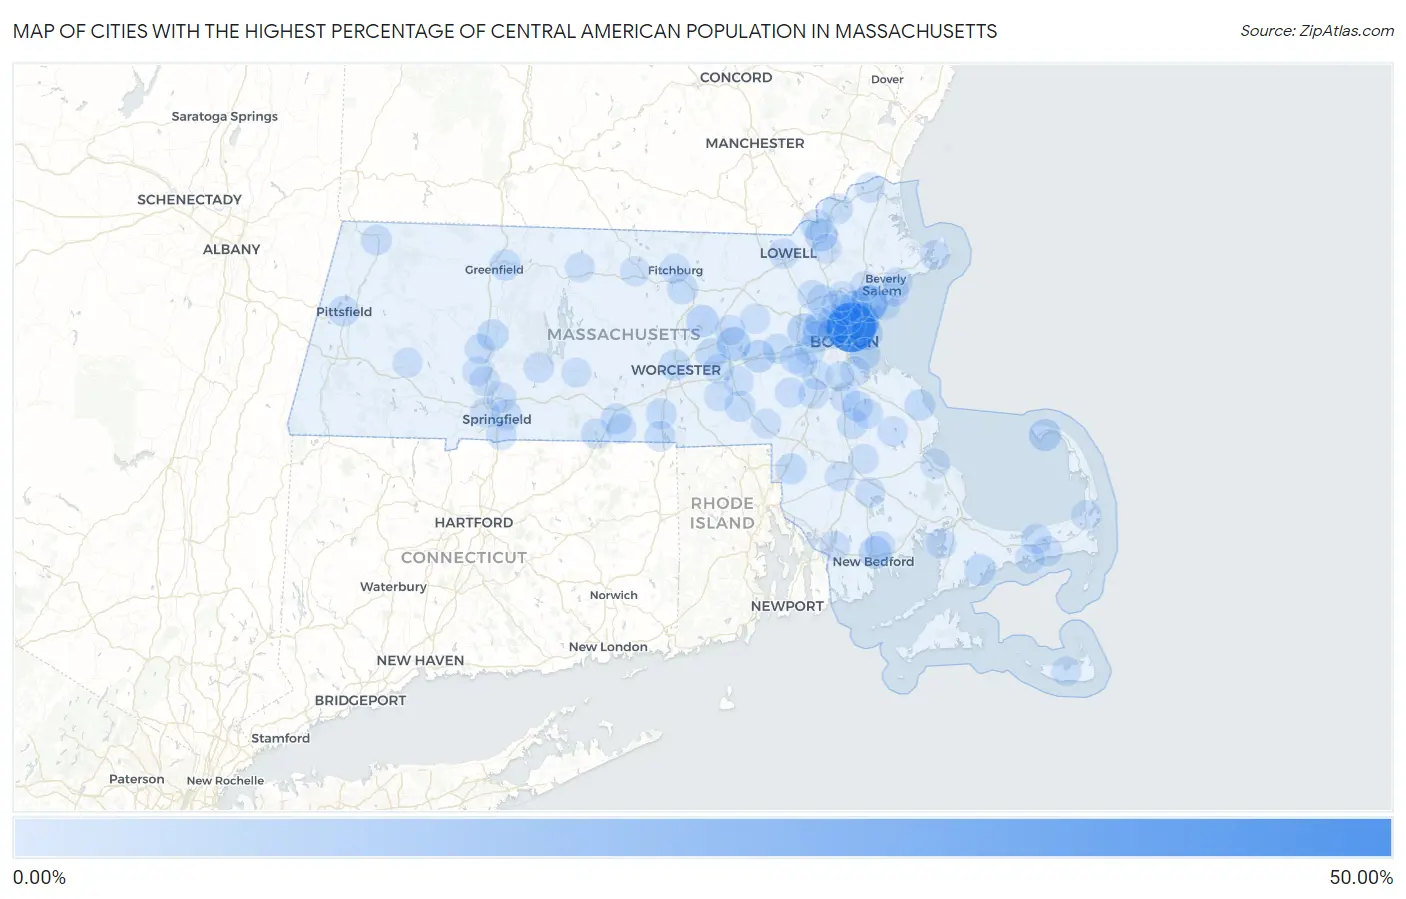
Map of Cities with the Highest Percentage of Central American Population in Massachusetts
0.00%
50.00%
Cities with the Highest Percentage of Central American Population in Massachusetts
| City | Central American | vs State | vs National | |
| 1. | Chelsea | 45.11% | 2.26%(+42.9)#1 | 1.81%(+43.3)#13 |
| 2. | Revere | 18.98% | 2.26%(+16.7)#2 | 1.81%(+17.2)#164 |
| 3. | Everett | 18.91% | 2.26%(+16.6)#3 | 1.81%(+17.1)#167 |
| 4. | Lynn | 16.04% | 2.26%(+13.8)#4 | 1.81%(+14.2)#212 |
| 5. | Marlborough | 8.12% | 2.26%(+5.87)#5 | 1.81%(+6.31)#575 |
| 6. | Winthrop Town | 7.12% | 2.26%(+4.86)#6 | 1.81%(+5.31)#704 |
| 7. | Waltham | 6.90% | 2.26%(+4.64)#7 | 1.81%(+5.09)#734 |
| 8. | Lawrence | 6.45% | 2.26%(+4.19)#8 | 1.81%(+4.63)#813 |
| 9. | Clinton | 5.76% | 2.26%(+3.50)#9 | 1.81%(+3.95)#940 |
| 10. | New Bedford | 5.73% | 2.26%(+3.47)#10 | 1.81%(+3.91)#952 |
| 11. | Framingham | 5.47% | 2.26%(+3.21)#11 | 1.81%(+3.65)#1,011 |
| 12. | Provincetown | 5.27% | 2.26%(+3.01)#12 | 1.81%(+3.46)#1,061 |
| 13. | Somerville | 4.91% | 2.26%(+2.65)#13 | 1.81%(+3.09)#1,140 |
| 14. | Malden | 3.95% | 2.26%(+1.69)#14 | 1.81%(+2.13)#1,447 |
| 15. | Saugus | 3.91% | 2.26%(+1.65)#15 | 1.81%(+2.10)#1,460 |
| 16. | Hatfield | 3.68% | 2.26%(+1.42)#16 | 1.81%(+1.87)#1,538 |
| 17. | Boston | 3.65% | 2.26%(+1.39)#17 | 1.81%(+1.84)#1,550 |
| 18. | Methuen Town | 3.33% | 2.26%(+1.07)#18 | 1.81%(+1.52)#1,711 |
| 19. | Mashpee Neck | 3.31% | 2.26%(+1.05)#19 | 1.81%(+1.49)#1,728 |
| 20. | Northborough | 3.10% | 2.26%(+0.840)#20 | 1.81%(+1.29)#1,826 |
| 21. | Turners Falls | 2.94% | 2.26%(+0.684)#21 | 1.81%(+1.13)#1,915 |
| 22. | Worcester | 2.91% | 2.26%(+0.645)#22 | 1.81%(+1.09)#1,939 |
| 23. | Attleboro | 2.81% | 2.26%(+0.551)#23 | 1.81%(+0.998)#2,000 |
| 24. | Marshfield Hills | 2.69% | 2.26%(+0.425)#24 | 1.81%(+0.872)#2,081 |
| 25. | Sturbridge | 2.52% | 2.26%(+0.260)#25 | 1.81%(+0.707)#2,209 |
| 26. | Leominster | 2.48% | 2.26%(+0.221)#26 | 1.81%(+0.668)#2,243 |
| 27. | Milford | 2.40% | 2.26%(+0.138)#27 | 1.81%(+0.585)#2,305 |
| 28. | Oxford | 2.27% | 2.26%(+0.014)#28 | 1.81%(+0.461)#2,393 |
| 29. | Medford | 2.25% | 2.26%(-0.006)#29 | 1.81%(+0.441)#2,416 |
| 30. | Woburn | 2.13% | 2.26%(-0.125)#30 | 1.81%(+0.322)#2,517 |
| 31. | Brockton | 2.01% | 2.26%(-0.248)#31 | 1.81%(+0.199)#2,646 |
| 32. | Springfield | 1.95% | 2.26%(-0.306)#32 | 1.81%(+0.141)#2,706 |
| 33. | Pittsfield | 1.93% | 2.26%(-0.332)#33 | 1.81%(+0.115)#2,739 |
| 34. | North Adams | 1.92% | 2.26%(-0.335)#34 | 1.81%(+0.112)#2,744 |
| 35. | Watertown Town | 1.82% | 2.26%(-0.441)#35 | 1.81%(+0.006)#2,870 |
| 36. | Haverhill | 1.81% | 2.26%(-0.446)#36 | 1.81%(+0.001)#2,880 |
| 37. | Holbrook | 1.81% | 2.26%(-0.452)#37 | 1.81%(-0.005)#2,891 |
| 38. | Norwood | 1.80% | 2.26%(-0.457)#38 | 1.81%(-0.010)#2,902 |
| 39. | Acushnet Center | 1.77% | 2.26%(-0.490)#39 | 1.81%(-0.043)#2,935 |
| 40. | Salem | 1.68% | 2.26%(-0.578)#40 | 1.81%(-0.131)#3,045 |
| 41. | Webster | 1.65% | 2.26%(-0.613)#41 | 1.81%(-0.166)#3,098 |
| 42. | Melrose | 1.41% | 2.26%(-0.845)#42 | 1.81%(-0.398)#3,474 |
| 43. | Hanson | 1.34% | 2.26%(-0.918)#43 | 1.81%(-0.471)#3,610 |
| 44. | Peabody | 1.28% | 2.26%(-0.981)#44 | 1.81%(-0.534)#3,742 |
| 45. | Cambridge | 1.27% | 2.26%(-0.993)#45 | 1.81%(-0.546)#3,767 |
| 46. | Swampscott | 1.24% | 2.26%(-1.02)#46 | 1.81%(-0.570)#3,808 |
| 47. | Longmeadow | 1.24% | 2.26%(-1.02)#47 | 1.81%(-0.572)#3,813 |
| 48. | Hudson | 1.22% | 2.26%(-1.04)#48 | 1.81%(-0.593)#3,844 |
| 49. | Gloucester | 1.21% | 2.26%(-1.05)#49 | 1.81%(-0.606)#3,863 |
| 50. | Lowell | 1.19% | 2.26%(-1.07)#50 | 1.81%(-0.622)#3,885 |
| 51. | Holland | 1.17% | 2.26%(-1.09)#51 | 1.81%(-0.642)#3,937 |
| 52. | Pocasset | 1.14% | 2.26%(-1.12)#52 | 1.81%(-0.671)#4,014 |
| 53. | Fall River | 1.13% | 2.26%(-1.13)#53 | 1.81%(-0.681)#4,031 |
| 54. | West Dennis | 1.10% | 2.26%(-1.16)#54 | 1.81%(-0.715)#4,104 |
| 55. | Southbridge Town | 1.08% | 2.26%(-1.18)#55 | 1.81%(-0.732)#4,154 |
| 56. | Belchertown | 1.06% | 2.26%(-1.20)#56 | 1.81%(-0.756)#4,207 |
| 57. | Yarmouth Port | 0.94% | 2.26%(-1.32)#57 | 1.81%(-0.875)#4,520 |
| 58. | Westborough | 0.94% | 2.26%(-1.32)#58 | 1.81%(-0.877)#4,528 |
| 59. | Burlington | 0.93% | 2.26%(-1.33)#59 | 1.81%(-0.884)#4,547 |
| 60. | Northampton | 0.89% | 2.26%(-1.37)#60 | 1.81%(-0.921)#4,649 |
| 61. | Amherst | 0.87% | 2.26%(-1.39)#61 | 1.81%(-0.938)#4,709 |
| 62. | Belmont | 0.84% | 2.26%(-1.42)#62 | 1.81%(-0.972)#4,811 |
| 63. | Randolph Town | 0.84% | 2.26%(-1.42)#63 | 1.81%(-0.974)#4,822 |
| 64. | Greenfield | 0.80% | 2.26%(-1.46)#64 | 1.81%(-1.01)#4,973 |
| 65. | Abington | 0.79% | 2.26%(-1.47)#65 | 1.81%(-1.02)#5,025 |
| 66. | North Lakeville | 0.77% | 2.26%(-1.49)#66 | 1.81%(-1.04)#5,088 |
| 67. | Cochituate | 0.76% | 2.26%(-1.50)#67 | 1.81%(-1.05)#5,110 |
| 68. | Chicopee | 0.76% | 2.26%(-1.50)#68 | 1.81%(-1.05)#5,115 |
| 69. | Medfield | 0.76% | 2.26%(-1.50)#69 | 1.81%(-1.05)#5,130 |
| 70. | Holyoke | 0.75% | 2.26%(-1.51)#70 | 1.81%(-1.06)#5,148 |
| 71. | Quincy | 0.73% | 2.26%(-1.53)#71 | 1.81%(-1.08)#5,213 |
| 72. | Plymouth | 0.73% | 2.26%(-1.53)#72 | 1.81%(-1.08)#5,216 |
| 73. | Dedham | 0.69% | 2.26%(-1.57)#73 | 1.81%(-1.13)#5,388 |
| 74. | Amesbury Town | 0.68% | 2.26%(-1.58)#74 | 1.81%(-1.13)#5,408 |
| 75. | Fitchburg | 0.64% | 2.26%(-1.62)#75 | 1.81%(-1.18)#5,572 |
| 76. | Nantucket | 0.63% | 2.26%(-1.63)#76 | 1.81%(-1.18)#5,611 |
| 77. | Chester | 0.63% | 2.26%(-1.63)#77 | 1.81%(-1.18)#5,616 |
| 78. | Bridgewater Town | 0.62% | 2.26%(-1.64)#78 | 1.81%(-1.19)#5,635 |
| 79. | West Springfield Town | 0.61% | 2.26%(-1.65)#79 | 1.81%(-1.21)#5,712 |
| 80. | Franklin Town | 0.60% | 2.26%(-1.66)#80 | 1.81%(-1.21)#5,728 |
| 81. | Stoneham | 0.56% | 2.26%(-1.70)#81 | 1.81%(-1.25)#5,920 |
| 82. | Beverly | 0.55% | 2.26%(-1.71)#82 | 1.81%(-1.26)#5,971 |
| 83. | Andover | 0.54% | 2.26%(-1.72)#83 | 1.81%(-1.27)#6,015 |
| 84. | Orleans | 0.54% | 2.26%(-1.72)#84 | 1.81%(-1.27)#6,017 |
| 85. | Taunton | 0.48% | 2.26%(-1.78)#85 | 1.81%(-1.33)#6,291 |
| 86. | Gardner | 0.48% | 2.26%(-1.78)#86 | 1.81%(-1.33)#6,294 |
| 87. | Easthampton Town | 0.47% | 2.26%(-1.79)#87 | 1.81%(-1.34)#6,348 |
| 88. | Upton | 0.46% | 2.26%(-1.80)#88 | 1.81%(-1.35)#6,382 |
| 89. | Maynard | 0.46% | 2.26%(-1.80)#89 | 1.81%(-1.35)#6,399 |
| 90. | Newton | 0.46% | 2.26%(-1.80)#90 | 1.81%(-1.36)#6,423 |
| 91. | Hopkinton | 0.45% | 2.26%(-1.81)#91 | 1.81%(-1.36)#6,429 |
| 92. | Arlington | 0.45% | 2.26%(-1.81)#92 | 1.81%(-1.36)#6,446 |
| 93. | Wakefield | 0.44% | 2.26%(-1.82)#93 | 1.81%(-1.37)#6,511 |
| 94. | Athol | 0.44% | 2.26%(-1.82)#94 | 1.81%(-1.38)#6,546 |
| 95. | Ware | 0.43% | 2.26%(-1.83)#95 | 1.81%(-1.38)#6,574 |
| 96. | North Attleborough | 0.40% | 2.26%(-1.86)#96 | 1.81%(-1.42)#6,759 |
| 97. | Milton | 0.38% | 2.26%(-1.88)#97 | 1.81%(-1.43)#6,829 |
| 98. | West Yarmouth | 0.38% | 2.26%(-1.88)#98 | 1.81%(-1.44)#6,862 |
| 99. | Wellesley | 0.38% | 2.26%(-1.88)#99 | 1.81%(-1.44)#6,871 |
| 100. | Needham | 0.37% | 2.26%(-1.89)#100 | 1.81%(-1.44)#6,890 |
Common Questions
What are the Top 10 Cities with the Highest Percentage of Central American Population in Massachusetts?
Top 10 Cities with the Highest Percentage of Central American Population in Massachusetts are:
#1
45.11%
#2
18.98%
#3
18.91%
#4
16.04%
#5
8.12%
#6
7.12%
#7
6.90%
#8
6.45%
#9
5.76%
#10
5.73%
What city has the Highest Percentage of Central American Population in Massachusetts?
Chelsea has the Highest Percentage of Central American Population in Massachusetts with 45.11%.
What is the Percentage of Central American Population in the State of Massachusetts?
Percentage of Central American Population in Massachusetts is 2.26%.
What is the Percentage of Central American Population in the United States?
Percentage of Central American Population in the United States is 1.81%.