Pomona, CA Map & Demographics
Pomona Map
Pomona Overview
$26,064
PER CAPITA INCOME
$75,922
AVG FAMILY INCOME
$73,515
AVG HOUSEHOLD INCOME
23.9%
WAGE / INCOME GAP [ % ]
76.1¢/ $1
WAGE / INCOME GAP [ $ ]
$12,674
FAMILY INCOME DEFICIT
0.41
INEQUALITY / GINI INDEX
149,831
TOTAL POPULATION
73,857
MALE POPULATION
75,974
FEMALE POPULATION
97.21
MALES / 100 FEMALES
102.87
FEMALES / 100 MALES
34.4
MEDIAN AGE
3.9
AVG FAMILY SIZE
3.5
AVG HOUSEHOLD SIZE
74,087
LABOR FORCE [ PEOPLE ]
62.8%
PERCENT IN LABOR FORCE
6.5%
UNEMPLOYMENT RATE
Income in Pomona
Income Overview in Pomona
Per Capita Income in Pomona is $26,064, while median incomes of families and households are $75,922 and $73,515 respectively.
| Characteristic | Number | Measure |
| Per Capita Income | 149,831 | $26,064 |
| Median Family Income | 31,882 | $75,922 |
| Mean Family Income | 31,882 | $93,269 |
| Median Household Income | 41,438 | $73,515 |
| Mean Household Income | 41,438 | $89,609 |
| Income Deficit | 31,882 | $12,674 |
| Wage / Income Gap (%) | 149,831 | 23.90% |
| Wage / Income Gap ($) | 149,831 | 76.10¢ per $1 |
| Gini / Inequality Index | 149,831 | 0.41 |
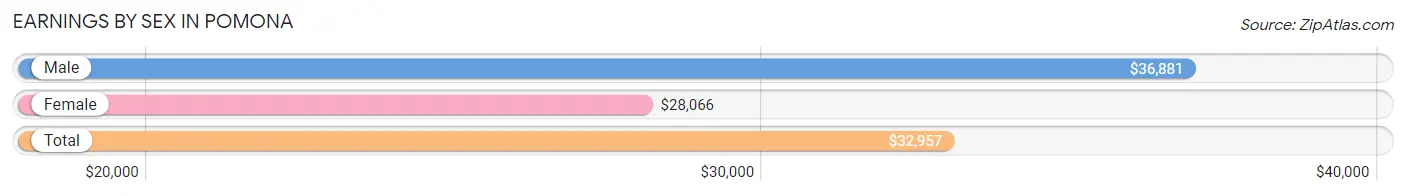
Earnings by Sex in Pomona
Average Earnings in Pomona are $32,957, $36,881 for men and $28,066 for women, a difference of 23.9%.
| Sex | Number | Average Earnings |
| Male | 41,289 (54.6%) | $36,881 |
| Female | 34,320 (45.4%) | $28,066 |
| Total | 75,609 (100.0%) | $32,957 |
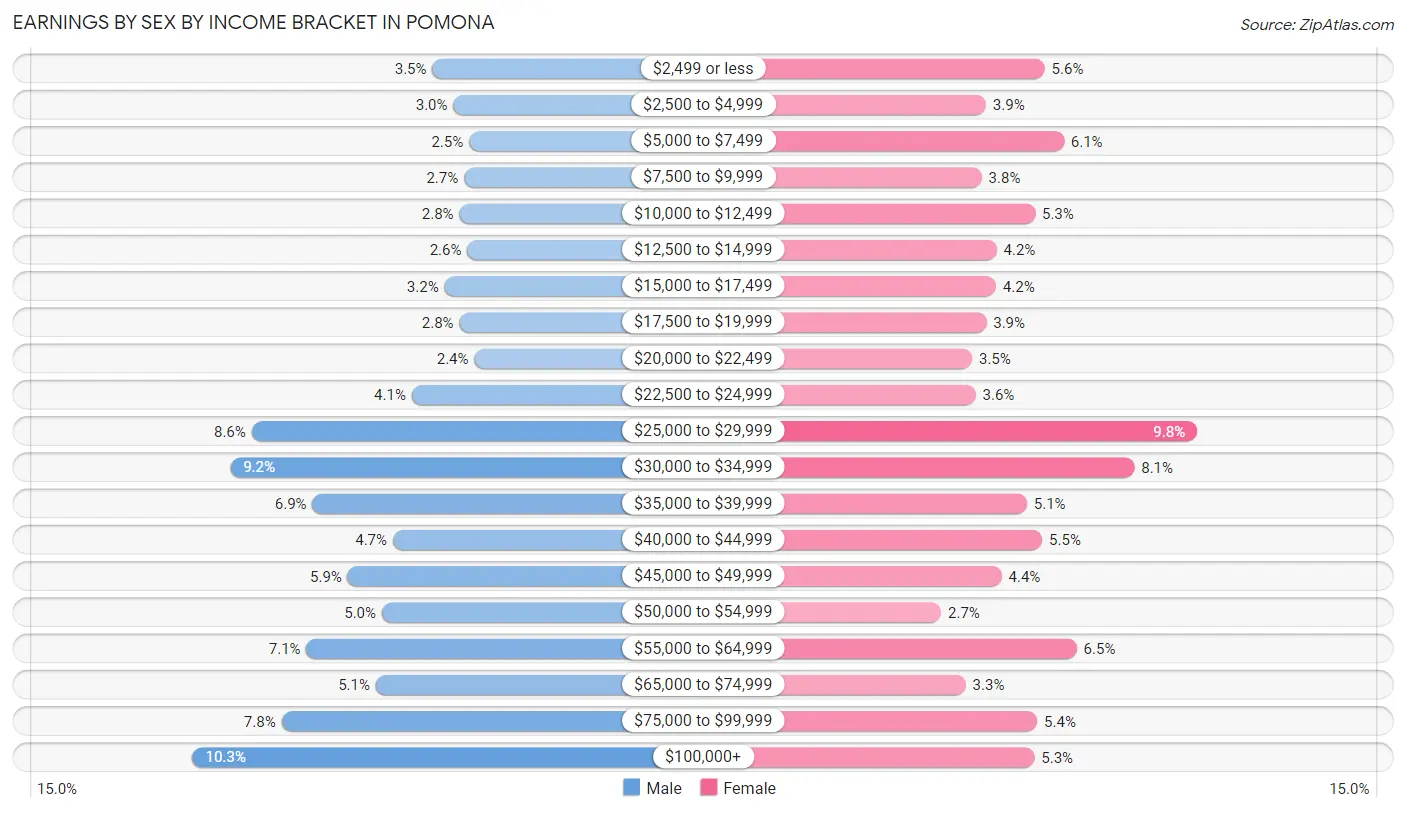
Earnings by Sex by Income Bracket in Pomona
The most common earnings brackets in Pomona are $100,000+ for men (4,245 | 10.3%) and $25,000 to $29,999 for women (3,377 | 9.8%).
| Income | Male | Female |
| $2,499 or less | 1,461 (3.5%) | 1,909 (5.6%) |
| $2,500 to $4,999 | 1,220 (2.9%) | 1,343 (3.9%) |
| $5,000 to $7,499 | 1,037 (2.5%) | 2,092 (6.1%) |
| $7,500 to $9,999 | 1,096 (2.6%) | 1,301 (3.8%) |
| $10,000 to $12,499 | 1,146 (2.8%) | 1,815 (5.3%) |
| $12,500 to $14,999 | 1,055 (2.6%) | 1,446 (4.2%) |
| $15,000 to $17,499 | 1,323 (3.2%) | 1,438 (4.2%) |
| $17,500 to $19,999 | 1,147 (2.8%) | 1,345 (3.9%) |
| $20,000 to $22,499 | 973 (2.4%) | 1,209 (3.5%) |
| $22,500 to $24,999 | 1,702 (4.1%) | 1,244 (3.6%) |
| $25,000 to $29,999 | 3,558 (8.6%) | 3,377 (9.8%) |
| $30,000 to $34,999 | 3,807 (9.2%) | 2,772 (8.1%) |
| $35,000 to $39,999 | 2,852 (6.9%) | 1,735 (5.1%) |
| $40,000 to $44,999 | 1,920 (4.6%) | 1,883 (5.5%) |
| $45,000 to $49,999 | 2,444 (5.9%) | 1,494 (4.3%) |
| $50,000 to $54,999 | 2,048 (5.0%) | 909 (2.6%) |
| $55,000 to $64,999 | 2,924 (7.1%) | 2,216 (6.5%) |
| $65,000 to $74,999 | 2,117 (5.1%) | 1,147 (3.3%) |
| $75,000 to $99,999 | 3,214 (7.8%) | 1,836 (5.3%) |
| $100,000+ | 4,245 (10.3%) | 1,809 (5.3%) |
| Total | 41,289 (100.0%) | 34,320 (100.0%) |
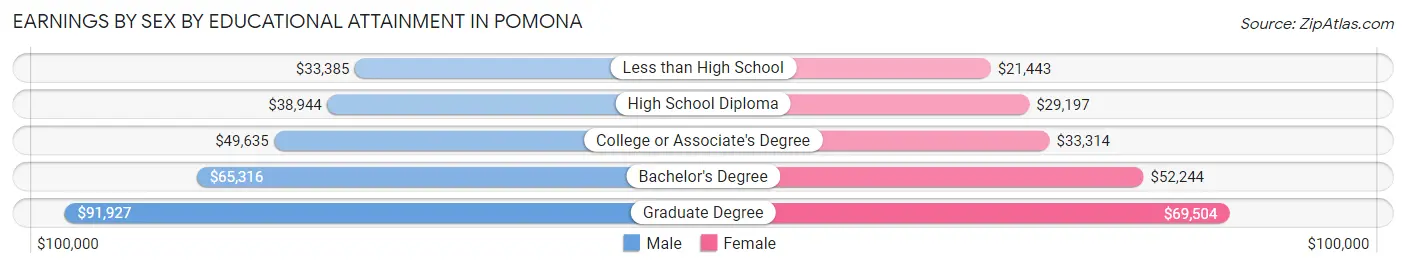
Earnings by Sex by Educational Attainment in Pomona
Average earnings in Pomona are $42,257 for men and $31,592 for women, a difference of 25.2%. Men with an educational attainment of graduate degree enjoy the highest average annual earnings of $91,927, while those with less than high school education earn the least with $33,385. Women with an educational attainment of graduate degree earn the most with the average annual earnings of $69,504, while those with less than high school education have the smallest earnings of $21,443.
| Educational Attainment | Male Income | Female Income |
| Less than High School | $33,385 | $21,443 |
| High School Diploma | $38,944 | $29,197 |
| College or Associate's Degree | $49,635 | $33,314 |
| Bachelor's Degree | $65,316 | $52,244 |
| Graduate Degree | $91,927 | $69,504 |
| Total | $42,257 | $31,592 |
Family Income in Pomona
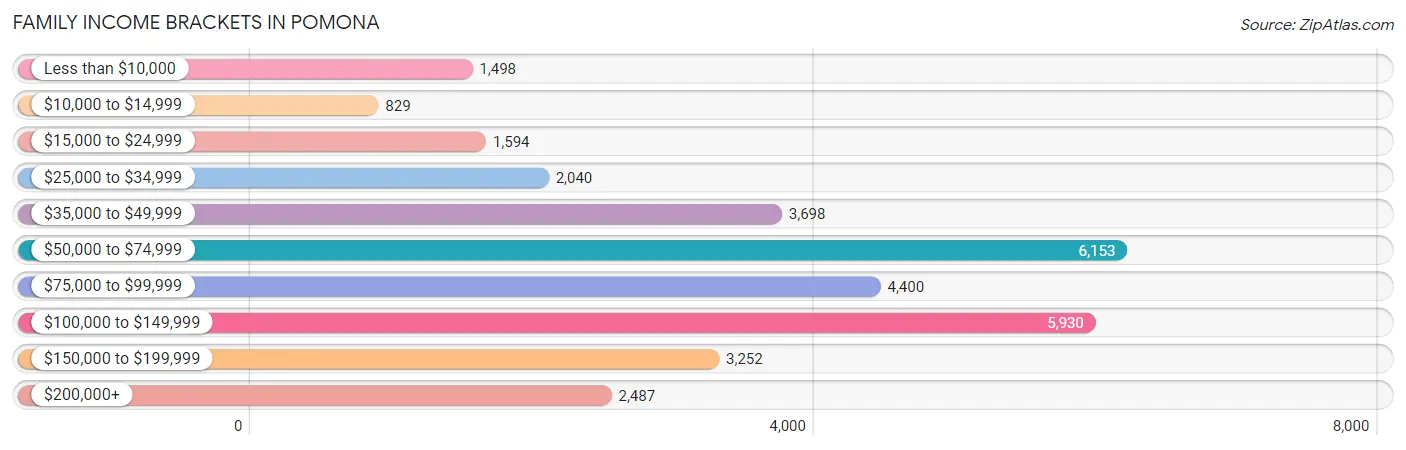
Family Income Brackets in Pomona
According to the Pomona family income data, there are 6,153 families falling into the $50,000 to $74,999 income range, which is the most common income bracket and makes up 19.3% of all families. Conversely, the $10,000 to $14,999 income bracket is the least frequent group with only 829 families (2.6%) belonging to this category.
| Income Bracket | # Families | % Families |
| Less than $10,000 | 1,498 | 4.7% |
| $10,000 to $14,999 | 829 | 2.6% |
| $15,000 to $24,999 | 1,594 | 5.0% |
| $25,000 to $34,999 | 2,040 | 6.4% |
| $35,000 to $49,999 | 3,698 | 11.6% |
| $50,000 to $74,999 | 6,153 | 19.3% |
| $75,000 to $99,999 | 4,400 | 13.8% |
| $100,000 to $149,999 | 5,930 | 18.6% |
| $150,000 to $199,999 | 3,252 | 10.2% |
| $200,000+ | 2,487 | 7.8% |
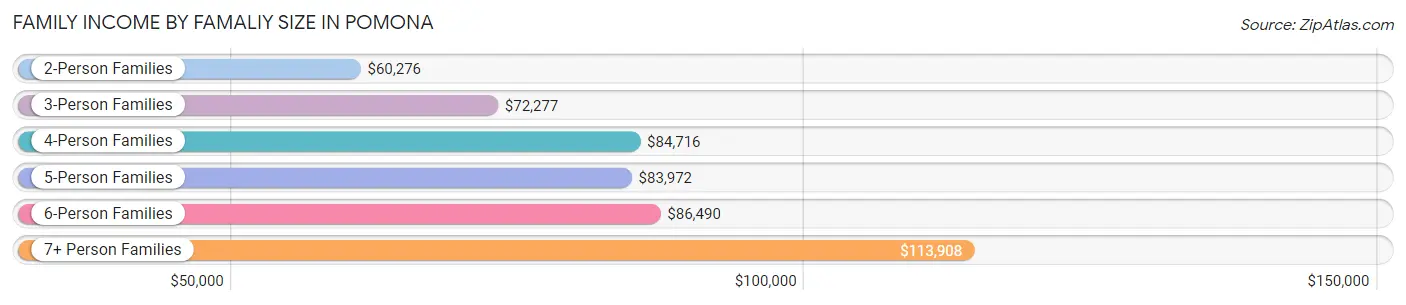
Family Income by Famaliy Size in Pomona
7+ person families (2,140 | 6.7%) account for the highest median family income in Pomona with $113,908 per family, while 2-person families (9,698 | 30.4%) have the highest median income of $30,138 per family member.
| Income Bracket | # Families | Median Income |
| 2-Person Families | 9,698 (30.4%) | $60,276 |
| 3-Person Families | 6,945 (21.8%) | $72,277 |
| 4-Person Families | 6,056 (19.0%) | $84,716 |
| 5-Person Families | 5,056 (15.9%) | $83,972 |
| 6-Person Families | 1,987 (6.2%) | $86,490 |
| 7+ Person Families | 2,140 (6.7%) | $113,908 |
| Total | 31,882 (100.0%) | $75,922 |
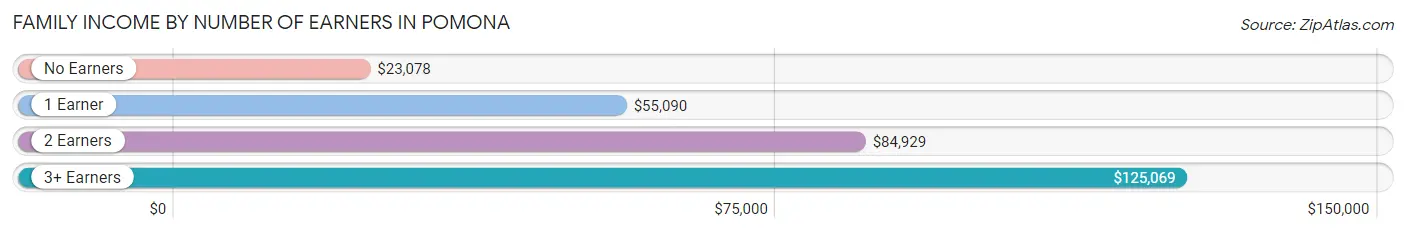
Family Income by Number of Earners in Pomona
The median family income in Pomona is $75,922, with families comprising 3+ earners (7,354) having the highest median family income of $125,069, while families with no earners (3,309) have the lowest median family income of $23,078, accounting for 23.1% and 10.4% of families, respectively.
| Number of Earners | # Families | Median Income |
| No Earners | 3,309 (10.4%) | $23,078 |
| 1 Earner | 10,081 (31.6%) | $55,090 |
| 2 Earners | 11,138 (34.9%) | $84,929 |
| 3+ Earners | 7,354 (23.1%) | $125,069 |
| Total | 31,882 (100.0%) | $75,922 |
Household Income in Pomona
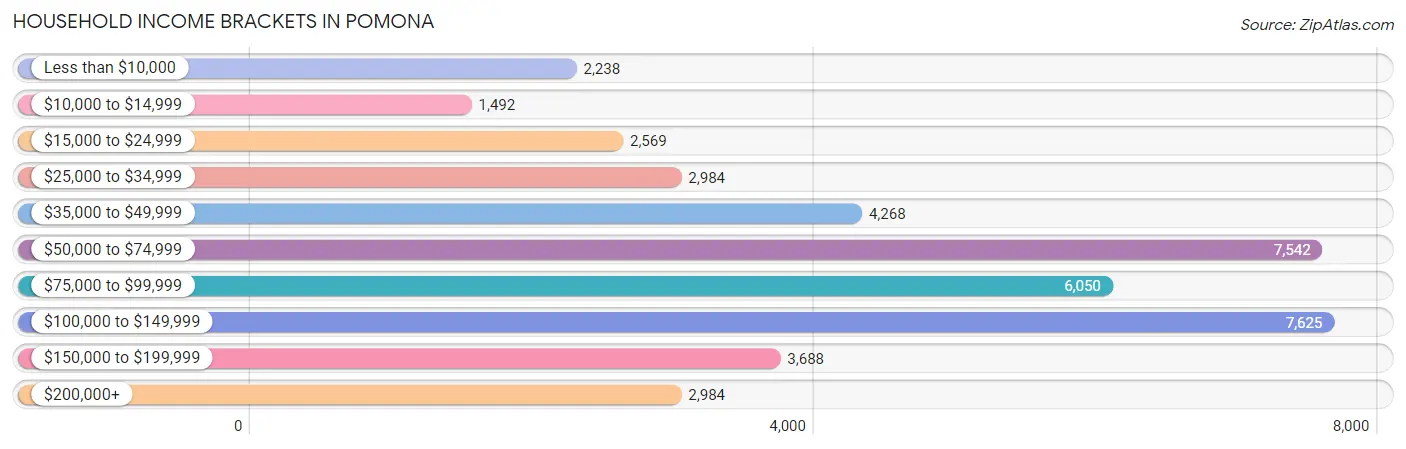
Household Income Brackets in Pomona
With 7,625 households falling in the category, the $100,000 to $149,999 income range is the most frequent in Pomona, accounting for 18.4% of all households. In contrast, only 1,492 households (3.6%) fall into the $10,000 to $14,999 income bracket, making it the least populous group.
| Income Bracket | # Households | % Households |
| Less than $10,000 | 2,238 | 5.4% |
| $10,000 to $14,999 | 1,492 | 3.6% |
| $15,000 to $24,999 | 2,569 | 6.2% |
| $25,000 to $34,999 | 2,984 | 7.2% |
| $35,000 to $49,999 | 4,268 | 10.3% |
| $50,000 to $74,999 | 7,542 | 18.2% |
| $75,000 to $99,999 | 6,050 | 14.6% |
| $100,000 to $149,999 | 7,625 | 18.4% |
| $150,000 to $199,999 | 3,688 | 8.9% |
| $200,000+ | 2,984 | 7.2% |
Household Income by Householder Age in Pomona
The median household income in Pomona is $73,515, with the highest median household income of $88,230 found in the 45 to 64 years age bracket for the primary householder. A total of 17,025 households (41.1%) fall into this category. Meanwhile, the 15 to 24 years age bracket for the primary householder has the lowest median household income of $42,823, with 1,528 households (3.7%) in this group.
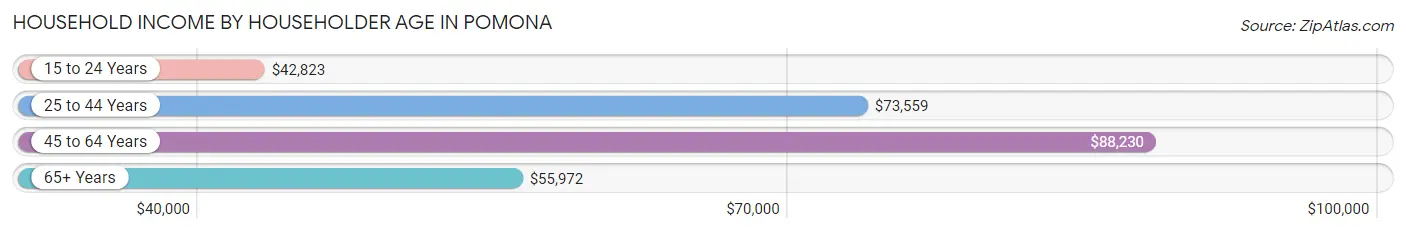
| Income Bracket | # Households | Median Income |
| 15 to 24 Years | 1,528 (3.7%) | $42,823 |
| 25 to 44 Years | 13,782 (33.3%) | $73,559 |
| 45 to 64 Years | 17,025 (41.1%) | $88,230 |
| 65+ Years | 9,103 (22.0%) | $55,972 |
| Total | 41,438 (100.0%) | $73,515 |
Poverty in Pomona
Income Below Poverty by Sex and Age in Pomona
With 13.1% poverty level for males and 16.6% for females among the residents of Pomona, 15 year old males and 18 to 24 year old females are the most vulnerable to poverty, with 287 males (28.4%) and 1,665 females (20.8%) in their respective age groups living below the poverty level.
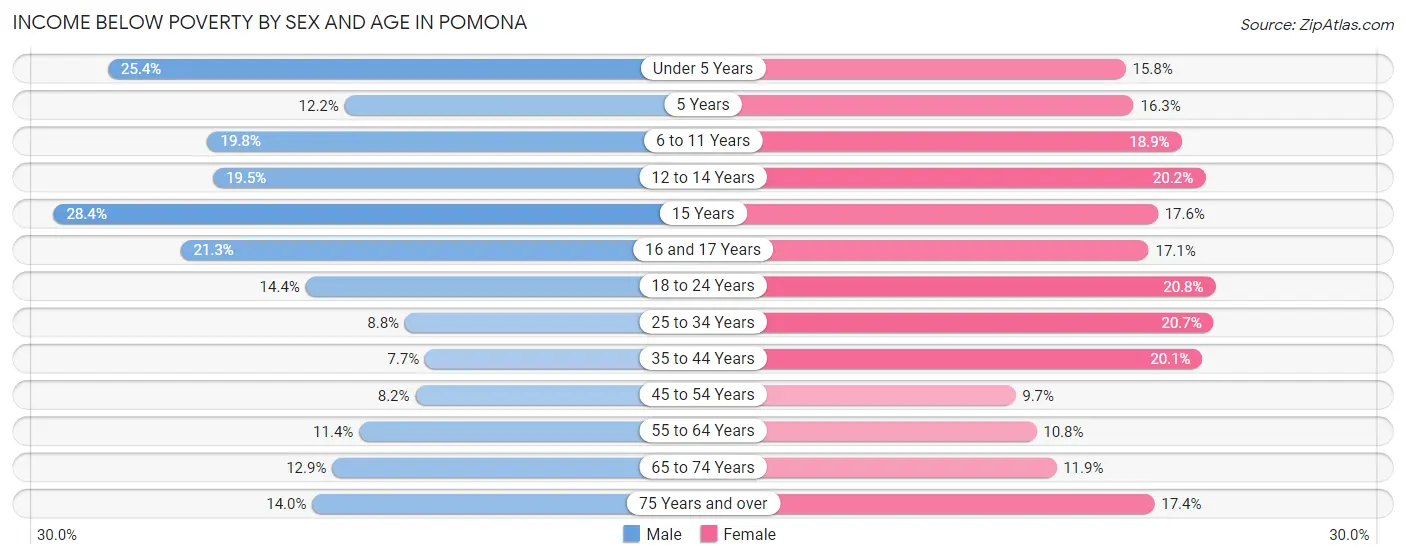
| Age Bracket | Male | Female |
| Under 5 Years | 1,203 (25.4%) | 715 (15.8%) |
| 5 Years | 77 (12.2%) | 171 (16.3%) |
| 6 to 11 Years | 1,240 (19.8%) | 1,065 (18.9%) |
| 12 to 14 Years | 555 (19.5%) | 659 (20.2%) |
| 15 Years | 287 (28.4%) | 216 (17.6%) |
| 16 and 17 Years | 410 (21.3%) | 439 (17.1%) |
| 18 to 24 Years | 1,292 (14.3%) | 1,665 (20.8%) |
| 25 to 34 Years | 977 (8.8%) | 2,151 (20.7%) |
| 35 to 44 Years | 774 (7.7%) | 1,966 (20.1%) |
| 45 to 54 Years | 799 (8.2%) | 946 (9.7%) |
| 55 to 64 Years | 856 (11.4%) | 893 (10.8%) |
| 65 to 74 Years | 640 (12.9%) | 650 (11.9%) |
| 75 Years and over | 351 (14.0%) | 752 (17.4%) |
| Total | 9,461 (13.1%) | 12,288 (16.6%) |
Income Above Poverty by Sex and Age in Pomona
According to the poverty statistics in Pomona, males aged 35 to 44 years and females aged 45 to 54 years are the age groups that are most secure financially, with 92.3% of males and 90.3% of females in these age groups living above the poverty line.
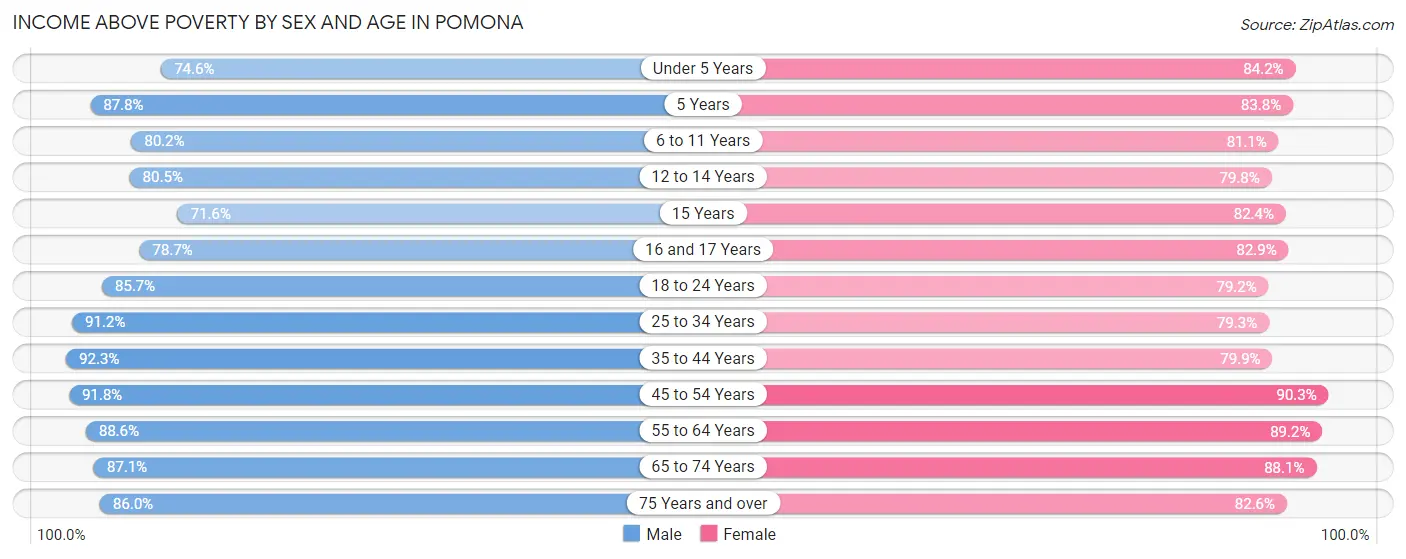
| Age Bracket | Male | Female |
| Under 5 Years | 3,541 (74.6%) | 3,811 (84.2%) |
| 5 Years | 555 (87.8%) | 881 (83.8%) |
| 6 to 11 Years | 5,019 (80.2%) | 4,567 (81.1%) |
| 12 to 14 Years | 2,289 (80.5%) | 2,598 (79.8%) |
| 15 Years | 724 (71.6%) | 1,012 (82.4%) |
| 16 and 17 Years | 1,513 (78.7%) | 2,132 (82.9%) |
| 18 to 24 Years | 7,712 (85.7%) | 6,338 (79.2%) |
| 25 to 34 Years | 10,100 (91.2%) | 8,239 (79.3%) |
| 35 to 44 Years | 9,282 (92.3%) | 7,825 (79.9%) |
| 45 to 54 Years | 8,899 (91.8%) | 8,842 (90.3%) |
| 55 to 64 Years | 6,672 (88.6%) | 7,350 (89.2%) |
| 65 to 74 Years | 4,331 (87.1%) | 4,794 (88.1%) |
| 75 Years and over | 2,159 (86.0%) | 3,570 (82.6%) |
| Total | 62,796 (86.9%) | 61,959 (83.5%) |
Income Below Poverty Among Married-Couple Families in Pomona
The poverty statistics for married-couple families in Pomona show that 6.6% or 1,322 of the total 20,174 families live below the poverty line. Families with 5 or more children have the highest poverty rate of 18.3%, comprising of 20 families. On the other hand, families with no children have the lowest poverty rate of 5.2%, which includes 527 families.
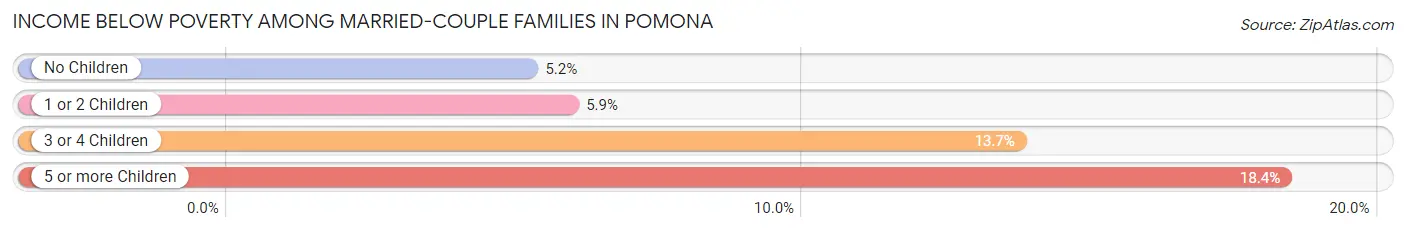
| Children | Above Poverty | Below Poverty |
| No Children | 9,542 (94.8%) | 527 (5.2%) |
| 1 or 2 Children | 7,217 (94.1%) | 456 (5.9%) |
| 3 or 4 Children | 2,004 (86.3%) | 319 (13.7%) |
| 5 or more Children | 89 (81.7%) | 20 (18.3%) |
| Total | 18,852 (93.4%) | 1,322 (6.6%) |
Income Below Poverty Among Single-Parent Households in Pomona
According to the poverty data in Pomona, 15.0% or 613 single-father households and 24.6% or 1,876 single-mother households are living below the poverty line. Among single-father households, those with 3 or 4 children have the highest poverty rate, with 93 households (18.2%) experiencing poverty. Likewise, among single-mother households, those with 3 or 4 children have the highest poverty rate, with 578 households (58.7%) falling below the poverty line.
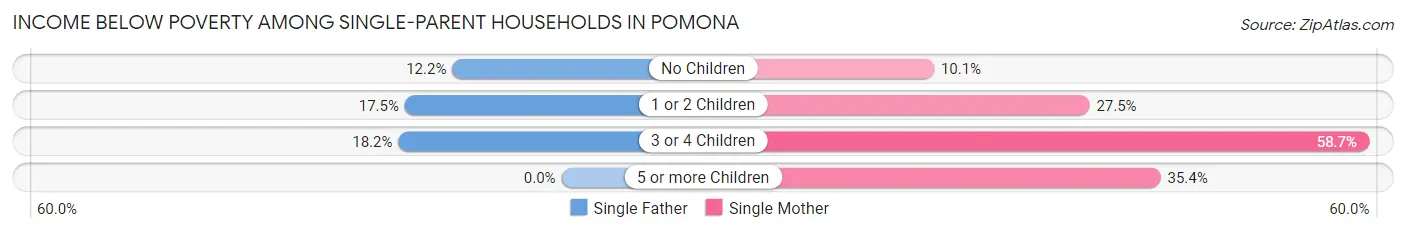
| Children | Single Father | Single Mother |
| No Children | 232 (12.2%) | 313 (10.1%) |
| 1 or 2 Children | 288 (17.5%) | 911 (27.5%) |
| 3 or 4 Children | 93 (18.2%) | 578 (58.7%) |
| 5 or more Children | 0 (0.0%) | 74 (35.4%) |
| Total | 613 (15.0%) | 1,876 (24.6%) |
Income Below Poverty Among Married-Couple vs Single-Parent Households in Pomona
The poverty data for Pomona shows that 1,322 of the married-couple family households (6.6%) and 2,489 of the single-parent households (21.3%) are living below the poverty level. Within the married-couple family households, those with 5 or more children have the highest poverty rate, with 20 households (18.3%) falling below the poverty line. Among the single-parent households, those with 3 or 4 children have the highest poverty rate, with 671 household (44.9%) living below poverty.
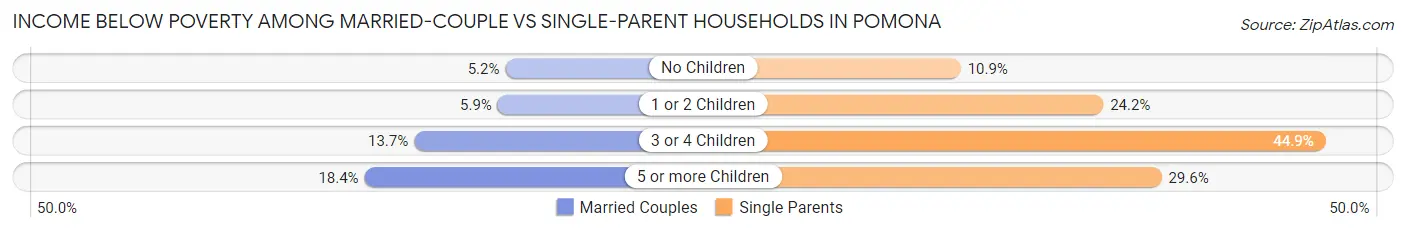
| Children | Married-Couple Families | Single-Parent Households |
| No Children | 527 (5.2%) | 545 (10.9%) |
| 1 or 2 Children | 456 (5.9%) | 1,199 (24.2%) |
| 3 or 4 Children | 319 (13.7%) | 671 (44.9%) |
| 5 or more Children | 20 (18.3%) | 74 (29.6%) |
| Total | 1,322 (6.6%) | 2,489 (21.3%) |
Race in Pomona
The most populous races in Pomona are Hispanic or Latino (107,992 | 72.1%), Some other Race (55,013 | 36.7%), and White / Caucasian (41,939 | 28.0%).
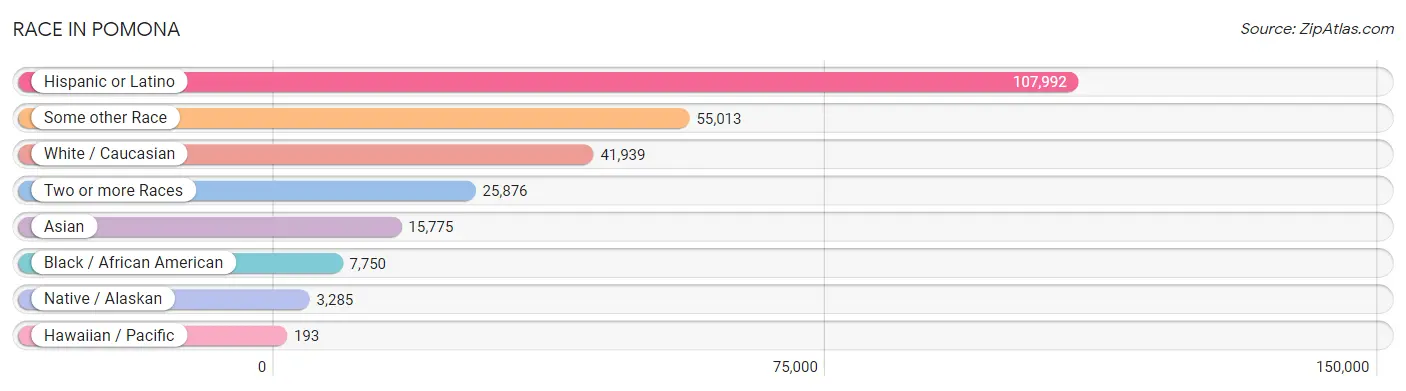
| Race | # Population | % Population |
| Asian | 15,775 | 10.5% |
| Black / African American | 7,750 | 5.2% |
| Hawaiian / Pacific | 193 | 0.1% |
| Hispanic or Latino | 107,992 | 72.1% |
| Native / Alaskan | 3,285 | 2.2% |
| White / Caucasian | 41,939 | 28.0% |
| Two or more Races | 25,876 | 17.3% |
| Some other Race | 55,013 | 36.7% |
| Total | 149,831 | 100.0% |
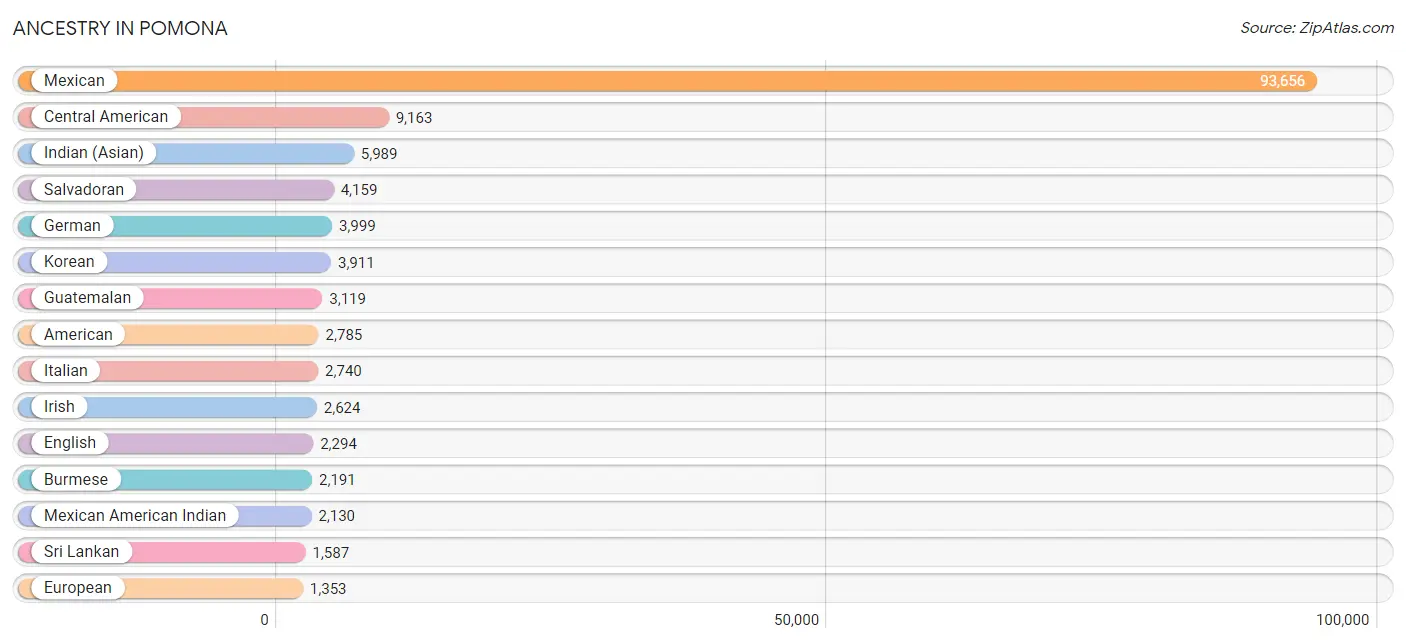
Ancestry in Pomona
The most populous ancestries reported in Pomona are Mexican (93,656 | 62.5%), Central American (9,163 | 6.1%), Indian (Asian) (5,989 | 4.0%), Salvadoran (4,159 | 2.8%), and German (3,999 | 2.7%), together accounting for 78.1% of all Pomona residents.
| Ancestry | # Population | % Population |
| Afghan | 152 | 0.1% |
| African | 532 | 0.4% |
| American | 2,785 | 1.9% |
| Apache | 211 | 0.1% |
| Arab | 431 | 0.3% |
| Argentinean | 362 | 0.2% |
| Armenian | 83 | 0.1% |
| Australian | 34 | 0.0% |
| Austrian | 4 | 0.0% |
| Bahamian | 13 | 0.0% |
| Bangladeshi | 53 | 0.0% |
| Barbadian | 18 | 0.0% |
| Basque | 72 | 0.1% |
| Belizean | 20 | 0.0% |
| Bhutanese | 650 | 0.4% |
| Blackfeet | 20 | 0.0% |
| Bolivian | 44 | 0.0% |
| Brazilian | 18 | 0.0% |
| British | 212 | 0.1% |
| British West Indian | 14 | 0.0% |
| Bulgarian | 4 | 0.0% |
| Burmese | 2,191 | 1.5% |
| Cajun | 75 | 0.1% |
| Canadian | 44 | 0.0% |
| Cape Verdean | 16 | 0.0% |
| Central American | 9,163 | 6.1% |
| Central American Indian | 726 | 0.5% |
| Cherokee | 105 | 0.1% |
| Chilean | 118 | 0.1% |
| Choctaw | 30 | 0.0% |
| Colombian | 179 | 0.1% |
| Costa Rican | 342 | 0.2% |
| Creek | 19 | 0.0% |
| Cuban | 407 | 0.3% |
| Czech | 93 | 0.1% |
| Danish | 64 | 0.0% |
| Dominican | 46 | 0.0% |
| Dutch | 518 | 0.4% |
| Eastern European | 72 | 0.1% |
| Ecuadorian | 131 | 0.1% |
| Egyptian | 41 | 0.0% |
| English | 2,294 | 1.5% |
| European | 1,353 | 0.9% |
| Filipino | 332 | 0.2% |
| Finnish | 7 | 0.0% |
| French | 1,068 | 0.7% |
| French Canadian | 241 | 0.2% |
| German | 3,999 | 2.7% |
| Ghanaian | 18 | 0.0% |
| Greek | 115 | 0.1% |
| Guamanian / Chamorro | 80 | 0.1% |
| Guatemalan | 3,119 | 2.1% |
| Guyanese | 15 | 0.0% |
| Haitian | 39 | 0.0% |
| Honduran | 689 | 0.5% |
| Hopi | 92 | 0.1% |
| Hungarian | 83 | 0.1% |
| Icelander | 2 | 0.0% |
| Indian (Asian) | 5,989 | 4.0% |
| Indonesian | 3 | 0.0% |
| Iranian | 185 | 0.1% |
| Iraqi | 6 | 0.0% |
| Irish | 2,624 | 1.8% |
| Israeli | 36 | 0.0% |
| Italian | 2,740 | 1.8% |
| Jamaican | 177 | 0.1% |
| Japanese | 898 | 0.6% |
| Jordanian | 1 | 0.0% |
| Kenyan | 45 | 0.0% |
| Korean | 3,911 | 2.6% |
| Laotian | 179 | 0.1% |
| Lebanese | 147 | 0.1% |
| Lithuanian | 29 | 0.0% |
| Lumbee | 1 | 0.0% |
| Malaysian | 180 | 0.1% |
| Mexican | 93,656 | 62.5% |
| Mexican American Indian | 2,130 | 1.4% |
| Mongolian | 3 | 0.0% |
| Native Hawaiian | 167 | 0.1% |
| Navajo | 157 | 0.1% |
| Nicaraguan | 671 | 0.4% |
| Nigerian | 81 | 0.1% |
| Northern European | 144 | 0.1% |
| Norwegian | 417 | 0.3% |
| Okinawan | 29 | 0.0% |
| Ottawa | 13 | 0.0% |
| Pakistani | 278 | 0.2% |
| Palestinian | 29 | 0.0% |
| Panamanian | 102 | 0.1% |
| Peruvian | 274 | 0.2% |
| Polish | 474 | 0.3% |
| Portuguese | 276 | 0.2% |
| Potawatomi | 12 | 0.0% |
| Pueblo | 10 | 0.0% |
| Puerto Rican | 804 | 0.5% |
| Romanian | 137 | 0.1% |
| Russian | 307 | 0.2% |
| Salvadoran | 4,159 | 2.8% |
| Samoan | 115 | 0.1% |
| Scandinavian | 67 | 0.0% |
| Scotch-Irish | 150 | 0.1% |
| Scottish | 735 | 0.5% |
| Serbian | 11 | 0.0% |
| Sioux | 10 | 0.0% |
| Slavic | 15 | 0.0% |
| Slovak | 35 | 0.0% |
| Slovene | 7 | 0.0% |
| South African | 26 | 0.0% |
| South American | 1,123 | 0.7% |
| Spaniard | 354 | 0.2% |
| Spanish | 270 | 0.2% |
| Spanish American | 3 | 0.0% |
| Spanish American Indian | 334 | 0.2% |
| Sri Lankan | 1,587 | 1.1% |
| Subsaharan African | 937 | 0.6% |
| Sudanese | 130 | 0.1% |
| Swedish | 188 | 0.1% |
| Swiss | 169 | 0.1% |
| Syrian | 100 | 0.1% |
| Thai | 1,093 | 0.7% |
| Tohono O'Odham | 234 | 0.2% |
| Tongan | 19 | 0.0% |
| Ukrainian | 105 | 0.1% |
| Venezuelan | 7 | 0.0% |
| Vietnamese | 33 | 0.0% |
| Welsh | 199 | 0.1% |
| West Indian | 12 | 0.0% |
| Yaqui | 32 | 0.0% |
| Yugoslavian | 14 | 0.0% |
| Yuman | 37 | 0.0% |
| Zimbabwean | 4 | 0.0% | View All 131 Rows |
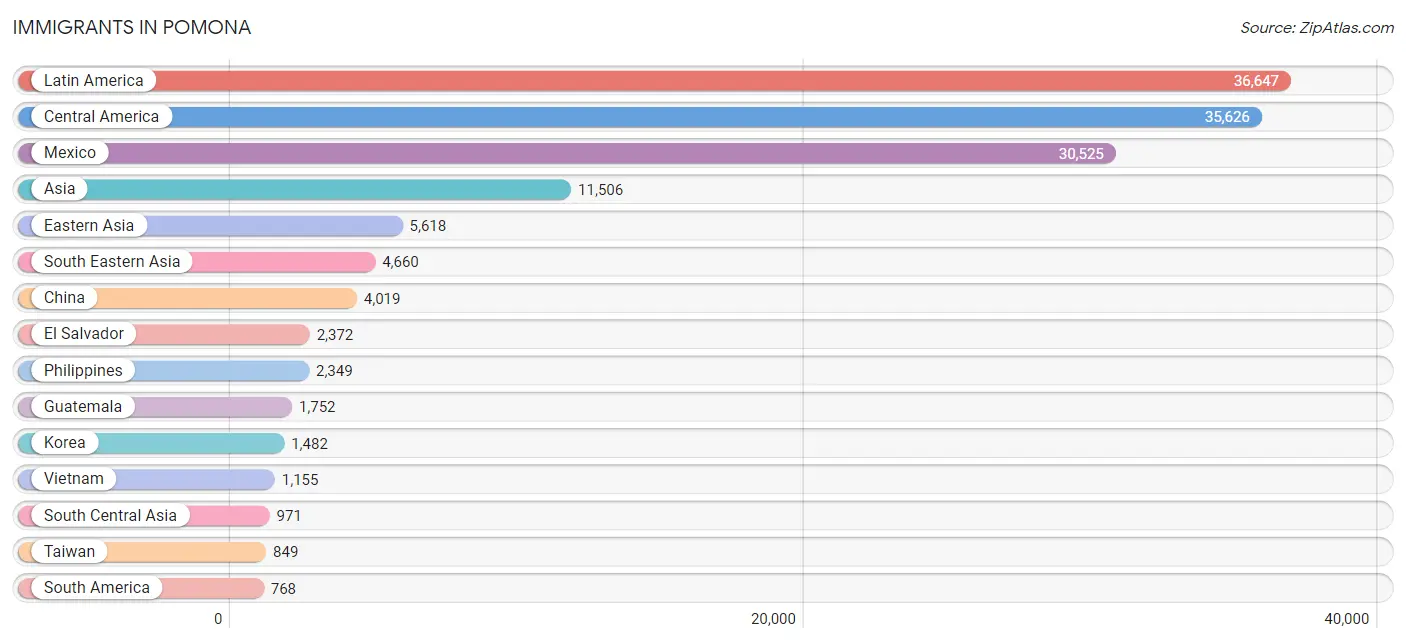
Immigrants in Pomona
The most numerous immigrant groups reported in Pomona came from Latin America (36,647 | 24.5%), Central America (35,626 | 23.8%), Mexico (30,525 | 20.4%), Asia (11,506 | 7.7%), and Eastern Asia (5,618 | 3.7%), together accounting for 80.0% of all Pomona residents.
| Immigration Origin | # Population | % Population |
| Afghanistan | 57 | 0.0% |
| Africa | 435 | 0.3% |
| Argentina | 215 | 0.1% |
| Armenia | 12 | 0.0% |
| Asia | 11,506 | 7.7% |
| Australia | 19 | 0.0% |
| Bangladesh | 30 | 0.0% |
| Belgium | 28 | 0.0% |
| Belize | 69 | 0.1% |
| Bolivia | 8 | 0.0% |
| Brazil | 16 | 0.0% |
| Bulgaria | 2 | 0.0% |
| Cambodia | 411 | 0.3% |
| Cameroon | 55 | 0.0% |
| Canada | 132 | 0.1% |
| Caribbean | 253 | 0.2% |
| Central America | 35,626 | 23.8% |
| Chile | 49 | 0.0% |
| China | 4,019 | 2.7% |
| Colombia | 178 | 0.1% |
| Costa Rica | 45 | 0.0% |
| Cuba | 171 | 0.1% |
| Czechoslovakia | 8 | 0.0% |
| Eastern Africa | 35 | 0.0% |
| Eastern Asia | 5,618 | 3.7% |
| Eastern Europe | 92 | 0.1% |
| Ecuador | 51 | 0.0% |
| Egypt | 43 | 0.0% |
| El Salvador | 2,372 | 1.6% |
| England | 125 | 0.1% |
| Europe | 524 | 0.4% |
| Fiji | 24 | 0.0% |
| France | 48 | 0.0% |
| Germany | 50 | 0.0% |
| Ghana | 45 | 0.0% |
| Guatemala | 1,752 | 1.2% |
| Guyana | 60 | 0.0% |
| Haiti | 14 | 0.0% |
| Honduras | 402 | 0.3% |
| Hong Kong | 131 | 0.1% |
| India | 598 | 0.4% |
| Indonesia | 223 | 0.2% |
| Iran | 109 | 0.1% |
| Israel | 29 | 0.0% |
| Jamaica | 45 | 0.0% |
| Japan | 108 | 0.1% |
| Kenya | 30 | 0.0% |
| Korea | 1,482 | 1.0% |
| Kuwait | 94 | 0.1% |
| Laos | 81 | 0.1% |
| Latin America | 36,647 | 24.5% |
| Lebanon | 53 | 0.0% |
| Liberia | 5 | 0.0% |
| Malaysia | 109 | 0.1% |
| Mexico | 30,525 | 20.4% |
| Micronesia | 14 | 0.0% |
| Middle Africa | 55 | 0.0% |
| Morocco | 12 | 0.0% |
| Nepal | 52 | 0.0% |
| Netherlands | 32 | 0.0% |
| Nicaragua | 385 | 0.3% |
| Nigeria | 181 | 0.1% |
| Northern Africa | 114 | 0.1% |
| Northern Europe | 204 | 0.1% |
| Oceania | 62 | 0.0% |
| Pakistan | 92 | 0.1% |
| Panama | 76 | 0.1% |
| Peru | 184 | 0.1% |
| Philippines | 2,349 | 1.6% |
| Romania | 47 | 0.0% |
| Russia | 16 | 0.0% |
| Singapore | 58 | 0.0% |
| South America | 768 | 0.5% |
| South Central Asia | 971 | 0.6% |
| South Eastern Asia | 4,660 | 3.1% |
| Southern Europe | 37 | 0.0% |
| Spain | 37 | 0.0% |
| Sri Lanka | 33 | 0.0% |
| Sudan | 48 | 0.0% |
| Sweden | 22 | 0.0% |
| Switzerland | 33 | 0.0% |
| Syria | 65 | 0.0% |
| Taiwan | 849 | 0.6% |
| Thailand | 224 | 0.2% |
| Trinidad and Tobago | 9 | 0.0% |
| Ukraine | 2 | 0.0% |
| Venezuela | 7 | 0.0% |
| Vietnam | 1,155 | 0.8% |
| Western Africa | 231 | 0.2% |
| Western Asia | 257 | 0.2% |
| Western Europe | 191 | 0.1% |
| Zimbabwe | 4 | 0.0% | View All 92 Rows |
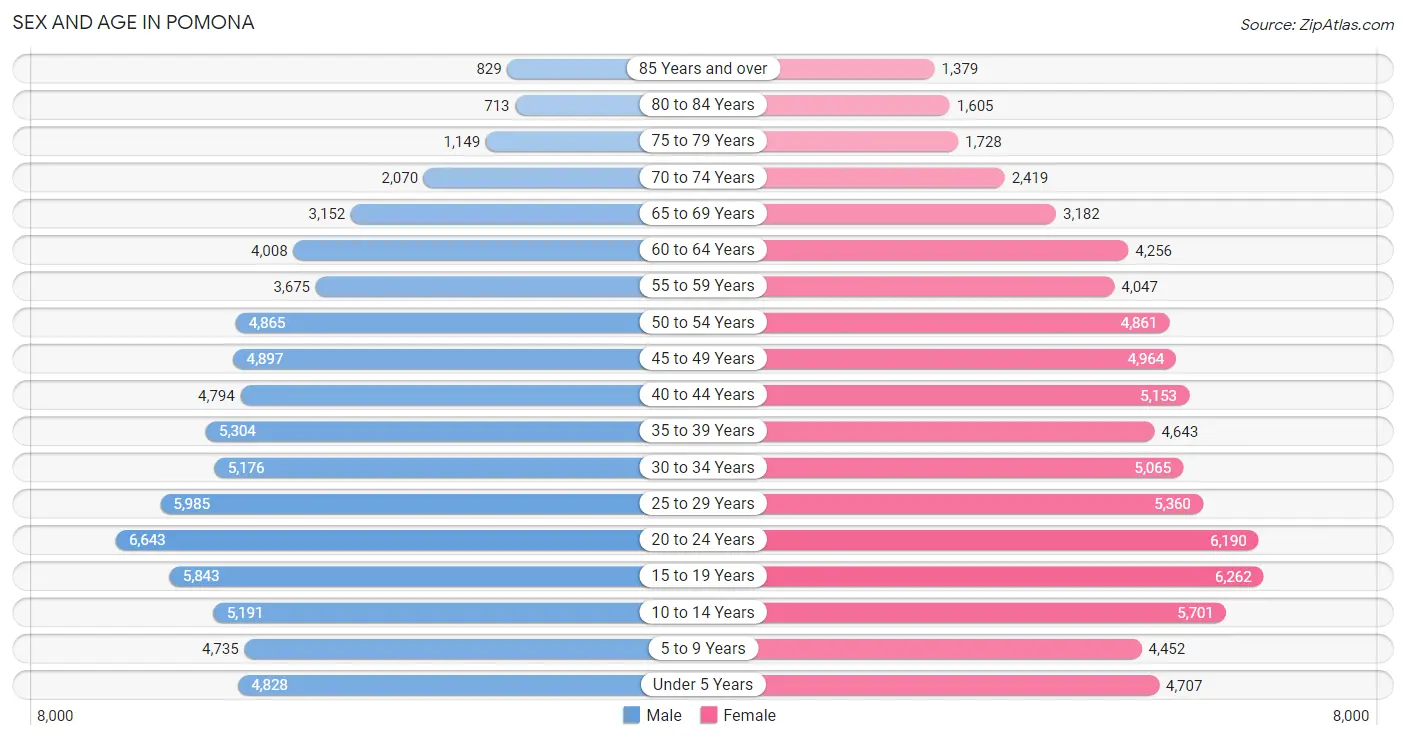
Sex and Age in Pomona
Sex and Age in Pomona
The most populous age groups in Pomona are 20 to 24 Years (6,643 | 9.0%) for men and 15 to 19 Years (6,262 | 8.2%) for women.
| Age Bracket | Male | Female |
| Under 5 Years | 4,828 (6.5%) | 4,707 (6.2%) |
| 5 to 9 Years | 4,735 (6.4%) | 4,452 (5.9%) |
| 10 to 14 Years | 5,191 (7.0%) | 5,701 (7.5%) |
| 15 to 19 Years | 5,843 (7.9%) | 6,262 (8.2%) |
| 20 to 24 Years | 6,643 (9.0%) | 6,190 (8.2%) |
| 25 to 29 Years | 5,985 (8.1%) | 5,360 (7.1%) |
| 30 to 34 Years | 5,176 (7.0%) | 5,065 (6.7%) |
| 35 to 39 Years | 5,304 (7.2%) | 4,643 (6.1%) |
| 40 to 44 Years | 4,794 (6.5%) | 5,153 (6.8%) |
| 45 to 49 Years | 4,897 (6.6%) | 4,964 (6.5%) |
| 50 to 54 Years | 4,865 (6.6%) | 4,861 (6.4%) |
| 55 to 59 Years | 3,675 (5.0%) | 4,047 (5.3%) |
| 60 to 64 Years | 4,008 (5.4%) | 4,256 (5.6%) |
| 65 to 69 Years | 3,152 (4.3%) | 3,182 (4.2%) |
| 70 to 74 Years | 2,070 (2.8%) | 2,419 (3.2%) |
| 75 to 79 Years | 1,149 (1.6%) | 1,728 (2.3%) |
| 80 to 84 Years | 713 (1.0%) | 1,605 (2.1%) |
| 85 Years and over | 829 (1.1%) | 1,379 (1.8%) |
| Total | 73,857 (100.0%) | 75,974 (100.0%) |
Families and Households in Pomona
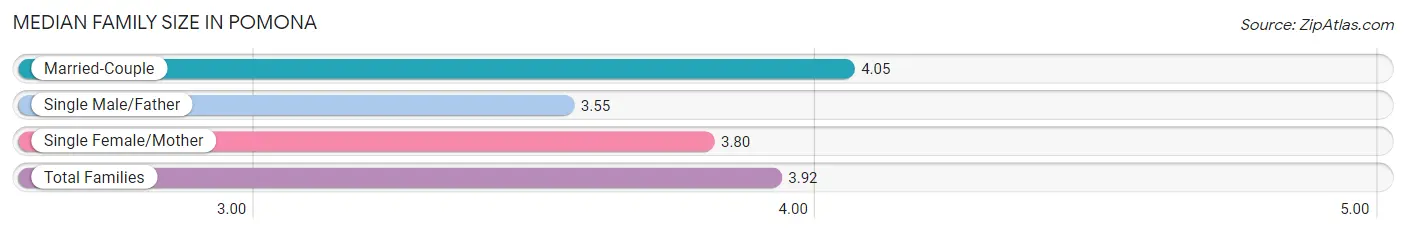
Median Family Size in Pomona
The median family size in Pomona is 3.92 persons per family, with married-couple families (20,174 | 63.3%) accounting for the largest median family size of 4.05 persons per family. On the other hand, single male/father families (4,096 | 12.9%) represent the smallest median family size with 3.55 persons per family.
| Family Type | # Families | Family Size |
| Married-Couple | 20,174 (63.3%) | 4.05 |
| Single Male/Father | 4,096 (12.9%) | 3.55 |
| Single Female/Mother | 7,612 (23.9%) | 3.80 |
| Total Families | 31,882 (100.0%) | 3.92 |
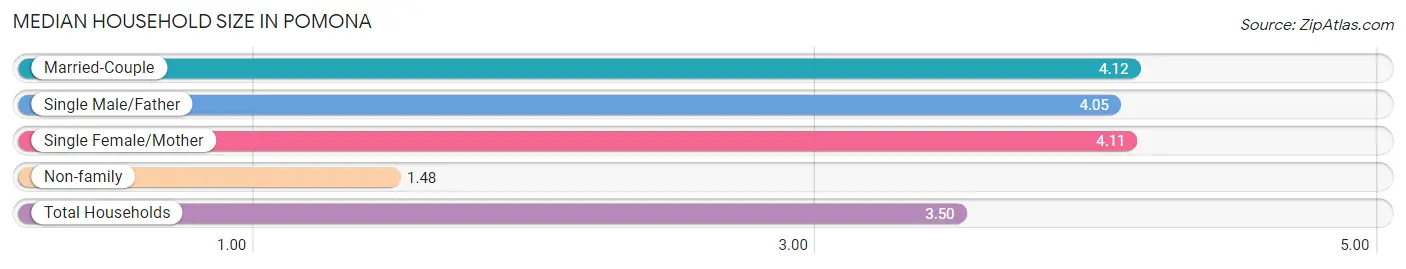
Median Household Size in Pomona
The median household size in Pomona is 3.50 persons per household, with married-couple households (20,174 | 48.7%) accounting for the largest median household size of 4.12 persons per household. non-family households (9,556 | 23.1%) represent the smallest median household size with 1.48 persons per household.
| Household Type | # Households | Household Size |
| Married-Couple | 20,174 (48.7%) | 4.12 |
| Single Male/Father | 4,096 (9.9%) | 4.05 |
| Single Female/Mother | 7,612 (18.4%) | 4.11 |
| Non-family | 9,556 (23.1%) | 1.48 |
| Total Households | 41,438 (100.0%) | 3.50 |
Household Size by Marriage Status in Pomona
Out of a total of 41,438 households in Pomona, 31,882 (76.9%) are family households, while 9,556 (23.1%) are nonfamily households. The most numerous type of family households are 2-person households, comprising 8,473, and the most common type of nonfamily households are 1-person households, comprising 7,036.
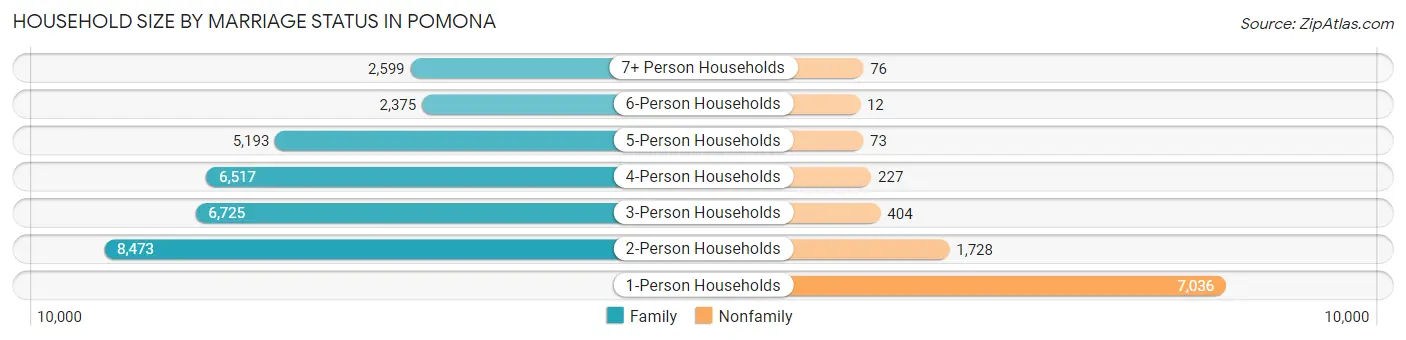
| Household Size | Family Households | Nonfamily Households |
| 1-Person Households | - | 7,036 (17.0%) |
| 2-Person Households | 8,473 (20.4%) | 1,728 (4.2%) |
| 3-Person Households | 6,725 (16.2%) | 404 (1.0%) |
| 4-Person Households | 6,517 (15.7%) | 227 (0.5%) |
| 5-Person Households | 5,193 (12.5%) | 73 (0.2%) |
| 6-Person Households | 2,375 (5.7%) | 12 (0.0%) |
| 7+ Person Households | 2,599 (6.3%) | 76 (0.2%) |
| Total | 31,882 (76.9%) | 9,556 (23.1%) |
Female Fertility in Pomona
Fertility by Age in Pomona
Average fertility rate in Pomona is 45.0 births per 1,000 women. Women in the age bracket of 20 to 34 years have the highest fertility rate with 67.0 births per 1,000 women. Women in the age bracket of 20 to 34 years acount for 63.8% of all women with births.
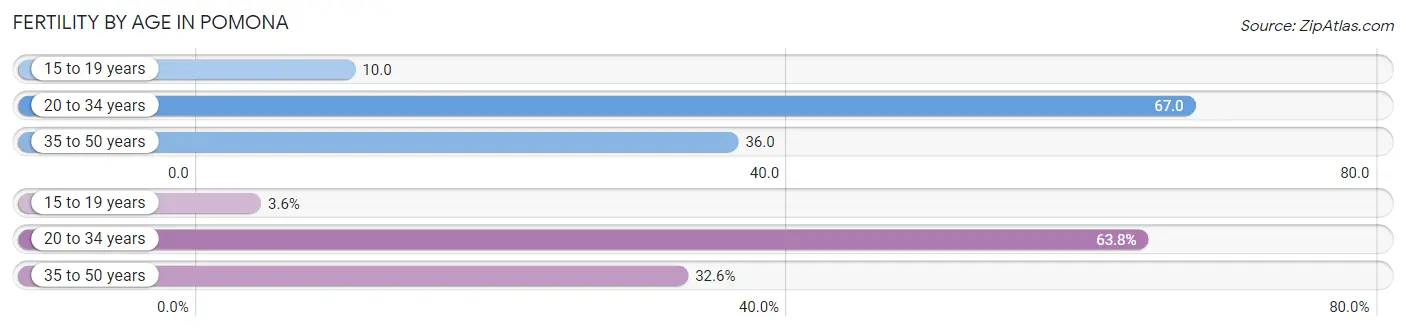
| Age Bracket | Women with Births | Births / 1,000 Women |
| 15 to 19 years | 63 (3.6%) | 10.0 |
| 20 to 34 years | 1,116 (63.8%) | 67.0 |
| 35 to 50 years | 570 (32.6%) | 36.0 |
| Total | 1,749 (100.0%) | 45.0 |
Fertility by Age by Marriage Status in Pomona
49.8% of women with births (1,749) in Pomona are married. The highest percentage of unmarried women with births falls into 20 to 34 years age bracket with 62.0% of them unmarried at the time of birth, while the lowest percentage of unmarried women with births belong to 35 to 50 years age bracket with 27.7% of them unmarried.
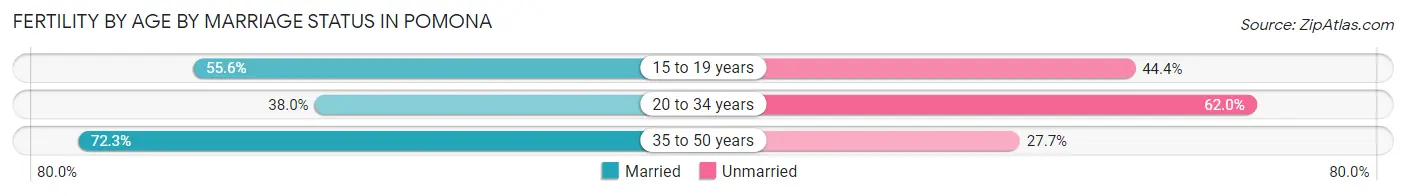
| Age Bracket | Married | Unmarried |
| 15 to 19 years | 35 (55.6%) | 28 (44.4%) |
| 20 to 34 years | 424 (38.0%) | 692 (62.0%) |
| 35 to 50 years | 412 (72.3%) | 158 (27.7%) |
| Total | 871 (49.8%) | 878 (50.2%) |
Fertility by Education in Pomona
Average fertility rate in Pomona is 45.0 births per 1,000 women. Women with the education attainment of high school diploma have the highest fertility rate of 52.0 births per 1,000 women, while women with the education attainment of graduate degree have the lowest fertility at 35.0 births per 1,000 women. Women with the education attainment of college or associate's degree represent 35.0% of all women with births.
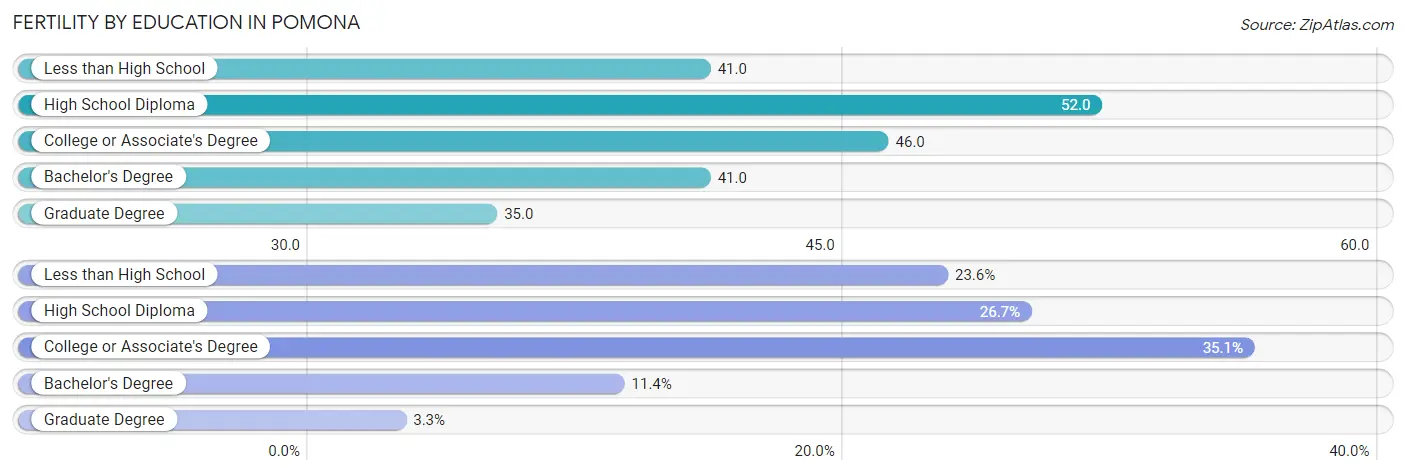
| Educational Attainment | Women with Births | Births / 1,000 Women |
| Less than High School | 412 (23.6%) | 41.0 |
| High School Diploma | 467 (26.7%) | 52.0 |
| College or Associate's Degree | 613 (35.0%) | 46.0 |
| Bachelor's Degree | 200 (11.4%) | 41.0 |
| Graduate Degree | 57 (3.3%) | 35.0 |
| Total | 1,749 (100.0%) | 45.0 |
Fertility by Education by Marriage Status in Pomona
50.2% of women with births in Pomona are unmarried. Women with the educational attainment of graduate degree are most likely to be married with 100.0% of them married at childbirth, while women with the educational attainment of high school diploma are least likely to be married with 63.8% of them unmarried at childbirth.
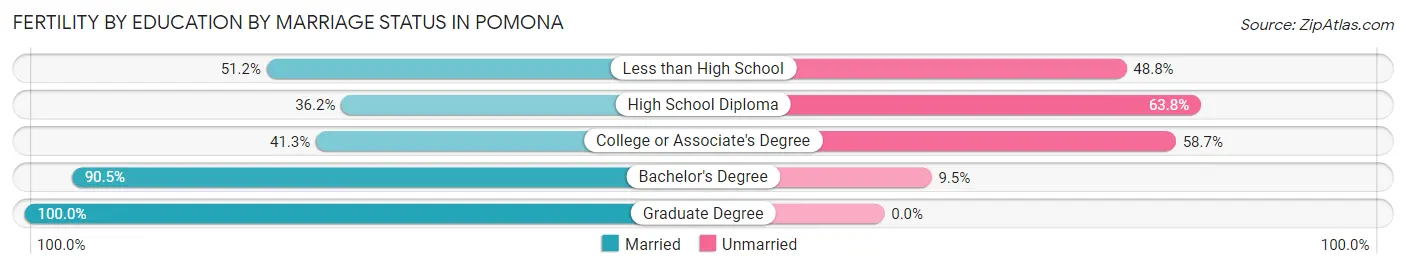
| Educational Attainment | Married | Unmarried |
| Less than High School | 211 (51.2%) | 201 (48.8%) |
| High School Diploma | 169 (36.2%) | 298 (63.8%) |
| College or Associate's Degree | 253 (41.3%) | 360 (58.7%) |
| Bachelor's Degree | 181 (90.5%) | 19 (9.5%) |
| Graduate Degree | 57 (100.0%) | 0 (0.0%) |
| Total | 871 (49.8%) | 878 (50.2%) |
Employment Characteristics in Pomona
Employment by Class of Employer in Pomona
Among the 67,055 employed individuals in Pomona, private company employees (47,735 | 71.2%), local government employees (5,302 | 7.9%), and self-employed (not incorporated) (4,597 | 6.9%) make up the most common classes of employment.
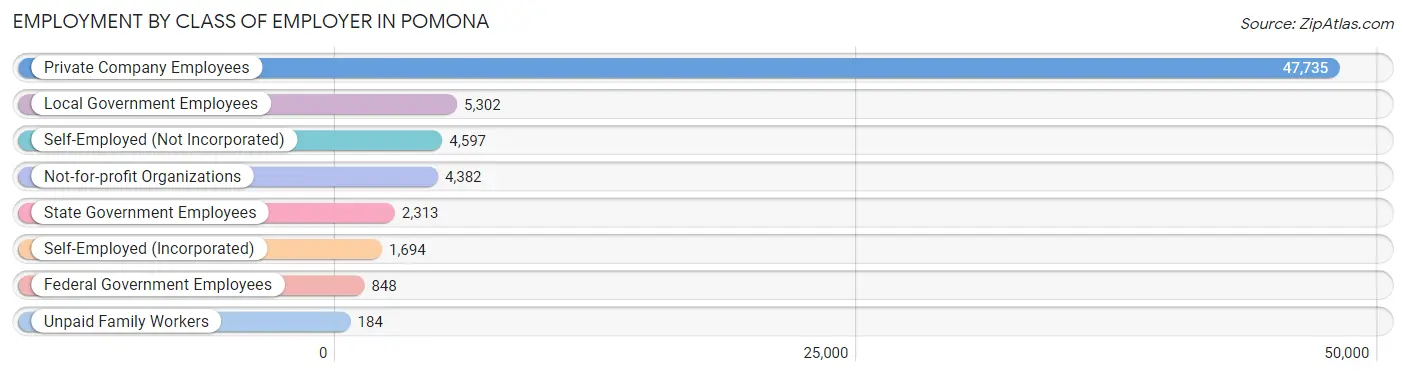
| Employer Class | # Employees | % Employees |
| Private Company Employees | 47,735 | 71.2% |
| Self-Employed (Incorporated) | 1,694 | 2.5% |
| Self-Employed (Not Incorporated) | 4,597 | 6.9% |
| Not-for-profit Organizations | 4,382 | 6.5% |
| Local Government Employees | 5,302 | 7.9% |
| State Government Employees | 2,313 | 3.5% |
| Federal Government Employees | 848 | 1.3% |
| Unpaid Family Workers | 184 | 0.3% |
| Total | 67,055 | 100.0% |
Employment Status by Age in Pomona
According to the labor force statistics for Pomona, out of the total population over 16 years of age (117,973), 62.8% or 74,087 individuals are in the labor force, with 6.5% or 4,816 of them unemployed. The age group with the highest labor force participation rate is 25 to 29 years, with 80.9% or 9,178 individuals in the labor force. Within the labor force, the 16 to 19 years age range has the highest percentage of unemployed individuals, with 25.5% or 709 of them being unemployed.
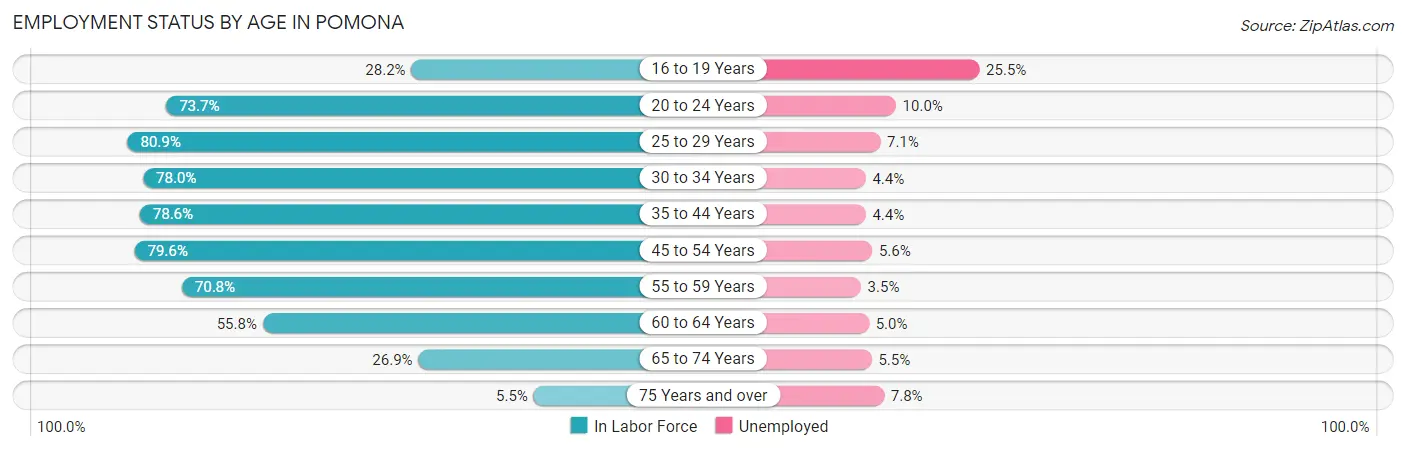
| Age Bracket | In Labor Force | Unemployed |
| 16 to 19 Years | 2,781 (28.2%) | 709 (25.5%) |
| 20 to 24 Years | 9,458 (73.7%) | 946 (10.0%) |
| 25 to 29 Years | 9,178 (80.9%) | 652 (7.1%) |
| 30 to 34 Years | 7,988 (78.0%) | 351 (4.4%) |
| 35 to 44 Years | 15,637 (78.6%) | 688 (4.4%) |
| 45 to 54 Years | 15,591 (79.6%) | 873 (5.6%) |
| 55 to 59 Years | 5,467 (70.8%) | 191 (3.5%) |
| 60 to 64 Years | 4,611 (55.8%) | 231 (5.0%) |
| 65 to 74 Years | 2,911 (26.9%) | 160 (5.5%) |
| 75 Years and over | 407 (5.5%) | 32 (7.8%) |
| Total | 74,087 (62.8%) | 4,816 (6.5%) |
Employment Status by Educational Attainment in Pomona
According to labor force statistics for Pomona, 75.9% of individuals (58,483) out of the total population between 25 and 64 years of age (77,053) are in the labor force, with 5.1% or 2,983 of them being unemployed. The group with the highest labor force participation rate are those with the educational attainment of bachelor's degree or higher, with 85.9% or 12,023 individuals in the labor force. Within the labor force, individuals with less than high school education have the highest percentage of unemployment, with 5.7% or 742 of them being unemployed.
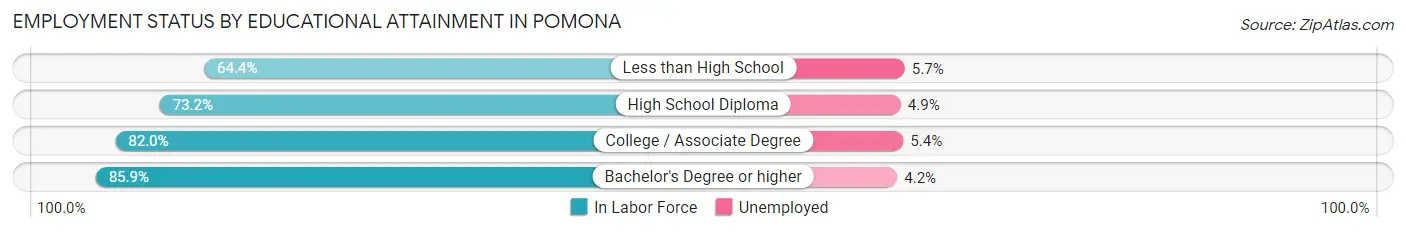
| Educational Attainment | In Labor Force | Unemployed |
| Less than High School | 13,016 (64.4%) | 1,152 (5.7%) |
| High School Diploma | 14,092 (73.2%) | 943 (4.9%) |
| College / Associate Degree | 19,347 (82.0%) | 1,274 (5.4%) |
| Bachelor's Degree or higher | 12,023 (85.9%) | 588 (4.2%) |
| Total | 58,483 (75.9%) | 3,930 (5.1%) |
Employment Occupations by Sex in Pomona
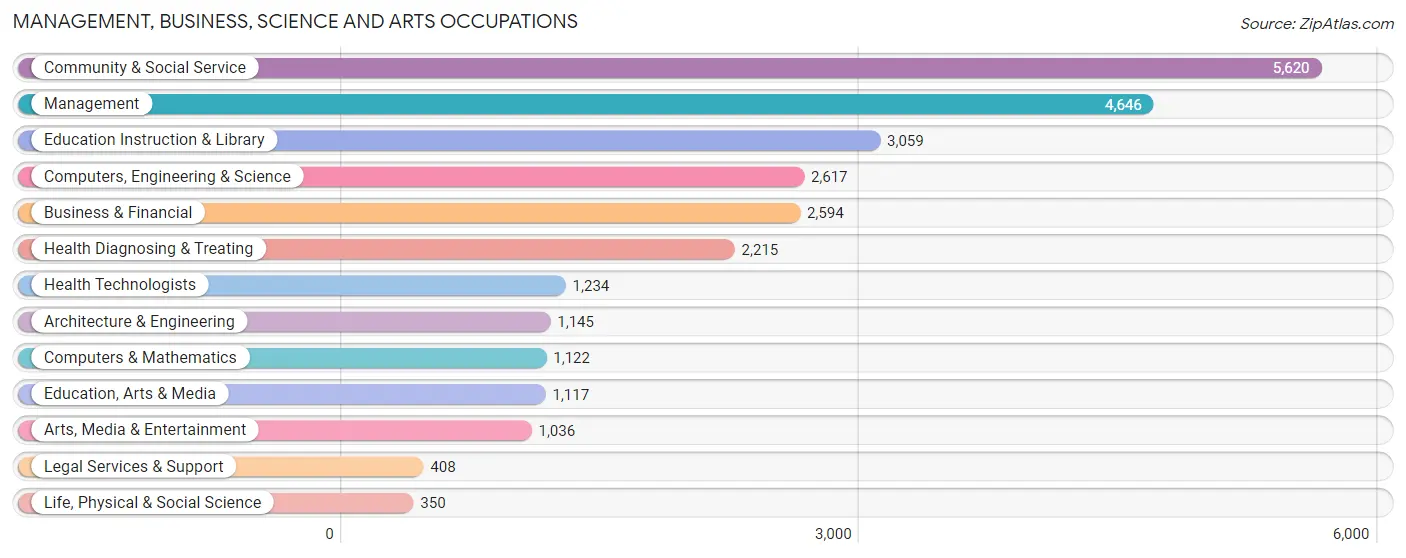
Management, Business, Science and Arts Occupations
The most common Management, Business, Science and Arts occupations in Pomona are Community & Social Service (5,620 | 8.1%), Management (4,646 | 6.7%), Education Instruction & Library (3,059 | 4.4%), Computers, Engineering & Science (2,617 | 3.8%), and Business & Financial (2,594 | 3.7%).
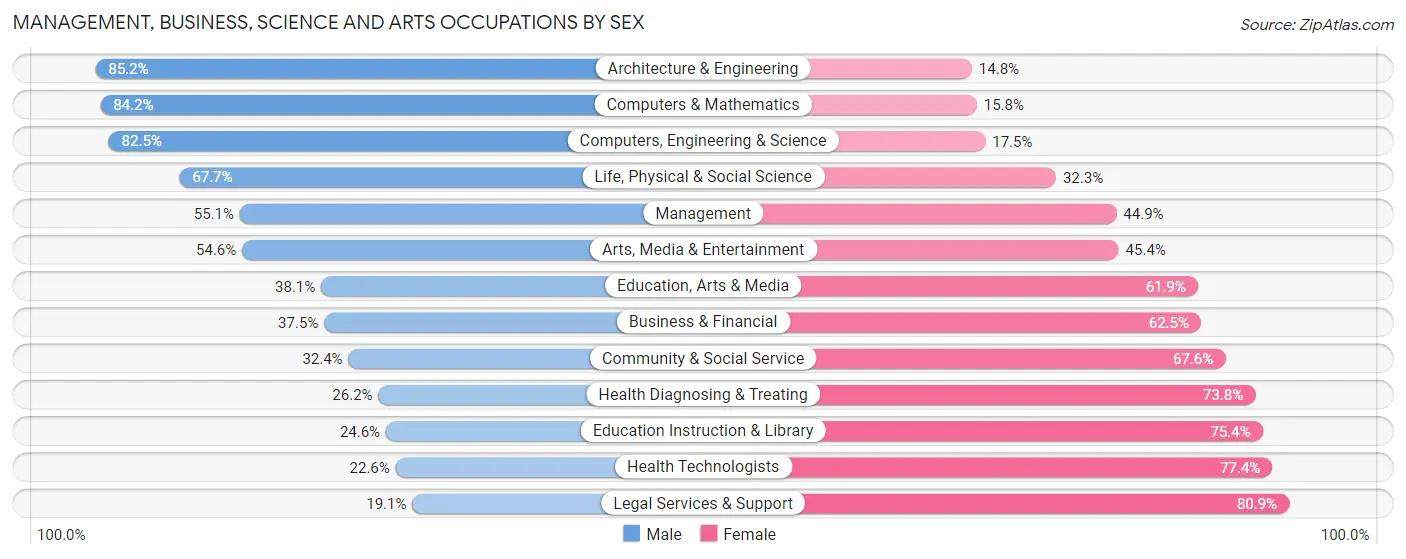
Management, Business, Science and Arts Occupations by Sex
Within the Management, Business, Science and Arts occupations in Pomona, the most male-oriented occupations are Architecture & Engineering (85.2%), Computers & Mathematics (84.2%), and Computers, Engineering & Science (82.5%), while the most female-oriented occupations are Legal Services & Support (80.9%), Health Technologists (77.4%), and Education Instruction & Library (75.4%).
| Occupation | Male | Female |
| Management | 2,560 (55.1%) | 2,086 (44.9%) |
| Business & Financial | 973 (37.5%) | 1,621 (62.5%) |
| Computers, Engineering & Science | 2,158 (82.5%) | 459 (17.5%) |
| Computers & Mathematics | 945 (84.2%) | 177 (15.8%) |
| Architecture & Engineering | 976 (85.2%) | 169 (14.8%) |
| Life, Physical & Social Science | 237 (67.7%) | 113 (32.3%) |
| Community & Social Service | 1,823 (32.4%) | 3,797 (67.6%) |
| Education, Arts & Media | 426 (38.1%) | 691 (61.9%) |
| Legal Services & Support | 78 (19.1%) | 330 (80.9%) |
| Education Instruction & Library | 753 (24.6%) | 2,306 (75.4%) |
| Arts, Media & Entertainment | 566 (54.6%) | 470 (45.4%) |
| Health Diagnosing & Treating | 580 (26.2%) | 1,635 (73.8%) |
| Health Technologists | 279 (22.6%) | 955 (77.4%) |
| Total (Category) | 8,094 (45.8%) | 9,598 (54.2%) |
| Total (Overall) | 38,397 (55.5%) | 30,758 (44.5%) |
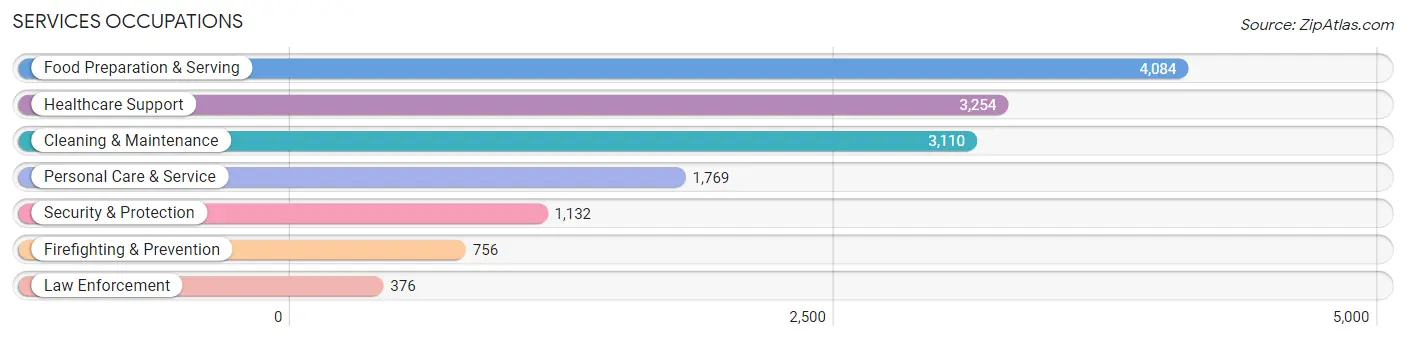
Services Occupations
The most common Services occupations in Pomona are Food Preparation & Serving (4,084 | 5.9%), Healthcare Support (3,254 | 4.7%), Cleaning & Maintenance (3,110 | 4.5%), Personal Care & Service (1,769 | 2.6%), and Security & Protection (1,132 | 1.6%).
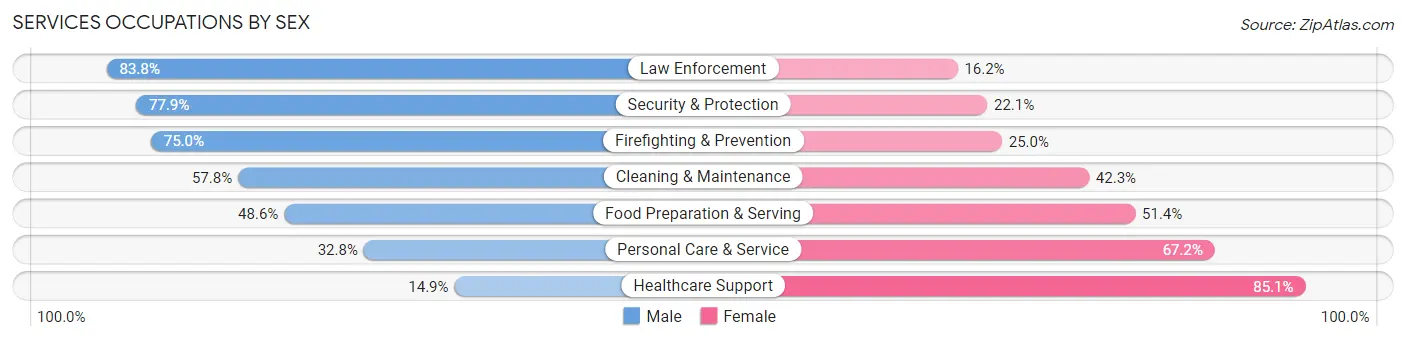
Services Occupations by Sex
Within the Services occupations in Pomona, the most male-oriented occupations are Law Enforcement (83.8%), Security & Protection (77.9%), and Firefighting & Prevention (75.0%), while the most female-oriented occupations are Healthcare Support (85.1%), Personal Care & Service (67.2%), and Food Preparation & Serving (51.4%).
| Occupation | Male | Female |
| Healthcare Support | 485 (14.9%) | 2,769 (85.1%) |
| Security & Protection | 882 (77.9%) | 250 (22.1%) |
| Firefighting & Prevention | 567 (75.0%) | 189 (25.0%) |
| Law Enforcement | 315 (83.8%) | 61 (16.2%) |
| Food Preparation & Serving | 1,985 (48.6%) | 2,099 (51.4%) |
| Cleaning & Maintenance | 1,796 (57.8%) | 1,314 (42.2%) |
| Personal Care & Service | 581 (32.8%) | 1,188 (67.2%) |
| Total (Category) | 5,729 (42.9%) | 7,620 (57.1%) |
| Total (Overall) | 38,397 (55.5%) | 30,758 (44.5%) |
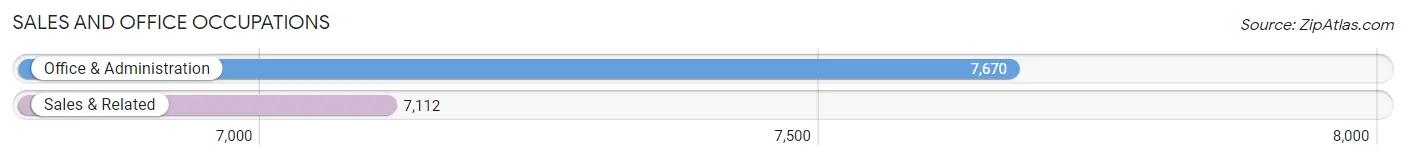
Sales and Office Occupations
The most common Sales and Office occupations in Pomona are Office & Administration (7,670 | 11.1%), and Sales & Related (7,112 | 10.3%).
Sales and Office Occupations by Sex
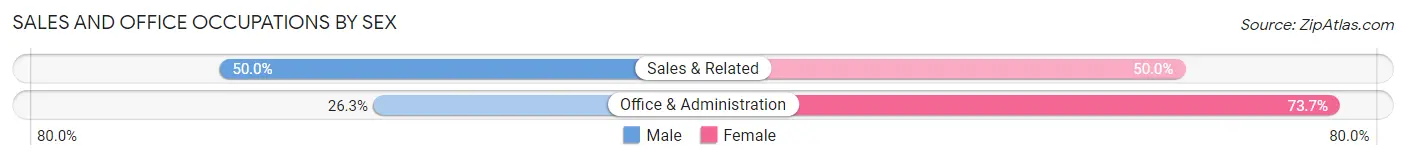
| Occupation | Male | Female |
| Sales & Related | 3,559 (50.0%) | 3,553 (50.0%) |
| Office & Administration | 2,016 (26.3%) | 5,654 (73.7%) |
| Total (Category) | 5,575 (37.7%) | 9,207 (62.3%) |
| Total (Overall) | 38,397 (55.5%) | 30,758 (44.5%) |
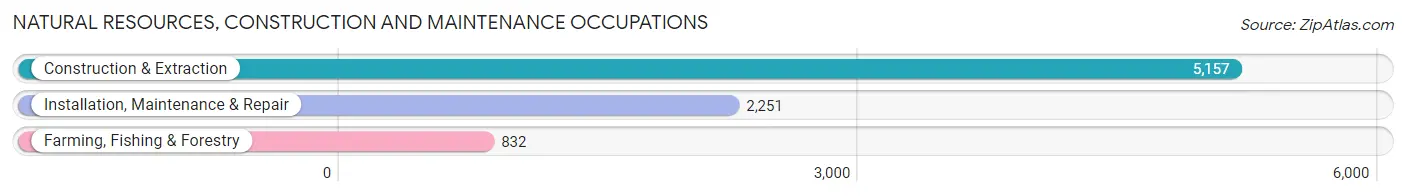
Natural Resources, Construction and Maintenance Occupations
The most common Natural Resources, Construction and Maintenance occupations in Pomona are Construction & Extraction (5,157 | 7.5%), Installation, Maintenance & Repair (2,251 | 3.3%), and Farming, Fishing & Forestry (832 | 1.2%).
Natural Resources, Construction and Maintenance Occupations by Sex
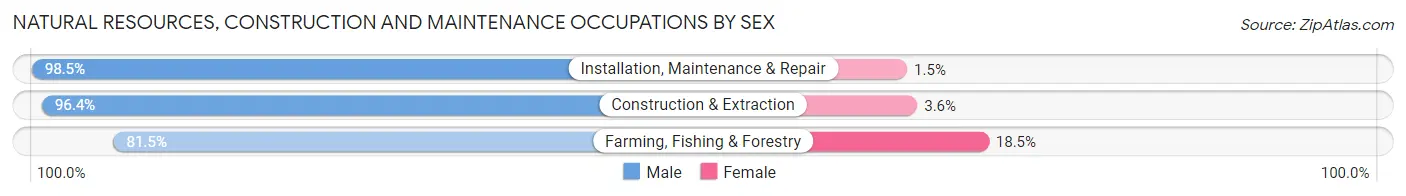
| Occupation | Male | Female |
| Farming, Fishing & Forestry | 678 (81.5%) | 154 (18.5%) |
| Construction & Extraction | 4,971 (96.4%) | 186 (3.6%) |
| Installation, Maintenance & Repair | 2,217 (98.5%) | 34 (1.5%) |
| Total (Category) | 7,866 (95.5%) | 374 (4.5%) |
| Total (Overall) | 38,397 (55.5%) | 30,758 (44.5%) |
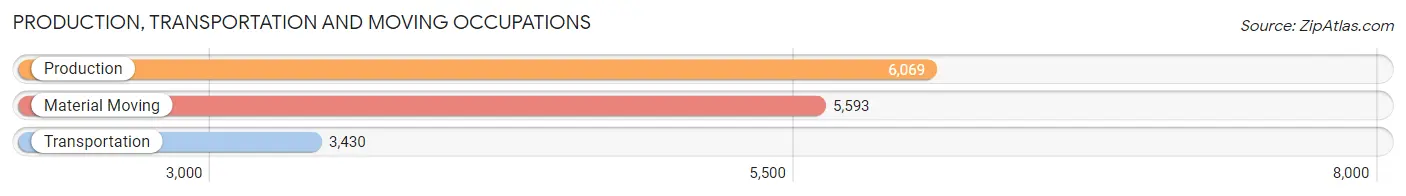
Production, Transportation and Moving Occupations
The most common Production, Transportation and Moving occupations in Pomona are Production (6,069 | 8.8%), Material Moving (5,593 | 8.1%), and Transportation (3,430 | 5.0%).
Production, Transportation and Moving Occupations by Sex
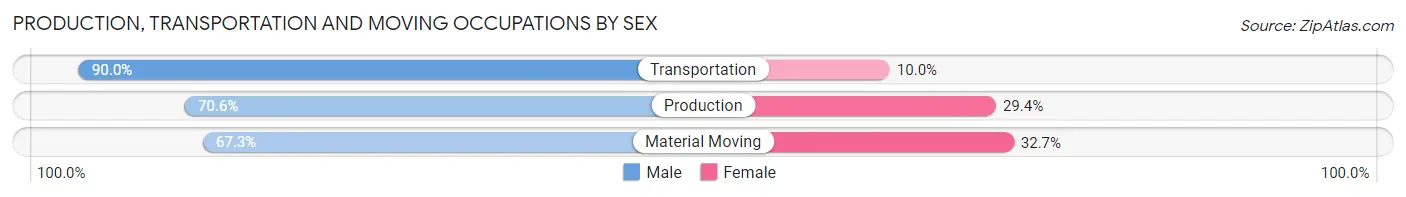
| Occupation | Male | Female |
| Production | 4,282 (70.6%) | 1,787 (29.4%) |
| Transportation | 3,088 (90.0%) | 342 (10.0%) |
| Material Moving | 3,763 (67.3%) | 1,830 (32.7%) |
| Total (Category) | 11,133 (73.8%) | 3,959 (26.2%) |
| Total (Overall) | 38,397 (55.5%) | 30,758 (44.5%) |
Employment Industries by Sex in Pomona
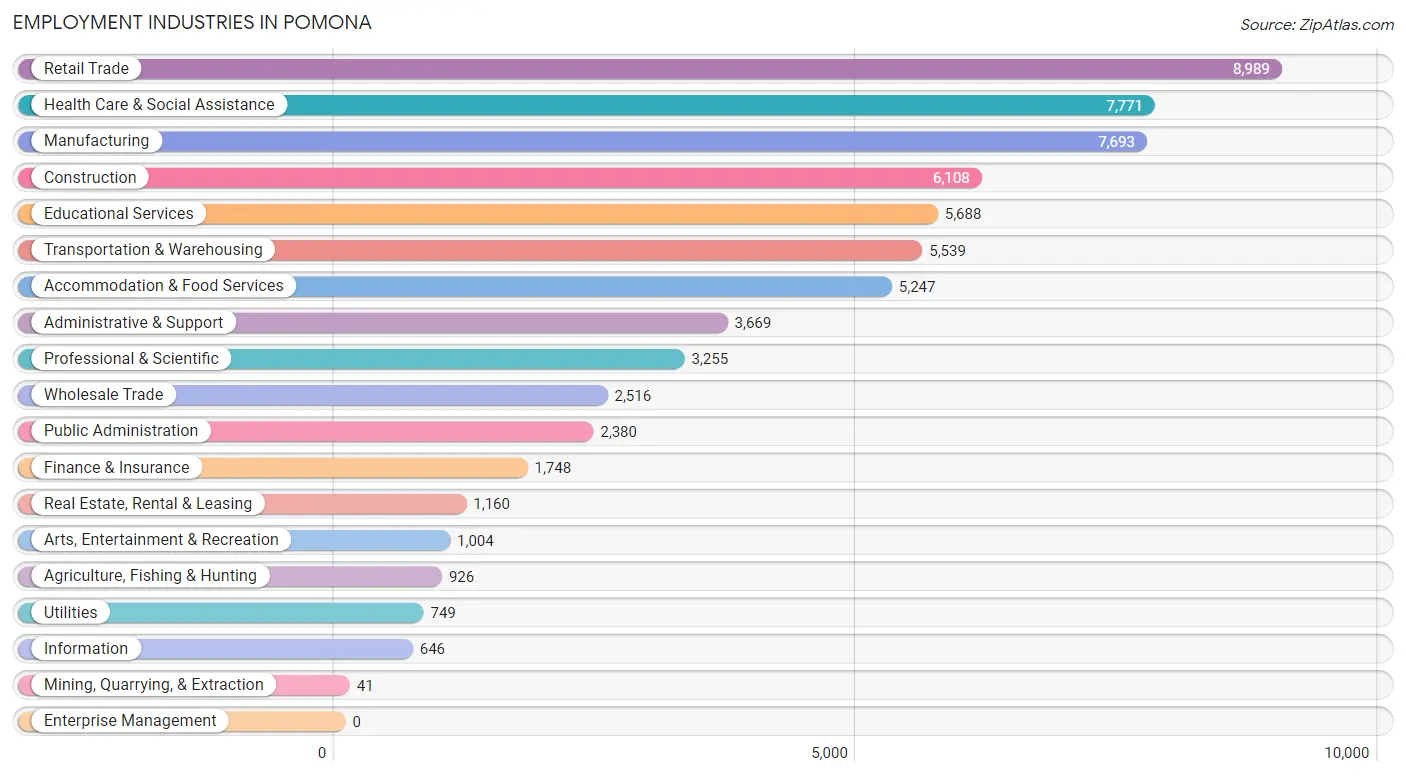
Employment Industries in Pomona
The major employment industries in Pomona include Retail Trade (8,989 | 13.0%), Health Care & Social Assistance (7,771 | 11.2%), Manufacturing (7,693 | 11.1%), Construction (6,108 | 8.8%), and Educational Services (5,688 | 8.2%).
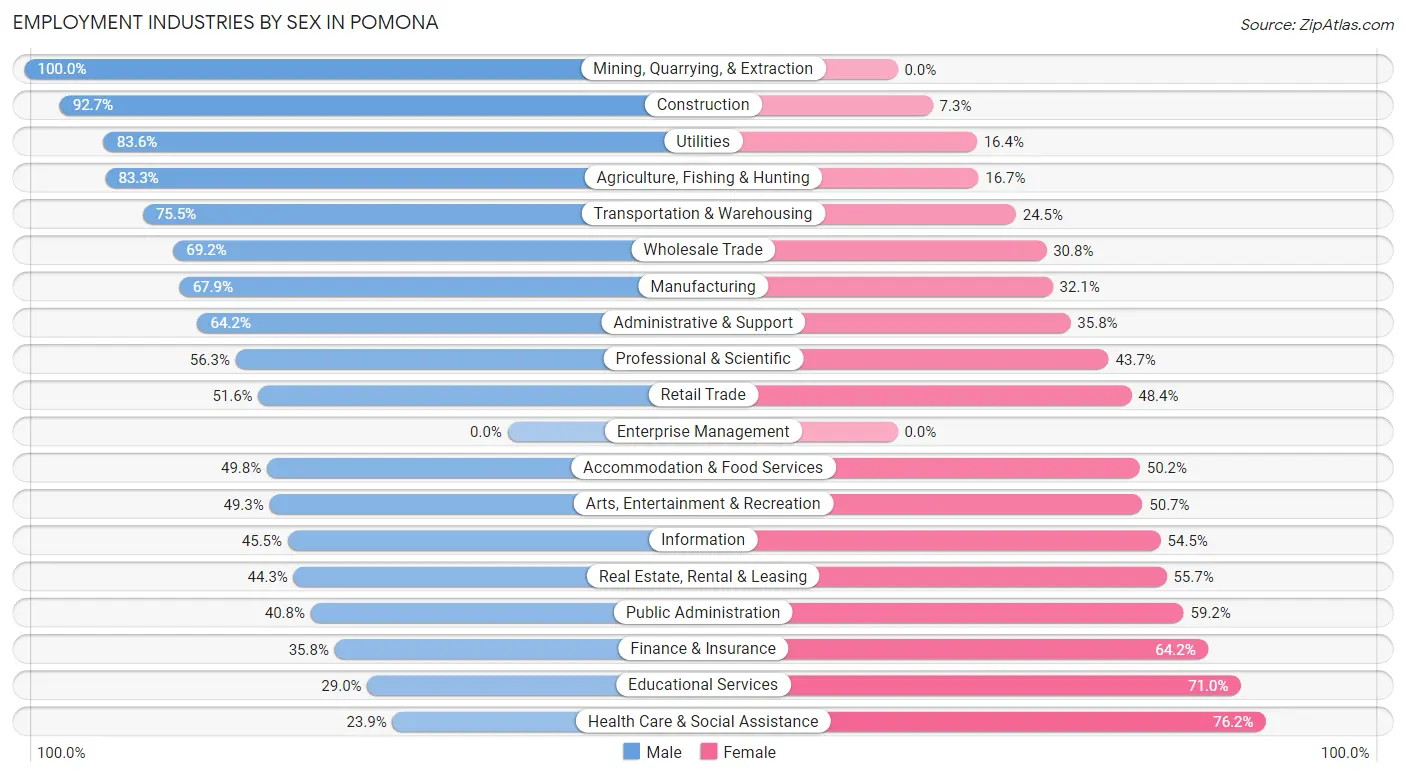
Employment Industries by Sex in Pomona
The Pomona industries that see more men than women are Mining, Quarrying, & Extraction (100.0%), Construction (92.7%), and Utilities (83.6%), whereas the industries that tend to have a higher number of women are Health Care & Social Assistance (76.1%), Educational Services (71.0%), and Finance & Insurance (64.2%).
| Industry | Male | Female |
| Agriculture, Fishing & Hunting | 771 (83.3%) | 155 (16.7%) |
| Mining, Quarrying, & Extraction | 41 (100.0%) | 0 (0.0%) |
| Construction | 5,663 (92.7%) | 445 (7.3%) |
| Manufacturing | 5,222 (67.9%) | 2,471 (32.1%) |
| Wholesale Trade | 1,741 (69.2%) | 775 (30.8%) |
| Retail Trade | 4,638 (51.6%) | 4,351 (48.4%) |
| Transportation & Warehousing | 4,182 (75.5%) | 1,357 (24.5%) |
| Utilities | 626 (83.6%) | 123 (16.4%) |
| Information | 294 (45.5%) | 352 (54.5%) |
| Finance & Insurance | 626 (35.8%) | 1,122 (64.2%) |
| Real Estate, Rental & Leasing | 514 (44.3%) | 646 (55.7%) |
| Professional & Scientific | 1,832 (56.3%) | 1,423 (43.7%) |
| Enterprise Management | 0 (0.0%) | 0 (0.0%) |
| Administrative & Support | 2,355 (64.2%) | 1,314 (35.8%) |
| Educational Services | 1,652 (29.0%) | 4,036 (71.0%) |
| Health Care & Social Assistance | 1,853 (23.8%) | 5,918 (76.1%) |
| Arts, Entertainment & Recreation | 495 (49.3%) | 509 (50.7%) |
| Accommodation & Food Services | 2,614 (49.8%) | 2,633 (50.2%) |
| Public Administration | 970 (40.8%) | 1,410 (59.2%) |
| Total | 38,397 (55.5%) | 30,758 (44.5%) |
Education in Pomona
School Enrollment in Pomona
The most common levels of schooling among the 43,565 students in Pomona are college / undergraduate (12,225 | 28.1%), high school (9,915 | 22.8%), and middle school (7,851 | 18.0%).
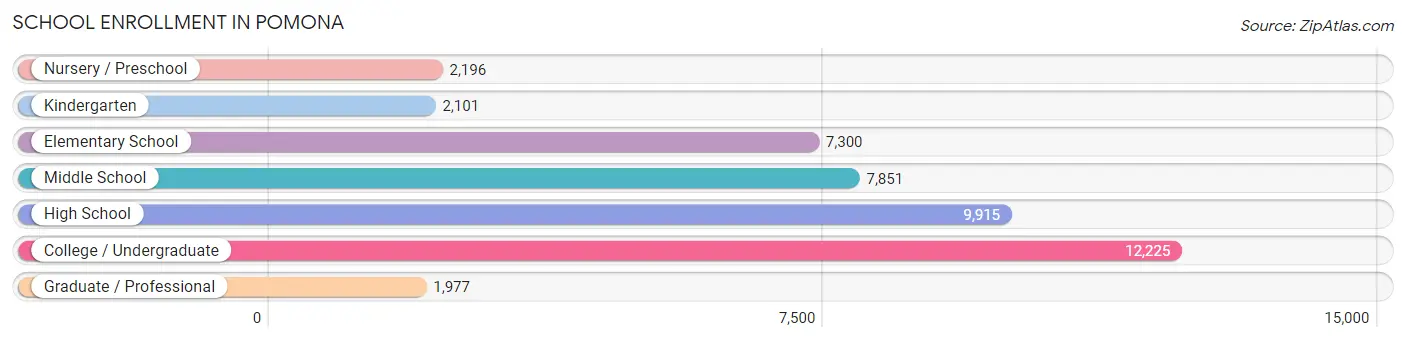
| School Level | # Students | % Students |
| Nursery / Preschool | 2,196 | 5.0% |
| Kindergarten | 2,101 | 4.8% |
| Elementary School | 7,300 | 16.8% |
| Middle School | 7,851 | 18.0% |
| High School | 9,915 | 22.8% |
| College / Undergraduate | 12,225 | 28.1% |
| Graduate / Professional | 1,977 | 4.5% |
| Total | 43,565 | 100.0% |
School Enrollment by Age by Funding Source in Pomona
Out of a total of 43,565 students who are enrolled in schools in Pomona, 4,356 (10.0%) attend a private institution, while the remaining 39,208 (90.0%) are enrolled in public schools. The age group of 3 to 4 year olds has the highest likelihood of being enrolled in private schools, with 488 (26.1% in the age bracket) enrolled. Conversely, the age group of 15 to 17 year olds has the lowest likelihood of being enrolled in a private school, with 6,392 (98.1% in the age bracket) attending a public institution.
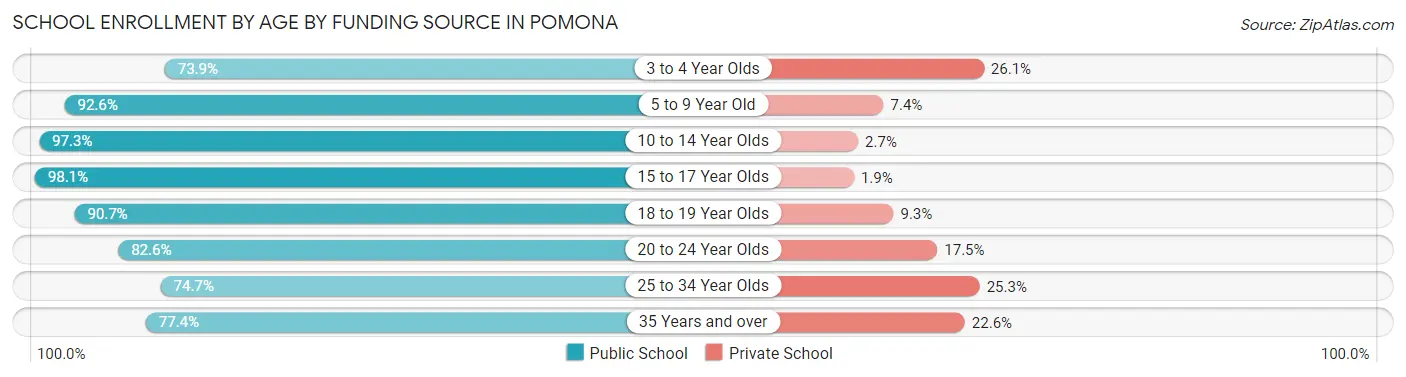
| Age Bracket | Public School | Private School |
| 3 to 4 Year Olds | 1,380 (73.9%) | 488 (26.1%) |
| 5 to 9 Year Old | 8,044 (92.6%) | 647 (7.4%) |
| 10 to 14 Year Olds | 10,255 (97.3%) | 285 (2.7%) |
| 15 to 17 Year Olds | 6,392 (98.1%) | 125 (1.9%) |
| 18 to 19 Year Olds | 3,829 (90.7%) | 392 (9.3%) |
| 20 to 24 Year Olds | 5,030 (82.6%) | 1,063 (17.4%) |
| 25 to 34 Year Olds | 2,613 (74.7%) | 887 (25.3%) |
| 35 Years and over | 1,653 (77.4%) | 482 (22.6%) |
| Total | 39,208 (90.0%) | 4,356 (10.0%) |
Educational Attainment by Field of Study in Pomona
Business (3,799 | 21.0%), engineering (1,779 | 9.8%), social sciences (1,624 | 9.0%), science & technology (1,359 | 7.5%), and education (1,299 | 7.2%) are the most common fields of study among 18,104 individuals in Pomona who have obtained a bachelor's degree or higher.
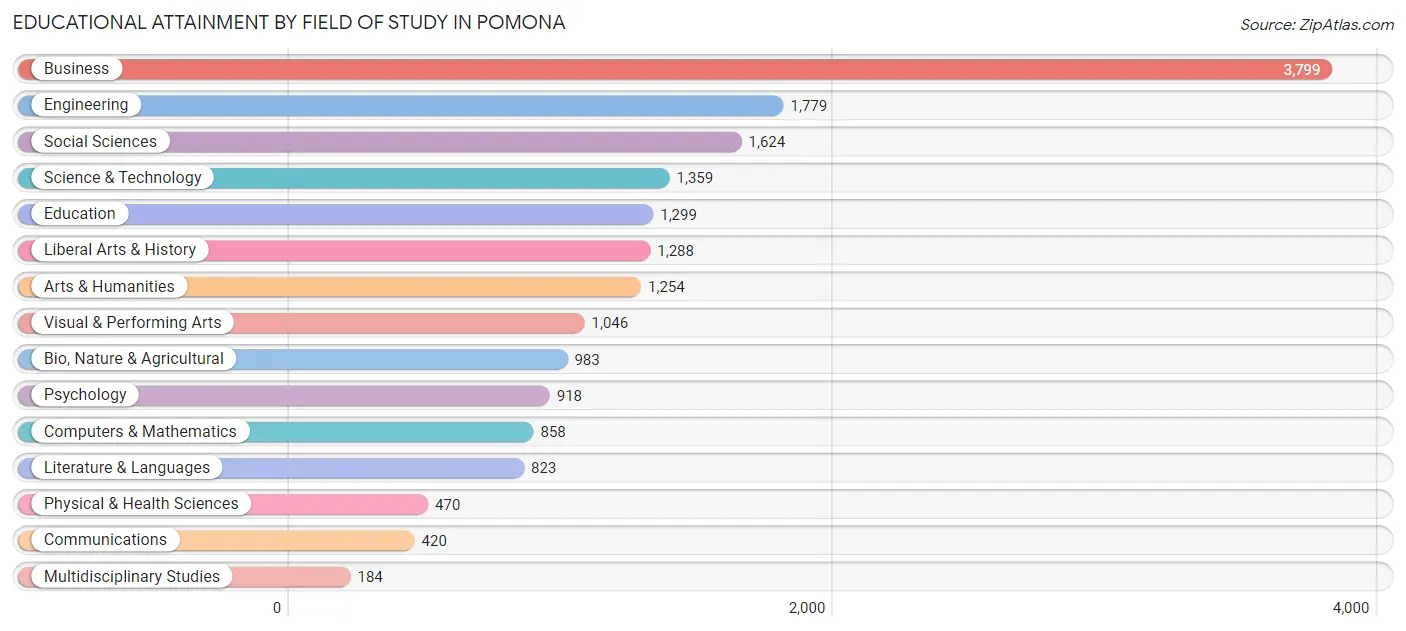
| Field of Study | # Graduates | % Graduates |
| Computers & Mathematics | 858 | 4.7% |
| Bio, Nature & Agricultural | 983 | 5.4% |
| Physical & Health Sciences | 470 | 2.6% |
| Psychology | 918 | 5.1% |
| Social Sciences | 1,624 | 9.0% |
| Engineering | 1,779 | 9.8% |
| Multidisciplinary Studies | 184 | 1.0% |
| Science & Technology | 1,359 | 7.5% |
| Business | 3,799 | 21.0% |
| Education | 1,299 | 7.2% |
| Literature & Languages | 823 | 4.5% |
| Liberal Arts & History | 1,288 | 7.1% |
| Visual & Performing Arts | 1,046 | 5.8% |
| Communications | 420 | 2.3% |
| Arts & Humanities | 1,254 | 6.9% |
| Total | 18,104 | 100.0% |
Transportation & Commute in Pomona
Vehicle Availability by Sex in Pomona
The most prevalent vehicle ownership categories in Pomona are males with 2 vehicles (11,514, accounting for 30.9%) and females with 2 vehicles (8,604, making up 39.6%).
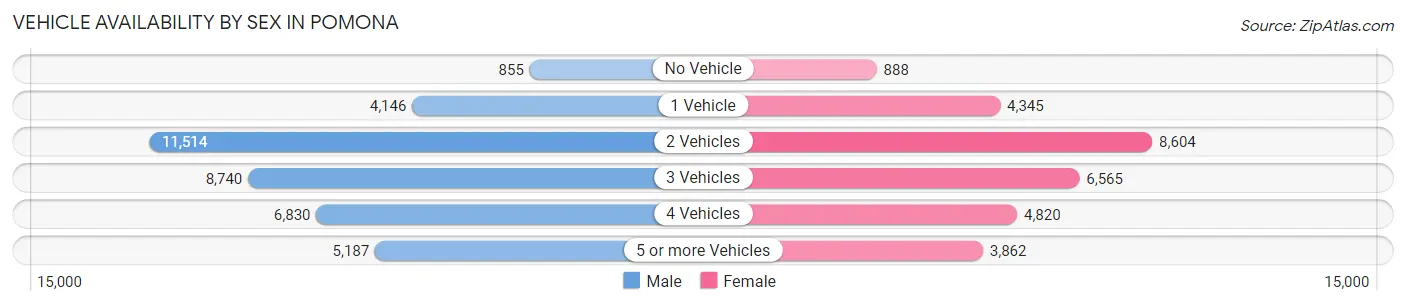
| Vehicles Available | Male | Female |
| No Vehicle | 855 (2.3%) | 888 (3.0%) |
| 1 Vehicle | 4,146 (11.1%) | 4,345 (14.9%) |
| 2 Vehicles | 11,514 (30.9%) | 8,604 (29.6%) |
| 3 Vehicles | 8,740 (23.4%) | 6,565 (22.6%) |
| 4 Vehicles | 6,830 (18.3%) | 4,820 (16.6%) |
| 5 or more Vehicles | 5,187 (13.9%) | 3,862 (13.3%) |
| Total | 37,272 (100.0%) | 29,084 (100.0%) |
Commute Time in Pomona
The most frequently occuring commute durations in Pomona are 30 to 34 minutes (10,037 commuters, 16.2%), 15 to 19 minutes (8,266 commuters, 13.3%), and 20 to 24 minutes (7,784 commuters, 12.5%).
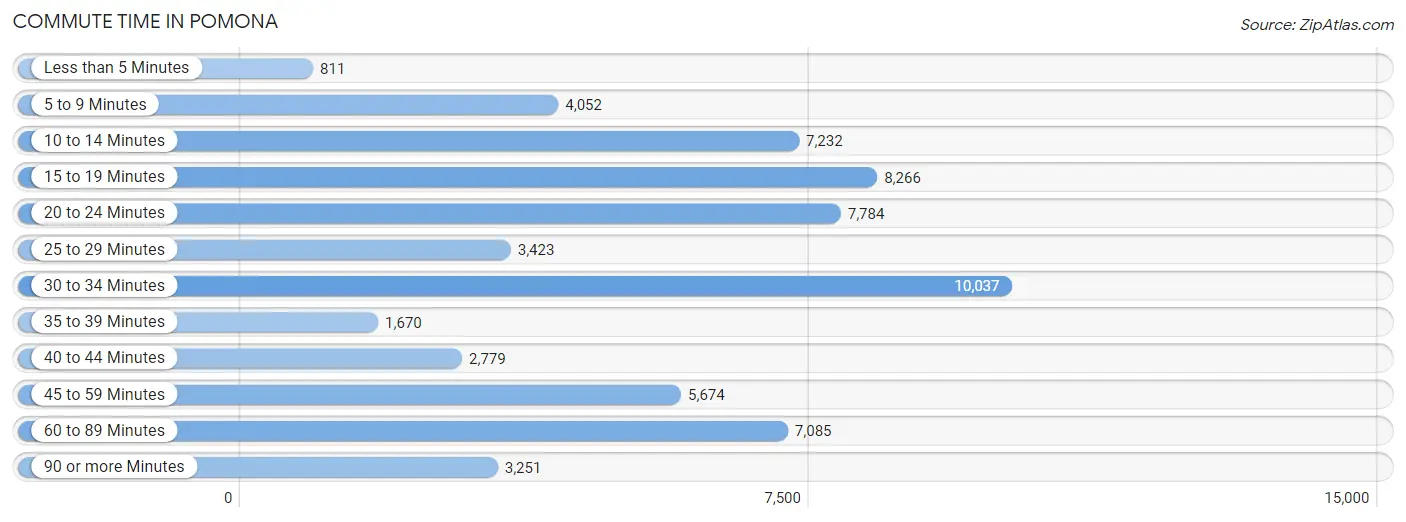
| Commute Time | # Commuters | % Commuters |
| Less than 5 Minutes | 811 | 1.3% |
| 5 to 9 Minutes | 4,052 | 6.5% |
| 10 to 14 Minutes | 7,232 | 11.7% |
| 15 to 19 Minutes | 8,266 | 13.3% |
| 20 to 24 Minutes | 7,784 | 12.5% |
| 25 to 29 Minutes | 3,423 | 5.5% |
| 30 to 34 Minutes | 10,037 | 16.2% |
| 35 to 39 Minutes | 1,670 | 2.7% |
| 40 to 44 Minutes | 2,779 | 4.5% |
| 45 to 59 Minutes | 5,674 | 9.1% |
| 60 to 89 Minutes | 7,085 | 11.4% |
| 90 or more Minutes | 3,251 | 5.2% |
Commute Time by Sex in Pomona
The most common commute times in Pomona are 30 to 34 minutes (5,917 commuters, 16.8%) for males and 30 to 34 minutes (4,120 commuters, 15.4%) for females.
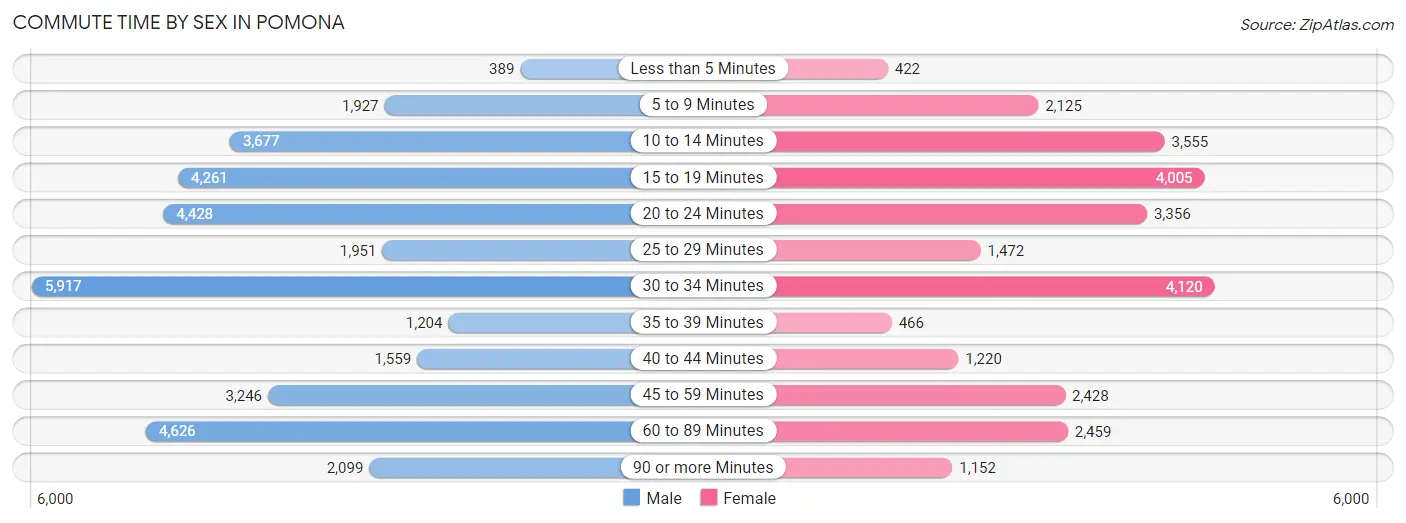
| Commute Time | Male | Female |
| Less than 5 Minutes | 389 (1.1%) | 422 (1.6%) |
| 5 to 9 Minutes | 1,927 (5.5%) | 2,125 (7.9%) |
| 10 to 14 Minutes | 3,677 (10.4%) | 3,555 (13.3%) |
| 15 to 19 Minutes | 4,261 (12.1%) | 4,005 (15.0%) |
| 20 to 24 Minutes | 4,428 (12.6%) | 3,356 (12.5%) |
| 25 to 29 Minutes | 1,951 (5.5%) | 1,472 (5.5%) |
| 30 to 34 Minutes | 5,917 (16.8%) | 4,120 (15.4%) |
| 35 to 39 Minutes | 1,204 (3.4%) | 466 (1.7%) |
| 40 to 44 Minutes | 1,559 (4.4%) | 1,220 (4.6%) |
| 45 to 59 Minutes | 3,246 (9.2%) | 2,428 (9.1%) |
| 60 to 89 Minutes | 4,626 (13.1%) | 2,459 (9.2%) |
| 90 or more Minutes | 2,099 (5.9%) | 1,152 (4.3%) |
Time of Departure to Work by Sex in Pomona
The most frequent times of departure to work in Pomona are 12:00 AM to 4:59 AM (4,935, 14.0%) for males and 7:00 AM to 7:29 AM (3,282, 12.3%) for females.
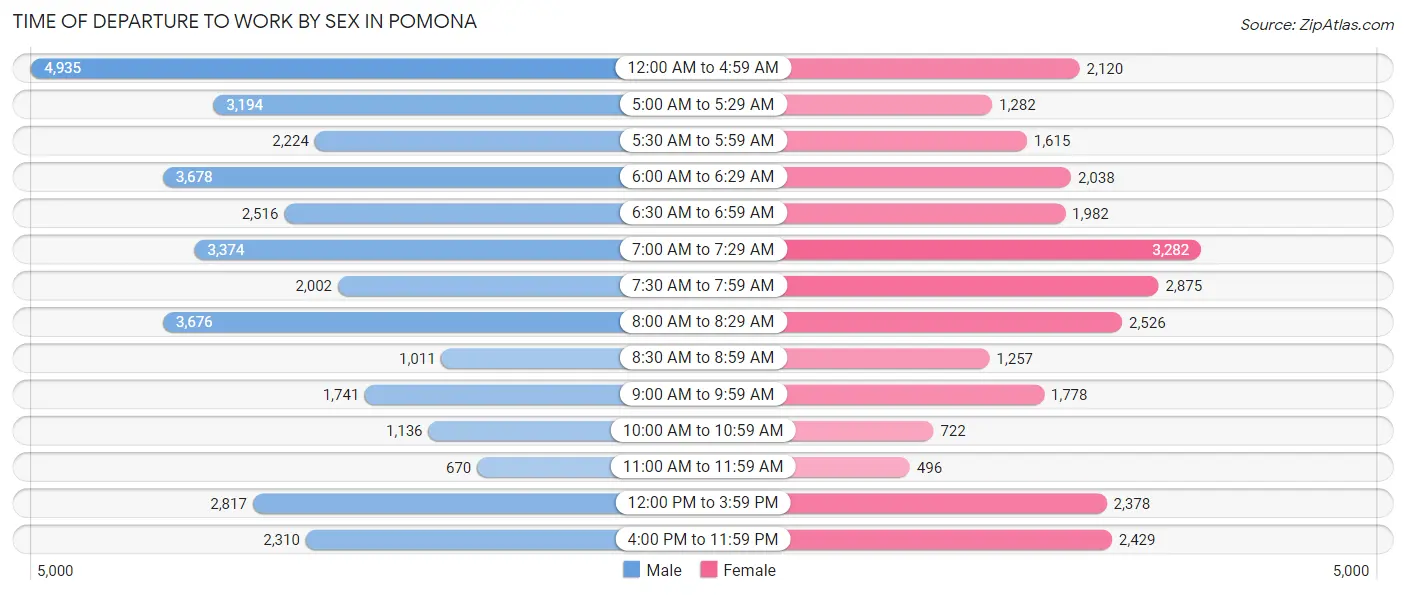
| Time of Departure | Male | Female |
| 12:00 AM to 4:59 AM | 4,935 (14.0%) | 2,120 (7.9%) |
| 5:00 AM to 5:29 AM | 3,194 (9.0%) | 1,282 (4.8%) |
| 5:30 AM to 5:59 AM | 2,224 (6.3%) | 1,615 (6.0%) |
| 6:00 AM to 6:29 AM | 3,678 (10.4%) | 2,038 (7.6%) |
| 6:30 AM to 6:59 AM | 2,516 (7.1%) | 1,982 (7.4%) |
| 7:00 AM to 7:29 AM | 3,374 (9.6%) | 3,282 (12.3%) |
| 7:30 AM to 7:59 AM | 2,002 (5.7%) | 2,875 (10.7%) |
| 8:00 AM to 8:29 AM | 3,676 (10.4%) | 2,526 (9.4%) |
| 8:30 AM to 8:59 AM | 1,011 (2.9%) | 1,257 (4.7%) |
| 9:00 AM to 9:59 AM | 1,741 (4.9%) | 1,778 (6.6%) |
| 10:00 AM to 10:59 AM | 1,136 (3.2%) | 722 (2.7%) |
| 11:00 AM to 11:59 AM | 670 (1.9%) | 496 (1.8%) |
| 12:00 PM to 3:59 PM | 2,817 (8.0%) | 2,378 (8.9%) |
| 4:00 PM to 11:59 PM | 2,310 (6.6%) | 2,429 (9.1%) |
| Total | 35,284 (100.0%) | 26,780 (100.0%) |
Housing Occupancy in Pomona
Occupancy by Ownership in Pomona
Of the total 41,438 dwellings in Pomona, owner-occupied units account for 22,327 (53.9%), while renter-occupied units make up 19,111 (46.1%).
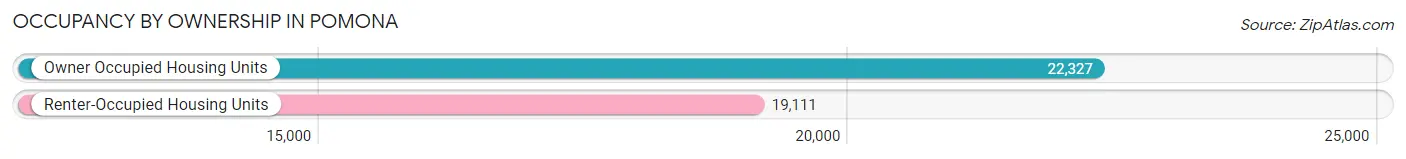
| Occupancy | # Housing Units | % Housing Units |
| Owner Occupied Housing Units | 22,327 | 53.9% |
| Renter-Occupied Housing Units | 19,111 | 46.1% |
| Total Occupied Housing Units | 41,438 | 100.0% |
Occupancy by Household Size in Pomona
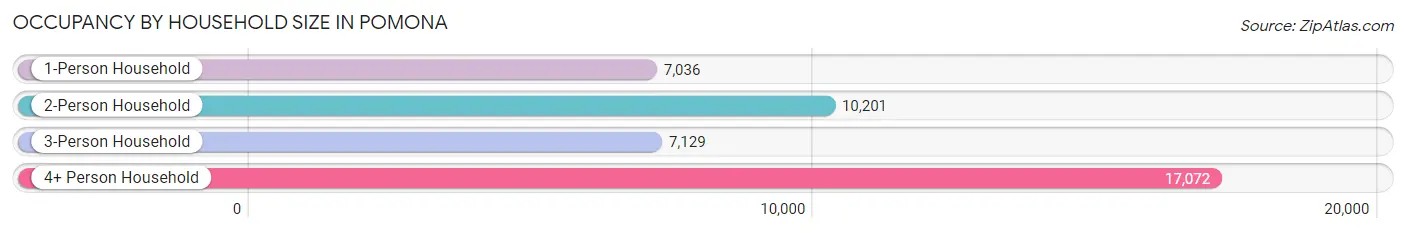
| Household Size | # Housing Units | % Housing Units |
| 1-Person Household | 7,036 | 17.0% |
| 2-Person Household | 10,201 | 24.6% |
| 3-Person Household | 7,129 | 17.2% |
| 4+ Person Household | 17,072 | 41.2% |
| Total Housing Units | 41,438 | 100.0% |
Occupancy by Ownership by Household Size in Pomona
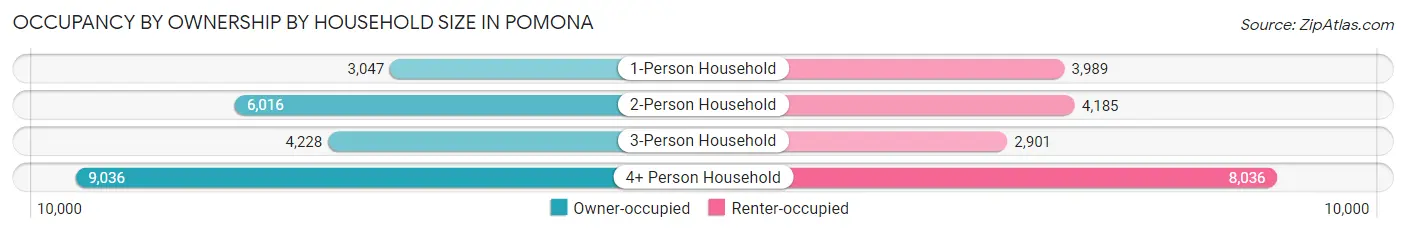
| Household Size | Owner-occupied | Renter-occupied |
| 1-Person Household | 3,047 (43.3%) | 3,989 (56.7%) |
| 2-Person Household | 6,016 (59.0%) | 4,185 (41.0%) |
| 3-Person Household | 4,228 (59.3%) | 2,901 (40.7%) |
| 4+ Person Household | 9,036 (52.9%) | 8,036 (47.1%) |
| Total Housing Units | 22,327 (53.9%) | 19,111 (46.1%) |
Occupancy by Educational Attainment in Pomona
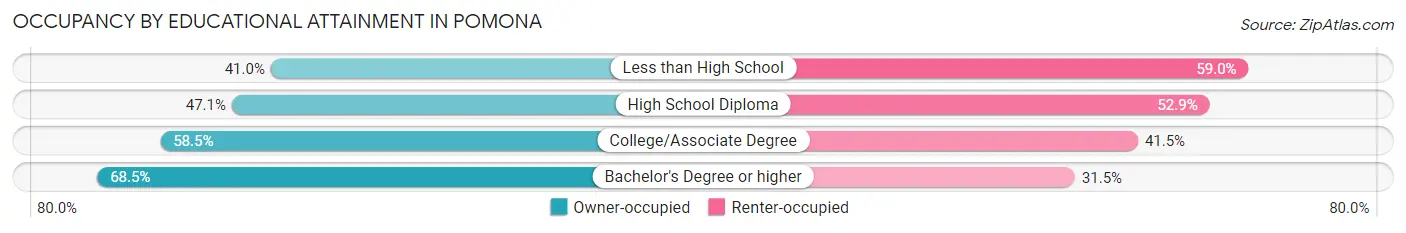
| Household Size | Owner-occupied | Renter-occupied |
| Less than High School | 4,083 (41.0%) | 5,885 (59.0%) |
| High School Diploma | 4,273 (47.1%) | 4,791 (52.9%) |
| College/Associate Degree | 8,029 (58.5%) | 5,700 (41.5%) |
| Bachelor's Degree or higher | 5,942 (68.5%) | 2,735 (31.5%) |
Occupancy by Age of Householder in Pomona
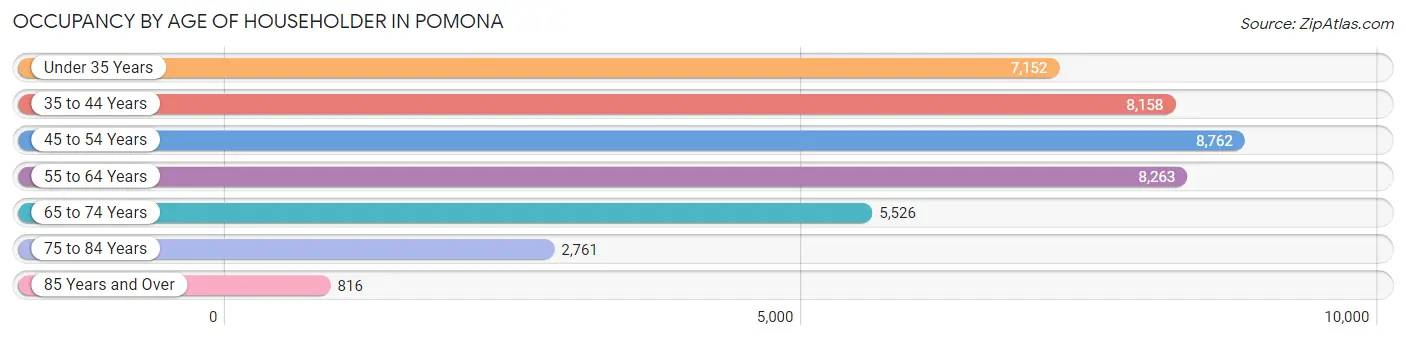
| Age Bracket | # Households | % Households |
| Under 35 Years | 7,152 | 17.3% |
| 35 to 44 Years | 8,158 | 19.7% |
| 45 to 54 Years | 8,762 | 21.1% |
| 55 to 64 Years | 8,263 | 19.9% |
| 65 to 74 Years | 5,526 | 13.3% |
| 75 to 84 Years | 2,761 | 6.7% |
| 85 Years and Over | 816 | 2.0% |
| Total | 41,438 | 100.0% |
Housing Finances in Pomona
Median Income by Occupancy in Pomona
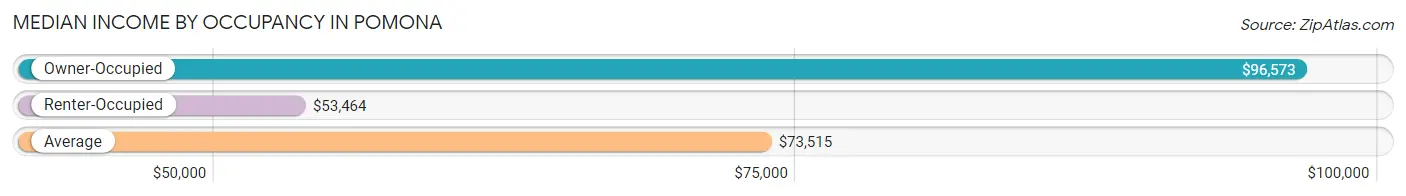
| Occupancy Type | # Households | Median Income |
| Owner-Occupied | 22,327 (53.9%) | $96,573 |
| Renter-Occupied | 19,111 (46.1%) | $53,464 |
| Average | 41,438 (100.0%) | $73,515 |
Occupancy by Householder Income Bracket in Pomona
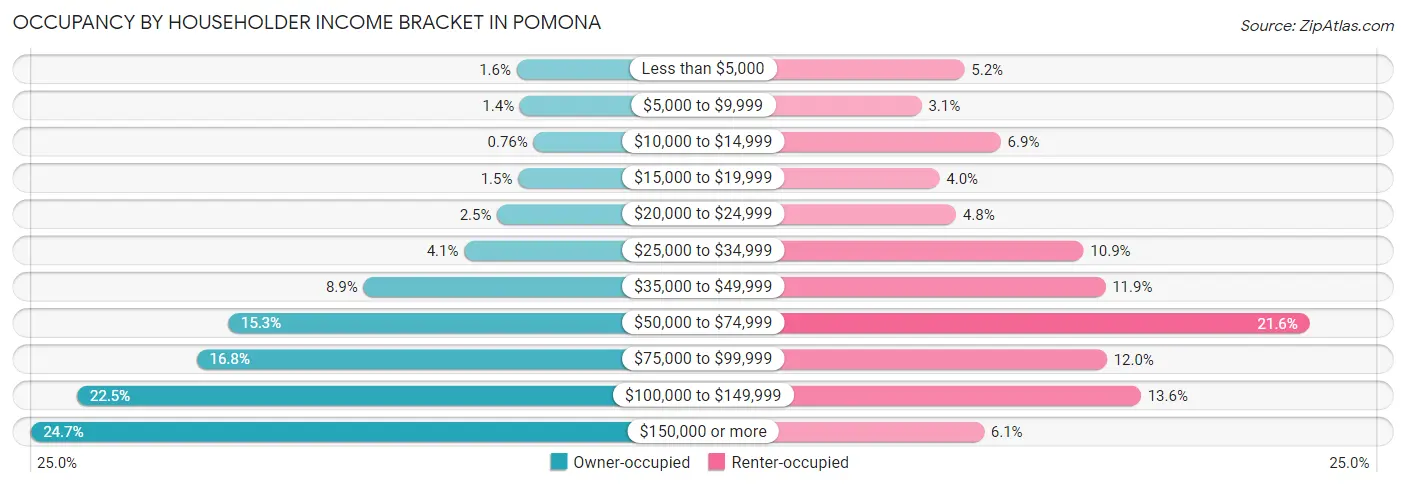
| Income Bracket | Owner-occupied | Renter-occupied |
| Less than $5,000 | 348 (1.6%) | 990 (5.2%) |
| $5,000 to $9,999 | 315 (1.4%) | 600 (3.1%) |
| $10,000 to $14,999 | 170 (0.8%) | 1,320 (6.9%) |
| $15,000 to $19,999 | 333 (1.5%) | 763 (4.0%) |
| $20,000 to $24,999 | 556 (2.5%) | 914 (4.8%) |
| $25,000 to $34,999 | 907 (4.1%) | 2,073 (10.8%) |
| $35,000 to $49,999 | 1,979 (8.9%) | 2,273 (11.9%) |
| $50,000 to $74,999 | 3,420 (15.3%) | 4,131 (21.6%) |
| $75,000 to $99,999 | 3,753 (16.8%) | 2,285 (12.0%) |
| $100,000 to $149,999 | 5,025 (22.5%) | 2,595 (13.6%) |
| $150,000 or more | 5,521 (24.7%) | 1,167 (6.1%) |
| Total | 22,327 (100.0%) | 19,111 (100.0%) |
Monthly Housing Cost Tiers in Pomona
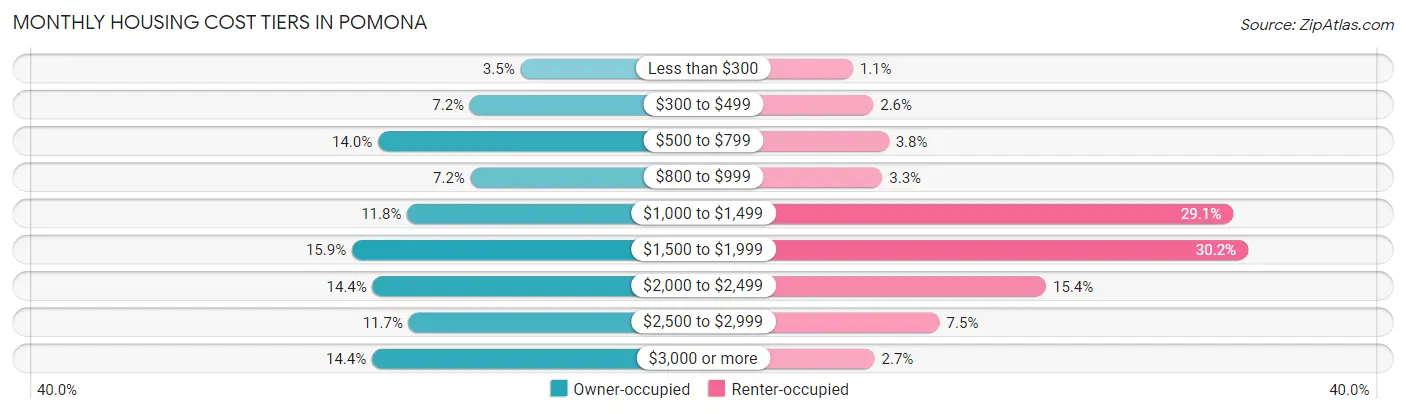
| Monthly Cost | Owner-occupied | Renter-occupied |
| Less than $300 | 776 (3.5%) | 215 (1.1%) |
| $300 to $499 | 1,608 (7.2%) | 504 (2.6%) |
| $500 to $799 | 3,118 (14.0%) | 722 (3.8%) |
| $800 to $999 | 1,597 (7.1%) | 632 (3.3%) |
| $1,000 to $1,499 | 2,640 (11.8%) | 5,567 (29.1%) |
| $1,500 to $1,999 | 3,548 (15.9%) | 5,777 (30.2%) |
| $2,000 to $2,499 | 3,209 (14.4%) | 2,937 (15.4%) |
| $2,500 to $2,999 | 2,614 (11.7%) | 1,439 (7.5%) |
| $3,000 or more | 3,217 (14.4%) | 523 (2.7%) |
| Total | 22,327 (100.0%) | 19,111 (100.0%) |
Physical Housing Characteristics in Pomona
Housing Structures in Pomona
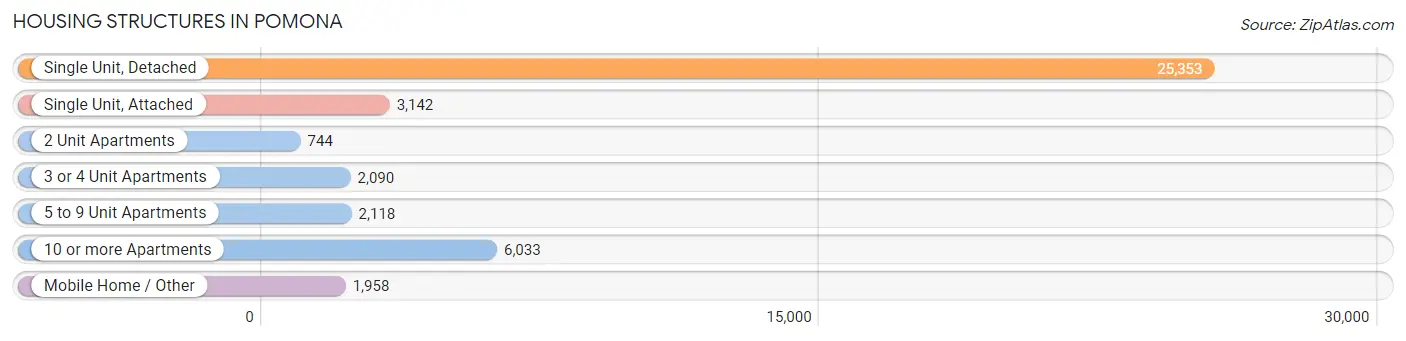
| Structure Type | # Housing Units | % Housing Units |
| Single Unit, Detached | 25,353 | 61.2% |
| Single Unit, Attached | 3,142 | 7.6% |
| 2 Unit Apartments | 744 | 1.8% |
| 3 or 4 Unit Apartments | 2,090 | 5.0% |
| 5 to 9 Unit Apartments | 2,118 | 5.1% |
| 10 or more Apartments | 6,033 | 14.6% |
| Mobile Home / Other | 1,958 | 4.7% |
| Total | 41,438 | 100.0% |
Housing Structures by Occupancy in Pomona
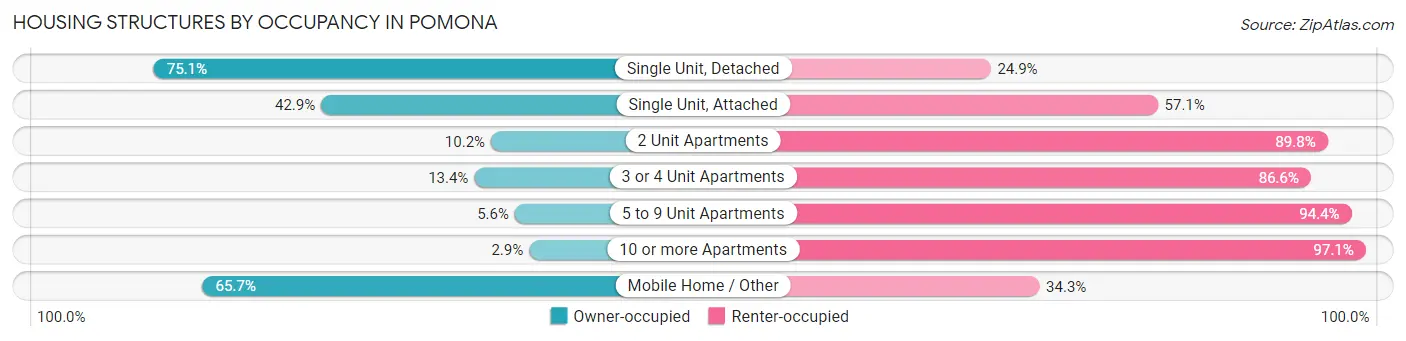
| Structure Type | Owner-occupied | Renter-occupied |
| Single Unit, Detached | 19,042 (75.1%) | 6,311 (24.9%) |
| Single Unit, Attached | 1,349 (42.9%) | 1,793 (57.1%) |
| 2 Unit Apartments | 76 (10.2%) | 668 (89.8%) |
| 3 or 4 Unit Apartments | 281 (13.4%) | 1,809 (86.6%) |
| 5 to 9 Unit Apartments | 119 (5.6%) | 1,999 (94.4%) |
| 10 or more Apartments | 173 (2.9%) | 5,860 (97.1%) |
| Mobile Home / Other | 1,287 (65.7%) | 671 (34.3%) |
| Total | 22,327 (53.9%) | 19,111 (46.1%) |
Housing Structures by Number of Rooms in Pomona
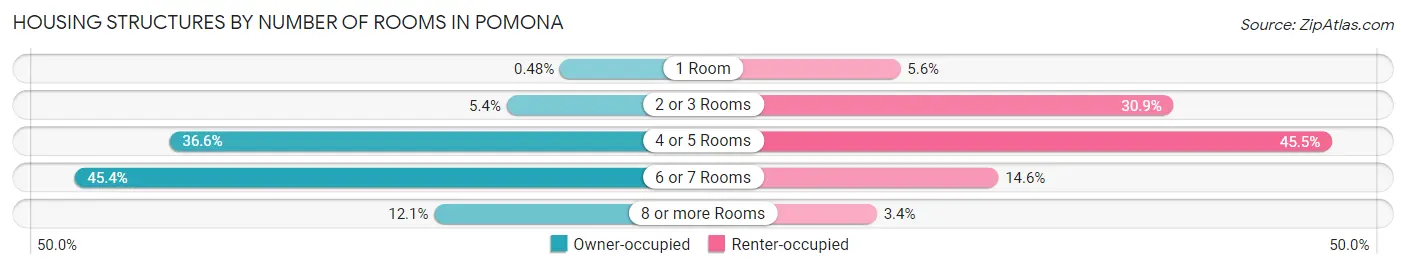
| Number of Rooms | Owner-occupied | Renter-occupied |
| 1 Room | 108 (0.5%) | 1,068 (5.6%) |
| 2 or 3 Rooms | 1,209 (5.4%) | 5,897 (30.9%) |
| 4 or 5 Rooms | 8,173 (36.6%) | 8,698 (45.5%) |
| 6 or 7 Rooms | 10,134 (45.4%) | 2,798 (14.6%) |
| 8 or more Rooms | 2,703 (12.1%) | 650 (3.4%) |
| Total | 22,327 (100.0%) | 19,111 (100.0%) |
Housing Structure by Heating Type in Pomona
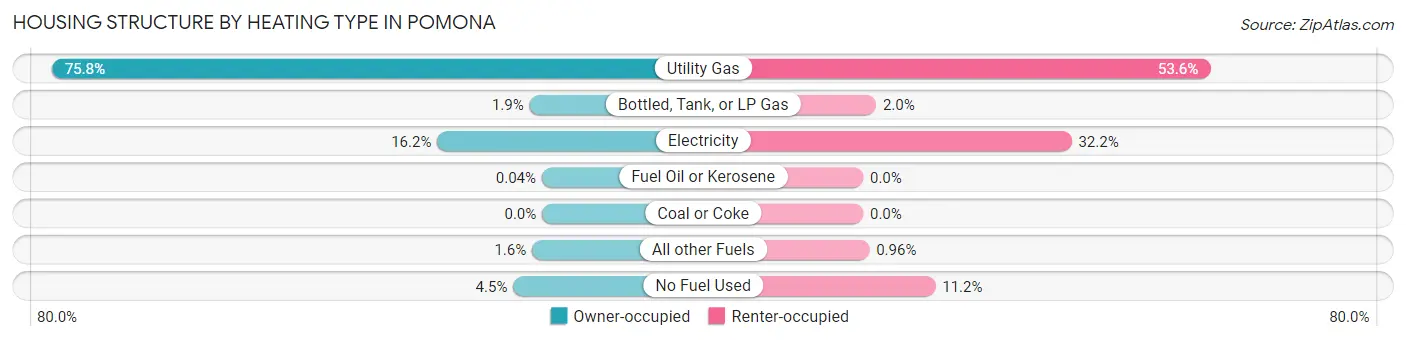
| Heating Type | Owner-occupied | Renter-occupied |
| Utility Gas | 16,924 (75.8%) | 10,252 (53.6%) |
| Bottled, Tank, or LP Gas | 433 (1.9%) | 382 (2.0%) |
| Electricity | 3,619 (16.2%) | 6,158 (32.2%) |
| Fuel Oil or Kerosene | 8 (0.0%) | 0 (0.0%) |
| Coal or Coke | 0 (0.0%) | 0 (0.0%) |
| All other Fuels | 347 (1.5%) | 184 (1.0%) |
| No Fuel Used | 996 (4.5%) | 2,135 (11.2%) |
| Total | 22,327 (100.0%) | 19,111 (100.0%) |
Household Vehicle Usage in Pomona
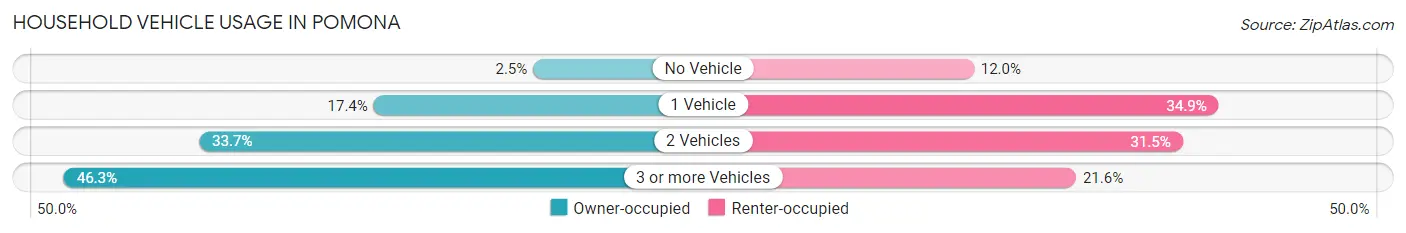
| Vehicles per Household | Owner-occupied | Renter-occupied |
| No Vehicle | 564 (2.5%) | 2,299 (12.0%) |
| 1 Vehicle | 3,890 (17.4%) | 6,665 (34.9%) |
| 2 Vehicles | 7,527 (33.7%) | 6,024 (31.5%) |
| 3 or more Vehicles | 10,346 (46.3%) | 4,123 (21.6%) |
| Total | 22,327 (100.0%) | 19,111 (100.0%) |
Real Estate & Mortgages in Pomona
Real Estate and Mortgage Overview in Pomona
| Characteristic | Without Mortgage | With Mortgage |
| Housing Units | 7,543 | 14,784 |
| Median Property Value | $483,200 | $544,600 |
| Median Household Income | $81,685 | $4,343 |
| Monthly Housing Costs | $628 | $3,210 |
| Real Estate Taxes | $2,701 | $204 |
Property Value by Mortgage Status in Pomona
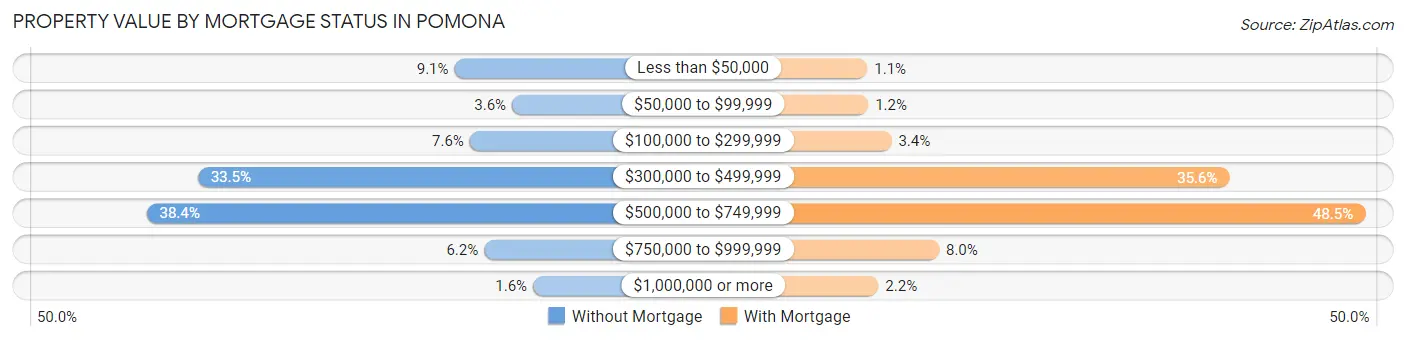
| Property Value | Without Mortgage | With Mortgage |
| Less than $50,000 | 684 (9.1%) | 166 (1.1%) |
| $50,000 to $99,999 | 271 (3.6%) | 179 (1.2%) |
| $100,000 to $299,999 | 574 (7.6%) | 505 (3.4%) |
| $300,000 to $499,999 | 2,528 (33.5%) | 5,262 (35.6%) |
| $500,000 to $749,999 | 2,895 (38.4%) | 7,173 (48.5%) |
| $750,000 to $999,999 | 471 (6.2%) | 1,176 (8.0%) |
| $1,000,000 or more | 120 (1.6%) | 323 (2.2%) |
| Total | 7,543 (100.0%) | 14,784 (100.0%) |
Household Income by Mortgage Status in Pomona
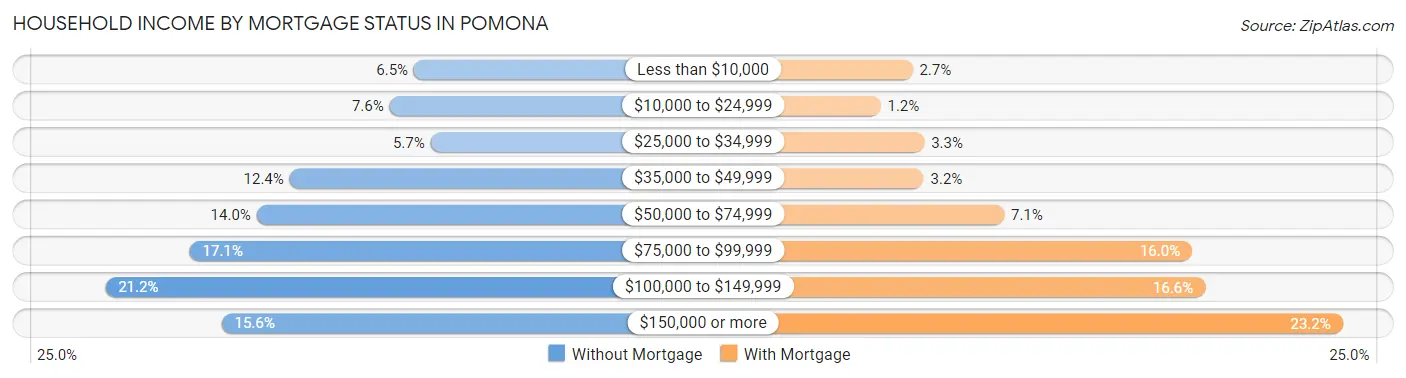
| Household Income | Without Mortgage | With Mortgage |
| Less than $10,000 | 487 (6.5%) | 401 (2.7%) |
| $10,000 to $24,999 | 575 (7.6%) | 176 (1.2%) |
| $25,000 to $34,999 | 428 (5.7%) | 484 (3.3%) |
| $35,000 to $49,999 | 934 (12.4%) | 479 (3.2%) |
| $50,000 to $74,999 | 1,052 (14.0%) | 1,045 (7.1%) |
| $75,000 to $99,999 | 1,293 (17.1%) | 2,368 (16.0%) |
| $100,000 to $149,999 | 1,596 (21.2%) | 2,460 (16.6%) |
| $150,000 or more | 1,178 (15.6%) | 3,429 (23.2%) |
| Total | 7,543 (100.0%) | 14,784 (100.0%) |
Property Value to Household Income Ratio in Pomona
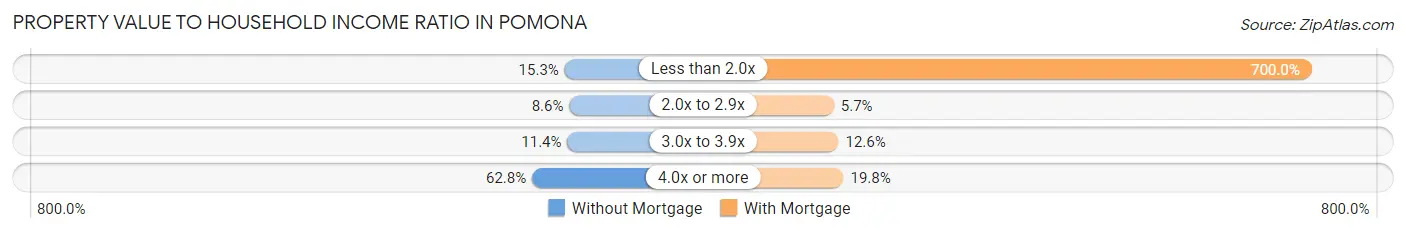
| Value-to-Income Ratio | Without Mortgage | With Mortgage |
| Less than 2.0x | 1,157 (15.3%) | 103,486 (700.0%) |
| 2.0x to 2.9x | 646 (8.6%) | 843 (5.7%) |
| 3.0x to 3.9x | 862 (11.4%) | 1,856 (12.6%) |
| 4.0x or more | 4,733 (62.7%) | 2,932 (19.8%) |
| Total | 7,543 (100.0%) | 14,784 (100.0%) |
Real Estate Taxes by Mortgage Status in Pomona
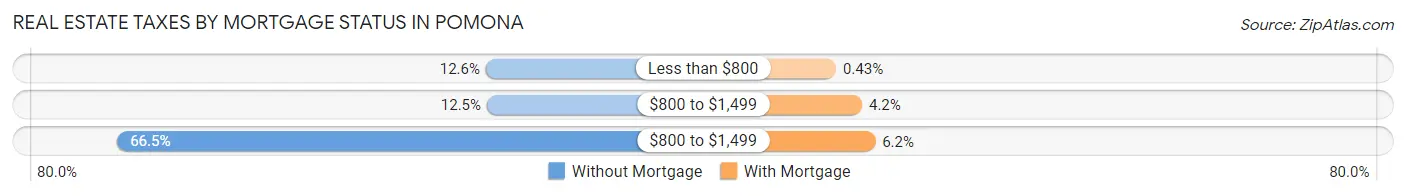
| Property Taxes | Without Mortgage | With Mortgage |
| Less than $800 | 951 (12.6%) | 63 (0.4%) |
| $800 to $1,499 | 940 (12.5%) | 627 (4.2%) |
| $800 to $1,499 | 5,013 (66.5%) | 911 (6.2%) |
| Total | 7,543 (100.0%) | 14,784 (100.0%) |
Health & Disability in Pomona
Health Insurance Coverage by Age in Pomona
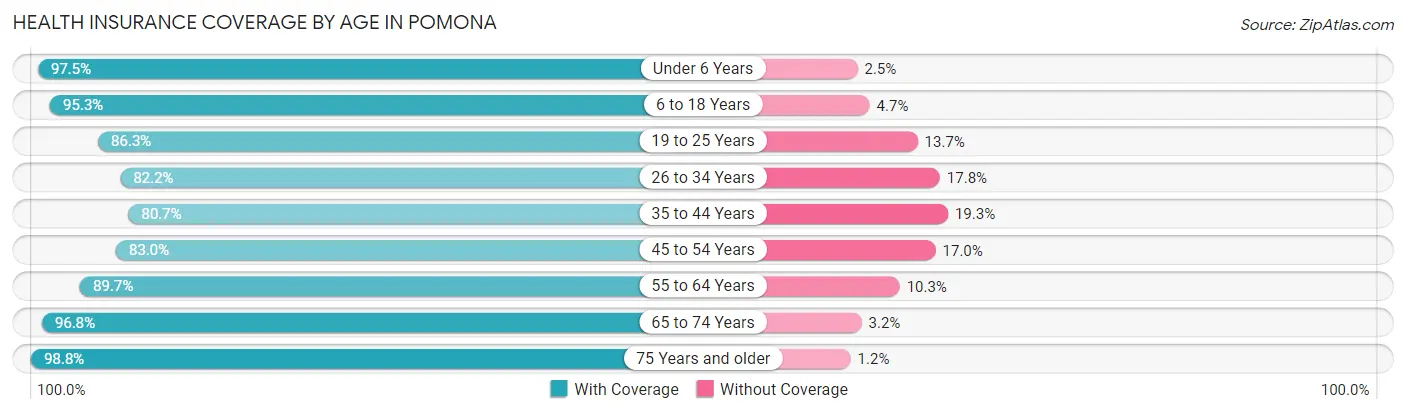
| Age Bracket | With Coverage | Without Coverage |
| Under 6 Years | 10,942 (97.5%) | 277 (2.5%) |
| 6 to 18 Years | 26,818 (95.3%) | 1,332 (4.7%) |
| 19 to 25 Years | 15,029 (86.3%) | 2,381 (13.7%) |
| 26 to 34 Years | 15,705 (82.2%) | 3,407 (17.8%) |
| 35 to 44 Years | 16,004 (80.7%) | 3,837 (19.3%) |
| 45 to 54 Years | 16,163 (83.0%) | 3,317 (17.0%) |
| 55 to 64 Years | 14,142 (89.7%) | 1,629 (10.3%) |
| 65 to 74 Years | 10,079 (96.8%) | 336 (3.2%) |
| 75 Years and older | 6,751 (98.8%) | 81 (1.2%) |
| Total | 131,633 (88.8%) | 16,597 (11.2%) |
Health Insurance Coverage by Citizenship Status in Pomona
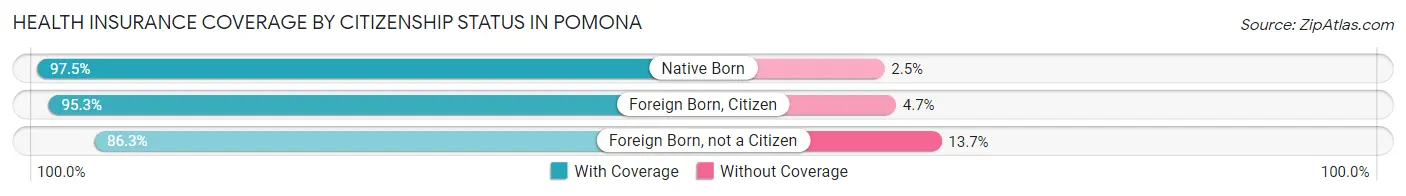
| Citizenship Status | With Coverage | Without Coverage |
| Native Born | 10,942 (97.5%) | 277 (2.5%) |
| Foreign Born, Citizen | 26,818 (95.3%) | 1,332 (4.7%) |
| Foreign Born, not a Citizen | 15,029 (86.3%) | 2,381 (13.7%) |
Health Insurance Coverage by Household Income in Pomona
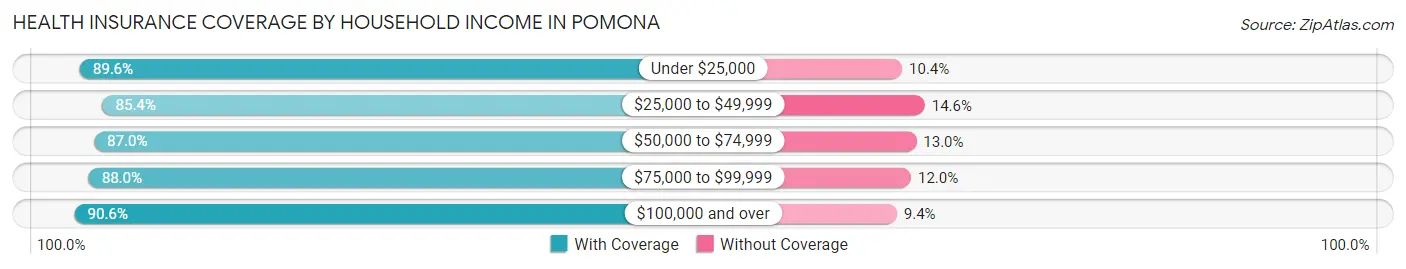
| Household Income | With Coverage | Without Coverage |
| Under $25,000 | 12,393 (89.6%) | 1,432 (10.4%) |
| $25,000 to $49,999 | 19,189 (85.4%) | 3,287 (14.6%) |
| $50,000 to $74,999 | 21,961 (87.0%) | 3,291 (13.0%) |
| $75,000 to $99,999 | 20,114 (88.0%) | 2,752 (12.0%) |
| $100,000 and over | 55,001 (90.6%) | 5,692 (9.4%) |
Public vs Private Health Insurance Coverage by Age in Pomona
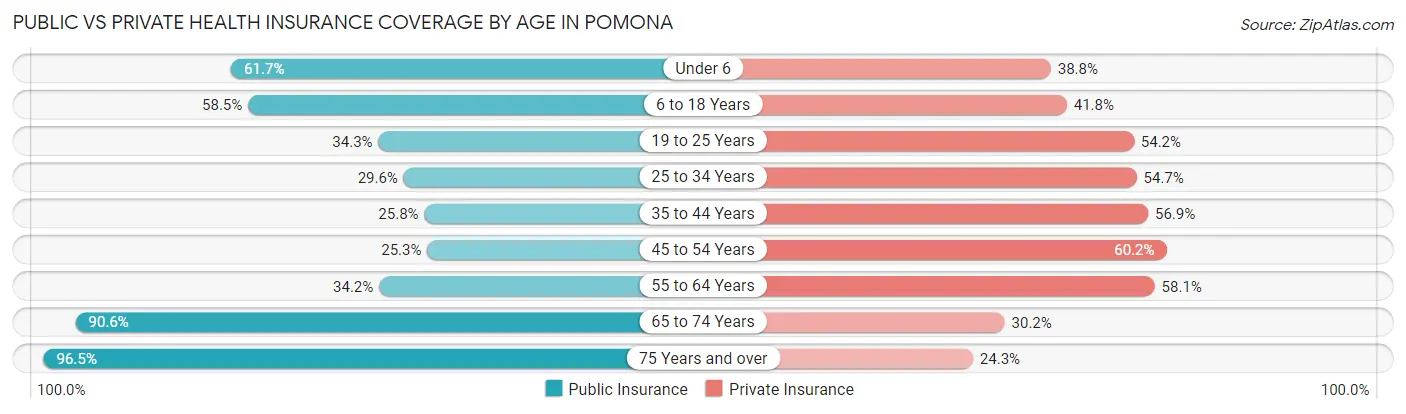
| Age Bracket | Public Insurance | Private Insurance |
| Under 6 | 6,920 (61.7%) | 4,353 (38.8%) |
| 6 to 18 Years | 16,470 (58.5%) | 11,756 (41.8%) |
| 19 to 25 Years | 5,976 (34.3%) | 9,438 (54.2%) |
| 25 to 34 Years | 5,662 (29.6%) | 10,458 (54.7%) |
| 35 to 44 Years | 5,117 (25.8%) | 11,279 (56.9%) |
| 45 to 54 Years | 4,920 (25.3%) | 11,734 (60.2%) |
| 55 to 64 Years | 5,393 (34.2%) | 9,159 (58.1%) |
| 65 to 74 Years | 9,432 (90.6%) | 3,147 (30.2%) |
| 75 Years and over | 6,592 (96.5%) | 1,663 (24.3%) |
| Total | 66,482 (44.9%) | 72,987 (49.2%) |
Disability Status by Sex by Age in Pomona
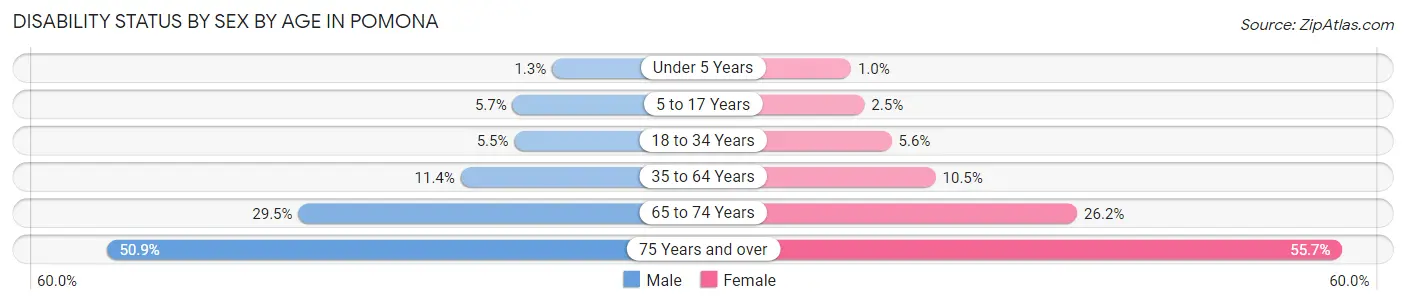
| Age Bracket | Male | Female |
| Under 5 Years | 61 (1.3%) | 48 (1.0%) |
| 5 to 17 Years | 727 (5.7%) | 351 (2.5%) |
| 18 to 34 Years | 1,120 (5.5%) | 1,056 (5.6%) |
| 35 to 64 Years | 3,120 (11.4%) | 2,906 (10.4%) |
| 65 to 74 Years | 1,467 (29.5%) | 1,427 (26.2%) |
| 75 Years and over | 1,277 (50.9%) | 2,409 (55.7%) |
Disability Class by Sex by Age in Pomona
Disability Class: Hearing Difficulty
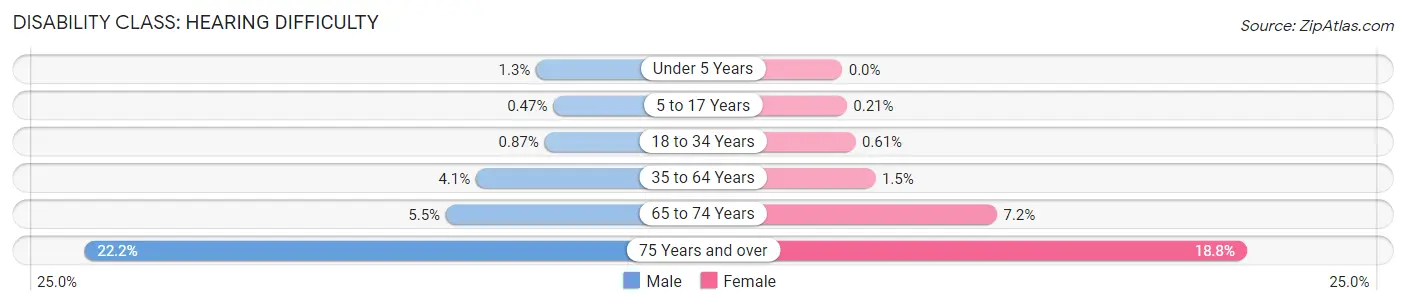
| Age Bracket | Male | Female |
| Under 5 Years | 61 (1.3%) | 0 (0.0%) |
| 5 to 17 Years | 60 (0.5%) | 29 (0.2%) |
| 18 to 34 Years | 178 (0.9%) | 116 (0.6%) |
| 35 to 64 Years | 1,104 (4.1%) | 427 (1.5%) |
| 65 to 74 Years | 271 (5.4%) | 391 (7.2%) |
| 75 Years and over | 558 (22.2%) | 812 (18.8%) |
Disability Class: Vision Difficulty
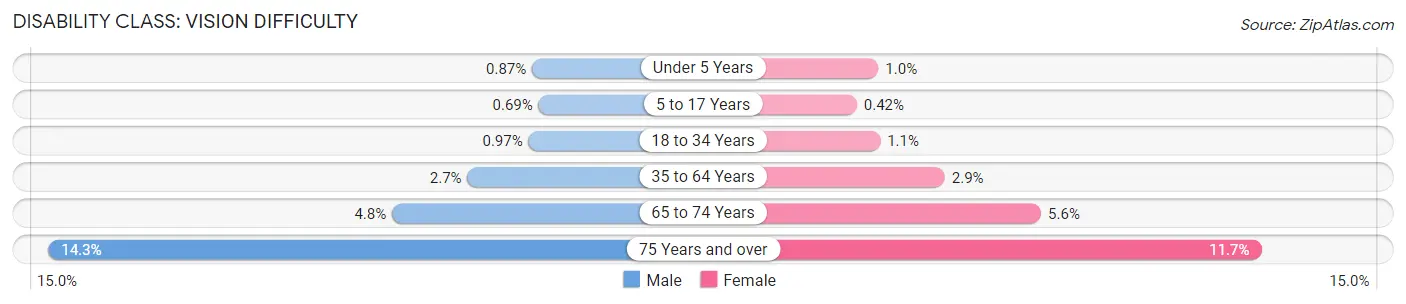
| Age Bracket | Male | Female |
| Under 5 Years | 42 (0.9%) | 48 (1.0%) |
| 5 to 17 Years | 89 (0.7%) | 58 (0.4%) |
| 18 to 34 Years | 199 (1.0%) | 204 (1.1%) |
| 35 to 64 Years | 729 (2.7%) | 798 (2.9%) |
| 65 to 74 Years | 237 (4.8%) | 302 (5.6%) |
| 75 Years and over | 360 (14.3%) | 505 (11.7%) |
Disability Class: Cognitive Difficulty
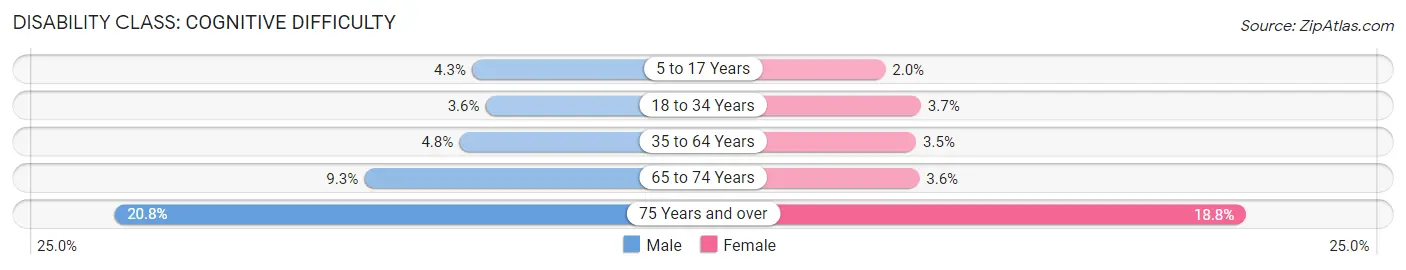
| Age Bracket | Male | Female |
| 5 to 17 Years | 546 (4.3%) | 282 (2.0%) |
| 18 to 34 Years | 743 (3.6%) | 698 (3.7%) |
| 35 to 64 Years | 1,319 (4.8%) | 959 (3.5%) |
| 65 to 74 Years | 460 (9.2%) | 196 (3.6%) |
| 75 Years and over | 523 (20.8%) | 811 (18.8%) |
Disability Class: Ambulatory Difficulty
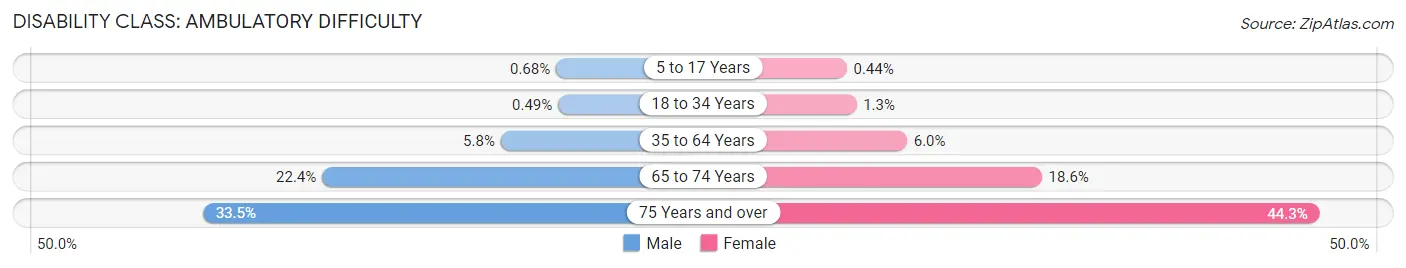
| Age Bracket | Male | Female |
| 5 to 17 Years | 88 (0.7%) | 61 (0.4%) |
| 18 to 34 Years | 101 (0.5%) | 255 (1.3%) |
| 35 to 64 Years | 1,584 (5.8%) | 1,677 (6.0%) |
| 65 to 74 Years | 1,113 (22.4%) | 1,010 (18.5%) |
| 75 Years and over | 840 (33.5%) | 1,916 (44.3%) |
Disability Class: Self-Care Difficulty
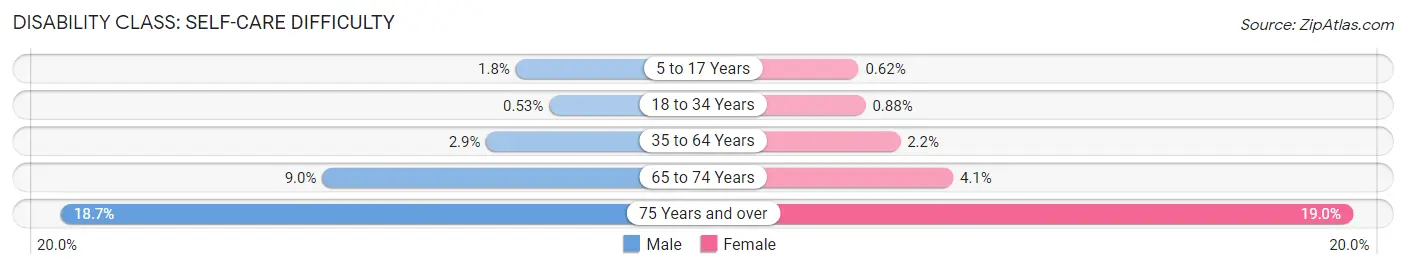
| Age Bracket | Male | Female |
| 5 to 17 Years | 227 (1.8%) | 86 (0.6%) |
| 18 to 34 Years | 109 (0.5%) | 168 (0.9%) |
| 35 to 64 Years | 779 (2.9%) | 604 (2.2%) |
| 65 to 74 Years | 445 (8.9%) | 225 (4.1%) |
| 75 Years and over | 468 (18.6%) | 820 (19.0%) |
Technology Access in Pomona
Computing Device Access in Pomona
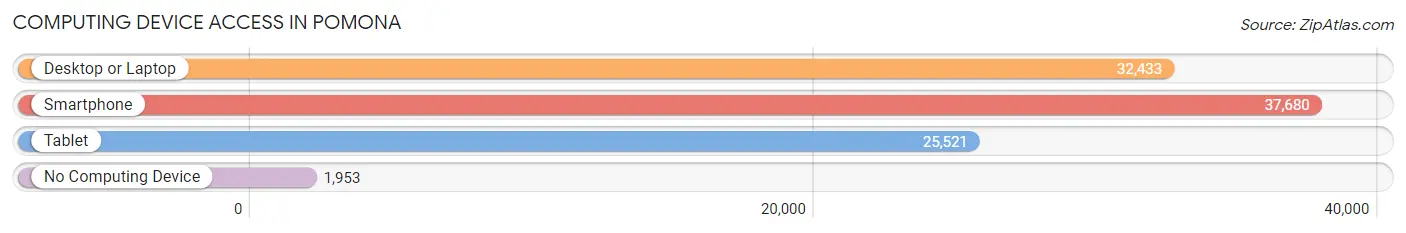
| Device Type | # Households | % Households |
| Desktop or Laptop | 32,433 | 78.3% |
| Smartphone | 37,680 | 90.9% |
| Tablet | 25,521 | 61.6% |
| No Computing Device | 1,953 | 4.7% |
| Total | 41,438 | 100.0% |
Internet Access in Pomona
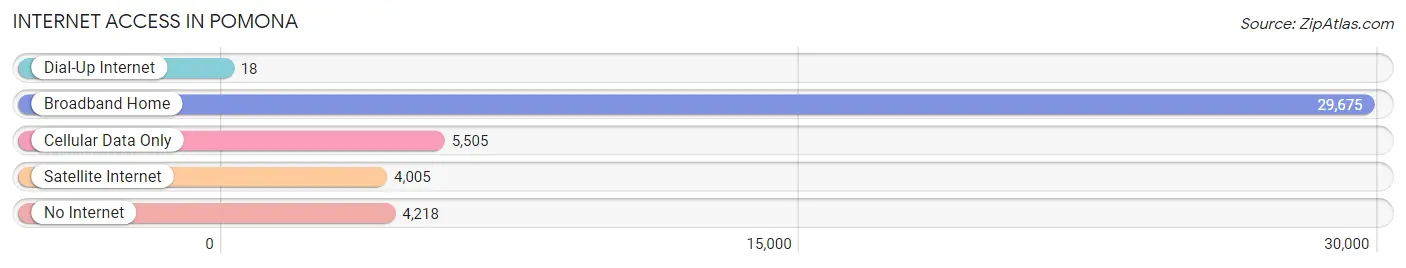
| Internet Type | # Households | % Households |
| Dial-Up Internet | 18 | 0.0% |
| Broadband Home | 29,675 | 71.6% |
| Cellular Data Only | 5,505 | 13.3% |
| Satellite Internet | 4,005 | 9.7% |
| No Internet | 4,218 | 10.2% |
| Total | 41,438 | 100.0% |
Pomona Summary
Pomona, California is a city located in Los Angeles County, California. It is situated in the Pomona Valley, between the San Gabriel Mountains and the San Bernardino Mountains. The city is approximately 30 miles east of downtown Los Angeles and is part of the Greater Los Angeles Area. As of the 2010 United States Census, the city had a population of 149,058, making it the second-largest city in Los Angeles County.
Geography
Pomona is located in the Pomona Valley, which is bordered by the San Gabriel Mountains to the north and the San Bernardino Mountains to the south. The city is approximately 30 miles east of downtown Los Angeles and is part of the Greater Los Angeles Area. The city is divided into several neighborhoods, including Downtown Pomona, Phillips Ranch, Ganesha Hills, and Phillips Ranch.
The city has a total area of 22.9 square miles, of which 22.7 square miles is land and 0.2 square miles is water. The city is located at an elevation of 830 feet above sea level.
Economy
Pomona is home to a diverse economy, with a variety of industries represented. The city is home to several major employers, including the Los Angeles County Fairplex, the California Polytechnic University Pomona, and the Pomona Valley Hospital Medical Center. The city is also home to several major retail centers, including the Westfield Shoppingtown Pomona, the Pomona Valley Mall, and the Pomona Valley Plaza.
Demographics
As of the 2010 United States Census, the city had a population of 149,058, making it the second-largest city in Los Angeles County. The population was spread out, with 33.3% under the age of 18, 11.2% from 18 to 24, 30.2% from 25 to 44, 17.7% from 45 to 64, and 7.6% who were 65 years of age or older. The median age was 28.7 years.
The racial makeup of the city was 44.3% White, 4.2% African American, 1.2% Native American, 8.2% Asian, 0.3% Pacific Islander, 36.2% from other races, and 5.6% from two or more races. Hispanic or Latino of any race were 63.7% of the population.
History
Pomona was founded in 1888 by Solomon Gates, a former Union Army officer. The city was named after the Roman goddess of fruit, Pomona. The city was incorporated in 1888 and has since grown to become the second-largest city in Los Angeles County.
Pomona has a long and rich history, with many of its historic buildings still standing today. The city is home to the historic Pomona Fox Theater, which was built in 1931 and is still in operation today. The city is also home to the historic Ganesha Park, which was established in 1887 and is the oldest park in Los Angeles County.
Pomona has experienced significant growth in recent years, with the population increasing by more than 10% between 2000 and 2010. The city is home to a diverse population, with a variety of cultures and backgrounds represented. The city is also home to a thriving economy, with a variety of industries represented.
Common Questions
What is Per Capita Income in Pomona?
Per Capita income in Pomona is $26,064.
What is the Median Family Income in Pomona?
Median Family Income in Pomona is $75,922.
What is the Median Household income in Pomona?
Median Household Income in Pomona is $73,515.
What is Income or Wage Gap in Pomona?
Income or Wage Gap in Pomona is 23.9%.
Women in Pomona earn 76.1 cents for every dollar earned by a man.
What is Family Income Deficit in Pomona?
Family Income Deficit in Pomona is $12,674.
Families that are below poverty line in Pomona earn $12,674 less on average than the poverty threshold level.
What is Inequality or Gini Index in Pomona?
Inequality or Gini Index in Pomona is 0.41.
What is the Total Population of Pomona?
Total Population of Pomona is 149,831.
What is the Total Male Population of Pomona?
Total Male Population of Pomona is 73,857.
What is the Total Female Population of Pomona?
Total Female Population of Pomona is 75,974.
What is the Ratio of Males per 100 Females in Pomona?
There are 97.21 Males per 100 Females in Pomona.
What is the Ratio of Females per 100 Males in Pomona?
There are 102.87 Females per 100 Males in Pomona.
What is the Median Population Age in Pomona?
Median Population Age in Pomona is 34.4 Years.
What is the Average Family Size in Pomona
Average Family Size in Pomona is 3.9 People.
What is the Average Household Size in Pomona
Average Household Size in Pomona is 3.5 People.
How Large is the Labor Force in Pomona?
There are 74,087 People in the Labor Forcein in Pomona.
What is the Percentage of People in the Labor Force in Pomona?
62.8% of People are in the Labor Force in Pomona.
What is the Unemployment Rate in Pomona?
Unemployment Rate in Pomona is 6.5%.