Cities with the Highest Percentage of Central American Population in Indiana
RELATED REPORTS & OPTIONS
Central American
Indiana
Compare Cities
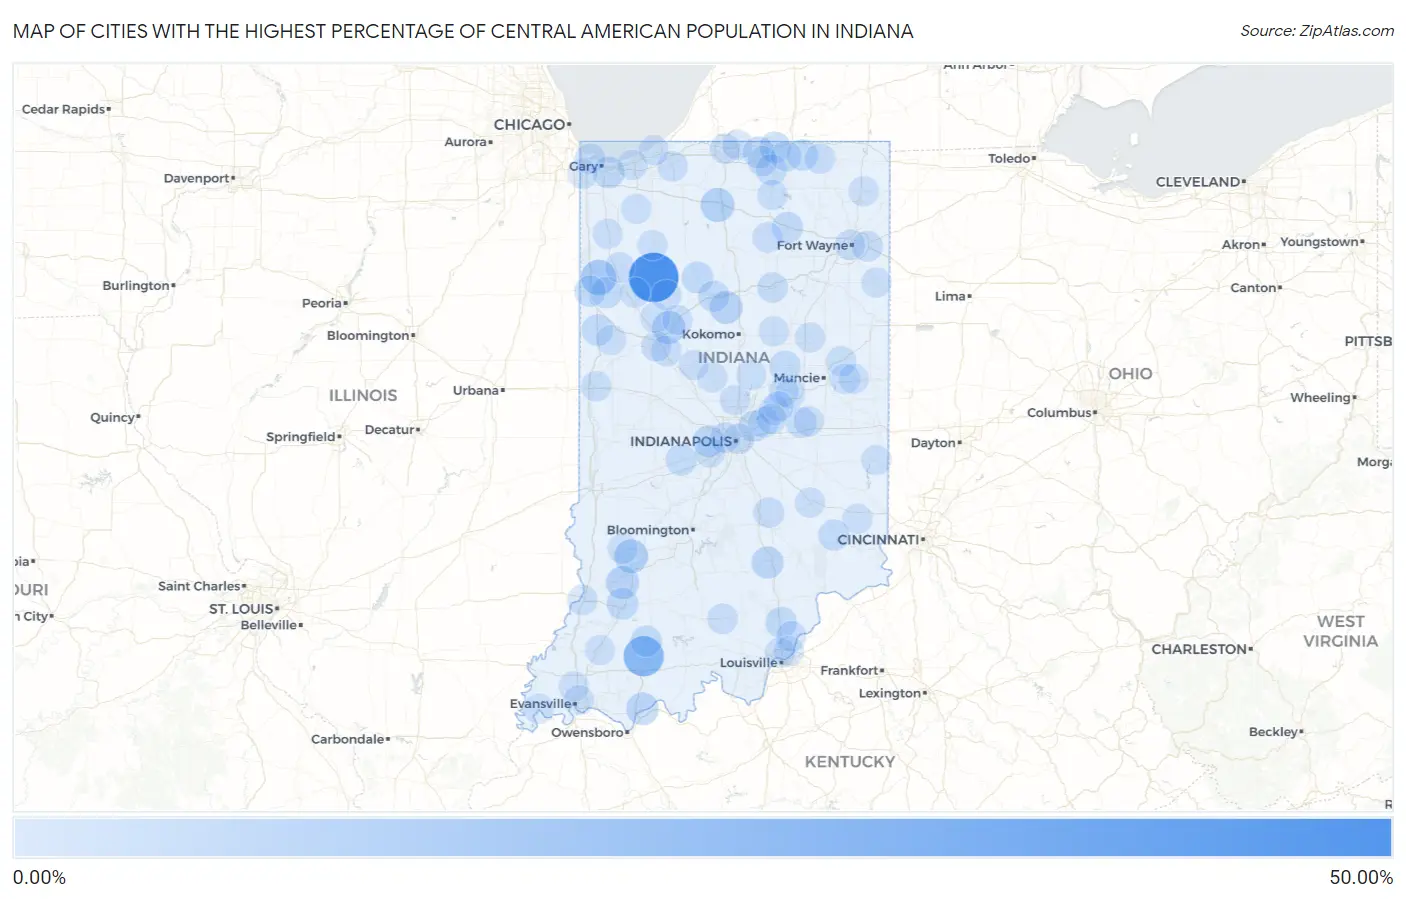
Map of Cities with the Highest Percentage of Central American Population in Indiana
0.00%
50.00%
Cities with the Highest Percentage of Central American Population in Indiana
| City | Central American | vs State | vs National | |
| 1. | Monon | 41.78% | 0.61%(+41.2)#1 | 1.81%(+40.0)#17 |
| 2. | Rockfield | 30.26% | 0.61%(+29.6)#2 | 1.81%(+28.5)#65 |
| 3. | Fair Oaks | 27.44% | 0.61%(+26.8)#3 | 1.81%(+25.6)#74 |
| 4. | Philadelphia | 24.75% | 0.61%(+24.1)#4 | 1.81%(+22.9)#100 |
| 5. | Huntingburg | 21.51% | 0.61%(+20.9)#5 | 1.81%(+19.7)#121 |
| 6. | Young America | 13.33% | 0.61%(+12.7)#6 | 1.81%(+11.5)#293 |
| 7. | Brook | 11.25% | 0.61%(+10.6)#7 | 1.81%(+9.44)#375 |
| 8. | Plymouth | 8.07% | 0.61%(+7.46)#8 | 1.81%(+6.26)#582 |
| 9. | Lyons | 7.73% | 0.61%(+7.12)#9 | 1.81%(+5.92)#625 |
| 10. | Americus | 6.64% | 0.61%(+6.03)#10 | 1.81%(+4.83)#789 |
| 11. | Lincoln | 6.35% | 0.61%(+5.73)#11 | 1.81%(+4.54)#831 |
| 12. | Plainville | 6.33% | 0.61%(+5.72)#12 | 1.81%(+4.52)#833 |
| 13. | Walton | 6.10% | 0.61%(+5.49)#13 | 1.81%(+4.29)#874 |
| 14. | Grandview | 5.45% | 0.61%(+4.83)#14 | 1.81%(+3.64)#1,018 |
| 15. | Liberty Center | 5.42% | 0.61%(+4.81)#15 | 1.81%(+3.61)#1,025 |
| 16. | Seymour | 4.35% | 0.61%(+3.74)#16 | 1.81%(+2.54)#1,296 |
| 17. | New Chicago | 4.03% | 0.61%(+3.41)#17 | 1.81%(+2.21)#1,419 |
| 18. | Avon | 3.88% | 0.61%(+3.27)#18 | 1.81%(+2.07)#1,468 |
| 19. | Elkhart | 3.67% | 0.61%(+3.06)#19 | 1.81%(+1.86)#1,544 |
| 20. | Washington | 3.50% | 0.61%(+2.89)#20 | 1.81%(+1.69)#1,616 |
| 21. | Royal Center | 3.43% | 0.61%(+2.82)#21 | 1.81%(+1.62)#1,660 |
| 22. | Boswell | 3.30% | 0.61%(+2.69)#22 | 1.81%(+1.49)#1,730 |
| 23. | Bristol | 3.28% | 0.61%(+2.66)#23 | 1.81%(+1.46)#1,745 |
| 24. | Pierceton | 3.12% | 0.61%(+2.51)#24 | 1.81%(+1.31)#1,808 |
| 25. | Goodland | 3.03% | 0.61%(+2.41)#25 | 1.81%(+1.21)#1,867 |
| 26. | Jasper | 3.03% | 0.61%(+2.41)#26 | 1.81%(+1.21)#1,868 |
| 27. | Henryville | 2.99% | 0.61%(+2.38)#27 | 1.81%(+1.18)#1,885 |
| 28. | Shipshewana | 2.98% | 0.61%(+2.36)#28 | 1.81%(+1.17)#1,898 |
| 29. | Orestes | 2.83% | 0.61%(+2.21)#29 | 1.81%(+1.01)#1,990 |
| 30. | Stilesville | 2.78% | 0.61%(+2.16)#30 | 1.81%(+0.965)#2,024 |
| 31. | Logansport | 2.77% | 0.61%(+2.16)#31 | 1.81%(+0.961)#2,026 |
| 32. | Osgood | 2.63% | 0.61%(+2.02)#32 | 1.81%(+0.819)#2,124 |
| 33. | Kentland | 2.54% | 0.61%(+1.93)#33 | 1.81%(+0.728)#2,191 |
| 34. | Lawrence | 2.42% | 0.61%(+1.80)#34 | 1.81%(+0.607)#2,280 |
| 35. | Goshen | 2.33% | 0.61%(+1.72)#35 | 1.81%(+0.518)#2,351 |
| 36. | Shirley | 1.75% | 0.61%(+1.14)#36 | 1.81%(-0.060)#2,958 |
| 37. | New Haven | 1.63% | 0.61%(+1.01)#37 | 1.81%(-0.186)#3,132 |
| 38. | Clifford | 1.59% | 0.61%(+0.979)#38 | 1.81%(-0.219)#3,185 |
| 39. | Wabash | 1.52% | 0.61%(+0.902)#39 | 1.81%(-0.296)#3,294 |
| 40. | Indianapolis | 1.48% | 0.61%(+0.865)#40 | 1.81%(-0.333)#3,348 |
| 41. | Speedway | 1.32% | 0.61%(+0.704)#41 | 1.81%(-0.494)#3,649 |
| 42. | Livonia | 1.20% | 0.61%(+0.590)#42 | 1.81%(-0.608)#3,865 |
| 43. | Westfield | 1.19% | 0.61%(+0.576)#43 | 1.81%(-0.622)#3,886 |
| 44. | Claypool | 1.15% | 0.61%(+0.531)#44 | 1.81%(-0.667)#3,999 |
| 45. | Roseland | 1.13% | 0.61%(+0.519)#45 | 1.81%(-0.679)#4,027 |
| 46. | Mccordsville | 1.12% | 0.61%(+0.506)#46 | 1.81%(-0.692)#4,052 |
| 47. | Middlebury | 1.12% | 0.61%(+0.500)#47 | 1.81%(-0.698)#4,065 |
| 48. | Fort Wayne | 1.08% | 0.61%(+0.463)#48 | 1.81%(-0.735)#4,160 |
| 49. | Charlestown | 1.05% | 0.61%(+0.437)#49 | 1.81%(-0.761)#4,223 |
| 50. | Dayton | 1.00% | 0.61%(+0.386)#50 | 1.81%(-0.812)#4,351 |
| 51. | East Chicago | 0.99% | 0.61%(+0.375)#51 | 1.81%(-0.823)#4,373 |
| 52. | Milford | 0.96% | 0.61%(+0.350)#52 | 1.81%(-0.848)#4,450 |
| 53. | Lafayette | 0.96% | 0.61%(+0.348)#53 | 1.81%(-0.850)#4,453 |
| 54. | La Porte | 0.95% | 0.61%(+0.336)#54 | 1.81%(-0.862)#4,487 |
| 55. | Albany | 0.95% | 0.61%(+0.331)#55 | 1.81%(-0.867)#4,493 |
| 56. | Vincennes | 0.93% | 0.61%(+0.318)#56 | 1.81%(-0.880)#4,532 |
| 57. | Covington | 0.92% | 0.61%(+0.306)#57 | 1.81%(-0.892)#4,566 |
| 58. | Ingalls | 0.92% | 0.61%(+0.300)#58 | 1.81%(-0.898)#4,579 |
| 59. | Atlanta | 0.91% | 0.61%(+0.291)#59 | 1.81%(-0.907)#4,604 |
| 60. | Lagrange | 0.90% | 0.61%(+0.283)#60 | 1.81%(-0.915)#4,630 |
| 61. | Rensselaer | 0.88% | 0.61%(+0.267)#61 | 1.81%(-0.931)#4,687 |
| 62. | Mineral Springs | 0.87% | 0.61%(+0.254)#62 | 1.81%(-0.944)#4,726 |
| 63. | Edgewood | 0.86% | 0.61%(+0.248)#63 | 1.81%(-0.950)#4,740 |
| 64. | Liberty | 0.82% | 0.61%(+0.200)#64 | 1.81%(-0.998)#4,914 |
| 65. | Floyds Knobs | 0.81% | 0.61%(+0.194)#65 | 1.81%(-1.00)#4,948 |
| 66. | Michigan City | 0.81% | 0.61%(+0.192)#66 | 1.81%(-1.01)#4,956 |
| 67. | Plainfield | 0.80% | 0.61%(+0.183)#67 | 1.81%(-1.01)#4,986 |
| 68. | Darmstadt | 0.79% | 0.61%(+0.178)#68 | 1.81%(-1.02)#5,004 |
| 69. | Brookston | 0.79% | 0.61%(+0.177)#69 | 1.81%(-1.02)#5,010 |
| 70. | Monticello | 0.78% | 0.61%(+0.169)#70 | 1.81%(-1.03)#5,038 |
| 71. | Kennard | 0.76% | 0.61%(+0.143)#71 | 1.81%(-1.06)#5,138 |
| 72. | Waterloo | 0.75% | 0.61%(+0.134)#72 | 1.81%(-1.06)#5,162 |
| 73. | Mount Vernon | 0.74% | 0.61%(+0.126)#73 | 1.81%(-1.07)#5,185 |
| 74. | Pine Village | 0.74% | 0.61%(+0.123)#74 | 1.81%(-1.07)#5,197 |
| 75. | Wolcott | 0.74% | 0.61%(+0.122)#75 | 1.81%(-1.08)#5,203 |
| 76. | Roselawn | 0.73% | 0.61%(+0.117)#76 | 1.81%(-1.08)#5,221 |
| 77. | Kouts | 0.72% | 0.61%(+0.106)#77 | 1.81%(-1.09)#5,254 |
| 78. | Dunlap | 0.72% | 0.61%(+0.106)#78 | 1.81%(-1.09)#5,258 |
| 79. | Greensburg | 0.71% | 0.61%(+0.094)#79 | 1.81%(-1.10)#5,301 |
| 80. | Anderson | 0.71% | 0.61%(+0.092)#80 | 1.81%(-1.11)#5,309 |
| 81. | Upland | 0.71% | 0.61%(+0.092)#81 | 1.81%(-1.11)#5,311 |
| 82. | Clarksville | 0.70% | 0.61%(+0.082)#82 | 1.81%(-1.12)#5,356 |
| 83. | Kirklin | 0.69% | 0.61%(+0.079)#83 | 1.81%(-1.12)#5,368 |
| 84. | Parker City | 0.67% | 0.61%(+0.059)#84 | 1.81%(-1.14)#5,430 |
| 85. | Pendleton | 0.67% | 0.61%(+0.053)#85 | 1.81%(-1.14)#5,450 |
| 86. | Medaryville | 0.64% | 0.61%(+0.026)#86 | 1.81%(-1.17)#5,558 |
| 87. | Munster | 0.62% | 0.61%(+0.004)#87 | 1.81%(-1.19)#5,651 |
| 88. | Farmland | 0.62% | 0.61%(+0.001)#88 | 1.81%(-1.20)#5,667 |
| 89. | Fortville | 0.60% | 0.61%(-0.020)#89 | 1.81%(-1.22)#5,750 |
| 90. | Jeffersonville | 0.59% | 0.61%(-0.022)#90 | 1.81%(-1.22)#5,758 |
| 91. | Oakland City | 0.58% | 0.61%(-0.037)#91 | 1.81%(-1.23)#5,819 |
| 92. | Delphi | 0.57% | 0.61%(-0.045)#92 | 1.81%(-1.24)#5,866 |
| 93. | Evansville | 0.57% | 0.61%(-0.049)#93 | 1.81%(-1.25)#5,894 |
| 94. | Chesterton | 0.56% | 0.61%(-0.058)#94 | 1.81%(-1.26)#5,937 |
| 95. | Sunman | 0.55% | 0.61%(-0.069)#95 | 1.81%(-1.27)#5,990 |
| 96. | Swayzee | 0.54% | 0.61%(-0.072)#96 | 1.81%(-1.27)#6,006 |
| 97. | Decatur | 0.54% | 0.61%(-0.080)#97 | 1.81%(-1.28)#6,045 |
| 98. | Frankfort | 0.51% | 0.61%(-0.108)#98 | 1.81%(-1.31)#6,172 |
| 99. | Granger | 0.49% | 0.61%(-0.129)#99 | 1.81%(-1.33)#6,280 |
| 100. | Linton | 0.49% | 0.61%(-0.129)#100 | 1.81%(-1.33)#6,287 |
Common Questions
What are the Top 10 Cities with the Highest Percentage of Central American Population in Indiana?
Top 10 Cities with the Highest Percentage of Central American Population in Indiana are:
#1
41.78%
#2
21.51%
#3
11.25%
#4
8.07%
#5
7.73%
#6
6.64%
#7
6.33%
#8
6.10%
#9
5.45%
#10
4.35%
What city has the Highest Percentage of Central American Population in Indiana?
Monon has the Highest Percentage of Central American Population in Indiana with 41.78%.
What is the Percentage of Central American Population in the State of Indiana?
Percentage of Central American Population in Indiana is 0.61%.
What is the Percentage of Central American Population in the United States?
Percentage of Central American Population in the United States is 1.81%.