North Fair Oaks, CA Map & Demographics
North Fair Oaks Map
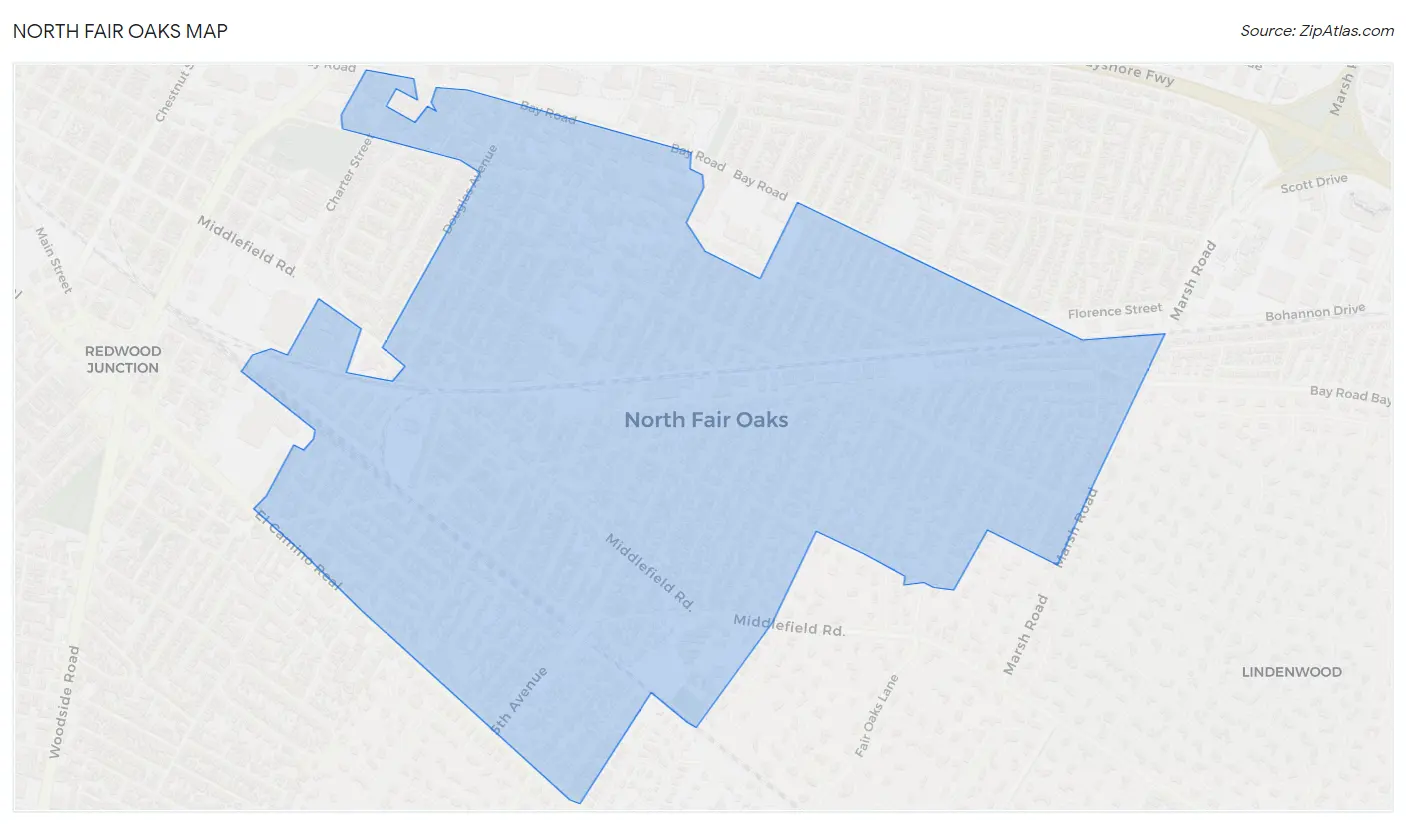
North Fair Oaks Overview
$45,176
PER CAPITA INCOME
$107,371
AVG FAMILY INCOME
$114,925
AVG HOUSEHOLD INCOME
11.3%
WAGE / INCOME GAP [ % ]
88.7¢/ $1
WAGE / INCOME GAP [ $ ]
0.46
INEQUALITY / GINI INDEX
13,718
TOTAL POPULATION
6,910
MALE POPULATION
6,808
FEMALE POPULATION
101.50
MALES / 100 FEMALES
98.52
FEMALES / 100 MALES
31.7
MEDIAN AGE
4.1
AVG FAMILY SIZE
3.5
AVG HOUSEHOLD SIZE
7,340
LABOR FORCE [ PEOPLE ]
68.2%
PERCENT IN LABOR FORCE
7.4%
UNEMPLOYMENT RATE
Income in North Fair Oaks
Income Overview in North Fair Oaks
Per Capita Income in North Fair Oaks is $45,176, while median incomes of families and households are $107,371 and $114,925 respectively.
| Characteristic | Number | Measure |
| Per Capita Income | 13,718 | $45,176 |
| Median Family Income | 2,699 | $107,371 |
| Mean Family Income | 2,699 | $149,660 |
| Median Household Income | 3,921 | $114,925 |
| Mean Household Income | 3,921 | $149,784 |
| Income Deficit | 2,699 | $0 |
| Wage / Income Gap (%) | 13,718 | 11.29% |
| Wage / Income Gap ($) | 13,718 | 88.71¢ per $1 |
| Gini / Inequality Index | 13,718 | 0.46 |
Earnings by Sex in North Fair Oaks
Average Earnings in North Fair Oaks are $44,733, $46,119 for men and $40,912 for women, a difference of 11.3%.
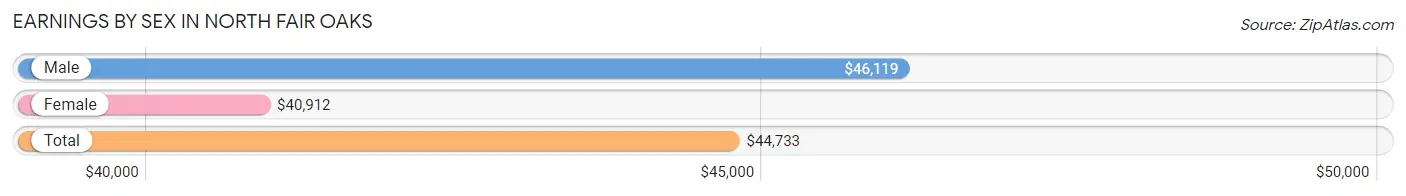
| Sex | Number | Average Earnings |
| Male | 4,450 (59.6%) | $46,119 |
| Female | 3,012 (40.4%) | $40,912 |
| Total | 7,462 (100.0%) | $44,733 |
Earnings by Sex by Income Bracket in North Fair Oaks
The most common earnings brackets in North Fair Oaks are $100,000+ for men (961 | 21.6%) and $100,000+ for women (583 | 19.4%).
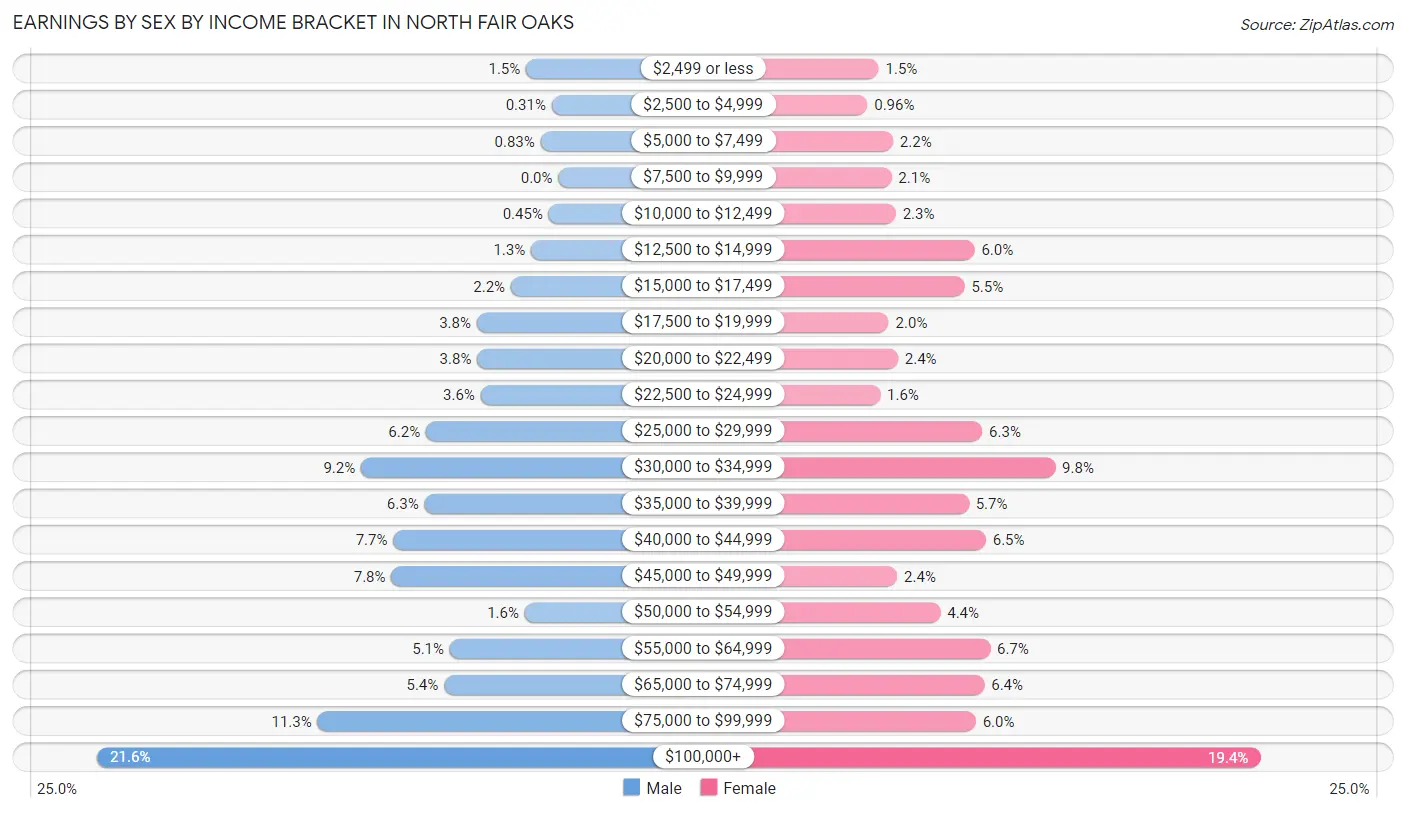
| Income | Male | Female |
| $2,499 or less | 67 (1.5%) | 45 (1.5%) |
| $2,500 to $4,999 | 14 (0.3%) | 29 (1.0%) |
| $5,000 to $7,499 | 37 (0.8%) | 65 (2.2%) |
| $7,500 to $9,999 | 0 (0.0%) | 63 (2.1%) |
| $10,000 to $12,499 | 20 (0.4%) | 69 (2.3%) |
| $12,500 to $14,999 | 57 (1.3%) | 180 (6.0%) |
| $15,000 to $17,499 | 99 (2.2%) | 166 (5.5%) |
| $17,500 to $19,999 | 170 (3.8%) | 59 (2.0%) |
| $20,000 to $22,499 | 169 (3.8%) | 72 (2.4%) |
| $22,500 to $24,999 | 162 (3.6%) | 47 (1.6%) |
| $25,000 to $29,999 | 276 (6.2%) | 191 (6.3%) |
| $30,000 to $34,999 | 411 (9.2%) | 294 (9.8%) |
| $35,000 to $39,999 | 279 (6.3%) | 172 (5.7%) |
| $40,000 to $44,999 | 344 (7.7%) | 196 (6.5%) |
| $45,000 to $49,999 | 348 (7.8%) | 71 (2.4%) |
| $50,000 to $54,999 | 70 (1.6%) | 132 (4.4%) |
| $55,000 to $64,999 | 226 (5.1%) | 202 (6.7%) |
| $65,000 to $74,999 | 238 (5.3%) | 194 (6.4%) |
| $75,000 to $99,999 | 502 (11.3%) | 182 (6.0%) |
| $100,000+ | 961 (21.6%) | 583 (19.4%) |
| Total | 4,450 (100.0%) | 3,012 (100.0%) |
Earnings by Sex by Educational Attainment in North Fair Oaks
Average earnings in North Fair Oaks are $49,016 for men and $43,125 for women, a difference of 12.0%. Men with an educational attainment of graduate degree enjoy the highest average annual earnings of $165,556, while those with less than high school education earn the least with $40,473. Women with an educational attainment of graduate degree earn the most with the average annual earnings of $116,786, while those with high school diploma education have the smallest earnings of $27,313.
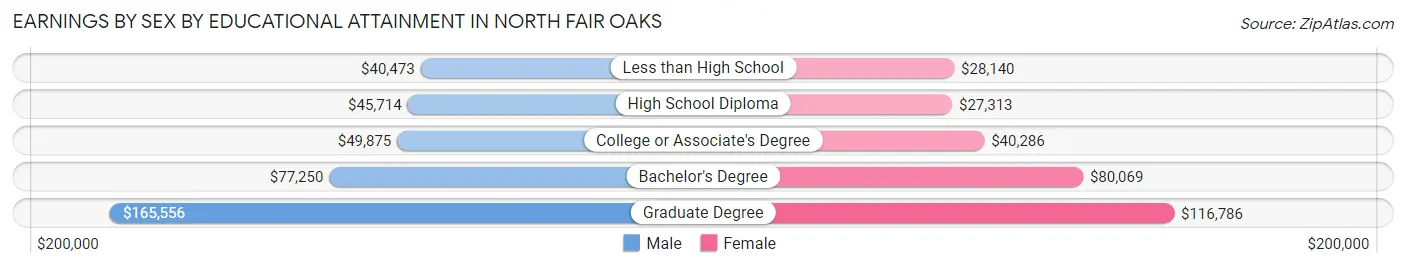
| Educational Attainment | Male Income | Female Income |
| Less than High School | $40,473 | $28,140 |
| High School Diploma | $45,714 | $27,313 |
| College or Associate's Degree | $49,875 | $40,286 |
| Bachelor's Degree | $77,250 | $80,069 |
| Graduate Degree | $165,556 | $116,786 |
| Total | $49,016 | $43,125 |
Family Income in North Fair Oaks
Family Income Brackets in North Fair Oaks
According to the North Fair Oaks family income data, there are 667 families falling into the $200,000+ income range, which is the most common income bracket and makes up 24.7% of all families. Conversely, the $10,000 to $14,999 income bracket is the least frequent group with only 30 families (1.1%) belonging to this category.
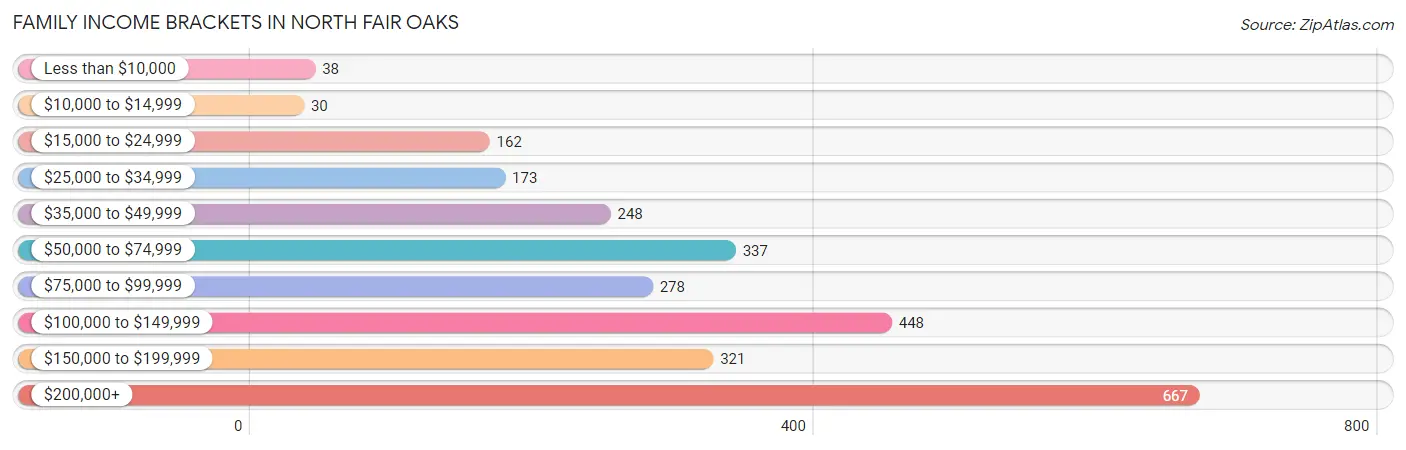
| Income Bracket | # Families | % Families |
| Less than $10,000 | 38 | 1.4% |
| $10,000 to $14,999 | 30 | 1.1% |
| $15,000 to $24,999 | 162 | 6.0% |
| $25,000 to $34,999 | 173 | 6.4% |
| $35,000 to $49,999 | 248 | 9.2% |
| $50,000 to $74,999 | 337 | 12.5% |
| $75,000 to $99,999 | 278 | 10.3% |
| $100,000 to $149,999 | 448 | 16.6% |
| $150,000 to $199,999 | 321 | 11.9% |
| $200,000+ | 667 | 24.7% |
Family Income by Famaliy Size in North Fair Oaks
7+ person families (170 | 6.3%) account for the highest median family income in North Fair Oaks with $189,516 per family, while 2-person families (822 | 30.5%) have the highest median income of $38,214 per family member.
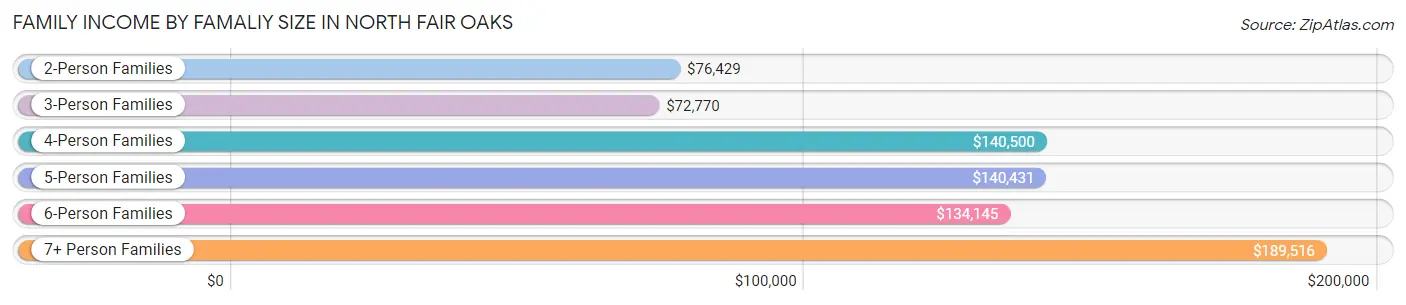
| Income Bracket | # Families | Median Income |
| 2-Person Families | 822 (30.5%) | $76,429 |
| 3-Person Families | 665 (24.6%) | $72,770 |
| 4-Person Families | 476 (17.6%) | $140,500 |
| 5-Person Families | 417 (15.4%) | $140,431 |
| 6-Person Families | 149 (5.5%) | $134,145 |
| 7+ Person Families | 170 (6.3%) | $189,516 |
| Total | 2,699 (100.0%) | $107,371 |
Family Income by Number of Earners in North Fair Oaks
The median family income in North Fair Oaks is $107,371, with families comprising 3+ earners (501) having the highest median family income of $188,854, while families with no earners (245) have the lowest median family income of $26,513, accounting for 18.6% and 9.1% of families, respectively.
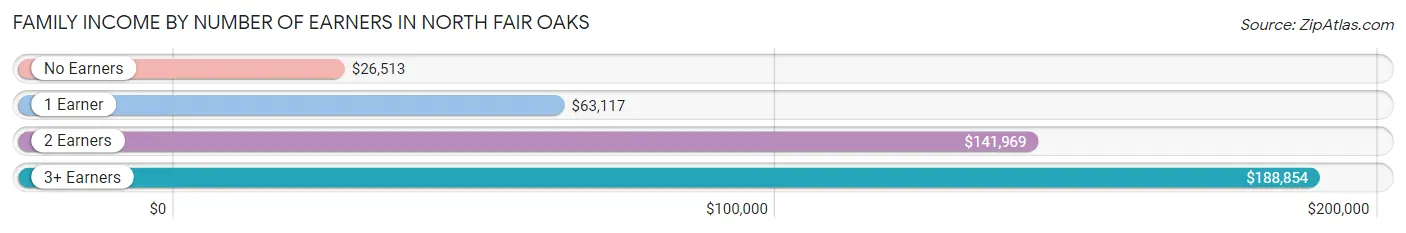
| Number of Earners | # Families | Median Income |
| No Earners | 245 (9.1%) | $26,513 |
| 1 Earner | 876 (32.5%) | $63,117 |
| 2 Earners | 1,077 (39.9%) | $141,969 |
| 3+ Earners | 501 (18.6%) | $188,854 |
| Total | 2,699 (100.0%) | $107,371 |
Household Income in North Fair Oaks
Household Income Brackets in North Fair Oaks
With 870 households falling in the category, the $200,000+ income range is the most frequent in North Fair Oaks, accounting for 22.2% of all households. In contrast, only 31 households (0.8%) fall into the $10,000 to $14,999 income bracket, making it the least populous group.
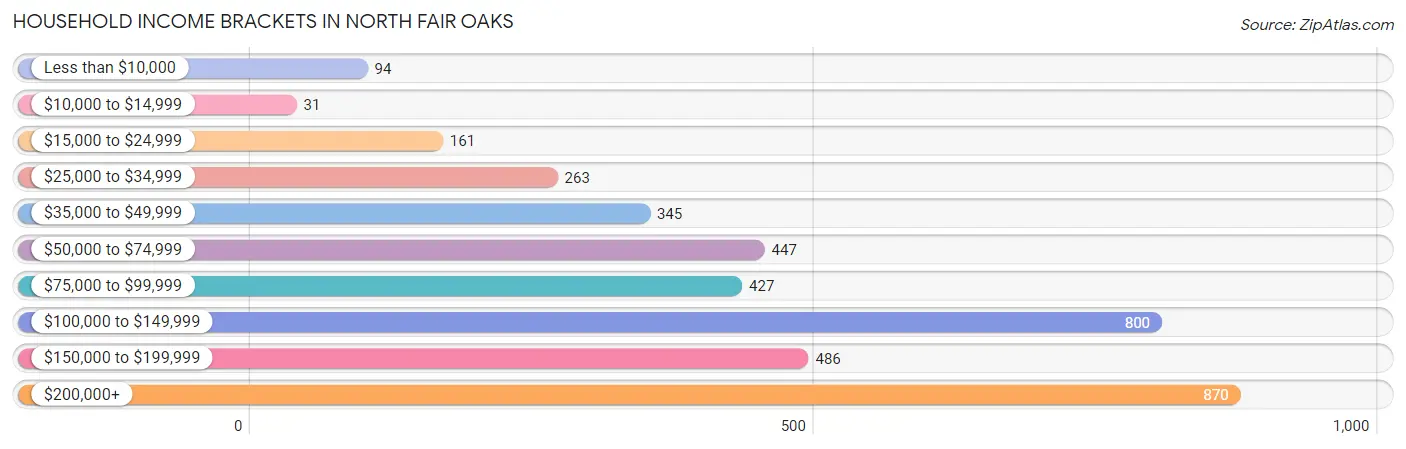
| Income Bracket | # Households | % Households |
| Less than $10,000 | 94 | 2.4% |
| $10,000 to $14,999 | 31 | 0.8% |
| $15,000 to $24,999 | 161 | 4.1% |
| $25,000 to $34,999 | 263 | 6.7% |
| $35,000 to $49,999 | 345 | 8.8% |
| $50,000 to $74,999 | 447 | 11.4% |
| $75,000 to $99,999 | 427 | 10.9% |
| $100,000 to $149,999 | 800 | 20.4% |
| $150,000 to $199,999 | 486 | 12.4% |
| $200,000+ | 870 | 22.2% |
Household Income by Householder Age in North Fair Oaks
The median household income in North Fair Oaks is $114,925, with the highest median household income of $159,239 found in the 15 to 24 years age bracket for the primary householder. A total of 154 households (3.9%) fall into this category. Meanwhile, the 65+ years age bracket for the primary householder has the lowest median household income of $86,429, with 704 households (17.9%) in this group.
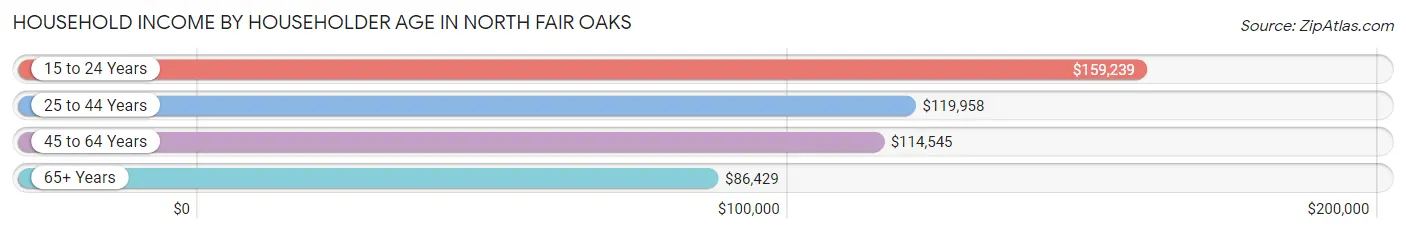
| Income Bracket | # Households | Median Income |
| 15 to 24 Years | 154 (3.9%) | $159,239 |
| 25 to 44 Years | 1,463 (37.3%) | $119,958 |
| 45 to 64 Years | 1,600 (40.8%) | $114,545 |
| 65+ Years | 704 (17.9%) | $86,429 |
| Total | 3,921 (100.0%) | $114,925 |
Poverty in North Fair Oaks
Income Below Poverty by Sex and Age in North Fair Oaks
With 8.8% poverty level for males and 14.2% for females among the residents of North Fair Oaks, 75 year old and over males and 12 to 14 year old females are the most vulnerable to poverty, with 25 males (20.0%) and 75 females (32.6%) in their respective age groups living below the poverty level.
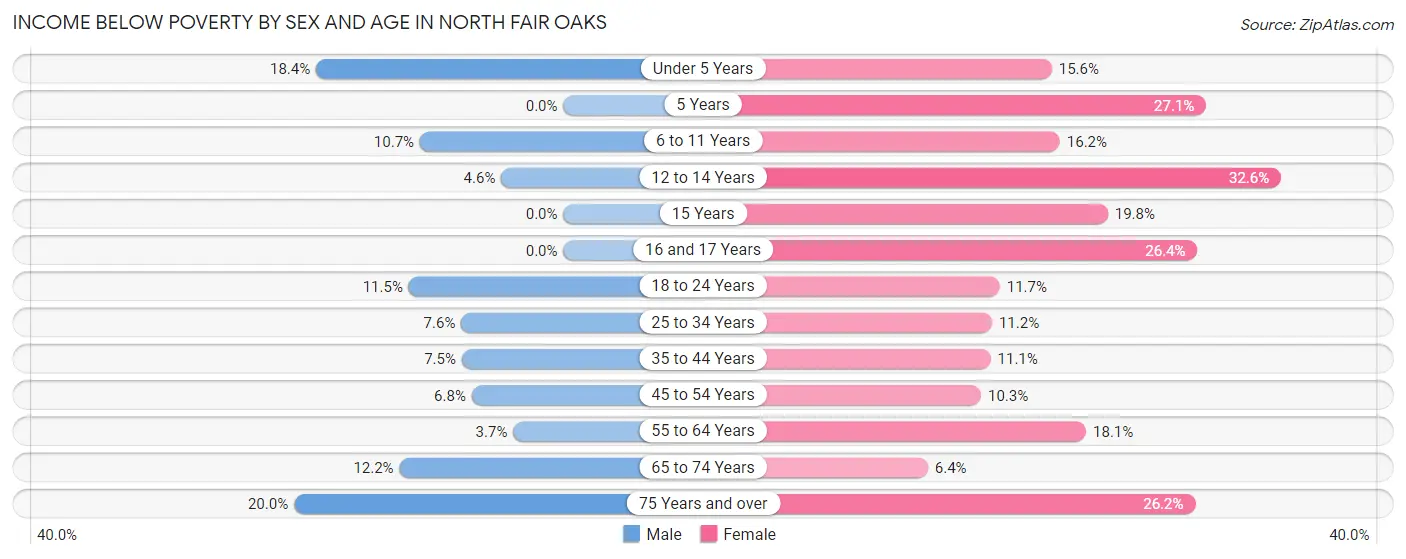
| Age Bracket | Male | Female |
| Under 5 Years | 110 (18.4%) | 77 (15.6%) |
| 5 Years | 0 (0.0%) | 33 (27.1%) |
| 6 to 11 Years | 49 (10.6%) | 79 (16.2%) |
| 12 to 14 Years | 10 (4.6%) | 75 (32.6%) |
| 15 Years | 0 (0.0%) | 16 (19.8%) |
| 16 and 17 Years | 0 (0.0%) | 47 (26.4%) |
| 18 to 24 Years | 91 (11.5%) | 80 (11.7%) |
| 25 to 34 Years | 103 (7.6%) | 142 (11.2%) |
| 35 to 44 Years | 61 (7.5%) | 82 (11.1%) |
| 45 to 54 Years | 67 (6.8%) | 97 (10.3%) |
| 55 to 64 Years | 28 (3.7%) | 121 (18.1%) |
| 65 to 74 Years | 65 (12.2%) | 35 (6.4%) |
| 75 Years and over | 25 (20.0%) | 74 (26.2%) |
| Total | 609 (8.8%) | 958 (14.2%) |
Income Above Poverty by Sex and Age in North Fair Oaks
According to the poverty statistics in North Fair Oaks, males aged 5 years and females aged 65 to 74 years are the age groups that are most secure financially, with 100.0% of males and 93.6% of females in these age groups living above the poverty line.
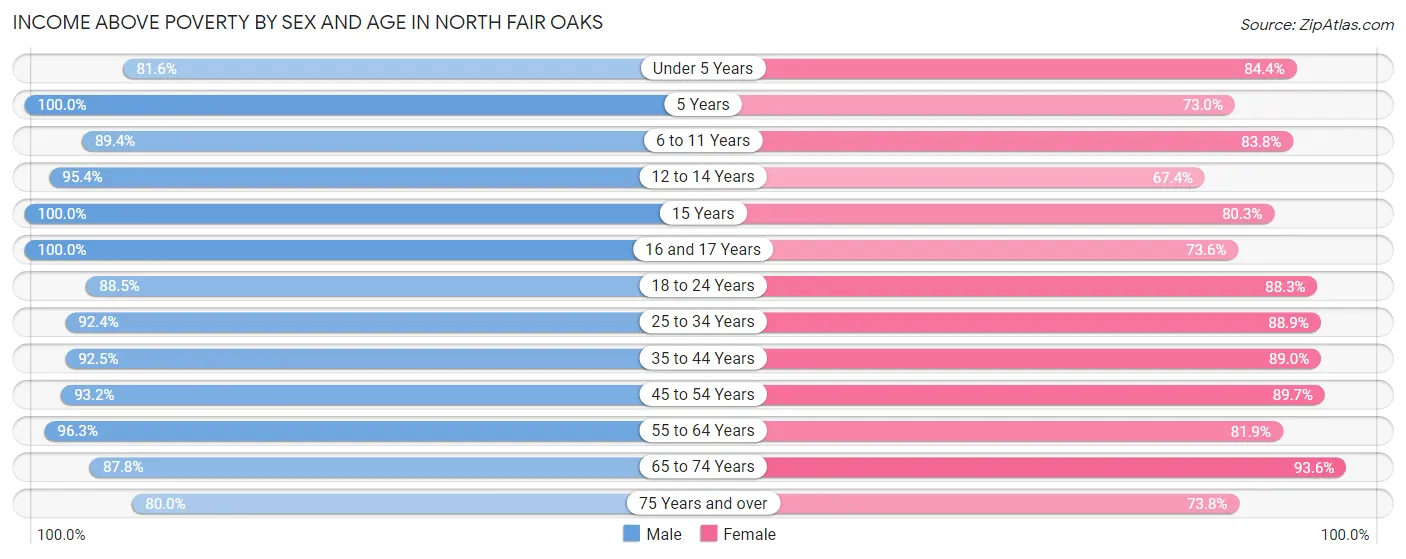
| Age Bracket | Male | Female |
| Under 5 Years | 489 (81.6%) | 417 (84.4%) |
| 5 Years | 167 (100.0%) | 89 (73.0%) |
| 6 to 11 Years | 411 (89.3%) | 409 (83.8%) |
| 12 to 14 Years | 207 (95.4%) | 155 (67.4%) |
| 15 Years | 16 (100.0%) | 65 (80.2%) |
| 16 and 17 Years | 94 (100.0%) | 131 (73.6%) |
| 18 to 24 Years | 702 (88.5%) | 602 (88.3%) |
| 25 to 34 Years | 1,255 (92.4%) | 1,132 (88.8%) |
| 35 to 44 Years | 748 (92.5%) | 660 (88.9%) |
| 45 to 54 Years | 918 (93.2%) | 841 (89.7%) |
| 55 to 64 Years | 725 (96.3%) | 546 (81.9%) |
| 65 to 74 Years | 469 (87.8%) | 513 (93.6%) |
| 75 Years and over | 100 (80.0%) | 208 (73.8%) |
| Total | 6,301 (91.2%) | 5,768 (85.8%) |
Income Below Poverty Among Married-Couple Families in North Fair Oaks
The poverty statistics for married-couple families in North Fair Oaks show that 9.3% or 190 of the total 2,045 families live below the poverty line. Families with 1 or 2 children have the highest poverty rate of 10.8%, comprising of 100 families. On the other hand, families with no children have the lowest poverty rate of 7.9%, which includes 72 families.
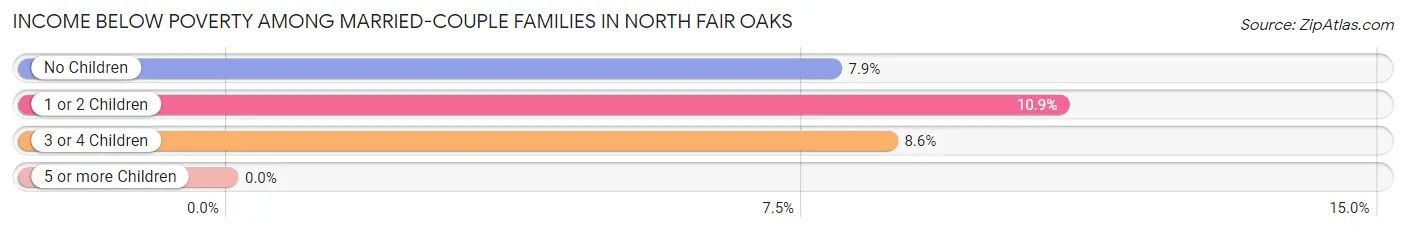
| Children | Above Poverty | Below Poverty |
| No Children | 842 (92.1%) | 72 (7.9%) |
| 1 or 2 Children | 822 (89.1%) | 100 (10.8%) |
| 3 or 4 Children | 191 (91.4%) | 18 (8.6%) |
| 5 or more Children | 0 (0.0%) | 0 (0.0%) |
| Total | 1,855 (90.7%) | 190 (9.3%) |
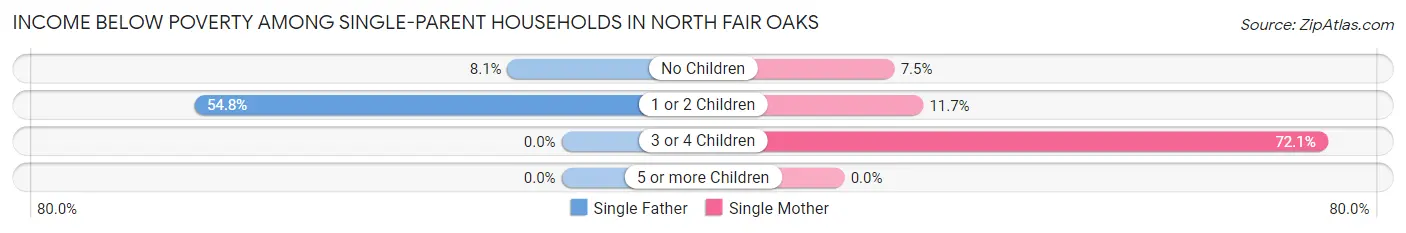
Income Below Poverty Among Single-Parent Households in North Fair Oaks
According to the poverty data in North Fair Oaks, 16.4% or 35 single-father households and 16.3% or 72 single-mother households are living below the poverty line. Among single-father households, those with 1 or 2 children have the highest poverty rate, with 23 households (54.8%) experiencing poverty. Likewise, among single-mother households, those with 3 or 4 children have the highest poverty rate, with 31 households (72.1%) falling below the poverty line.
| Children | Single Father | Single Mother |
| No Children | 12 (8.1%) | 10 (7.5%) |
| 1 or 2 Children | 23 (54.8%) | 31 (11.7%) |
| 3 or 4 Children | 0 (0.0%) | 31 (72.1%) |
| 5 or more Children | 0 (0.0%) | 0 (0.0%) |
| Total | 35 (16.4%) | 72 (16.3%) |
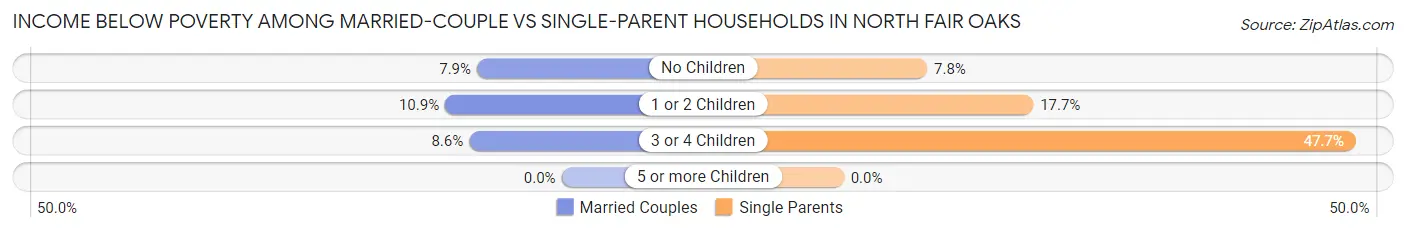
Income Below Poverty Among Married-Couple vs Single-Parent Households in North Fair Oaks
The poverty data for North Fair Oaks shows that 190 of the married-couple family households (9.3%) and 107 of the single-parent households (16.4%) are living below the poverty level. Within the married-couple family households, those with 1 or 2 children have the highest poverty rate, with 100 households (10.8%) falling below the poverty line. Among the single-parent households, those with 3 or 4 children have the highest poverty rate, with 31 household (47.7%) living below poverty.
| Children | Married-Couple Families | Single-Parent Households |
| No Children | 72 (7.9%) | 22 (7.8%) |
| 1 or 2 Children | 100 (10.8%) | 54 (17.6%) |
| 3 or 4 Children | 18 (8.6%) | 31 (47.7%) |
| 5 or more Children | 0 (0.0%) | 0 (0.0%) |
| Total | 190 (9.3%) | 107 (16.4%) |
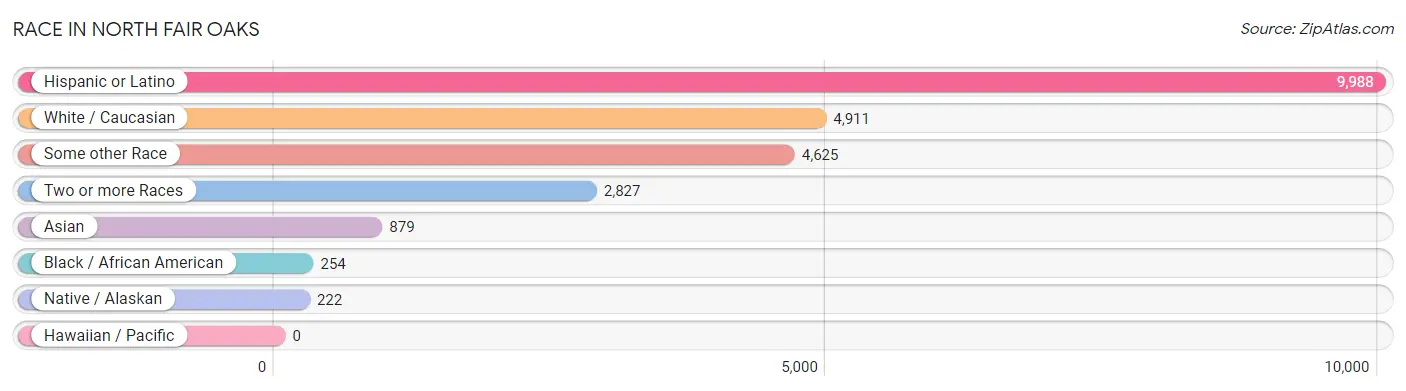
Race in North Fair Oaks
The most populous races in North Fair Oaks are Hispanic or Latino (9,988 | 72.8%), White / Caucasian (4,911 | 35.8%), and Some other Race (4,625 | 33.7%).
| Race | # Population | % Population |
| Asian | 879 | 6.4% |
| Black / African American | 254 | 1.8% |
| Hawaiian / Pacific | 0 | 0.0% |
| Hispanic or Latino | 9,988 | 72.8% |
| Native / Alaskan | 222 | 1.6% |
| White / Caucasian | 4,911 | 35.8% |
| Two or more Races | 2,827 | 20.6% |
| Some other Race | 4,625 | 33.7% |
| Total | 13,718 | 100.0% |
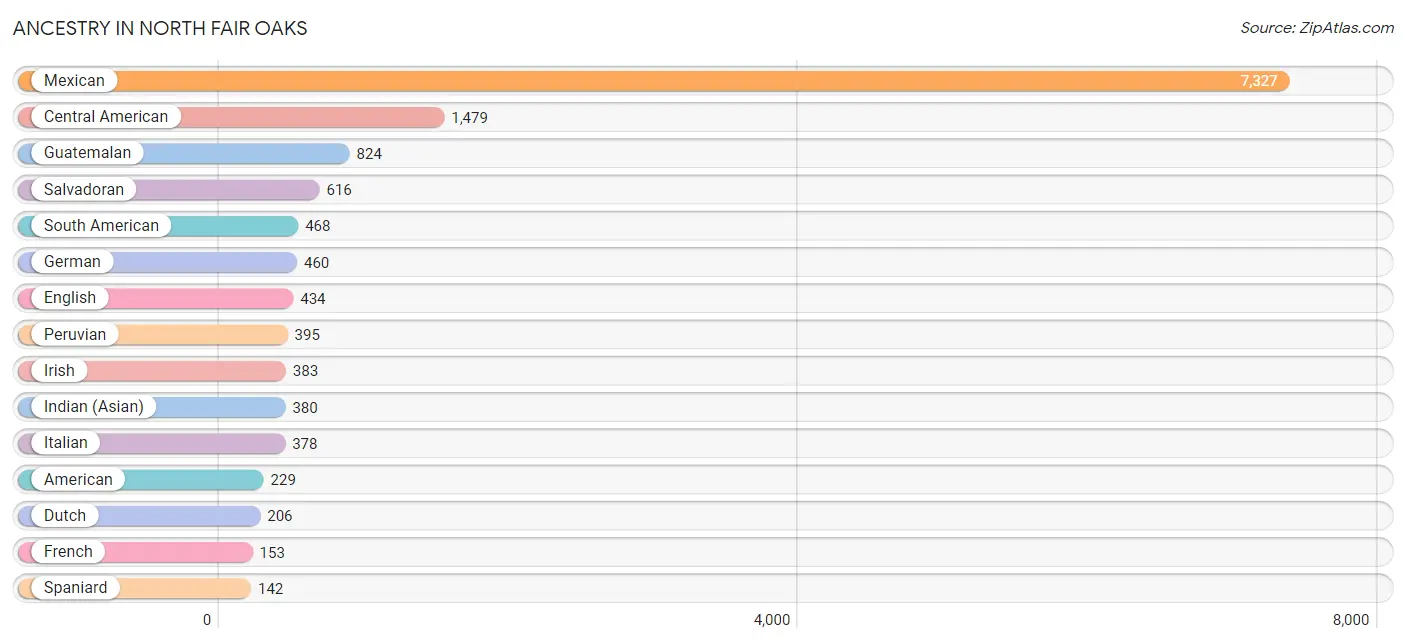
Ancestry in North Fair Oaks
The most populous ancestries reported in North Fair Oaks are Mexican (7,327 | 53.4%), Central American (1,479 | 10.8%), Guatemalan (824 | 6.0%), Salvadoran (616 | 4.5%), and South American (468 | 3.4%), together accounting for 78.1% of all North Fair Oaks residents.
| Ancestry | # Population | % Population |
| African | 16 | 0.1% |
| Alsatian | 8 | 0.1% |
| American | 229 | 1.7% |
| Arab | 20 | 0.2% |
| Armenian | 7 | 0.1% |
| Belgian | 22 | 0.2% |
| Bhutanese | 86 | 0.6% |
| Brazilian | 44 | 0.3% |
| British | 17 | 0.1% |
| Bulgarian | 7 | 0.1% |
| Burmese | 74 | 0.5% |
| Central American | 1,479 | 10.8% |
| Central American Indian | 19 | 0.1% |
| Cherokee | 12 | 0.1% |
| Chilean | 73 | 0.5% |
| Cuban | 47 | 0.3% |
| Czech | 15 | 0.1% |
| Danish | 36 | 0.3% |
| Dutch | 206 | 1.5% |
| Eastern European | 26 | 0.2% |
| English | 434 | 3.2% |
| Ethiopian | 125 | 0.9% |
| European | 107 | 0.8% |
| Filipino | 28 | 0.2% |
| Finnish | 26 | 0.2% |
| French | 153 | 1.1% |
| French Canadian | 28 | 0.2% |
| German | 460 | 3.4% |
| Greek | 26 | 0.2% |
| Guatemalan | 824 | 6.0% |
| Honduran | 12 | 0.1% |
| Hungarian | 46 | 0.3% |
| Indian (Asian) | 380 | 2.8% |
| Indonesian | 139 | 1.0% |
| Iranian | 59 | 0.4% |
| Irish | 383 | 2.8% |
| Italian | 378 | 2.8% |
| Korean | 132 | 1.0% |
| Laotian | 17 | 0.1% |
| Mexican | 7,327 | 53.4% |
| Mexican American Indian | 48 | 0.4% |
| Northern European | 8 | 0.1% |
| Norwegian | 50 | 0.4% |
| Pakistani | 18 | 0.1% |
| Palestinian | 15 | 0.1% |
| Panamanian | 27 | 0.2% |
| Peruvian | 395 | 2.9% |
| Polish | 61 | 0.4% |
| Portuguese | 10 | 0.1% |
| Puerto Rican | 86 | 0.6% |
| Russian | 78 | 0.6% |
| Salvadoran | 616 | 4.5% |
| Scandinavian | 10 | 0.1% |
| Scotch-Irish | 46 | 0.3% |
| Scottish | 53 | 0.4% |
| Slavic | 13 | 0.1% |
| South American | 468 | 3.4% |
| Spaniard | 142 | 1.0% |
| Spanish | 26 | 0.2% |
| Sri Lankan | 109 | 0.8% |
| Subsaharan African | 141 | 1.0% |
| Swedish | 12 | 0.1% |
| Swiss | 32 | 0.2% |
| Thai | 85 | 0.6% |
| Turkish | 16 | 0.1% |
| Ukrainian | 33 | 0.2% | View All 66 Rows |
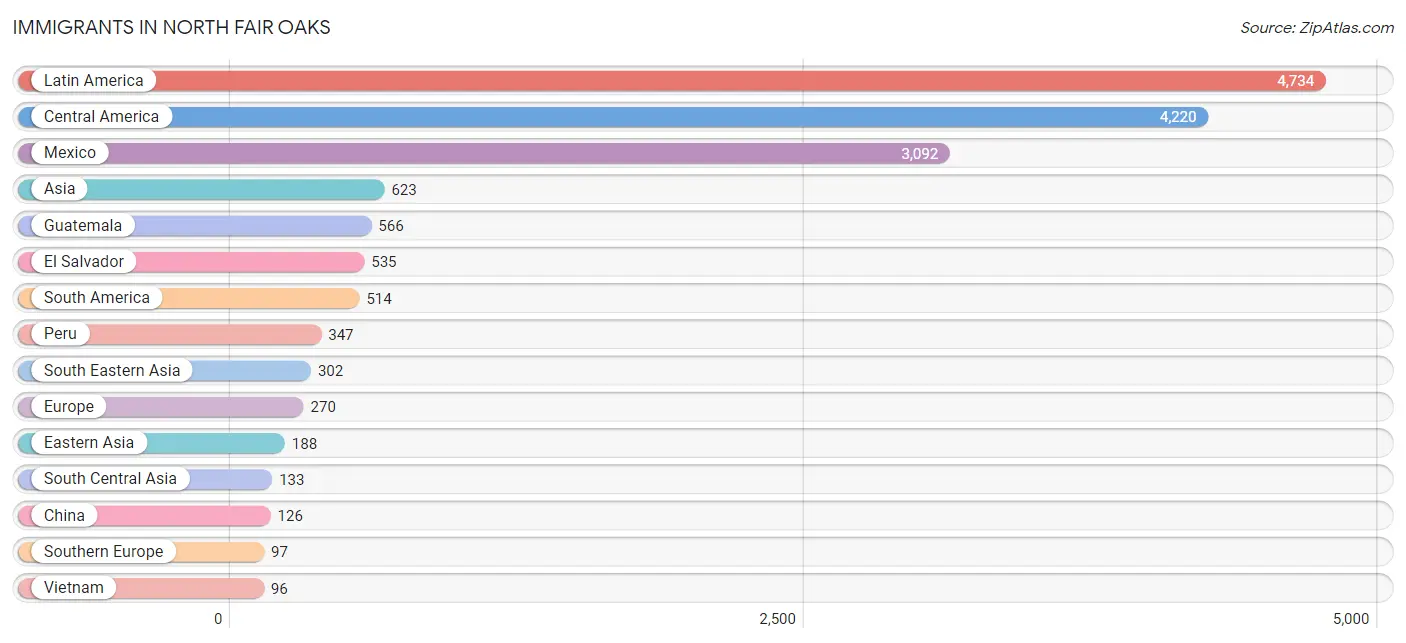
Immigrants in North Fair Oaks
The most numerous immigrant groups reported in North Fair Oaks came from Latin America (4,734 | 34.5%), Central America (4,220 | 30.8%), Mexico (3,092 | 22.5%), Asia (623 | 4.5%), and Guatemala (566 | 4.1%), together accounting for 96.5% of all North Fair Oaks residents.
| Immigration Origin | # Population | % Population |
| Africa | 59 | 0.4% |
| Asia | 623 | 4.5% |
| Australia | 8 | 0.1% |
| Belgium | 3 | 0.0% |
| Brazil | 63 | 0.5% |
| Bulgaria | 7 | 0.1% |
| Canada | 30 | 0.2% |
| Central America | 4,220 | 30.8% |
| Chile | 55 | 0.4% |
| China | 126 | 0.9% |
| Eastern Africa | 35 | 0.3% |
| Eastern Asia | 188 | 1.4% |
| Eastern Europe | 89 | 0.6% |
| El Salvador | 535 | 3.9% |
| Ethiopia | 35 | 0.3% |
| Europe | 270 | 2.0% |
| France | 44 | 0.3% |
| Germany | 37 | 0.3% |
| Guatemala | 566 | 4.1% |
| Honduras | 18 | 0.1% |
| Hong Kong | 17 | 0.1% |
| Hungary | 8 | 0.1% |
| India | 64 | 0.5% |
| Indonesia | 7 | 0.1% |
| Iran | 59 | 0.4% |
| Italy | 43 | 0.3% |
| Japan | 34 | 0.3% |
| Korea | 28 | 0.2% |
| Latin America | 4,734 | 34.5% |
| Malaysia | 14 | 0.1% |
| Mexico | 3,092 | 22.5% |
| Nepal | 10 | 0.1% |
| Northern Africa | 24 | 0.2% |
| Oceania | 8 | 0.1% |
| Panama | 9 | 0.1% |
| Peru | 347 | 2.5% |
| Philippines | 42 | 0.3% |
| Russia | 68 | 0.5% |
| South America | 514 | 3.7% |
| South Central Asia | 133 | 1.0% |
| South Eastern Asia | 302 | 2.2% |
| Southern Europe | 97 | 0.7% |
| Spain | 54 | 0.4% |
| Taiwan | 50 | 0.4% |
| Thailand | 26 | 0.2% |
| Ukraine | 6 | 0.0% |
| Uruguay | 49 | 0.4% |
| Vietnam | 96 | 0.7% |
| Western Europe | 84 | 0.6% | View All 49 Rows |
Sex and Age in North Fair Oaks
Sex and Age in North Fair Oaks
The most populous age groups in North Fair Oaks are 25 to 29 Years (730 | 10.6%) for men and 25 to 29 Years (846 | 12.4%) for women.
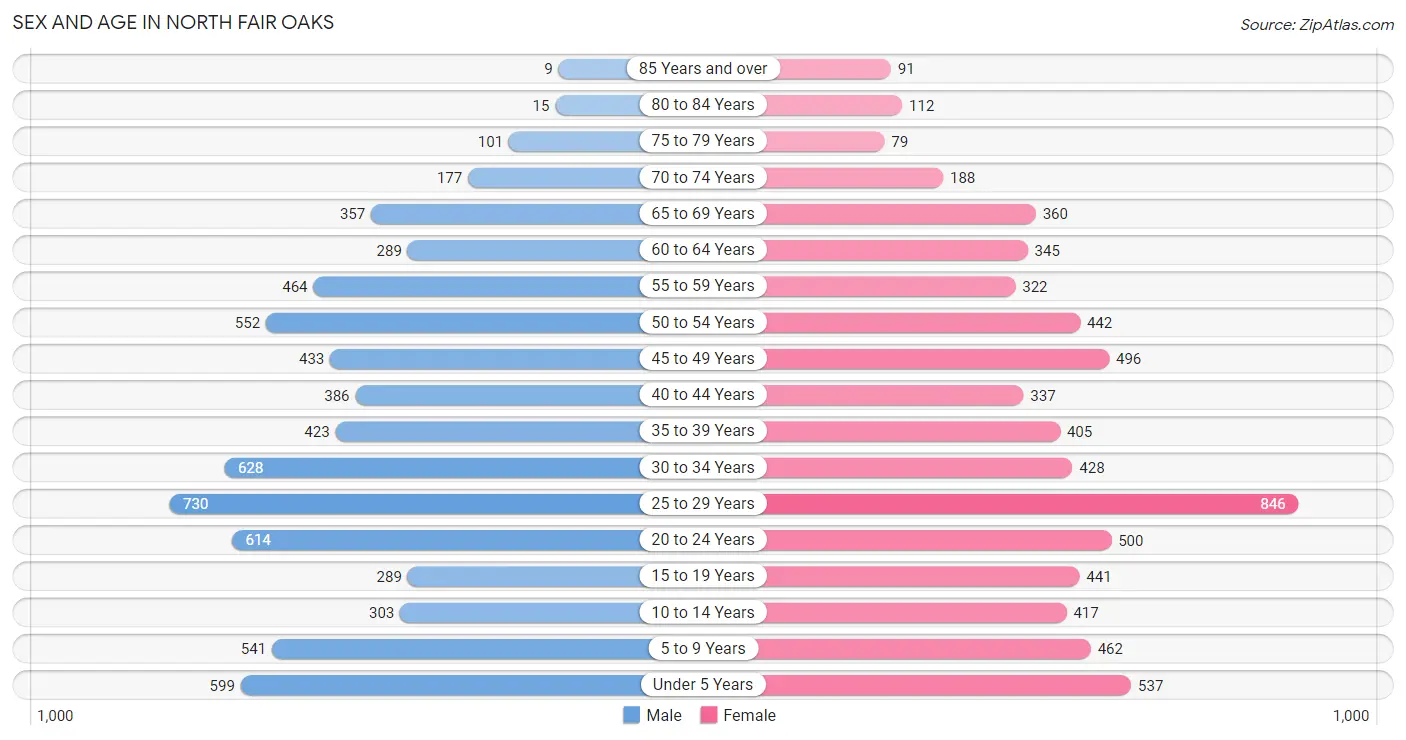
| Age Bracket | Male | Female |
| Under 5 Years | 599 (8.7%) | 537 (7.9%) |
| 5 to 9 Years | 541 (7.8%) | 462 (6.8%) |
| 10 to 14 Years | 303 (4.4%) | 417 (6.1%) |
| 15 to 19 Years | 289 (4.2%) | 441 (6.5%) |
| 20 to 24 Years | 614 (8.9%) | 500 (7.3%) |
| 25 to 29 Years | 730 (10.6%) | 846 (12.4%) |
| 30 to 34 Years | 628 (9.1%) | 428 (6.3%) |
| 35 to 39 Years | 423 (6.1%) | 405 (5.9%) |
| 40 to 44 Years | 386 (5.6%) | 337 (5.0%) |
| 45 to 49 Years | 433 (6.3%) | 496 (7.3%) |
| 50 to 54 Years | 552 (8.0%) | 442 (6.5%) |
| 55 to 59 Years | 464 (6.7%) | 322 (4.7%) |
| 60 to 64 Years | 289 (4.2%) | 345 (5.1%) |
| 65 to 69 Years | 357 (5.2%) | 360 (5.3%) |
| 70 to 74 Years | 177 (2.6%) | 188 (2.8%) |
| 75 to 79 Years | 101 (1.5%) | 79 (1.2%) |
| 80 to 84 Years | 15 (0.2%) | 112 (1.7%) |
| 85 Years and over | 9 (0.1%) | 91 (1.3%) |
| Total | 6,910 (100.0%) | 6,808 (100.0%) |
Families and Households in North Fair Oaks
Median Family Size in North Fair Oaks
The median family size in North Fair Oaks is 4.09 persons per family, with single male/father families (213 | 7.9%) accounting for the largest median family size of 4.36 persons per family. On the other hand, single female/mother families (441 | 16.3%) represent the smallest median family size with 3.56 persons per family.
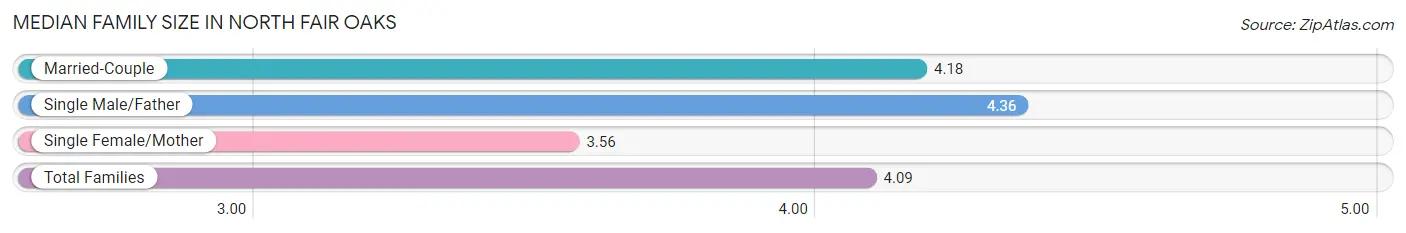
| Family Type | # Families | Family Size |
| Married-Couple | 2,045 (75.8%) | 4.18 |
| Single Male/Father | 213 (7.9%) | 4.36 |
| Single Female/Mother | 441 (16.3%) | 3.56 |
| Total Families | 2,699 (100.0%) | 4.09 |
Median Household Size in North Fair Oaks
The median household size in North Fair Oaks is 3.47 persons per household, with single male/father households (213 | 5.4%) accounting for the largest median household size of 4.57 persons per household. non-family households (1,222 | 31.2%) represent the smallest median household size with 1.81 persons per household.
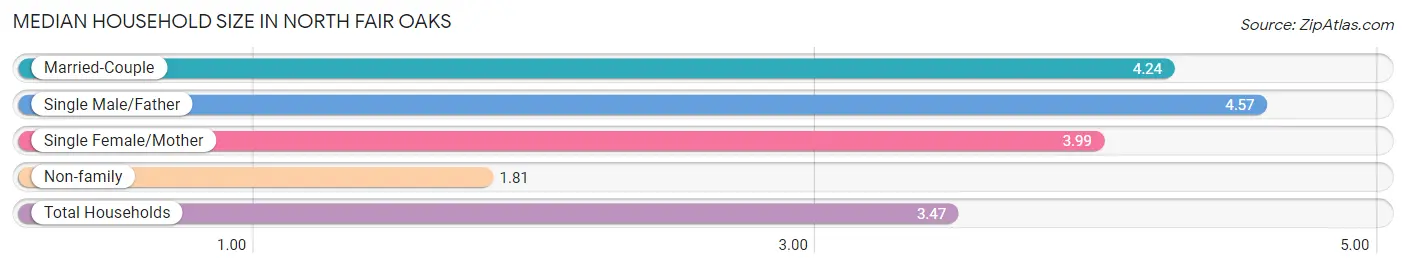
| Household Type | # Households | Household Size |
| Married-Couple | 2,045 (52.2%) | 4.24 |
| Single Male/Father | 213 (5.4%) | 4.57 |
| Single Female/Mother | 441 (11.3%) | 3.99 |
| Non-family | 1,222 (31.2%) | 1.81 |
| Total Households | 3,921 (100.0%) | 3.47 |
Household Size by Marriage Status in North Fair Oaks
Out of a total of 3,921 households in North Fair Oaks, 2,699 (68.8%) are family households, while 1,222 (31.2%) are nonfamily households. The most numerous type of family households are 2-person households, comprising 760, and the most common type of nonfamily households are 1-person households, comprising 795.
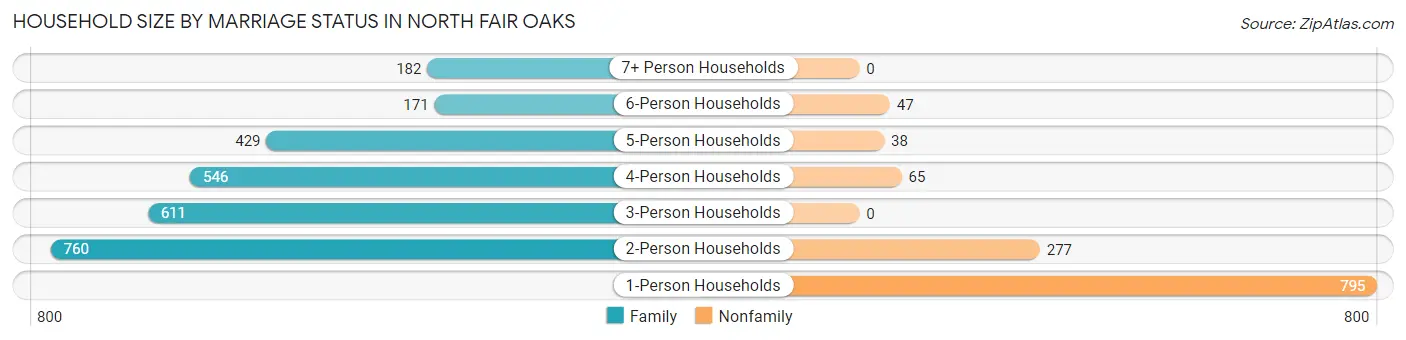
| Household Size | Family Households | Nonfamily Households |
| 1-Person Households | - | 795 (20.3%) |
| 2-Person Households | 760 (19.4%) | 277 (7.1%) |
| 3-Person Households | 611 (15.6%) | 0 (0.0%) |
| 4-Person Households | 546 (13.9%) | 65 (1.7%) |
| 5-Person Households | 429 (10.9%) | 38 (1.0%) |
| 6-Person Households | 171 (4.4%) | 47 (1.2%) |
| 7+ Person Households | 182 (4.6%) | 0 (0.0%) |
| Total | 2,699 (68.8%) | 1,222 (31.2%) |
Female Fertility in North Fair Oaks
Fertility by Age in North Fair Oaks
Average fertility rate in North Fair Oaks is 62.0 births per 1,000 women. Women in the age bracket of 35 to 50 years have the highest fertility rate with 71.0 births per 1,000 women. Women in the age bracket of 20 to 34 years acount for 56.4% of all women with births.
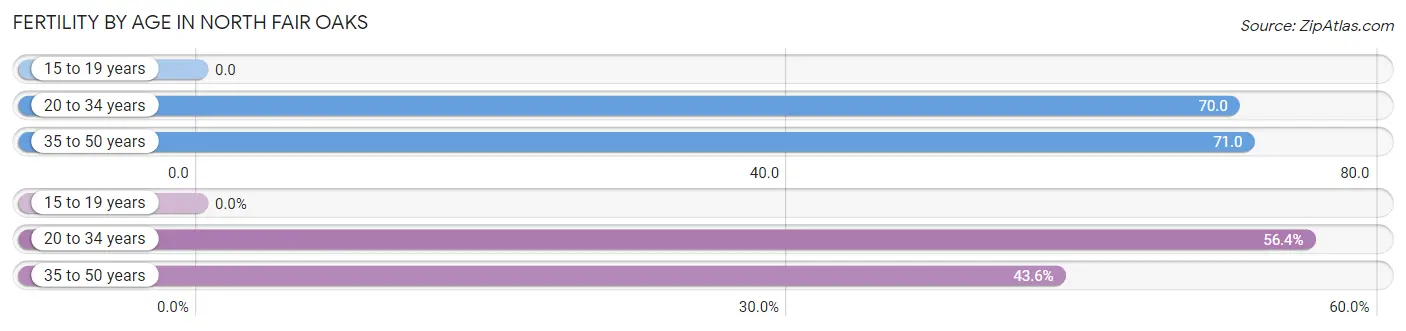
| Age Bracket | Women with Births | Births / 1,000 Women |
| 15 to 19 years | 0 (0.0%) | 0.0 |
| 20 to 34 years | 124 (56.4%) | 70.0 |
| 35 to 50 years | 96 (43.6%) | 71.0 |
| Total | 220 (100.0%) | 62.0 |
Fertility by Age by Marriage Status in North Fair Oaks
54.5% of women with births (220) in North Fair Oaks are married. The highest percentage of unmarried women with births falls into 35 to 50 years age bracket with 59.4% of them unmarried at the time of birth, while the lowest percentage of unmarried women with births belong to 20 to 34 years age bracket with 34.7% of them unmarried.
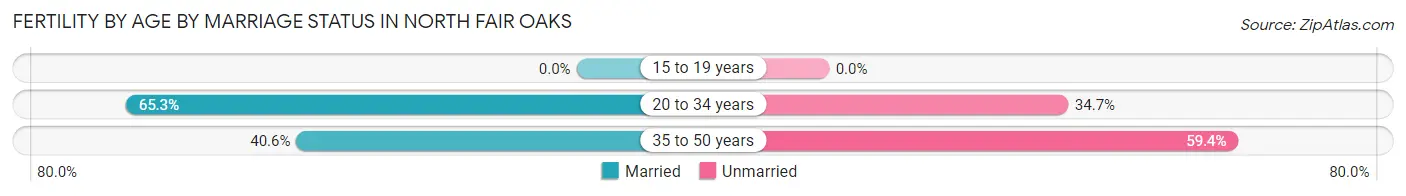
| Age Bracket | Married | Unmarried |
| 15 to 19 years | 0 (0.0%) | 0 (0.0%) |
| 20 to 34 years | 81 (65.3%) | 43 (34.7%) |
| 35 to 50 years | 39 (40.6%) | 57 (59.4%) |
| Total | 120 (54.5%) | 100 (45.5%) |
Fertility by Education in North Fair Oaks
Average fertility rate in North Fair Oaks is 62.0 births per 1,000 women. Women with the education attainment of college or associate's degree have the highest fertility rate of 115.0 births per 1,000 women, while women with the education attainment of high school diploma have the lowest fertility at 27.0 births per 1,000 women. Women with the education attainment of college or associate's degree represent 48.6% of all women with births.
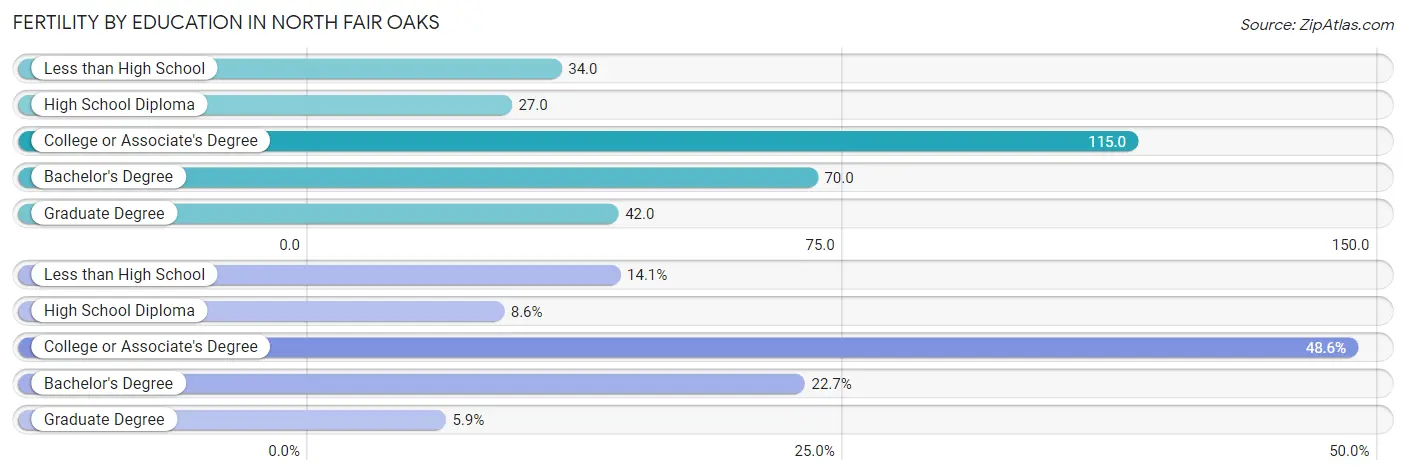
| Educational Attainment | Women with Births | Births / 1,000 Women |
| Less than High School | 31 (14.1%) | 34.0 |
| High School Diploma | 19 (8.6%) | 27.0 |
| College or Associate's Degree | 107 (48.6%) | 115.0 |
| Bachelor's Degree | 50 (22.7%) | 70.0 |
| Graduate Degree | 13 (5.9%) | 42.0 |
| Total | 220 (100.0%) | 62.0 |
Fertility by Education by Marriage Status in North Fair Oaks
45.5% of women with births in North Fair Oaks are unmarried. Women with the educational attainment of high school diploma are most likely to be married with 100.0% of them married at childbirth, while women with the educational attainment of less than high school are least likely to be married with 100.0% of them unmarried at childbirth.
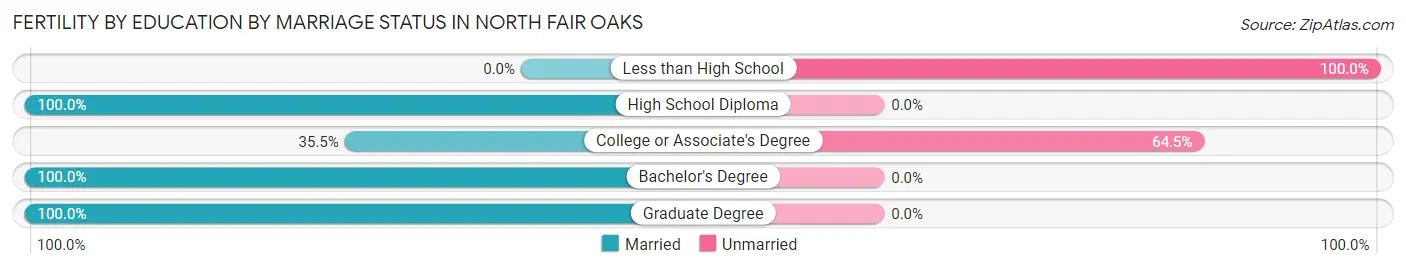
| Educational Attainment | Married | Unmarried |
| Less than High School | 0 (0.0%) | 31 (100.0%) |
| High School Diploma | 19 (100.0%) | 0 (0.0%) |
| College or Associate's Degree | 38 (35.5%) | 69 (64.5%) |
| Bachelor's Degree | 50 (100.0%) | 0 (0.0%) |
| Graduate Degree | 13 (100.0%) | 0 (0.0%) |
| Total | 120 (54.5%) | 100 (45.5%) |
Employment Characteristics in North Fair Oaks
Employment by Class of Employer in North Fair Oaks
Among the 6,630 employed individuals in North Fair Oaks, private company employees (4,708 | 71.0%), self-employed (not incorporated) (744 | 11.2%), and not-for-profit organizations (461 | 7.0%) make up the most common classes of employment.
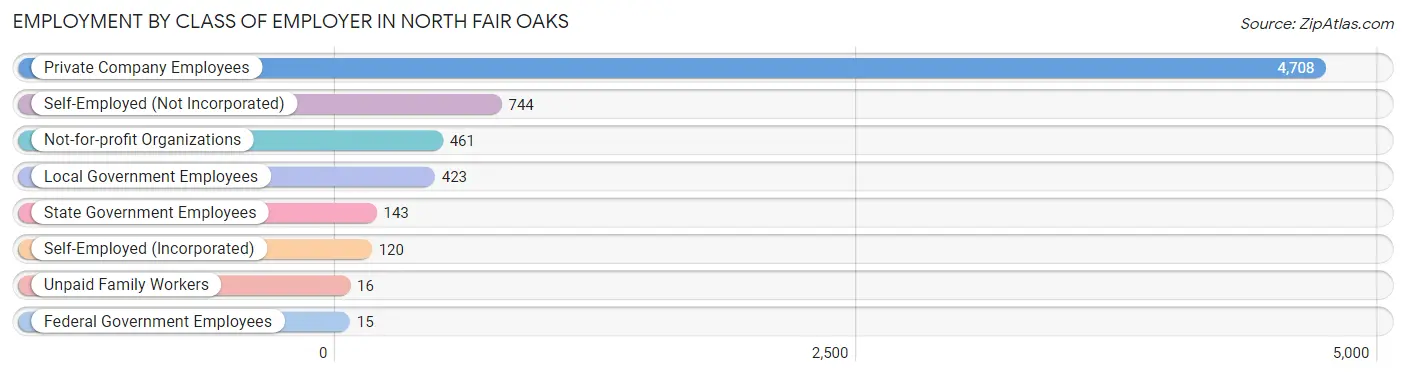
| Employer Class | # Employees | % Employees |
| Private Company Employees | 4,708 | 71.0% |
| Self-Employed (Incorporated) | 120 | 1.8% |
| Self-Employed (Not Incorporated) | 744 | 11.2% |
| Not-for-profit Organizations | 461 | 7.0% |
| Local Government Employees | 423 | 6.4% |
| State Government Employees | 143 | 2.2% |
| Federal Government Employees | 15 | 0.2% |
| Unpaid Family Workers | 16 | 0.2% |
| Total | 6,630 | 100.0% |
Employment Status by Age in North Fair Oaks
According to the labor force statistics for North Fair Oaks, out of the total population over 16 years of age (10,762), 68.2% or 7,340 individuals are in the labor force, with 7.4% or 543 of them unemployed. The age group with the highest labor force participation rate is 35 to 44 years, with 86.3% or 1,339 individuals in the labor force. Within the labor force, the 16 to 19 years age range has the highest percentage of unemployed individuals, with 25.4% or 51 of them being unemployed.
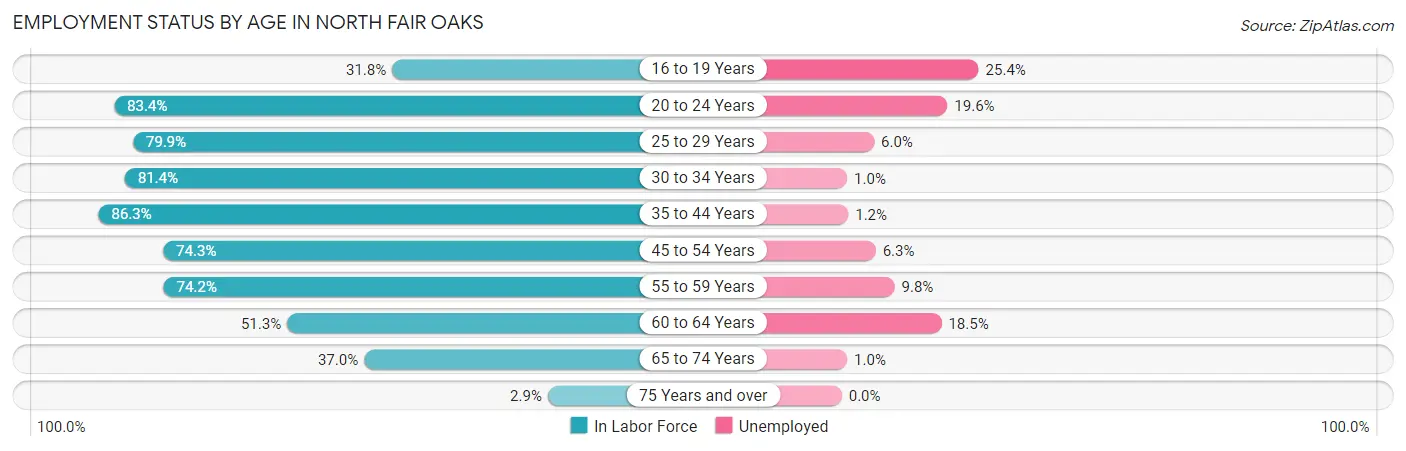
| Age Bracket | In Labor Force | Unemployed |
| 16 to 19 Years | 201 (31.8%) | 51 (25.4%) |
| 20 to 24 Years | 929 (83.4%) | 182 (19.6%) |
| 25 to 29 Years | 1,259 (79.9%) | 76 (6.0%) |
| 30 to 34 Years | 860 (81.4%) | 9 (1.0%) |
| 35 to 44 Years | 1,339 (86.3%) | 16 (1.2%) |
| 45 to 54 Years | 1,429 (74.3%) | 90 (6.3%) |
| 55 to 59 Years | 583 (74.2%) | 57 (9.8%) |
| 60 to 64 Years | 325 (51.3%) | 60 (18.5%) |
| 65 to 74 Years | 400 (37.0%) | 4 (1.0%) |
| 75 Years and over | 12 (2.9%) | 0 (0.0%) |
| Total | 7,340 (68.2%) | 543 (7.4%) |
Employment Status by Educational Attainment in North Fair Oaks
According to labor force statistics for North Fair Oaks, 77.0% of individuals (5,795) out of the total population between 25 and 64 years of age (7,526) are in the labor force, with 5.3% or 307 of them being unemployed. The group with the highest labor force participation rate are those with the educational attainment of bachelor's degree or higher, with 88.5% or 1,912 individuals in the labor force. Within the labor force, individuals with college / associate degree education have the highest percentage of unemployment, with 7.7% or 92 of them being unemployed.
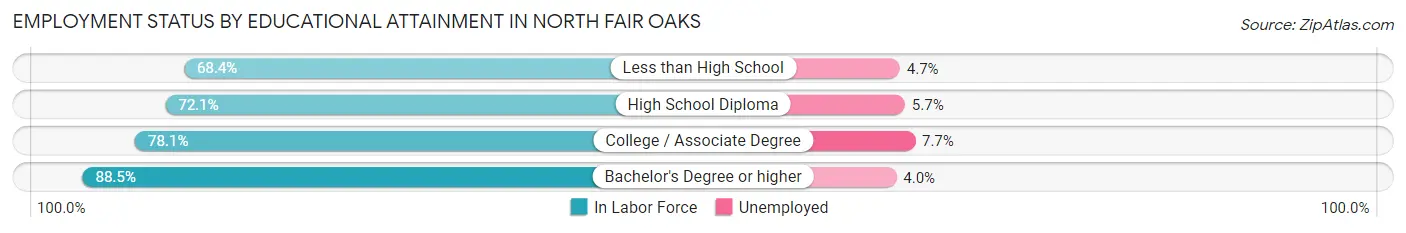
| Educational Attainment | In Labor Force | Unemployed |
| Less than High School | 1,481 (68.4%) | 102 (4.7%) |
| High School Diploma | 1,199 (72.1%) | 95 (5.7%) |
| College / Associate Degree | 1,201 (78.1%) | 118 (7.7%) |
| Bachelor's Degree or higher | 1,912 (88.5%) | 86 (4.0%) |
| Total | 5,795 (77.0%) | 399 (5.3%) |
Employment Occupations by Sex in North Fair Oaks
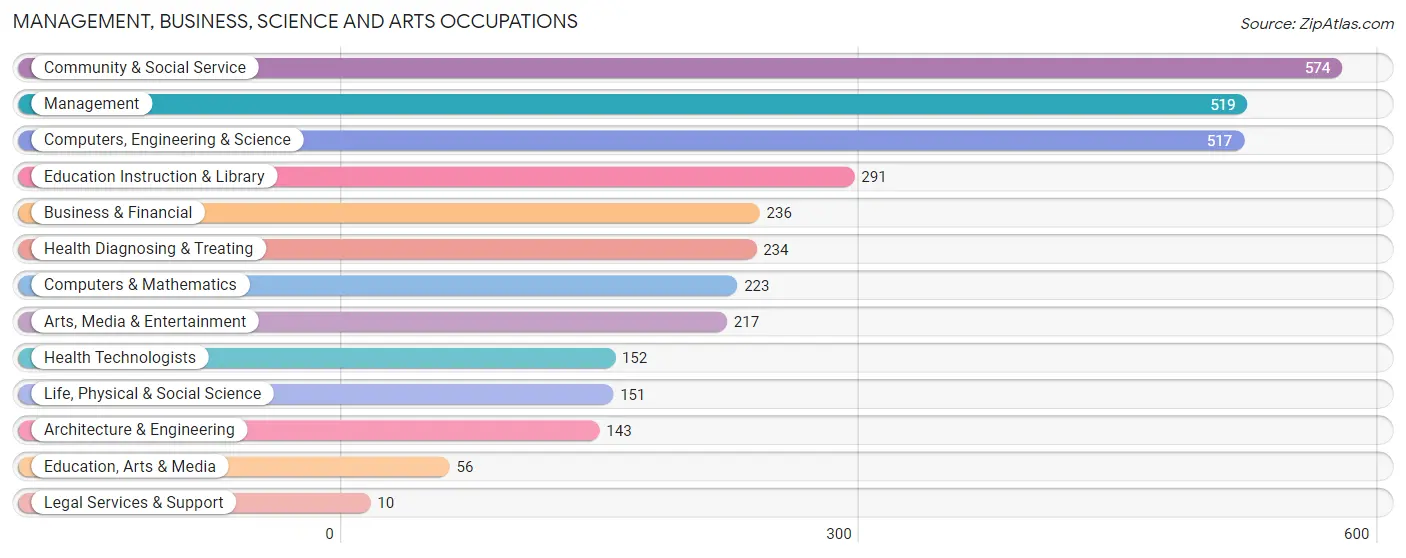
Management, Business, Science and Arts Occupations
The most common Management, Business, Science and Arts occupations in North Fair Oaks are Community & Social Service (574 | 8.5%), Management (519 | 7.6%), Computers, Engineering & Science (517 | 7.6%), Education Instruction & Library (291 | 4.3%), and Business & Financial (236 | 3.5%).
Management, Business, Science and Arts Occupations by Sex
Within the Management, Business, Science and Arts occupations in North Fair Oaks, the most male-oriented occupations are Computers & Mathematics (82.5%), Architecture & Engineering (81.1%), and Computers, Engineering & Science (72.2%), while the most female-oriented occupations are Legal Services & Support (100.0%), Education Instruction & Library (86.9%), and Community & Social Service (80.8%).
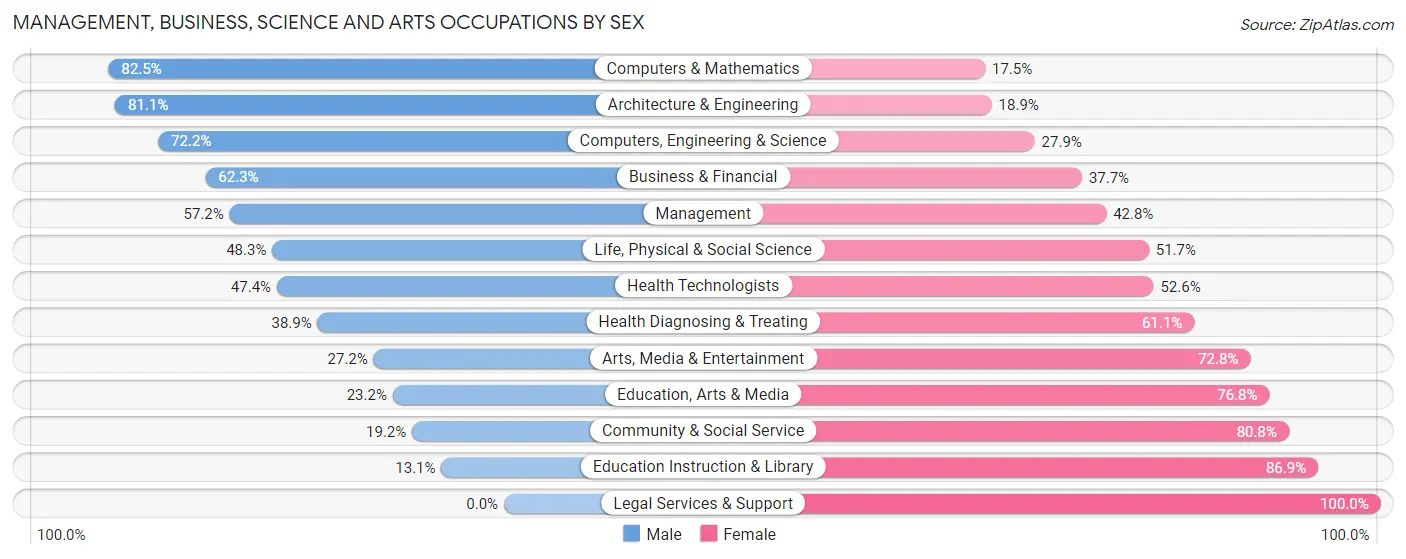
| Occupation | Male | Female |
| Management | 297 (57.2%) | 222 (42.8%) |
| Business & Financial | 147 (62.3%) | 89 (37.7%) |
| Computers, Engineering & Science | 373 (72.2%) | 144 (27.9%) |
| Computers & Mathematics | 184 (82.5%) | 39 (17.5%) |
| Architecture & Engineering | 116 (81.1%) | 27 (18.9%) |
| Life, Physical & Social Science | 73 (48.3%) | 78 (51.7%) |
| Community & Social Service | 110 (19.2%) | 464 (80.8%) |
| Education, Arts & Media | 13 (23.2%) | 43 (76.8%) |
| Legal Services & Support | 0 (0.0%) | 10 (100.0%) |
| Education Instruction & Library | 38 (13.1%) | 253 (86.9%) |
| Arts, Media & Entertainment | 59 (27.2%) | 158 (72.8%) |
| Health Diagnosing & Treating | 91 (38.9%) | 143 (61.1%) |
| Health Technologists | 72 (47.4%) | 80 (52.6%) |
| Total (Category) | 1,018 (48.9%) | 1,062 (51.1%) |
| Total (Overall) | 4,066 (59.9%) | 2,725 (40.1%) |
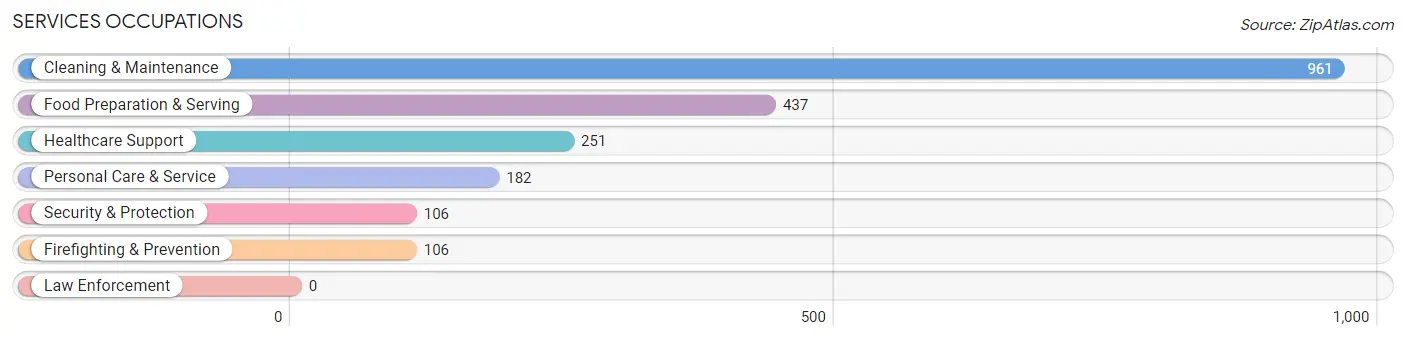
Services Occupations
The most common Services occupations in North Fair Oaks are Cleaning & Maintenance (961 | 14.1%), Food Preparation & Serving (437 | 6.4%), Healthcare Support (251 | 3.7%), Personal Care & Service (182 | 2.7%), and Security & Protection (106 | 1.6%).
Services Occupations by Sex
Within the Services occupations in North Fair Oaks, the most male-oriented occupations are Food Preparation & Serving (77.8%), Cleaning & Maintenance (60.2%), and Security & Protection (44.3%), while the most female-oriented occupations are Personal Care & Service (90.1%), Healthcare Support (75.7%), and Security & Protection (55.7%).
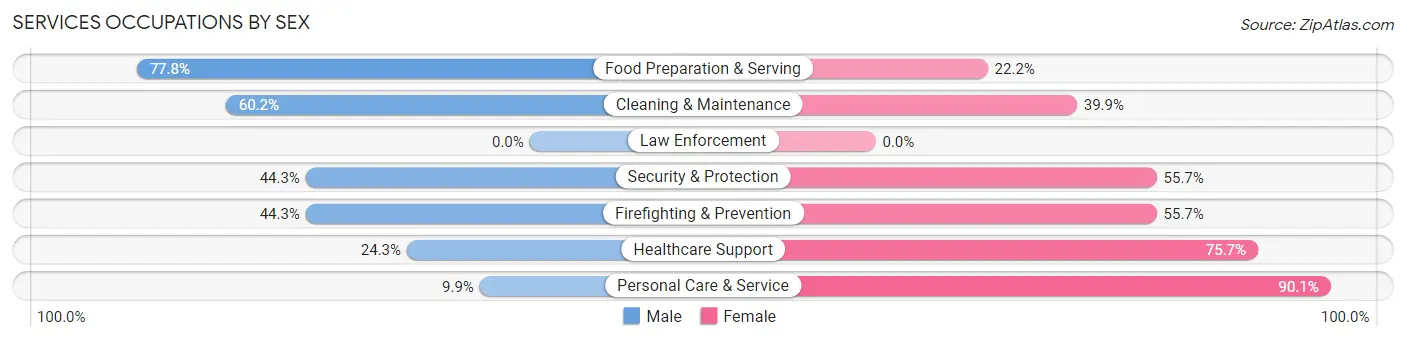
| Occupation | Male | Female |
| Healthcare Support | 61 (24.3%) | 190 (75.7%) |
| Security & Protection | 47 (44.3%) | 59 (55.7%) |
| Firefighting & Prevention | 47 (44.3%) | 59 (55.7%) |
| Law Enforcement | 0 (0.0%) | 0 (0.0%) |
| Food Preparation & Serving | 340 (77.8%) | 97 (22.2%) |
| Cleaning & Maintenance | 578 (60.2%) | 383 (39.9%) |
| Personal Care & Service | 18 (9.9%) | 164 (90.1%) |
| Total (Category) | 1,044 (53.9%) | 893 (46.1%) |
| Total (Overall) | 4,066 (59.9%) | 2,725 (40.1%) |
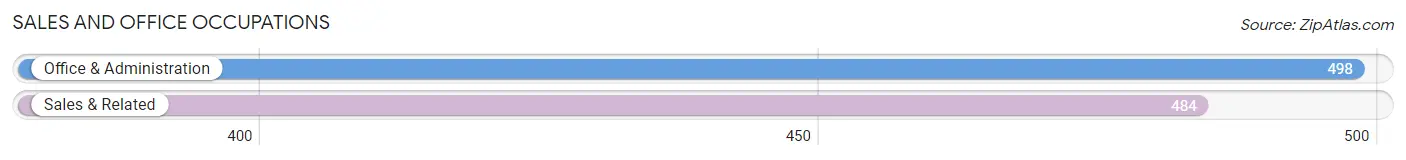
Sales and Office Occupations
The most common Sales and Office occupations in North Fair Oaks are Office & Administration (498 | 7.3%), and Sales & Related (484 | 7.1%).
Sales and Office Occupations by Sex
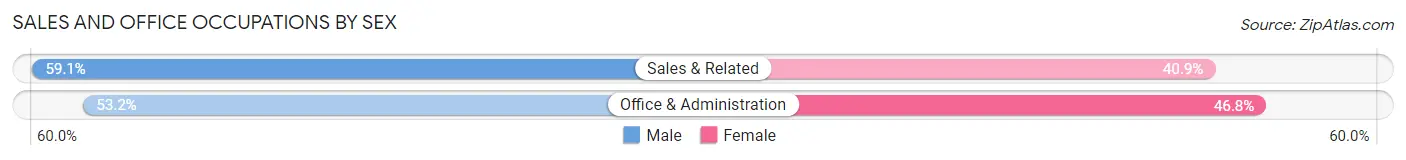
| Occupation | Male | Female |
| Sales & Related | 286 (59.1%) | 198 (40.9%) |
| Office & Administration | 265 (53.2%) | 233 (46.8%) |
| Total (Category) | 551 (56.1%) | 431 (43.9%) |
| Total (Overall) | 4,066 (59.9%) | 2,725 (40.1%) |
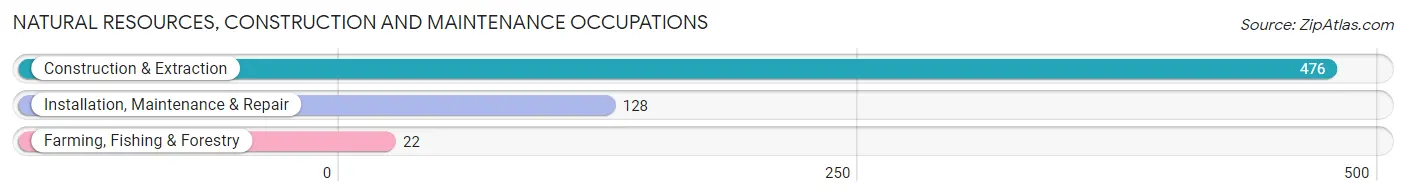
Natural Resources, Construction and Maintenance Occupations
The most common Natural Resources, Construction and Maintenance occupations in North Fair Oaks are Construction & Extraction (476 | 7.0%), Installation, Maintenance & Repair (128 | 1.9%), and Farming, Fishing & Forestry (22 | 0.3%).
Natural Resources, Construction and Maintenance Occupations by Sex
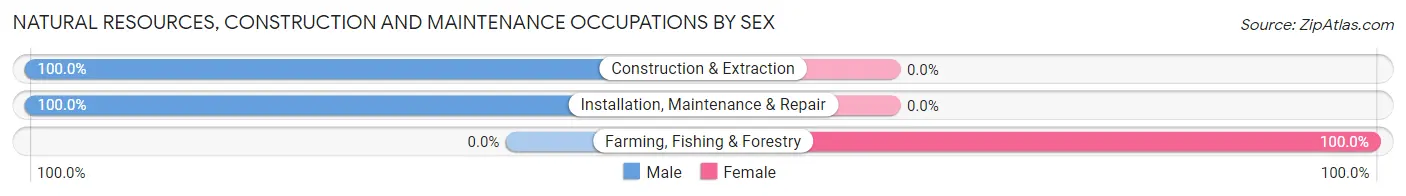
| Occupation | Male | Female |
| Farming, Fishing & Forestry | 0 (0.0%) | 22 (100.0%) |
| Construction & Extraction | 476 (100.0%) | 0 (0.0%) |
| Installation, Maintenance & Repair | 128 (100.0%) | 0 (0.0%) |
| Total (Category) | 604 (96.5%) | 22 (3.5%) |
| Total (Overall) | 4,066 (59.9%) | 2,725 (40.1%) |
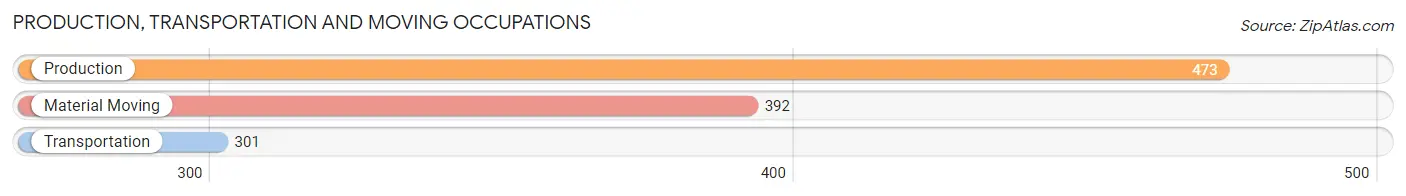
Production, Transportation and Moving Occupations
The most common Production, Transportation and Moving occupations in North Fair Oaks are Production (473 | 7.0%), Material Moving (392 | 5.8%), and Transportation (301 | 4.4%).
Production, Transportation and Moving Occupations by Sex
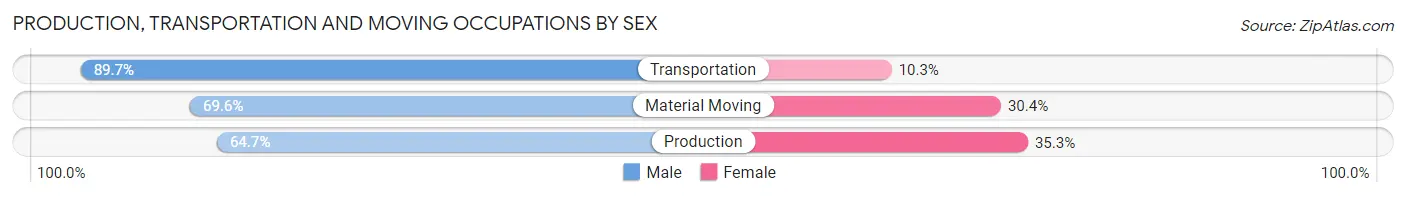
| Occupation | Male | Female |
| Production | 306 (64.7%) | 167 (35.3%) |
| Transportation | 270 (89.7%) | 31 (10.3%) |
| Material Moving | 273 (69.6%) | 119 (30.4%) |
| Total (Category) | 849 (72.8%) | 317 (27.2%) |
| Total (Overall) | 4,066 (59.9%) | 2,725 (40.1%) |
Employment Industries by Sex in North Fair Oaks
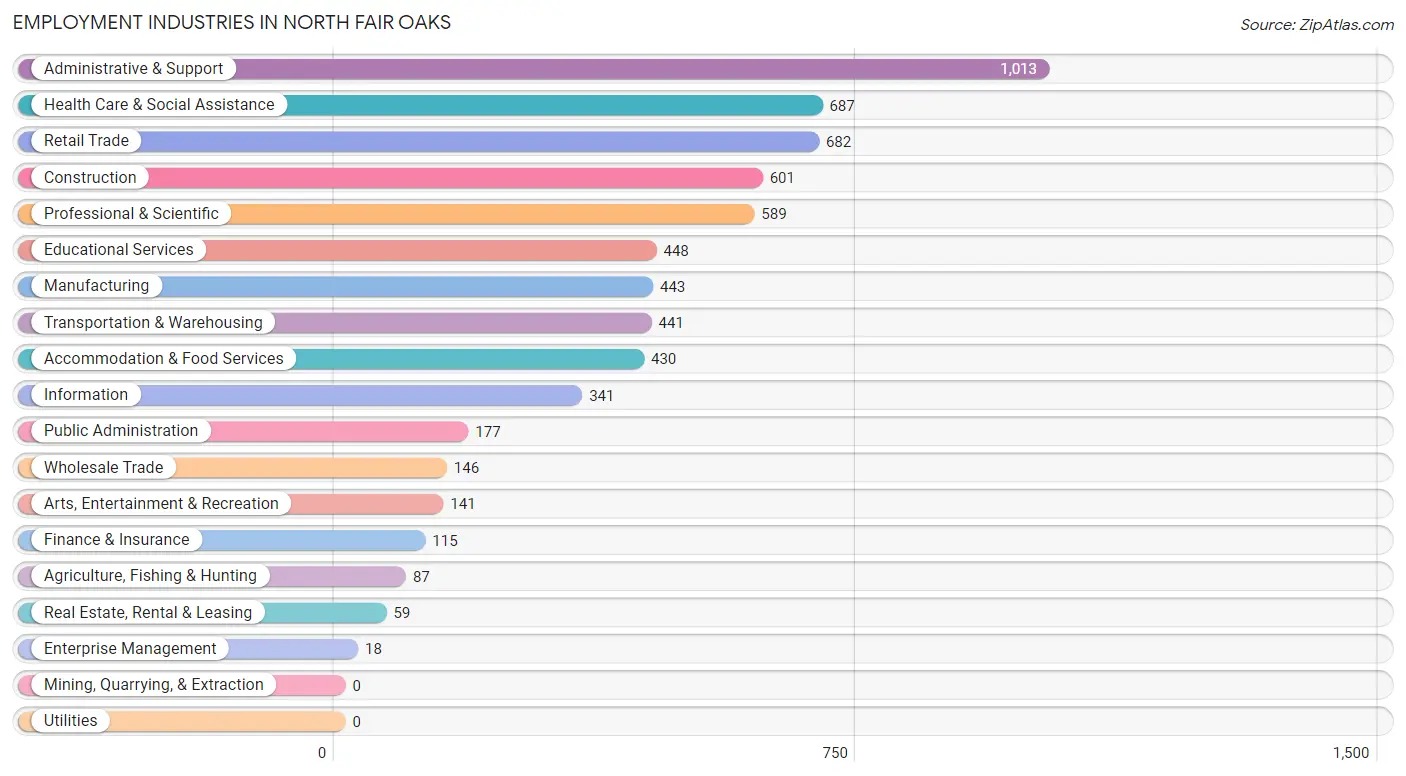
Employment Industries in North Fair Oaks
The major employment industries in North Fair Oaks include Administrative & Support (1,013 | 14.9%), Health Care & Social Assistance (687 | 10.1%), Retail Trade (682 | 10.0%), Construction (601 | 8.8%), and Professional & Scientific (589 | 8.7%).
Employment Industries by Sex in North Fair Oaks
The North Fair Oaks industries that see more men than women are Wholesale Trade (100.0%), Enterprise Management (100.0%), and Construction (97.7%), whereas the industries that tend to have a higher number of women are Agriculture, Fishing & Hunting (88.5%), Educational Services (74.6%), and Health Care & Social Assistance (72.8%).
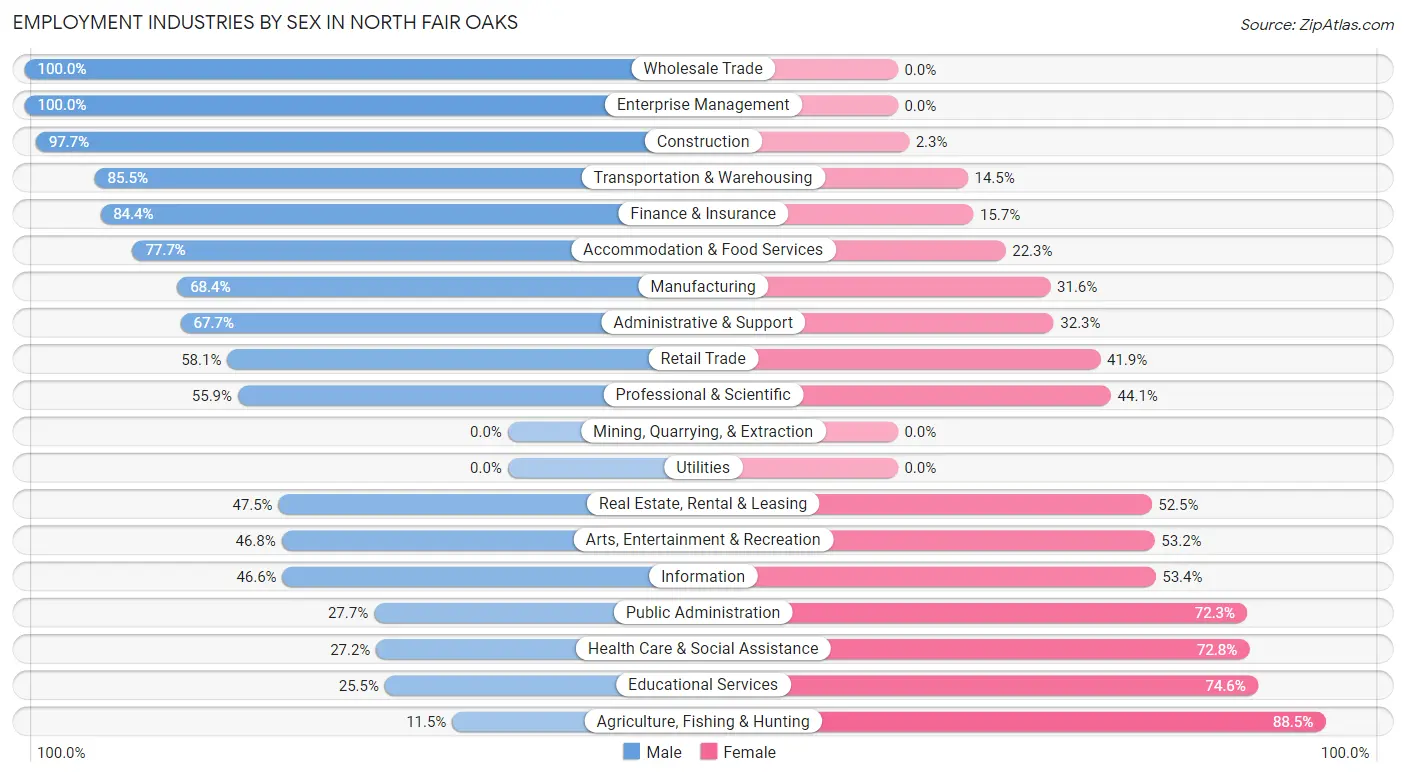
| Industry | Male | Female |
| Agriculture, Fishing & Hunting | 10 (11.5%) | 77 (88.5%) |
| Mining, Quarrying, & Extraction | 0 (0.0%) | 0 (0.0%) |
| Construction | 587 (97.7%) | 14 (2.3%) |
| Manufacturing | 303 (68.4%) | 140 (31.6%) |
| Wholesale Trade | 146 (100.0%) | 0 (0.0%) |
| Retail Trade | 396 (58.1%) | 286 (41.9%) |
| Transportation & Warehousing | 377 (85.5%) | 64 (14.5%) |
| Utilities | 0 (0.0%) | 0 (0.0%) |
| Information | 159 (46.6%) | 182 (53.4%) |
| Finance & Insurance | 97 (84.4%) | 18 (15.7%) |
| Real Estate, Rental & Leasing | 28 (47.5%) | 31 (52.5%) |
| Professional & Scientific | 329 (55.9%) | 260 (44.1%) |
| Enterprise Management | 18 (100.0%) | 0 (0.0%) |
| Administrative & Support | 686 (67.7%) | 327 (32.3%) |
| Educational Services | 114 (25.5%) | 334 (74.6%) |
| Health Care & Social Assistance | 187 (27.2%) | 500 (72.8%) |
| Arts, Entertainment & Recreation | 66 (46.8%) | 75 (53.2%) |
| Accommodation & Food Services | 334 (77.7%) | 96 (22.3%) |
| Public Administration | 49 (27.7%) | 128 (72.3%) |
| Total | 4,066 (59.9%) | 2,725 (40.1%) |
Education in North Fair Oaks
School Enrollment in North Fair Oaks
The most common levels of schooling among the 2,962 students in North Fair Oaks are elementary school (766 | 25.9%), college / undergraduate (633 | 21.4%), and middle school (504 | 17.0%).
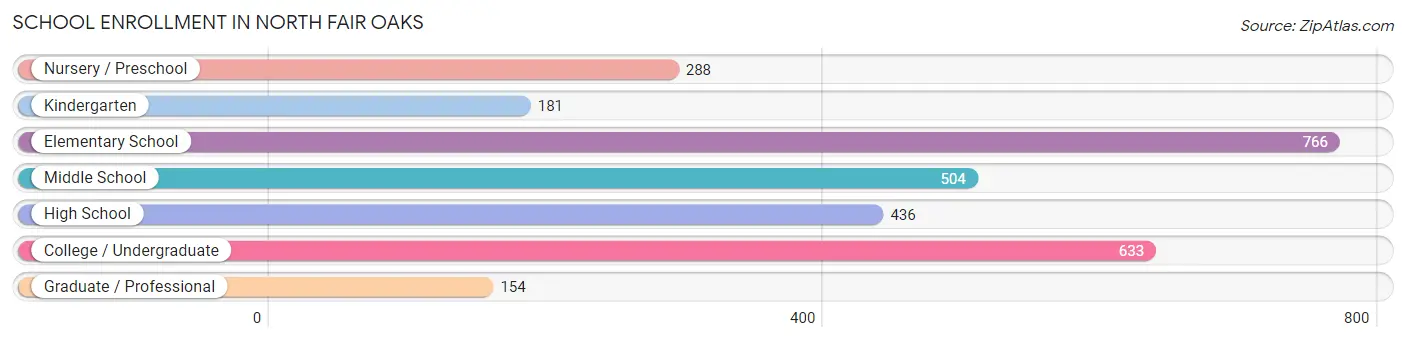
| School Level | # Students | % Students |
| Nursery / Preschool | 288 | 9.7% |
| Kindergarten | 181 | 6.1% |
| Elementary School | 766 | 25.9% |
| Middle School | 504 | 17.0% |
| High School | 436 | 14.7% |
| College / Undergraduate | 633 | 21.4% |
| Graduate / Professional | 154 | 5.2% |
| Total | 2,962 | 100.0% |
School Enrollment by Age by Funding Source in North Fair Oaks
Out of a total of 2,962 students who are enrolled in schools in North Fair Oaks, 418 (14.1%) attend a private institution, while the remaining 2,544 (85.9%) are enrolled in public schools. The age group of 20 to 24 year olds has the highest likelihood of being enrolled in private schools, with 128 (40.5% in the age bracket) enrolled. Conversely, the age group of 18 to 19 year olds has the lowest likelihood of being enrolled in a private school, with 227 (100.0% in the age bracket) attending a public institution.
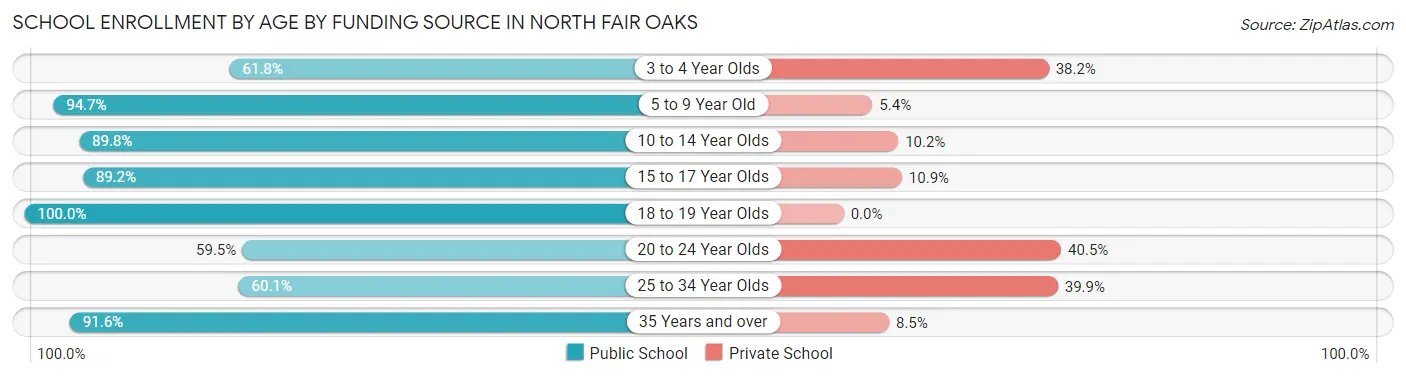
| Age Bracket | Public School | Private School |
| 3 to 4 Year Olds | 89 (61.8%) | 55 (38.2%) |
| 5 to 9 Year Old | 938 (94.7%) | 53 (5.3%) |
| 10 to 14 Year Olds | 628 (89.8%) | 71 (10.2%) |
| 15 to 17 Year Olds | 304 (89.1%) | 37 (10.8%) |
| 18 to 19 Year Olds | 227 (100.0%) | 0 (0.0%) |
| 20 to 24 Year Olds | 188 (59.5%) | 128 (40.5%) |
| 25 to 34 Year Olds | 104 (60.1%) | 69 (39.9%) |
| 35 Years and over | 65 (91.5%) | 6 (8.5%) |
| Total | 2,544 (85.9%) | 418 (14.1%) |
Educational Attainment by Field of Study in North Fair Oaks
Engineering (488 | 17.2%), business (334 | 11.7%), social sciences (290 | 10.2%), computers & mathematics (248 | 8.7%), and science & technology (248 | 8.7%) are the most common fields of study among 2,842 individuals in North Fair Oaks who have obtained a bachelor's degree or higher.
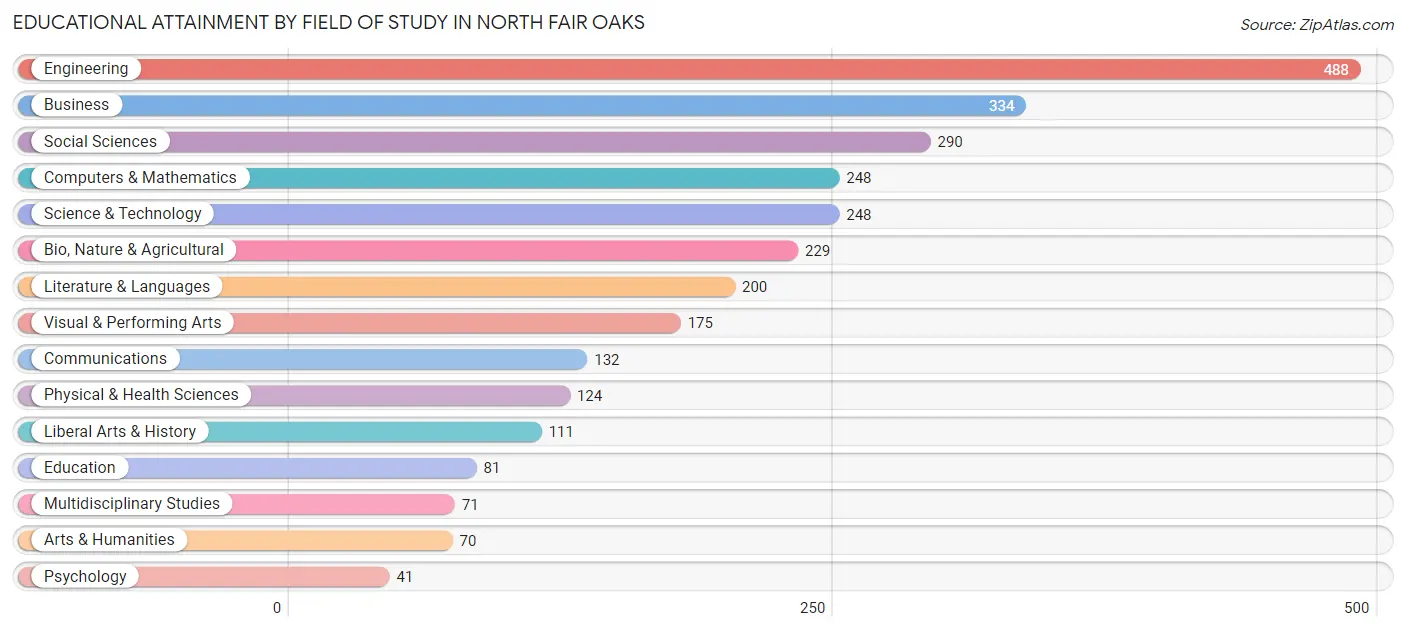
| Field of Study | # Graduates | % Graduates |
| Computers & Mathematics | 248 | 8.7% |
| Bio, Nature & Agricultural | 229 | 8.1% |
| Physical & Health Sciences | 124 | 4.4% |
| Psychology | 41 | 1.4% |
| Social Sciences | 290 | 10.2% |
| Engineering | 488 | 17.2% |
| Multidisciplinary Studies | 71 | 2.5% |
| Science & Technology | 248 | 8.7% |
| Business | 334 | 11.7% |
| Education | 81 | 2.9% |
| Literature & Languages | 200 | 7.0% |
| Liberal Arts & History | 111 | 3.9% |
| Visual & Performing Arts | 175 | 6.2% |
| Communications | 132 | 4.6% |
| Arts & Humanities | 70 | 2.5% |
| Total | 2,842 | 100.0% |
Transportation & Commute in North Fair Oaks
Vehicle Availability by Sex in North Fair Oaks
The most prevalent vehicle ownership categories in North Fair Oaks are males with 2 vehicles (1,304, accounting for 32.7%) and females with 2 vehicles (784, making up 49.9%).
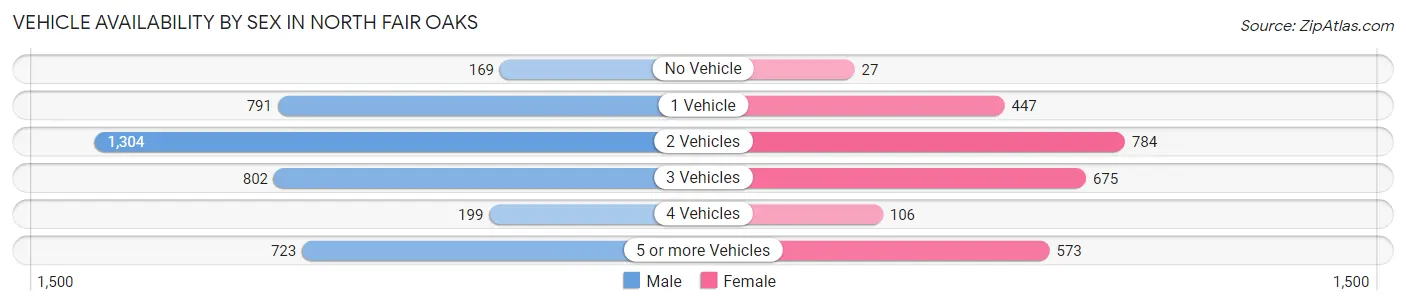
| Vehicles Available | Male | Female |
| No Vehicle | 169 (4.2%) | 27 (1.0%) |
| 1 Vehicle | 791 (19.8%) | 447 (17.1%) |
| 2 Vehicles | 1,304 (32.7%) | 784 (30.0%) |
| 3 Vehicles | 802 (20.1%) | 675 (25.8%) |
| 4 Vehicles | 199 (5.0%) | 106 (4.1%) |
| 5 or more Vehicles | 723 (18.1%) | 573 (21.9%) |
| Total | 3,988 (100.0%) | 2,612 (100.0%) |
Commute Time in North Fair Oaks
The most frequently occuring commute durations in North Fair Oaks are 15 to 19 minutes (1,232 commuters, 21.3%), 20 to 24 minutes (929 commuters, 16.1%), and 10 to 14 minutes (845 commuters, 14.6%).
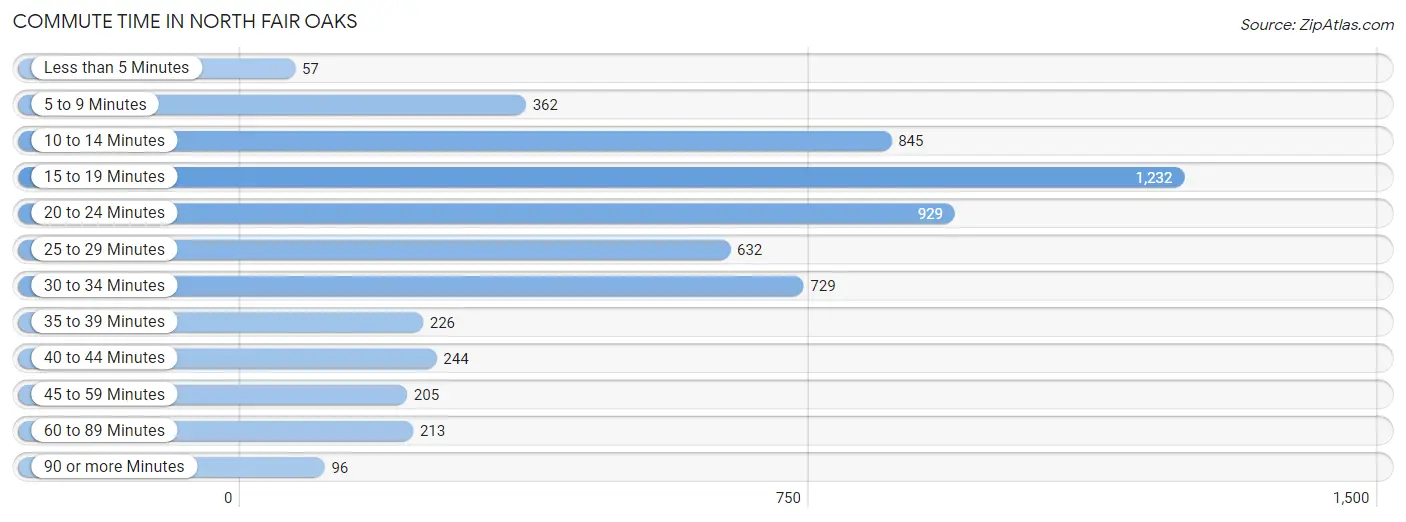
| Commute Time | # Commuters | % Commuters |
| Less than 5 Minutes | 57 | 1.0% |
| 5 to 9 Minutes | 362 | 6.3% |
| 10 to 14 Minutes | 845 | 14.6% |
| 15 to 19 Minutes | 1,232 | 21.3% |
| 20 to 24 Minutes | 929 | 16.1% |
| 25 to 29 Minutes | 632 | 11.0% |
| 30 to 34 Minutes | 729 | 12.6% |
| 35 to 39 Minutes | 226 | 3.9% |
| 40 to 44 Minutes | 244 | 4.2% |
| 45 to 59 Minutes | 205 | 3.5% |
| 60 to 89 Minutes | 213 | 3.7% |
| 90 or more Minutes | 96 | 1.7% |
Commute Time by Sex in North Fair Oaks
The most common commute times in North Fair Oaks are 15 to 19 minutes (802 commuters, 22.8%) for males and 15 to 19 minutes (430 commuters, 19.1%) for females.
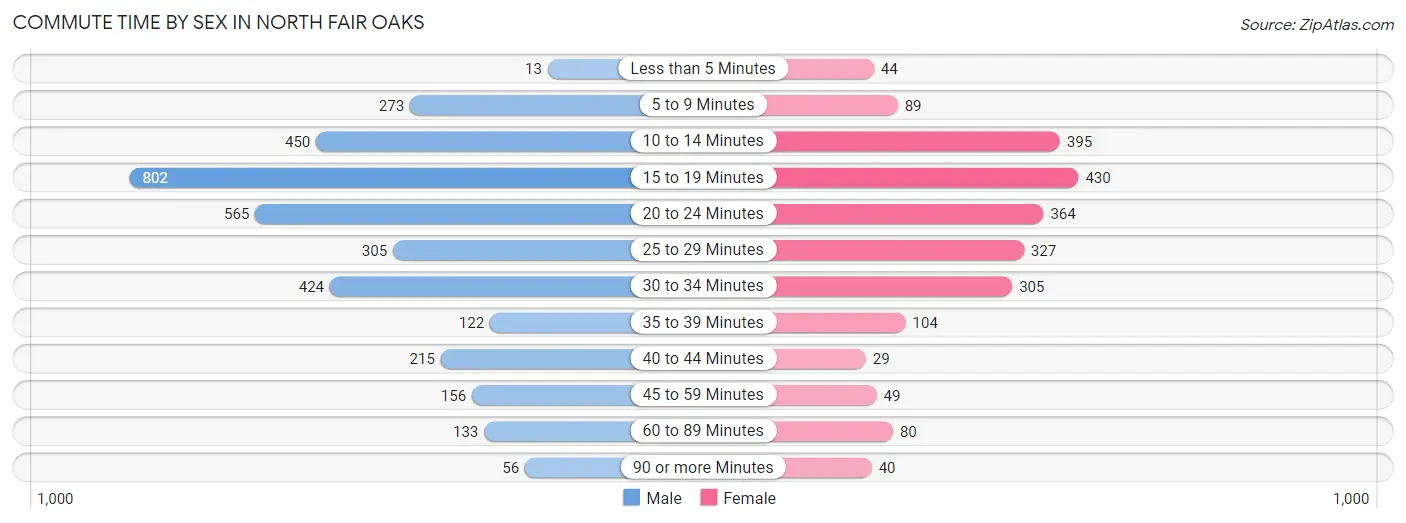
| Commute Time | Male | Female |
| Less than 5 Minutes | 13 (0.4%) | 44 (1.9%) |
| 5 to 9 Minutes | 273 (7.8%) | 89 (4.0%) |
| 10 to 14 Minutes | 450 (12.8%) | 395 (17.5%) |
| 15 to 19 Minutes | 802 (22.8%) | 430 (19.1%) |
| 20 to 24 Minutes | 565 (16.1%) | 364 (16.1%) |
| 25 to 29 Minutes | 305 (8.7%) | 327 (14.5%) |
| 30 to 34 Minutes | 424 (12.1%) | 305 (13.5%) |
| 35 to 39 Minutes | 122 (3.5%) | 104 (4.6%) |
| 40 to 44 Minutes | 215 (6.1%) | 29 (1.3%) |
| 45 to 59 Minutes | 156 (4.4%) | 49 (2.2%) |
| 60 to 89 Minutes | 133 (3.8%) | 80 (3.5%) |
| 90 or more Minutes | 56 (1.6%) | 40 (1.8%) |
Time of Departure to Work by Sex in North Fair Oaks
The most frequent times of departure to work in North Fair Oaks are 7:00 AM to 7:29 AM (895, 25.5%) for males and 8:00 AM to 8:29 AM (425, 18.8%) for females.
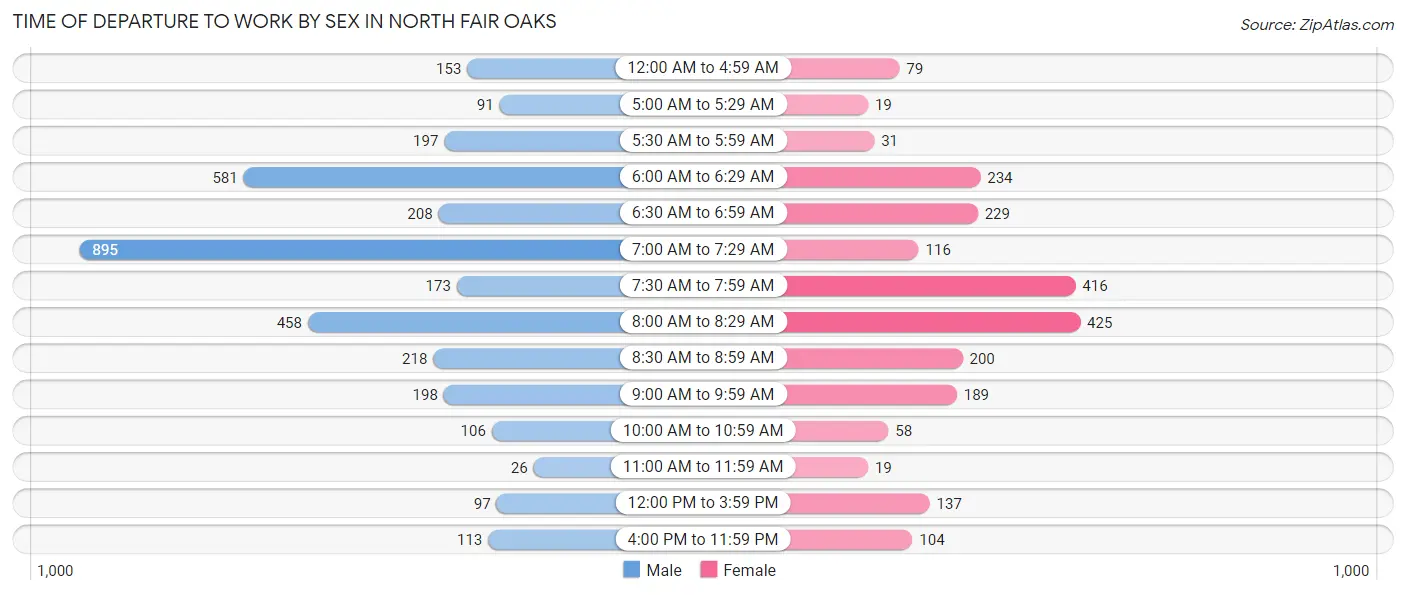
| Time of Departure | Male | Female |
| 12:00 AM to 4:59 AM | 153 (4.3%) | 79 (3.5%) |
| 5:00 AM to 5:29 AM | 91 (2.6%) | 19 (0.8%) |
| 5:30 AM to 5:59 AM | 197 (5.6%) | 31 (1.4%) |
| 6:00 AM to 6:29 AM | 581 (16.5%) | 234 (10.4%) |
| 6:30 AM to 6:59 AM | 208 (5.9%) | 229 (10.2%) |
| 7:00 AM to 7:29 AM | 895 (25.5%) | 116 (5.1%) |
| 7:30 AM to 7:59 AM | 173 (4.9%) | 416 (18.4%) |
| 8:00 AM to 8:29 AM | 458 (13.0%) | 425 (18.8%) |
| 8:30 AM to 8:59 AM | 218 (6.2%) | 200 (8.9%) |
| 9:00 AM to 9:59 AM | 198 (5.6%) | 189 (8.4%) |
| 10:00 AM to 10:59 AM | 106 (3.0%) | 58 (2.6%) |
| 11:00 AM to 11:59 AM | 26 (0.7%) | 19 (0.8%) |
| 12:00 PM to 3:59 PM | 97 (2.8%) | 137 (6.1%) |
| 4:00 PM to 11:59 PM | 113 (3.2%) | 104 (4.6%) |
| Total | 3,514 (100.0%) | 2,256 (100.0%) |
Housing Occupancy in North Fair Oaks
Occupancy by Ownership in North Fair Oaks
Of the total 3,921 dwellings in North Fair Oaks, owner-occupied units account for 2,055 (52.4%), while renter-occupied units make up 1,866 (47.6%).
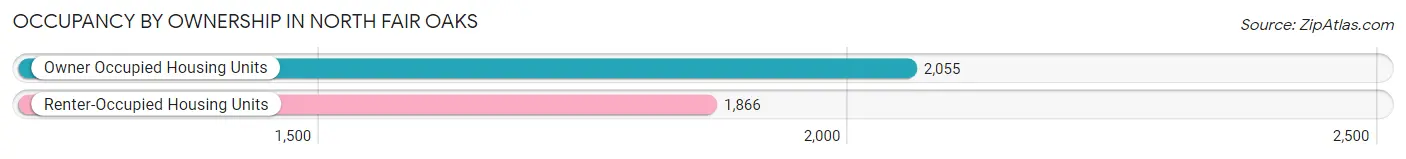
| Occupancy | # Housing Units | % Housing Units |
| Owner Occupied Housing Units | 2,055 | 52.4% |
| Renter-Occupied Housing Units | 1,866 | 47.6% |
| Total Occupied Housing Units | 3,921 | 100.0% |
Occupancy by Household Size in North Fair Oaks
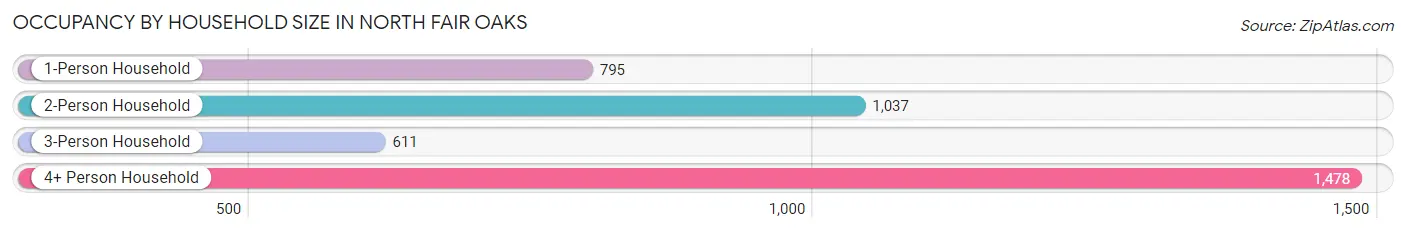
| Household Size | # Housing Units | % Housing Units |
| 1-Person Household | 795 | 20.3% |
| 2-Person Household | 1,037 | 26.5% |
| 3-Person Household | 611 | 15.6% |
| 4+ Person Household | 1,478 | 37.7% |
| Total Housing Units | 3,921 | 100.0% |
Occupancy by Ownership by Household Size in North Fair Oaks
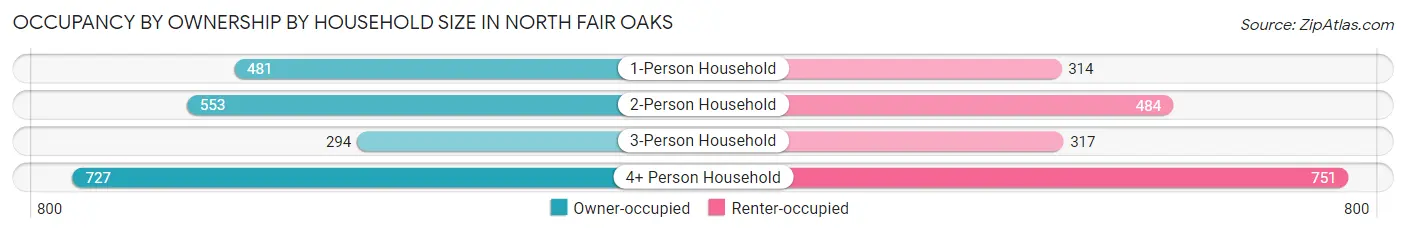
| Household Size | Owner-occupied | Renter-occupied |
| 1-Person Household | 481 (60.5%) | 314 (39.5%) |
| 2-Person Household | 553 (53.3%) | 484 (46.7%) |
| 3-Person Household | 294 (48.1%) | 317 (51.9%) |
| 4+ Person Household | 727 (49.2%) | 751 (50.8%) |
| Total Housing Units | 2,055 (52.4%) | 1,866 (47.6%) |
Occupancy by Educational Attainment in North Fair Oaks
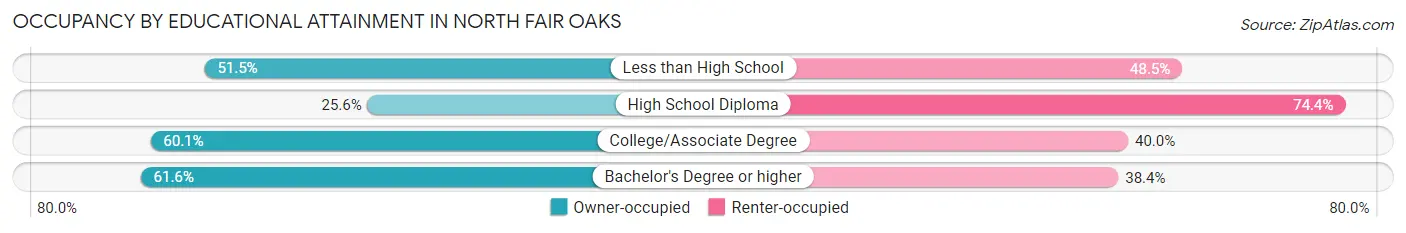
| Household Size | Owner-occupied | Renter-occupied |
| Less than High School | 543 (51.5%) | 512 (48.5%) |
| High School Diploma | 171 (25.6%) | 497 (74.4%) |
| College/Associate Degree | 499 (60.1%) | 332 (40.0%) |
| Bachelor's Degree or higher | 842 (61.6%) | 525 (38.4%) |
Occupancy by Age of Householder in North Fair Oaks
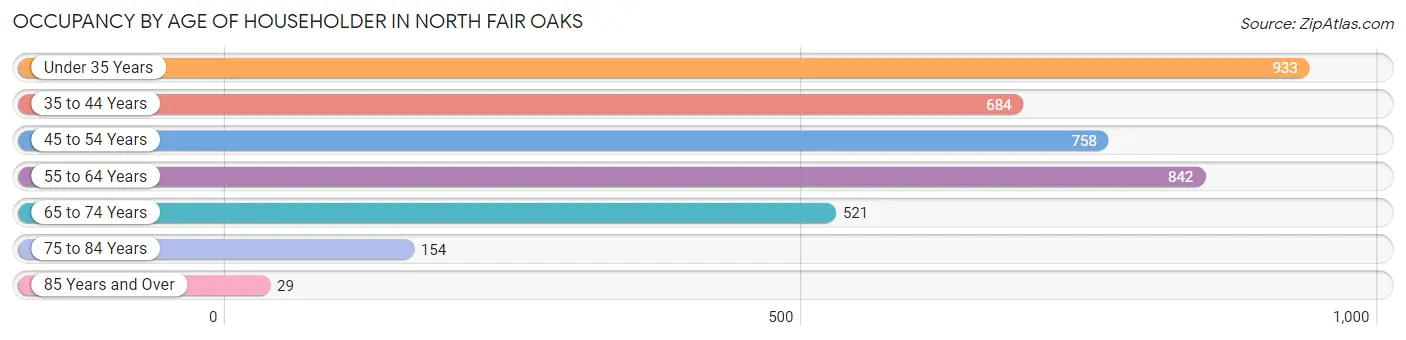
| Age Bracket | # Households | % Households |
| Under 35 Years | 933 | 23.8% |
| 35 to 44 Years | 684 | 17.4% |
| 45 to 54 Years | 758 | 19.3% |
| 55 to 64 Years | 842 | 21.5% |
| 65 to 74 Years | 521 | 13.3% |
| 75 to 84 Years | 154 | 3.9% |
| 85 Years and Over | 29 | 0.7% |
| Total | 3,921 | 100.0% |
Housing Finances in North Fair Oaks
Median Income by Occupancy in North Fair Oaks
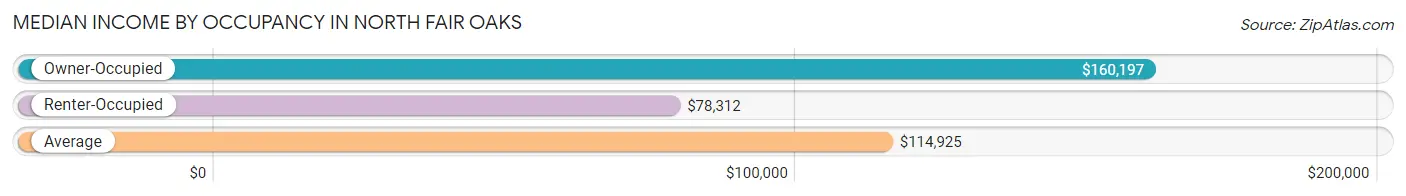
| Occupancy Type | # Households | Median Income |
| Owner-Occupied | 2,055 (52.4%) | $160,197 |
| Renter-Occupied | 1,866 (47.6%) | $78,312 |
| Average | 3,921 (100.0%) | $114,925 |
Occupancy by Householder Income Bracket in North Fair Oaks
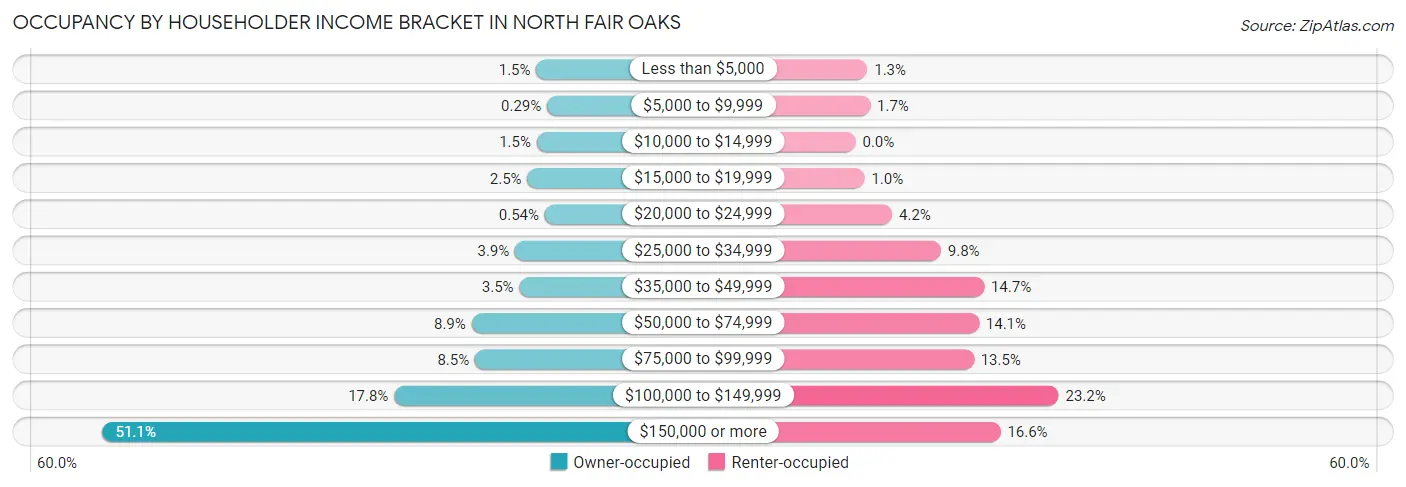
| Income Bracket | Owner-occupied | Renter-occupied |
| Less than $5,000 | 31 (1.5%) | 25 (1.3%) |
| $5,000 to $9,999 | 6 (0.3%) | 31 (1.7%) |
| $10,000 to $14,999 | 30 (1.5%) | 0 (0.0%) |
| $15,000 to $19,999 | 52 (2.5%) | 19 (1.0%) |
| $20,000 to $24,999 | 11 (0.5%) | 78 (4.2%) |
| $25,000 to $34,999 | 81 (3.9%) | 182 (9.8%) |
| $35,000 to $49,999 | 71 (3.5%) | 274 (14.7%) |
| $50,000 to $74,999 | 183 (8.9%) | 263 (14.1%) |
| $75,000 to $99,999 | 175 (8.5%) | 252 (13.5%) |
| $100,000 to $149,999 | 365 (17.8%) | 433 (23.2%) |
| $150,000 or more | 1,050 (51.1%) | 309 (16.6%) |
| Total | 2,055 (100.0%) | 1,866 (100.0%) |
Monthly Housing Cost Tiers in North Fair Oaks
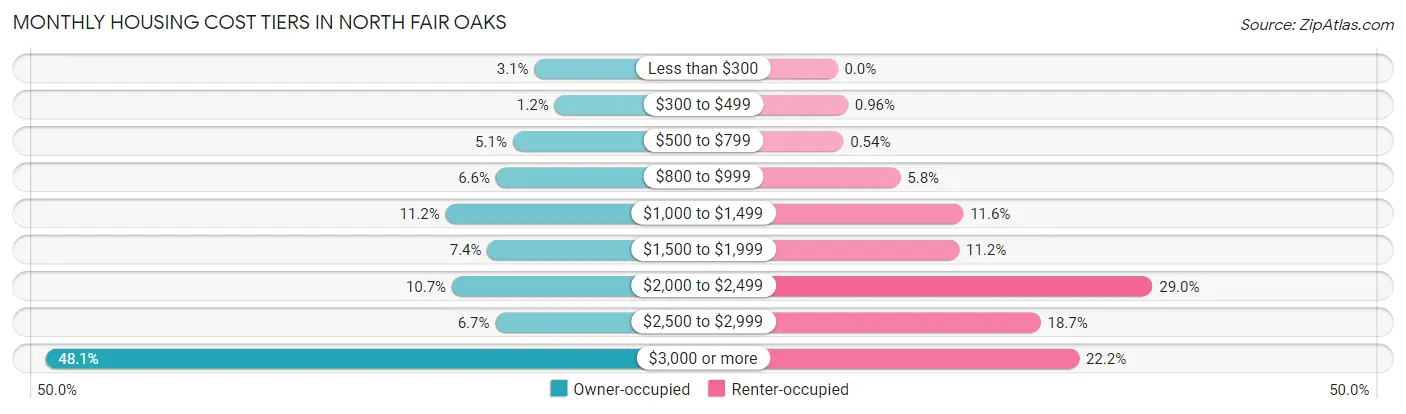
| Monthly Cost | Owner-occupied | Renter-occupied |
| Less than $300 | 63 (3.1%) | 0 (0.0%) |
| $300 to $499 | 25 (1.2%) | 18 (1.0%) |
| $500 to $799 | 104 (5.1%) | 10 (0.5%) |
| $800 to $999 | 136 (6.6%) | 108 (5.8%) |
| $1,000 to $1,499 | 231 (11.2%) | 216 (11.6%) |
| $1,500 to $1,999 | 152 (7.4%) | 209 (11.2%) |
| $2,000 to $2,499 | 219 (10.7%) | 541 (29.0%) |
| $2,500 to $2,999 | 137 (6.7%) | 349 (18.7%) |
| $3,000 or more | 988 (48.1%) | 415 (22.2%) |
| Total | 2,055 (100.0%) | 1,866 (100.0%) |
Physical Housing Characteristics in North Fair Oaks
Housing Structures in North Fair Oaks
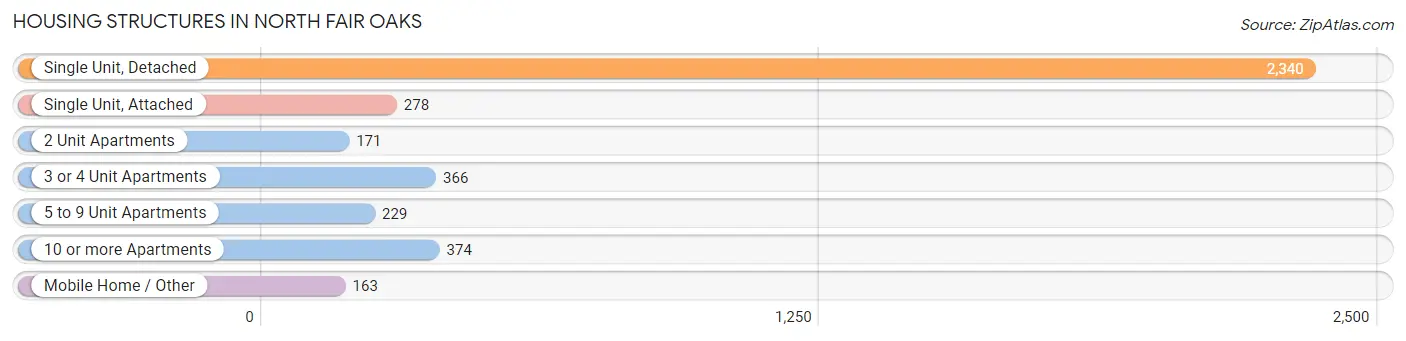
| Structure Type | # Housing Units | % Housing Units |
| Single Unit, Detached | 2,340 | 59.7% |
| Single Unit, Attached | 278 | 7.1% |
| 2 Unit Apartments | 171 | 4.4% |
| 3 or 4 Unit Apartments | 366 | 9.3% |
| 5 to 9 Unit Apartments | 229 | 5.8% |
| 10 or more Apartments | 374 | 9.5% |
| Mobile Home / Other | 163 | 4.2% |
| Total | 3,921 | 100.0% |
Housing Structures by Occupancy in North Fair Oaks
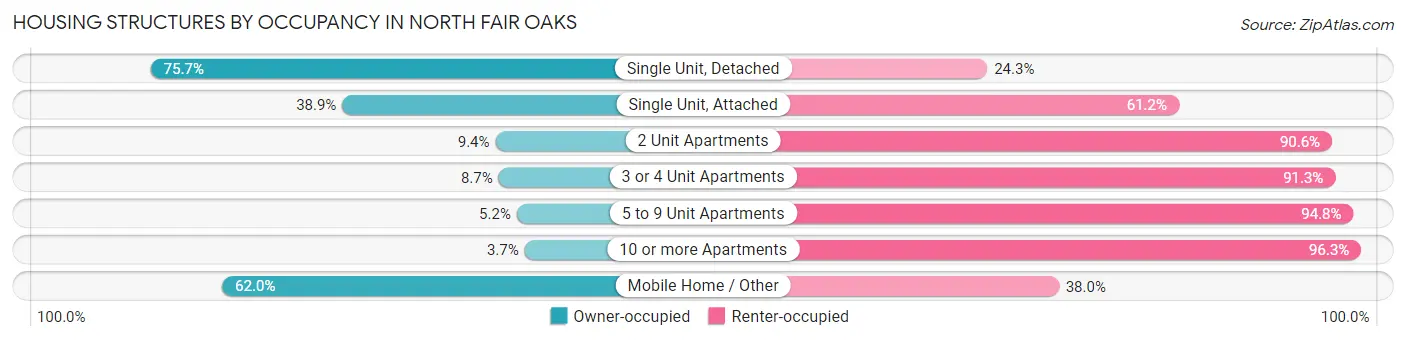
| Structure Type | Owner-occupied | Renter-occupied |
| Single Unit, Detached | 1,772 (75.7%) | 568 (24.3%) |
| Single Unit, Attached | 108 (38.9%) | 170 (61.2%) |
| 2 Unit Apartments | 16 (9.4%) | 155 (90.6%) |
| 3 or 4 Unit Apartments | 32 (8.7%) | 334 (91.3%) |
| 5 to 9 Unit Apartments | 12 (5.2%) | 217 (94.8%) |
| 10 or more Apartments | 14 (3.7%) | 360 (96.3%) |
| Mobile Home / Other | 101 (62.0%) | 62 (38.0%) |
| Total | 2,055 (52.4%) | 1,866 (47.6%) |
Housing Structures by Number of Rooms in North Fair Oaks
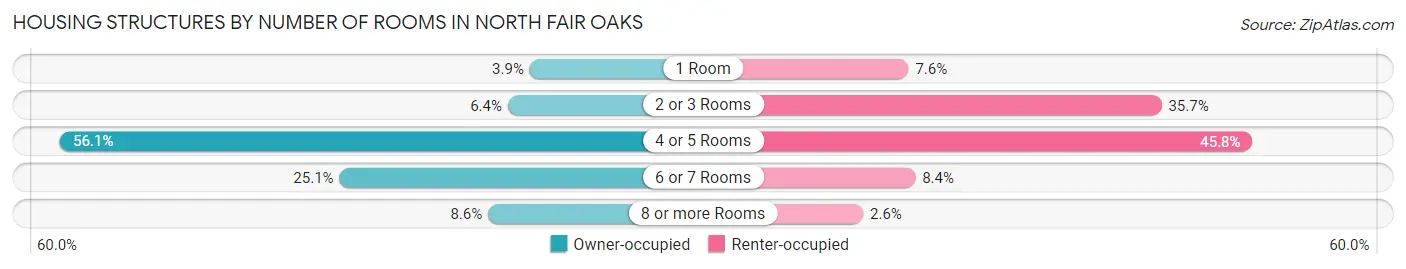
| Number of Rooms | Owner-occupied | Renter-occupied |
| 1 Room | 81 (3.9%) | 142 (7.6%) |
| 2 or 3 Rooms | 131 (6.4%) | 666 (35.7%) |
| 4 or 5 Rooms | 1,152 (56.1%) | 854 (45.8%) |
| 6 or 7 Rooms | 515 (25.1%) | 156 (8.4%) |
| 8 or more Rooms | 176 (8.6%) | 48 (2.6%) |
| Total | 2,055 (100.0%) | 1,866 (100.0%) |
Housing Structure by Heating Type in North Fair Oaks
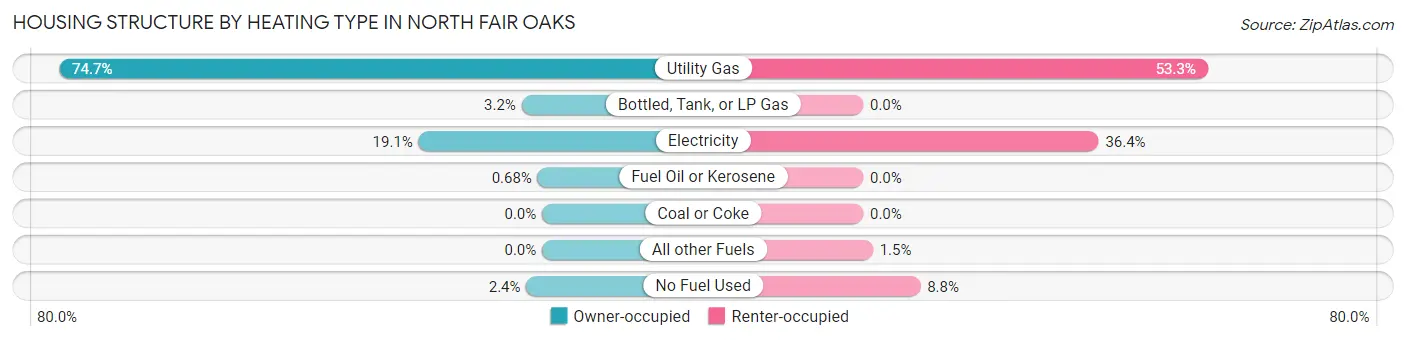
| Heating Type | Owner-occupied | Renter-occupied |
| Utility Gas | 1,534 (74.7%) | 994 (53.3%) |
| Bottled, Tank, or LP Gas | 65 (3.2%) | 0 (0.0%) |
| Electricity | 392 (19.1%) | 679 (36.4%) |
| Fuel Oil or Kerosene | 14 (0.7%) | 0 (0.0%) |
| Coal or Coke | 0 (0.0%) | 0 (0.0%) |
| All other Fuels | 0 (0.0%) | 28 (1.5%) |
| No Fuel Used | 50 (2.4%) | 165 (8.8%) |
| Total | 2,055 (100.0%) | 1,866 (100.0%) |
Household Vehicle Usage in North Fair Oaks
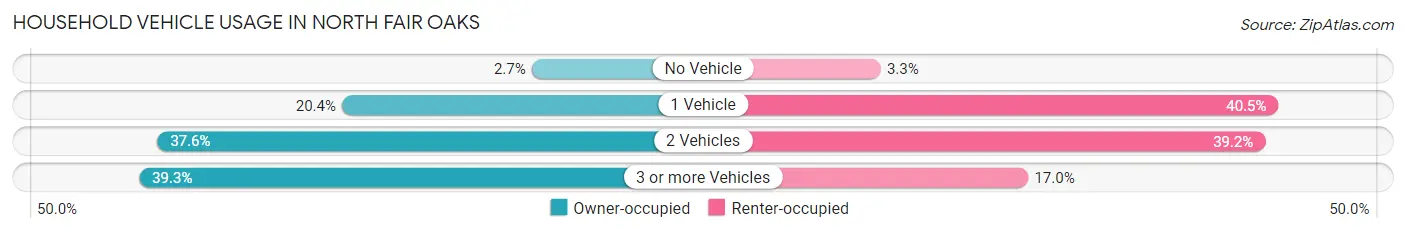
| Vehicles per Household | Owner-occupied | Renter-occupied |
| No Vehicle | 55 (2.7%) | 61 (3.3%) |
| 1 Vehicle | 419 (20.4%) | 755 (40.5%) |
| 2 Vehicles | 773 (37.6%) | 732 (39.2%) |
| 3 or more Vehicles | 808 (39.3%) | 318 (17.0%) |
| Total | 2,055 (100.0%) | 1,866 (100.0%) |
Real Estate & Mortgages in North Fair Oaks
Real Estate and Mortgage Overview in North Fair Oaks
| Characteristic | Without Mortgage | With Mortgage |
| Housing Units | 513 | 1,542 |
| Median Property Value | $1,050,300 | $1,199,300 |
| Median Household Income | $118,527 | $864 |
| Monthly Housing Costs | $951 | $983 |
| Real Estate Taxes | $5,957 | $84 |
Property Value by Mortgage Status in North Fair Oaks
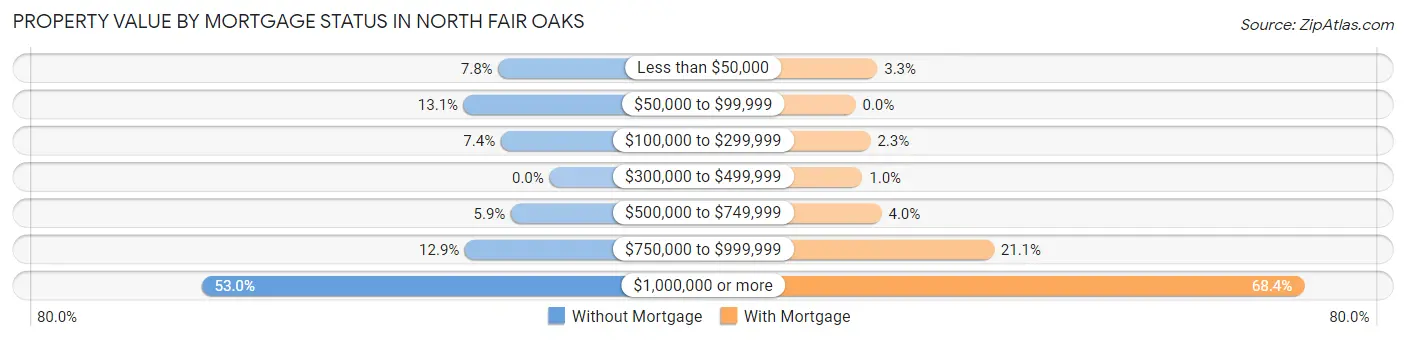
| Property Value | Without Mortgage | With Mortgage |
| Less than $50,000 | 40 (7.8%) | 51 (3.3%) |
| $50,000 to $99,999 | 67 (13.1%) | 0 (0.0%) |
| $100,000 to $299,999 | 38 (7.4%) | 35 (2.3%) |
| $300,000 to $499,999 | 0 (0.0%) | 16 (1.0%) |
| $500,000 to $749,999 | 30 (5.9%) | 61 (4.0%) |
| $750,000 to $999,999 | 66 (12.9%) | 325 (21.1%) |
| $1,000,000 or more | 272 (53.0%) | 1,054 (68.3%) |
| Total | 513 (100.0%) | 1,542 (100.0%) |
Household Income by Mortgage Status in North Fair Oaks
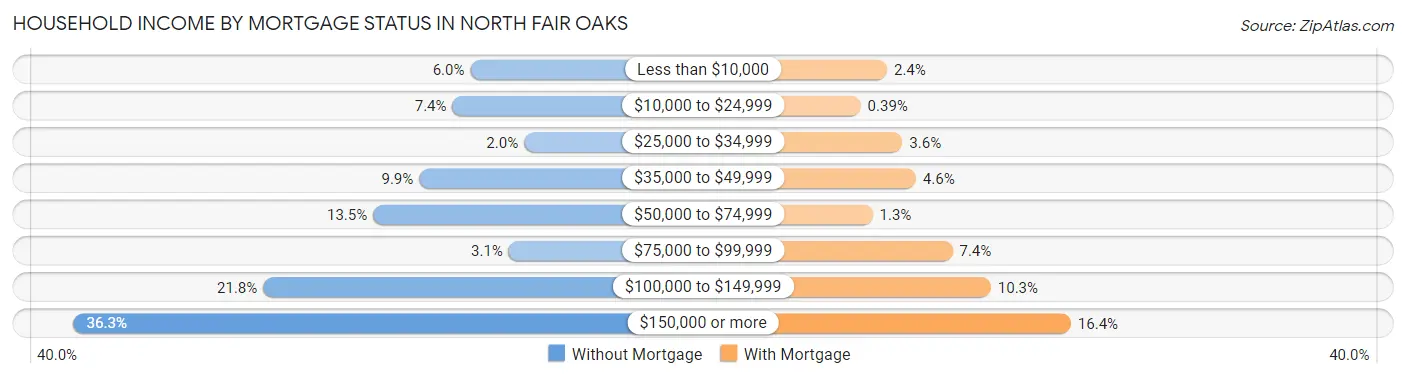
| Household Income | Without Mortgage | With Mortgage |
| Less than $10,000 | 31 (6.0%) | 37 (2.4%) |
| $10,000 to $24,999 | 38 (7.4%) | 6 (0.4%) |
| $25,000 to $34,999 | 10 (1.9%) | 55 (3.6%) |
| $35,000 to $49,999 | 51 (9.9%) | 71 (4.6%) |
| $50,000 to $74,999 | 69 (13.5%) | 20 (1.3%) |
| $75,000 to $99,999 | 16 (3.1%) | 114 (7.4%) |
| $100,000 to $149,999 | 112 (21.8%) | 159 (10.3%) |
| $150,000 or more | 186 (36.3%) | 253 (16.4%) |
| Total | 513 (100.0%) | 1,542 (100.0%) |
Property Value to Household Income Ratio in North Fair Oaks
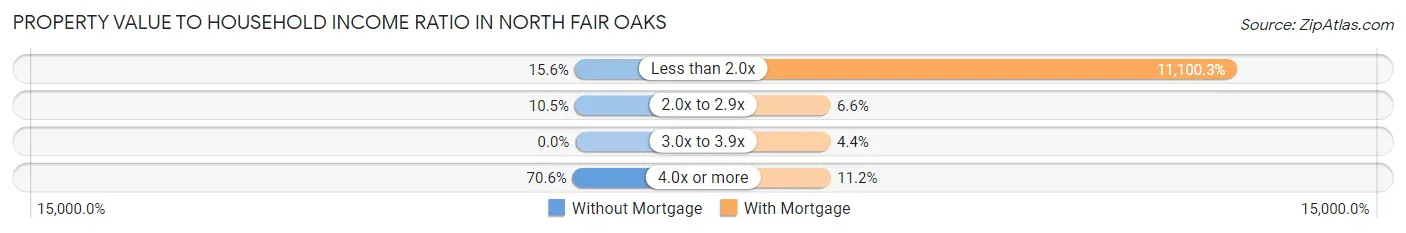
| Value-to-Income Ratio | Without Mortgage | With Mortgage |
| Less than 2.0x | 80 (15.6%) | 171,167 (11,100.3%) |
| 2.0x to 2.9x | 54 (10.5%) | 101 (6.6%) |
| 3.0x to 3.9x | 0 (0.0%) | 67 (4.3%) |
| 4.0x or more | 362 (70.6%) | 172 (11.2%) |
| Total | 513 (100.0%) | 1,542 (100.0%) |
Real Estate Taxes by Mortgage Status in North Fair Oaks
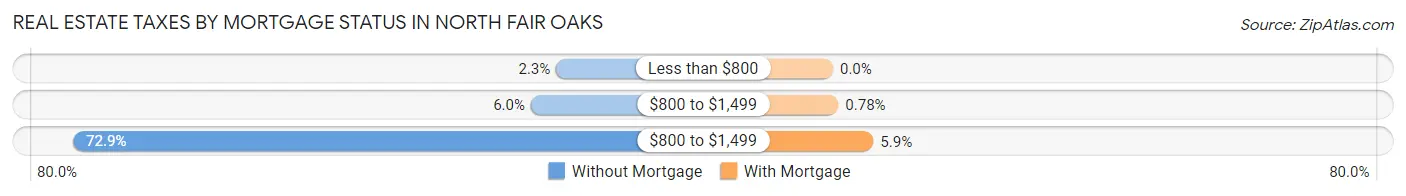
| Property Taxes | Without Mortgage | With Mortgage |
| Less than $800 | 12 (2.3%) | 0 (0.0%) |
| $800 to $1,499 | 31 (6.0%) | 12 (0.8%) |
| $800 to $1,499 | 374 (72.9%) | 91 (5.9%) |
| Total | 513 (100.0%) | 1,542 (100.0%) |
Health & Disability in North Fair Oaks
Health Insurance Coverage by Age in North Fair Oaks
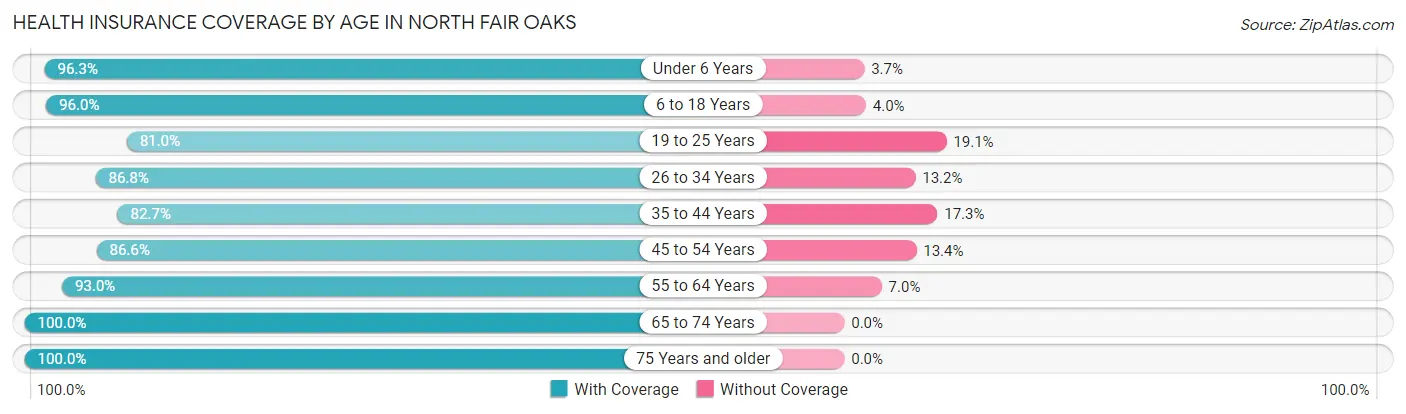
| Age Bracket | With Coverage | Without Coverage |
| Under 6 Years | 1,372 (96.3%) | 53 (3.7%) |
| 6 to 18 Years | 1,862 (96.0%) | 78 (4.0%) |
| 19 to 25 Years | 1,385 (80.9%) | 326 (19.1%) |
| 26 to 34 Years | 1,960 (86.8%) | 299 (13.2%) |
| 35 to 44 Years | 1,282 (82.7%) | 269 (17.3%) |
| 45 to 54 Years | 1,665 (86.6%) | 258 (13.4%) |
| 55 to 64 Years | 1,321 (93.0%) | 99 (7.0%) |
| 65 to 74 Years | 1,082 (100.0%) | 0 (0.0%) |
| 75 Years and older | 407 (100.0%) | 0 (0.0%) |
| Total | 12,336 (89.9%) | 1,382 (10.1%) |
Health Insurance Coverage by Citizenship Status in North Fair Oaks
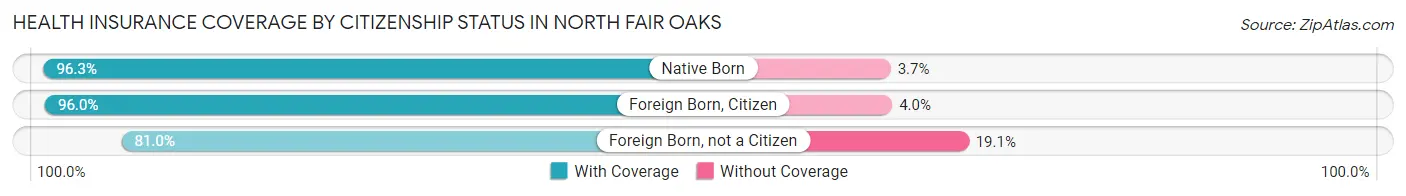
| Citizenship Status | With Coverage | Without Coverage |
| Native Born | 1,372 (96.3%) | 53 (3.7%) |
| Foreign Born, Citizen | 1,862 (96.0%) | 78 (4.0%) |
| Foreign Born, not a Citizen | 1,385 (80.9%) | 326 (19.1%) |
Health Insurance Coverage by Household Income in North Fair Oaks
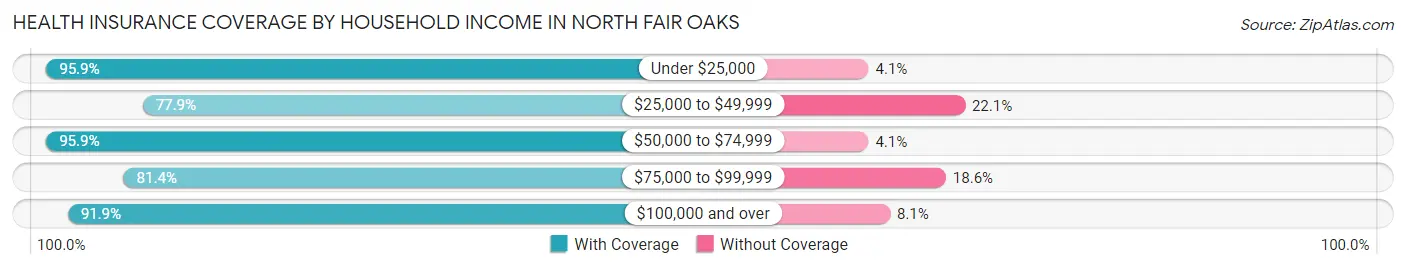
| Household Income | With Coverage | Without Coverage |
| Under $25,000 | 706 (95.9%) | 30 (4.1%) |
| $25,000 to $49,999 | 1,217 (77.9%) | 346 (22.1%) |
| $50,000 to $74,999 | 1,088 (95.9%) | 46 (4.1%) |
| $75,000 to $99,999 | 1,061 (81.4%) | 242 (18.6%) |
| $100,000 and over | 8,151 (91.9%) | 718 (8.1%) |
Public vs Private Health Insurance Coverage by Age in North Fair Oaks
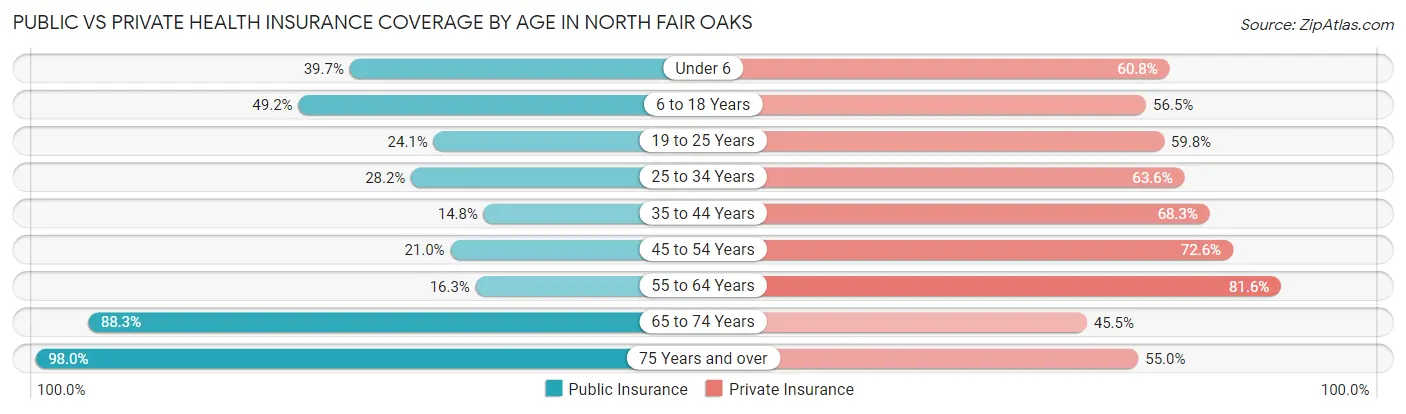
| Age Bracket | Public Insurance | Private Insurance |
| Under 6 | 565 (39.7%) | 867 (60.8%) |
| 6 to 18 Years | 954 (49.2%) | 1,096 (56.5%) |
| 19 to 25 Years | 412 (24.1%) | 1,023 (59.8%) |
| 25 to 34 Years | 638 (28.2%) | 1,437 (63.6%) |
| 35 to 44 Years | 229 (14.8%) | 1,059 (68.3%) |
| 45 to 54 Years | 403 (21.0%) | 1,396 (72.6%) |
| 55 to 64 Years | 231 (16.3%) | 1,158 (81.6%) |
| 65 to 74 Years | 955 (88.3%) | 492 (45.5%) |
| 75 Years and over | 399 (98.0%) | 224 (55.0%) |
| Total | 4,786 (34.9%) | 8,752 (63.8%) |
Disability Status by Sex by Age in North Fair Oaks
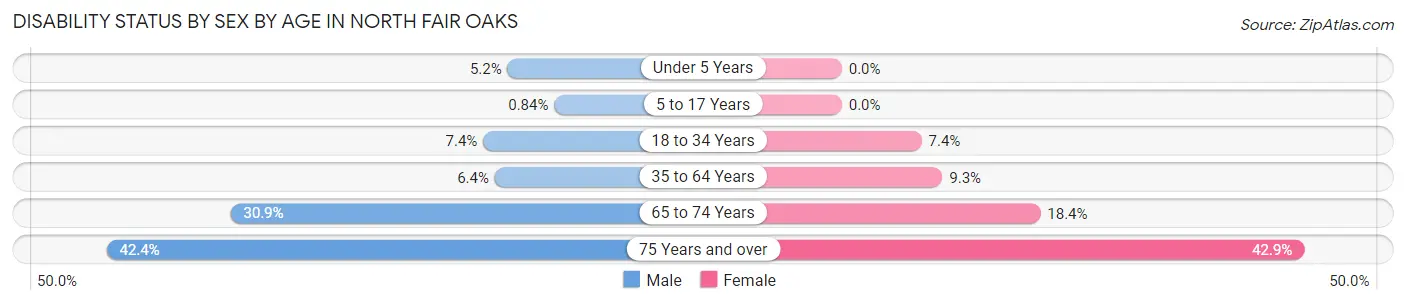
| Age Bracket | Male | Female |
| Under 5 Years | 31 (5.2%) | 0 (0.0%) |
| 5 to 17 Years | 8 (0.8%) | 0 (0.0%) |
| 18 to 34 Years | 160 (7.4%) | 145 (7.4%) |
| 35 to 64 Years | 162 (6.4%) | 219 (9.3%) |
| 65 to 74 Years | 165 (30.9%) | 101 (18.4%) |
| 75 Years and over | 53 (42.4%) | 121 (42.9%) |
Disability Class by Sex by Age in North Fair Oaks
Disability Class: Hearing Difficulty
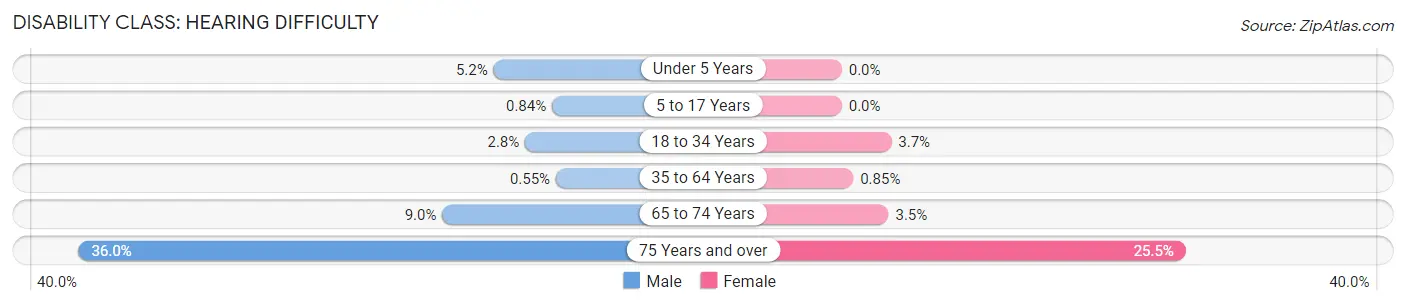
| Age Bracket | Male | Female |
| Under 5 Years | 31 (5.2%) | 0 (0.0%) |
| 5 to 17 Years | 8 (0.8%) | 0 (0.0%) |
| 18 to 34 Years | 61 (2.8%) | 72 (3.7%) |
| 35 to 64 Years | 14 (0.5%) | 20 (0.9%) |
| 65 to 74 Years | 48 (9.0%) | 19 (3.5%) |
| 75 Years and over | 45 (36.0%) | 72 (25.5%) |
Disability Class: Vision Difficulty
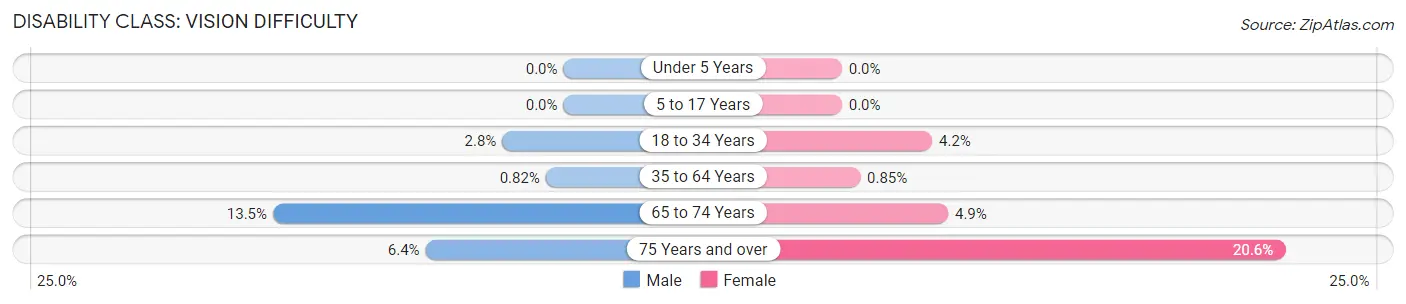
| Age Bracket | Male | Female |
| Under 5 Years | 0 (0.0%) | 0 (0.0%) |
| 5 to 17 Years | 0 (0.0%) | 0 (0.0%) |
| 18 to 34 Years | 61 (2.8%) | 82 (4.2%) |
| 35 to 64 Years | 21 (0.8%) | 20 (0.9%) |
| 65 to 74 Years | 72 (13.5%) | 27 (4.9%) |
| 75 Years and over | 8 (6.4%) | 58 (20.6%) |
Disability Class: Cognitive Difficulty
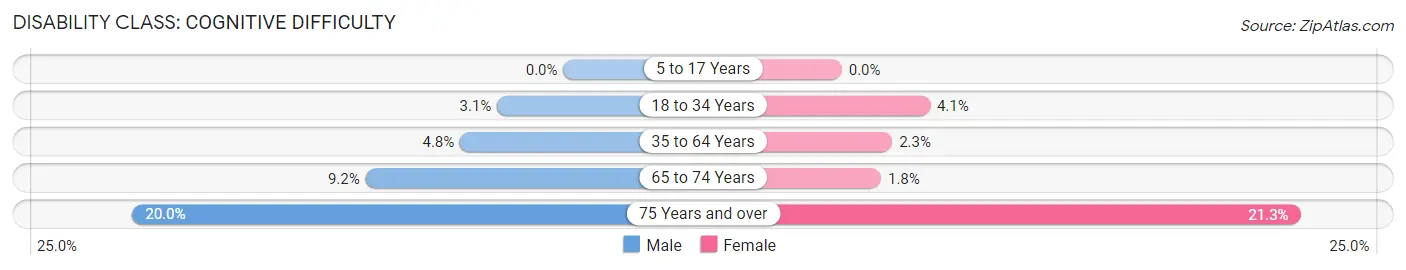
| Age Bracket | Male | Female |
| 5 to 17 Years | 0 (0.0%) | 0 (0.0%) |
| 18 to 34 Years | 66 (3.1%) | 80 (4.1%) |
| 35 to 64 Years | 122 (4.8%) | 55 (2.3%) |
| 65 to 74 Years | 49 (9.2%) | 10 (1.8%) |
| 75 Years and over | 25 (20.0%) | 60 (21.3%) |
Disability Class: Ambulatory Difficulty
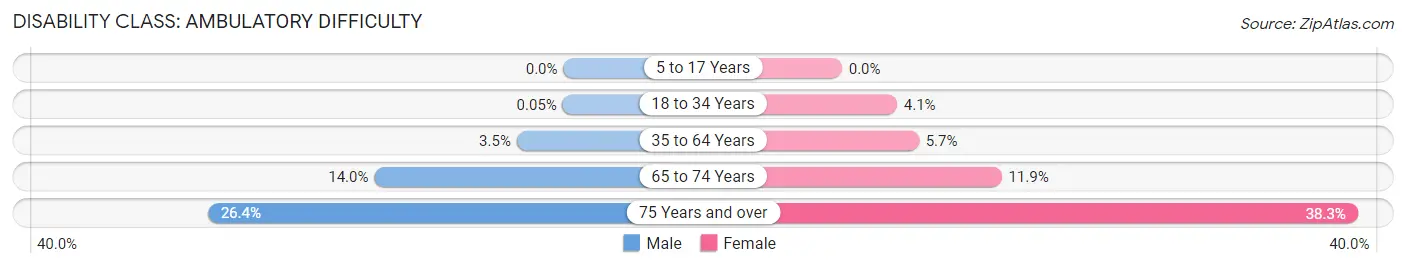
| Age Bracket | Male | Female |
| 5 to 17 Years | 0 (0.0%) | 0 (0.0%) |
| 18 to 34 Years | 1 (0.1%) | 80 (4.1%) |
| 35 to 64 Years | 88 (3.5%) | 134 (5.7%) |
| 65 to 74 Years | 75 (14.0%) | 65 (11.9%) |
| 75 Years and over | 33 (26.4%) | 108 (38.3%) |
Disability Class: Self-Care Difficulty
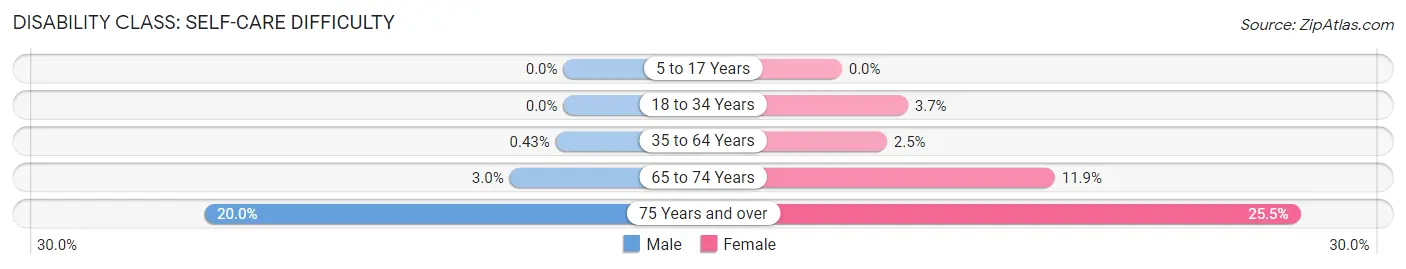
| Age Bracket | Male | Female |
| 5 to 17 Years | 0 (0.0%) | 0 (0.0%) |
| 18 to 34 Years | 0 (0.0%) | 72 (3.7%) |
| 35 to 64 Years | 11 (0.4%) | 59 (2.5%) |
| 65 to 74 Years | 16 (3.0%) | 65 (11.9%) |
| 75 Years and over | 25 (20.0%) | 72 (25.5%) |
Technology Access in North Fair Oaks
Computing Device Access in North Fair Oaks
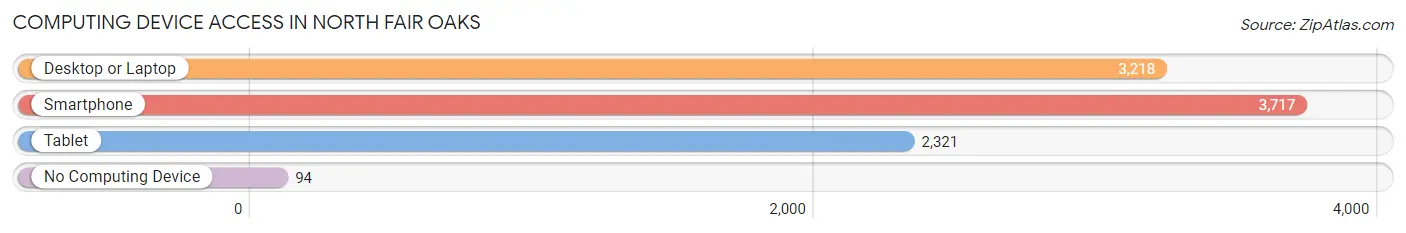
| Device Type | # Households | % Households |
| Desktop or Laptop | 3,218 | 82.1% |
| Smartphone | 3,717 | 94.8% |
| Tablet | 2,321 | 59.2% |
| No Computing Device | 94 | 2.4% |
| Total | 3,921 | 100.0% |
Internet Access in North Fair Oaks
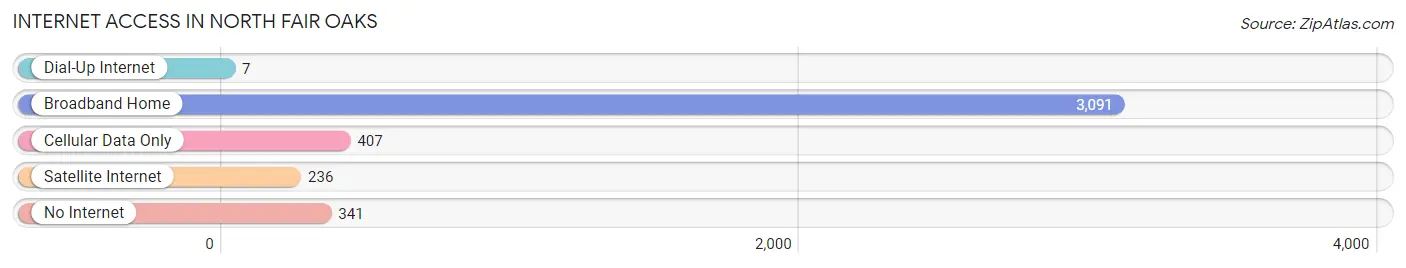
| Internet Type | # Households | % Households |
| Dial-Up Internet | 7 | 0.2% |
| Broadband Home | 3,091 | 78.8% |
| Cellular Data Only | 407 | 10.4% |
| Satellite Internet | 236 | 6.0% |
| No Internet | 341 | 8.7% |
| Total | 3,921 | 100.0% |
North Fair Oaks Summary
History
North Fair Oaks is a census-designated place (CDP) located in San Mateo County, California. It is situated between the cities of Redwood City and Menlo Park, and is part of the larger unincorporated community of Fair Oaks. The area was originally inhabited by the Ohlone people, who were the first inhabitants of the San Francisco Bay Area. The area was later settled by Spanish and Mexican settlers in the late 1700s and early 1800s.
In the late 1800s, the area was developed as a farming community, with many of the farms owned by Italian immigrants. The area was known as “Little Italy” due to the large number of Italian immigrants who lived and worked in the area. The area was annexed by Redwood City in 1925, and the name was changed to North Fair Oaks.
Geography
North Fair Oaks is located in San Mateo County, California. It is situated between the cities of Redwood City and Menlo Park, and is part of the larger unincorporated community of Fair Oaks. The area is bordered by the San Francisquito Creek to the north, the San Mateo Creek to the east, and the Santa Cruz Mountains to the west. The area has a total area of 1.3 square miles, all of which is land.
The climate in North Fair Oaks is mild and temperate, with warm summers and cool winters. The average annual temperature is around 60°F, with temperatures ranging from the mid-50s in the winter to the mid-70s in the summer. The area receives an average of 20 inches of rain per year.
Economy
The economy of North Fair Oaks is largely based on agriculture and light industry. The area is home to several farms, which produce a variety of fruits and vegetables, including strawberries, tomatoes, and peppers. The area is also home to several light industrial businesses, including a furniture manufacturer, a printing company, and a metal fabrication shop.
The area is also home to several retail businesses, including grocery stores, restaurants, and clothing stores. The area is served by several public transportation options, including bus lines and Caltrain.
Demographics
As of the 2010 census, the population of North Fair Oaks was 8,780. The population is largely Hispanic, with over 70% of the population identifying as Hispanic or Latino. The median household income is $60,000, and the median home value is $735,000. The area is largely residential, with over 90% of the population living in single-family homes.
Conclusion
North Fair Oaks is a census-designated place located in San Mateo County, California. It is situated between the cities of Redwood City and Menlo Park, and is part of the larger unincorporated community of Fair Oaks. The area was originally inhabited by the Ohlone people, and was later settled by Spanish and Mexican settlers in the late 1700s and early 1800s. The area was developed as a farming community in the late 1800s, and was annexed by Redwood City in 1925. The economy of North Fair Oaks is largely based on agriculture and light industry, and the population is largely Hispanic. The area is served by several public transportation options, and is largely residential.
Common Questions
What is Per Capita Income in North Fair Oaks?
Per Capita income in North Fair Oaks is $45,176.
What is the Median Family Income in North Fair Oaks?
Median Family Income in North Fair Oaks is $107,371.
What is the Median Household income in North Fair Oaks?
Median Household Income in North Fair Oaks is $114,925.
What is Income or Wage Gap in North Fair Oaks?
Income or Wage Gap in North Fair Oaks is 11.3%.
Women in North Fair Oaks earn 88.7 cents for every dollar earned by a man.
What is Inequality or Gini Index in North Fair Oaks?
Inequality or Gini Index in North Fair Oaks is 0.46.
What is the Total Population of North Fair Oaks?
Total Population of North Fair Oaks is 13,718.
What is the Total Male Population of North Fair Oaks?
Total Male Population of North Fair Oaks is 6,910.
What is the Total Female Population of North Fair Oaks?
Total Female Population of North Fair Oaks is 6,808.
What is the Ratio of Males per 100 Females in North Fair Oaks?
There are 101.50 Males per 100 Females in North Fair Oaks.
What is the Ratio of Females per 100 Males in North Fair Oaks?
There are 98.52 Females per 100 Males in North Fair Oaks.
What is the Median Population Age in North Fair Oaks?
Median Population Age in North Fair Oaks is 31.7 Years.
What is the Average Family Size in North Fair Oaks
Average Family Size in North Fair Oaks is 4.1 People.
What is the Average Household Size in North Fair Oaks
Average Household Size in North Fair Oaks is 3.5 People.
How Large is the Labor Force in North Fair Oaks?
There are 7,340 People in the Labor Forcein in North Fair Oaks.
What is the Percentage of People in the Labor Force in North Fair Oaks?
68.2% of People are in the Labor Force in North Fair Oaks.
What is the Unemployment Rate in North Fair Oaks?
Unemployment Rate in North Fair Oaks is 7.4%.