Commerce, CA Map & Demographics
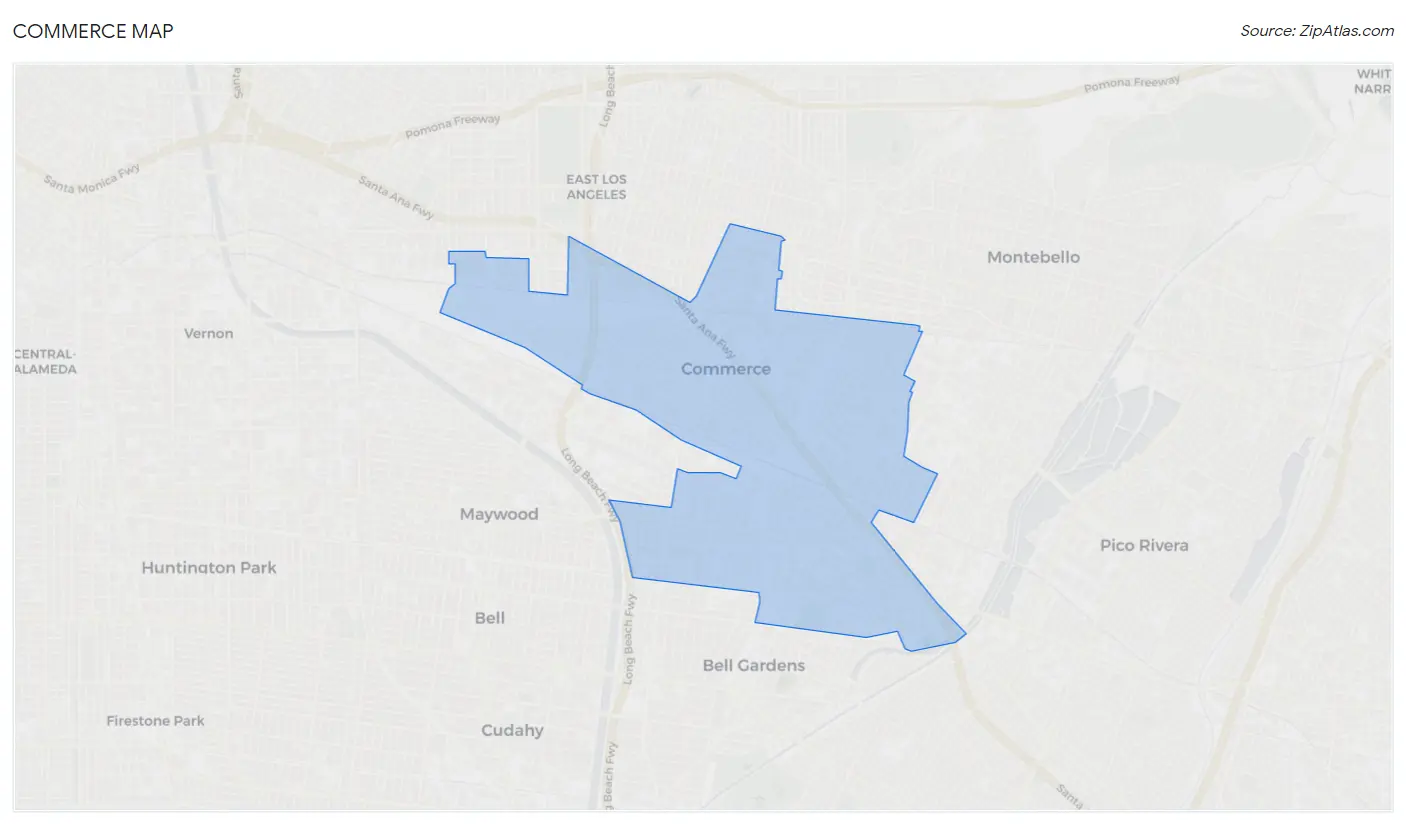
Commerce Map
Commerce Overview
$24,497
PER CAPITA INCOME
$76,236
AVG FAMILY INCOME
$66,071
AVG HOUSEHOLD INCOME
12.1%
WAGE / INCOME GAP [ % ]
87.9¢/ $1
WAGE / INCOME GAP [ $ ]
$15,140
FAMILY INCOME DEFICIT
0.43
INEQUALITY / GINI INDEX
12,253
TOTAL POPULATION
6,275
MALE POPULATION
5,978
FEMALE POPULATION
104.97
MALES / 100 FEMALES
95.27
FEMALES / 100 MALES
37.3
MEDIAN AGE
4.1
AVG FAMILY SIZE
3.5
AVG HOUSEHOLD SIZE
5,731
LABOR FORCE [ PEOPLE ]
57.1%
PERCENT IN LABOR FORCE
4.9%
UNEMPLOYMENT RATE
Income in Commerce
Income Overview in Commerce
Per Capita Income in Commerce is $24,497, while median incomes of families and households are $76,236 and $66,071 respectively.
| Characteristic | Number | Measure |
| Per Capita Income | 12,253 | $24,497 |
| Median Family Income | 2,667 | $76,236 |
| Mean Family Income | 2,667 | $89,867 |
| Median Household Income | 3,472 | $66,071 |
| Mean Household Income | 3,472 | $83,076 |
| Income Deficit | 2,667 | $15,140 |
| Wage / Income Gap (%) | 12,253 | 12.14% |
| Wage / Income Gap ($) | 12,253 | 87.86¢ per $1 |
| Gini / Inequality Index | 12,253 | 0.43 |
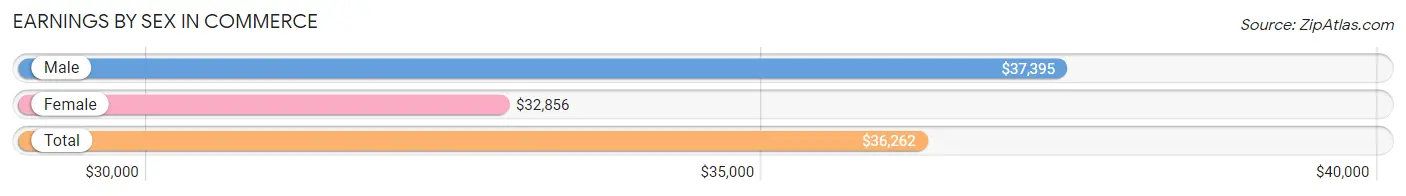
Earnings by Sex in Commerce
Average Earnings in Commerce are $36,262, $37,395 for men and $32,856 for women, a difference of 12.1%.
| Sex | Number | Average Earnings |
| Male | 3,110 (53.7%) | $37,395 |
| Female | 2,679 (46.3%) | $32,856 |
| Total | 5,789 (100.0%) | $36,262 |
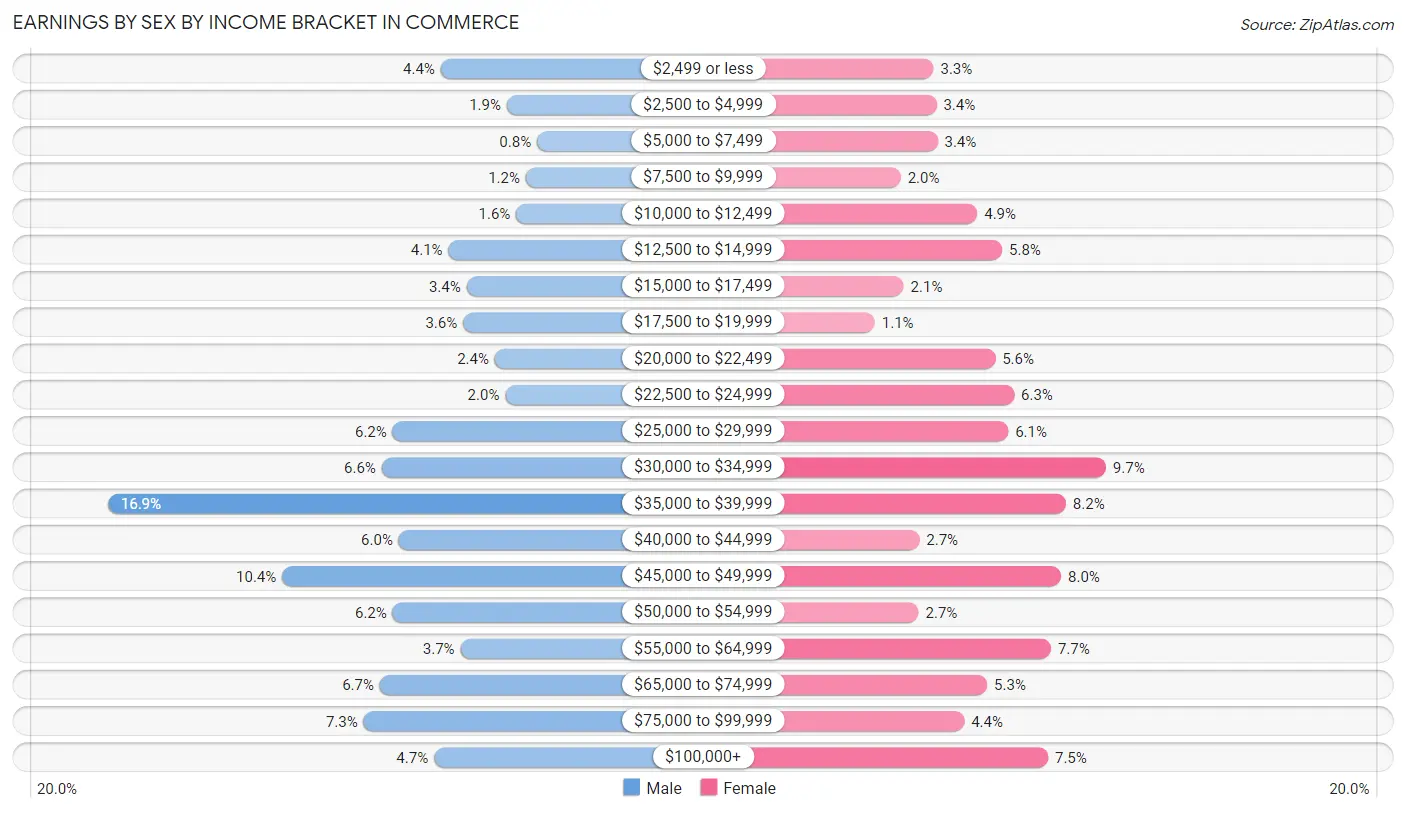
Earnings by Sex by Income Bracket in Commerce
The most common earnings brackets in Commerce are $35,000 to $39,999 for men (525 | 16.9%) and $30,000 to $34,999 for women (260 | 9.7%).
| Income | Male | Female |
| $2,499 or less | 137 (4.4%) | 87 (3.3%) |
| $2,500 to $4,999 | 60 (1.9%) | 90 (3.4%) |
| $5,000 to $7,499 | 25 (0.8%) | 91 (3.4%) |
| $7,500 to $9,999 | 38 (1.2%) | 54 (2.0%) |
| $10,000 to $12,499 | 49 (1.6%) | 131 (4.9%) |
| $12,500 to $14,999 | 128 (4.1%) | 156 (5.8%) |
| $15,000 to $17,499 | 107 (3.4%) | 57 (2.1%) |
| $17,500 to $19,999 | 111 (3.6%) | 28 (1.1%) |
| $20,000 to $22,499 | 74 (2.4%) | 149 (5.6%) |
| $22,500 to $24,999 | 62 (2.0%) | 168 (6.3%) |
| $25,000 to $29,999 | 193 (6.2%) | 162 (6.0%) |
| $30,000 to $34,999 | 206 (6.6%) | 260 (9.7%) |
| $35,000 to $39,999 | 525 (16.9%) | 220 (8.2%) |
| $40,000 to $44,999 | 186 (6.0%) | 73 (2.7%) |
| $45,000 to $49,999 | 322 (10.3%) | 215 (8.0%) |
| $50,000 to $54,999 | 193 (6.2%) | 72 (2.7%) |
| $55,000 to $64,999 | 114 (3.7%) | 205 (7.6%) |
| $65,000 to $74,999 | 208 (6.7%) | 141 (5.3%) |
| $75,000 to $99,999 | 227 (7.3%) | 118 (4.4%) |
| $100,000+ | 145 (4.7%) | 202 (7.5%) |
| Total | 3,110 (100.0%) | 2,679 (100.0%) |
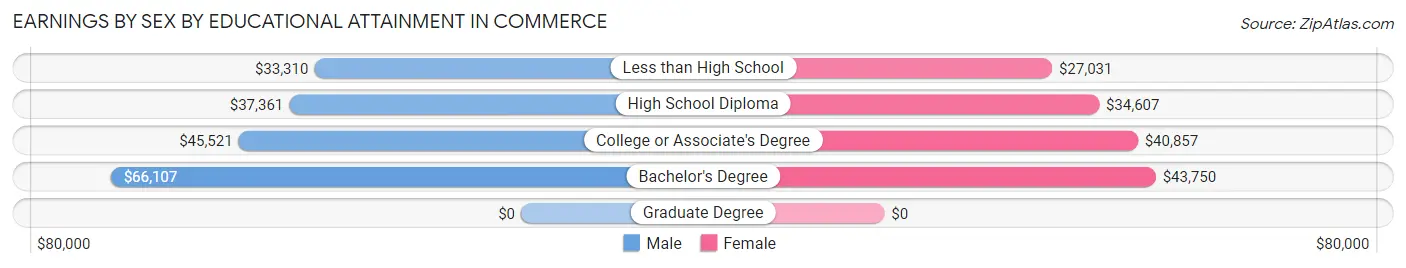
Earnings by Sex by Educational Attainment in Commerce
Average earnings in Commerce are $40,714 for men and $36,146 for women, a difference of 11.2%. Men with an educational attainment of bachelor's degree enjoy the highest average annual earnings of $66,107, while those with less than high school education earn the least with $33,310. Women with an educational attainment of bachelor's degree earn the most with the average annual earnings of $43,750, while those with less than high school education have the smallest earnings of $27,031.
| Educational Attainment | Male Income | Female Income |
| Less than High School | $33,310 | $27,031 |
| High School Diploma | $37,361 | $34,607 |
| College or Associate's Degree | $45,521 | $40,857 |
| Bachelor's Degree | $66,107 | $43,750 |
| Graduate Degree | - | - |
| Total | $40,714 | $36,146 |
Family Income in Commerce
Family Income Brackets in Commerce
According to the Commerce family income data, there are 619 families falling into the $50,000 to $74,999 income range, which is the most common income bracket and makes up 23.2% of all families. Conversely, the $25,000 to $34,999 income bracket is the least frequent group with only 80 families (3.0%) belonging to this category.
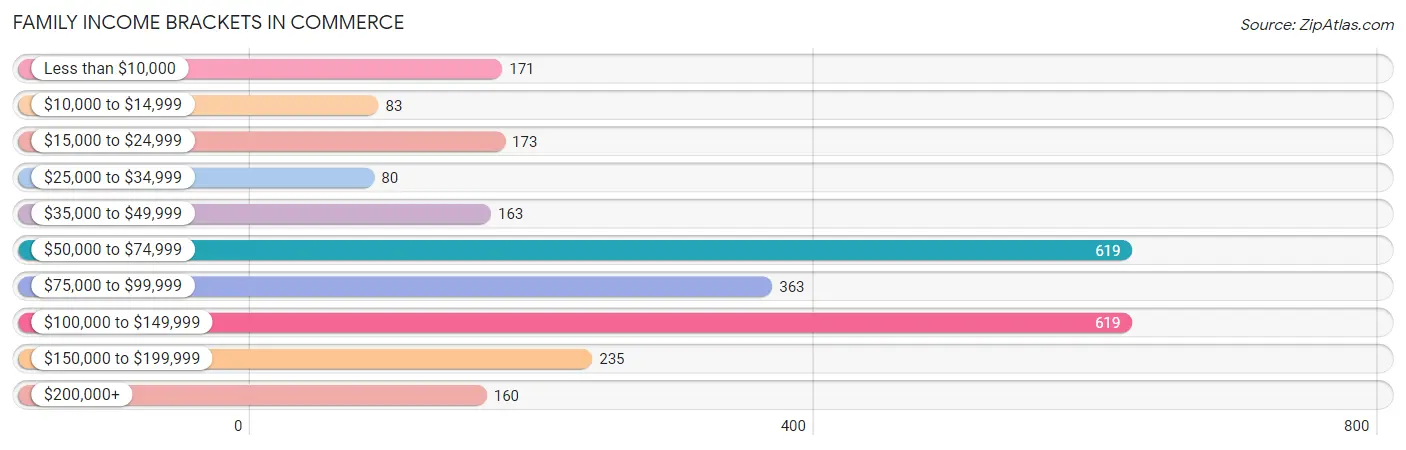
| Income Bracket | # Families | % Families |
| Less than $10,000 | 171 | 6.4% |
| $10,000 to $14,999 | 83 | 3.1% |
| $15,000 to $24,999 | 173 | 6.5% |
| $25,000 to $34,999 | 80 | 3.0% |
| $35,000 to $49,999 | 163 | 6.1% |
| $50,000 to $74,999 | 619 | 23.2% |
| $75,000 to $99,999 | 363 | 13.6% |
| $100,000 to $149,999 | 619 | 23.2% |
| $150,000 to $199,999 | 235 | 8.8% |
| $200,000+ | 160 | 6.0% |
Family Income by Famaliy Size in Commerce
6-person families (216 | 8.1%) account for the highest median family income in Commerce with $181,932 per family, while 3-person families (481 | 18.0%) have the highest median income of $31,343 per family member.
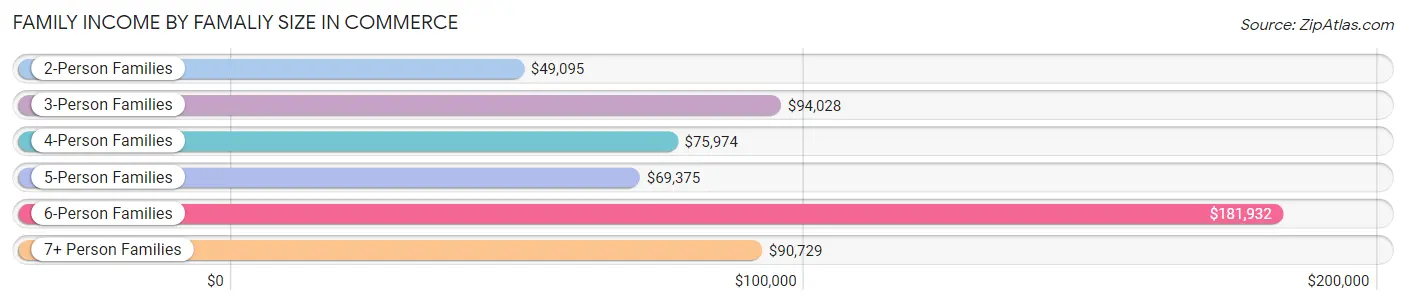
| Income Bracket | # Families | Median Income |
| 2-Person Families | 655 (24.6%) | $49,095 |
| 3-Person Families | 481 (18.0%) | $94,028 |
| 4-Person Families | 687 (25.8%) | $75,974 |
| 5-Person Families | 523 (19.6%) | $69,375 |
| 6-Person Families | 216 (8.1%) | $181,932 |
| 7+ Person Families | 105 (3.9%) | $90,729 |
| Total | 2,667 (100.0%) | $76,236 |
Family Income by Number of Earners in Commerce
The median family income in Commerce is $76,236, with families comprising 3+ earners (780) having the highest median family income of $115,192, while families with no earners (317) have the lowest median family income of $22,525, accounting for 29.2% and 11.9% of families, respectively.
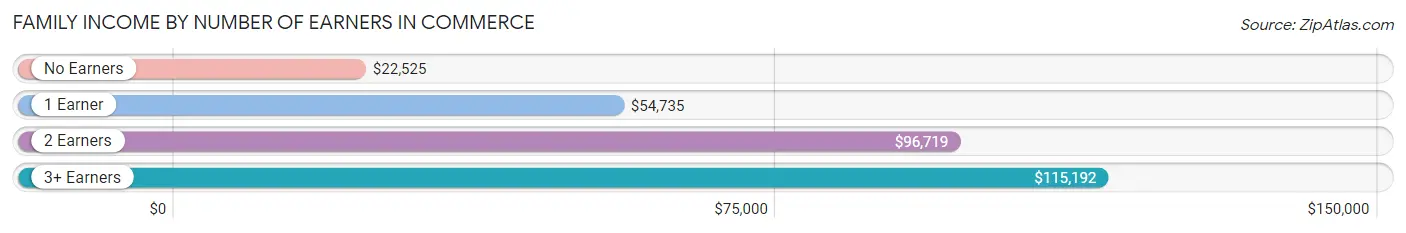
| Number of Earners | # Families | Median Income |
| No Earners | 317 (11.9%) | $22,525 |
| 1 Earner | 777 (29.1%) | $54,735 |
| 2 Earners | 793 (29.7%) | $96,719 |
| 3+ Earners | 780 (29.2%) | $115,192 |
| Total | 2,667 (100.0%) | $76,236 |
Household Income in Commerce
Household Income Brackets in Commerce
With 653 households falling in the category, the $50,000 to $74,999 income range is the most frequent in Commerce, accounting for 18.8% of all households. In contrast, only 149 households (4.3%) fall into the $25,000 to $34,999 income bracket, making it the least populous group.
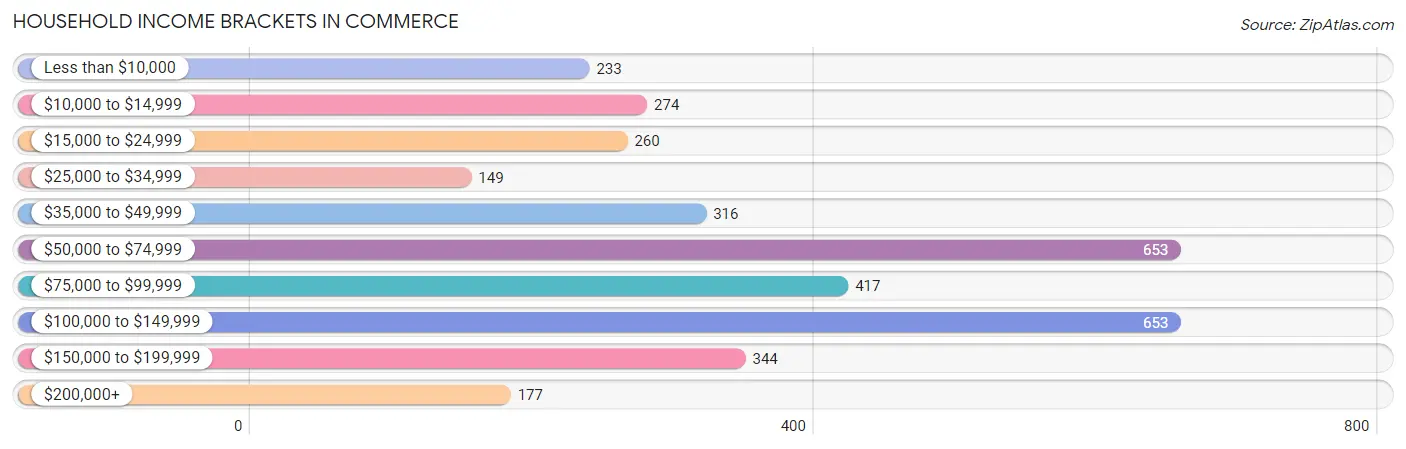
| Income Bracket | # Households | % Households |
| Less than $10,000 | 233 | 6.7% |
| $10,000 to $14,999 | 274 | 7.9% |
| $15,000 to $24,999 | 260 | 7.5% |
| $25,000 to $34,999 | 149 | 4.3% |
| $35,000 to $49,999 | 316 | 9.1% |
| $50,000 to $74,999 | 653 | 18.8% |
| $75,000 to $99,999 | 417 | 12.0% |
| $100,000 to $149,999 | 653 | 18.8% |
| $150,000 to $199,999 | 344 | 9.9% |
| $200,000+ | 177 | 5.1% |
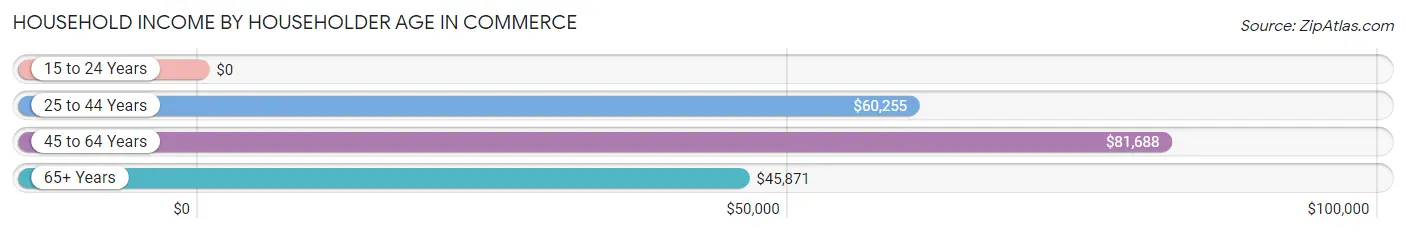
Household Income by Householder Age in Commerce
The median household income in Commerce is $66,071, with the highest median household income of $81,688 found in the 45 to 64 years age bracket for the primary householder. A total of 1,525 households (43.9%) fall into this category. Meanwhile, the 15 to 24 years age bracket for the primary householder has the lowest median household income of $0, with 23 households (0.7%) in this group.
| Income Bracket | # Households | Median Income |
| 15 to 24 Years | 23 (0.7%) | $0 |
| 25 to 44 Years | 892 (25.7%) | $60,255 |
| 45 to 64 Years | 1,525 (43.9%) | $81,688 |
| 65+ Years | 1,032 (29.7%) | $45,871 |
| Total | 3,472 (100.0%) | $66,071 |
Poverty in Commerce
Income Below Poverty by Sex and Age in Commerce
With 13.1% poverty level for males and 13.8% for females among the residents of Commerce, under 5 year old males and 5 year old females are the most vulnerable to poverty, with 64 males (22.2%) and 29 females (46.0%) in their respective age groups living below the poverty level.
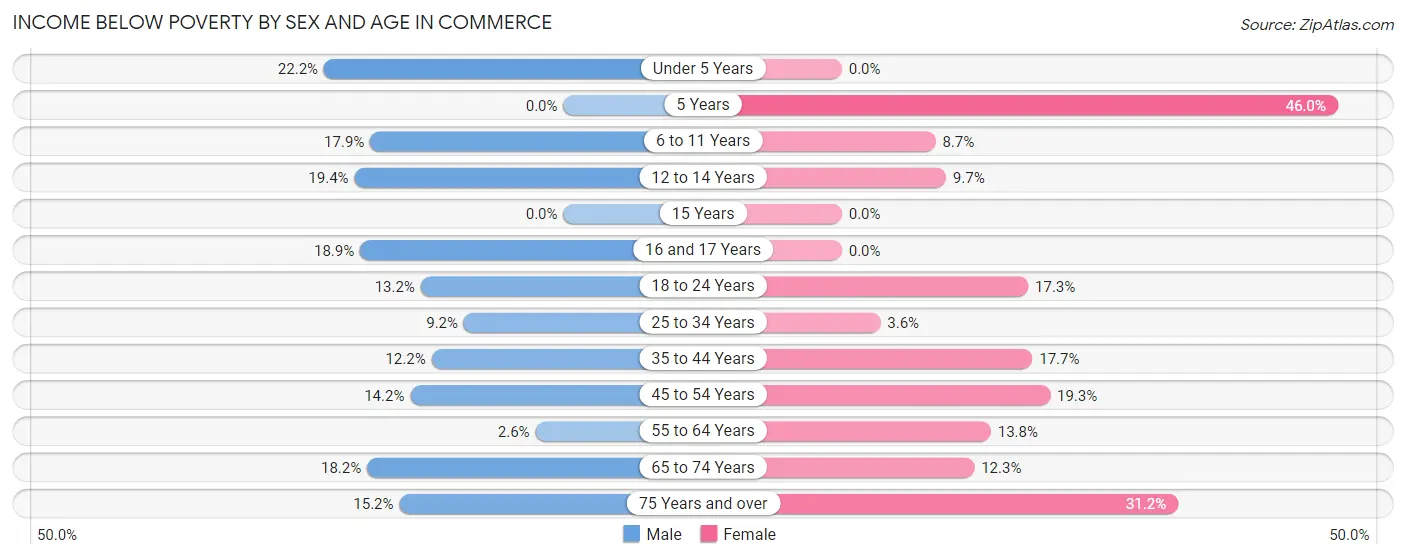
| Age Bracket | Male | Female |
| Under 5 Years | 64 (22.2%) | 0 (0.0%) |
| 5 Years | 0 (0.0%) | 29 (46.0%) |
| 6 to 11 Years | 111 (17.9%) | 37 (8.7%) |
| 12 to 14 Years | 51 (19.4%) | 28 (9.7%) |
| 15 Years | 0 (0.0%) | 0 (0.0%) |
| 16 and 17 Years | 30 (18.9%) | 0 (0.0%) |
| 18 to 24 Years | 90 (13.2%) | 74 (17.3%) |
| 25 to 34 Years | 104 (9.2%) | 30 (3.6%) |
| 35 to 44 Years | 77 (12.2%) | 139 (17.7%) |
| 45 to 54 Years | 82 (14.2%) | 156 (19.3%) |
| 55 to 64 Years | 20 (2.6%) | 103 (13.8%) |
| 65 to 74 Years | 123 (18.2%) | 73 (12.3%) |
| 75 Years and over | 65 (15.2%) | 151 (31.2%) |
| Total | 817 (13.1%) | 820 (13.8%) |
Income Above Poverty by Sex and Age in Commerce
According to the poverty statistics in Commerce, males aged 15 years and females aged under 5 years are the age groups that are most secure financially, with 100.0% of males and 100.0% of females in these age groups living above the poverty line.
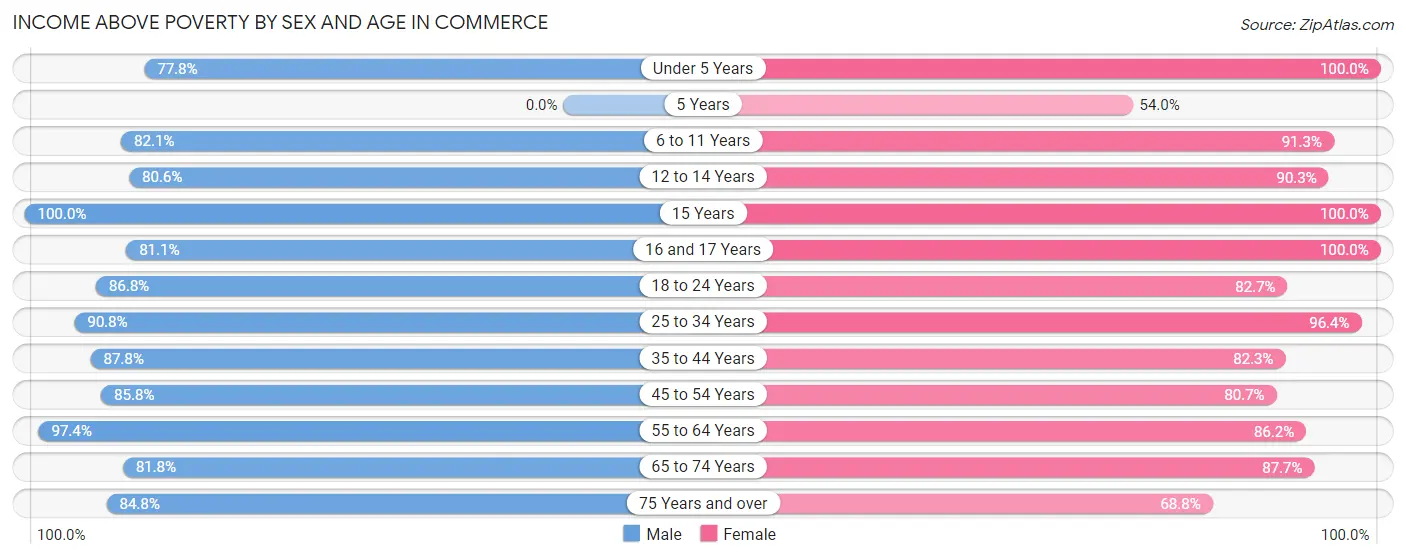
| Age Bracket | Male | Female |
| Under 5 Years | 224 (77.8%) | 176 (100.0%) |
| 5 Years | 0 (0.0%) | 34 (54.0%) |
| 6 to 11 Years | 508 (82.1%) | 389 (91.3%) |
| 12 to 14 Years | 212 (80.6%) | 262 (90.3%) |
| 15 Years | 20 (100.0%) | 27 (100.0%) |
| 16 and 17 Years | 129 (81.1%) | 270 (100.0%) |
| 18 to 24 Years | 590 (86.8%) | 354 (82.7%) |
| 25 to 34 Years | 1,023 (90.8%) | 809 (96.4%) |
| 35 to 44 Years | 552 (87.8%) | 647 (82.3%) |
| 45 to 54 Years | 495 (85.8%) | 651 (80.7%) |
| 55 to 64 Years | 752 (97.4%) | 642 (86.2%) |
| 65 to 74 Years | 552 (81.8%) | 521 (87.7%) |
| 75 Years and over | 362 (84.8%) | 333 (68.8%) |
| Total | 5,419 (86.9%) | 5,115 (86.2%) |
Income Below Poverty Among Married-Couple Families in Commerce
The poverty statistics for married-couple families in Commerce show that 8.7% or 143 of the total 1,649 families live below the poverty line. Families with 1 or 2 children have the highest poverty rate of 12.3%, comprising of 98 families. On the other hand, families with 3 or 4 children have the lowest poverty rate of 0.0%, which includes 0 families.
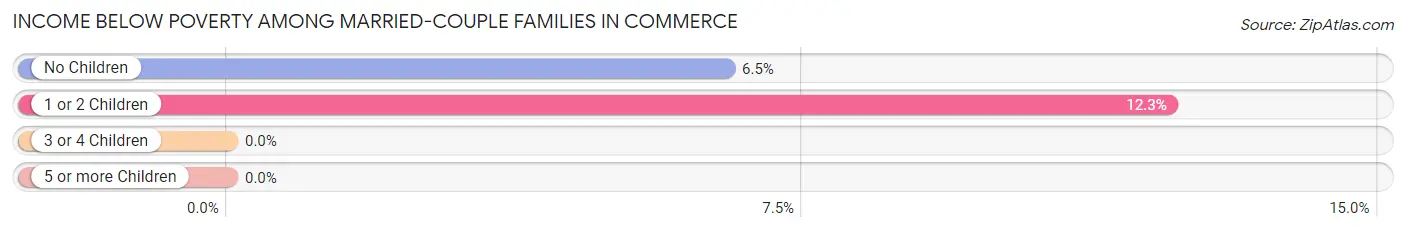
| Children | Above Poverty | Below Poverty |
| No Children | 648 (93.5%) | 45 (6.5%) |
| 1 or 2 Children | 700 (87.7%) | 98 (12.3%) |
| 3 or 4 Children | 91 (100.0%) | 0 (0.0%) |
| 5 or more Children | 67 (100.0%) | 0 (0.0%) |
| Total | 1,506 (91.3%) | 143 (8.7%) |
Income Below Poverty Among Single-Parent Households in Commerce
According to the poverty data in Commerce, 7.3% or 35 single-father households and 28.3% or 153 single-mother households are living below the poverty line. Among single-father households, those with 1 or 2 children have the highest poverty rate, with 12 households (21.0%) experiencing poverty. Likewise, among single-mother households, those with 3 or 4 children have the highest poverty rate, with 25 households (35.7%) falling below the poverty line.
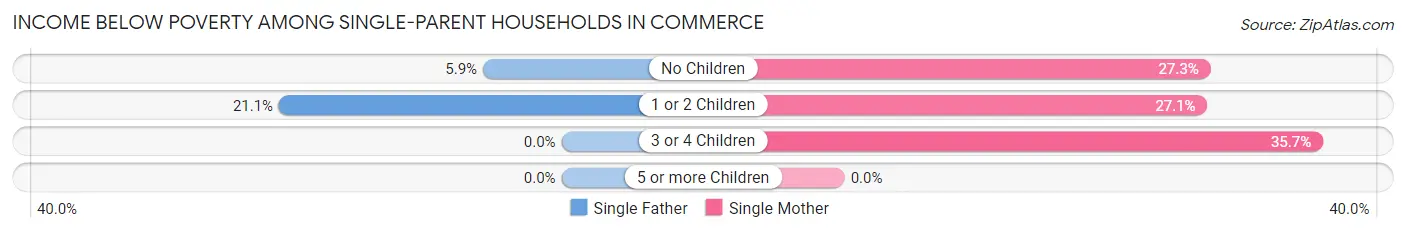
| Children | Single Father | Single Mother |
| No Children | 23 (5.9%) | 70 (27.3%) |
| 1 or 2 Children | 12 (21.0%) | 58 (27.1%) |
| 3 or 4 Children | 0 (0.0%) | 25 (35.7%) |
| 5 or more Children | 0 (0.0%) | 0 (0.0%) |
| Total | 35 (7.3%) | 153 (28.3%) |
Income Below Poverty Among Married-Couple vs Single-Parent Households in Commerce
The poverty data for Commerce shows that 143 of the married-couple family households (8.7%) and 188 of the single-parent households (18.5%) are living below the poverty level. Within the married-couple family households, those with 1 or 2 children have the highest poverty rate, with 98 households (12.3%) falling below the poverty line. Among the single-parent households, those with 1 or 2 children have the highest poverty rate, with 70 household (25.8%) living below poverty.
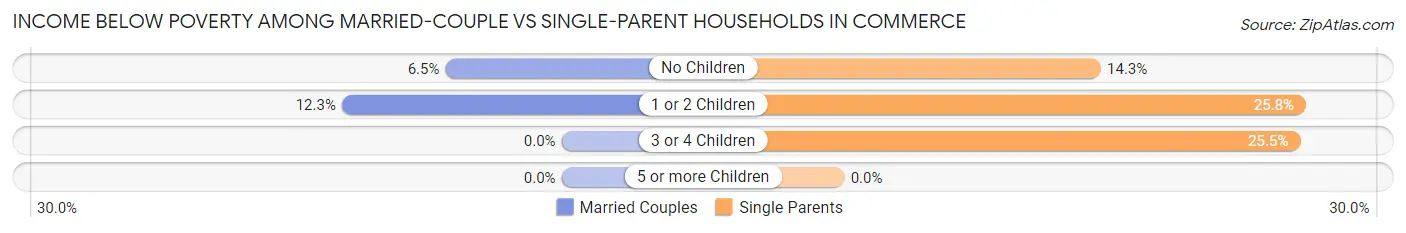
| Children | Married-Couple Families | Single-Parent Households |
| No Children | 45 (6.5%) | 93 (14.3%) |
| 1 or 2 Children | 98 (12.3%) | 70 (25.8%) |
| 3 or 4 Children | 0 (0.0%) | 25 (25.5%) |
| 5 or more Children | 0 (0.0%) | 0 (0.0%) |
| Total | 143 (8.7%) | 188 (18.5%) |
Race in Commerce
The most populous races in Commerce are Hispanic or Latino (11,647 | 95.1%), Some other Race (4,840 | 39.5%), and White / Caucasian (3,910 | 31.9%).
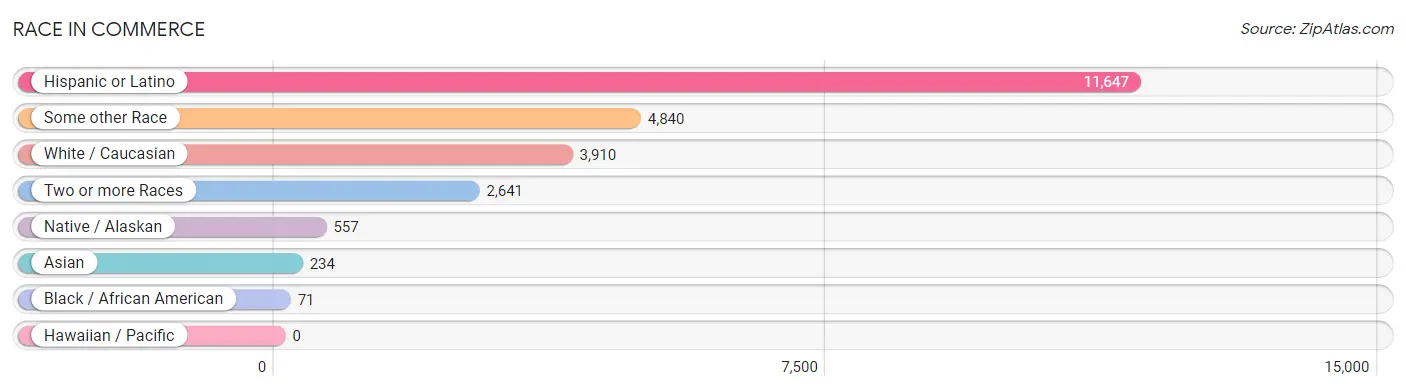
| Race | # Population | % Population |
| Asian | 234 | 1.9% |
| Black / African American | 71 | 0.6% |
| Hawaiian / Pacific | 0 | 0.0% |
| Hispanic or Latino | 11,647 | 95.1% |
| Native / Alaskan | 557 | 4.5% |
| White / Caucasian | 3,910 | 31.9% |
| Two or more Races | 2,641 | 21.5% |
| Some other Race | 4,840 | 39.5% |
| Total | 12,253 | 100.0% |
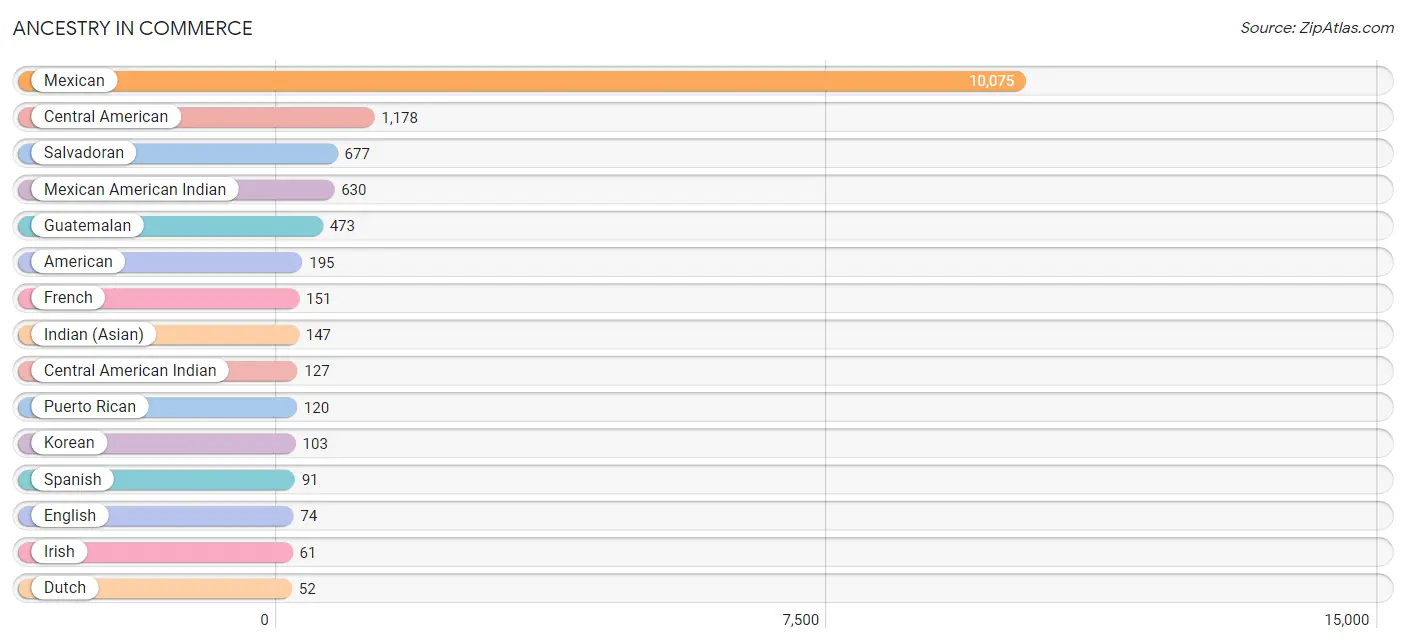
Ancestry in Commerce
The most populous ancestries reported in Commerce are Mexican (10,075 | 82.2%), Central American (1,178 | 9.6%), Salvadoran (677 | 5.5%), Mexican American Indian (630 | 5.1%), and Guatemalan (473 | 3.9%), together accounting for 106.4% of all Commerce residents.
| Ancestry | # Population | % Population |
| African | 29 | 0.2% |
| American | 195 | 1.6% |
| Bhutanese | 5 | 0.0% |
| Brazilian | 7 | 0.1% |
| Central American | 1,178 | 9.6% |
| Central American Indian | 127 | 1.0% |
| Dutch | 52 | 0.4% |
| Ecuadorian | 28 | 0.2% |
| English | 74 | 0.6% |
| Estonian | 47 | 0.4% |
| Ethiopian | 43 | 0.4% |
| European | 10 | 0.1% |
| French | 151 | 1.2% |
| German | 47 | 0.4% |
| Guatemalan | 473 | 3.9% |
| Honduran | 28 | 0.2% |
| Indian (Asian) | 147 | 1.2% |
| Irish | 61 | 0.5% |
| Italian | 21 | 0.2% |
| Korean | 103 | 0.8% |
| Mexican | 10,075 | 82.2% |
| Mexican American Indian | 630 | 5.1% |
| Portuguese | 32 | 0.3% |
| Puerto Rican | 120 | 1.0% |
| Salvadoran | 677 | 5.5% |
| Scottish | 22 | 0.2% |
| South American | 28 | 0.2% |
| Spaniard | 51 | 0.4% |
| Spanish | 91 | 0.7% |
| Subsaharan African | 43 | 0.4% |
| Yaqui | 21 | 0.2% | View All 31 Rows |
Immigrants in Commerce
The most numerous immigrant groups reported in Commerce came from Latin America (4,369 | 35.7%), Central America (4,318 | 35.2%), Mexico (3,663 | 29.9%), El Salvador (396 | 3.2%), and Guatemala (240 | 2.0%), together accounting for 106.0% of all Commerce residents.
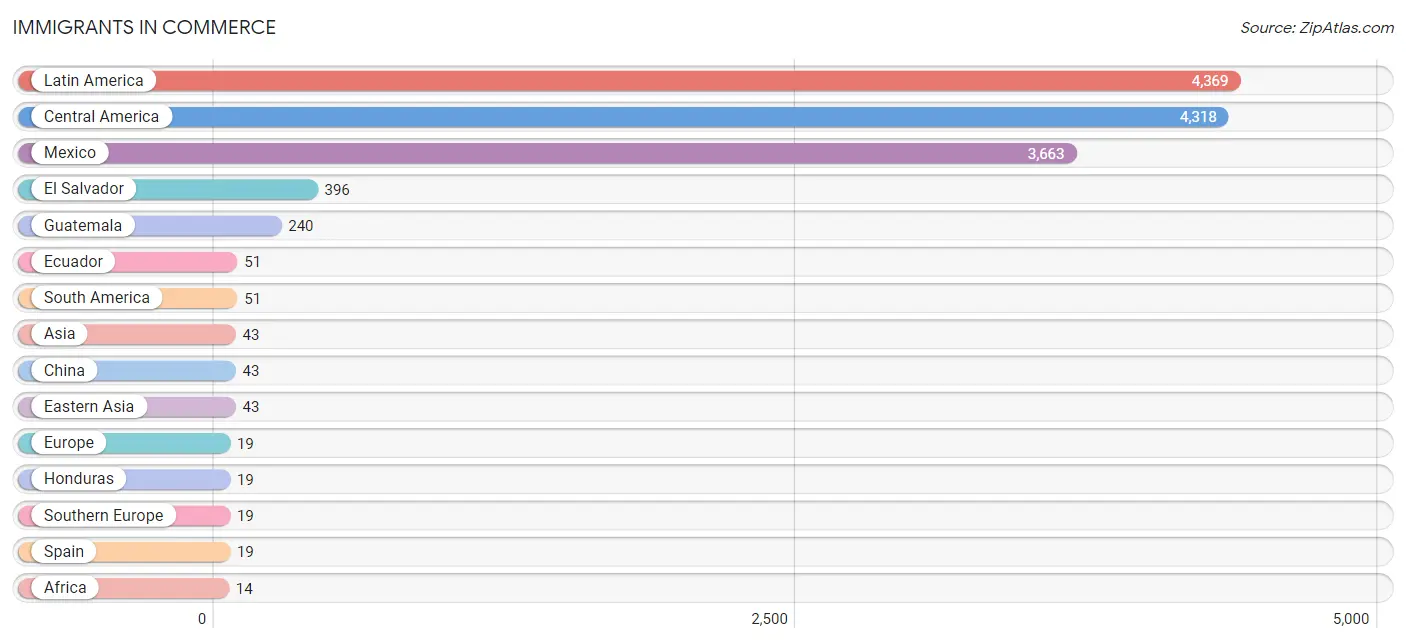
| Immigration Origin | # Population | % Population |
| Africa | 14 | 0.1% |
| Asia | 43 | 0.4% |
| Central America | 4,318 | 35.2% |
| China | 43 | 0.4% |
| Eastern Africa | 14 | 0.1% |
| Eastern Asia | 43 | 0.4% |
| Ecuador | 51 | 0.4% |
| El Salvador | 396 | 3.2% |
| Ethiopia | 14 | 0.1% |
| Europe | 19 | 0.2% |
| Guatemala | 240 | 2.0% |
| Honduras | 19 | 0.2% |
| Latin America | 4,369 | 35.7% |
| Mexico | 3,663 | 29.9% |
| South America | 51 | 0.4% |
| Southern Europe | 19 | 0.2% |
| Spain | 19 | 0.2% | View All 17 Rows |
Sex and Age in Commerce
Sex and Age in Commerce
The most populous age groups in Commerce are 25 to 29 Years (764 | 12.2%) for men and 45 to 49 Years (497 | 8.3%) for women.
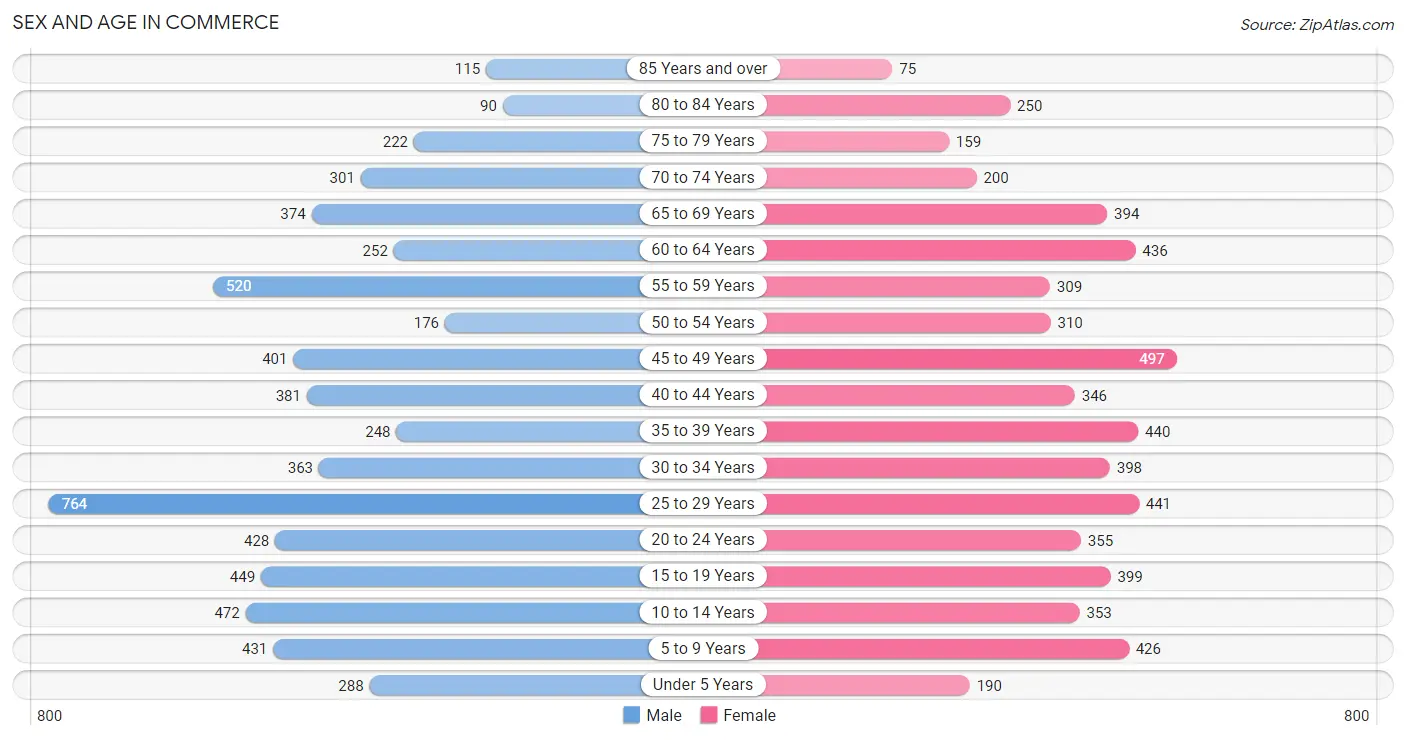
| Age Bracket | Male | Female |
| Under 5 Years | 288 (4.6%) | 190 (3.2%) |
| 5 to 9 Years | 431 (6.9%) | 426 (7.1%) |
| 10 to 14 Years | 472 (7.5%) | 353 (5.9%) |
| 15 to 19 Years | 449 (7.2%) | 399 (6.7%) |
| 20 to 24 Years | 428 (6.8%) | 355 (5.9%) |
| 25 to 29 Years | 764 (12.2%) | 441 (7.4%) |
| 30 to 34 Years | 363 (5.8%) | 398 (6.7%) |
| 35 to 39 Years | 248 (4.0%) | 440 (7.4%) |
| 40 to 44 Years | 381 (6.1%) | 346 (5.8%) |
| 45 to 49 Years | 401 (6.4%) | 497 (8.3%) |
| 50 to 54 Years | 176 (2.8%) | 310 (5.2%) |
| 55 to 59 Years | 520 (8.3%) | 309 (5.2%) |
| 60 to 64 Years | 252 (4.0%) | 436 (7.3%) |
| 65 to 69 Years | 374 (6.0%) | 394 (6.6%) |
| 70 to 74 Years | 301 (4.8%) | 200 (3.4%) |
| 75 to 79 Years | 222 (3.5%) | 159 (2.7%) |
| 80 to 84 Years | 90 (1.4%) | 250 (4.2%) |
| 85 Years and over | 115 (1.8%) | 75 (1.3%) |
| Total | 6,275 (100.0%) | 5,978 (100.0%) |
Families and Households in Commerce
Median Family Size in Commerce
The median family size in Commerce is 4.07 persons per family, with married-couple families (1,649 | 61.8%) accounting for the largest median family size of 4.47 persons per family. On the other hand, single male/father families (478 | 17.9%) represent the smallest median family size with 3.33 persons per family.
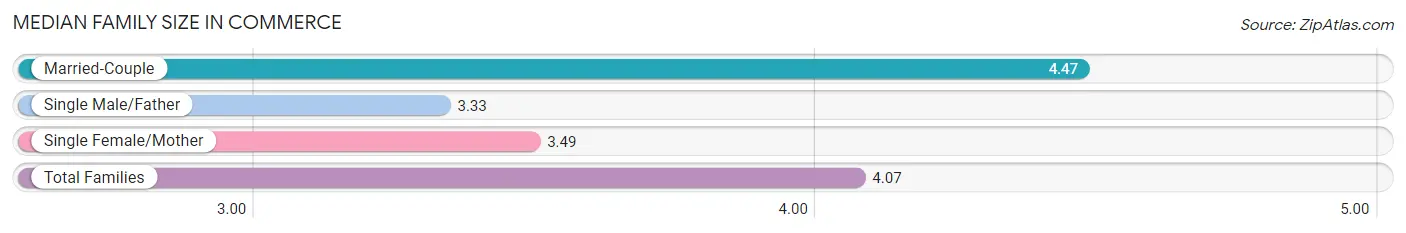
| Family Type | # Families | Family Size |
| Married-Couple | 1,649 (61.8%) | 4.47 |
| Single Male/Father | 478 (17.9%) | 3.33 |
| Single Female/Mother | 540 (20.3%) | 3.49 |
| Total Families | 2,667 (100.0%) | 4.07 |
Median Household Size in Commerce
The median household size in Commerce is 3.52 persons per household, with married-couple households (1,649 | 47.5%) accounting for the largest median household size of 4.54 persons per household. non-family households (805 | 23.2%) represent the smallest median household size with 1.16 persons per household.
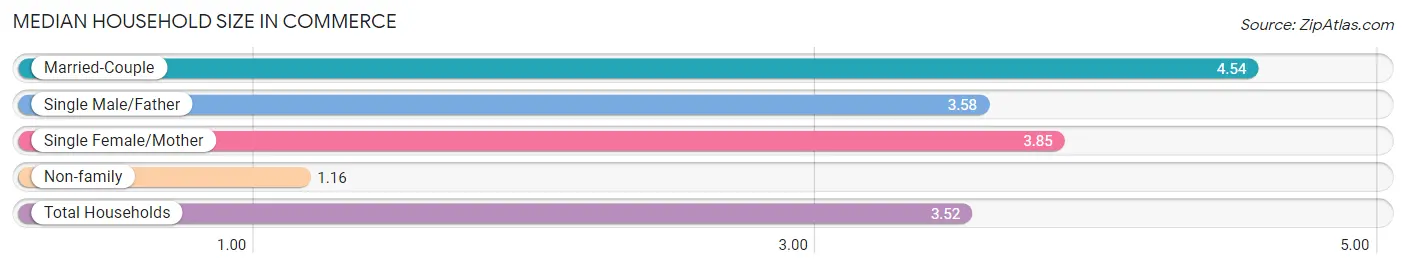
| Household Type | # Households | Household Size |
| Married-Couple | 1,649 (47.5%) | 4.54 |
| Single Male/Father | 478 (13.8%) | 3.58 |
| Single Female/Mother | 540 (15.5%) | 3.85 |
| Non-family | 805 (23.2%) | 1.16 |
| Total Households | 3,472 (100.0%) | 3.52 |
Household Size by Marriage Status in Commerce
Out of a total of 3,472 households in Commerce, 2,667 (76.8%) are family households, while 805 (23.2%) are nonfamily households. The most numerous type of family households are 5-person households, comprising 621, and the most common type of nonfamily households are 1-person households, comprising 711.
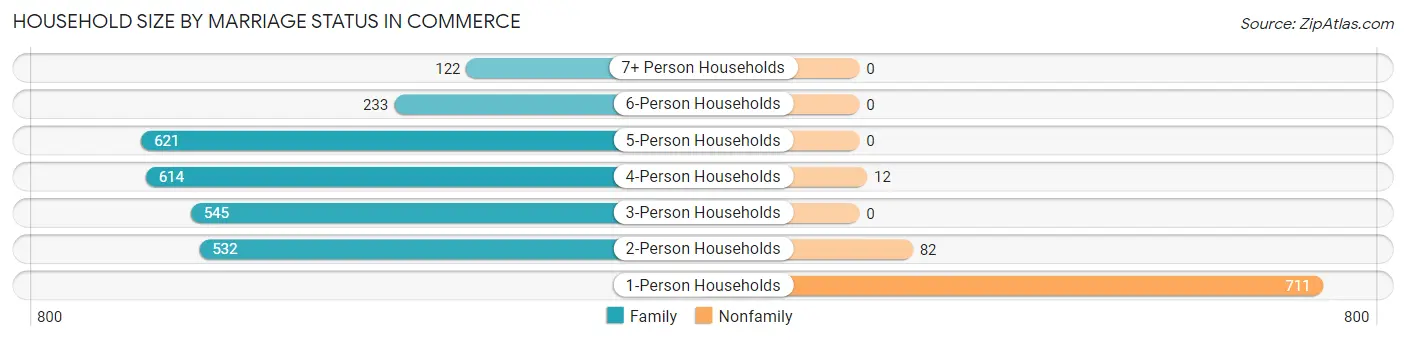
| Household Size | Family Households | Nonfamily Households |
| 1-Person Households | - | 711 (20.5%) |
| 2-Person Households | 532 (15.3%) | 82 (2.4%) |
| 3-Person Households | 545 (15.7%) | 0 (0.0%) |
| 4-Person Households | 614 (17.7%) | 12 (0.4%) |
| 5-Person Households | 621 (17.9%) | 0 (0.0%) |
| 6-Person Households | 233 (6.7%) | 0 (0.0%) |
| 7+ Person Households | 122 (3.5%) | 0 (0.0%) |
| Total | 2,667 (76.8%) | 805 (23.2%) |
Female Fertility in Commerce
Fertility by Age in Commerce
Average fertility rate in Commerce is 27.0 births per 1,000 women. Women in the age bracket of 20 to 34 years have the highest fertility rate with 49.0 births per 1,000 women. Women in the age bracket of 20 to 34 years acount for 75.6% of all women with births.
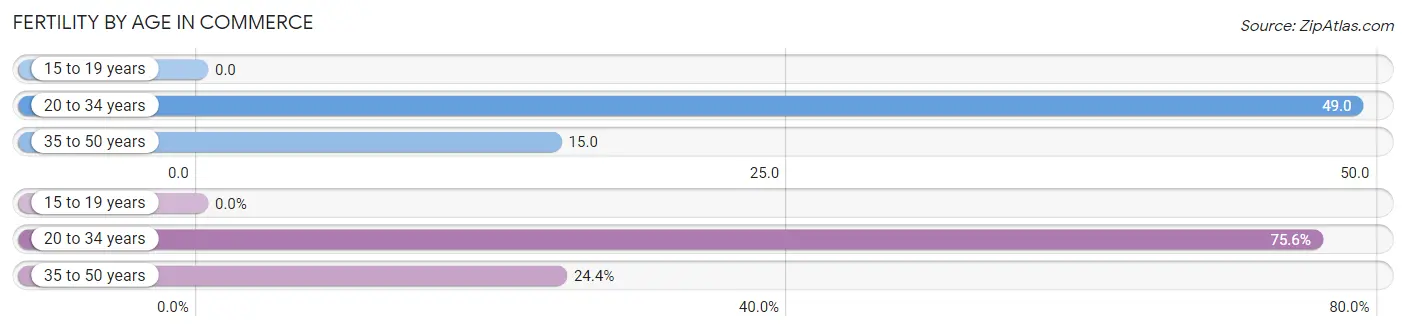
| Age Bracket | Women with Births | Births / 1,000 Women |
| 15 to 19 years | 0 (0.0%) | 0.0 |
| 20 to 34 years | 59 (75.6%) | 49.0 |
| 35 to 50 years | 19 (24.4%) | 15.0 |
| Total | 78 (100.0%) | 27.0 |
Fertility by Age by Marriage Status in Commerce
89.7% of women with births (78) in Commerce are married. The highest percentage of unmarried women with births falls into 20 to 34 years age bracket with 13.6% of them unmarried at the time of birth, while the lowest percentage of unmarried women with births belong to 35 to 50 years age bracket with 0.0% of them unmarried.
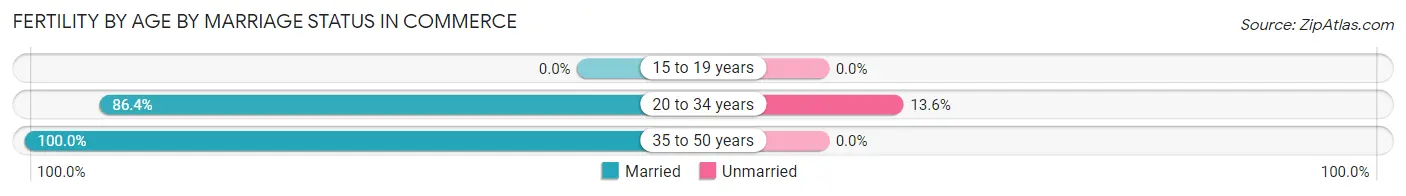
| Age Bracket | Married | Unmarried |
| 15 to 19 years | 0 (0.0%) | 0 (0.0%) |
| 20 to 34 years | 51 (86.4%) | 8 (13.6%) |
| 35 to 50 years | 19 (100.0%) | 0 (0.0%) |
| Total | 70 (89.7%) | 8 (10.3%) |
Fertility by Education in Commerce
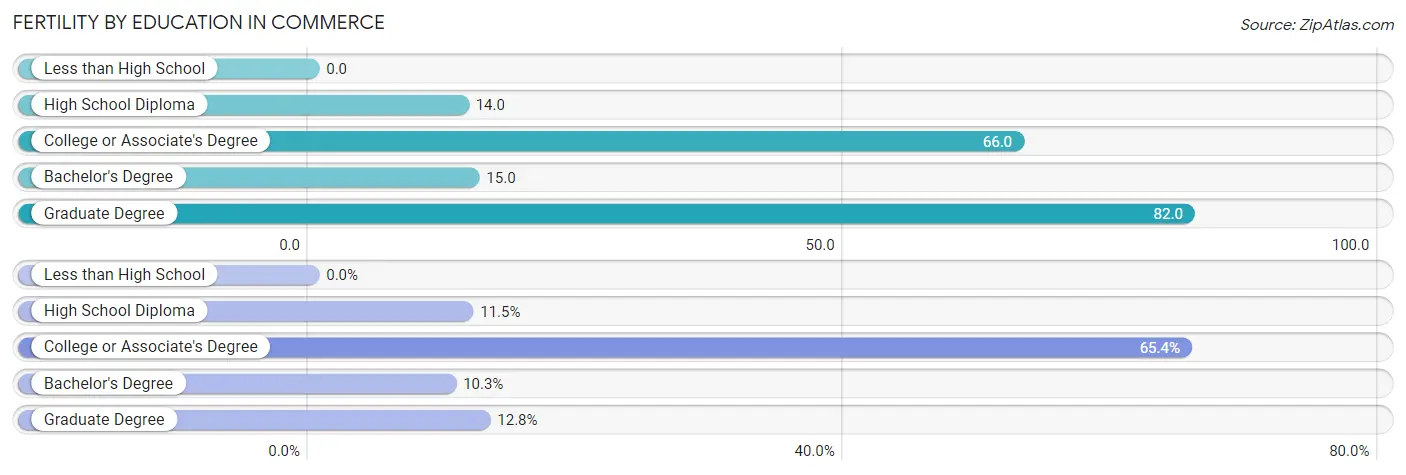
| Educational Attainment | Women with Births | Births / 1,000 Women |
| Less than High School | 0 (0.0%) | 0.0 |
| High School Diploma | 9 (11.5%) | 14.0 |
| College or Associate's Degree | 51 (65.4%) | 66.0 |
| Bachelor's Degree | 8 (10.3%) | 15.0 |
| Graduate Degree | 10 (12.8%) | 82.0 |
| Total | 78 (100.0%) | 27.0 |
Fertility by Education by Marriage Status in Commerce
10.3% of women with births in Commerce are unmarried. Women with the educational attainment of high school diploma are most likely to be married with 100.0% of them married at childbirth, while women with the educational attainment of bachelor's degree are least likely to be married with 100.0% of them unmarried at childbirth.
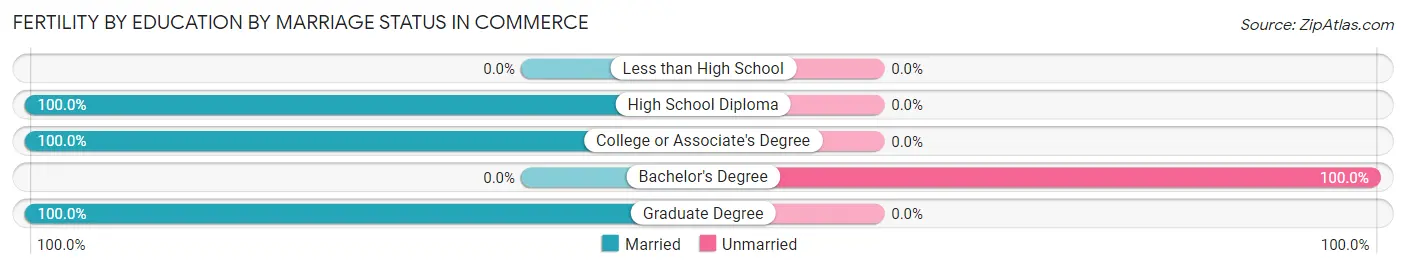
| Educational Attainment | Married | Unmarried |
| Less than High School | 0 (0.0%) | 0 (0.0%) |
| High School Diploma | 9 (100.0%) | 0 (0.0%) |
| College or Associate's Degree | 51 (100.0%) | 0 (0.0%) |
| Bachelor's Degree | 0 (0.0%) | 8 (100.0%) |
| Graduate Degree | 10 (100.0%) | 0 (0.0%) |
| Total | 70 (89.7%) | 8 (10.3%) |
Employment Characteristics in Commerce
Employment by Class of Employer in Commerce
Among the 5,443 employed individuals in Commerce, private company employees (3,858 | 70.9%), local government employees (685 | 12.6%), and self-employed (not incorporated) (285 | 5.2%) make up the most common classes of employment.
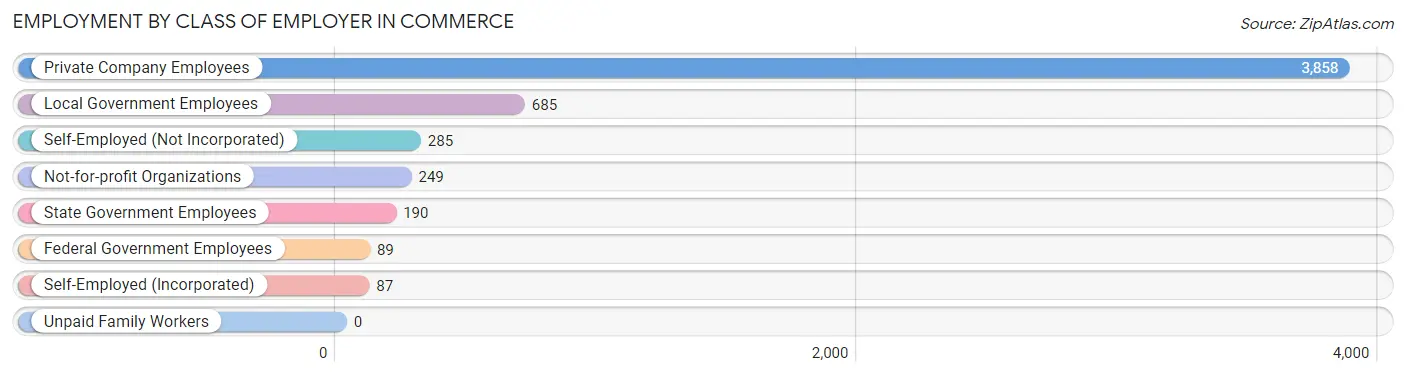
| Employer Class | # Employees | % Employees |
| Private Company Employees | 3,858 | 70.9% |
| Self-Employed (Incorporated) | 87 | 1.6% |
| Self-Employed (Not Incorporated) | 285 | 5.2% |
| Not-for-profit Organizations | 249 | 4.6% |
| Local Government Employees | 685 | 12.6% |
| State Government Employees | 190 | 3.5% |
| Federal Government Employees | 89 | 1.6% |
| Unpaid Family Workers | 0 | 0.0% |
| Total | 5,443 | 100.0% |
Employment Status by Age in Commerce
According to the labor force statistics for Commerce, out of the total population over 16 years of age (10,037), 57.1% or 5,731 individuals are in the labor force, with 4.9% or 281 of them unemployed. The age group with the highest labor force participation rate is 55 to 59 years, with 84.0% or 696 individuals in the labor force. Within the labor force, the 16 to 19 years age range has the highest percentage of unemployed individuals, with 9.7% or 20 of them being unemployed.
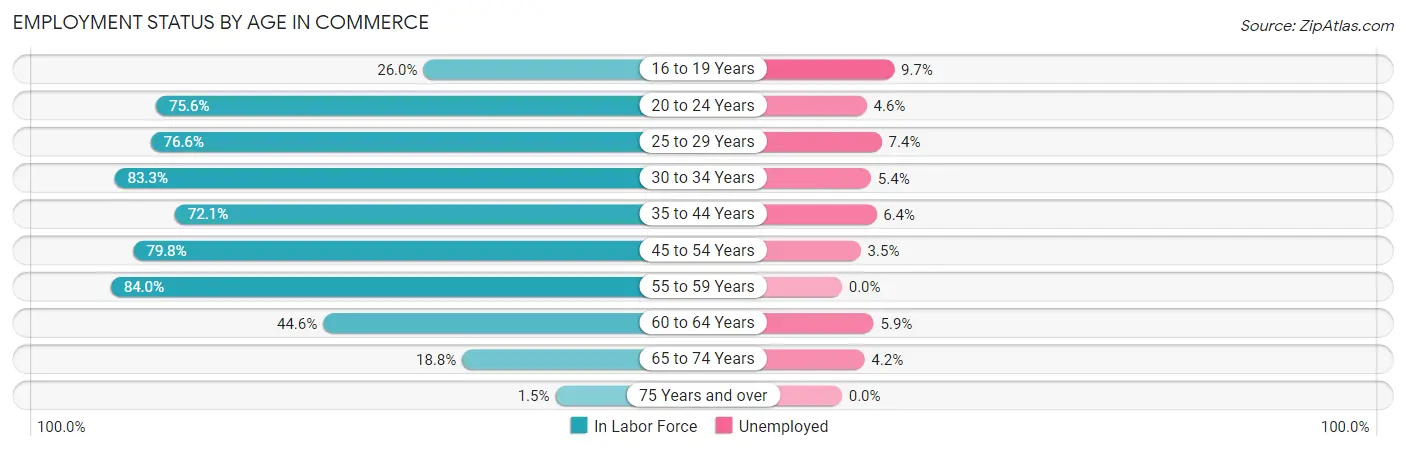
| Age Bracket | In Labor Force | Unemployed |
| 16 to 19 Years | 206 (26.0%) | 20 (9.7%) |
| 20 to 24 Years | 592 (75.6%) | 27 (4.6%) |
| 25 to 29 Years | 923 (76.6%) | 68 (7.4%) |
| 30 to 34 Years | 634 (83.3%) | 34 (5.4%) |
| 35 to 44 Years | 1,020 (72.1%) | 65 (6.4%) |
| 45 to 54 Years | 1,104 (79.8%) | 39 (3.5%) |
| 55 to 59 Years | 696 (84.0%) | 0 (0.0%) |
| 60 to 64 Years | 307 (44.6%) | 18 (5.9%) |
| 65 to 74 Years | 239 (18.8%) | 10 (4.2%) |
| 75 Years and over | 14 (1.5%) | 0 (0.0%) |
| Total | 5,731 (57.1%) | 281 (4.9%) |
Employment Status by Educational Attainment in Commerce
According to labor force statistics for Commerce, 74.6% of individuals (4,686) out of the total population between 25 and 64 years of age (6,282) are in the labor force, with 4.8% or 225 of them being unemployed. The group with the highest labor force participation rate are those with the educational attainment of bachelor's degree or higher, with 93.5% or 882 individuals in the labor force. Within the labor force, individuals with bachelor's degree or higher education have the highest percentage of unemployment, with 7.6% or 67 of them being unemployed.
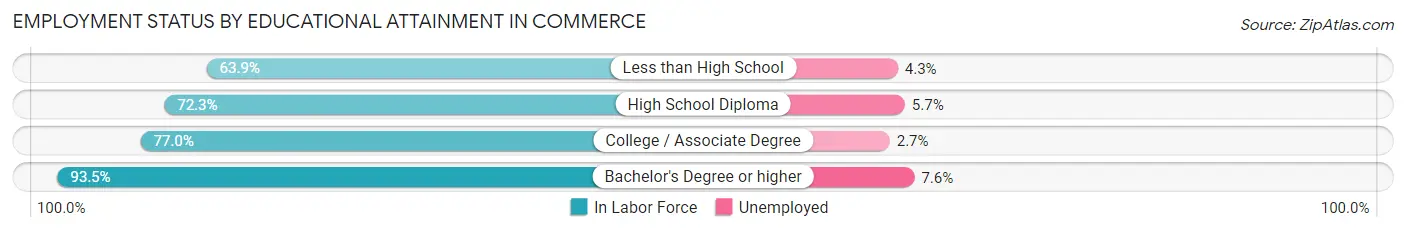
| Educational Attainment | In Labor Force | Unemployed |
| Less than High School | 1,132 (63.9%) | 76 (4.3%) |
| High School Diploma | 1,194 (72.3%) | 94 (5.7%) |
| College / Associate Degree | 1,475 (77.0%) | 52 (2.7%) |
| Bachelor's Degree or higher | 882 (93.5%) | 72 (7.6%) |
| Total | 4,686 (74.6%) | 302 (4.8%) |
Employment Occupations by Sex in Commerce
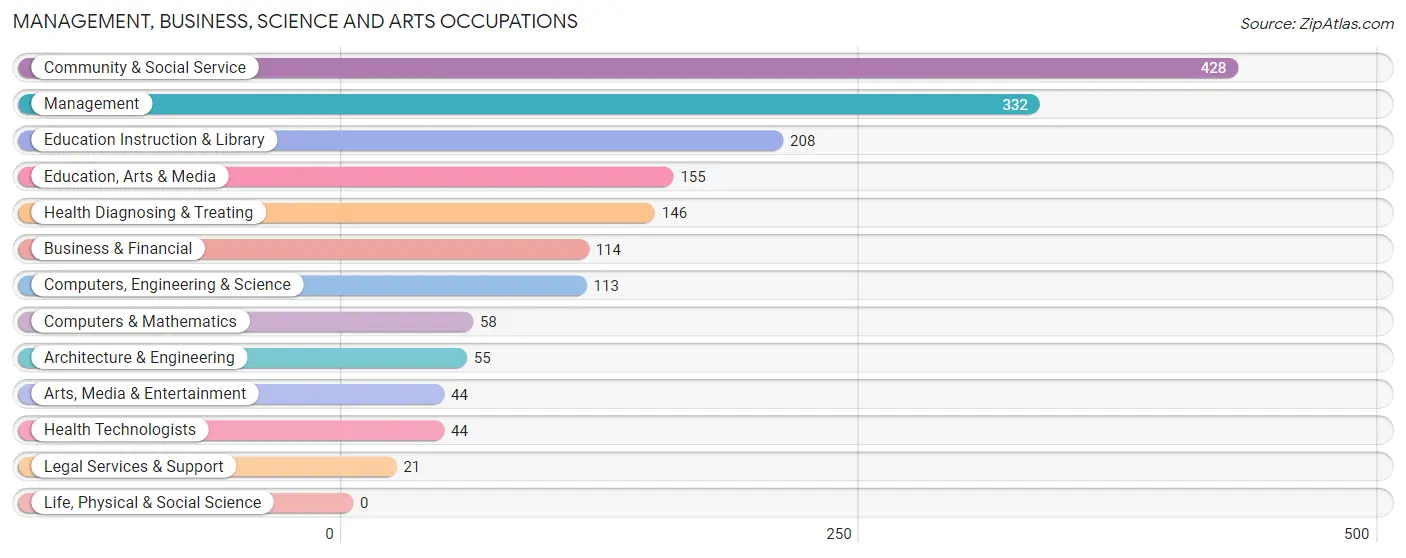
Management, Business, Science and Arts Occupations
The most common Management, Business, Science and Arts occupations in Commerce are Community & Social Service (428 | 7.9%), Management (332 | 6.1%), Education Instruction & Library (208 | 3.8%), Education, Arts & Media (155 | 2.8%), and Health Diagnosing & Treating (146 | 2.7%).
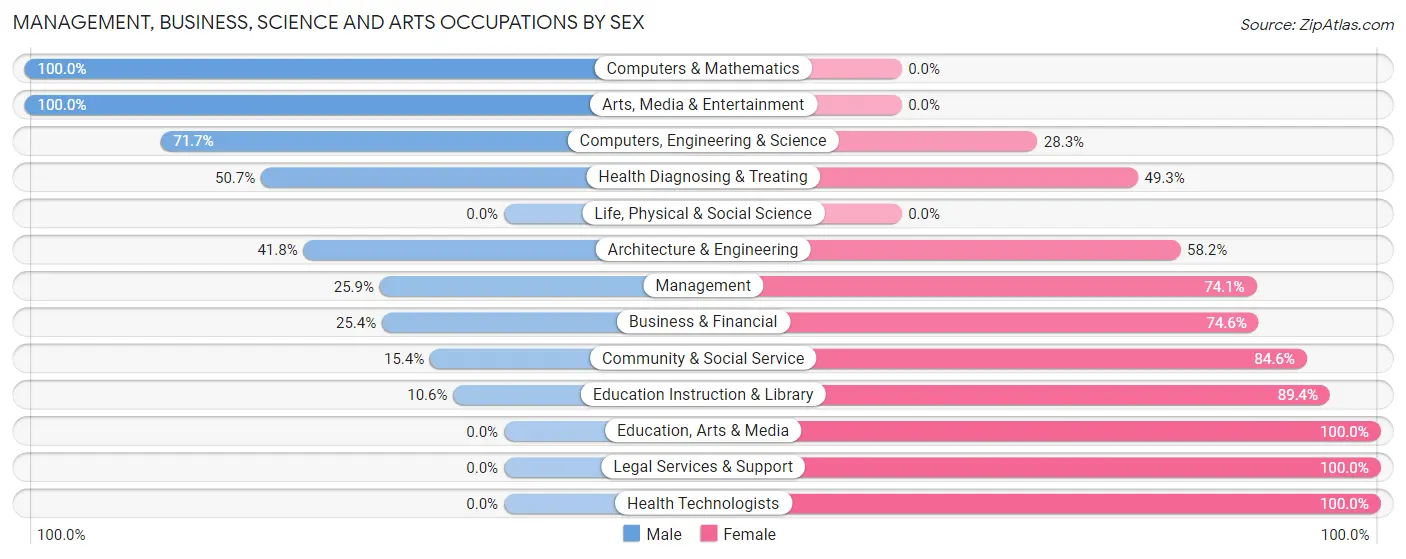
Management, Business, Science and Arts Occupations by Sex
Within the Management, Business, Science and Arts occupations in Commerce, the most male-oriented occupations are Computers & Mathematics (100.0%), Arts, Media & Entertainment (100.0%), and Computers, Engineering & Science (71.7%), while the most female-oriented occupations are Education, Arts & Media (100.0%), Legal Services & Support (100.0%), and Health Technologists (100.0%).
| Occupation | Male | Female |
| Management | 86 (25.9%) | 246 (74.1%) |
| Business & Financial | 29 (25.4%) | 85 (74.6%) |
| Computers, Engineering & Science | 81 (71.7%) | 32 (28.3%) |
| Computers & Mathematics | 58 (100.0%) | 0 (0.0%) |
| Architecture & Engineering | 23 (41.8%) | 32 (58.2%) |
| Life, Physical & Social Science | 0 (0.0%) | 0 (0.0%) |
| Community & Social Service | 66 (15.4%) | 362 (84.6%) |
| Education, Arts & Media | 0 (0.0%) | 155 (100.0%) |
| Legal Services & Support | 0 (0.0%) | 21 (100.0%) |
| Education Instruction & Library | 22 (10.6%) | 186 (89.4%) |
| Arts, Media & Entertainment | 44 (100.0%) | 0 (0.0%) |
| Health Diagnosing & Treating | 74 (50.7%) | 72 (49.3%) |
| Health Technologists | 0 (0.0%) | 44 (100.0%) |
| Total (Category) | 336 (29.7%) | 797 (70.3%) |
| Total (Overall) | 2,869 (52.6%) | 2,584 (47.4%) |
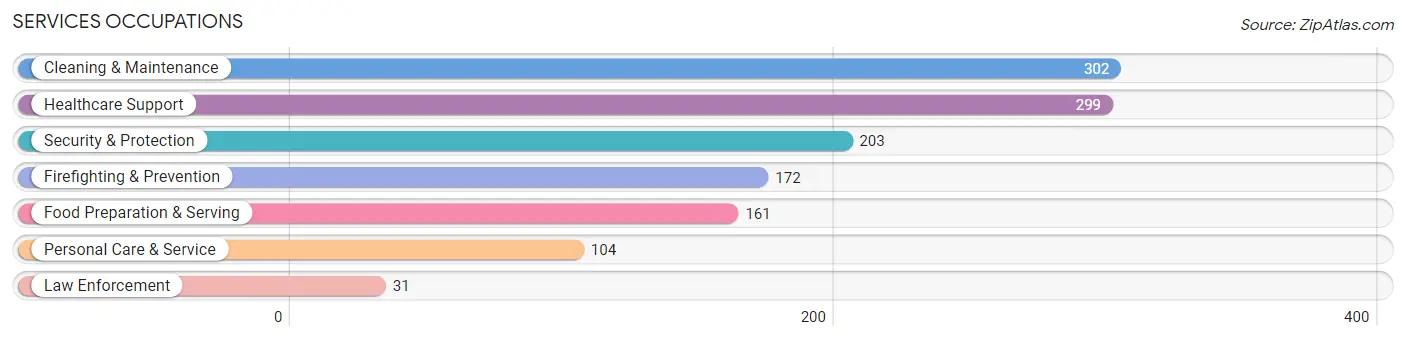
Services Occupations
The most common Services occupations in Commerce are Cleaning & Maintenance (302 | 5.5%), Healthcare Support (299 | 5.5%), Security & Protection (203 | 3.7%), Firefighting & Prevention (172 | 3.2%), and Food Preparation & Serving (161 | 2.9%).
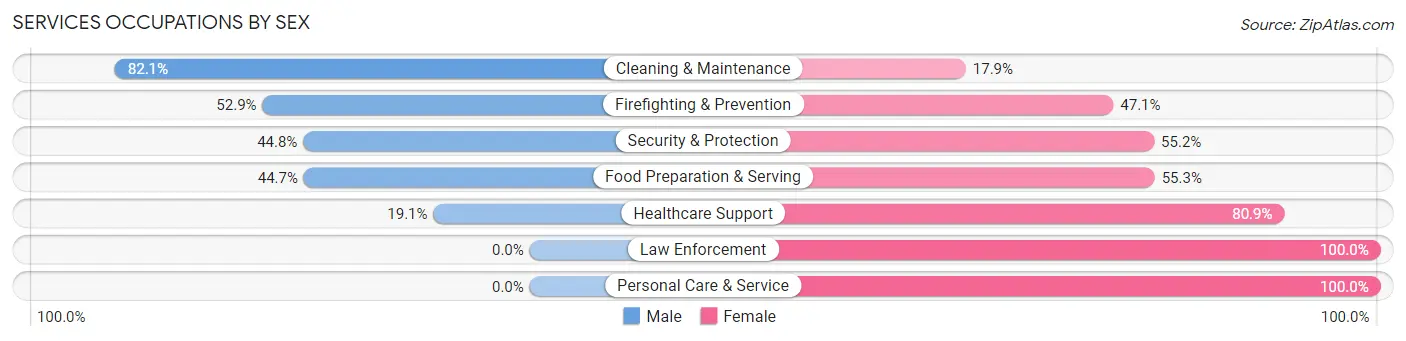
Services Occupations by Sex
Within the Services occupations in Commerce, the most male-oriented occupations are Cleaning & Maintenance (82.1%), Firefighting & Prevention (52.9%), and Security & Protection (44.8%), while the most female-oriented occupations are Law Enforcement (100.0%), Personal Care & Service (100.0%), and Healthcare Support (80.9%).
| Occupation | Male | Female |
| Healthcare Support | 57 (19.1%) | 242 (80.9%) |
| Security & Protection | 91 (44.8%) | 112 (55.2%) |
| Firefighting & Prevention | 91 (52.9%) | 81 (47.1%) |
| Law Enforcement | 0 (0.0%) | 31 (100.0%) |
| Food Preparation & Serving | 72 (44.7%) | 89 (55.3%) |
| Cleaning & Maintenance | 248 (82.1%) | 54 (17.9%) |
| Personal Care & Service | 0 (0.0%) | 104 (100.0%) |
| Total (Category) | 468 (43.8%) | 601 (56.2%) |
| Total (Overall) | 2,869 (52.6%) | 2,584 (47.4%) |
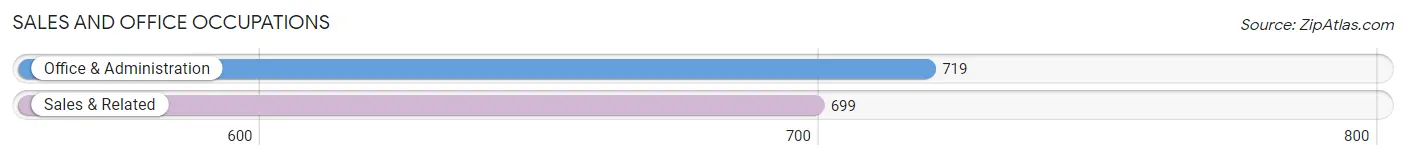
Sales and Office Occupations
The most common Sales and Office occupations in Commerce are Office & Administration (719 | 13.2%), and Sales & Related (699 | 12.8%).
Sales and Office Occupations by Sex
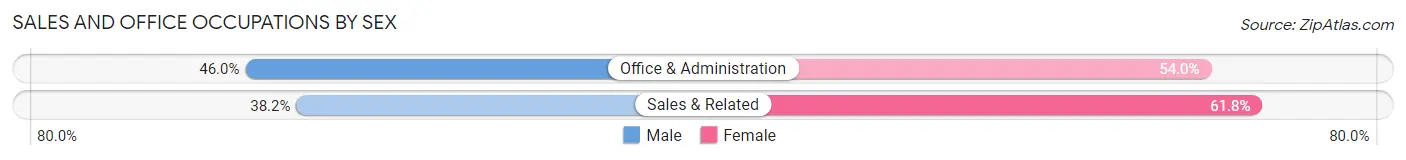
| Occupation | Male | Female |
| Sales & Related | 267 (38.2%) | 432 (61.8%) |
| Office & Administration | 331 (46.0%) | 388 (54.0%) |
| Total (Category) | 598 (42.2%) | 820 (57.8%) |
| Total (Overall) | 2,869 (52.6%) | 2,584 (47.4%) |
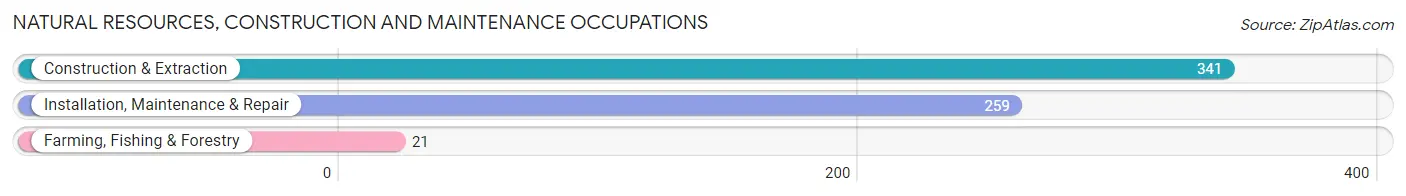
Natural Resources, Construction and Maintenance Occupations
The most common Natural Resources, Construction and Maintenance occupations in Commerce are Construction & Extraction (341 | 6.2%), Installation, Maintenance & Repair (259 | 4.8%), and Farming, Fishing & Forestry (21 | 0.4%).
Natural Resources, Construction and Maintenance Occupations by Sex
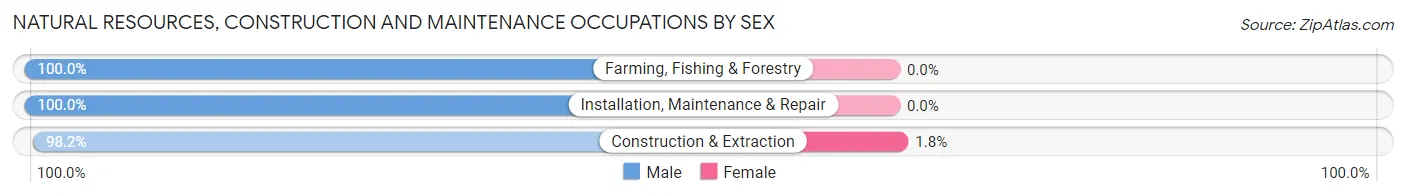
| Occupation | Male | Female |
| Farming, Fishing & Forestry | 21 (100.0%) | 0 (0.0%) |
| Construction & Extraction | 335 (98.2%) | 6 (1.8%) |
| Installation, Maintenance & Repair | 259 (100.0%) | 0 (0.0%) |
| Total (Category) | 615 (99.0%) | 6 (1.0%) |
| Total (Overall) | 2,869 (52.6%) | 2,584 (47.4%) |
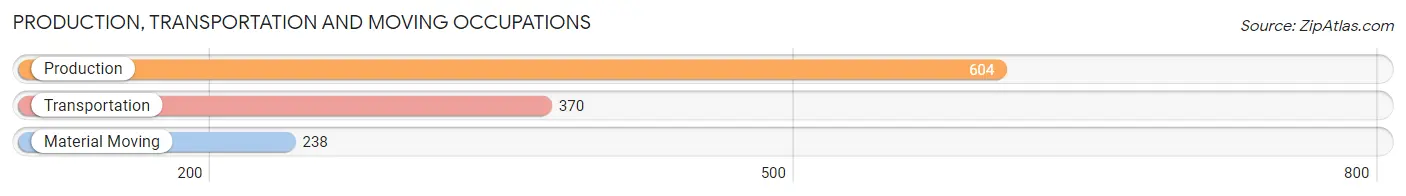
Production, Transportation and Moving Occupations
The most common Production, Transportation and Moving occupations in Commerce are Production (604 | 11.1%), Transportation (370 | 6.8%), and Material Moving (238 | 4.4%).
Production, Transportation and Moving Occupations by Sex
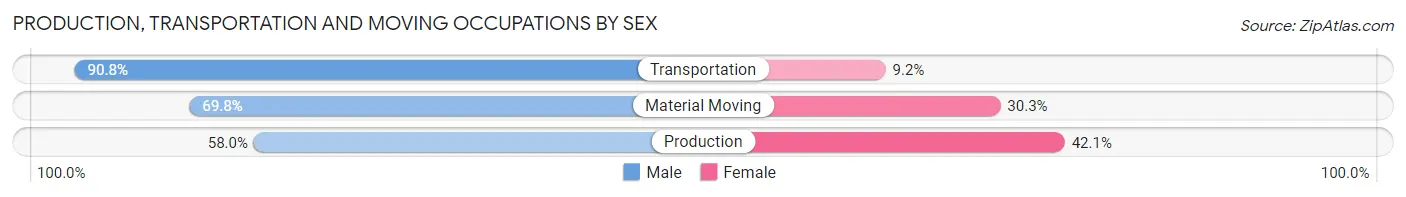
| Occupation | Male | Female |
| Production | 350 (58.0%) | 254 (42.0%) |
| Transportation | 336 (90.8%) | 34 (9.2%) |
| Material Moving | 166 (69.8%) | 72 (30.2%) |
| Total (Category) | 852 (70.3%) | 360 (29.7%) |
| Total (Overall) | 2,869 (52.6%) | 2,584 (47.4%) |
Employment Industries by Sex in Commerce
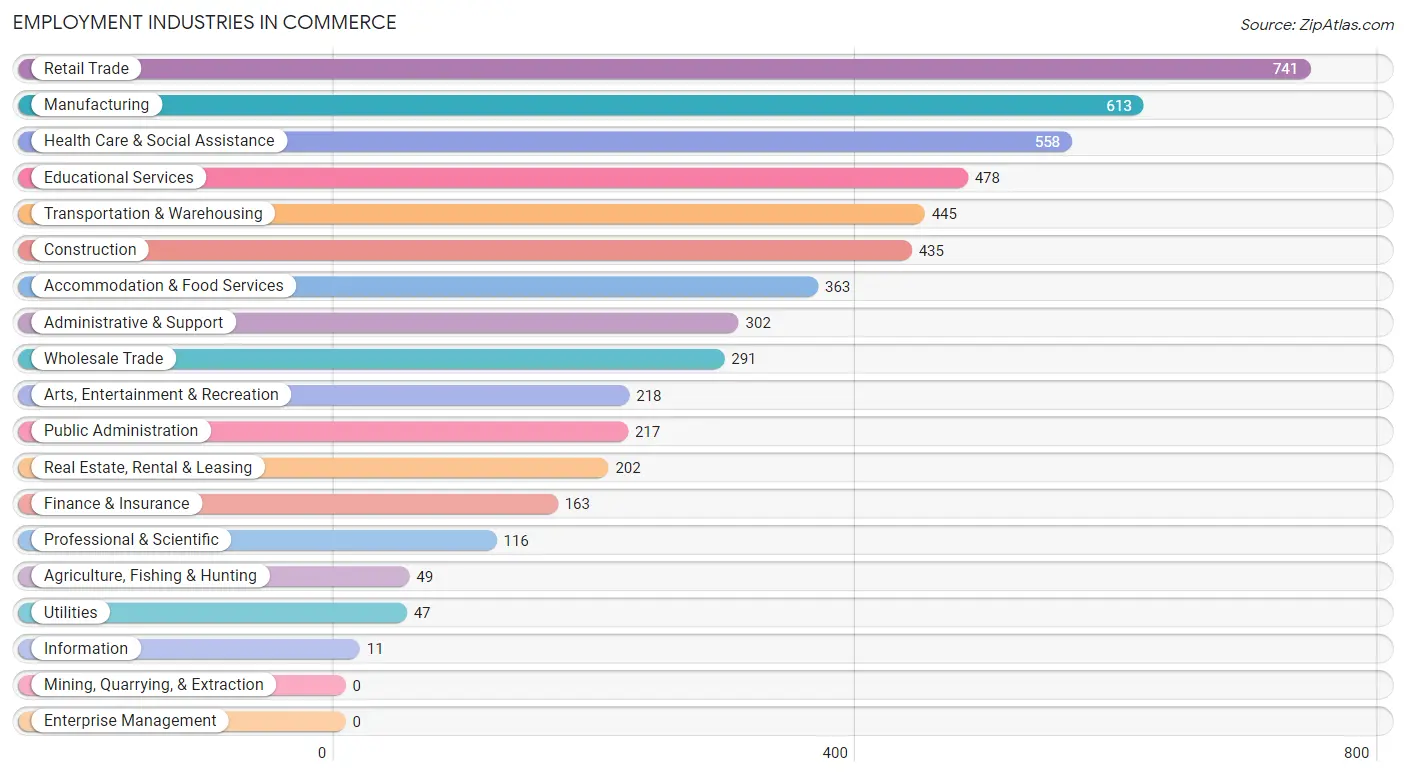
Employment Industries in Commerce
The major employment industries in Commerce include Retail Trade (741 | 13.6%), Manufacturing (613 | 11.2%), Health Care & Social Assistance (558 | 10.2%), Educational Services (478 | 8.8%), and Transportation & Warehousing (445 | 8.2%).
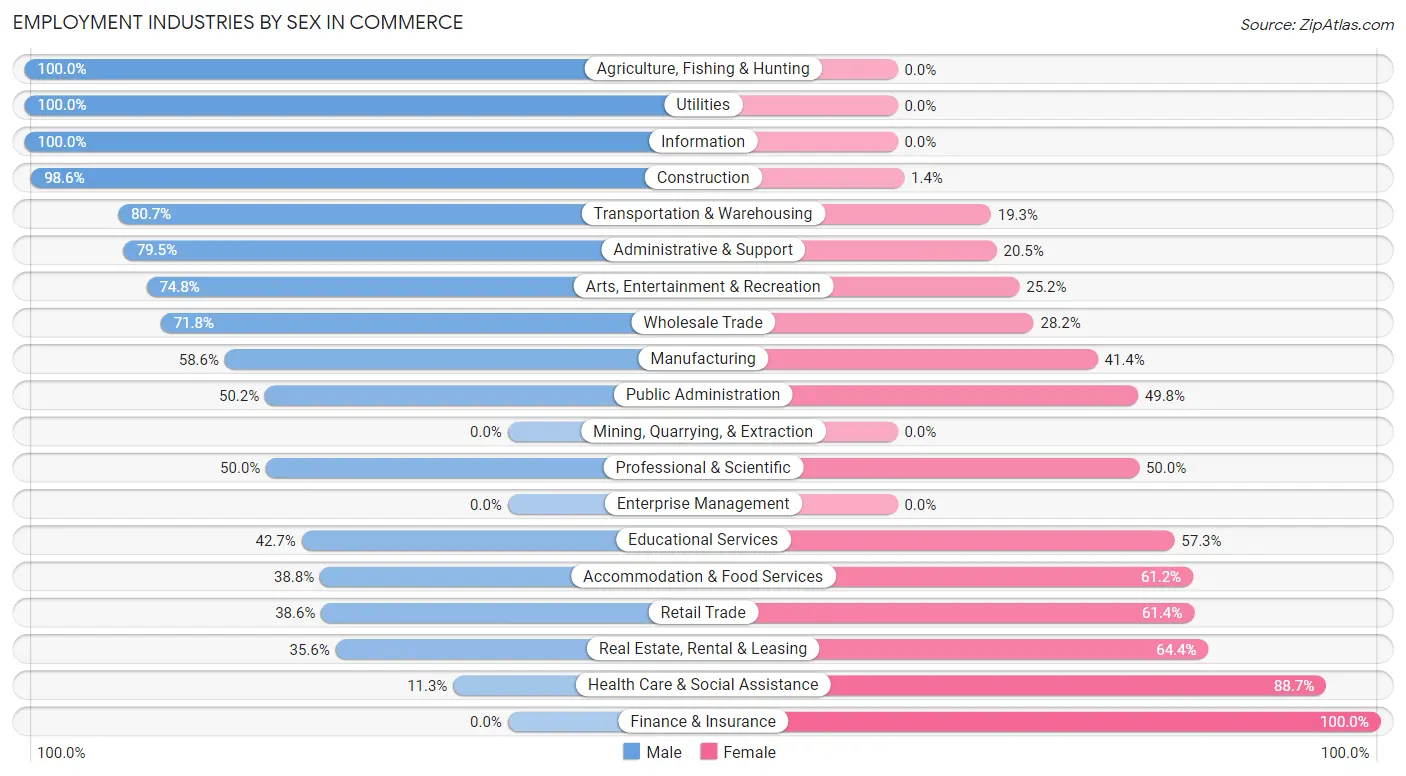
Employment Industries by Sex in Commerce
The Commerce industries that see more men than women are Agriculture, Fishing & Hunting (100.0%), Utilities (100.0%), and Information (100.0%), whereas the industries that tend to have a higher number of women are Finance & Insurance (100.0%), Health Care & Social Assistance (88.7%), and Real Estate, Rental & Leasing (64.4%).
| Industry | Male | Female |
| Agriculture, Fishing & Hunting | 49 (100.0%) | 0 (0.0%) |
| Mining, Quarrying, & Extraction | 0 (0.0%) | 0 (0.0%) |
| Construction | 429 (98.6%) | 6 (1.4%) |
| Manufacturing | 359 (58.6%) | 254 (41.4%) |
| Wholesale Trade | 209 (71.8%) | 82 (28.2%) |
| Retail Trade | 286 (38.6%) | 455 (61.4%) |
| Transportation & Warehousing | 359 (80.7%) | 86 (19.3%) |
| Utilities | 47 (100.0%) | 0 (0.0%) |
| Information | 11 (100.0%) | 0 (0.0%) |
| Finance & Insurance | 0 (0.0%) | 163 (100.0%) |
| Real Estate, Rental & Leasing | 72 (35.6%) | 130 (64.4%) |
| Professional & Scientific | 58 (50.0%) | 58 (50.0%) |
| Enterprise Management | 0 (0.0%) | 0 (0.0%) |
| Administrative & Support | 240 (79.5%) | 62 (20.5%) |
| Educational Services | 204 (42.7%) | 274 (57.3%) |
| Health Care & Social Assistance | 63 (11.3%) | 495 (88.7%) |
| Arts, Entertainment & Recreation | 163 (74.8%) | 55 (25.2%) |
| Accommodation & Food Services | 141 (38.8%) | 222 (61.2%) |
| Public Administration | 109 (50.2%) | 108 (49.8%) |
| Total | 2,869 (52.6%) | 2,584 (47.4%) |
Education in Commerce
School Enrollment in Commerce
The most common levels of schooling among the 3,575 students in Commerce are college / undergraduate (1,151 | 32.2%), high school (760 | 21.3%), and elementary school (667 | 18.7%).
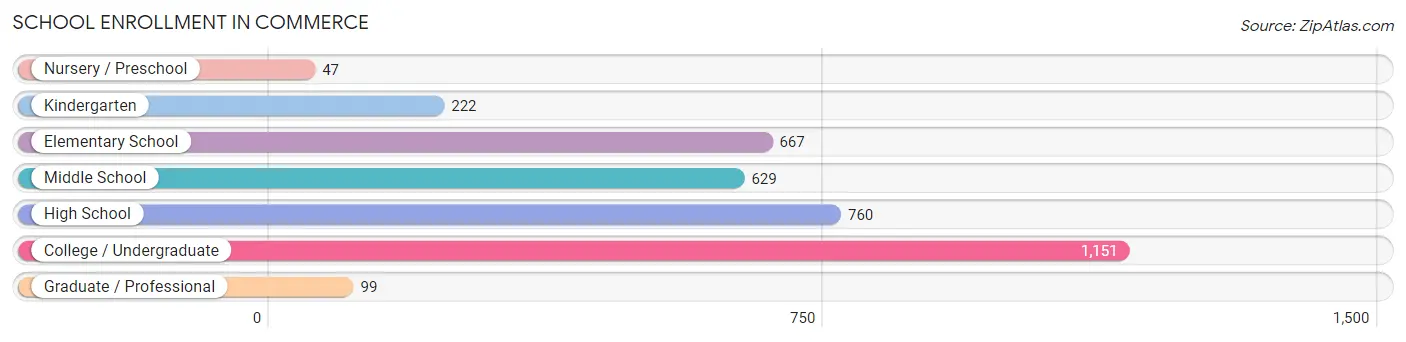
| School Level | # Students | % Students |
| Nursery / Preschool | 47 | 1.3% |
| Kindergarten | 222 | 6.2% |
| Elementary School | 667 | 18.7% |
| Middle School | 629 | 17.6% |
| High School | 760 | 21.3% |
| College / Undergraduate | 1,151 | 32.2% |
| Graduate / Professional | 99 | 2.8% |
| Total | 3,575 | 100.0% |
School Enrollment by Age by Funding Source in Commerce
Out of a total of 3,575 students who are enrolled in schools in Commerce, 325 (9.1%) attend a private institution, while the remaining 3,250 (90.9%) are enrolled in public schools. The age group of 25 to 34 year olds has the highest likelihood of being enrolled in private schools, with 152 (34.2% in the age bracket) enrolled. Conversely, the age group of 10 to 14 year olds has the lowest likelihood of being enrolled in a private school, with 776 (97.2% in the age bracket) attending a public institution.
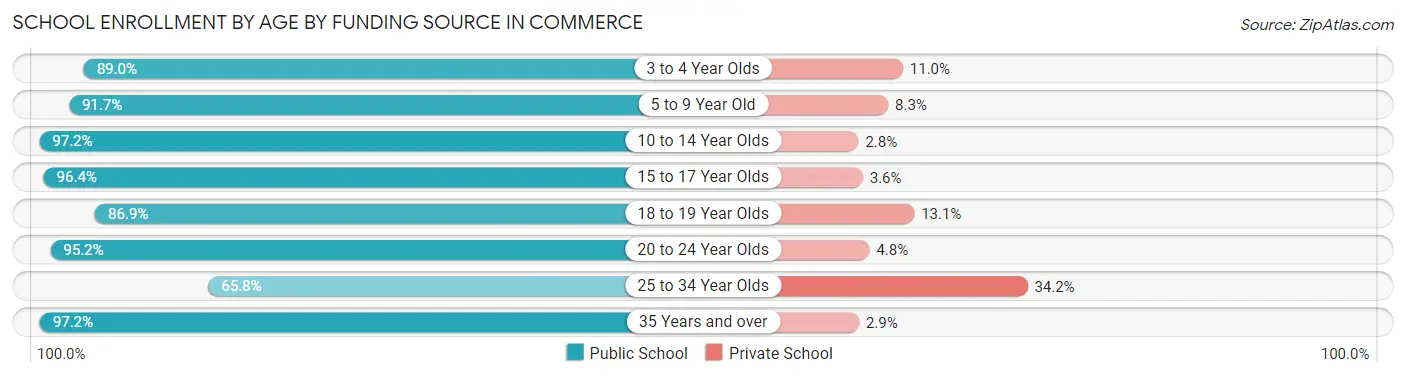
| Age Bracket | Public School | Private School |
| 3 to 4 Year Olds | 105 (89.0%) | 13 (11.0%) |
| 5 to 9 Year Old | 754 (91.7%) | 68 (8.3%) |
| 10 to 14 Year Olds | 776 (97.2%) | 22 (2.8%) |
| 15 to 17 Year Olds | 488 (96.4%) | 18 (3.6%) |
| 18 to 19 Year Olds | 152 (86.9%) | 23 (13.1%) |
| 20 to 24 Year Olds | 377 (95.2%) | 19 (4.8%) |
| 25 to 34 Year Olds | 292 (65.8%) | 152 (34.2%) |
| 35 Years and over | 307 (97.2%) | 9 (2.9%) |
| Total | 3,250 (90.9%) | 325 (9.1%) |
Educational Attainment by Field of Study in Commerce
Business (378 | 36.1%), science & technology (94 | 9.0%), engineering (93 | 8.9%), communications (86 | 8.2%), and education (81 | 7.7%) are the most common fields of study among 1,048 individuals in Commerce who have obtained a bachelor's degree or higher.
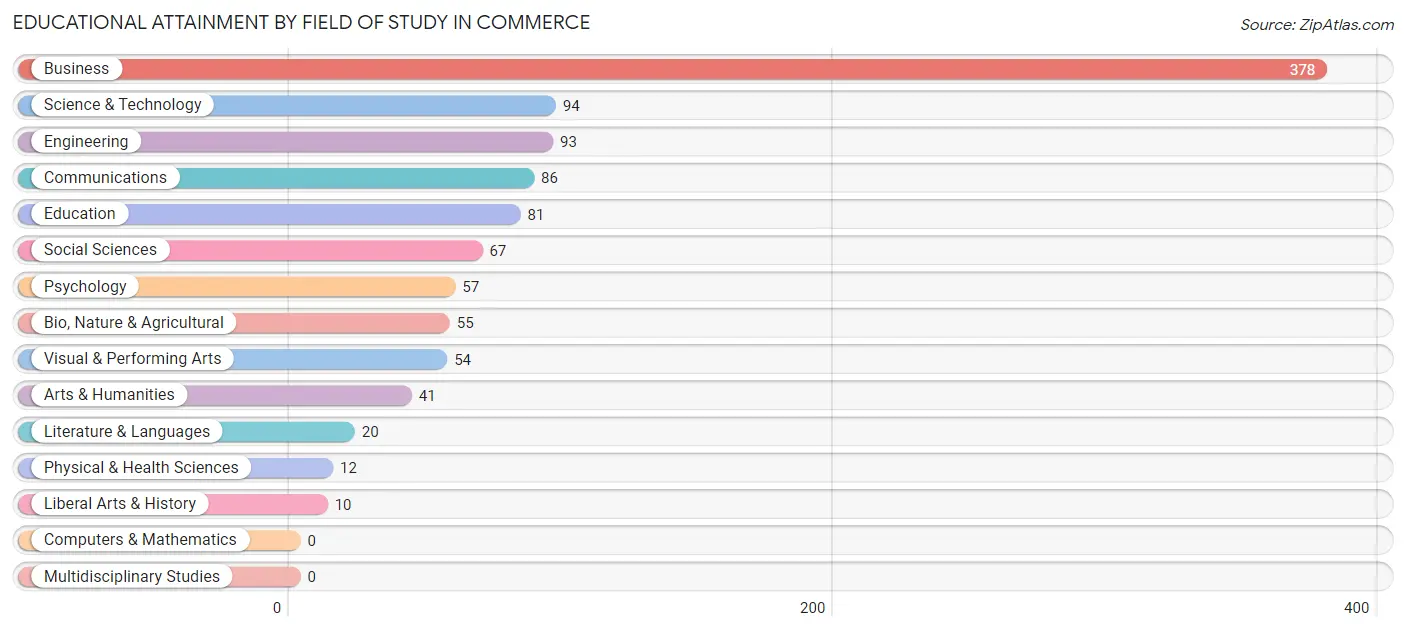
| Field of Study | # Graduates | % Graduates |
| Computers & Mathematics | 0 | 0.0% |
| Bio, Nature & Agricultural | 55 | 5.2% |
| Physical & Health Sciences | 12 | 1.1% |
| Psychology | 57 | 5.4% |
| Social Sciences | 67 | 6.4% |
| Engineering | 93 | 8.9% |
| Multidisciplinary Studies | 0 | 0.0% |
| Science & Technology | 94 | 9.0% |
| Business | 378 | 36.1% |
| Education | 81 | 7.7% |
| Literature & Languages | 20 | 1.9% |
| Liberal Arts & History | 10 | 0.9% |
| Visual & Performing Arts | 54 | 5.1% |
| Communications | 86 | 8.2% |
| Arts & Humanities | 41 | 3.9% |
| Total | 1,048 | 100.0% |
Transportation & Commute in Commerce
Vehicle Availability by Sex in Commerce
The most prevalent vehicle ownership categories in Commerce are males with 2 vehicles (1,084, accounting for 37.9%) and females with 2 vehicles (757, making up 41.9%).
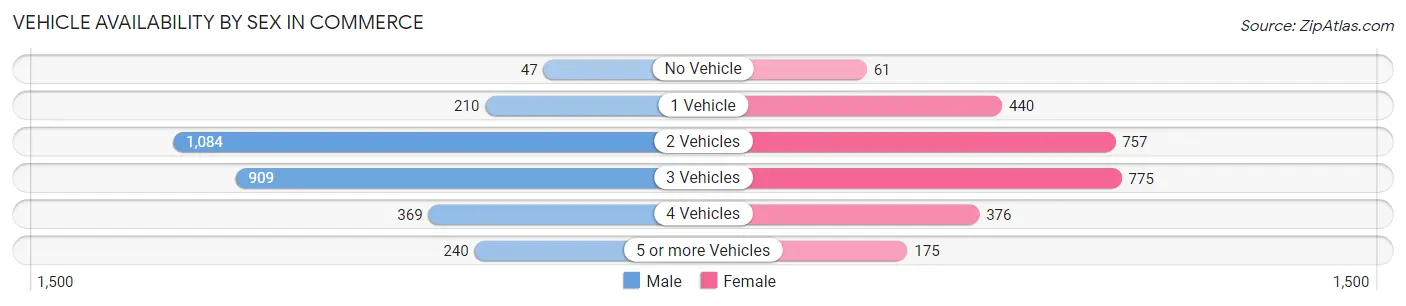
| Vehicles Available | Male | Female |
| No Vehicle | 47 (1.6%) | 61 (2.4%) |
| 1 Vehicle | 210 (7.3%) | 440 (17.0%) |
| 2 Vehicles | 1,084 (37.9%) | 757 (29.3%) |
| 3 Vehicles | 909 (31.8%) | 775 (30.0%) |
| 4 Vehicles | 369 (12.9%) | 376 (14.5%) |
| 5 or more Vehicles | 240 (8.4%) | 175 (6.8%) |
| Total | 2,859 (100.0%) | 2,584 (100.0%) |
Commute Time in Commerce
The most frequently occuring commute durations in Commerce are 20 to 24 minutes (1,109 commuters, 21.9%), 30 to 34 minutes (1,000 commuters, 19.8%), and 15 to 19 minutes (580 commuters, 11.5%).
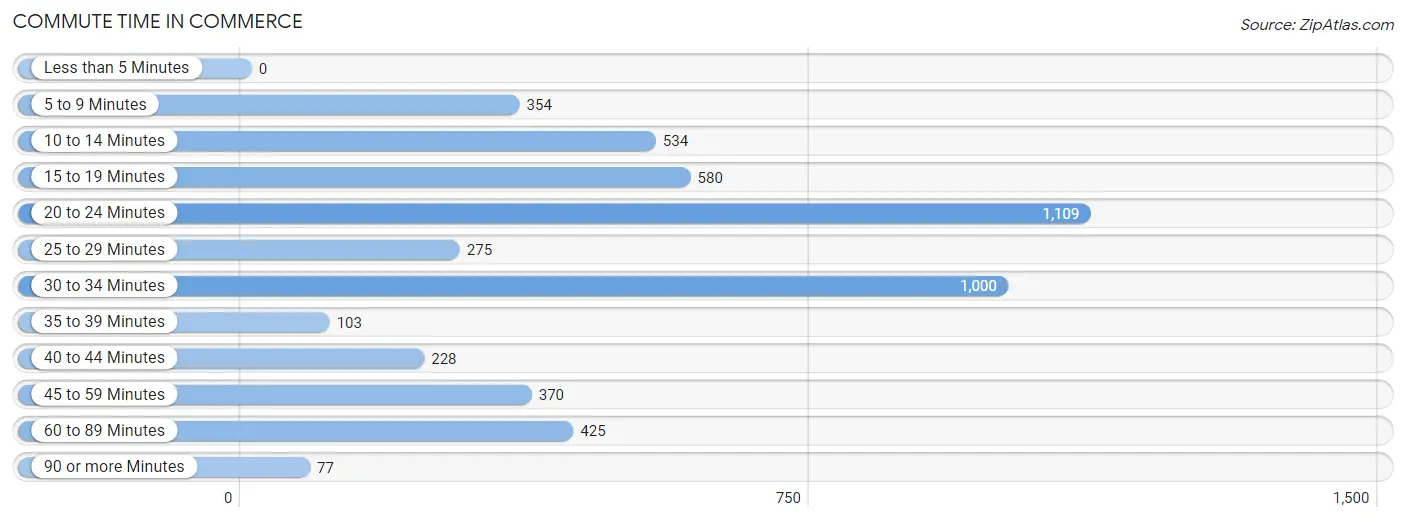
| Commute Time | # Commuters | % Commuters |
| Less than 5 Minutes | 0 | 0.0% |
| 5 to 9 Minutes | 354 | 7.0% |
| 10 to 14 Minutes | 534 | 10.6% |
| 15 to 19 Minutes | 580 | 11.5% |
| 20 to 24 Minutes | 1,109 | 21.9% |
| 25 to 29 Minutes | 275 | 5.4% |
| 30 to 34 Minutes | 1,000 | 19.8% |
| 35 to 39 Minutes | 103 | 2.0% |
| 40 to 44 Minutes | 228 | 4.5% |
| 45 to 59 Minutes | 370 | 7.3% |
| 60 to 89 Minutes | 425 | 8.4% |
| 90 or more Minutes | 77 | 1.5% |
Commute Time by Sex in Commerce
The most common commute times in Commerce are 20 to 24 minutes (683 commuters, 25.4%) for males and 20 to 24 minutes (426 commuters, 18.0%) for females.
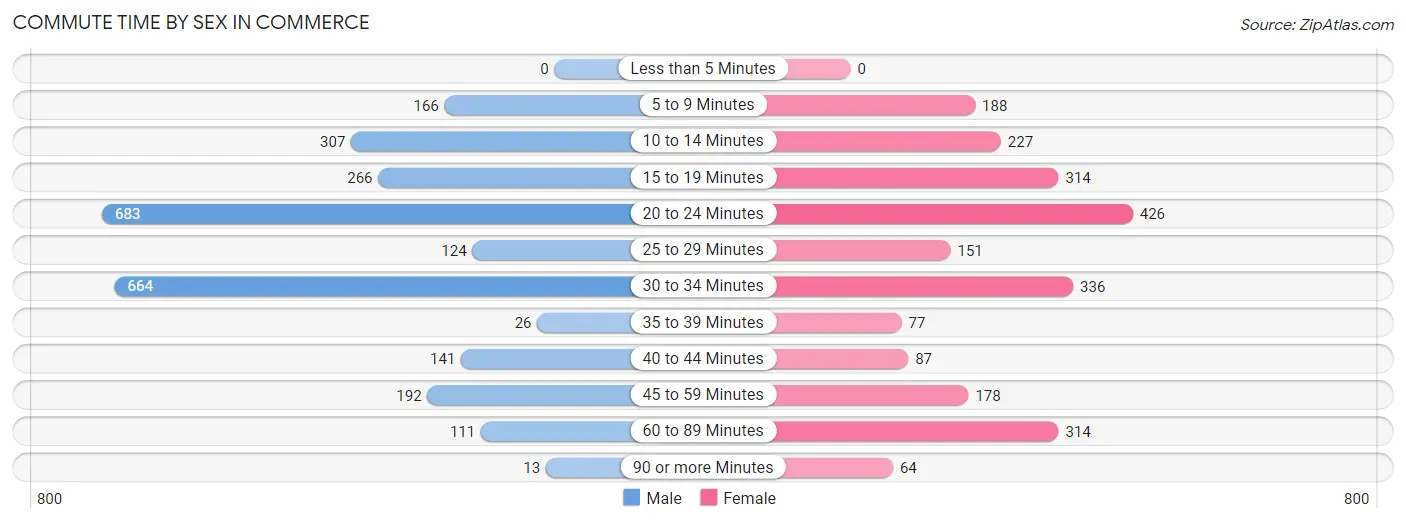
| Commute Time | Male | Female |
| Less than 5 Minutes | 0 (0.0%) | 0 (0.0%) |
| 5 to 9 Minutes | 166 (6.2%) | 188 (8.0%) |
| 10 to 14 Minutes | 307 (11.4%) | 227 (9.6%) |
| 15 to 19 Minutes | 266 (9.9%) | 314 (13.3%) |
| 20 to 24 Minutes | 683 (25.4%) | 426 (18.0%) |
| 25 to 29 Minutes | 124 (4.6%) | 151 (6.4%) |
| 30 to 34 Minutes | 664 (24.7%) | 336 (14.2%) |
| 35 to 39 Minutes | 26 (1.0%) | 77 (3.3%) |
| 40 to 44 Minutes | 141 (5.2%) | 87 (3.7%) |
| 45 to 59 Minutes | 192 (7.1%) | 178 (7.5%) |
| 60 to 89 Minutes | 111 (4.1%) | 314 (13.3%) |
| 90 or more Minutes | 13 (0.5%) | 64 (2.7%) |
Time of Departure to Work by Sex in Commerce
The most frequent times of departure to work in Commerce are 12:00 AM to 4:59 AM (530, 19.7%) for males and 8:00 AM to 8:29 AM (389, 16.5%) for females.
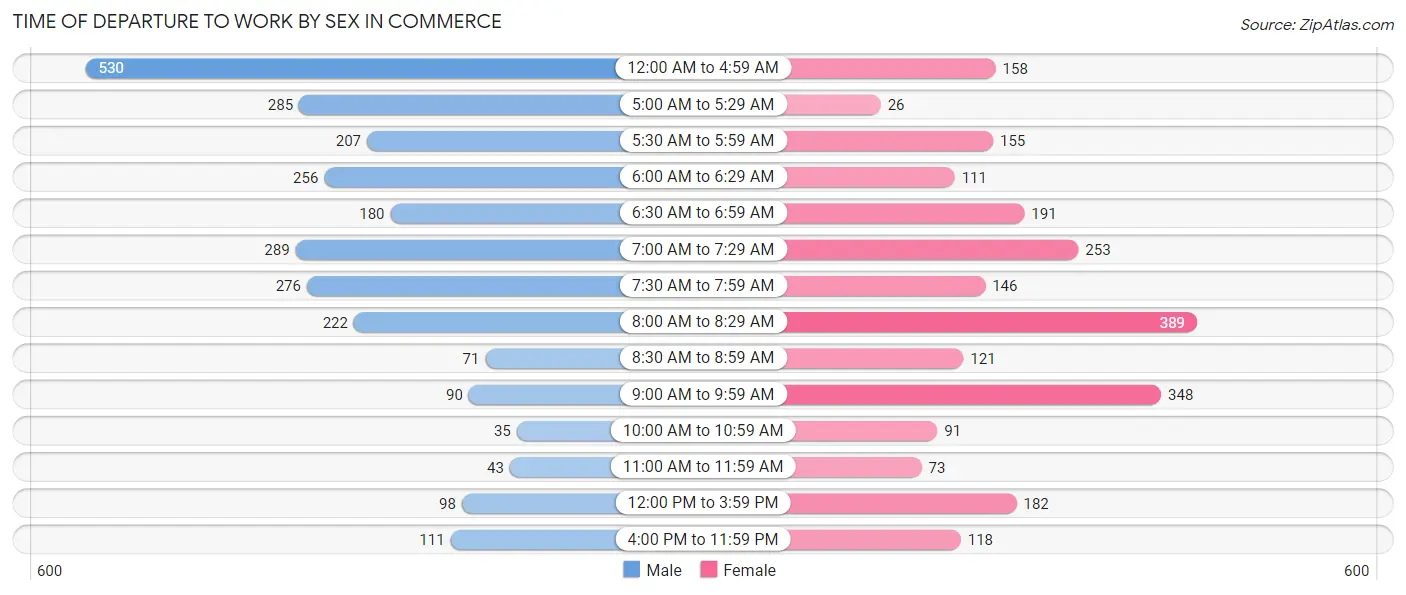
| Time of Departure | Male | Female |
| 12:00 AM to 4:59 AM | 530 (19.7%) | 158 (6.7%) |
| 5:00 AM to 5:29 AM | 285 (10.6%) | 26 (1.1%) |
| 5:30 AM to 5:59 AM | 207 (7.7%) | 155 (6.6%) |
| 6:00 AM to 6:29 AM | 256 (9.5%) | 111 (4.7%) |
| 6:30 AM to 6:59 AM | 180 (6.7%) | 191 (8.1%) |
| 7:00 AM to 7:29 AM | 289 (10.7%) | 253 (10.7%) |
| 7:30 AM to 7:59 AM | 276 (10.2%) | 146 (6.2%) |
| 8:00 AM to 8:29 AM | 222 (8.2%) | 389 (16.5%) |
| 8:30 AM to 8:59 AM | 71 (2.6%) | 121 (5.1%) |
| 9:00 AM to 9:59 AM | 90 (3.3%) | 348 (14.7%) |
| 10:00 AM to 10:59 AM | 35 (1.3%) | 91 (3.8%) |
| 11:00 AM to 11:59 AM | 43 (1.6%) | 73 (3.1%) |
| 12:00 PM to 3:59 PM | 98 (3.6%) | 182 (7.7%) |
| 4:00 PM to 11:59 PM | 111 (4.1%) | 118 (5.0%) |
| Total | 2,693 (100.0%) | 2,362 (100.0%) |
Housing Occupancy in Commerce
Occupancy by Ownership in Commerce
Of the total 3,472 dwellings in Commerce, owner-occupied units account for 1,921 (55.3%), while renter-occupied units make up 1,551 (44.7%).
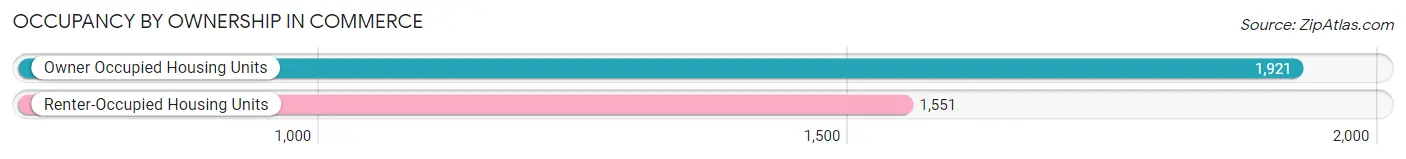
| Occupancy | # Housing Units | % Housing Units |
| Owner Occupied Housing Units | 1,921 | 55.3% |
| Renter-Occupied Housing Units | 1,551 | 44.7% |
| Total Occupied Housing Units | 3,472 | 100.0% |
Occupancy by Household Size in Commerce
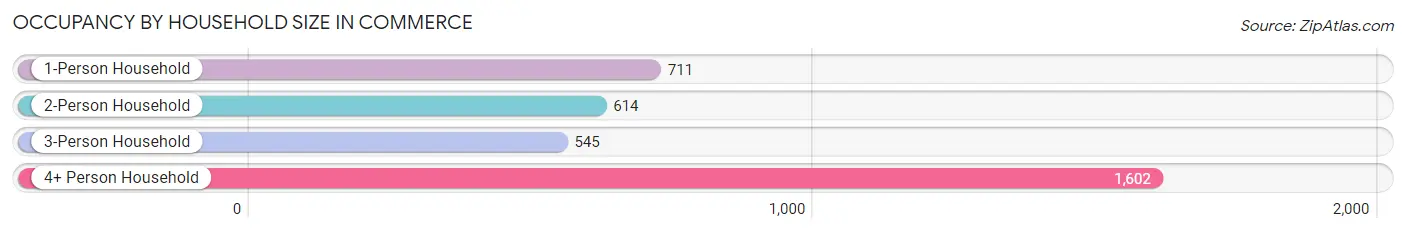
| Household Size | # Housing Units | % Housing Units |
| 1-Person Household | 711 | 20.5% |
| 2-Person Household | 614 | 17.7% |
| 3-Person Household | 545 | 15.7% |
| 4+ Person Household | 1,602 | 46.1% |
| Total Housing Units | 3,472 | 100.0% |
Occupancy by Ownership by Household Size in Commerce
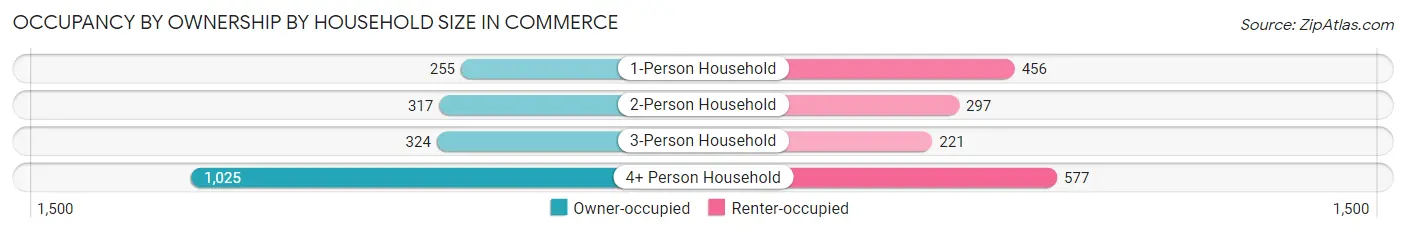
| Household Size | Owner-occupied | Renter-occupied |
| 1-Person Household | 255 (35.9%) | 456 (64.1%) |
| 2-Person Household | 317 (51.6%) | 297 (48.4%) |
| 3-Person Household | 324 (59.5%) | 221 (40.6%) |
| 4+ Person Household | 1,025 (64.0%) | 577 (36.0%) |
| Total Housing Units | 1,921 (55.3%) | 1,551 (44.7%) |
Occupancy by Educational Attainment in Commerce
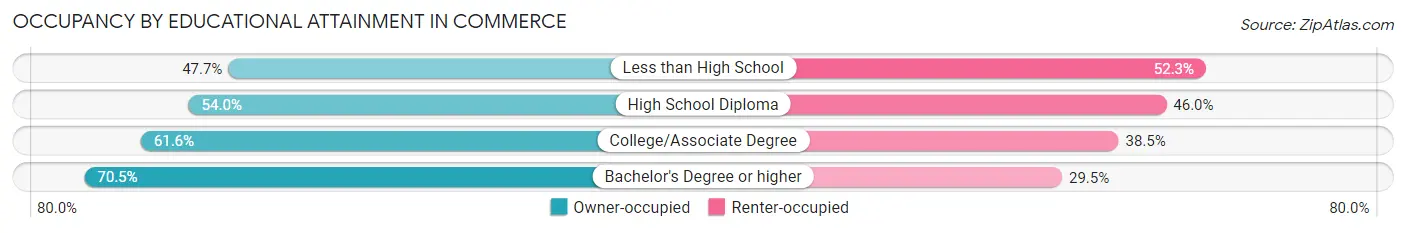
| Household Size | Owner-occupied | Renter-occupied |
| Less than High School | 647 (47.7%) | 709 (52.3%) |
| High School Diploma | 462 (54.0%) | 394 (46.0%) |
| College/Associate Degree | 525 (61.6%) | 328 (38.5%) |
| Bachelor's Degree or higher | 287 (70.5%) | 120 (29.5%) |
Occupancy by Age of Householder in Commerce
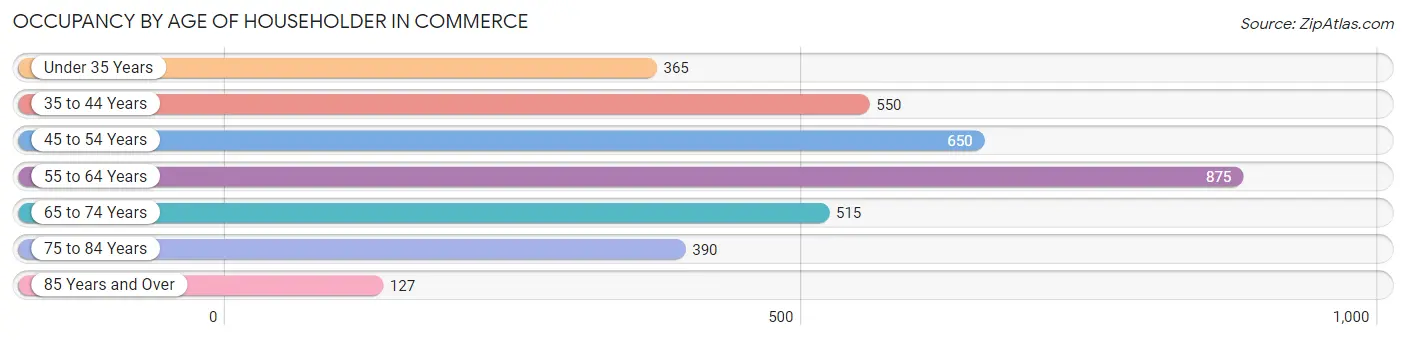
| Age Bracket | # Households | % Households |
| Under 35 Years | 365 | 10.5% |
| 35 to 44 Years | 550 | 15.8% |
| 45 to 54 Years | 650 | 18.7% |
| 55 to 64 Years | 875 | 25.2% |
| 65 to 74 Years | 515 | 14.8% |
| 75 to 84 Years | 390 | 11.2% |
| 85 Years and Over | 127 | 3.7% |
| Total | 3,472 | 100.0% |
Housing Finances in Commerce
Median Income by Occupancy in Commerce
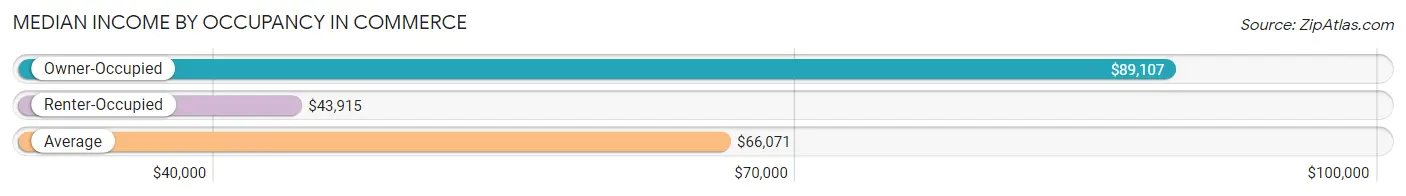
| Occupancy Type | # Households | Median Income |
| Owner-Occupied | 1,921 (55.3%) | $89,107 |
| Renter-Occupied | 1,551 (44.7%) | $43,915 |
| Average | 3,472 (100.0%) | $66,071 |
Occupancy by Householder Income Bracket in Commerce
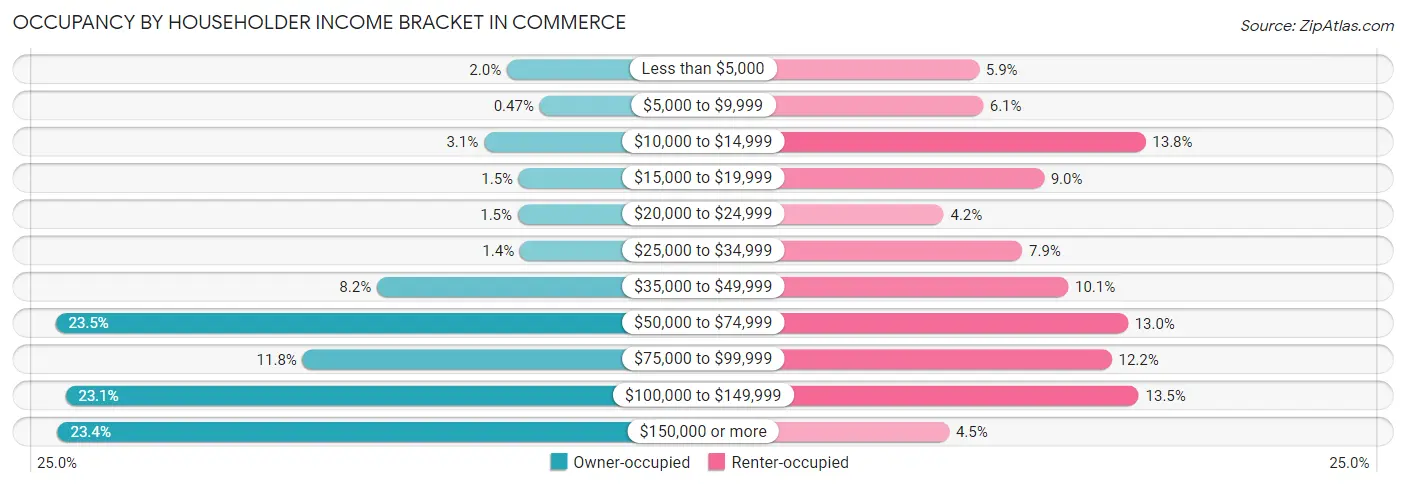
| Income Bracket | Owner-occupied | Renter-occupied |
| Less than $5,000 | 39 (2.0%) | 91 (5.9%) |
| $5,000 to $9,999 | 9 (0.5%) | 94 (6.1%) |
| $10,000 to $14,999 | 60 (3.1%) | 214 (13.8%) |
| $15,000 to $19,999 | 28 (1.5%) | 139 (9.0%) |
| $20,000 to $24,999 | 29 (1.5%) | 65 (4.2%) |
| $25,000 to $34,999 | 27 (1.4%) | 123 (7.9%) |
| $35,000 to $49,999 | 158 (8.2%) | 157 (10.1%) |
| $50,000 to $74,999 | 452 (23.5%) | 201 (13.0%) |
| $75,000 to $99,999 | 226 (11.8%) | 189 (12.2%) |
| $100,000 to $149,999 | 443 (23.1%) | 209 (13.5%) |
| $150,000 or more | 450 (23.4%) | 69 (4.4%) |
| Total | 1,921 (100.0%) | 1,551 (100.0%) |
Monthly Housing Cost Tiers in Commerce
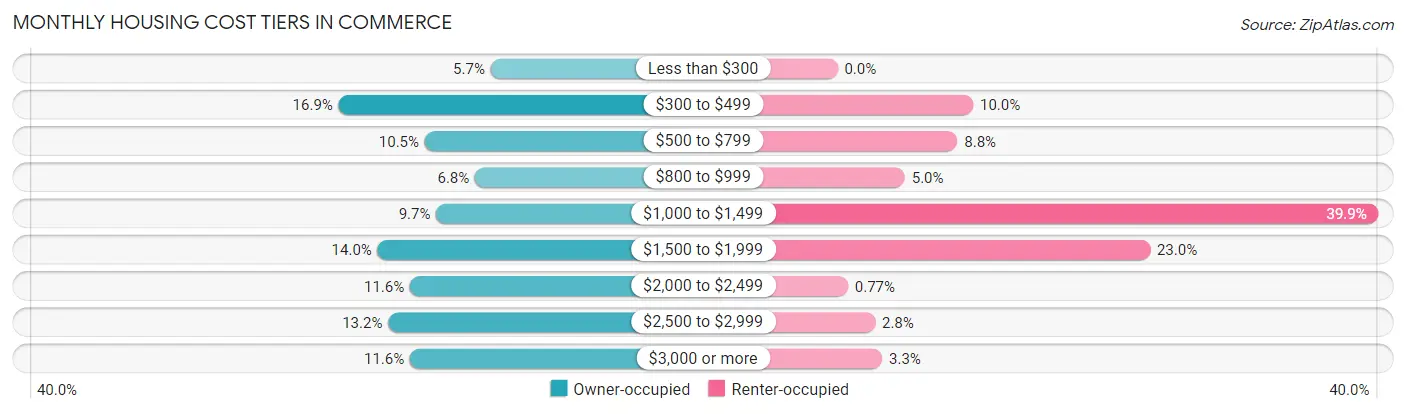
| Monthly Cost | Owner-occupied | Renter-occupied |
| Less than $300 | 109 (5.7%) | 0 (0.0%) |
| $300 to $499 | 324 (16.9%) | 155 (10.0%) |
| $500 to $799 | 202 (10.5%) | 137 (8.8%) |
| $800 to $999 | 131 (6.8%) | 77 (5.0%) |
| $1,000 to $1,499 | 186 (9.7%) | 618 (39.9%) |
| $1,500 to $1,999 | 269 (14.0%) | 357 (23.0%) |
| $2,000 to $2,499 | 223 (11.6%) | 12 (0.8%) |
| $2,500 to $2,999 | 254 (13.2%) | 43 (2.8%) |
| $3,000 or more | 223 (11.6%) | 51 (3.3%) |
| Total | 1,921 (100.0%) | 1,551 (100.0%) |
Physical Housing Characteristics in Commerce
Housing Structures in Commerce
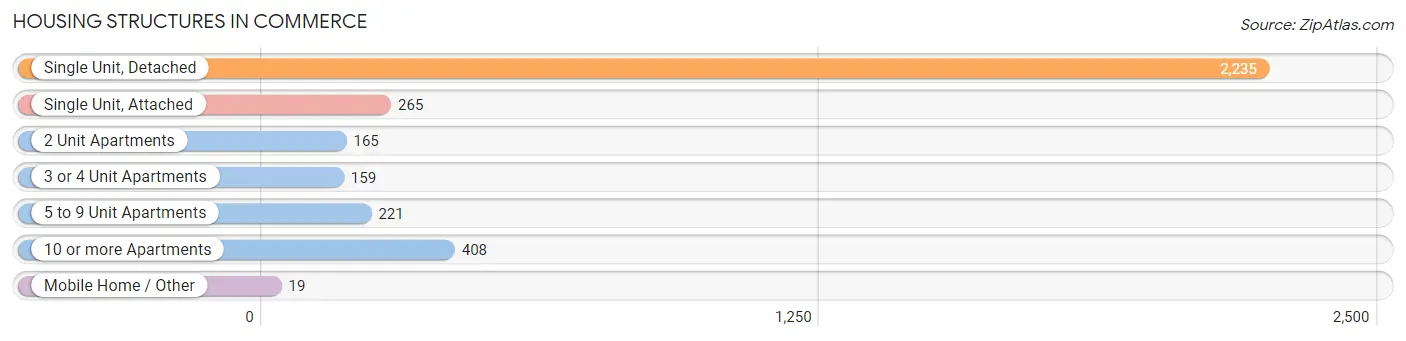
| Structure Type | # Housing Units | % Housing Units |
| Single Unit, Detached | 2,235 | 64.4% |
| Single Unit, Attached | 265 | 7.6% |
| 2 Unit Apartments | 165 | 4.8% |
| 3 or 4 Unit Apartments | 159 | 4.6% |
| 5 to 9 Unit Apartments | 221 | 6.4% |
| 10 or more Apartments | 408 | 11.7% |
| Mobile Home / Other | 19 | 0.5% |
| Total | 3,472 | 100.0% |
Housing Structures by Occupancy in Commerce
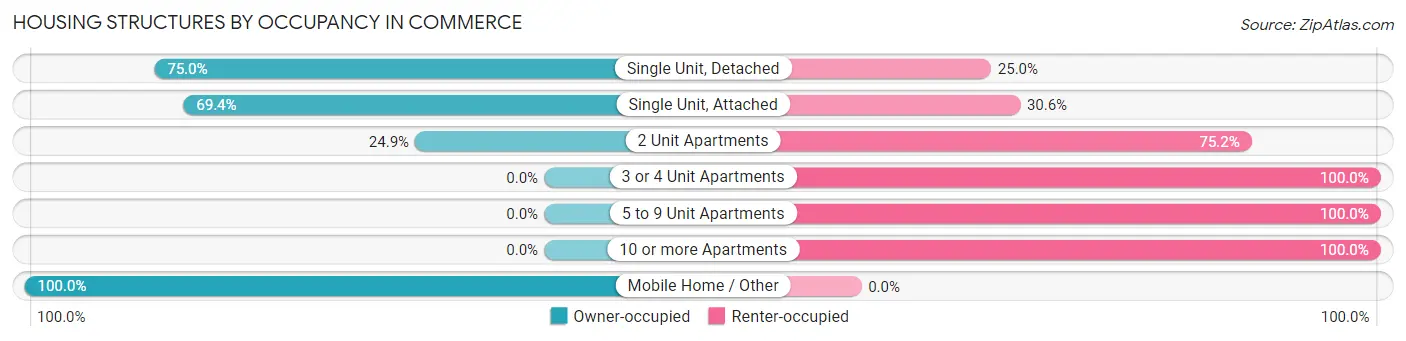
| Structure Type | Owner-occupied | Renter-occupied |
| Single Unit, Detached | 1,677 (75.0%) | 558 (25.0%) |
| Single Unit, Attached | 184 (69.4%) | 81 (30.6%) |
| 2 Unit Apartments | 41 (24.8%) | 124 (75.1%) |
| 3 or 4 Unit Apartments | 0 (0.0%) | 159 (100.0%) |
| 5 to 9 Unit Apartments | 0 (0.0%) | 221 (100.0%) |
| 10 or more Apartments | 0 (0.0%) | 408 (100.0%) |
| Mobile Home / Other | 19 (100.0%) | 0 (0.0%) |
| Total | 1,921 (55.3%) | 1,551 (44.7%) |
Housing Structures by Number of Rooms in Commerce
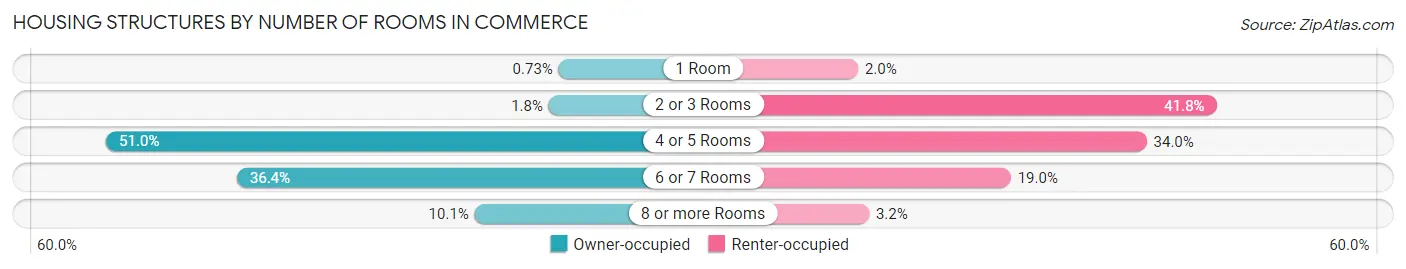
| Number of Rooms | Owner-occupied | Renter-occupied |
| 1 Room | 14 (0.7%) | 31 (2.0%) |
| 2 or 3 Rooms | 35 (1.8%) | 648 (41.8%) |
| 4 or 5 Rooms | 979 (51.0%) | 528 (34.0%) |
| 6 or 7 Rooms | 700 (36.4%) | 294 (19.0%) |
| 8 or more Rooms | 193 (10.1%) | 50 (3.2%) |
| Total | 1,921 (100.0%) | 1,551 (100.0%) |
Housing Structure by Heating Type in Commerce
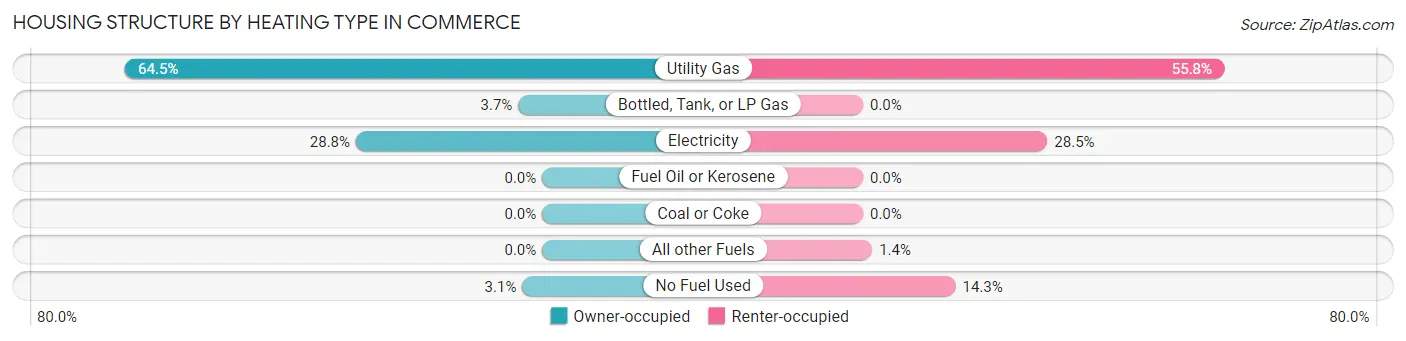
| Heating Type | Owner-occupied | Renter-occupied |
| Utility Gas | 1,238 (64.4%) | 865 (55.8%) |
| Bottled, Tank, or LP Gas | 71 (3.7%) | 0 (0.0%) |
| Electricity | 553 (28.8%) | 442 (28.5%) |
| Fuel Oil or Kerosene | 0 (0.0%) | 0 (0.0%) |
| Coal or Coke | 0 (0.0%) | 0 (0.0%) |
| All other Fuels | 0 (0.0%) | 22 (1.4%) |
| No Fuel Used | 59 (3.1%) | 222 (14.3%) |
| Total | 1,921 (100.0%) | 1,551 (100.0%) |
Household Vehicle Usage in Commerce
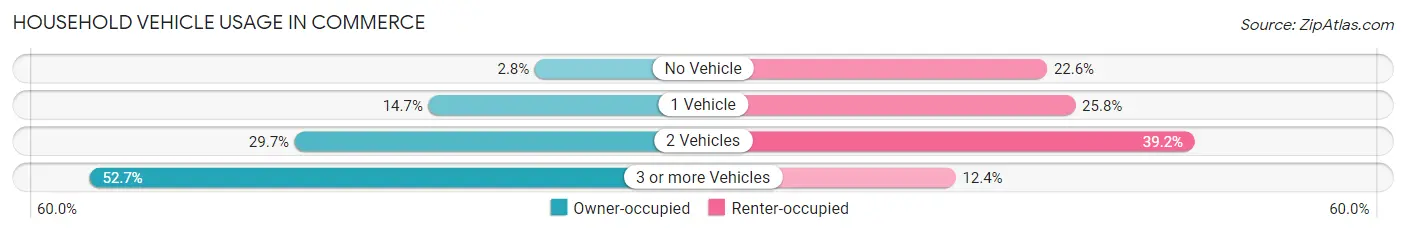
| Vehicles per Household | Owner-occupied | Renter-occupied |
| No Vehicle | 54 (2.8%) | 351 (22.6%) |
| 1 Vehicle | 283 (14.7%) | 400 (25.8%) |
| 2 Vehicles | 571 (29.7%) | 608 (39.2%) |
| 3 or more Vehicles | 1,013 (52.7%) | 192 (12.4%) |
| Total | 1,921 (100.0%) | 1,551 (100.0%) |
Real Estate & Mortgages in Commerce
Real Estate and Mortgage Overview in Commerce
| Characteristic | Without Mortgage | With Mortgage |
| Housing Units | 792 | 1,129 |
| Median Property Value | $499,000 | $589,500 |
| Median Household Income | $61,250 | $345 |
| Monthly Housing Costs | $482 | $223 |
| Real Estate Taxes | $2,659 | $10 |
Property Value by Mortgage Status in Commerce
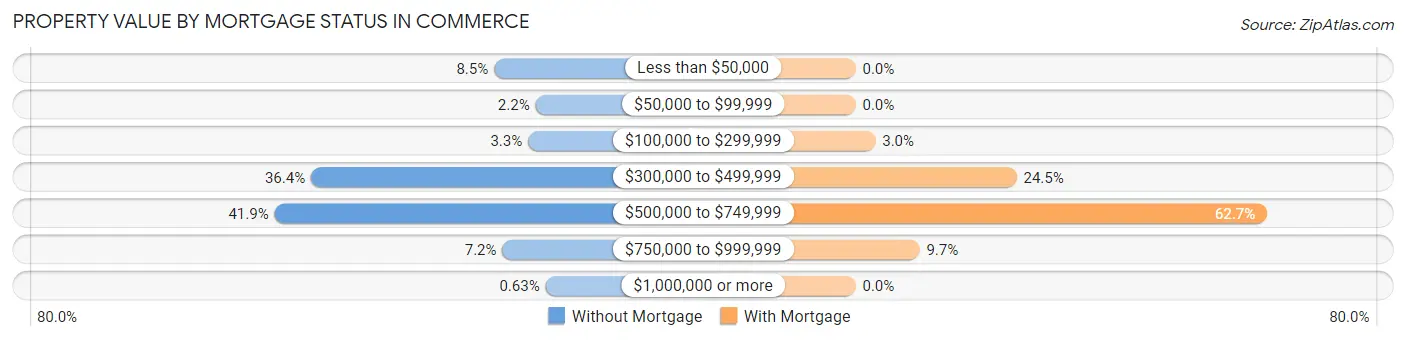
| Property Value | Without Mortgage | With Mortgage |
| Less than $50,000 | 67 (8.5%) | 0 (0.0%) |
| $50,000 to $99,999 | 17 (2.1%) | 0 (0.0%) |
| $100,000 to $299,999 | 26 (3.3%) | 34 (3.0%) |
| $300,000 to $499,999 | 288 (36.4%) | 277 (24.5%) |
| $500,000 to $749,999 | 332 (41.9%) | 708 (62.7%) |
| $750,000 to $999,999 | 57 (7.2%) | 110 (9.7%) |
| $1,000,000 or more | 5 (0.6%) | 0 (0.0%) |
| Total | 792 (100.0%) | 1,129 (100.0%) |
Household Income by Mortgage Status in Commerce
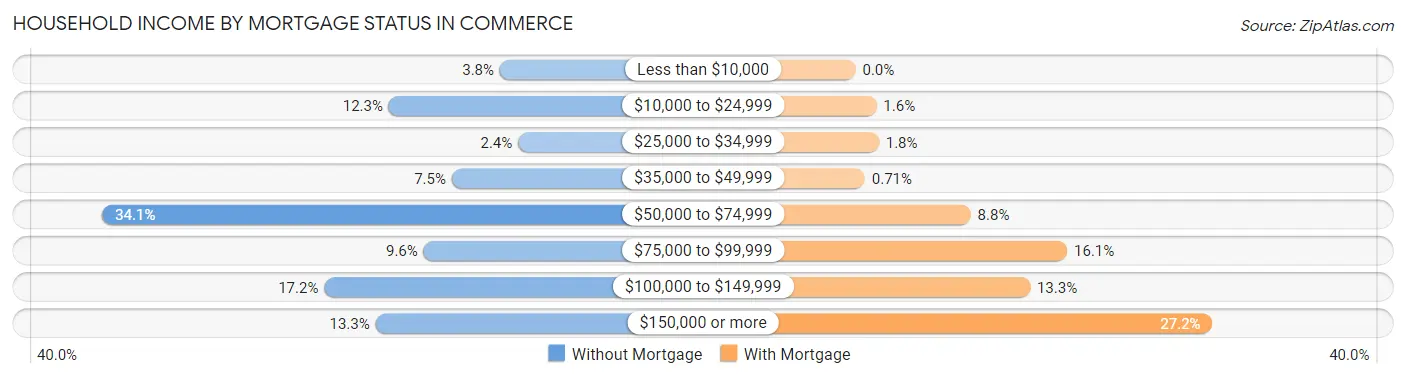
| Household Income | Without Mortgage | With Mortgage |
| Less than $10,000 | 30 (3.8%) | 0 (0.0%) |
| $10,000 to $24,999 | 97 (12.2%) | 18 (1.6%) |
| $25,000 to $34,999 | 19 (2.4%) | 20 (1.8%) |
| $35,000 to $49,999 | 59 (7.4%) | 8 (0.7%) |
| $50,000 to $74,999 | 270 (34.1%) | 99 (8.8%) |
| $75,000 to $99,999 | 76 (9.6%) | 182 (16.1%) |
| $100,000 to $149,999 | 136 (17.2%) | 150 (13.3%) |
| $150,000 or more | 105 (13.3%) | 307 (27.2%) |
| Total | 792 (100.0%) | 1,129 (100.0%) |
Property Value to Household Income Ratio in Commerce
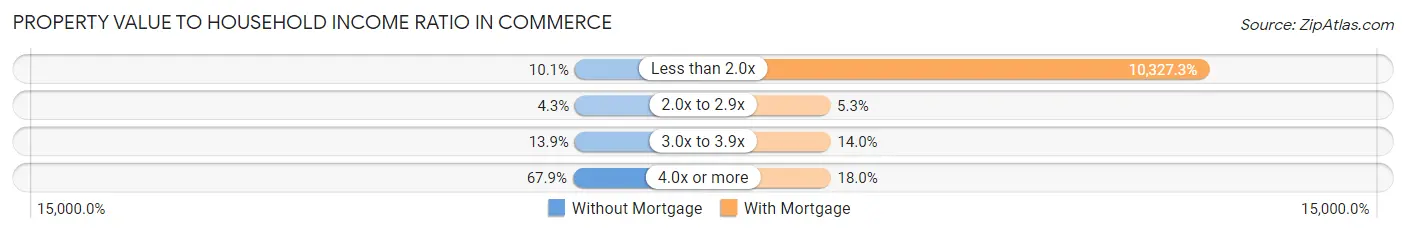
| Value-to-Income Ratio | Without Mortgage | With Mortgage |
| Less than 2.0x | 80 (10.1%) | 116,595 (10,327.3%) |
| 2.0x to 2.9x | 34 (4.3%) | 60 (5.3%) |
| 3.0x to 3.9x | 110 (13.9%) | 158 (14.0%) |
| 4.0x or more | 538 (67.9%) | 203 (18.0%) |
| Total | 792 (100.0%) | 1,129 (100.0%) |
Real Estate Taxes by Mortgage Status in Commerce
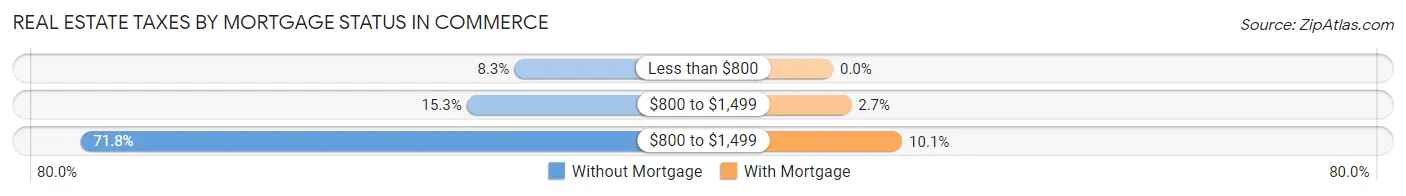
| Property Taxes | Without Mortgage | With Mortgage |
| Less than $800 | 66 (8.3%) | 0 (0.0%) |
| $800 to $1,499 | 121 (15.3%) | 30 (2.7%) |
| $800 to $1,499 | 569 (71.8%) | 114 (10.1%) |
| Total | 792 (100.0%) | 1,129 (100.0%) |
Health & Disability in Commerce
Health Insurance Coverage by Age in Commerce
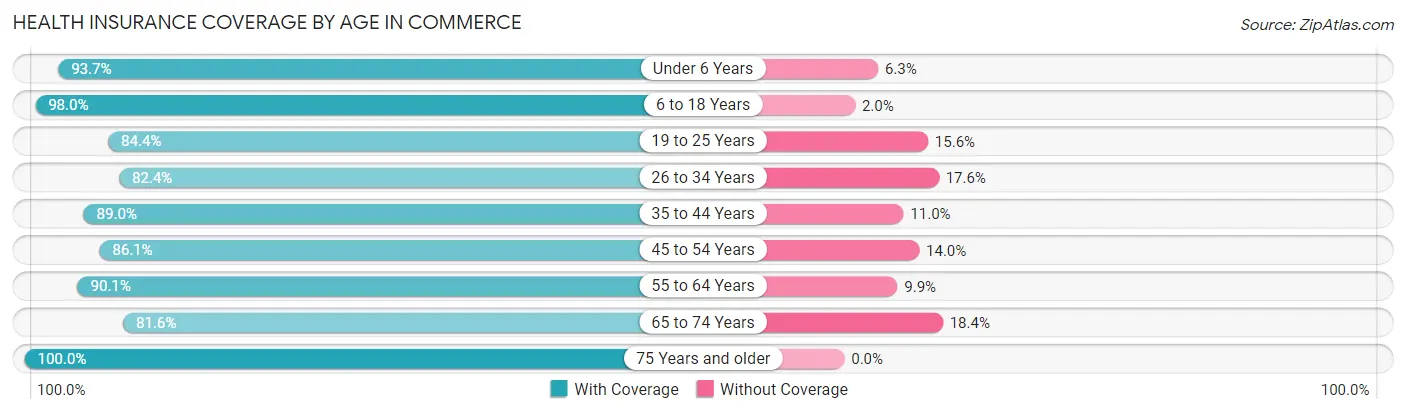
| Age Bracket | With Coverage | Without Coverage |
| Under 6 Years | 507 (93.7%) | 34 (6.3%) |
| 6 to 18 Years | 2,270 (98.0%) | 46 (2.0%) |
| 19 to 25 Years | 931 (84.4%) | 172 (15.6%) |
| 26 to 34 Years | 1,442 (82.4%) | 308 (17.6%) |
| 35 to 44 Years | 1,259 (89.0%) | 156 (11.0%) |
| 45 to 54 Years | 1,191 (86.1%) | 193 (14.0%) |
| 55 to 64 Years | 1,367 (90.1%) | 150 (9.9%) |
| 65 to 74 Years | 1,036 (81.6%) | 233 (18.4%) |
| 75 Years and older | 911 (100.0%) | 0 (0.0%) |
| Total | 10,914 (89.4%) | 1,292 (10.6%) |
Health Insurance Coverage by Citizenship Status in Commerce
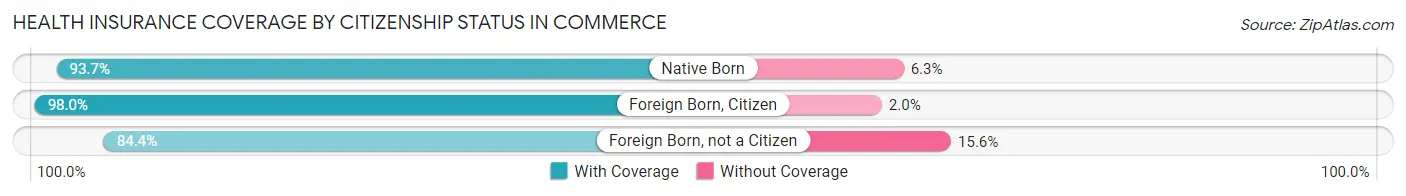
| Citizenship Status | With Coverage | Without Coverage |
| Native Born | 507 (93.7%) | 34 (6.3%) |
| Foreign Born, Citizen | 2,270 (98.0%) | 46 (2.0%) |
| Foreign Born, not a Citizen | 931 (84.4%) | 172 (15.6%) |
Health Insurance Coverage by Household Income in Commerce
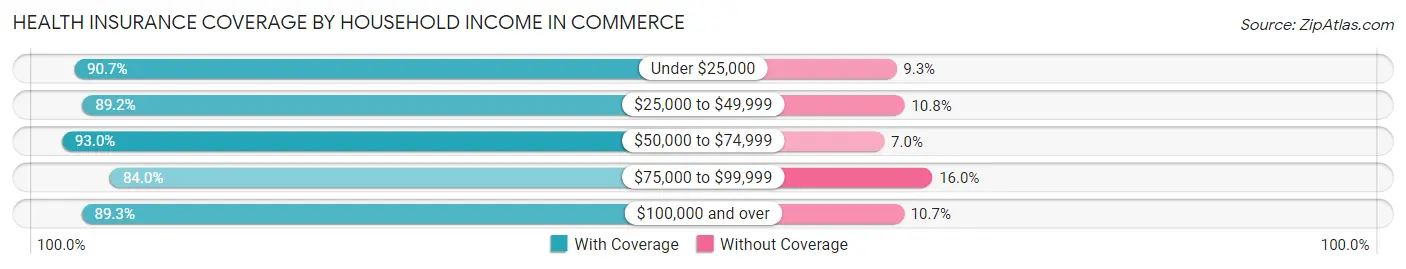
| Household Income | With Coverage | Without Coverage |
| Under $25,000 | 1,573 (90.7%) | 161 (9.3%) |
| $25,000 to $49,999 | 990 (89.2%) | 120 (10.8%) |
| $50,000 to $74,999 | 2,113 (93.0%) | 159 (7.0%) |
| $75,000 to $99,999 | 1,501 (84.0%) | 286 (16.0%) |
| $100,000 and over | 4,737 (89.3%) | 566 (10.7%) |
Public vs Private Health Insurance Coverage by Age in Commerce
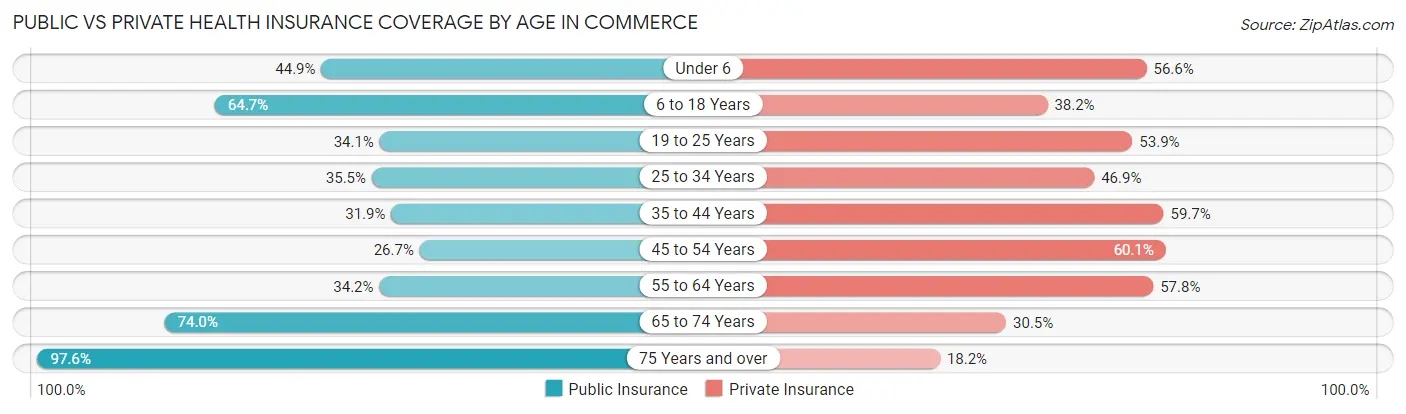
| Age Bracket | Public Insurance | Private Insurance |
| Under 6 | 243 (44.9%) | 306 (56.6%) |
| 6 to 18 Years | 1,498 (64.7%) | 884 (38.2%) |
| 19 to 25 Years | 376 (34.1%) | 595 (53.9%) |
| 25 to 34 Years | 622 (35.5%) | 820 (46.9%) |
| 35 to 44 Years | 452 (31.9%) | 845 (59.7%) |
| 45 to 54 Years | 369 (26.7%) | 832 (60.1%) |
| 55 to 64 Years | 518 (34.2%) | 877 (57.8%) |
| 65 to 74 Years | 939 (74.0%) | 387 (30.5%) |
| 75 Years and over | 889 (97.6%) | 166 (18.2%) |
| Total | 5,906 (48.4%) | 5,712 (46.8%) |
Disability Status by Sex by Age in Commerce
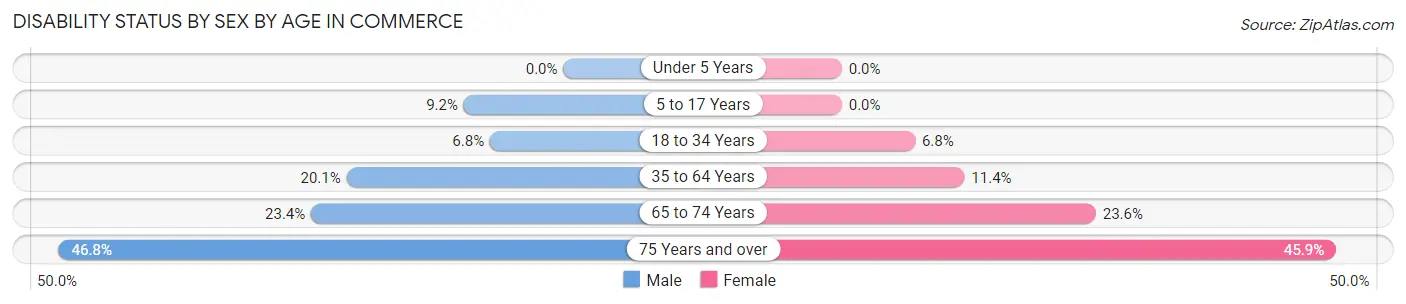
| Age Bracket | Male | Female |
| Under 5 Years | 0 (0.0%) | 0 (0.0%) |
| 5 to 17 Years | 100 (9.2%) | 0 (0.0%) |
| 18 to 34 Years | 123 (6.8%) | 86 (6.8%) |
| 35 to 64 Years | 398 (20.1%) | 266 (11.4%) |
| 65 to 74 Years | 158 (23.4%) | 140 (23.6%) |
| 75 Years and over | 200 (46.8%) | 222 (45.9%) |
Disability Class by Sex by Age in Commerce
Disability Class: Hearing Difficulty
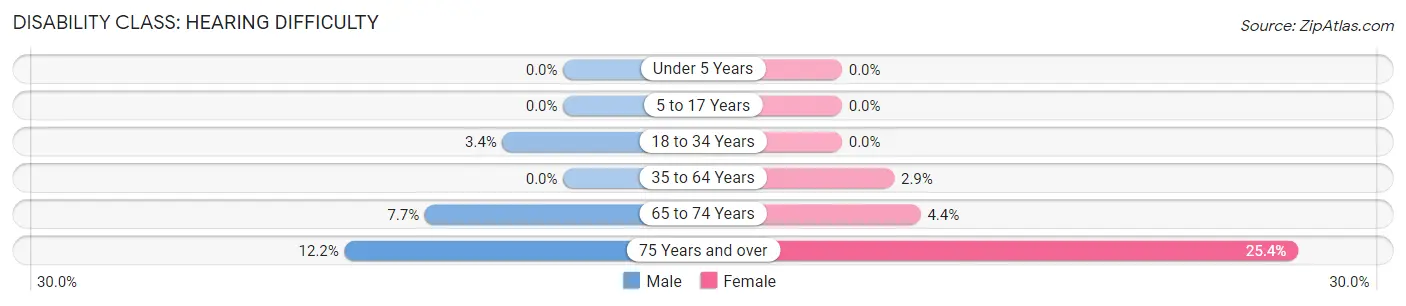
| Age Bracket | Male | Female |
| Under 5 Years | 0 (0.0%) | 0 (0.0%) |
| 5 to 17 Years | 0 (0.0%) | 0 (0.0%) |
| 18 to 34 Years | 61 (3.4%) | 0 (0.0%) |
| 35 to 64 Years | 0 (0.0%) | 68 (2.9%) |
| 65 to 74 Years | 52 (7.7%) | 26 (4.4%) |
| 75 Years and over | 52 (12.2%) | 123 (25.4%) |
Disability Class: Vision Difficulty
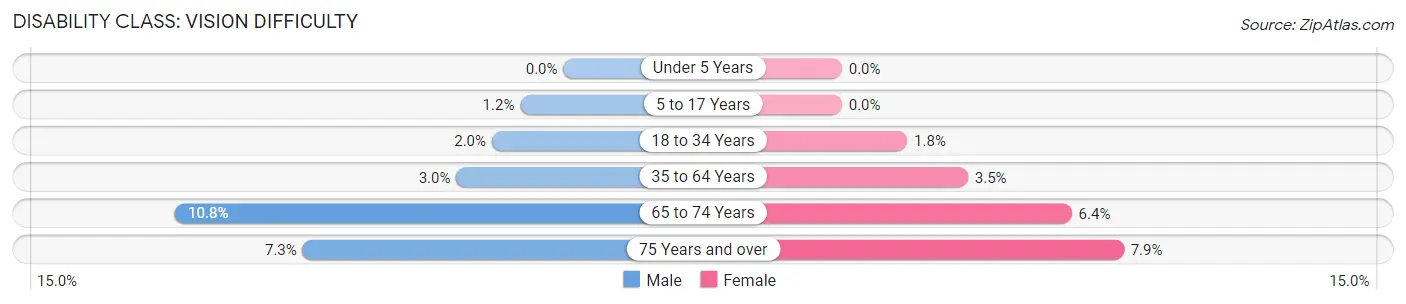
| Age Bracket | Male | Female |
| Under 5 Years | 0 (0.0%) | 0 (0.0%) |
| 5 to 17 Years | 13 (1.2%) | 0 (0.0%) |
| 18 to 34 Years | 36 (2.0%) | 23 (1.8%) |
| 35 to 64 Years | 59 (3.0%) | 82 (3.5%) |
| 65 to 74 Years | 73 (10.8%) | 38 (6.4%) |
| 75 Years and over | 31 (7.3%) | 38 (7.9%) |
Disability Class: Cognitive Difficulty
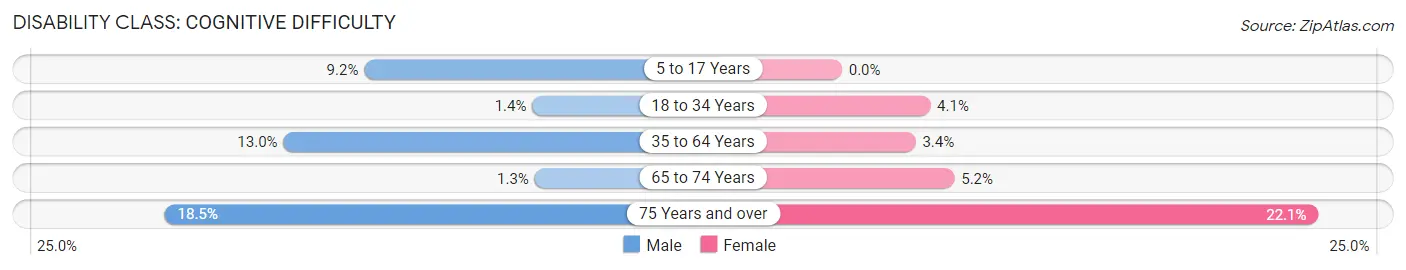
| Age Bracket | Male | Female |
| 5 to 17 Years | 100 (9.2%) | 0 (0.0%) |
| 18 to 34 Years | 26 (1.4%) | 52 (4.1%) |
| 35 to 64 Years | 257 (13.0%) | 80 (3.4%) |
| 65 to 74 Years | 9 (1.3%) | 31 (5.2%) |
| 75 Years and over | 79 (18.5%) | 107 (22.1%) |
Disability Class: Ambulatory Difficulty
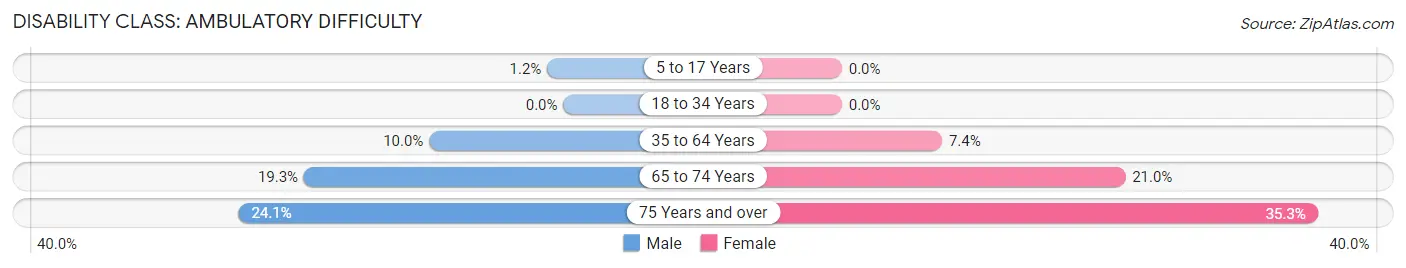
| Age Bracket | Male | Female |
| 5 to 17 Years | 13 (1.2%) | 0 (0.0%) |
| 18 to 34 Years | 0 (0.0%) | 0 (0.0%) |
| 35 to 64 Years | 197 (10.0%) | 174 (7.4%) |
| 65 to 74 Years | 130 (19.3%) | 125 (21.0%) |
| 75 Years and over | 103 (24.1%) | 171 (35.3%) |
Disability Class: Self-Care Difficulty
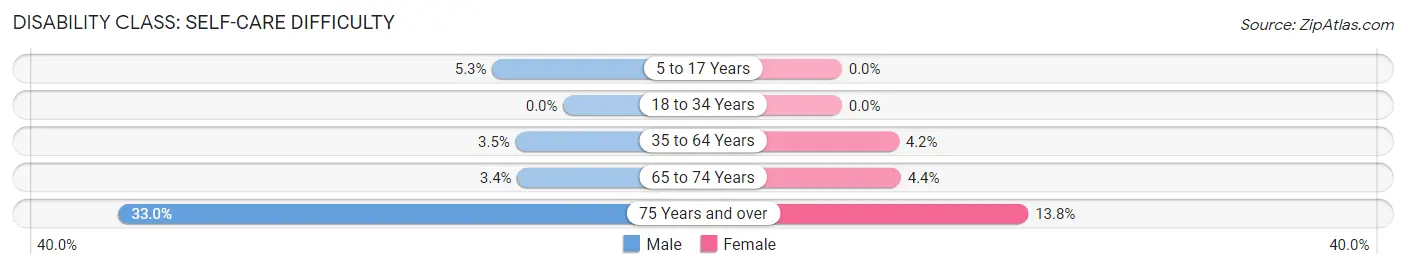
| Age Bracket | Male | Female |
| 5 to 17 Years | 57 (5.3%) | 0 (0.0%) |
| 18 to 34 Years | 0 (0.0%) | 0 (0.0%) |
| 35 to 64 Years | 70 (3.5%) | 99 (4.2%) |
| 65 to 74 Years | 23 (3.4%) | 26 (4.4%) |
| 75 Years and over | 141 (33.0%) | 67 (13.8%) |
Technology Access in Commerce
Computing Device Access in Commerce
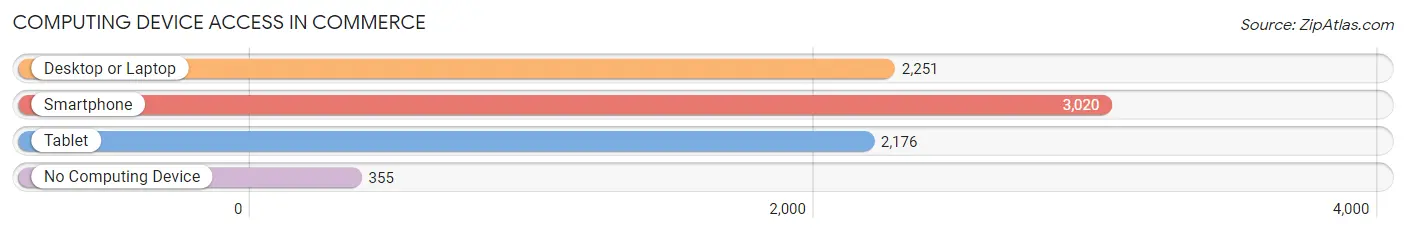
| Device Type | # Households | % Households |
| Desktop or Laptop | 2,251 | 64.8% |
| Smartphone | 3,020 | 87.0% |
| Tablet | 2,176 | 62.7% |
| No Computing Device | 355 | 10.2% |
| Total | 3,472 | 100.0% |
Internet Access in Commerce
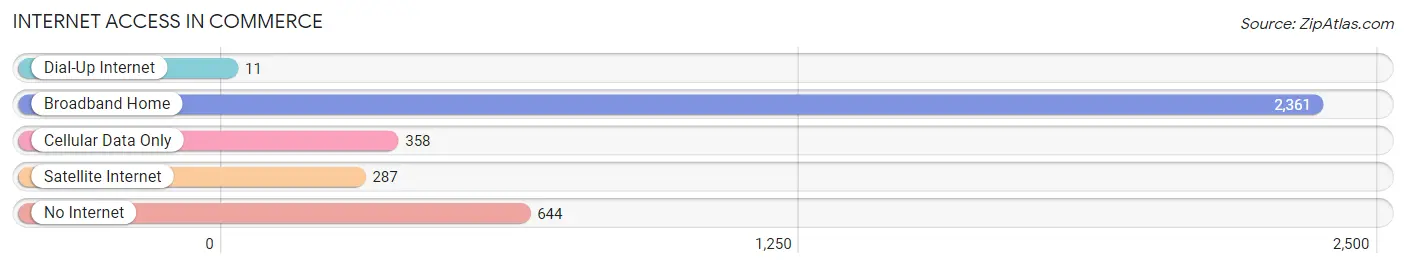
| Internet Type | # Households | % Households |
| Dial-Up Internet | 11 | 0.3% |
| Broadband Home | 2,361 | 68.0% |
| Cellular Data Only | 358 | 10.3% |
| Satellite Internet | 287 | 8.3% |
| No Internet | 644 | 18.5% |
| Total | 3,472 | 100.0% |
Commerce Summary
Commerce, California is a city located in Los Angeles County, California. It is situated in the southeastern portion of the county, approximately 13 miles southeast of downtown Los Angeles. As of the 2010 census, the population of Commerce was 12,823.
Geography
Commerce is located at 34°1′2″N 118°9′17″W. It is bordered by the cities of Vernon on the west, Los Angeles on the northwest, East Los Angeles on the north, Montebello on the east, and Downey and Bell Gardens on the south. The Los Angeles River forms part of its southwestern boundary, and the Rio Hondo separates it from Downey.
Commerce is served by the Long Beach and Santa Ana freeways, as well as the Metrolink commuter rail system. It is served by the Commerce station of the Metro Blue Line.
History
The area now known as Commerce was originally inhabited by the Tongva Native American tribe. The first European settlers arrived in the area in the late 19th century, and the city was officially incorporated in 1960.
The city was named after the nearby Commerce Oil Refinery, which was built in the early 20th century. The refinery was the largest in the world at the time, and it was the first to use the new thermal cracking process to refine crude oil.
Economy
Commerce is home to several major employers, including the Commerce Casino, the Citadel Outlets, and the Commerce Industrial Park. The city is also home to several large distribution centers, including those of Target, Home Depot, and Walmart.
The city's economy is largely based on retail and services. The city's largest employers are the Citadel Outlets, the Commerce Casino, and the Commerce Industrial Park.
Demographics
As of the 2010 census, the population of Commerce was 12,823. The racial makeup of the city was 57.2% Hispanic or Latino, 33.2% White (non-Hispanic), 5.2% African American, 1.2% Asian, 0.3% Native American, 0.1% Pacific Islander, and 2.9% from other races.
The median household income in Commerce was $41,921, and the median family income was $45,845. The per capita income was $17,845. About 17.2% of the population was below the poverty line.
Conclusion
Commerce, California is a city located in Los Angeles County, California. It is situated in the southeastern portion of the county, approximately 13 miles southeast of downtown Los Angeles. As of the 2010 census, the population of Commerce was 12,823. The city is bordered by the cities of Vernon on the west, Los Angeles on the northwest, East Los Angeles on the north, Montebello on the east, and Downey and Bell Gardens on the south. The city's economy is largely based on retail and services, and its largest employers are the Citadel Outlets, the Commerce Casino, and the Commerce Industrial Park. The racial makeup of the city was 57.2% Hispanic or Latino, 33.2% White (non-Hispanic), 5.2% African American, 1.2% Asian, 0.3% Native American, 0.1% Pacific Islander, and 2.9% from other races. The median household income in Commerce was $41,921, and the median family income was $45,845. About 17.2% of the population was below the poverty line.
Common Questions
What is Per Capita Income in Commerce?
Per Capita income in Commerce is $24,497.
What is the Median Family Income in Commerce?
Median Family Income in Commerce is $76,236.
What is the Median Household income in Commerce?
Median Household Income in Commerce is $66,071.
What is Income or Wage Gap in Commerce?
Income or Wage Gap in Commerce is 12.1%.
Women in Commerce earn 87.9 cents for every dollar earned by a man.
What is Family Income Deficit in Commerce?
Family Income Deficit in Commerce is $15,140.
Families that are below poverty line in Commerce earn $15,140 less on average than the poverty threshold level.
What is Inequality or Gini Index in Commerce?
Inequality or Gini Index in Commerce is 0.43.
What is the Total Population of Commerce?
Total Population of Commerce is 12,253.
What is the Total Male Population of Commerce?
Total Male Population of Commerce is 6,275.
What is the Total Female Population of Commerce?
Total Female Population of Commerce is 5,978.
What is the Ratio of Males per 100 Females in Commerce?
There are 104.97 Males per 100 Females in Commerce.
What is the Ratio of Females per 100 Males in Commerce?
There are 95.27 Females per 100 Males in Commerce.
What is the Median Population Age in Commerce?
Median Population Age in Commerce is 37.3 Years.
What is the Average Family Size in Commerce
Average Family Size in Commerce is 4.1 People.
What is the Average Household Size in Commerce
Average Household Size in Commerce is 3.5 People.
How Large is the Labor Force in Commerce?
There are 5,731 People in the Labor Forcein in Commerce.
What is the Percentage of People in the Labor Force in Commerce?
57.1% of People are in the Labor Force in Commerce.
What is the Unemployment Rate in Commerce?
Unemployment Rate in Commerce is 4.9%.