Pinole, CA Map & Demographics
Pinole Map
Pinole Overview
$49,738
PER CAPITA INCOME
$126,563
AVG FAMILY INCOME
$113,630
AVG HOUSEHOLD INCOME
12.1%
WAGE / INCOME GAP [ % ]
87.9¢/ $1
WAGE / INCOME GAP [ $ ]
$11,725
FAMILY INCOME DEFICIT
0.38
INEQUALITY / GINI INDEX
18,946
TOTAL POPULATION
8,876
MALE POPULATION
10,070
FEMALE POPULATION
88.14
MALES / 100 FEMALES
113.45
FEMALES / 100 MALES
42.6
MEDIAN AGE
3.2
AVG FAMILY SIZE
2.8
AVG HOUSEHOLD SIZE
10,168
LABOR FORCE [ PEOPLE ]
63.6%
PERCENT IN LABOR FORCE
3.9%
UNEMPLOYMENT RATE
Pinole Zip Codes
Pinole Area Codes
Income in Pinole
Income Overview in Pinole
Per Capita Income in Pinole is $49,738, while median incomes of families and households are $126,563 and $113,630 respectively.
| Characteristic | Number | Measure |
| Per Capita Income | 18,946 | $49,738 |
| Median Family Income | 4,896 | $126,563 |
| Mean Family Income | 4,896 | $145,163 |
| Median Household Income | 6,784 | $113,630 |
| Mean Household Income | 6,784 | $133,320 |
| Income Deficit | 4,896 | $11,725 |
| Wage / Income Gap (%) | 18,946 | 12.05% |
| Wage / Income Gap ($) | 18,946 | 87.95¢ per $1 |
| Gini / Inequality Index | 18,946 | 0.38 |
Earnings by Sex in Pinole
Average Earnings in Pinole are $52,267, $57,102 for men and $50,219 for women, a difference of 12.0%.
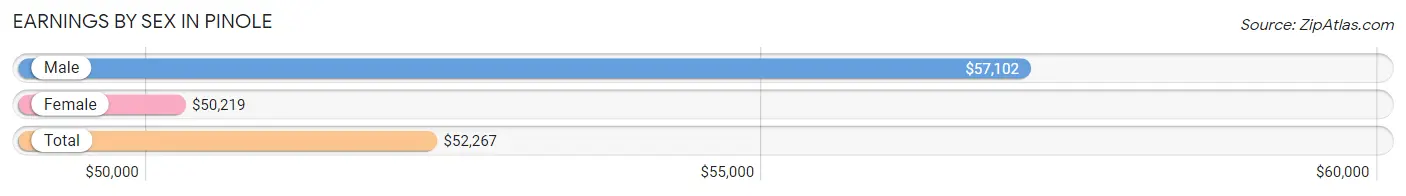
| Sex | Number | Average Earnings |
| Male | 5,438 (51.6%) | $57,102 |
| Female | 5,098 (48.4%) | $50,219 |
| Total | 10,536 (100.0%) | $52,267 |
Earnings by Sex by Income Bracket in Pinole
The most common earnings brackets in Pinole are $100,000+ for men (1,511 | 27.8%) and $100,000+ for women (972 | 19.1%).
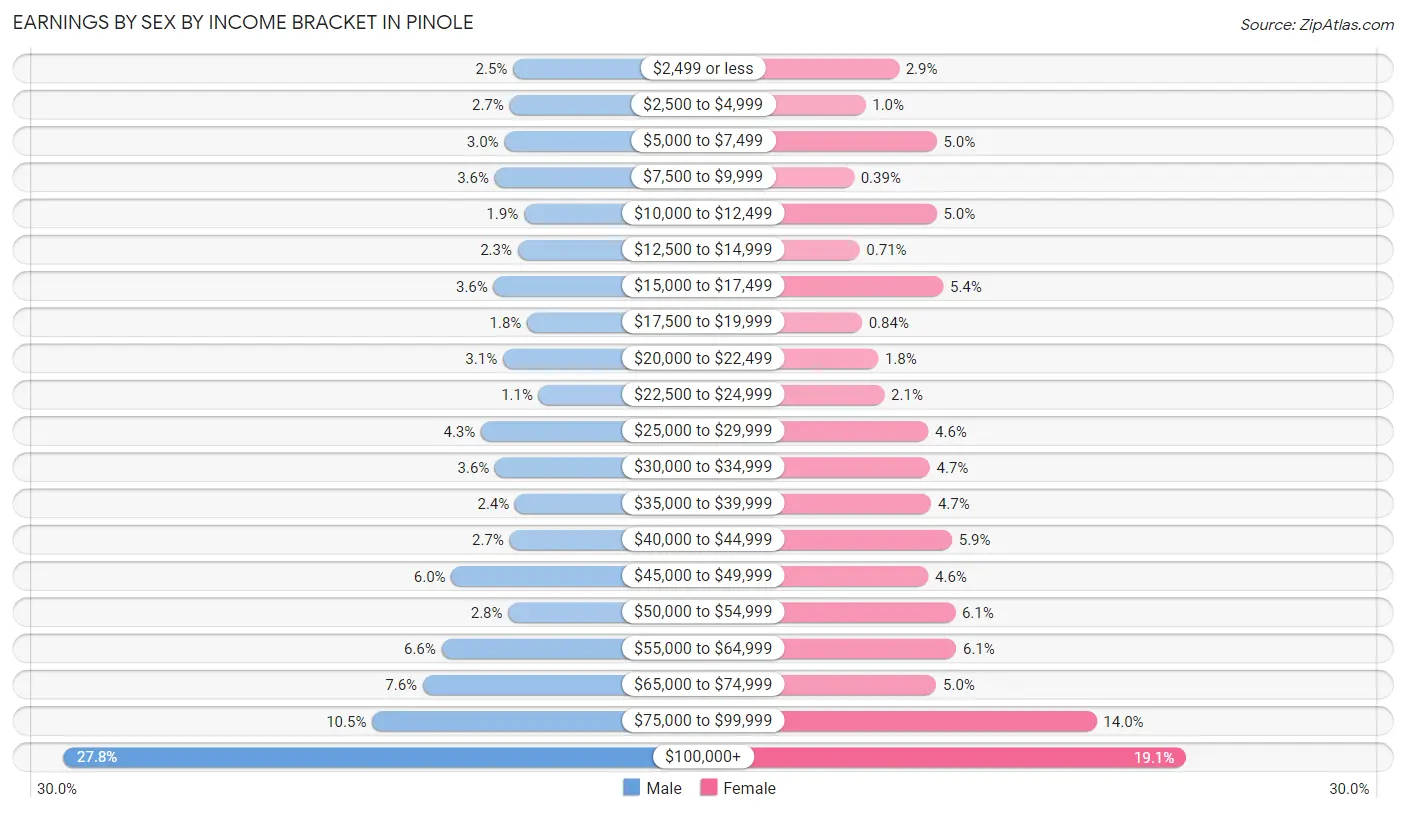
| Income | Male | Female |
| $2,499 or less | 138 (2.5%) | 149 (2.9%) |
| $2,500 to $4,999 | 149 (2.7%) | 53 (1.0%) |
| $5,000 to $7,499 | 165 (3.0%) | 257 (5.0%) |
| $7,500 to $9,999 | 194 (3.6%) | 20 (0.4%) |
| $10,000 to $12,499 | 105 (1.9%) | 257 (5.0%) |
| $12,500 to $14,999 | 124 (2.3%) | 36 (0.7%) |
| $15,000 to $17,499 | 198 (3.6%) | 276 (5.4%) |
| $17,500 to $19,999 | 95 (1.8%) | 43 (0.8%) |
| $20,000 to $22,499 | 169 (3.1%) | 89 (1.8%) |
| $22,500 to $24,999 | 60 (1.1%) | 107 (2.1%) |
| $25,000 to $29,999 | 236 (4.3%) | 233 (4.6%) |
| $30,000 to $34,999 | 193 (3.5%) | 237 (4.6%) |
| $35,000 to $39,999 | 132 (2.4%) | 241 (4.7%) |
| $40,000 to $44,999 | 149 (2.7%) | 301 (5.9%) |
| $45,000 to $49,999 | 327 (6.0%) | 233 (4.6%) |
| $50,000 to $54,999 | 153 (2.8%) | 310 (6.1%) |
| $55,000 to $64,999 | 357 (6.6%) | 313 (6.1%) |
| $65,000 to $74,999 | 414 (7.6%) | 256 (5.0%) |
| $75,000 to $99,999 | 569 (10.5%) | 715 (14.0%) |
| $100,000+ | 1,511 (27.8%) | 972 (19.1%) |
| Total | 5,438 (100.0%) | 5,098 (100.0%) |
Earnings by Sex by Educational Attainment in Pinole
Average earnings in Pinole are $65,133 for men and $53,017 for women, a difference of 18.6%. Men with an educational attainment of graduate degree enjoy the highest average annual earnings of $132,218, while those with less than high school education earn the least with $21,525. Women with an educational attainment of graduate degree earn the most with the average annual earnings of $85,950, while those with less than high school education have the smallest earnings of $16,561.
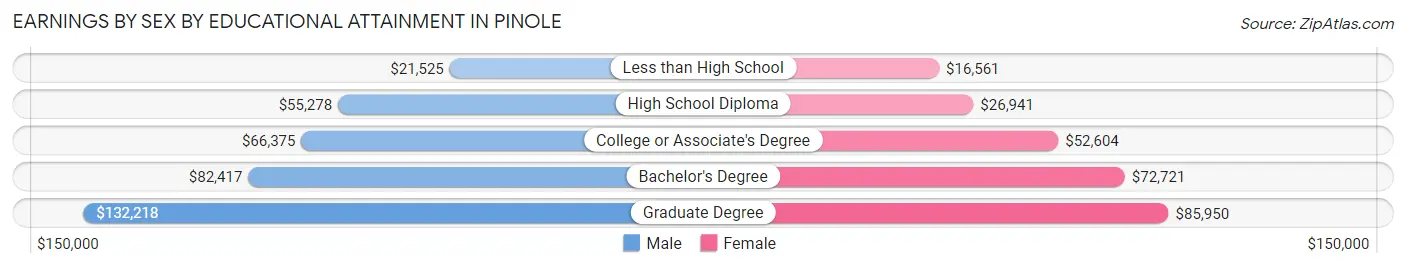
| Educational Attainment | Male Income | Female Income |
| Less than High School | $21,525 | $16,561 |
| High School Diploma | $55,278 | $26,941 |
| College or Associate's Degree | $66,375 | $52,604 |
| Bachelor's Degree | $82,417 | $72,721 |
| Graduate Degree | $132,218 | $85,950 |
| Total | $65,133 | $53,017 |
Family Income in Pinole
Family Income Brackets in Pinole
According to the Pinole family income data, there are 1,234 families falling into the $100,000 to $149,999 income range, which is the most common income bracket and makes up 25.2% of all families. Conversely, the $10,000 to $14,999 income bracket is the least frequent group with only 24 families (0.5%) belonging to this category.
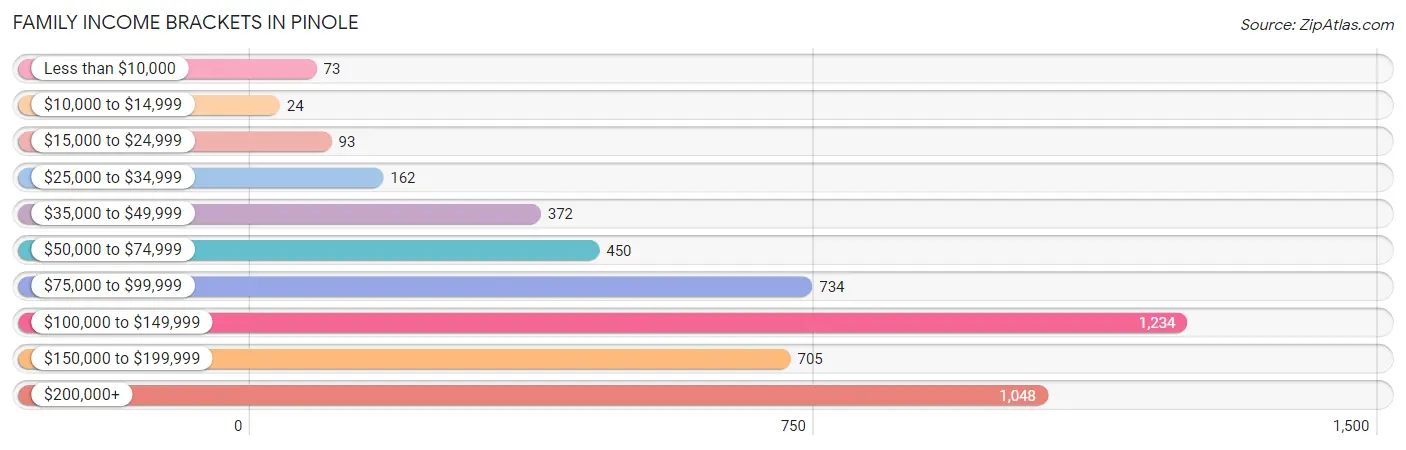
| Income Bracket | # Families | % Families |
| Less than $10,000 | 73 | 1.5% |
| $10,000 to $14,999 | 24 | 0.5% |
| $15,000 to $24,999 | 93 | 1.9% |
| $25,000 to $34,999 | 162 | 3.3% |
| $35,000 to $49,999 | 372 | 7.6% |
| $50,000 to $74,999 | 450 | 9.2% |
| $75,000 to $99,999 | 734 | 15.0% |
| $100,000 to $149,999 | 1,234 | 25.2% |
| $150,000 to $199,999 | 705 | 14.4% |
| $200,000+ | 1,048 | 21.4% |
Family Income by Famaliy Size in Pinole
7+ person families (101 | 2.1%) account for the highest median family income in Pinole with $160,486 per family, while 2-person families (2,353 | 48.1%) have the highest median income of $53,320 per family member.
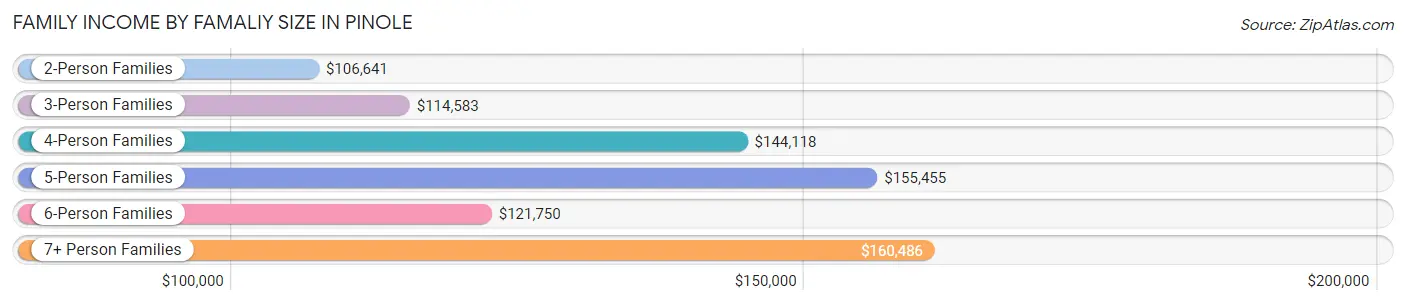
| Income Bracket | # Families | Median Income |
| 2-Person Families | 2,353 (48.1%) | $106,641 |
| 3-Person Families | 1,118 (22.8%) | $114,583 |
| 4-Person Families | 734 (15.0%) | $144,118 |
| 5-Person Families | 530 (10.8%) | $155,455 |
| 6-Person Families | 60 (1.2%) | $121,750 |
| 7+ Person Families | 101 (2.1%) | $160,486 |
| Total | 4,896 (100.0%) | $126,563 |
Family Income by Number of Earners in Pinole
The median family income in Pinole is $126,563, with families comprising 3+ earners (636) having the highest median family income of $190,160, while families with no earners (617) have the lowest median family income of $69,508, accounting for 13.0% and 12.6% of families, respectively.
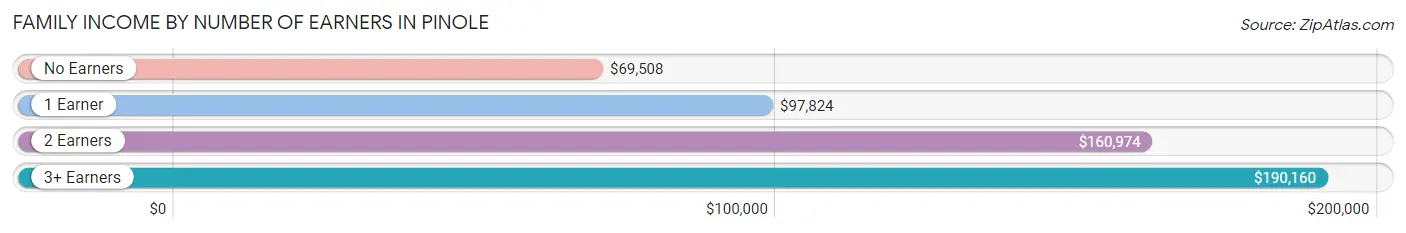
| Number of Earners | # Families | Median Income |
| No Earners | 617 (12.6%) | $69,508 |
| 1 Earner | 1,834 (37.5%) | $97,824 |
| 2 Earners | 1,809 (36.9%) | $160,974 |
| 3+ Earners | 636 (13.0%) | $190,160 |
| Total | 4,896 (100.0%) | $126,563 |
Household Income in Pinole
Household Income Brackets in Pinole
With 1,554 households falling in the category, the $100,000 to $149,999 income range is the most frequent in Pinole, accounting for 22.9% of all households. In contrast, only 122 households (1.8%) fall into the $15,000 to $24,999 income bracket, making it the least populous group.
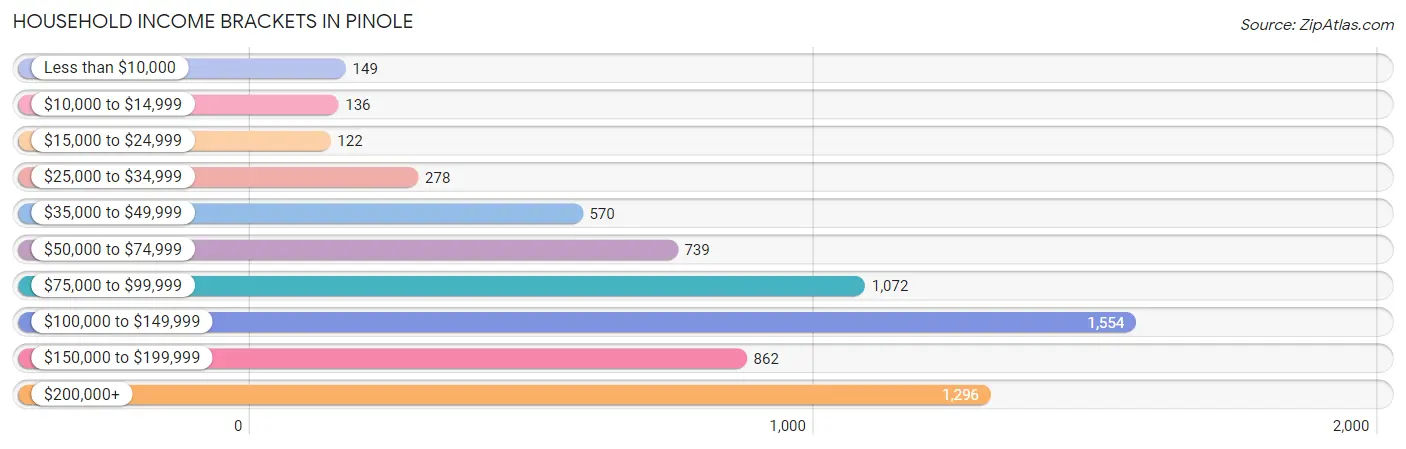
| Income Bracket | # Households | % Households |
| Less than $10,000 | 149 | 2.2% |
| $10,000 to $14,999 | 136 | 2.0% |
| $15,000 to $24,999 | 122 | 1.8% |
| $25,000 to $34,999 | 278 | 4.1% |
| $35,000 to $49,999 | 570 | 8.4% |
| $50,000 to $74,999 | 739 | 10.9% |
| $75,000 to $99,999 | 1,072 | 15.8% |
| $100,000 to $149,999 | 1,554 | 22.9% |
| $150,000 to $199,999 | 862 | 12.7% |
| $200,000+ | 1,296 | 19.1% |
Household Income by Householder Age in Pinole
The median household income in Pinole is $113,630, with the highest median household income of $132,050 found in the 45 to 64 years age bracket for the primary householder. A total of 2,253 households (33.2%) fall into this category. Meanwhile, the 15 to 24 years age bracket for the primary householder has the lowest median household income of $0, with 16 households (0.2%) in this group.
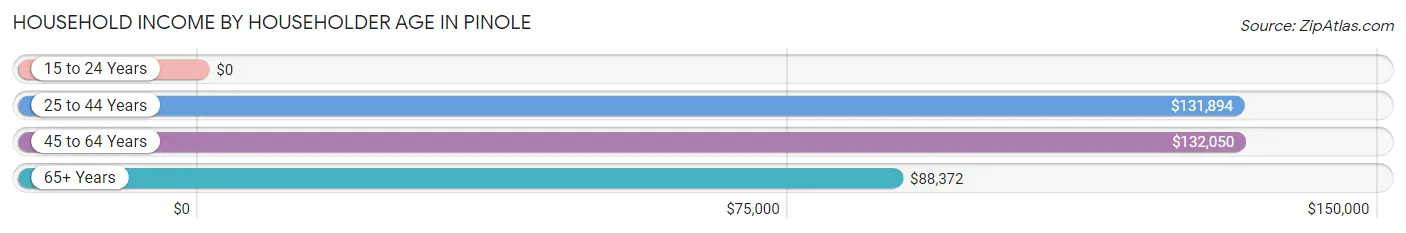
| Income Bracket | # Households | Median Income |
| 15 to 24 Years | 16 (0.2%) | $0 |
| 25 to 44 Years | 2,071 (30.5%) | $131,894 |
| 45 to 64 Years | 2,253 (33.2%) | $132,050 |
| 65+ Years | 2,444 (36.0%) | $88,372 |
| Total | 6,784 (100.0%) | $113,630 |
Poverty in Pinole
Income Below Poverty by Sex and Age in Pinole
With 5.5% poverty level for males and 5.5% for females among the residents of Pinole, 15 year old males and 18 to 24 year old females are the most vulnerable to poverty, with 11 males (12.0%) and 111 females (17.4%) in their respective age groups living below the poverty level.
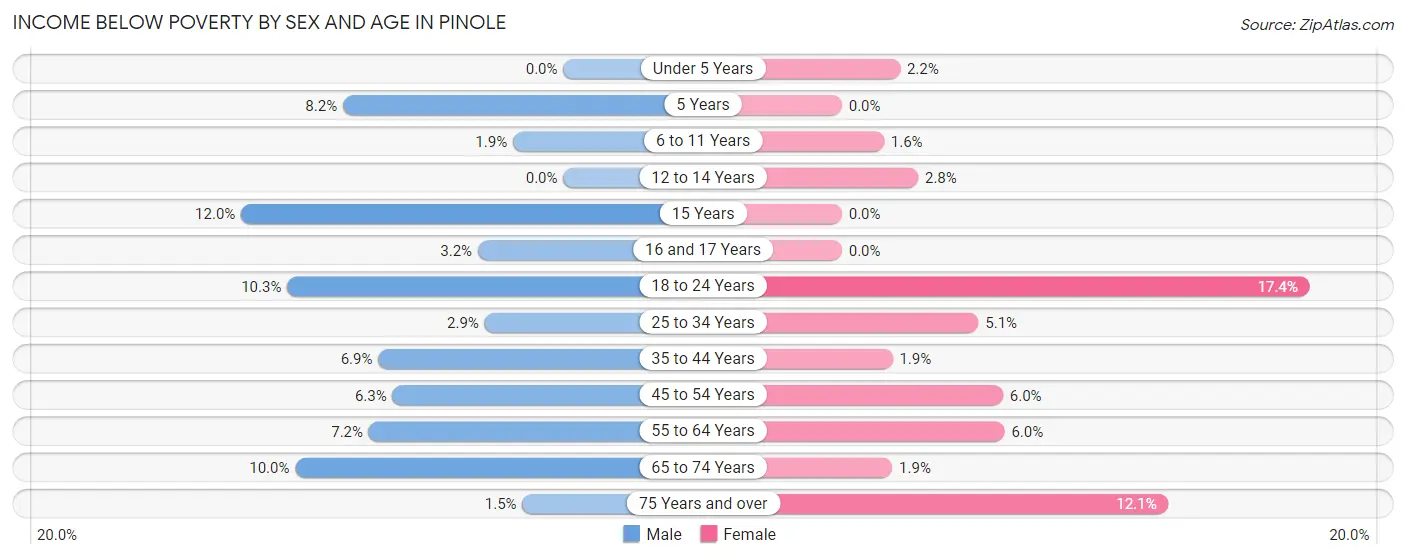
| Age Bracket | Male | Female |
| Under 5 Years | 0 (0.0%) | 12 (2.2%) |
| 5 Years | 9 (8.2%) | 0 (0.0%) |
| 6 to 11 Years | 10 (1.9%) | 9 (1.6%) |
| 12 to 14 Years | 0 (0.0%) | 10 (2.8%) |
| 15 Years | 11 (12.0%) | 0 (0.0%) |
| 16 and 17 Years | 10 (3.2%) | 0 (0.0%) |
| 18 to 24 Years | 53 (10.2%) | 111 (17.4%) |
| 25 to 34 Years | 43 (2.9%) | 73 (5.1%) |
| 35 to 44 Years | 92 (6.9%) | 26 (1.9%) |
| 45 to 54 Years | 57 (6.3%) | 60 (6.0%) |
| 55 to 64 Years | 91 (7.2%) | 86 (6.0%) |
| 65 to 74 Years | 102 (10.0%) | 26 (1.9%) |
| 75 Years and over | 10 (1.5%) | 136 (12.1%) |
| Total | 488 (5.5%) | 549 (5.5%) |
Income Above Poverty by Sex and Age in Pinole
According to the poverty statistics in Pinole, males aged under 5 years and females aged 5 years are the age groups that are most secure financially, with 100.0% of males and 100.0% of females in these age groups living above the poverty line.
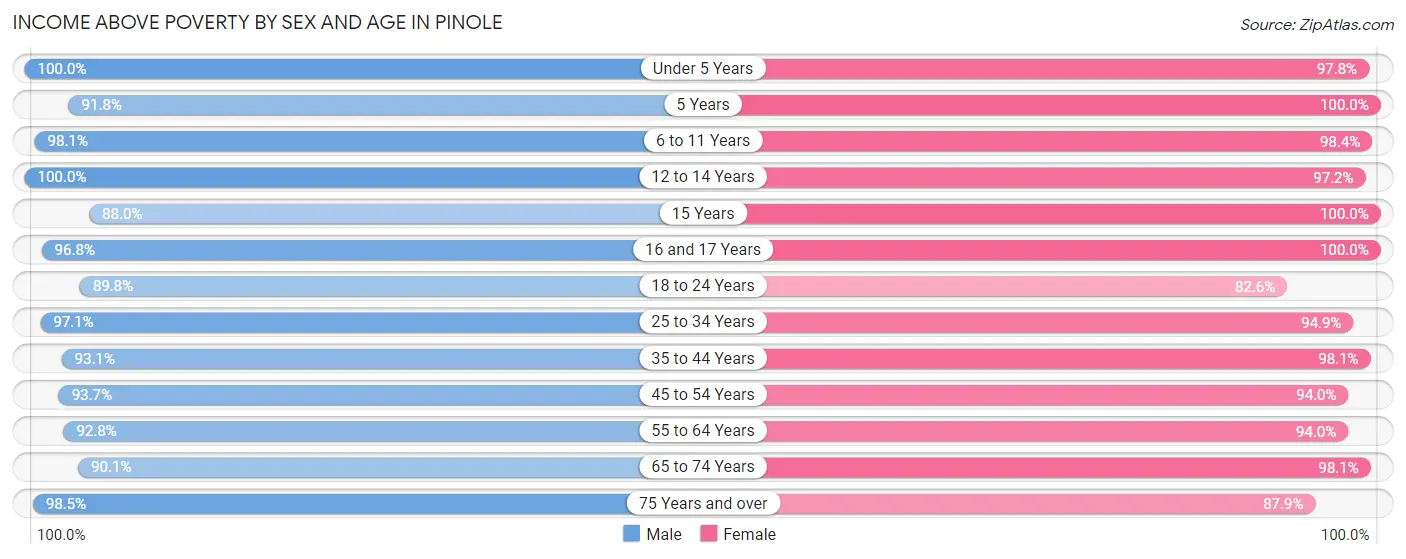
| Age Bracket | Male | Female |
| Under 5 Years | 395 (100.0%) | 544 (97.8%) |
| 5 Years | 101 (91.8%) | 24 (100.0%) |
| 6 to 11 Years | 525 (98.1%) | 568 (98.4%) |
| 12 to 14 Years | 192 (100.0%) | 343 (97.2%) |
| 15 Years | 81 (88.0%) | 51 (100.0%) |
| 16 and 17 Years | 305 (96.8%) | 67 (100.0%) |
| 18 to 24 Years | 464 (89.7%) | 528 (82.6%) |
| 25 to 34 Years | 1,432 (97.1%) | 1,367 (94.9%) |
| 35 to 44 Years | 1,247 (93.1%) | 1,359 (98.1%) |
| 45 to 54 Years | 842 (93.7%) | 944 (94.0%) |
| 55 to 64 Years | 1,169 (92.8%) | 1,338 (94.0%) |
| 65 to 74 Years | 923 (90.0%) | 1,366 (98.1%) |
| 75 Years and over | 650 (98.5%) | 985 (87.9%) |
| Total | 8,326 (94.5%) | 9,484 (94.5%) |
Income Below Poverty Among Married-Couple Families in Pinole
The poverty statistics for married-couple families in Pinole show that 2.1% or 68 of the total 3,249 families live below the poverty line. Families with no children have the highest poverty rate of 2.9%, comprising of 59 families. On the other hand, families with 3 or 4 children have the lowest poverty rate of 0.0%, which includes 0 families.
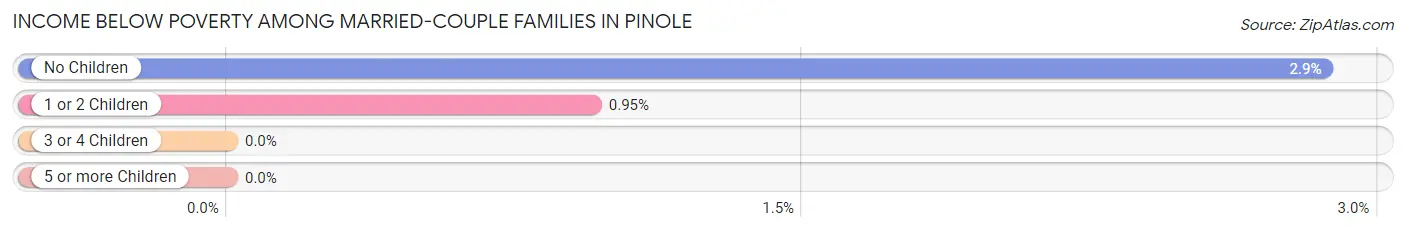
| Children | Above Poverty | Below Poverty |
| No Children | 2,005 (97.1%) | 59 (2.9%) |
| 1 or 2 Children | 937 (99.1%) | 9 (0.9%) |
| 3 or 4 Children | 239 (100.0%) | 0 (0.0%) |
| 5 or more Children | 0 (0.0%) | 0 (0.0%) |
| Total | 3,181 (97.9%) | 68 (2.1%) |
Income Below Poverty Among Single-Parent Households in Pinole
According to the poverty data in Pinole, 7.4% or 29 single-father households and 2.7% or 34 single-mother households are living below the poverty line. Among single-father households, those with 1 or 2 children have the highest poverty rate, with 22 households (9.2%) experiencing poverty. Likewise, among single-mother households, those with 1 or 2 children have the highest poverty rate, with 11 households (3.1%) falling below the poverty line.
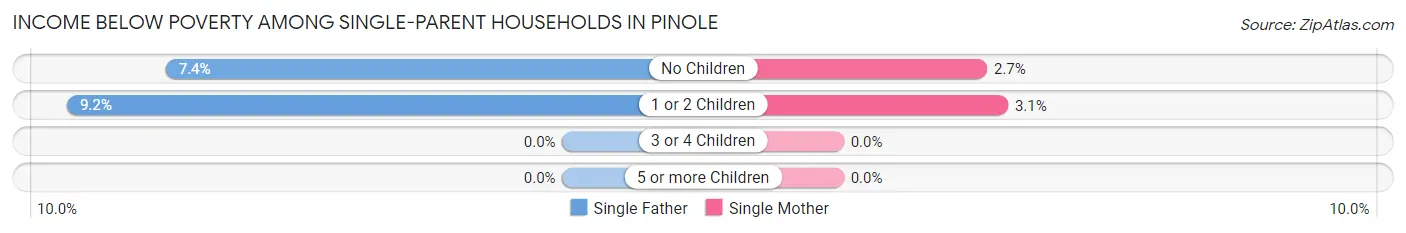
| Children | Single Father | Single Mother |
| No Children | 7 (7.4%) | 23 (2.7%) |
| 1 or 2 Children | 22 (9.2%) | 11 (3.1%) |
| 3 or 4 Children | 0 (0.0%) | 0 (0.0%) |
| 5 or more Children | 0 (0.0%) | 0 (0.0%) |
| Total | 29 (7.4%) | 34 (2.7%) |
Income Below Poverty Among Married-Couple vs Single-Parent Households in Pinole
The poverty data for Pinole shows that 68 of the married-couple family households (2.1%) and 63 of the single-parent households (3.8%) are living below the poverty level. Within the married-couple family households, those with no children have the highest poverty rate, with 59 households (2.9%) falling below the poverty line. Among the single-parent households, those with 1 or 2 children have the highest poverty rate, with 33 household (5.5%) living below poverty.
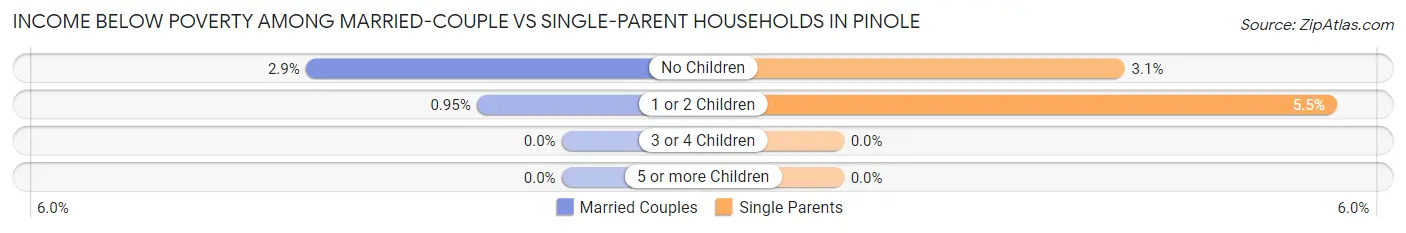
| Children | Married-Couple Families | Single-Parent Households |
| No Children | 59 (2.9%) | 30 (3.1%) |
| 1 or 2 Children | 9 (0.9%) | 33 (5.5%) |
| 3 or 4 Children | 0 (0.0%) | 0 (0.0%) |
| 5 or more Children | 0 (0.0%) | 0 (0.0%) |
| Total | 68 (2.1%) | 63 (3.8%) |
Race in Pinole
The most populous races in Pinole are White / Caucasian (6,962 | 36.7%), Hispanic or Latino (4,936 | 26.1%), and Asian (4,563 | 24.1%).
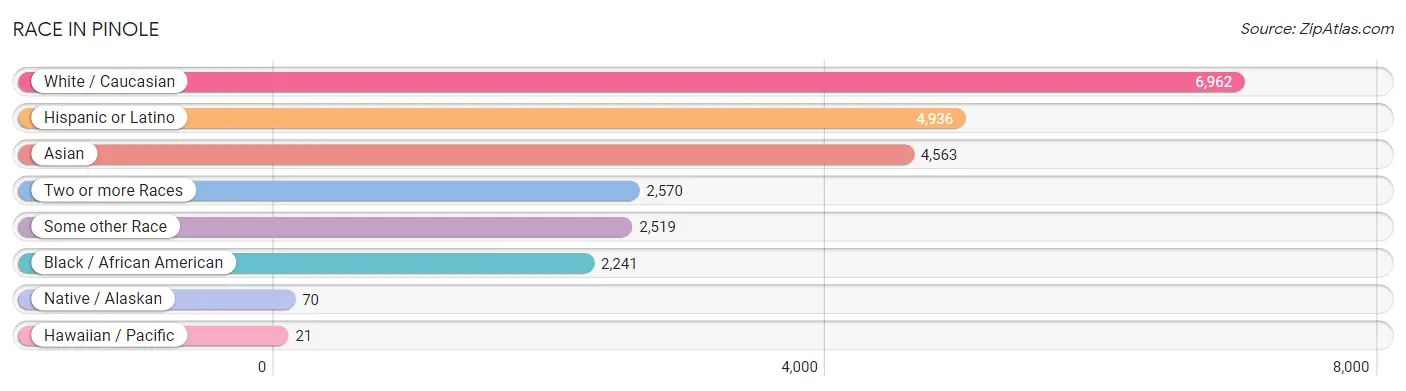
| Race | # Population | % Population |
| Asian | 4,563 | 24.1% |
| Black / African American | 2,241 | 11.8% |
| Hawaiian / Pacific | 21 | 0.1% |
| Hispanic or Latino | 4,936 | 26.1% |
| Native / Alaskan | 70 | 0.4% |
| White / Caucasian | 6,962 | 36.7% |
| Two or more Races | 2,570 | 13.6% |
| Some other Race | 2,519 | 13.3% |
| Total | 18,946 | 100.0% |
Ancestry in Pinole
The most populous ancestries reported in Pinole are Mexican (2,785 | 14.7%), Korean (2,156 | 11.4%), Central American (1,352 | 7.1%), Indian (Asian) (1,227 | 6.5%), and Italian (1,145 | 6.0%), together accounting for 45.7% of all Pinole residents.
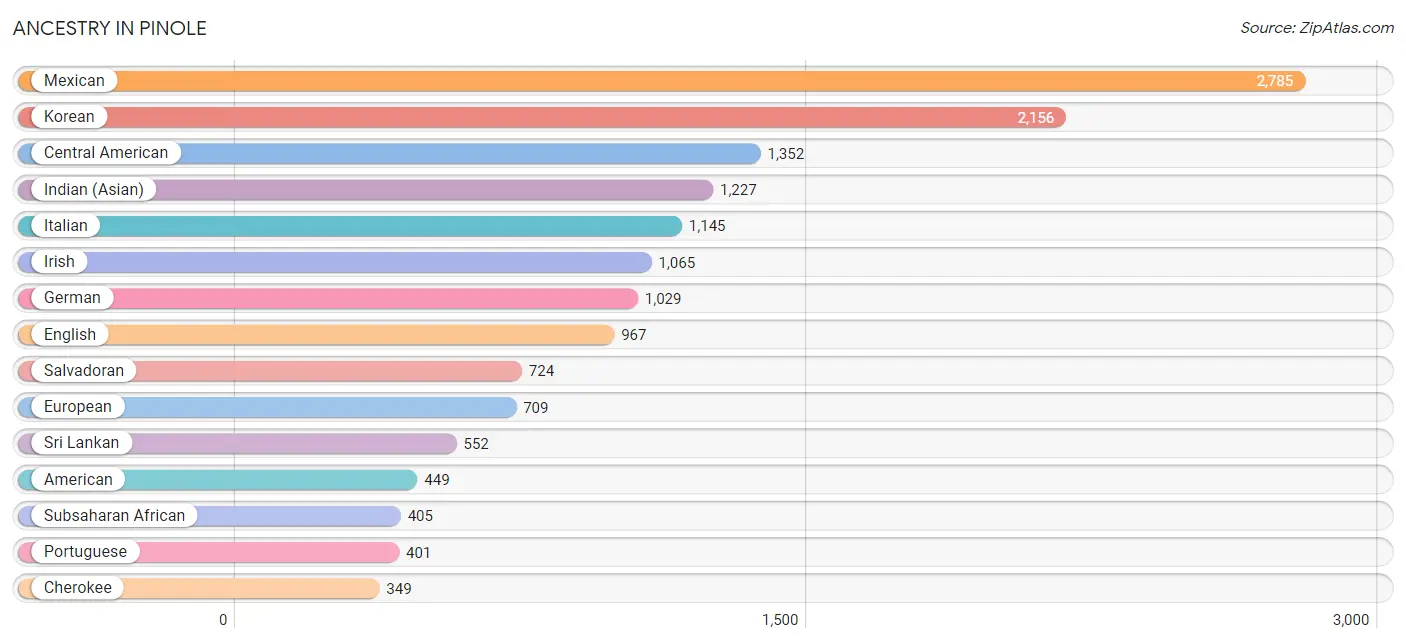
| Ancestry | # Population | % Population |
| African | 212 | 1.1% |
| American | 449 | 2.4% |
| Arab | 159 | 0.8% |
| Argentinean | 21 | 0.1% |
| Armenian | 47 | 0.3% |
| Australian | 5 | 0.0% |
| Austrian | 62 | 0.3% |
| Belizean | 23 | 0.1% |
| Bhutanese | 277 | 1.5% |
| Blackfeet | 37 | 0.2% |
| Brazilian | 35 | 0.2% |
| British | 56 | 0.3% |
| Burmese | 273 | 1.4% |
| Canadian | 7 | 0.0% |
| Cape Verdean | 34 | 0.2% |
| Central American | 1,352 | 7.1% |
| Central American Indian | 51 | 0.3% |
| Cherokee | 349 | 1.8% |
| Chickasaw | 7 | 0.0% |
| Chilean | 15 | 0.1% |
| Chinese | 10 | 0.1% |
| Chippewa | 110 | 0.6% |
| Choctaw | 13 | 0.1% |
| Colombian | 24 | 0.1% |
| Costa Rican | 23 | 0.1% |
| Cuban | 116 | 0.6% |
| Czech | 66 | 0.4% |
| Czechoslovakian | 12 | 0.1% |
| Danish | 10 | 0.1% |
| Dutch | 187 | 1.0% |
| English | 967 | 5.1% |
| Ethiopian | 89 | 0.5% |
| European | 709 | 3.7% |
| Filipino | 17 | 0.1% |
| Finnish | 11 | 0.1% |
| French | 123 | 0.6% |
| German | 1,029 | 5.4% |
| Greek | 67 | 0.4% |
| Guatemalan | 281 | 1.5% |
| Guyanese | 29 | 0.2% |
| Hungarian | 23 | 0.1% |
| Indian (Asian) | 1,227 | 6.5% |
| Iranian | 138 | 0.7% |
| Irish | 1,065 | 5.6% |
| Italian | 1,145 | 6.0% |
| Jamaican | 95 | 0.5% |
| Korean | 2,156 | 11.4% |
| Laotian | 249 | 1.3% |
| Malaysian | 208 | 1.1% |
| Mexican | 2,785 | 14.7% |
| Native Hawaiian | 100 | 0.5% |
| Navajo | 27 | 0.1% |
| Nicaraguan | 324 | 1.7% |
| Nigerian | 70 | 0.4% |
| Norwegian | 116 | 0.6% |
| Pakistani | 22 | 0.1% |
| Peruvian | 198 | 1.1% |
| Polish | 201 | 1.1% |
| Portuguese | 401 | 2.1% |
| Puerto Rican | 137 | 0.7% |
| Russian | 87 | 0.5% |
| Salvadoran | 724 | 3.8% |
| Samoan | 19 | 0.1% |
| Scandinavian | 11 | 0.1% |
| Scotch-Irish | 48 | 0.3% |
| Scottish | 209 | 1.1% |
| Sioux | 15 | 0.1% |
| Slovak | 43 | 0.2% |
| Slovene | 55 | 0.3% |
| South American | 258 | 1.4% |
| Spaniard | 71 | 0.4% |
| Spanish | 123 | 0.6% |
| Sri Lankan | 552 | 2.9% |
| Subsaharan African | 405 | 2.1% |
| Swedish | 146 | 0.8% |
| Swiss | 40 | 0.2% |
| Thai | 202 | 1.1% |
| Tongan | 18 | 0.1% |
| Trinidadian and Tobagonian | 14 | 0.1% |
| Ukrainian | 101 | 0.5% | View All 80 Rows |
Immigrants in Pinole
The most numerous immigrant groups reported in Pinole came from Asia (3,322 | 17.5%), South Eastern Asia (1,802 | 9.5%), Latin America (1,670 | 8.8%), Central America (1,509 | 8.0%), and Philippines (1,171 | 6.2%), together accounting for 50.0% of all Pinole residents.
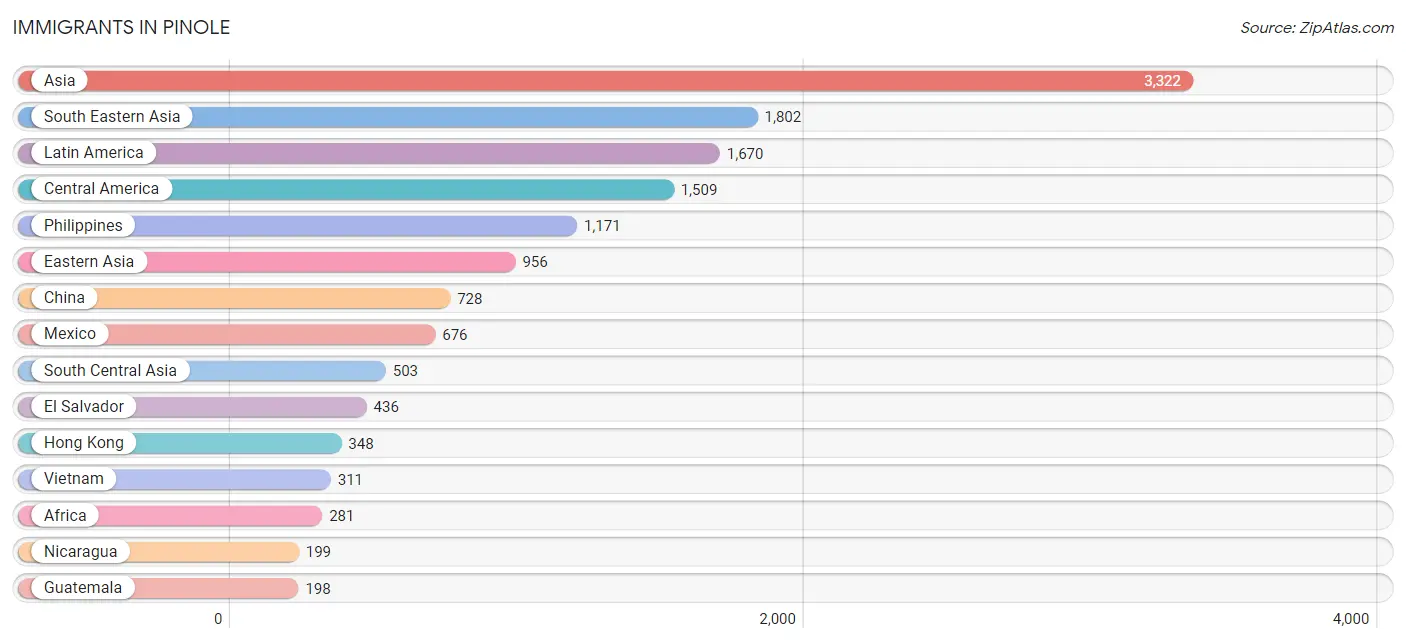
| Immigration Origin | # Population | % Population |
| Africa | 281 | 1.5% |
| Argentina | 21 | 0.1% |
| Asia | 3,322 | 17.5% |
| Australia | 7 | 0.0% |
| Canada | 46 | 0.2% |
| Caribbean | 34 | 0.2% |
| Central America | 1,509 | 8.0% |
| Chile | 15 | 0.1% |
| China | 728 | 3.8% |
| Colombia | 24 | 0.1% |
| Eastern Africa | 105 | 0.5% |
| Eastern Asia | 956 | 5.1% |
| Eastern Europe | 11 | 0.1% |
| El Salvador | 436 | 2.3% |
| England | 22 | 0.1% |
| Eritrea | 17 | 0.1% |
| Ethiopia | 45 | 0.2% |
| Europe | 188 | 1.0% |
| France | 13 | 0.1% |
| Germany | 19 | 0.1% |
| Guatemala | 198 | 1.1% |
| Guyana | 29 | 0.2% |
| Hong Kong | 348 | 1.8% |
| Hungary | 8 | 0.0% |
| India | 117 | 0.6% |
| Indonesia | 93 | 0.5% |
| Iran | 138 | 0.7% |
| Ireland | 20 | 0.1% |
| Italy | 60 | 0.3% |
| Jamaica | 20 | 0.1% |
| Japan | 31 | 0.2% |
| Korea | 197 | 1.0% |
| Laos | 150 | 0.8% |
| Latin America | 1,670 | 8.8% |
| Malaysia | 8 | 0.0% |
| Mexico | 676 | 3.6% |
| Nepal | 66 | 0.4% |
| Nicaragua | 199 | 1.1% |
| Nigeria | 62 | 0.3% |
| Northern Africa | 87 | 0.5% |
| Northern Europe | 64 | 0.3% |
| Oceania | 12 | 0.1% |
| Pakistan | 182 | 1.0% |
| Peru | 38 | 0.2% |
| Philippines | 1,171 | 6.2% |
| Russia | 3 | 0.0% |
| Saudi Arabia | 3 | 0.0% |
| South Africa | 27 | 0.1% |
| South America | 127 | 0.7% |
| South Central Asia | 503 | 2.6% |
| South Eastern Asia | 1,802 | 9.5% |
| Southern Europe | 81 | 0.4% |
| Spain | 21 | 0.1% |
| Taiwan | 17 | 0.1% |
| Thailand | 69 | 0.4% |
| Trinidad and Tobago | 14 | 0.1% |
| Vietnam | 311 | 1.6% |
| Western Africa | 62 | 0.3% |
| Western Asia | 61 | 0.3% |
| Western Europe | 32 | 0.2% |
| Yemen | 58 | 0.3% | View All 61 Rows |
Sex and Age in Pinole
Sex and Age in Pinole
The most populous age groups in Pinole are 30 to 34 Years (854 | 9.6%) for men and 30 to 34 Years (951 | 9.4%) for women.
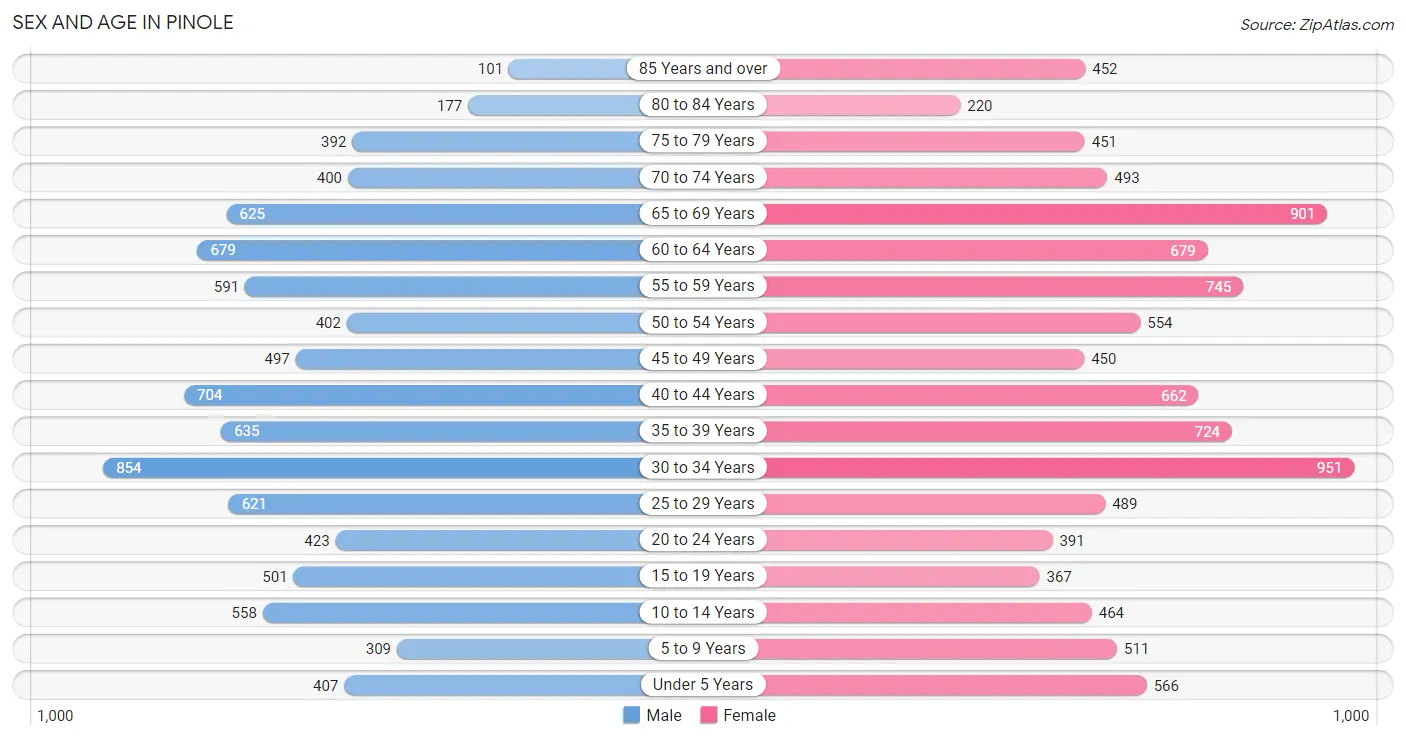
| Age Bracket | Male | Female |
| Under 5 Years | 407 (4.6%) | 566 (5.6%) |
| 5 to 9 Years | 309 (3.5%) | 511 (5.1%) |
| 10 to 14 Years | 558 (6.3%) | 464 (4.6%) |
| 15 to 19 Years | 501 (5.6%) | 367 (3.6%) |
| 20 to 24 Years | 423 (4.8%) | 391 (3.9%) |
| 25 to 29 Years | 621 (7.0%) | 489 (4.9%) |
| 30 to 34 Years | 854 (9.6%) | 951 (9.4%) |
| 35 to 39 Years | 635 (7.1%) | 724 (7.2%) |
| 40 to 44 Years | 704 (7.9%) | 662 (6.6%) |
| 45 to 49 Years | 497 (5.6%) | 450 (4.5%) |
| 50 to 54 Years | 402 (4.5%) | 554 (5.5%) |
| 55 to 59 Years | 591 (6.7%) | 745 (7.4%) |
| 60 to 64 Years | 679 (7.6%) | 679 (6.7%) |
| 65 to 69 Years | 625 (7.0%) | 901 (8.9%) |
| 70 to 74 Years | 400 (4.5%) | 493 (4.9%) |
| 75 to 79 Years | 392 (4.4%) | 451 (4.5%) |
| 80 to 84 Years | 177 (2.0%) | 220 (2.2%) |
| 85 Years and over | 101 (1.1%) | 452 (4.5%) |
| Total | 8,876 (100.0%) | 10,070 (100.0%) |
Families and Households in Pinole
Median Family Size in Pinole
The median family size in Pinole is 3.17 persons per family, with married-couple families (3,249 | 66.4%) accounting for the largest median family size of 3.34 persons per family. On the other hand, single female/mother families (1,253 | 25.6%) represent the smallest median family size with 2.70 persons per family.
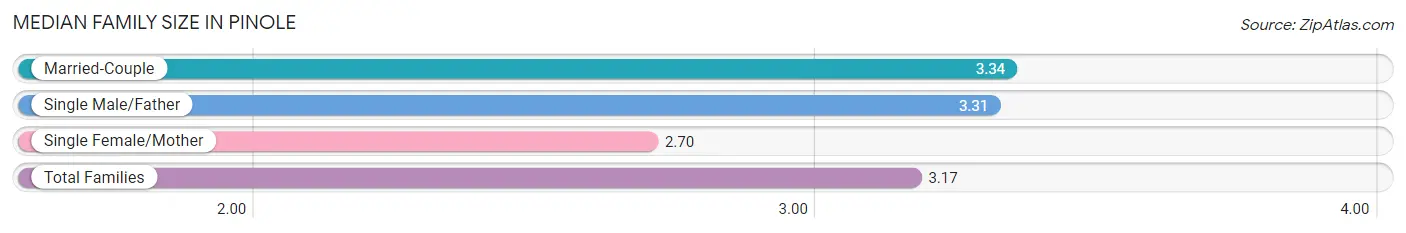
| Family Type | # Families | Family Size |
| Married-Couple | 3,249 (66.4%) | 3.34 |
| Single Male/Father | 394 (8.1%) | 3.31 |
| Single Female/Mother | 1,253 (25.6%) | 2.70 |
| Total Families | 4,896 (100.0%) | 3.17 |
Median Household Size in Pinole
The median household size in Pinole is 2.77 persons per household, with single male/father households (394 | 5.8%) accounting for the largest median household size of 3.89 persons per household. non-family households (1,888 | 27.8%) represent the smallest median household size with 1.44 persons per household.
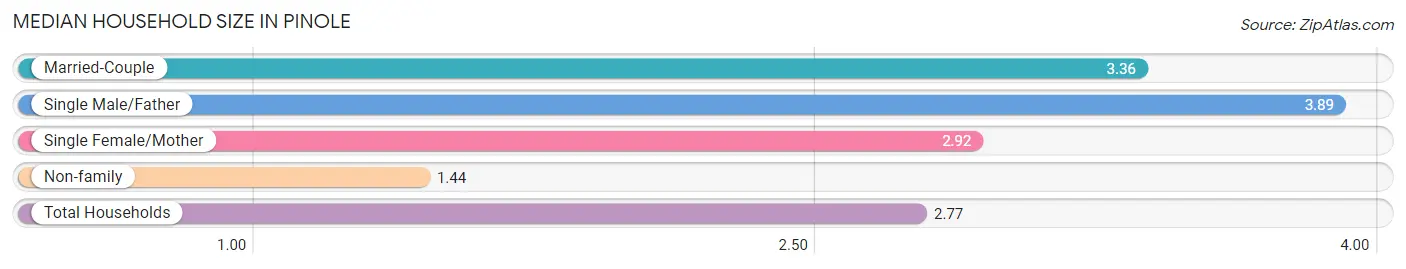
| Household Type | # Households | Household Size |
| Married-Couple | 3,249 (47.9%) | 3.36 |
| Single Male/Father | 394 (5.8%) | 3.89 |
| Single Female/Mother | 1,253 (18.5%) | 2.92 |
| Non-family | 1,888 (27.8%) | 1.44 |
| Total Households | 6,784 (100.0%) | 2.77 |
Household Size by Marriage Status in Pinole
Out of a total of 6,784 households in Pinole, 4,896 (72.2%) are family households, while 1,888 (27.8%) are nonfamily households. The most numerous type of family households are 2-person households, comprising 2,207, and the most common type of nonfamily households are 1-person households, comprising 1,375.
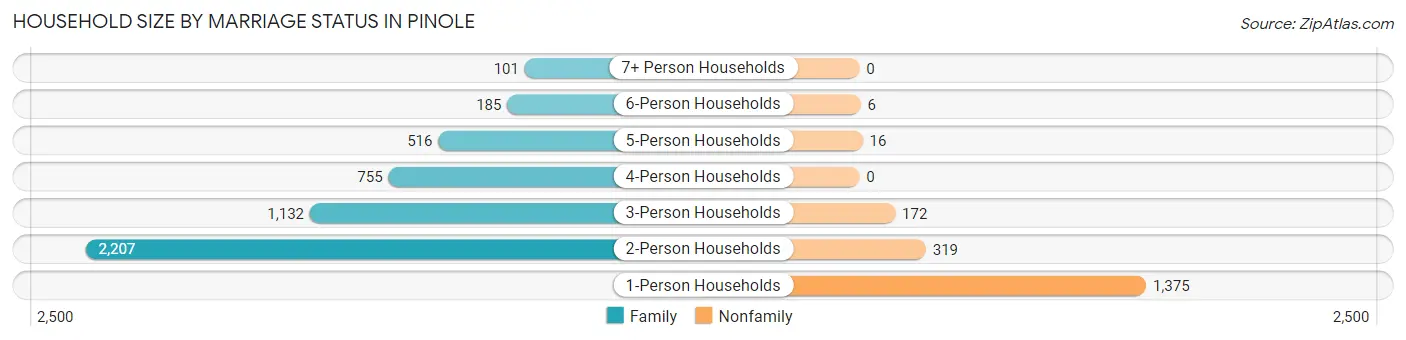
| Household Size | Family Households | Nonfamily Households |
| 1-Person Households | - | 1,375 (20.3%) |
| 2-Person Households | 2,207 (32.5%) | 319 (4.7%) |
| 3-Person Households | 1,132 (16.7%) | 172 (2.5%) |
| 4-Person Households | 755 (11.1%) | 0 (0.0%) |
| 5-Person Households | 516 (7.6%) | 16 (0.2%) |
| 6-Person Households | 185 (2.7%) | 6 (0.1%) |
| 7+ Person Households | 101 (1.5%) | 0 (0.0%) |
| Total | 4,896 (72.2%) | 1,888 (27.8%) |
Female Fertility in Pinole
Fertility by Age in Pinole
Average fertility rate in Pinole is 72.0 births per 1,000 women. Women in the age bracket of 20 to 34 years have the highest fertility rate with 84.0 births per 1,000 women. Women in the age bracket of 20 to 34 years acount for 51.3% of all women with births.
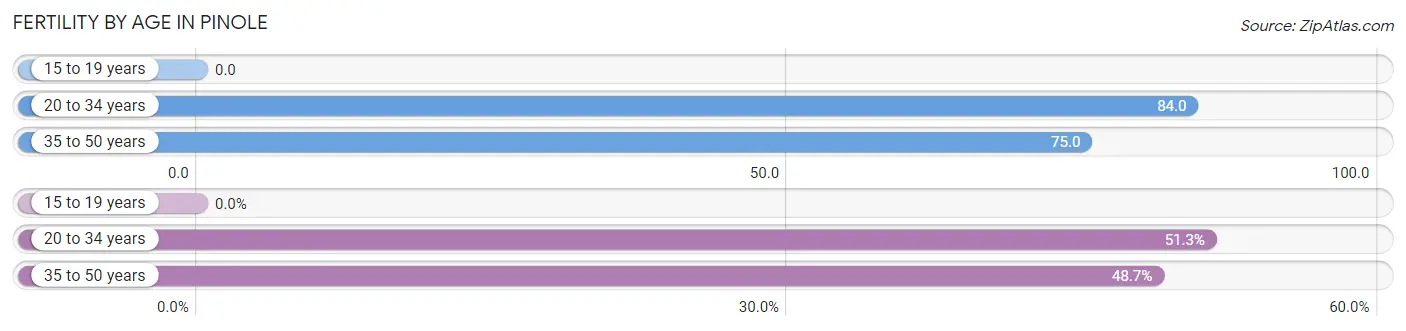
| Age Bracket | Women with Births | Births / 1,000 Women |
| 15 to 19 years | 0 (0.0%) | 0.0 |
| 20 to 34 years | 153 (51.3%) | 84.0 |
| 35 to 50 years | 145 (48.7%) | 75.0 |
| Total | 298 (100.0%) | 72.0 |
Fertility by Age by Marriage Status in Pinole
66.1% of women with births (298) in Pinole are married. The highest percentage of unmarried women with births falls into 20 to 34 years age bracket with 49.0% of them unmarried at the time of birth, while the lowest percentage of unmarried women with births belong to 35 to 50 years age bracket with 17.9% of them unmarried.
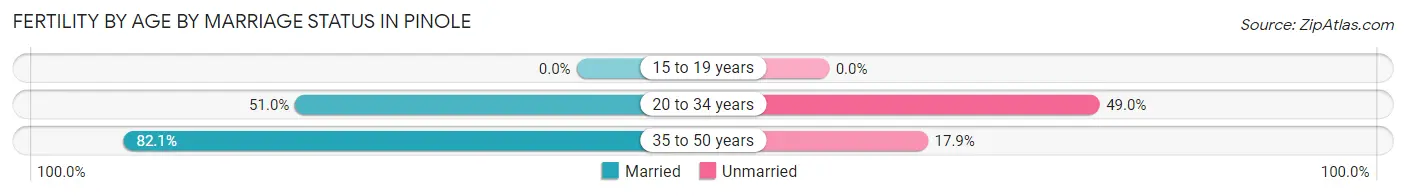
| Age Bracket | Married | Unmarried |
| 15 to 19 years | 0 (0.0%) | 0 (0.0%) |
| 20 to 34 years | 78 (51.0%) | 75 (49.0%) |
| 35 to 50 years | 119 (82.1%) | 26 (17.9%) |
| Total | 197 (66.1%) | 101 (33.9%) |
Fertility by Education in Pinole
Average fertility rate in Pinole is 72.0 births per 1,000 women. Women with the education attainment of graduate degree have the highest fertility rate of 171.0 births per 1,000 women, while women with the education attainment of bachelor's degree have the lowest fertility at 23.0 births per 1,000 women. Women with the education attainment of graduate degree represent 37.2% of all women with births.
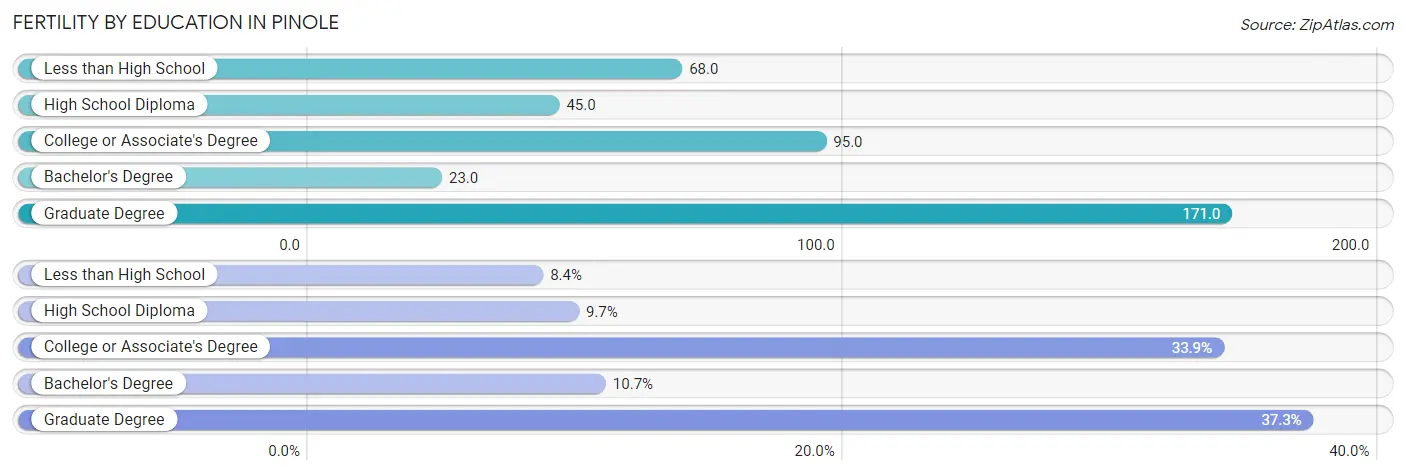
| Educational Attainment | Women with Births | Births / 1,000 Women |
| Less than High School | 25 (8.4%) | 68.0 |
| High School Diploma | 29 (9.7%) | 45.0 |
| College or Associate's Degree | 101 (33.9%) | 95.0 |
| Bachelor's Degree | 32 (10.7%) | 23.0 |
| Graduate Degree | 111 (37.2%) | 171.0 |
| Total | 298 (100.0%) | 72.0 |
Fertility by Education by Marriage Status in Pinole
33.9% of women with births in Pinole are unmarried. Women with the educational attainment of less than high school are most likely to be married with 100.0% of them married at childbirth, while women with the educational attainment of college or associate's degree are least likely to be married with 49.5% of them unmarried at childbirth.
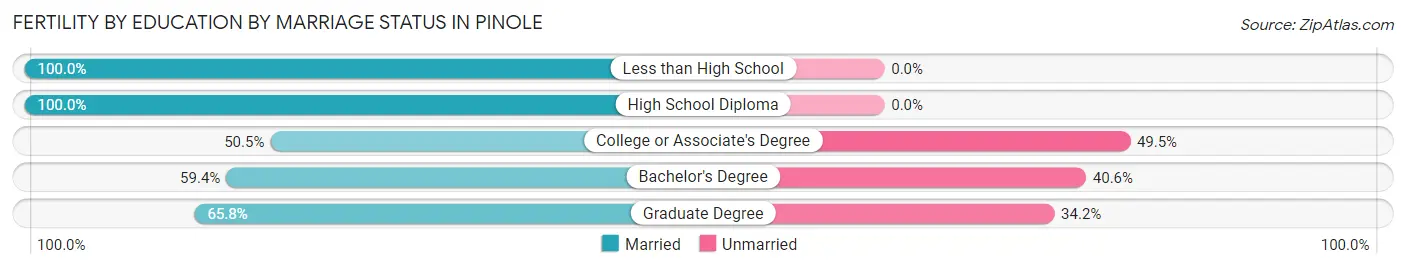
| Educational Attainment | Married | Unmarried |
| Less than High School | 25 (100.0%) | 0 (0.0%) |
| High School Diploma | 29 (100.0%) | 0 (0.0%) |
| College or Associate's Degree | 51 (50.5%) | 50 (49.5%) |
| Bachelor's Degree | 19 (59.4%) | 13 (40.6%) |
| Graduate Degree | 73 (65.8%) | 38 (34.2%) |
| Total | 197 (66.1%) | 101 (33.9%) |
Employment Characteristics in Pinole
Employment by Class of Employer in Pinole
Among the 9,535 employed individuals in Pinole, private company employees (5,876 | 61.6%), local government employees (1,019 | 10.7%), and not-for-profit organizations (961 | 10.1%) make up the most common classes of employment.
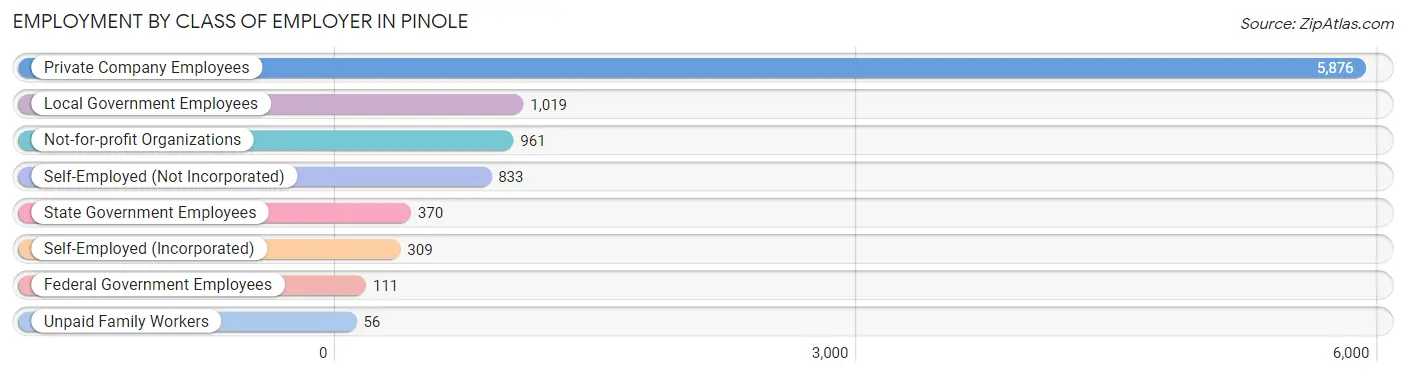
| Employer Class | # Employees | % Employees |
| Private Company Employees | 5,876 | 61.6% |
| Self-Employed (Incorporated) | 309 | 3.2% |
| Self-Employed (Not Incorporated) | 833 | 8.7% |
| Not-for-profit Organizations | 961 | 10.1% |
| Local Government Employees | 1,019 | 10.7% |
| State Government Employees | 370 | 3.9% |
| Federal Government Employees | 111 | 1.2% |
| Unpaid Family Workers | 56 | 0.6% |
| Total | 9,535 | 100.0% |
Employment Status by Age in Pinole
According to the labor force statistics for Pinole, out of the total population over 16 years of age (15,988), 63.6% or 10,168 individuals are in the labor force, with 3.9% or 397 of them unemployed. The age group with the highest labor force participation rate is 35 to 44 years, with 88.4% or 2,409 individuals in the labor force. Within the labor force, the 16 to 19 years age range has the highest percentage of unemployed individuals, with 9.8% or 13 of them being unemployed.
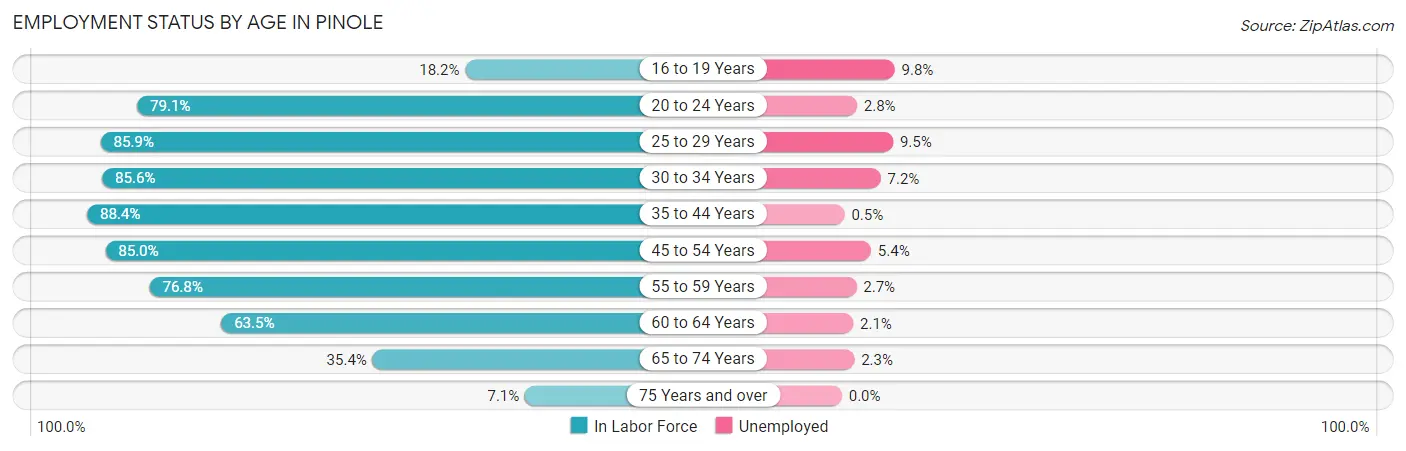
| Age Bracket | In Labor Force | Unemployed |
| 16 to 19 Years | 132 (18.2%) | 13 (9.8%) |
| 20 to 24 Years | 644 (79.1%) | 18 (2.8%) |
| 25 to 29 Years | 953 (85.9%) | 91 (9.5%) |
| 30 to 34 Years | 1,545 (85.6%) | 111 (7.2%) |
| 35 to 44 Years | 2,409 (88.4%) | 12 (0.5%) |
| 45 to 54 Years | 1,618 (85.0%) | 87 (5.4%) |
| 55 to 59 Years | 1,026 (76.8%) | 28 (2.7%) |
| 60 to 64 Years | 862 (63.5%) | 18 (2.1%) |
| 65 to 74 Years | 856 (35.4%) | 20 (2.3%) |
| 75 Years and over | 127 (7.1%) | 0 (0.0%) |
| Total | 10,168 (63.6%) | 397 (3.9%) |
Employment Status by Educational Attainment in Pinole
According to labor force statistics for Pinole, 82.2% of individuals (8,415) out of the total population between 25 and 64 years of age (10,237) are in the labor force, with 4.1% or 345 of them being unemployed. The group with the highest labor force participation rate are those with the educational attainment of bachelor's degree or higher, with 88.9% or 3,568 individuals in the labor force. Within the labor force, individuals with high school diploma education have the highest percentage of unemployment, with 8.2% or 123 of them being unemployed.
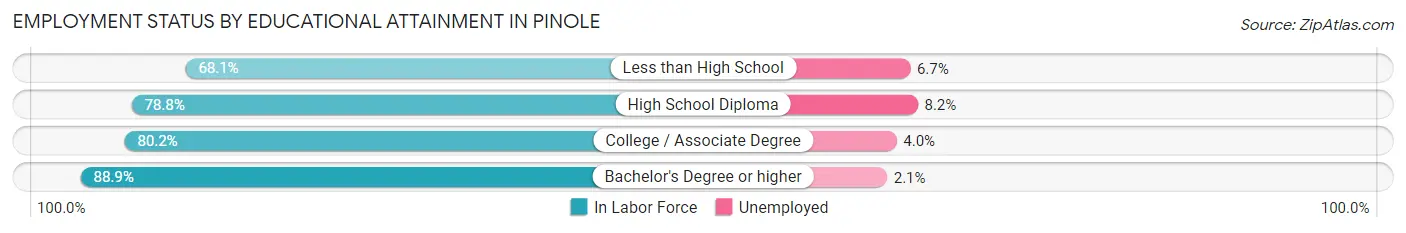
| Educational Attainment | In Labor Force | Unemployed |
| Less than High School | 660 (68.1%) | 65 (6.7%) |
| High School Diploma | 1,496 (78.8%) | 156 (8.2%) |
| College / Associate Degree | 2,692 (80.2%) | 134 (4.0%) |
| Bachelor's Degree or higher | 3,568 (88.9%) | 84 (2.1%) |
| Total | 8,415 (82.2%) | 420 (4.1%) |
Employment Occupations by Sex in Pinole
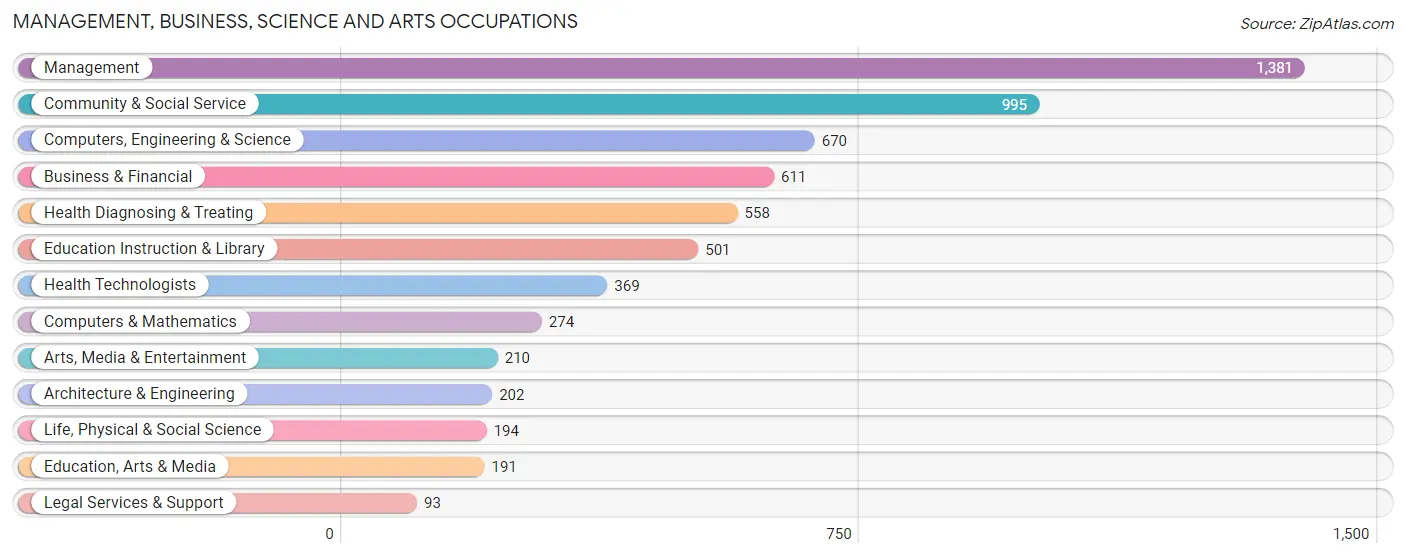
Management, Business, Science and Arts Occupations
The most common Management, Business, Science and Arts occupations in Pinole are Management (1,381 | 14.1%), Community & Social Service (995 | 10.2%), Computers, Engineering & Science (670 | 6.9%), Business & Financial (611 | 6.2%), and Health Diagnosing & Treating (558 | 5.7%).
Management, Business, Science and Arts Occupations by Sex
Within the Management, Business, Science and Arts occupations in Pinole, the most male-oriented occupations are Computers & Mathematics (97.5%), Architecture & Engineering (78.2%), and Computers, Engineering & Science (76.9%), while the most female-oriented occupations are Education, Arts & Media (95.8%), Health Diagnosing & Treating (86.4%), and Health Technologists (85.1%).
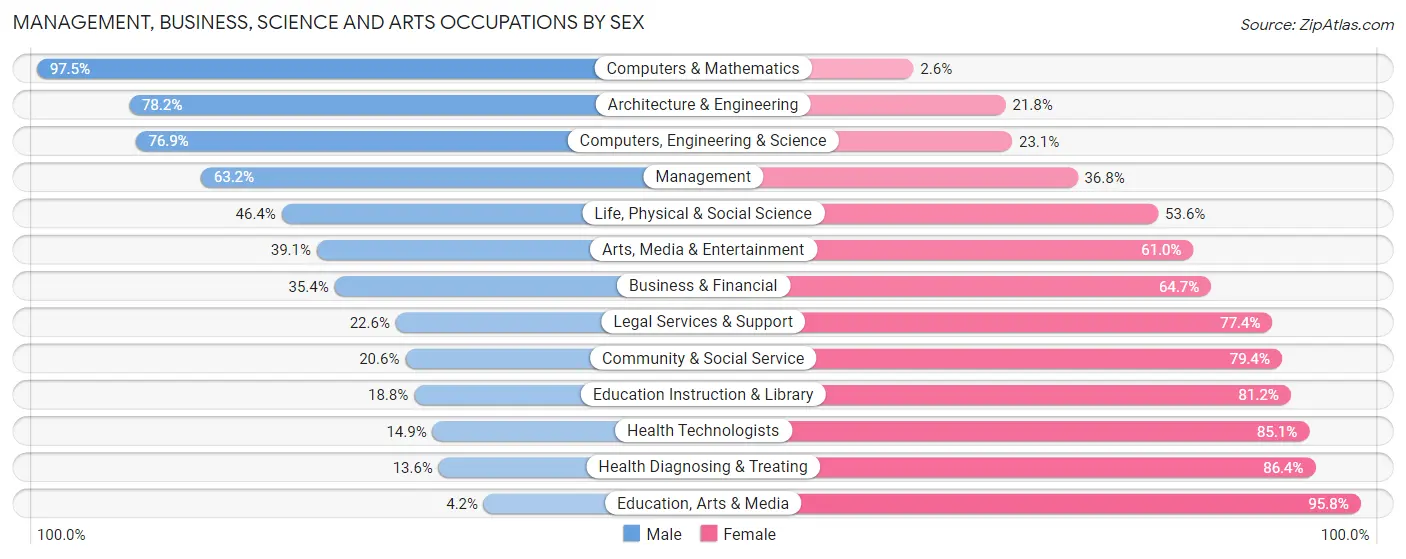
| Occupation | Male | Female |
| Management | 873 (63.2%) | 508 (36.8%) |
| Business & Financial | 216 (35.3%) | 395 (64.6%) |
| Computers, Engineering & Science | 515 (76.9%) | 155 (23.1%) |
| Computers & Mathematics | 267 (97.5%) | 7 (2.5%) |
| Architecture & Engineering | 158 (78.2%) | 44 (21.8%) |
| Life, Physical & Social Science | 90 (46.4%) | 104 (53.6%) |
| Community & Social Service | 205 (20.6%) | 790 (79.4%) |
| Education, Arts & Media | 8 (4.2%) | 183 (95.8%) |
| Legal Services & Support | 21 (22.6%) | 72 (77.4%) |
| Education Instruction & Library | 94 (18.8%) | 407 (81.2%) |
| Arts, Media & Entertainment | 82 (39.1%) | 128 (61.0%) |
| Health Diagnosing & Treating | 76 (13.6%) | 482 (86.4%) |
| Health Technologists | 55 (14.9%) | 314 (85.1%) |
| Total (Category) | 1,885 (44.7%) | 2,330 (55.3%) |
| Total (Overall) | 4,849 (49.6%) | 4,927 (50.4%) |
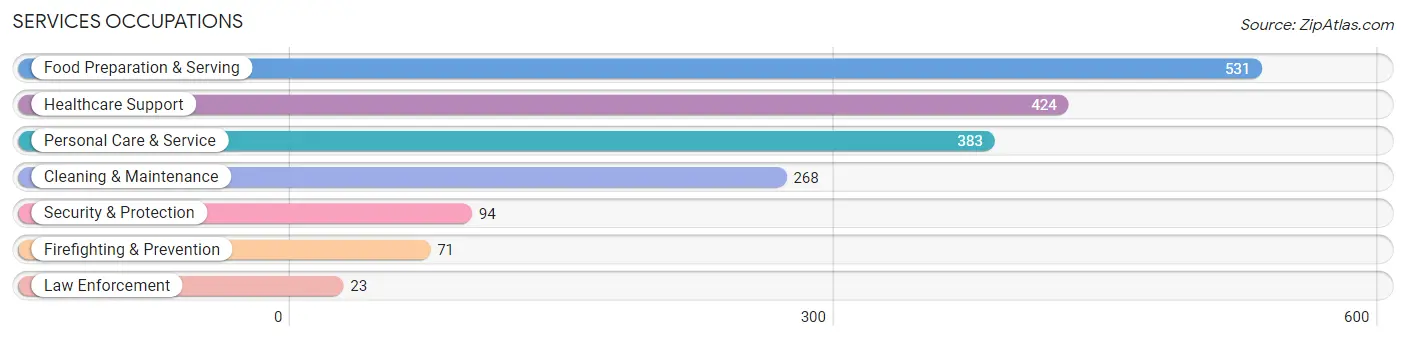
Services Occupations
The most common Services occupations in Pinole are Food Preparation & Serving (531 | 5.4%), Healthcare Support (424 | 4.3%), Personal Care & Service (383 | 3.9%), Cleaning & Maintenance (268 | 2.7%), and Security & Protection (94 | 1.0%).
Services Occupations by Sex
Within the Services occupations in Pinole, the most male-oriented occupations are Law Enforcement (100.0%), Security & Protection (84.0%), and Firefighting & Prevention (78.9%), while the most female-oriented occupations are Healthcare Support (92.2%), Personal Care & Service (72.6%), and Food Preparation & Serving (59.5%).
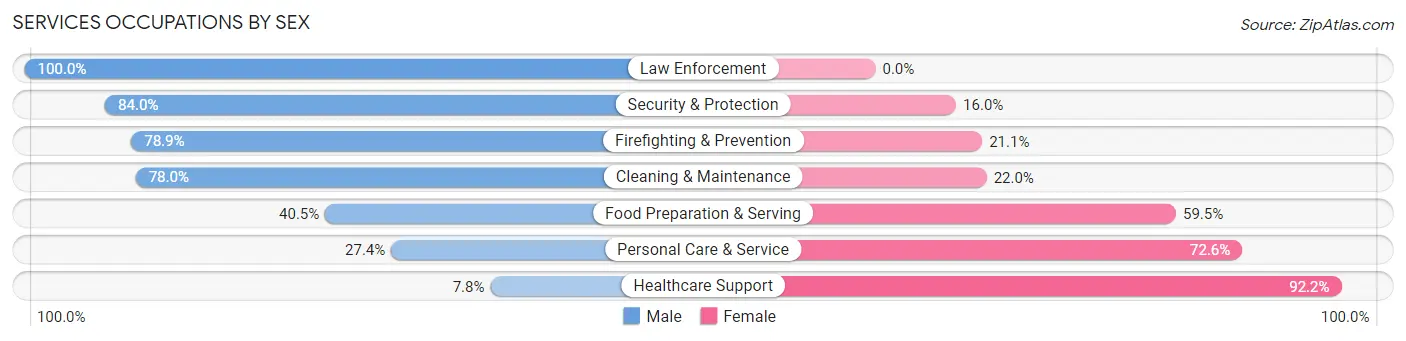
| Occupation | Male | Female |
| Healthcare Support | 33 (7.8%) | 391 (92.2%) |
| Security & Protection | 79 (84.0%) | 15 (16.0%) |
| Firefighting & Prevention | 56 (78.9%) | 15 (21.1%) |
| Law Enforcement | 23 (100.0%) | 0 (0.0%) |
| Food Preparation & Serving | 215 (40.5%) | 316 (59.5%) |
| Cleaning & Maintenance | 209 (78.0%) | 59 (22.0%) |
| Personal Care & Service | 105 (27.4%) | 278 (72.6%) |
| Total (Category) | 641 (37.7%) | 1,059 (62.3%) |
| Total (Overall) | 4,849 (49.6%) | 4,927 (50.4%) |
Sales and Office Occupations
The most common Sales and Office occupations in Pinole are Office & Administration (1,153 | 11.8%), and Sales & Related (1,143 | 11.7%).

Sales and Office Occupations by Sex
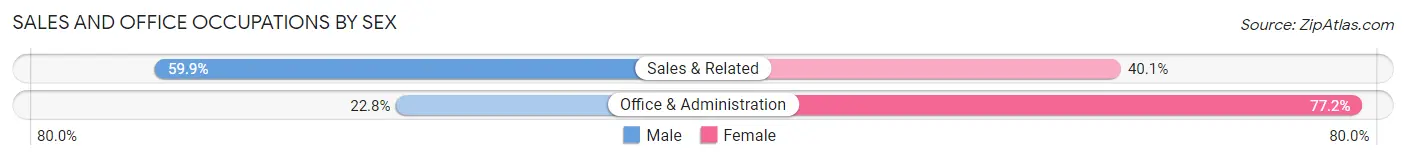
| Occupation | Male | Female |
| Sales & Related | 685 (59.9%) | 458 (40.1%) |
| Office & Administration | 263 (22.8%) | 890 (77.2%) |
| Total (Category) | 948 (41.3%) | 1,348 (58.7%) |
| Total (Overall) | 4,849 (49.6%) | 4,927 (50.4%) |
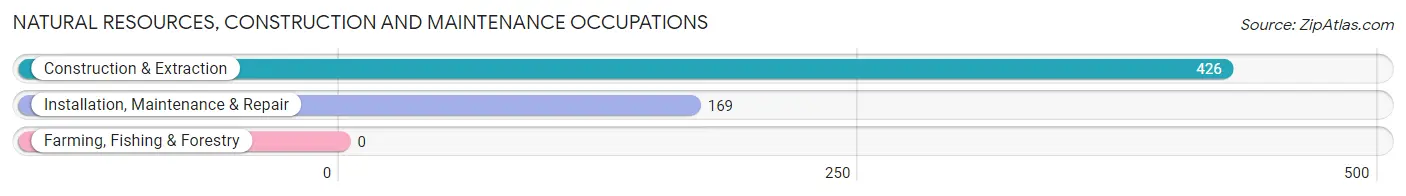
Natural Resources, Construction and Maintenance Occupations
The most common Natural Resources, Construction and Maintenance occupations in Pinole are Construction & Extraction (426 | 4.4%), and Installation, Maintenance & Repair (169 | 1.7%).
Natural Resources, Construction and Maintenance Occupations by Sex
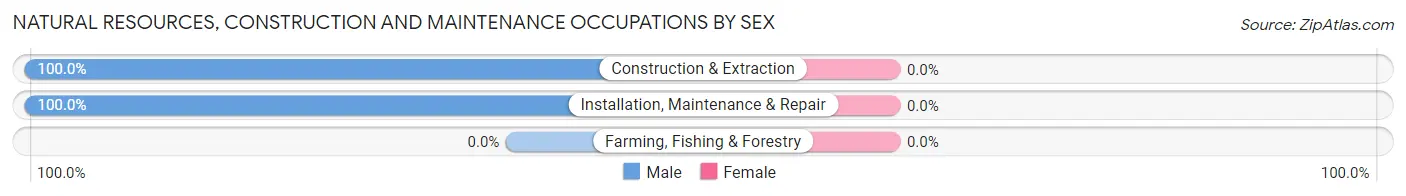
| Occupation | Male | Female |
| Farming, Fishing & Forestry | 0 (0.0%) | 0 (0.0%) |
| Construction & Extraction | 426 (100.0%) | 0 (0.0%) |
| Installation, Maintenance & Repair | 169 (100.0%) | 0 (0.0%) |
| Total (Category) | 595 (100.0%) | 0 (0.0%) |
| Total (Overall) | 4,849 (49.6%) | 4,927 (50.4%) |
Production, Transportation and Moving Occupations
The most common Production, Transportation and Moving occupations in Pinole are Transportation (376 | 3.8%), Production (349 | 3.6%), and Material Moving (245 | 2.5%).
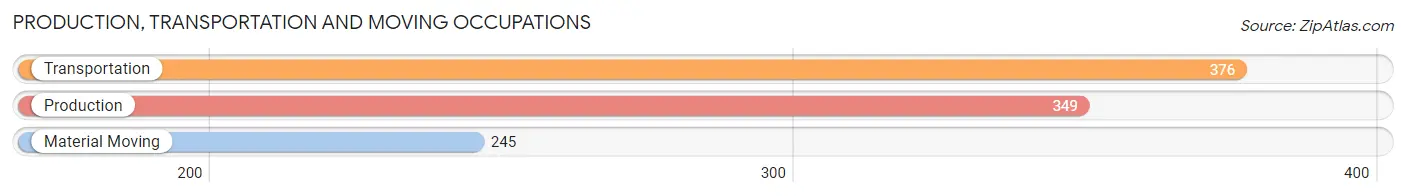
Production, Transportation and Moving Occupations by Sex
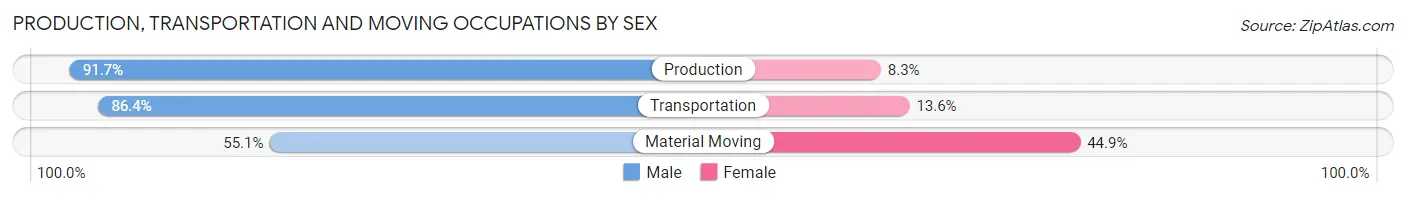
| Occupation | Male | Female |
| Production | 320 (91.7%) | 29 (8.3%) |
| Transportation | 325 (86.4%) | 51 (13.6%) |
| Material Moving | 135 (55.1%) | 110 (44.9%) |
| Total (Category) | 780 (80.4%) | 190 (19.6%) |
| Total (Overall) | 4,849 (49.6%) | 4,927 (50.4%) |
Employment Industries by Sex in Pinole
Employment Industries in Pinole
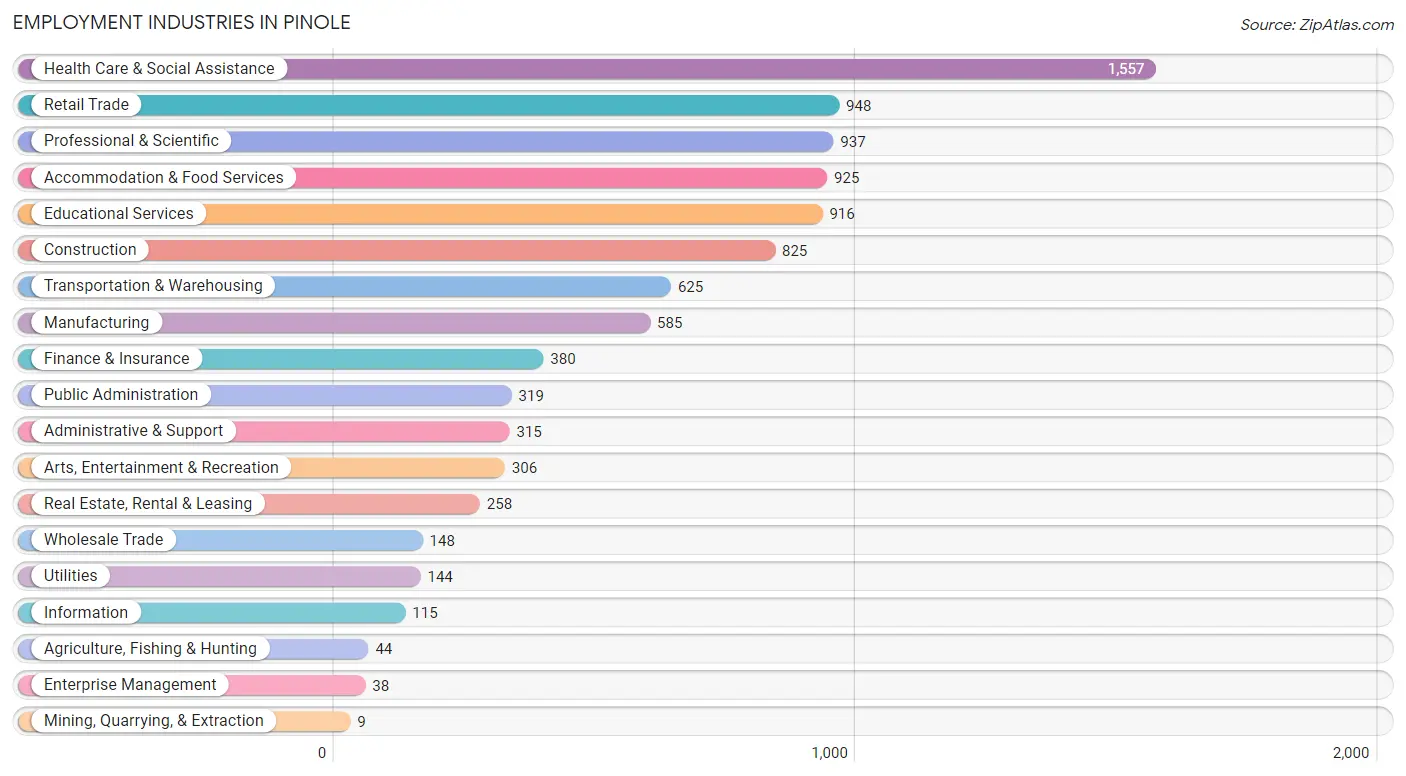
The major employment industries in Pinole include Health Care & Social Assistance (1,557 | 15.9%), Retail Trade (948 | 9.7%), Professional & Scientific (937 | 9.6%), Accommodation & Food Services (925 | 9.5%), and Educational Services (916 | 9.4%).
Employment Industries by Sex in Pinole
The Pinole industries that see more men than women are Construction (92.4%), Manufacturing (83.3%), and Transportation & Warehousing (71.8%), whereas the industries that tend to have a higher number of women are Health Care & Social Assistance (87.7%), Educational Services (84.3%), and Information (83.5%).
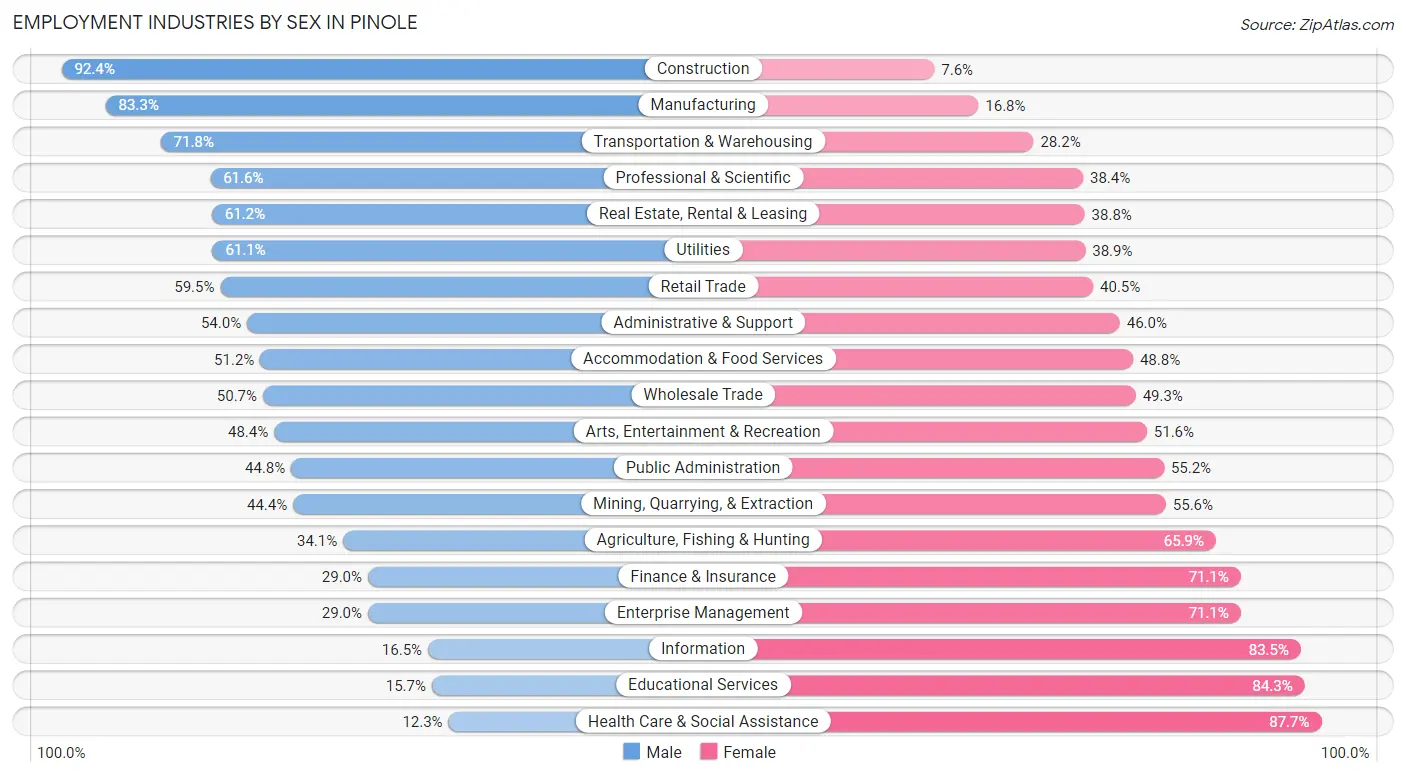
| Industry | Male | Female |
| Agriculture, Fishing & Hunting | 15 (34.1%) | 29 (65.9%) |
| Mining, Quarrying, & Extraction | 4 (44.4%) | 5 (55.6%) |
| Construction | 762 (92.4%) | 63 (7.6%) |
| Manufacturing | 487 (83.3%) | 98 (16.8%) |
| Wholesale Trade | 75 (50.7%) | 73 (49.3%) |
| Retail Trade | 564 (59.5%) | 384 (40.5%) |
| Transportation & Warehousing | 449 (71.8%) | 176 (28.2%) |
| Utilities | 88 (61.1%) | 56 (38.9%) |
| Information | 19 (16.5%) | 96 (83.5%) |
| Finance & Insurance | 110 (28.9%) | 270 (71.1%) |
| Real Estate, Rental & Leasing | 158 (61.2%) | 100 (38.8%) |
| Professional & Scientific | 577 (61.6%) | 360 (38.4%) |
| Enterprise Management | 11 (28.9%) | 27 (71.1%) |
| Administrative & Support | 170 (54.0%) | 145 (46.0%) |
| Educational Services | 144 (15.7%) | 772 (84.3%) |
| Health Care & Social Assistance | 191 (12.3%) | 1,366 (87.7%) |
| Arts, Entertainment & Recreation | 148 (48.4%) | 158 (51.6%) |
| Accommodation & Food Services | 474 (51.2%) | 451 (48.8%) |
| Public Administration | 143 (44.8%) | 176 (55.2%) |
| Total | 4,849 (49.6%) | 4,927 (50.4%) |
Education in Pinole
School Enrollment in Pinole
The most common levels of schooling among the 3,899 students in Pinole are college / undergraduate (998 | 25.6%), high school (877 | 22.5%), and middle school (733 | 18.8%).
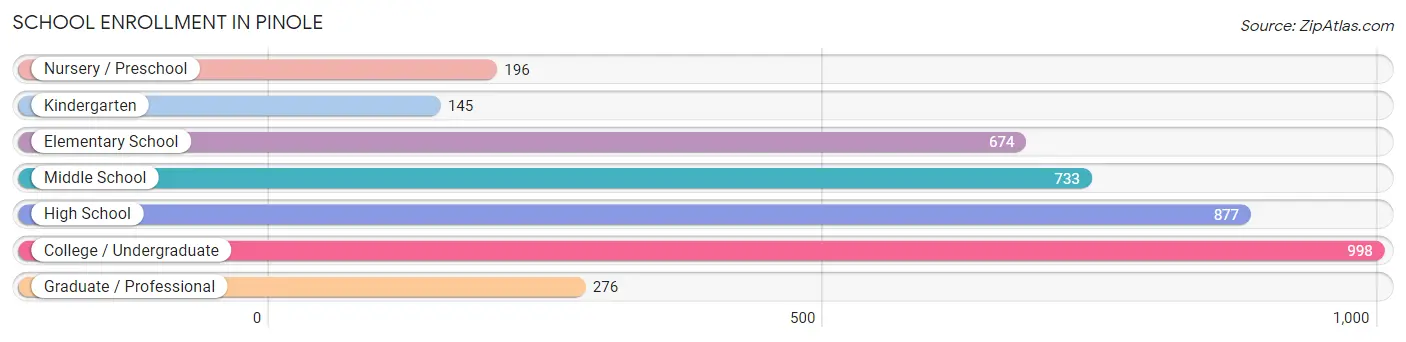
| School Level | # Students | % Students |
| Nursery / Preschool | 196 | 5.0% |
| Kindergarten | 145 | 3.7% |
| Elementary School | 674 | 17.3% |
| Middle School | 733 | 18.8% |
| High School | 877 | 22.5% |
| College / Undergraduate | 998 | 25.6% |
| Graduate / Professional | 276 | 7.1% |
| Total | 3,899 | 100.0% |
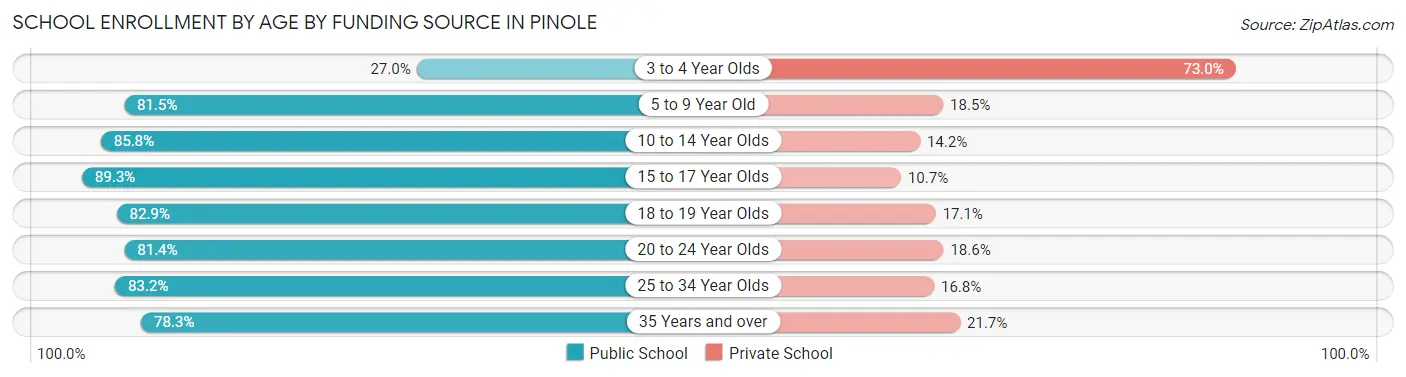
School Enrollment by Age by Funding Source in Pinole
Out of a total of 3,899 students who are enrolled in schools in Pinole, 733 (18.8%) attend a private institution, while the remaining 3,166 (81.2%) are enrolled in public schools. The age group of 3 to 4 year olds has the highest likelihood of being enrolled in private schools, with 127 (73.0% in the age bracket) enrolled. Conversely, the age group of 15 to 17 year olds has the lowest likelihood of being enrolled in a private school, with 460 (89.3% in the age bracket) attending a public institution.
| Age Bracket | Public School | Private School |
| 3 to 4 Year Olds | 47 (27.0%) | 127 (73.0%) |
| 5 to 9 Year Old | 633 (81.5%) | 144 (18.5%) |
| 10 to 14 Year Olds | 845 (85.8%) | 140 (14.2%) |
| 15 to 17 Year Olds | 460 (89.3%) | 55 (10.7%) |
| 18 to 19 Year Olds | 174 (82.9%) | 36 (17.1%) |
| 20 to 24 Year Olds | 346 (81.4%) | 79 (18.6%) |
| 25 to 34 Year Olds | 400 (83.2%) | 81 (16.8%) |
| 35 Years and over | 260 (78.3%) | 72 (21.7%) |
| Total | 3,166 (81.2%) | 733 (18.8%) |
Educational Attainment by Field of Study in Pinole
Business (940 | 16.4%), science & technology (776 | 13.5%), social sciences (651 | 11.4%), psychology (528 | 9.2%), and literature & languages (394 | 6.9%) are the most common fields of study among 5,736 individuals in Pinole who have obtained a bachelor's degree or higher.
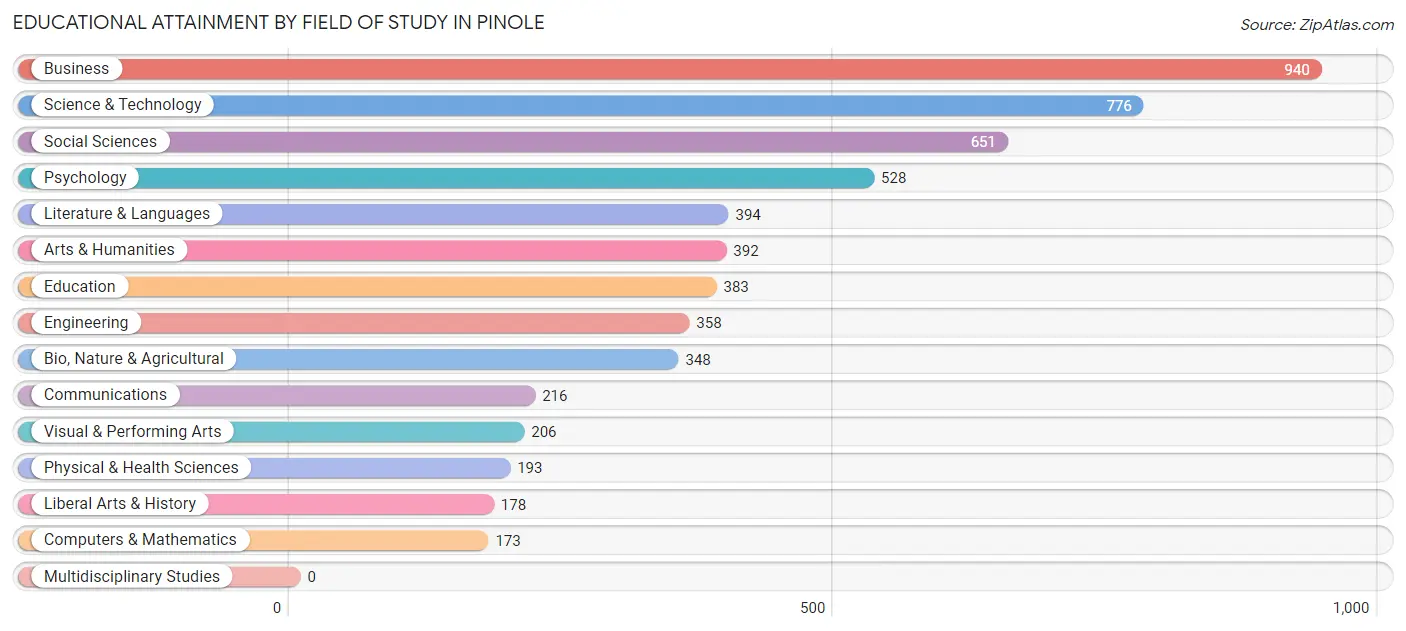
| Field of Study | # Graduates | % Graduates |
| Computers & Mathematics | 173 | 3.0% |
| Bio, Nature & Agricultural | 348 | 6.1% |
| Physical & Health Sciences | 193 | 3.4% |
| Psychology | 528 | 9.2% |
| Social Sciences | 651 | 11.4% |
| Engineering | 358 | 6.2% |
| Multidisciplinary Studies | 0 | 0.0% |
| Science & Technology | 776 | 13.5% |
| Business | 940 | 16.4% |
| Education | 383 | 6.7% |
| Literature & Languages | 394 | 6.9% |
| Liberal Arts & History | 178 | 3.1% |
| Visual & Performing Arts | 206 | 3.6% |
| Communications | 216 | 3.8% |
| Arts & Humanities | 392 | 6.8% |
| Total | 5,736 | 100.0% |
Transportation & Commute in Pinole
Vehicle Availability by Sex in Pinole
The most prevalent vehicle ownership categories in Pinole are males with 2 vehicles (1,640, accounting for 34.4%) and females with 2 vehicles (1,527, making up 34.5%).
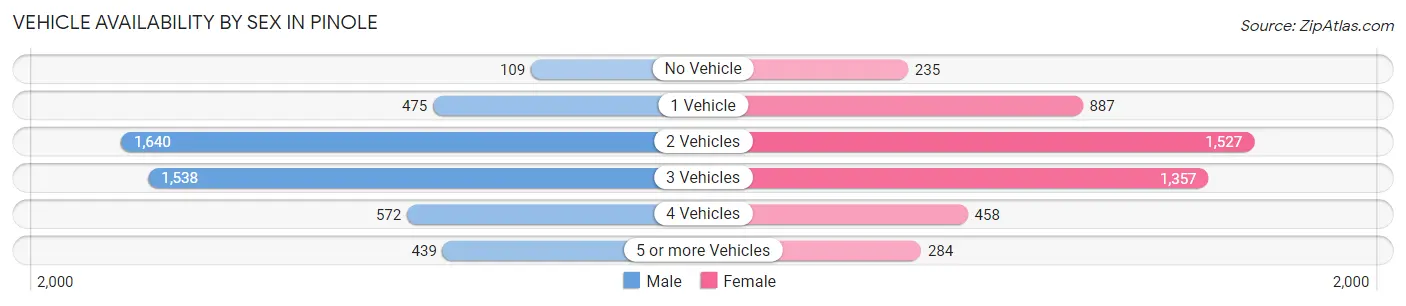
| Vehicles Available | Male | Female |
| No Vehicle | 109 (2.3%) | 235 (5.0%) |
| 1 Vehicle | 475 (10.0%) | 887 (18.7%) |
| 2 Vehicles | 1,640 (34.4%) | 1,527 (32.2%) |
| 3 Vehicles | 1,538 (32.2%) | 1,357 (28.6%) |
| 4 Vehicles | 572 (12.0%) | 458 (9.7%) |
| 5 or more Vehicles | 439 (9.2%) | 284 (6.0%) |
| Total | 4,773 (100.0%) | 4,748 (100.0%) |
Commute Time in Pinole
The most frequently occuring commute durations in Pinole are 45 to 59 minutes (1,262 commuters, 14.9%), 30 to 34 minutes (1,251 commuters, 14.8%), and 60 to 89 minutes (1,147 commuters, 13.6%).
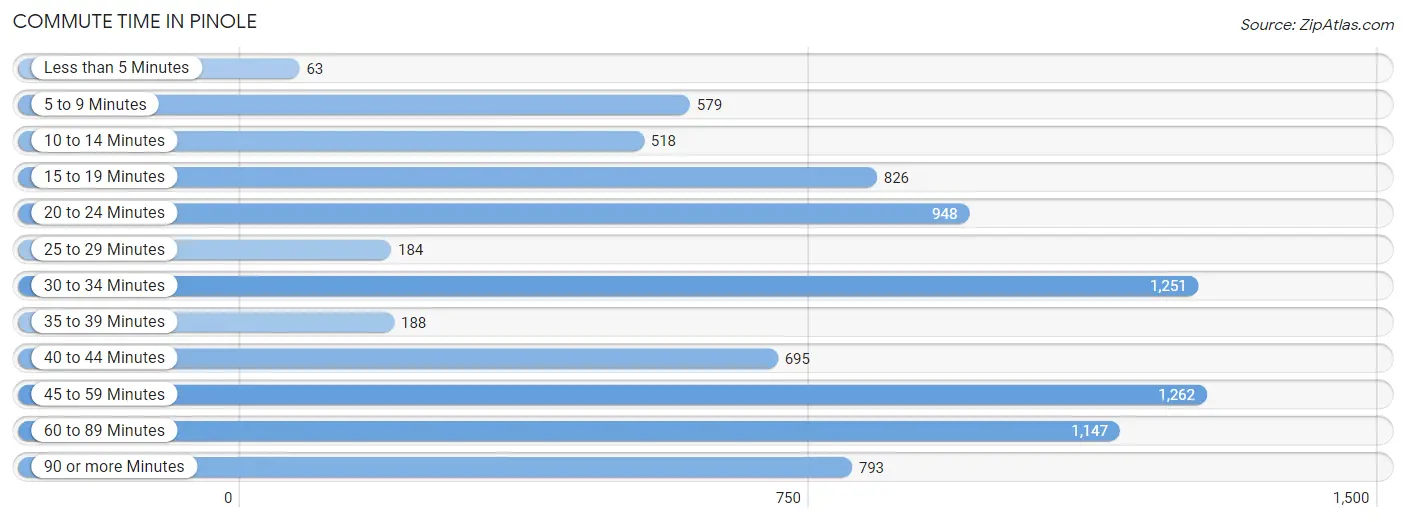
| Commute Time | # Commuters | % Commuters |
| Less than 5 Minutes | 63 | 0.7% |
| 5 to 9 Minutes | 579 | 6.9% |
| 10 to 14 Minutes | 518 | 6.1% |
| 15 to 19 Minutes | 826 | 9.8% |
| 20 to 24 Minutes | 948 | 11.2% |
| 25 to 29 Minutes | 184 | 2.2% |
| 30 to 34 Minutes | 1,251 | 14.8% |
| 35 to 39 Minutes | 188 | 2.2% |
| 40 to 44 Minutes | 695 | 8.2% |
| 45 to 59 Minutes | 1,262 | 14.9% |
| 60 to 89 Minutes | 1,147 | 13.6% |
| 90 or more Minutes | 793 | 9.4% |
Commute Time by Sex in Pinole
The most common commute times in Pinole are 45 to 59 minutes (743 commuters, 17.0%) for males and 30 to 34 minutes (721 commuters, 17.6%) for females.
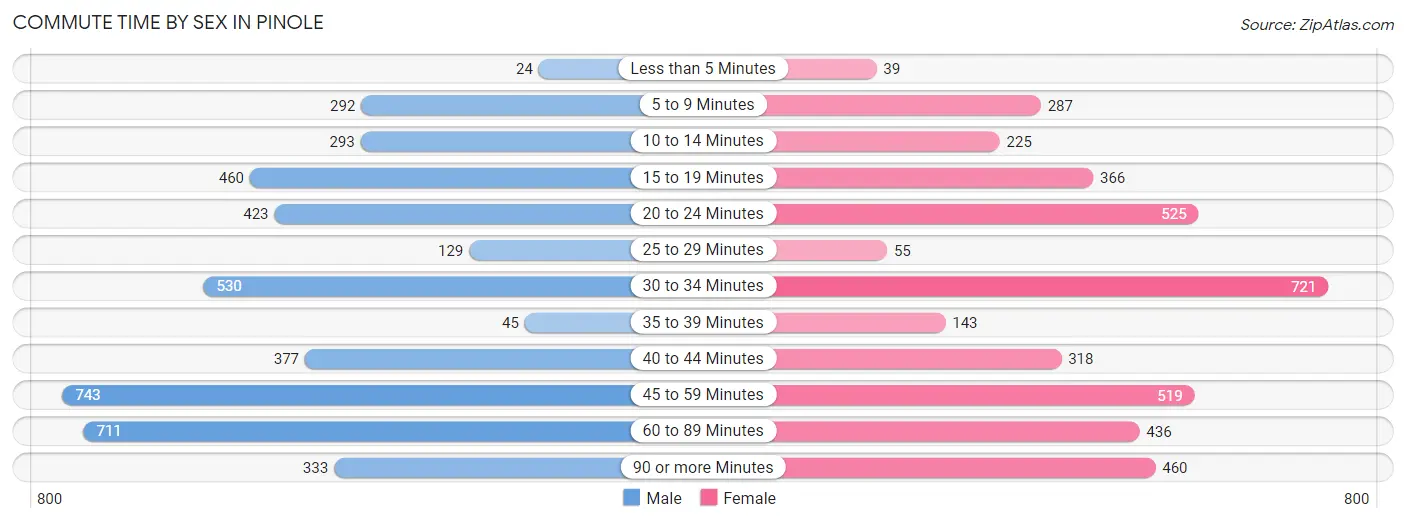
| Commute Time | Male | Female |
| Less than 5 Minutes | 24 (0.5%) | 39 (0.9%) |
| 5 to 9 Minutes | 292 (6.7%) | 287 (7.0%) |
| 10 to 14 Minutes | 293 (6.7%) | 225 (5.5%) |
| 15 to 19 Minutes | 460 (10.5%) | 366 (8.9%) |
| 20 to 24 Minutes | 423 (9.7%) | 525 (12.8%) |
| 25 to 29 Minutes | 129 (3.0%) | 55 (1.3%) |
| 30 to 34 Minutes | 530 (12.2%) | 721 (17.6%) |
| 35 to 39 Minutes | 45 (1.0%) | 143 (3.5%) |
| 40 to 44 Minutes | 377 (8.6%) | 318 (7.8%) |
| 45 to 59 Minutes | 743 (17.0%) | 519 (12.7%) |
| 60 to 89 Minutes | 711 (16.3%) | 436 (10.6%) |
| 90 or more Minutes | 333 (7.6%) | 460 (11.2%) |
Time of Departure to Work by Sex in Pinole
The most frequent times of departure to work in Pinole are 6:00 AM to 6:29 AM (611, 14.0%) for males and 7:30 AM to 7:59 AM (679, 16.6%) for females.
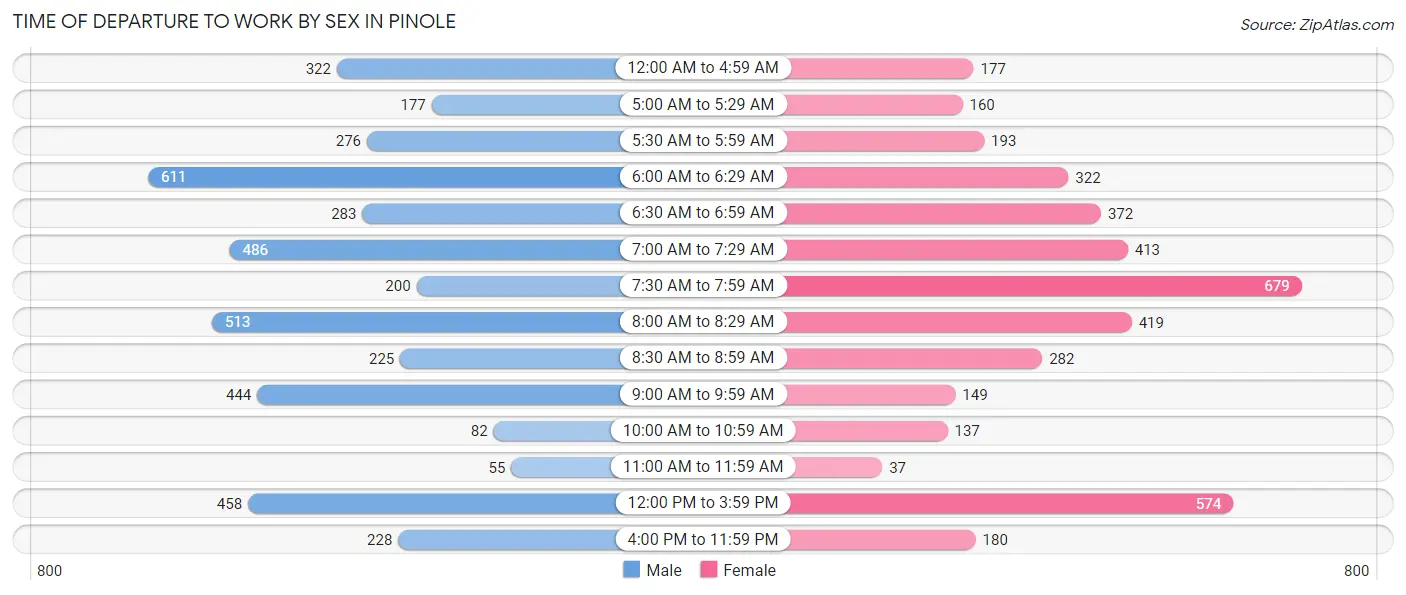
| Time of Departure | Male | Female |
| 12:00 AM to 4:59 AM | 322 (7.4%) | 177 (4.3%) |
| 5:00 AM to 5:29 AM | 177 (4.1%) | 160 (3.9%) |
| 5:30 AM to 5:59 AM | 276 (6.3%) | 193 (4.7%) |
| 6:00 AM to 6:29 AM | 611 (14.0%) | 322 (7.9%) |
| 6:30 AM to 6:59 AM | 283 (6.5%) | 372 (9.1%) |
| 7:00 AM to 7:29 AM | 486 (11.2%) | 413 (10.1%) |
| 7:30 AM to 7:59 AM | 200 (4.6%) | 679 (16.6%) |
| 8:00 AM to 8:29 AM | 513 (11.8%) | 419 (10.2%) |
| 8:30 AM to 8:59 AM | 225 (5.2%) | 282 (6.9%) |
| 9:00 AM to 9:59 AM | 444 (10.2%) | 149 (3.6%) |
| 10:00 AM to 10:59 AM | 82 (1.9%) | 137 (3.4%) |
| 11:00 AM to 11:59 AM | 55 (1.3%) | 37 (0.9%) |
| 12:00 PM to 3:59 PM | 458 (10.5%) | 574 (14.0%) |
| 4:00 PM to 11:59 PM | 228 (5.2%) | 180 (4.4%) |
| Total | 4,360 (100.0%) | 4,094 (100.0%) |
Housing Occupancy in Pinole
Occupancy by Ownership in Pinole
Of the total 6,784 dwellings in Pinole, owner-occupied units account for 4,886 (72.0%), while renter-occupied units make up 1,898 (28.0%).
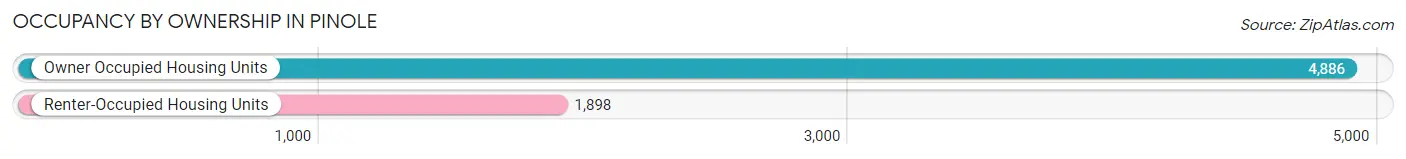
| Occupancy | # Housing Units | % Housing Units |
| Owner Occupied Housing Units | 4,886 | 72.0% |
| Renter-Occupied Housing Units | 1,898 | 28.0% |
| Total Occupied Housing Units | 6,784 | 100.0% |
Occupancy by Household Size in Pinole
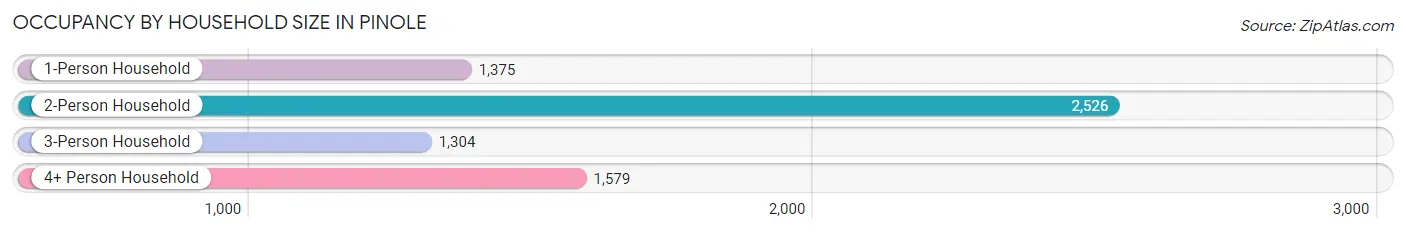
| Household Size | # Housing Units | % Housing Units |
| 1-Person Household | 1,375 | 20.3% |
| 2-Person Household | 2,526 | 37.2% |
| 3-Person Household | 1,304 | 19.2% |
| 4+ Person Household | 1,579 | 23.3% |
| Total Housing Units | 6,784 | 100.0% |
Occupancy by Ownership by Household Size in Pinole
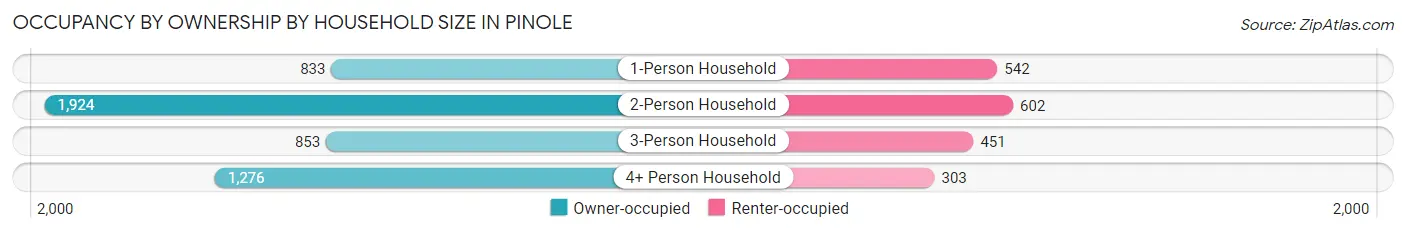
| Household Size | Owner-occupied | Renter-occupied |
| 1-Person Household | 833 (60.6%) | 542 (39.4%) |
| 2-Person Household | 1,924 (76.2%) | 602 (23.8%) |
| 3-Person Household | 853 (65.4%) | 451 (34.6%) |
| 4+ Person Household | 1,276 (80.8%) | 303 (19.2%) |
| Total Housing Units | 4,886 (72.0%) | 1,898 (28.0%) |
Occupancy by Educational Attainment in Pinole
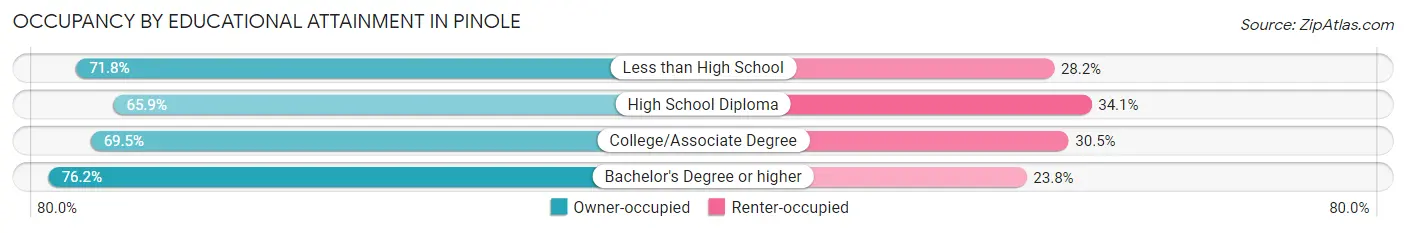
| Household Size | Owner-occupied | Renter-occupied |
| Less than High School | 410 (71.8%) | 161 (28.2%) |
| High School Diploma | 668 (65.9%) | 346 (34.1%) |
| College/Associate Degree | 1,587 (69.5%) | 696 (30.5%) |
| Bachelor's Degree or higher | 2,221 (76.2%) | 695 (23.8%) |
Occupancy by Age of Householder in Pinole
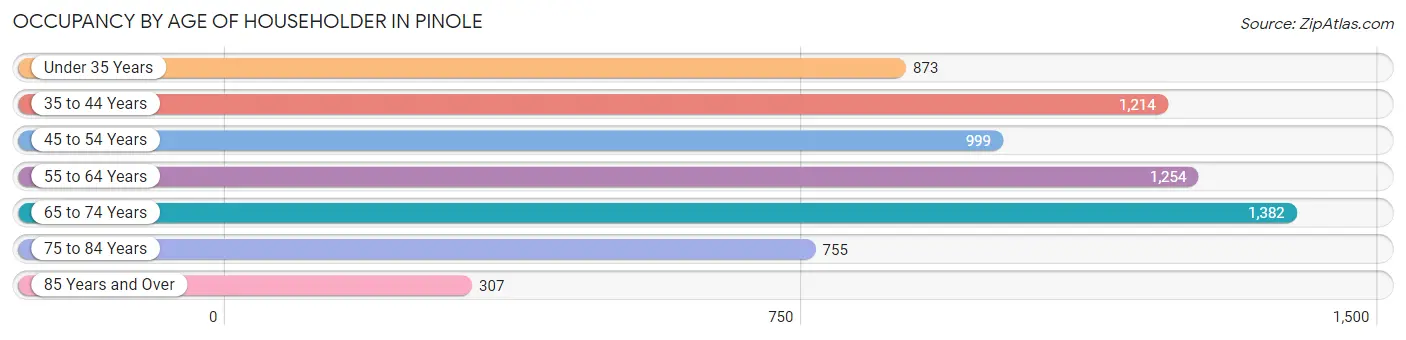
| Age Bracket | # Households | % Households |
| Under 35 Years | 873 | 12.9% |
| 35 to 44 Years | 1,214 | 17.9% |
| 45 to 54 Years | 999 | 14.7% |
| 55 to 64 Years | 1,254 | 18.5% |
| 65 to 74 Years | 1,382 | 20.4% |
| 75 to 84 Years | 755 | 11.1% |
| 85 Years and Over | 307 | 4.5% |
| Total | 6,784 | 100.0% |
Housing Finances in Pinole
Median Income by Occupancy in Pinole
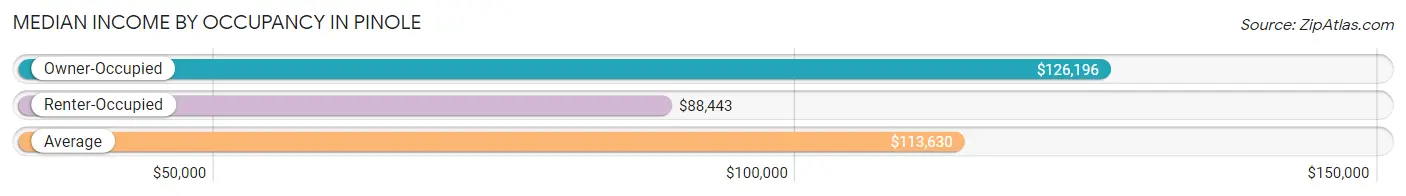
| Occupancy Type | # Households | Median Income |
| Owner-Occupied | 4,886 (72.0%) | $126,196 |
| Renter-Occupied | 1,898 (28.0%) | $88,443 |
| Average | 6,784 (100.0%) | $113,630 |
Occupancy by Householder Income Bracket in Pinole
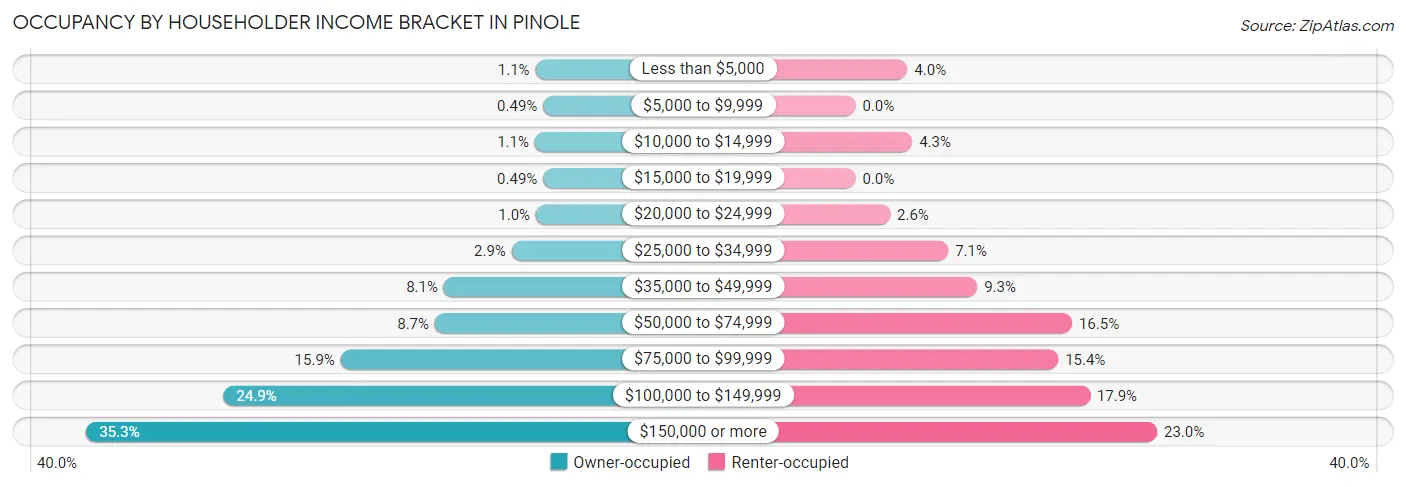
| Income Bracket | Owner-occupied | Renter-occupied |
| Less than $5,000 | 53 (1.1%) | 75 (4.0%) |
| $5,000 to $9,999 | 24 (0.5%) | 0 (0.0%) |
| $10,000 to $14,999 | 55 (1.1%) | 82 (4.3%) |
| $15,000 to $19,999 | 24 (0.5%) | 0 (0.0%) |
| $20,000 to $24,999 | 51 (1.0%) | 50 (2.6%) |
| $25,000 to $34,999 | 141 (2.9%) | 134 (7.1%) |
| $35,000 to $49,999 | 394 (8.1%) | 176 (9.3%) |
| $50,000 to $74,999 | 427 (8.7%) | 313 (16.5%) |
| $75,000 to $99,999 | 778 (15.9%) | 293 (15.4%) |
| $100,000 to $149,999 | 1,214 (24.8%) | 339 (17.9%) |
| $150,000 or more | 1,725 (35.3%) | 436 (23.0%) |
| Total | 4,886 (100.0%) | 1,898 (100.0%) |
Monthly Housing Cost Tiers in Pinole
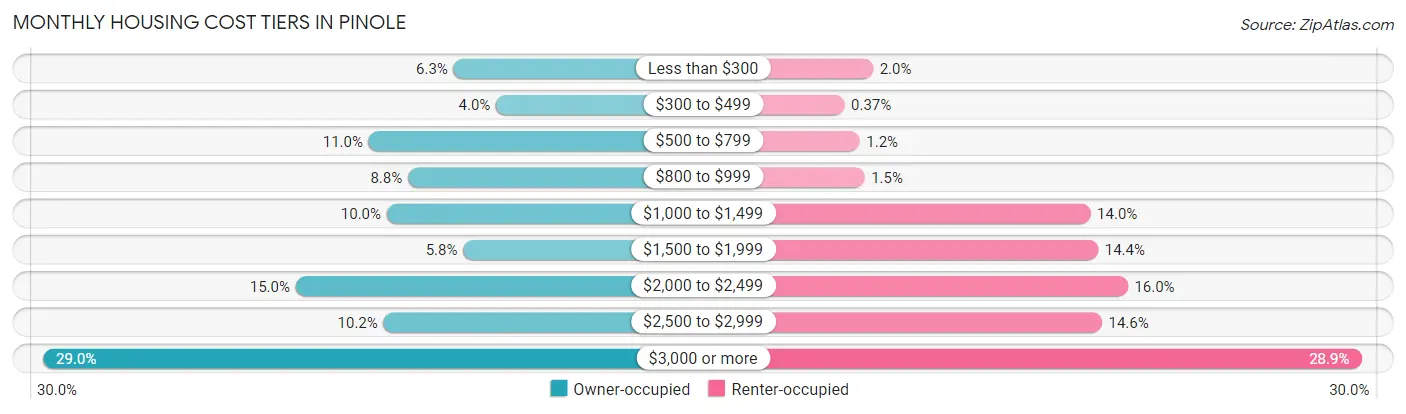
| Monthly Cost | Owner-occupied | Renter-occupied |
| Less than $300 | 308 (6.3%) | 37 (1.9%) |
| $300 to $499 | 193 (4.0%) | 7 (0.4%) |
| $500 to $799 | 537 (11.0%) | 23 (1.2%) |
| $800 to $999 | 431 (8.8%) | 28 (1.5%) |
| $1,000 to $1,499 | 488 (10.0%) | 265 (14.0%) |
| $1,500 to $1,999 | 282 (5.8%) | 273 (14.4%) |
| $2,000 to $2,499 | 734 (15.0%) | 304 (16.0%) |
| $2,500 to $2,999 | 497 (10.2%) | 277 (14.6%) |
| $3,000 or more | 1,416 (29.0%) | 549 (28.9%) |
| Total | 4,886 (100.0%) | 1,898 (100.0%) |
Physical Housing Characteristics in Pinole
Housing Structures in Pinole
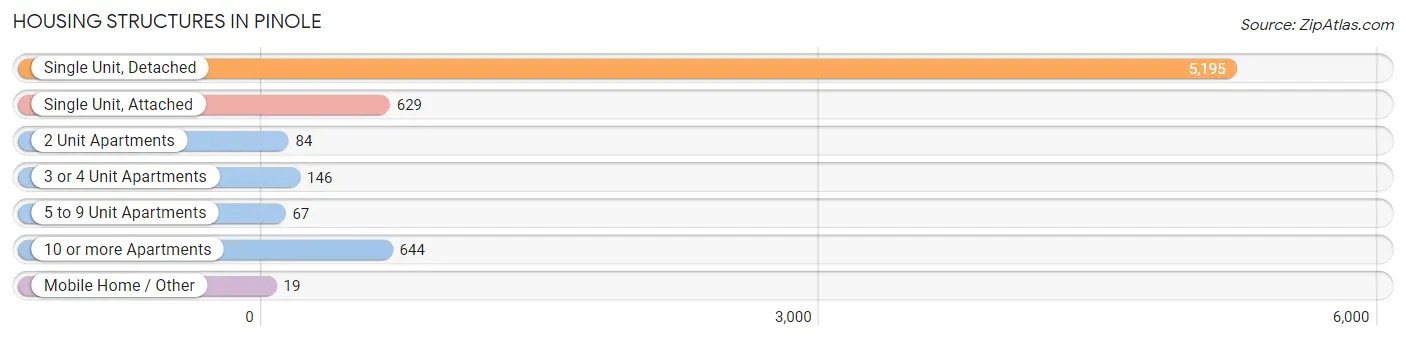
| Structure Type | # Housing Units | % Housing Units |
| Single Unit, Detached | 5,195 | 76.6% |
| Single Unit, Attached | 629 | 9.3% |
| 2 Unit Apartments | 84 | 1.2% |
| 3 or 4 Unit Apartments | 146 | 2.1% |
| 5 to 9 Unit Apartments | 67 | 1.0% |
| 10 or more Apartments | 644 | 9.5% |
| Mobile Home / Other | 19 | 0.3% |
| Total | 6,784 | 100.0% |
Housing Structures by Occupancy in Pinole
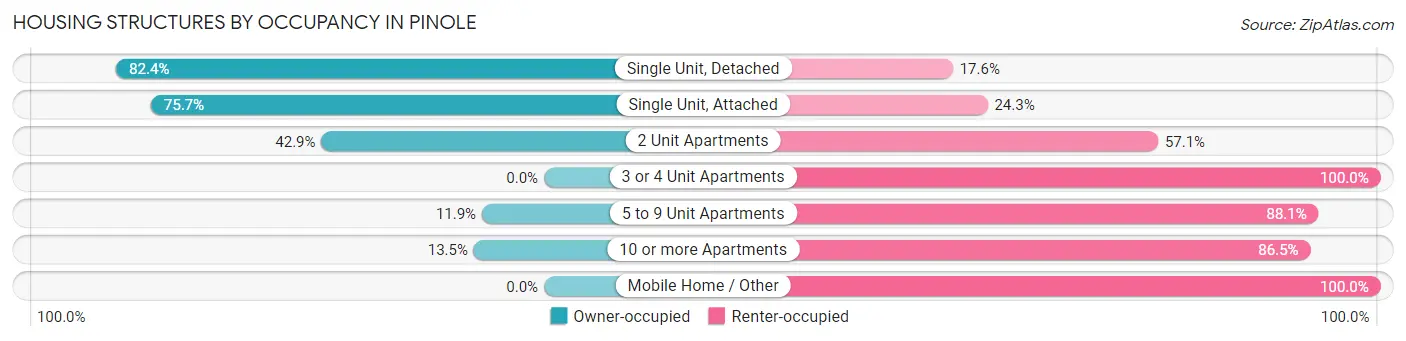
| Structure Type | Owner-occupied | Renter-occupied |
| Single Unit, Detached | 4,279 (82.4%) | 916 (17.6%) |
| Single Unit, Attached | 476 (75.7%) | 153 (24.3%) |
| 2 Unit Apartments | 36 (42.9%) | 48 (57.1%) |
| 3 or 4 Unit Apartments | 0 (0.0%) | 146 (100.0%) |
| 5 to 9 Unit Apartments | 8 (11.9%) | 59 (88.1%) |
| 10 or more Apartments | 87 (13.5%) | 557 (86.5%) |
| Mobile Home / Other | 0 (0.0%) | 19 (100.0%) |
| Total | 4,886 (72.0%) | 1,898 (28.0%) |
Housing Structures by Number of Rooms in Pinole
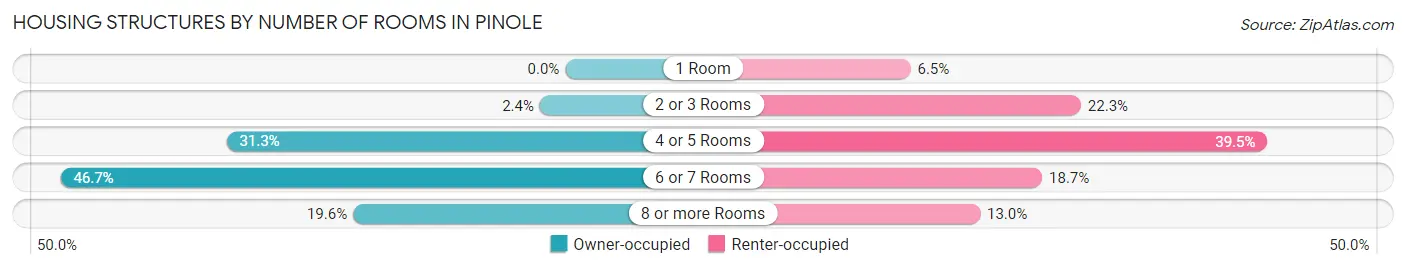
| Number of Rooms | Owner-occupied | Renter-occupied |
| 1 Room | 0 (0.0%) | 124 (6.5%) |
| 2 or 3 Rooms | 115 (2.4%) | 423 (22.3%) |
| 4 or 5 Rooms | 1,531 (31.3%) | 750 (39.5%) |
| 6 or 7 Rooms | 2,281 (46.7%) | 355 (18.7%) |
| 8 or more Rooms | 959 (19.6%) | 246 (13.0%) |
| Total | 4,886 (100.0%) | 1,898 (100.0%) |
Housing Structure by Heating Type in Pinole
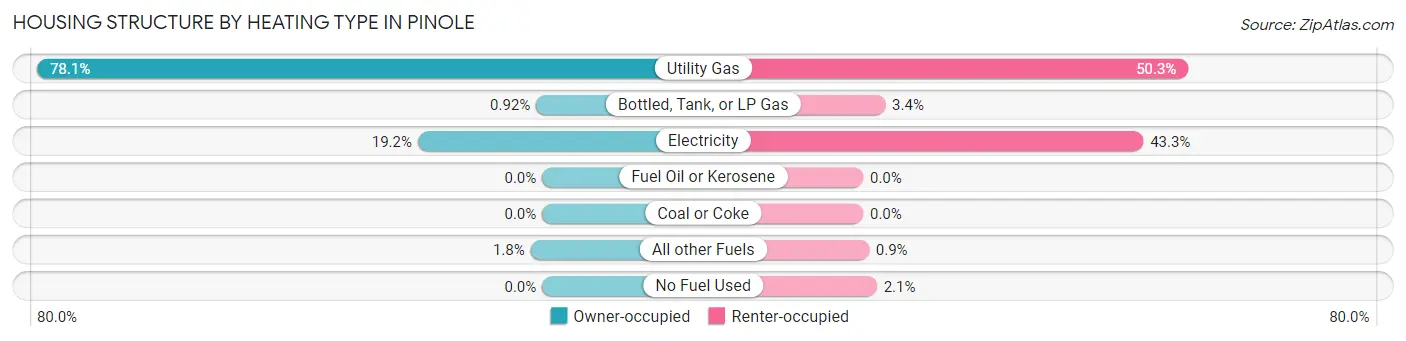
| Heating Type | Owner-occupied | Renter-occupied |
| Utility Gas | 3,815 (78.1%) | 954 (50.3%) |
| Bottled, Tank, or LP Gas | 45 (0.9%) | 65 (3.4%) |
| Electricity | 939 (19.2%) | 822 (43.3%) |
| Fuel Oil or Kerosene | 0 (0.0%) | 0 (0.0%) |
| Coal or Coke | 0 (0.0%) | 0 (0.0%) |
| All other Fuels | 87 (1.8%) | 17 (0.9%) |
| No Fuel Used | 0 (0.0%) | 40 (2.1%) |
| Total | 4,886 (100.0%) | 1,898 (100.0%) |
Household Vehicle Usage in Pinole
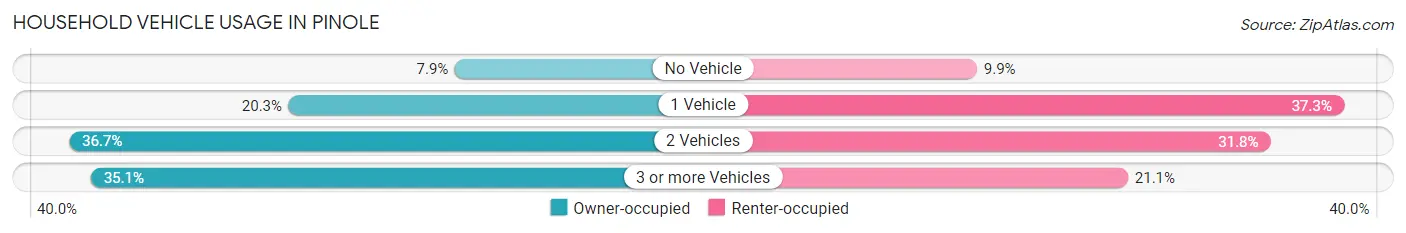
| Vehicles per Household | Owner-occupied | Renter-occupied |
| No Vehicle | 387 (7.9%) | 187 (9.9%) |
| 1 Vehicle | 994 (20.3%) | 707 (37.2%) |
| 2 Vehicles | 1,792 (36.7%) | 603 (31.8%) |
| 3 or more Vehicles | 1,713 (35.1%) | 401 (21.1%) |
| Total | 4,886 (100.0%) | 1,898 (100.0%) |
Real Estate & Mortgages in Pinole
Real Estate and Mortgage Overview in Pinole
| Characteristic | Without Mortgage | With Mortgage |
| Housing Units | 1,644 | 3,242 |
| Median Property Value | $623,500 | $685,200 |
| Median Household Income | $98,252 | $1,378 |
| Monthly Housing Costs | $741 | $1,416 |
| Real Estate Taxes | $3,796 | $120 |
Property Value by Mortgage Status in Pinole
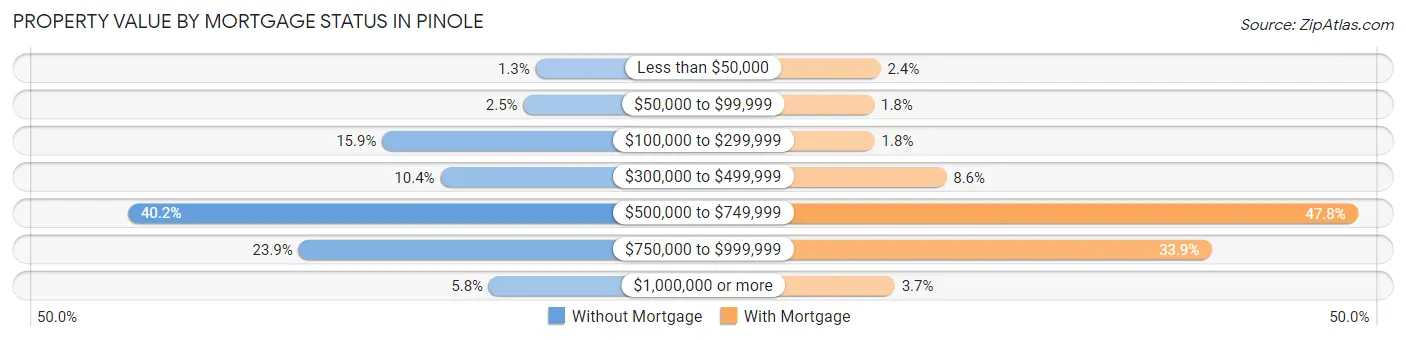
| Property Value | Without Mortgage | With Mortgage |
| Less than $50,000 | 22 (1.3%) | 77 (2.4%) |
| $50,000 to $99,999 | 41 (2.5%) | 57 (1.8%) |
| $100,000 to $299,999 | 262 (15.9%) | 59 (1.8%) |
| $300,000 to $499,999 | 171 (10.4%) | 280 (8.6%) |
| $500,000 to $749,999 | 660 (40.2%) | 1,550 (47.8%) |
| $750,000 to $999,999 | 393 (23.9%) | 1,098 (33.9%) |
| $1,000,000 or more | 95 (5.8%) | 121 (3.7%) |
| Total | 1,644 (100.0%) | 3,242 (100.0%) |
Household Income by Mortgage Status in Pinole
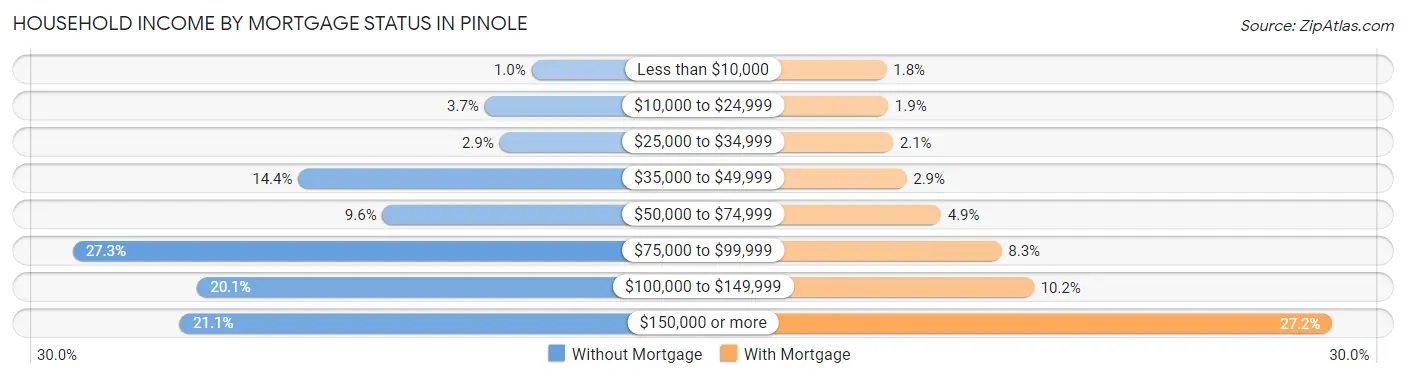
| Household Income | Without Mortgage | With Mortgage |
| Less than $10,000 | 17 (1.0%) | 57 (1.8%) |
| $10,000 to $24,999 | 61 (3.7%) | 60 (1.8%) |
| $25,000 to $34,999 | 47 (2.9%) | 69 (2.1%) |
| $35,000 to $49,999 | 236 (14.4%) | 94 (2.9%) |
| $50,000 to $74,999 | 157 (9.6%) | 158 (4.9%) |
| $75,000 to $99,999 | 448 (27.3%) | 270 (8.3%) |
| $100,000 to $149,999 | 331 (20.1%) | 330 (10.2%) |
| $150,000 or more | 347 (21.1%) | 883 (27.2%) |
| Total | 1,644 (100.0%) | 3,242 (100.0%) |
Property Value to Household Income Ratio in Pinole
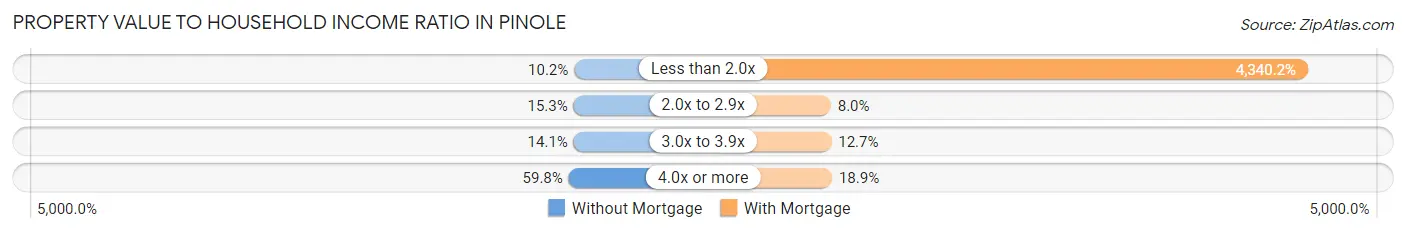
| Value-to-Income Ratio | Without Mortgage | With Mortgage |
| Less than 2.0x | 168 (10.2%) | 140,708 (4,340.2%) |
| 2.0x to 2.9x | 251 (15.3%) | 259 (8.0%) |
| 3.0x to 3.9x | 232 (14.1%) | 411 (12.7%) |
| 4.0x or more | 983 (59.8%) | 611 (18.9%) |
| Total | 1,644 (100.0%) | 3,242 (100.0%) |
Real Estate Taxes by Mortgage Status in Pinole
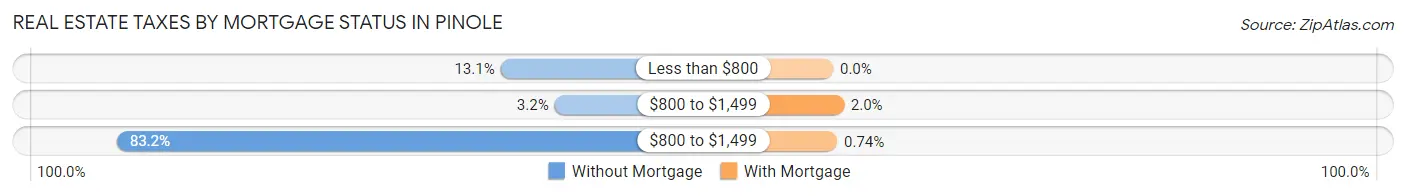
| Property Taxes | Without Mortgage | With Mortgage |
| Less than $800 | 215 (13.1%) | 0 (0.0%) |
| $800 to $1,499 | 53 (3.2%) | 64 (2.0%) |
| $800 to $1,499 | 1,367 (83.2%) | 24 (0.7%) |
| Total | 1,644 (100.0%) | 3,242 (100.0%) |
Health & Disability in Pinole
Health Insurance Coverage by Age in Pinole
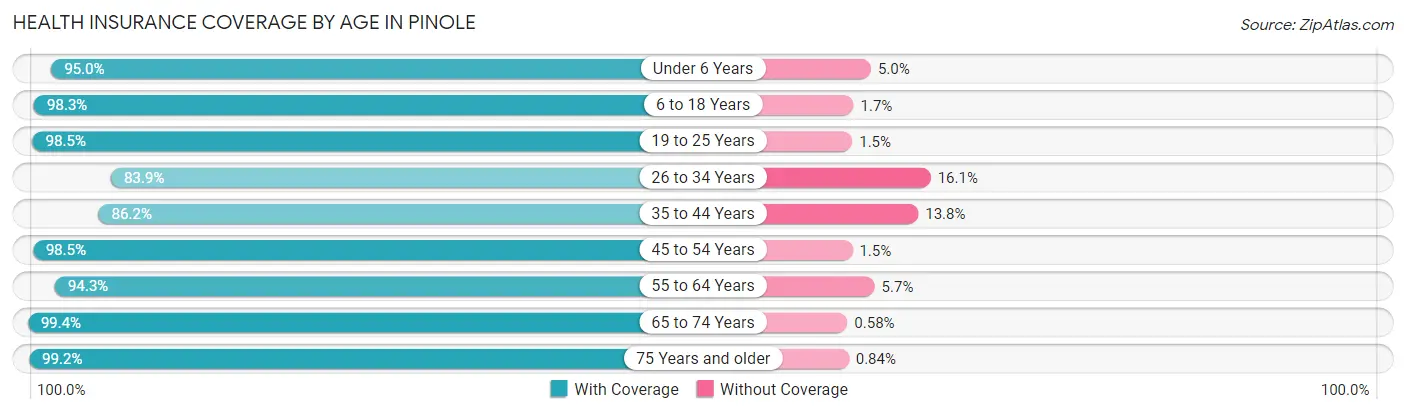
| Age Bracket | With Coverage | Without Coverage |
| Under 6 Years | 1,052 (95.0%) | 55 (5.0%) |
| 6 to 18 Years | 2,314 (98.3%) | 41 (1.7%) |
| 19 to 25 Years | 1,193 (98.5%) | 18 (1.5%) |
| 26 to 34 Years | 2,294 (83.9%) | 441 (16.1%) |
| 35 to 44 Years | 2,348 (86.2%) | 376 (13.8%) |
| 45 to 54 Years | 1,874 (98.5%) | 29 (1.5%) |
| 55 to 64 Years | 2,532 (94.3%) | 152 (5.7%) |
| 65 to 74 Years | 2,403 (99.4%) | 14 (0.6%) |
| 75 Years and older | 1,766 (99.2%) | 15 (0.8%) |
| Total | 17,776 (94.0%) | 1,141 (6.0%) |
Health Insurance Coverage by Citizenship Status in Pinole
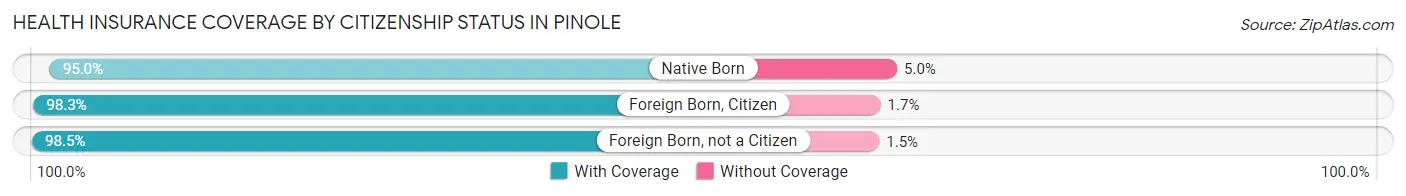
| Citizenship Status | With Coverage | Without Coverage |
| Native Born | 1,052 (95.0%) | 55 (5.0%) |
| Foreign Born, Citizen | 2,314 (98.3%) | 41 (1.7%) |
| Foreign Born, not a Citizen | 1,193 (98.5%) | 18 (1.5%) |
Health Insurance Coverage by Household Income in Pinole
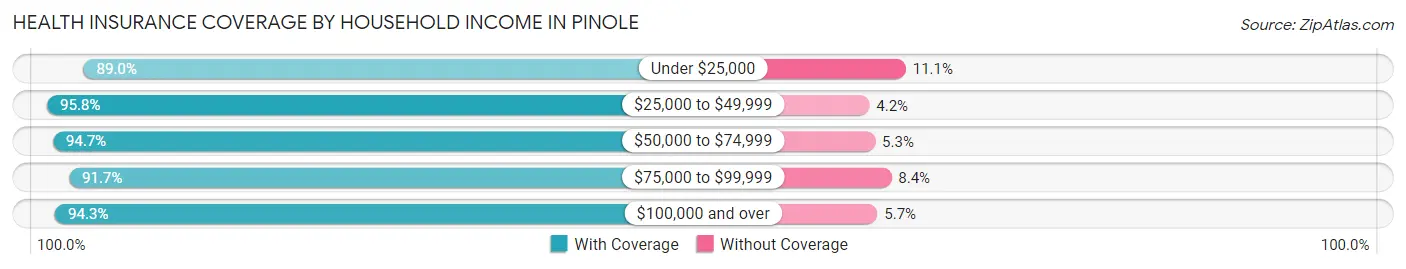
| Household Income | With Coverage | Without Coverage |
| Under $25,000 | 604 (88.9%) | 75 (11.1%) |
| $25,000 to $49,999 | 1,882 (95.8%) | 83 (4.2%) |
| $50,000 to $74,999 | 1,391 (94.7%) | 78 (5.3%) |
| $75,000 to $99,999 | 2,063 (91.6%) | 188 (8.4%) |
| $100,000 and over | 11,737 (94.3%) | 712 (5.7%) |
Public vs Private Health Insurance Coverage by Age in Pinole
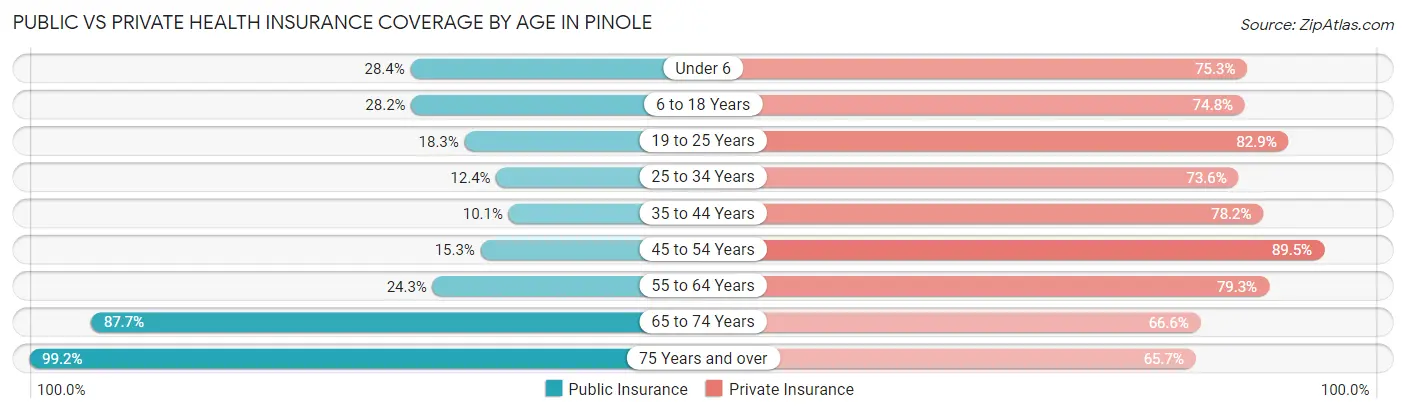
| Age Bracket | Public Insurance | Private Insurance |
| Under 6 | 314 (28.4%) | 833 (75.2%) |
| 6 to 18 Years | 664 (28.2%) | 1,762 (74.8%) |
| 19 to 25 Years | 222 (18.3%) | 1,004 (82.9%) |
| 25 to 34 Years | 340 (12.4%) | 2,014 (73.6%) |
| 35 to 44 Years | 276 (10.1%) | 2,131 (78.2%) |
| 45 to 54 Years | 292 (15.3%) | 1,703 (89.5%) |
| 55 to 64 Years | 651 (24.2%) | 2,128 (79.3%) |
| 65 to 74 Years | 2,120 (87.7%) | 1,610 (66.6%) |
| 75 Years and over | 1,766 (99.2%) | 1,170 (65.7%) |
| Total | 6,645 (35.1%) | 14,355 (75.9%) |
Disability Status by Sex by Age in Pinole
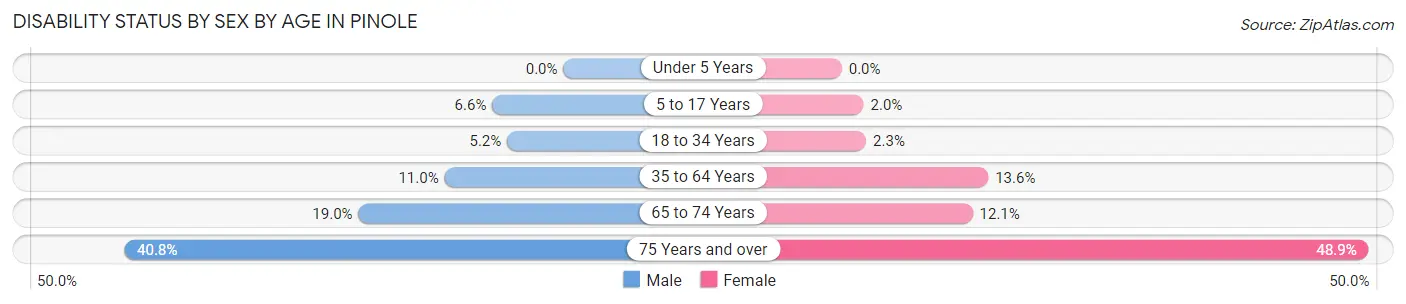
| Age Bracket | Male | Female |
| Under 5 Years | 0 (0.0%) | 0 (0.0%) |
| 5 to 17 Years | 84 (6.6%) | 22 (2.0%) |
| 18 to 34 Years | 104 (5.2%) | 47 (2.3%) |
| 35 to 64 Years | 386 (11.0%) | 518 (13.6%) |
| 65 to 74 Years | 195 (19.0%) | 169 (12.1%) |
| 75 Years and over | 269 (40.8%) | 548 (48.9%) |
Disability Class by Sex by Age in Pinole
Disability Class: Hearing Difficulty
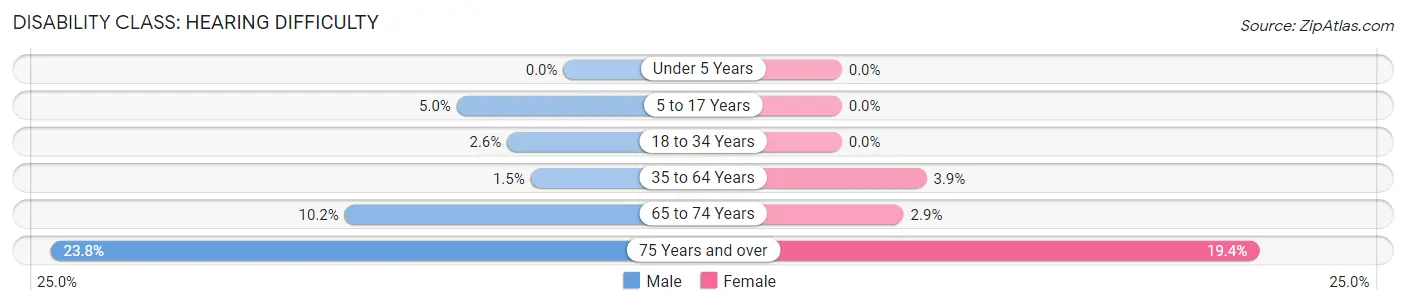
| Age Bracket | Male | Female |
| Under 5 Years | 0 (0.0%) | 0 (0.0%) |
| 5 to 17 Years | 63 (5.0%) | 0 (0.0%) |
| 18 to 34 Years | 52 (2.6%) | 0 (0.0%) |
| 35 to 64 Years | 53 (1.5%) | 150 (3.9%) |
| 65 to 74 Years | 104 (10.2%) | 40 (2.9%) |
| 75 Years and over | 157 (23.8%) | 217 (19.4%) |
Disability Class: Vision Difficulty
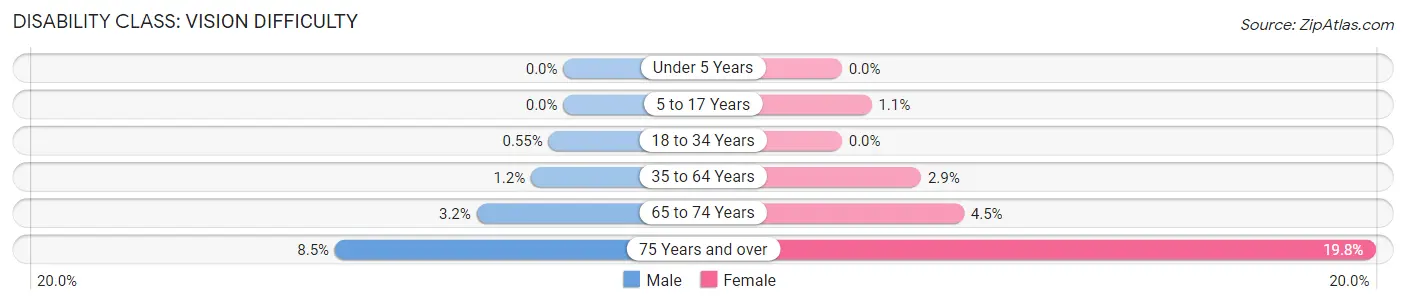
| Age Bracket | Male | Female |
| Under 5 Years | 0 (0.0%) | 0 (0.0%) |
| 5 to 17 Years | 0 (0.0%) | 12 (1.1%) |
| 18 to 34 Years | 11 (0.5%) | 0 (0.0%) |
| 35 to 64 Years | 42 (1.2%) | 112 (2.9%) |
| 65 to 74 Years | 33 (3.2%) | 63 (4.5%) |
| 75 Years and over | 56 (8.5%) | 222 (19.8%) |
Disability Class: Cognitive Difficulty
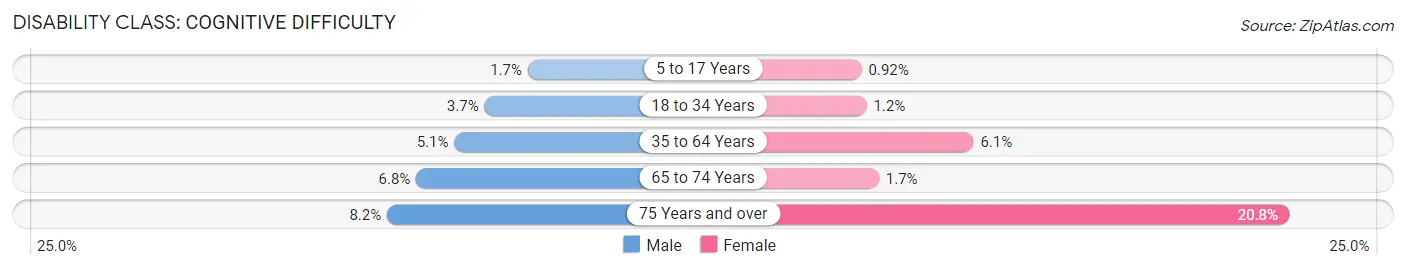
| Age Bracket | Male | Female |
| 5 to 17 Years | 21 (1.7%) | 10 (0.9%) |
| 18 to 34 Years | 73 (3.7%) | 24 (1.1%) |
| 35 to 64 Years | 177 (5.1%) | 233 (6.1%) |
| 65 to 74 Years | 70 (6.8%) | 24 (1.7%) |
| 75 Years and over | 54 (8.2%) | 233 (20.8%) |
Disability Class: Ambulatory Difficulty
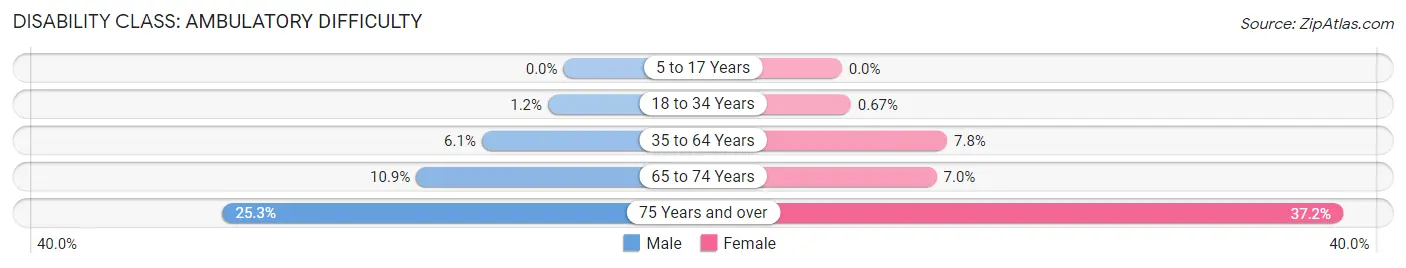
| Age Bracket | Male | Female |
| 5 to 17 Years | 0 (0.0%) | 0 (0.0%) |
| 18 to 34 Years | 23 (1.1%) | 14 (0.7%) |
| 35 to 64 Years | 212 (6.1%) | 298 (7.8%) |
| 65 to 74 Years | 112 (10.9%) | 98 (7.0%) |
| 75 Years and over | 167 (25.3%) | 417 (37.2%) |
Disability Class: Self-Care Difficulty
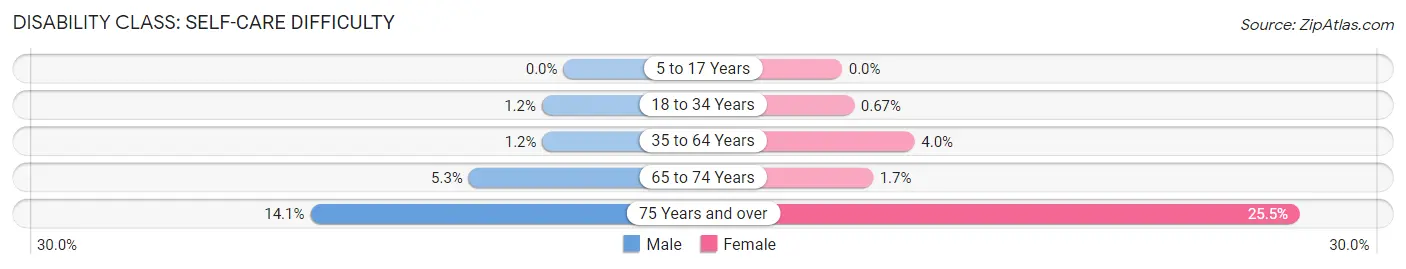
| Age Bracket | Male | Female |
| 5 to 17 Years | 0 (0.0%) | 0 (0.0%) |
| 18 to 34 Years | 24 (1.2%) | 14 (0.7%) |
| 35 to 64 Years | 41 (1.2%) | 154 (4.0%) |
| 65 to 74 Years | 54 (5.3%) | 24 (1.7%) |
| 75 Years and over | 93 (14.1%) | 286 (25.5%) |
Technology Access in Pinole
Computing Device Access in Pinole
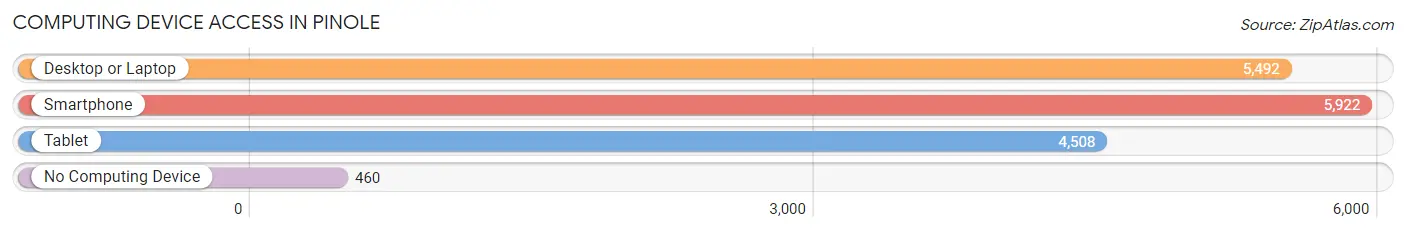
| Device Type | # Households | % Households |
| Desktop or Laptop | 5,492 | 81.0% |
| Smartphone | 5,922 | 87.3% |
| Tablet | 4,508 | 66.4% |
| No Computing Device | 460 | 6.8% |
| Total | 6,784 | 100.0% |
Internet Access in Pinole
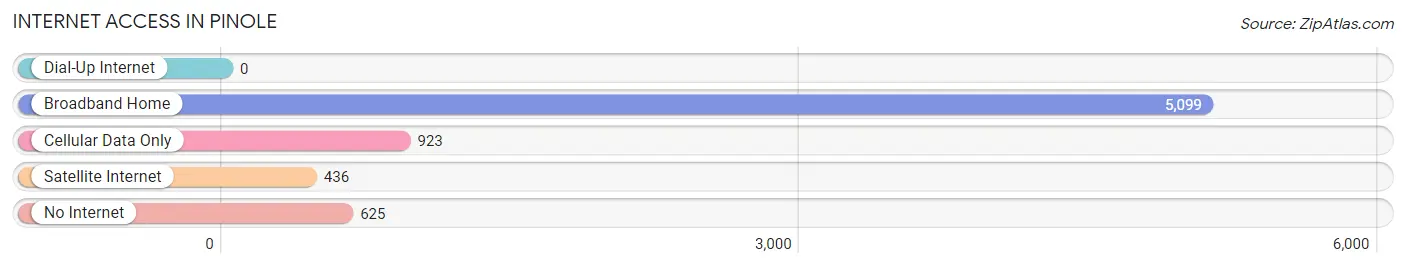
| Internet Type | # Households | % Households |
| Dial-Up Internet | 0 | 0.0% |
| Broadband Home | 5,099 | 75.2% |
| Cellular Data Only | 923 | 13.6% |
| Satellite Internet | 436 | 6.4% |
| No Internet | 625 | 9.2% |
| Total | 6,784 | 100.0% |
Pinole Summary
History
The history of Pinole, California dates back to the early 1800s when the area was inhabited by the Ohlone Indians. The Ohlone Indians were a peaceful tribe that lived in the area for thousands of years before the arrival of the Spanish. The Spanish arrived in the area in 1772 and established a mission in nearby San Pablo. The mission was the first European settlement in the area and it brought with it a large influx of Spanish settlers.
In 1823, the Mexican government granted a large land grant to Don Ygnacio Martinez, which included the area that is now Pinole. Martinez named the area Pinole, which is derived from the Ohlone word for “poppy seed”. Martinez established a ranch in the area and it quickly became a popular destination for travelers and settlers.
In 1878, the Central Pacific Railroad built a line through Pinole, which helped to spur the growth of the town. The railroad brought with it a large influx of new settlers and businesses. The town quickly grew and by the early 1900s, it had become a bustling community with a population of over 1,000 people.
In the early 1900s, Pinole was a major agricultural center, producing a variety of crops including wheat, barley, and hay. The town also had a thriving canning industry, which produced canned fruits and vegetables for the local market.
In the 1950s, the town began to experience a decline in its agricultural industry. This was due to the increasing popularity of suburban living and the growth of nearby cities such as Oakland and San Francisco. As a result, many of the town’s residents moved away in search of better job opportunities.
In the late 1970s, the town began to experience a resurgence in its economy. This was due to the growth of the nearby cities and the development of the nearby Interstate 80. The town also experienced a population boom, as many people moved to the area in search of affordable housing.
Today, Pinole is a thriving community with a population of over 18,000 people. The town is home to a variety of businesses, including retail stores, restaurants, and professional services. The town also has a vibrant arts and culture scene, with a variety of galleries, theaters, and music venues.
Geography
Pinole is located in Contra Costa County, California, approximately 20 miles northeast of San Francisco. The town is situated on the western shore of San Pablo Bay, which is part of the San Francisco Bay Area. The town is bordered by the cities of Hercules, Rodeo, and San Pablo.
The town has a total area of 4.3 square miles, of which 0.2 square miles is water. The terrain of the town is mostly flat, with some rolling hills in the northern part of the town. The town is located in a temperate climate zone, with mild winters and warm summers.
Economy
The economy of Pinole is largely based on the service industry. The town is home to a variety of retail stores, restaurants, and professional services. The town also has a thriving arts and culture scene, with a variety of galleries, theaters, and music venues.
The town is also home to a number of manufacturing and industrial businesses. The largest employer in the town is the Chevron Refinery, which employs over 1,000 people. Other major employers in the town include the Pinole Point Industrial Park, the Pinole Valley Shopping Center, and the Pinole Valley High School.
Demographics
As of the 2010 census, the population of Pinole was 18,390. The racial makeup of the town was 57.3% White, 16.2% African American, 0.7% Native American, 16.2% Asian, 0.2% Pacific Islander, and 8.6% from other races. Hispanic or Latino of any race were 24.3% of the population.
The median household income in Pinole was $68,813, and the median family income was $76,945. The per capita income in the town was $30,945. About 8.3% of families and 10.7% of the population were below the poverty line, including 14.2% of those under age 18 and 6.2% of those age 65 or over.
Common Questions
What is Per Capita Income in Pinole?
Per Capita income in Pinole is $49,738.
What is the Median Family Income in Pinole?
Median Family Income in Pinole is $126,563.
What is the Median Household income in Pinole?
Median Household Income in Pinole is $113,630.
What is Income or Wage Gap in Pinole?
Income or Wage Gap in Pinole is 12.1%.
Women in Pinole earn 87.9 cents for every dollar earned by a man.
What is Family Income Deficit in Pinole?
Family Income Deficit in Pinole is $11,725.
Families that are below poverty line in Pinole earn $11,725 less on average than the poverty threshold level.
What is Inequality or Gini Index in Pinole?
Inequality or Gini Index in Pinole is 0.38.
What is the Total Population of Pinole?
Total Population of Pinole is 18,946.
What is the Total Male Population of Pinole?
Total Male Population of Pinole is 8,876.
What is the Total Female Population of Pinole?
Total Female Population of Pinole is 10,070.
What is the Ratio of Males per 100 Females in Pinole?
There are 88.14 Males per 100 Females in Pinole.
What is the Ratio of Females per 100 Males in Pinole?
There are 113.45 Females per 100 Males in Pinole.
What is the Median Population Age in Pinole?
Median Population Age in Pinole is 42.6 Years.
What is the Average Family Size in Pinole
Average Family Size in Pinole is 3.2 People.
What is the Average Household Size in Pinole
Average Household Size in Pinole is 2.8 People.
How Large is the Labor Force in Pinole?
There are 10,168 People in the Labor Forcein in Pinole.
What is the Percentage of People in the Labor Force in Pinole?
63.6% of People are in the Labor Force in Pinole.
What is the Unemployment Rate in Pinole?
Unemployment Rate in Pinole is 3.9%.