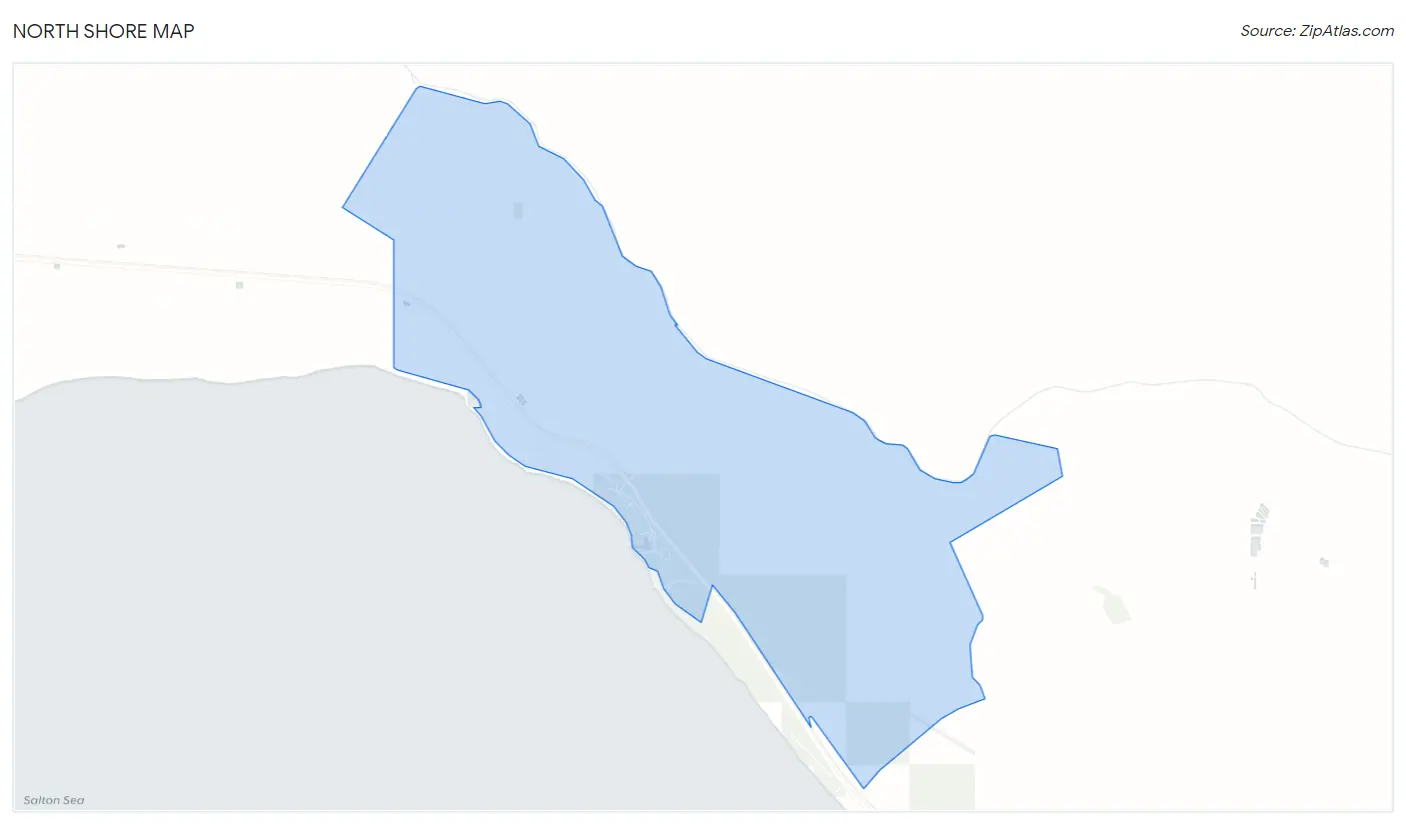
North Shore, CA Map & Demographics
North Shore Map
North Shore Overview
$19,500
PER CAPITA INCOME
$39,638
AVG FAMILY INCOME
$37,852
AVG HOUSEHOLD INCOME
44.8%
WAGE / INCOME GAP [ % ]
55.2¢/ $1
WAGE / INCOME GAP [ $ ]
0.38
INEQUALITY / GINI INDEX
2,610
TOTAL POPULATION
952
MALE POPULATION
1,658
FEMALE POPULATION
57.42
MALES / 100 FEMALES
174.16
FEMALES / 100 MALES
40.7
MEDIAN AGE
3.3
AVG FAMILY SIZE
2.6
AVG HOUSEHOLD SIZE
1,645
LABOR FORCE [ PEOPLE ]
69.6%
PERCENT IN LABOR FORCE
10.9%
UNEMPLOYMENT RATE
Income in North Shore
Income Overview in North Shore
Per Capita Income in North Shore is $19,500, while median incomes of families and households are $39,638 and $37,852 respectively.
| Characteristic | Number | Measure |
| Per Capita Income | 2,610 | $19,500 |
| Median Family Income | 689 | $39,638 |
| Mean Family Income | 689 | $55,548 |
| Median Household Income | 1,001 | $37,852 |
| Mean Household Income | 1,001 | $48,093 |
| Income Deficit | 689 | $0 |
| Wage / Income Gap (%) | 2,610 | 44.76% |
| Wage / Income Gap ($) | 2,610 | 55.24¢ per $1 |
| Gini / Inequality Index | 2,610 | 0.38 |
Earnings by Sex in North Shore
Average Earnings in North Shore are $22,518, $33,638 for men and $18,582 for women, a difference of 44.8%.
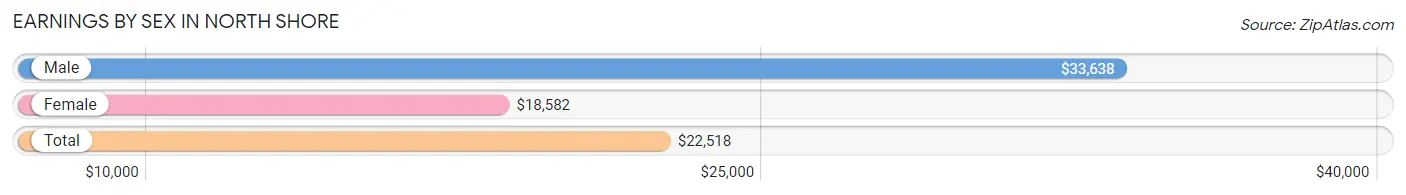
| Sex | Number | Average Earnings |
| Male | 765 (46.2%) | $33,638 |
| Female | 892 (53.8%) | $18,582 |
| Total | 1,657 (100.0%) | $22,518 |
Earnings by Sex by Income Bracket in North Shore
The most common earnings brackets in North Shore are $17,500 to $19,999 for men (166 | 21.7%) and $15,000 to $17,499 for women (178 | 20.0%).
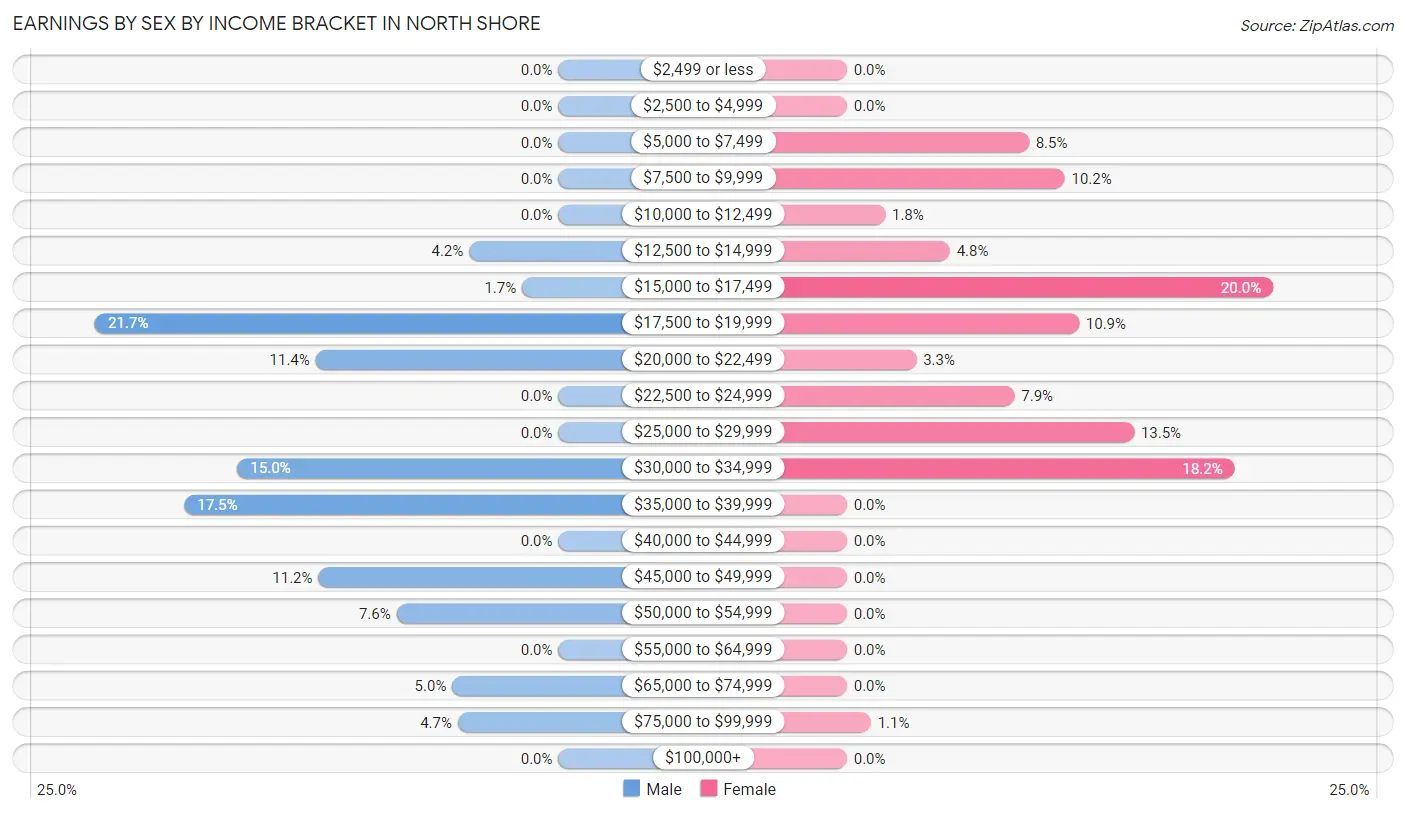
| Income | Male | Female |
| $2,499 or less | 0 (0.0%) | 0 (0.0%) |
| $2,500 to $4,999 | 0 (0.0%) | 0 (0.0%) |
| $5,000 to $7,499 | 0 (0.0%) | 76 (8.5%) |
| $7,500 to $9,999 | 0 (0.0%) | 91 (10.2%) |
| $10,000 to $12,499 | 0 (0.0%) | 16 (1.8%) |
| $12,500 to $14,999 | 32 (4.2%) | 43 (4.8%) |
| $15,000 to $17,499 | 13 (1.7%) | 178 (20.0%) |
| $17,500 to $19,999 | 166 (21.7%) | 97 (10.9%) |
| $20,000 to $22,499 | 87 (11.4%) | 29 (3.3%) |
| $22,500 to $24,999 | 0 (0.0%) | 70 (7.9%) |
| $25,000 to $29,999 | 0 (0.0%) | 120 (13.5%) |
| $30,000 to $34,999 | 115 (15.0%) | 162 (18.2%) |
| $35,000 to $39,999 | 134 (17.5%) | 0 (0.0%) |
| $40,000 to $44,999 | 0 (0.0%) | 0 (0.0%) |
| $45,000 to $49,999 | 86 (11.2%) | 0 (0.0%) |
| $50,000 to $54,999 | 58 (7.6%) | 0 (0.0%) |
| $55,000 to $64,999 | 0 (0.0%) | 0 (0.0%) |
| $65,000 to $74,999 | 38 (5.0%) | 0 (0.0%) |
| $75,000 to $99,999 | 36 (4.7%) | 10 (1.1%) |
| $100,000+ | 0 (0.0%) | 0 (0.0%) |
| Total | 765 (100.0%) | 892 (100.0%) |
Earnings by Sex by Educational Attainment in North Shore
Average earnings in North Shore are $33,214 for men and $22,964 for women, a difference of 30.9%. Men with an educational attainment of college or associate's degree enjoy the highest average annual earnings of $45,581, while those with less than high school education earn the least with $31,864. Women with an educational attainment of college or associate's degree earn the most with the average annual earnings of $31,838, while those with less than high school education have the smallest earnings of $9,407.
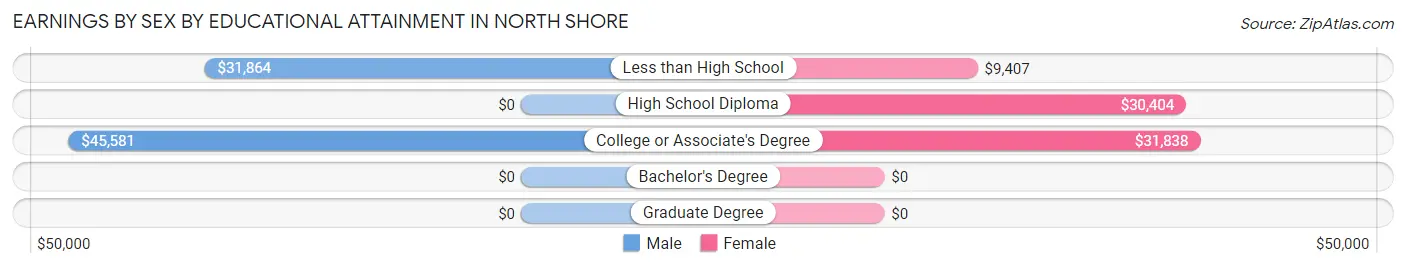
| Educational Attainment | Male Income | Female Income |
| Less than High School | $31,864 | $9,407 |
| High School Diploma | - | - |
| College or Associate's Degree | $45,581 | $31,838 |
| Bachelor's Degree | - | - |
| Graduate Degree | - | - |
| Total | $33,214 | $22,964 |
Family Income in North Shore
Family Income Brackets in North Shore
According to the North Shore family income data, there are 177 families falling into the $25,000 to $34,999 income range, which is the most common income bracket and makes up 25.7% of all families.
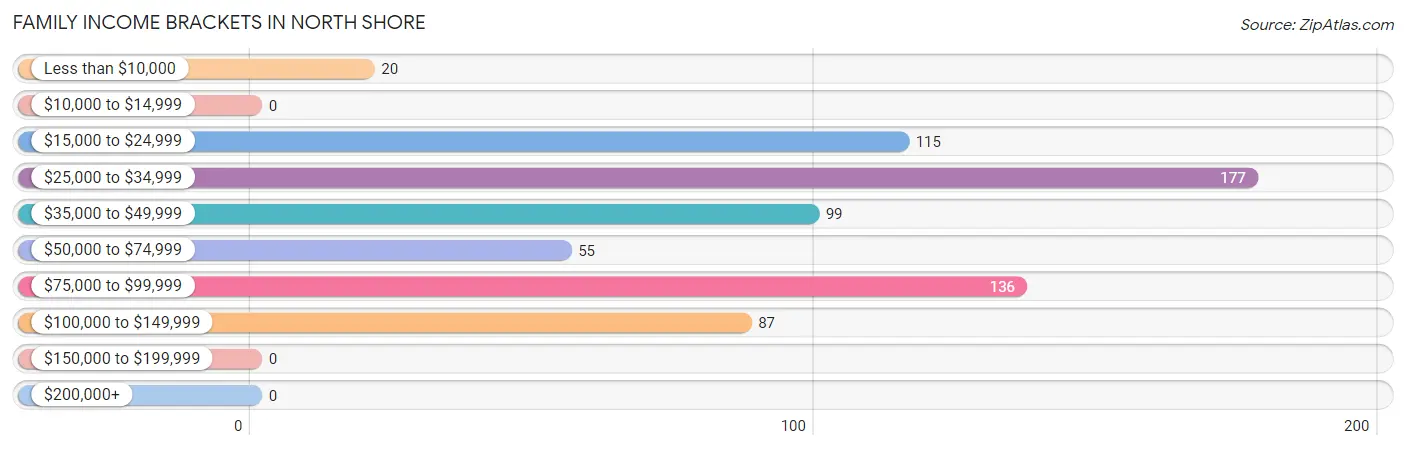
| Income Bracket | # Families | % Families |
| Less than $10,000 | 20 | 2.9% |
| $10,000 to $14,999 | 0 | 0.0% |
| $15,000 to $24,999 | 115 | 16.7% |
| $25,000 to $34,999 | 177 | 25.7% |
| $35,000 to $49,999 | 99 | 14.4% |
| $50,000 to $74,999 | 55 | 8.0% |
| $75,000 to $99,999 | 136 | 19.7% |
| $100,000 to $149,999 | 87 | 12.6% |
| $150,000 to $199,999 | 0 | 0.0% |
| $200,000+ | 0 | 0.0% |
Family Income by Famaliy Size in North Shore
5-person families (59 | 8.6%) account for the highest median family income in North Shore with $110,060 per family, while 4-person families (109 | 15.8%) have the highest median income of $23,454 per family member.
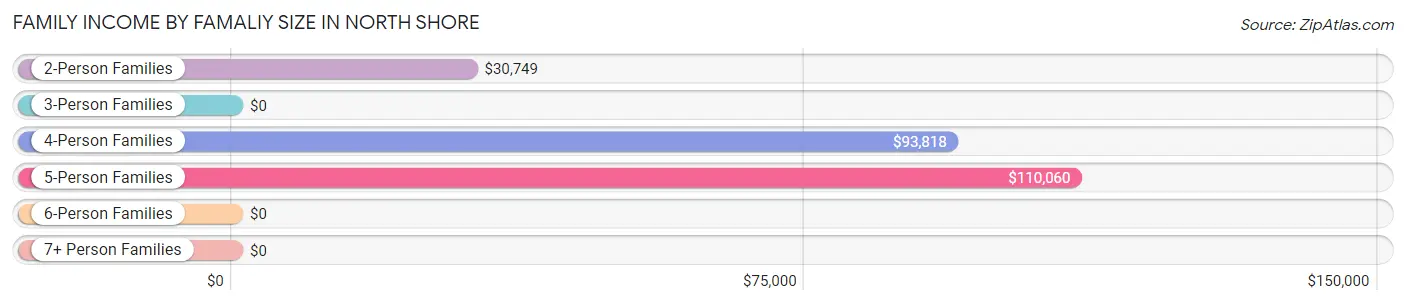
| Income Bracket | # Families | Median Income |
| 2-Person Families | 344 (49.9%) | $30,749 |
| 3-Person Families | 114 (16.6%) | $0 |
| 4-Person Families | 109 (15.8%) | $93,818 |
| 5-Person Families | 59 (8.6%) | $110,060 |
| 6-Person Families | 24 (3.5%) | $0 |
| 7+ Person Families | 39 (5.7%) | $0 |
| Total | 689 (100.0%) | $39,638 |
Family Income by Number of Earners in North Shore
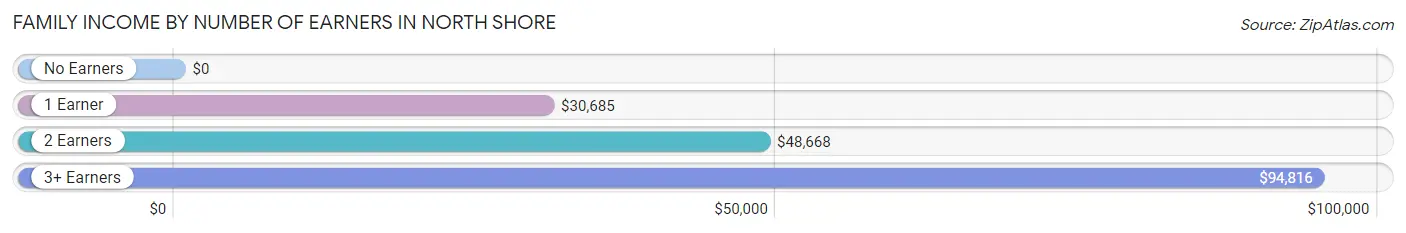
| Number of Earners | # Families | Median Income |
| No Earners | 0 (0.0%) | $0 |
| 1 Earner | 335 (48.6%) | $30,685 |
| 2 Earners | 165 (23.9%) | $48,668 |
| 3+ Earners | 189 (27.4%) | $94,816 |
| Total | 689 (100.0%) | $39,638 |
Household Income in North Shore
Household Income Brackets in North Shore
With 238 households falling in the category, the $35,000 to $49,999 income range is the most frequent in North Shore, accounting for 23.8% of all households.
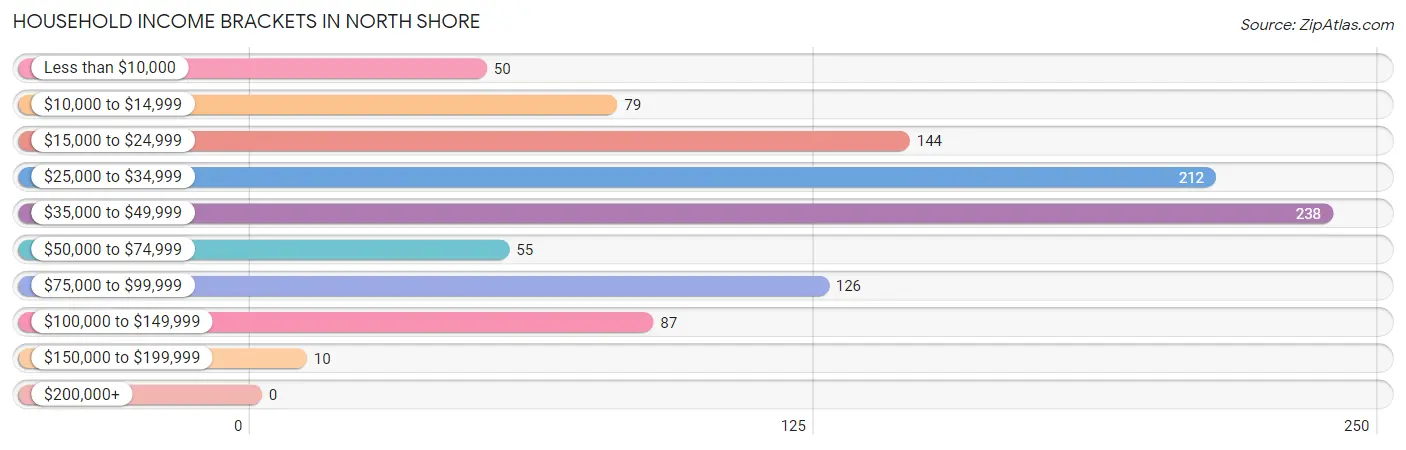
| Income Bracket | # Households | % Households |
| Less than $10,000 | 50 | 5.0% |
| $10,000 to $14,999 | 79 | 7.9% |
| $15,000 to $24,999 | 144 | 14.4% |
| $25,000 to $34,999 | 212 | 21.2% |
| $35,000 to $49,999 | 238 | 23.8% |
| $50,000 to $74,999 | 55 | 5.5% |
| $75,000 to $99,999 | 126 | 12.6% |
| $100,000 to $149,999 | 87 | 8.7% |
| $150,000 to $199,999 | 10 | 1.0% |
| $200,000+ | 0 | 0.0% |
Household Income by Householder Age in North Shore
The median household income in North Shore is $37,852, with the highest median household income of $48,402 found in the 25 to 44 years age bracket for the primary householder. A total of 208 households (20.8%) fall into this category.
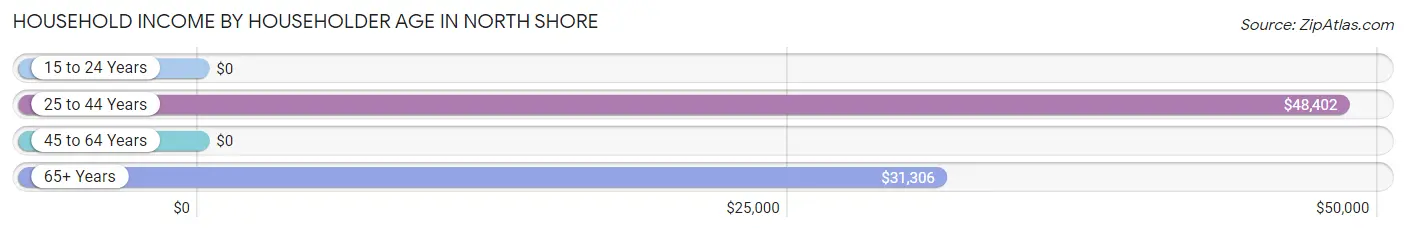
| Income Bracket | # Households | Median Income |
| 15 to 24 Years | 0 (0.0%) | $0 |
| 25 to 44 Years | 208 (20.8%) | $48,402 |
| 45 to 64 Years | 536 (53.5%) | $0 |
| 65+ Years | 257 (25.7%) | $31,306 |
| Total | 1,001 (100.0%) | $37,852 |
Poverty in North Shore
Income Below Poverty by Sex and Age in North Shore
With 11.8% poverty level for males and 13.9% for females among the residents of North Shore, 65 to 74 year old males and 12 to 14 year old females are the most vulnerable to poverty, with 36 males (64.3%) and 18 females (39.1%) in their respective age groups living below the poverty level.
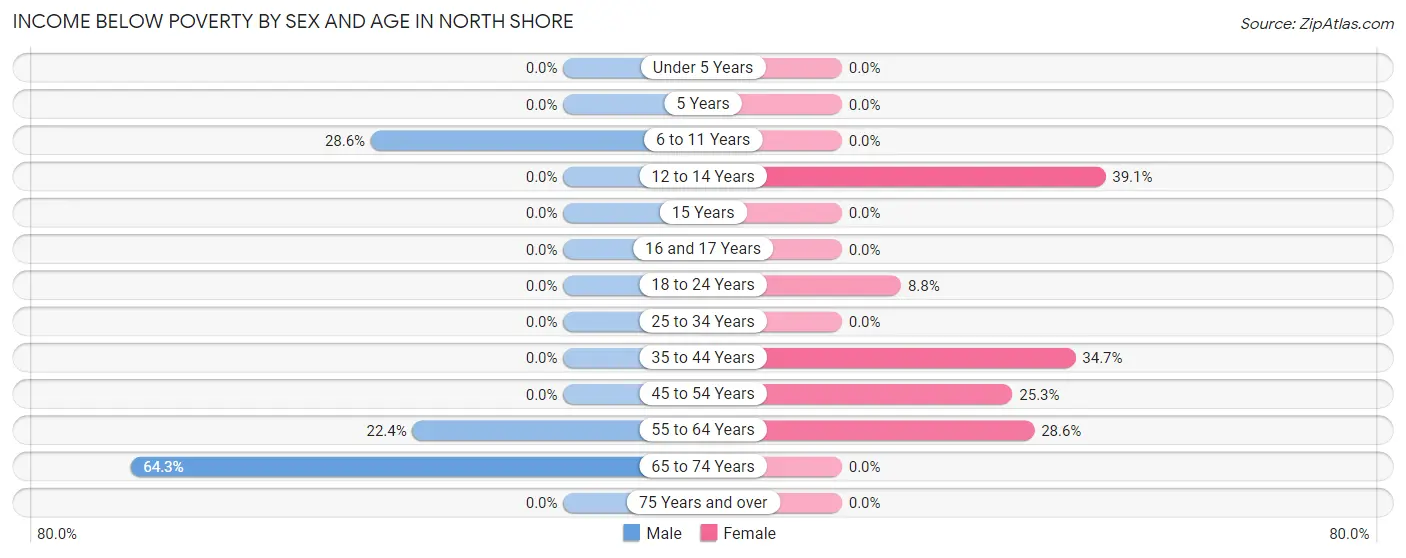
| Age Bracket | Male | Female |
| Under 5 Years | 0 (0.0%) | 0 (0.0%) |
| 5 Years | 0 (0.0%) | 0 (0.0%) |
| 6 to 11 Years | 16 (28.6%) | 0 (0.0%) |
| 12 to 14 Years | 0 (0.0%) | 18 (39.1%) |
| 15 Years | 0 (0.0%) | 0 (0.0%) |
| 16 and 17 Years | 0 (0.0%) | 0 (0.0%) |
| 18 to 24 Years | 0 (0.0%) | 43 (8.8%) |
| 25 to 34 Years | 0 (0.0%) | 0 (0.0%) |
| 35 to 44 Years | 0 (0.0%) | 43 (34.7%) |
| 45 to 54 Years | 0 (0.0%) | 76 (25.3%) |
| 55 to 64 Years | 60 (22.4%) | 50 (28.6%) |
| 65 to 74 Years | 36 (64.3%) | 0 (0.0%) |
| 75 Years and over | 0 (0.0%) | 0 (0.0%) |
| Total | 112 (11.8%) | 230 (13.9%) |
Income Above Poverty by Sex and Age in North Shore
According to the poverty statistics in North Shore, males aged under 5 years and females aged 5 years are the age groups that are most secure financially, with 100.0% of males and 100.0% of females in these age groups living above the poverty line.
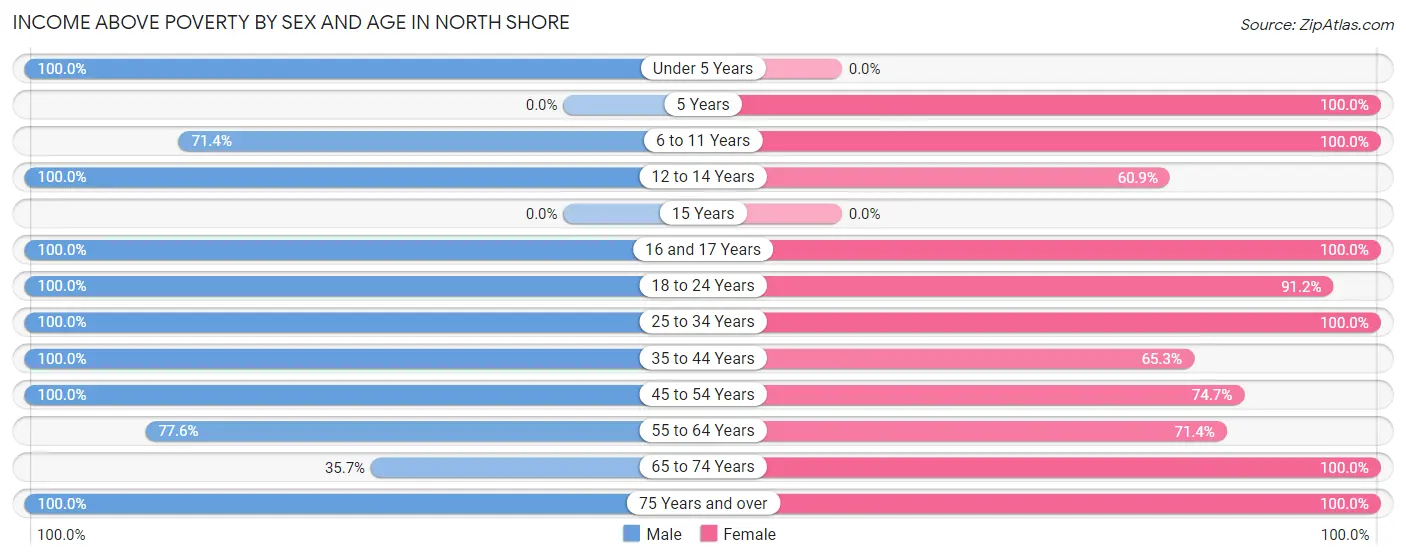
| Age Bracket | Male | Female |
| Under 5 Years | 11 (100.0%) | 0 (0.0%) |
| 5 Years | 0 (0.0%) | 28 (100.0%) |
| 6 to 11 Years | 40 (71.4%) | 95 (100.0%) |
| 12 to 14 Years | 11 (100.0%) | 28 (60.9%) |
| 15 Years | 0 (0.0%) | 0 (0.0%) |
| 16 and 17 Years | 21 (100.0%) | 55 (100.0%) |
| 18 to 24 Years | 91 (100.0%) | 446 (91.2%) |
| 25 to 34 Years | 121 (100.0%) | 89 (100.0%) |
| 35 to 44 Years | 225 (100.0%) | 81 (65.3%) |
| 45 to 54 Years | 71 (100.0%) | 224 (74.7%) |
| 55 to 64 Years | 208 (77.6%) | 125 (71.4%) |
| 65 to 74 Years | 20 (35.7%) | 234 (100.0%) |
| 75 Years and over | 21 (100.0%) | 23 (100.0%) |
| Total | 840 (88.2%) | 1,428 (86.1%) |
Income Below Poverty Among Married-Couple Families in North Shore
The poverty statistics for married-couple families in North Shore show that 16.2% or 59 of the total 364 families live below the poverty line. Families with no children have the highest poverty rate of 23.4%, comprising of 59 families. On the other hand, families with 1 or 2 children have the lowest poverty rate of 0.0%, which includes 0 families.
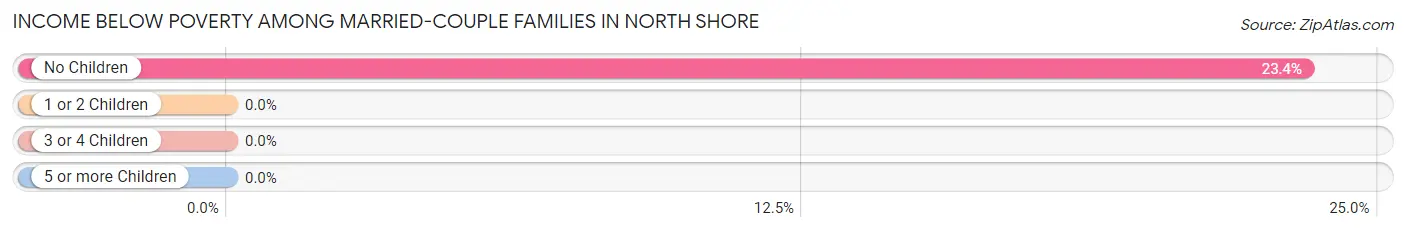
| Children | Above Poverty | Below Poverty |
| No Children | 193 (76.6%) | 59 (23.4%) |
| 1 or 2 Children | 44 (100.0%) | 0 (0.0%) |
| 3 or 4 Children | 68 (100.0%) | 0 (0.0%) |
| 5 or more Children | 0 (0.0%) | 0 (0.0%) |
| Total | 305 (83.8%) | 59 (16.2%) |
Income Below Poverty Among Single-Parent Households in North Shore
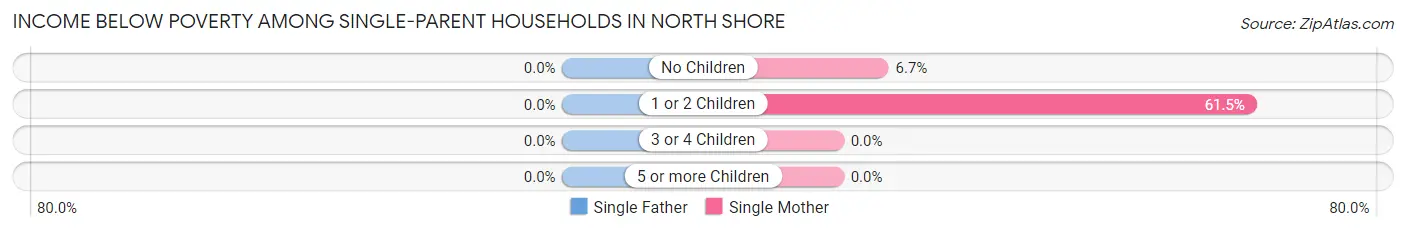
| Children | Single Father | Single Mother |
| No Children | 0 (0.0%) | 20 (6.7%) |
| 1 or 2 Children | 0 (0.0%) | 16 (61.5%) |
| 3 or 4 Children | 0 (0.0%) | 0 (0.0%) |
| 5 or more Children | 0 (0.0%) | 0 (0.0%) |
| Total | 0 (0.0%) | 36 (11.1%) |
Income Below Poverty Among Married-Couple vs Single-Parent Households in North Shore
The poverty data for North Shore shows that 59 of the married-couple family households (16.2%) and 36 of the single-parent households (11.1%) are living below the poverty level. Within the married-couple family households, those with no children have the highest poverty rate, with 59 households (23.4%) falling below the poverty line. Among the single-parent households, those with 1 or 2 children have the highest poverty rate, with 16 household (61.5%) living below poverty.
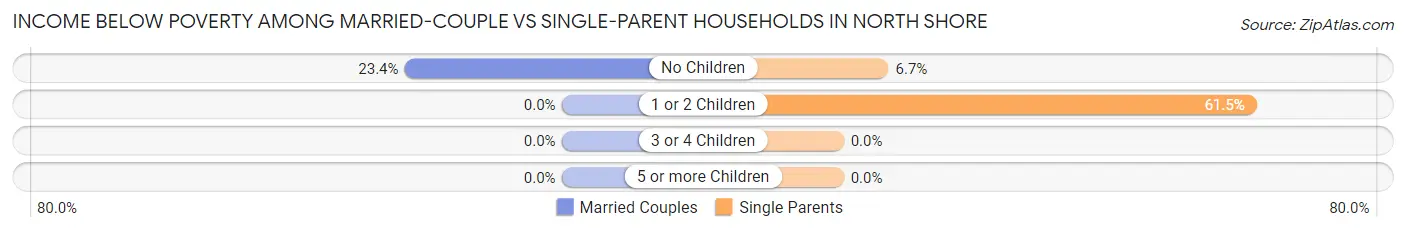
| Children | Married-Couple Families | Single-Parent Households |
| No Children | 59 (23.4%) | 20 (6.7%) |
| 1 or 2 Children | 0 (0.0%) | 16 (61.5%) |
| 3 or 4 Children | 0 (0.0%) | 0 (0.0%) |
| 5 or more Children | 0 (0.0%) | 0 (0.0%) |
| Total | 59 (16.2%) | 36 (11.1%) |
Race in North Shore
The most populous races in North Shore are Hispanic or Latino (2,546 | 97.6%), Two or more Races (1,087 | 41.6%), and Some other Race (1,076 | 41.2%).
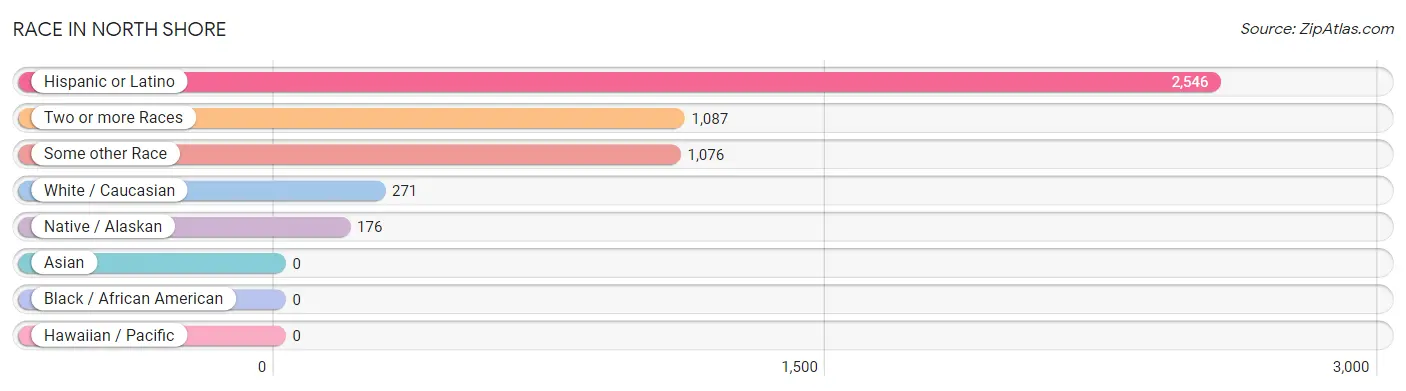
| Race | # Population | % Population |
| Asian | 0 | 0.0% |
| Black / African American | 0 | 0.0% |
| Hawaiian / Pacific | 0 | 0.0% |
| Hispanic or Latino | 2,546 | 97.6% |
| Native / Alaskan | 176 | 6.7% |
| White / Caucasian | 271 | 10.4% |
| Two or more Races | 1,087 | 41.6% |
| Some other Race | 1,076 | 41.2% |
| Total | 2,610 | 100.0% |
Ancestry in North Shore
The most populous ancestries reported in North Shore are Mexican (2,370 | 90.8%), Central American (176 | 6.7%), Central American Indian (176 | 6.7%), Guatemalan (144 | 5.5%), and Salvadoran (32 | 1.2%), together accounting for 111.0% of all North Shore residents.
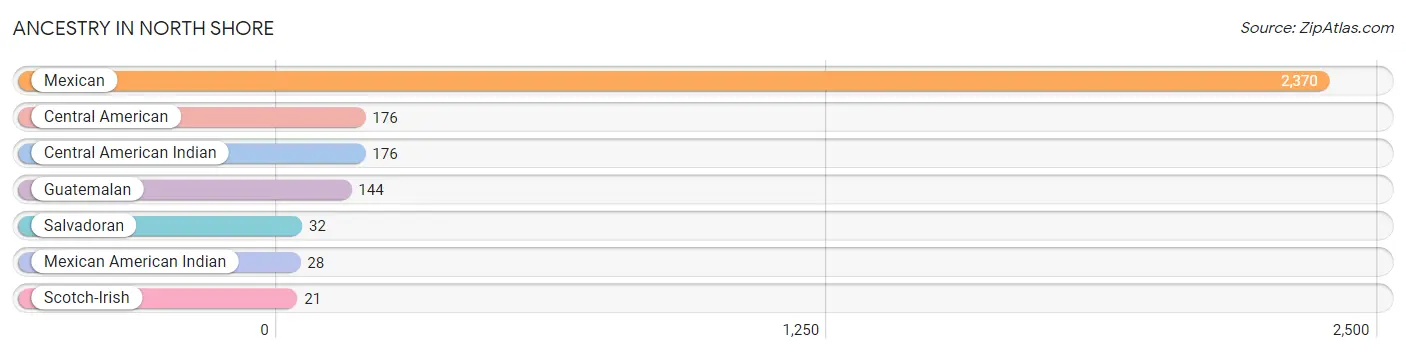
| Ancestry | # Population | % Population |
| Central American | 176 | 6.7% |
| Central American Indian | 176 | 6.7% |
| Guatemalan | 144 | 5.5% |
| Mexican | 2,370 | 90.8% |
| Mexican American Indian | 28 | 1.1% |
| Salvadoran | 32 | 1.2% |
| Scotch-Irish | 21 | 0.8% | View All 7 Rows |
Immigrants in North Shore
The most numerous immigrant groups reported in North Shore came from Central America (1,396 | 53.5%), Latin America (1,396 | 53.5%), and Mexico (1,396 | 53.5%), together accounting for 160.5% of all North Shore residents.
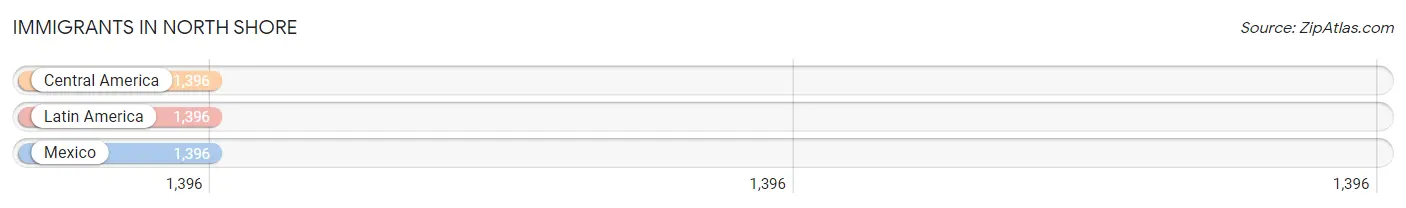
| Immigration Origin | # Population | % Population |
| Central America | 1,396 | 53.5% |
| Latin America | 1,396 | 53.5% |
| Mexico | 1,396 | 53.5% | View All 3 Rows |
Sex and Age in North Shore
Sex and Age in North Shore
The most populous age groups in North Shore are 55 to 59 Years (221 | 23.2%) for men and 20 to 24 Years (298 | 18.0%) for women.
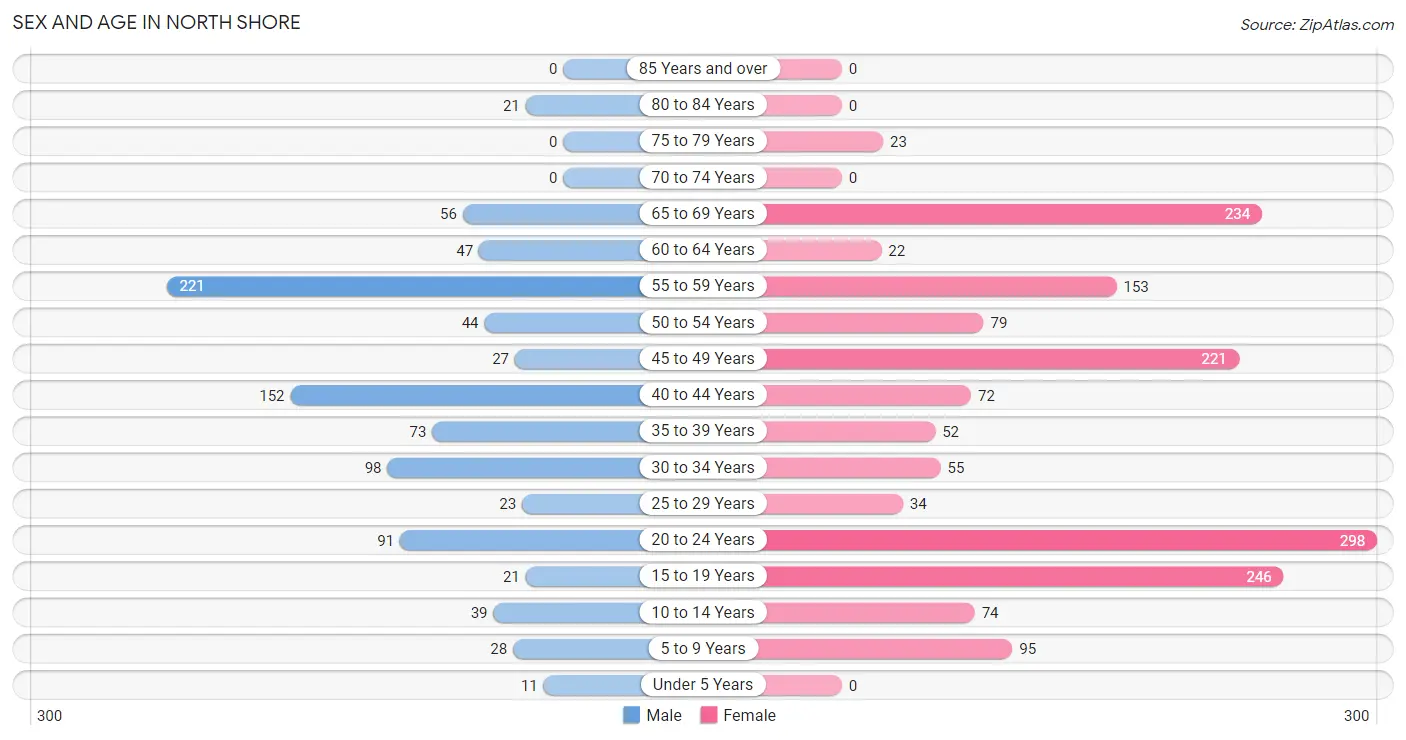
| Age Bracket | Male | Female |
| Under 5 Years | 11 (1.2%) | 0 (0.0%) |
| 5 to 9 Years | 28 (2.9%) | 95 (5.7%) |
| 10 to 14 Years | 39 (4.1%) | 74 (4.5%) |
| 15 to 19 Years | 21 (2.2%) | 246 (14.8%) |
| 20 to 24 Years | 91 (9.6%) | 298 (18.0%) |
| 25 to 29 Years | 23 (2.4%) | 34 (2.1%) |
| 30 to 34 Years | 98 (10.3%) | 55 (3.3%) |
| 35 to 39 Years | 73 (7.7%) | 52 (3.1%) |
| 40 to 44 Years | 152 (16.0%) | 72 (4.3%) |
| 45 to 49 Years | 27 (2.8%) | 221 (13.3%) |
| 50 to 54 Years | 44 (4.6%) | 79 (4.8%) |
| 55 to 59 Years | 221 (23.2%) | 153 (9.2%) |
| 60 to 64 Years | 47 (4.9%) | 22 (1.3%) |
| 65 to 69 Years | 56 (5.9%) | 234 (14.1%) |
| 70 to 74 Years | 0 (0.0%) | 0 (0.0%) |
| 75 to 79 Years | 0 (0.0%) | 23 (1.4%) |
| 80 to 84 Years | 21 (2.2%) | 0 (0.0%) |
| 85 Years and over | 0 (0.0%) | 0 (0.0%) |
| Total | 952 (100.0%) | 1,658 (100.0%) |
Families and Households in North Shore
Median Family Size in North Shore
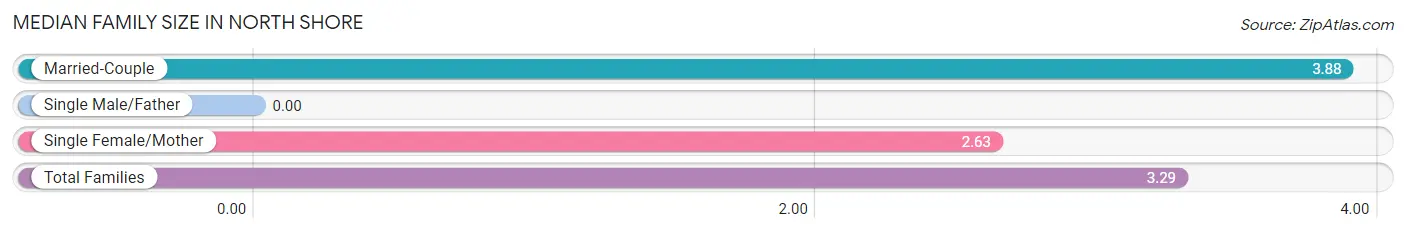
| Family Type | # Families | Family Size |
| Married-Couple | 364 (52.8%) | 3.88 |
| Single Male/Father | 0 (0.0%) | - |
| Single Female/Mother | 325 (47.2%) | 2.63 |
| Total Families | 689 (100.0%) | 3.29 |
Median Household Size in North Shore
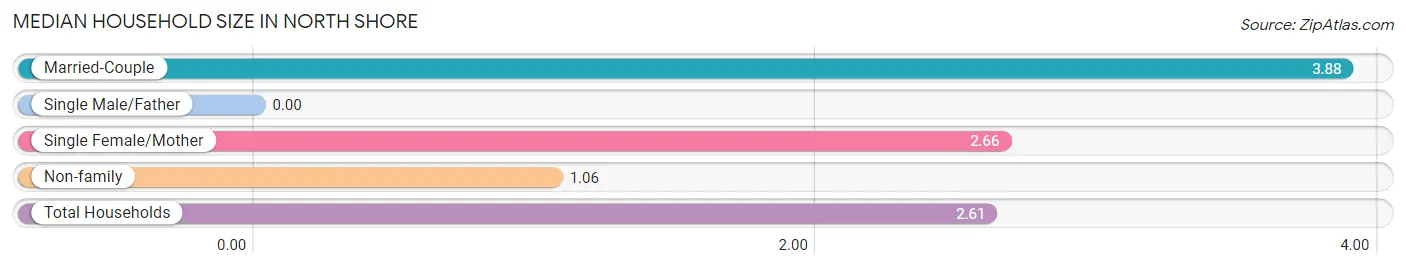
| Household Type | # Households | Household Size |
| Married-Couple | 364 (36.4%) | 3.88 |
| Single Male/Father | 0 (0.0%) | - |
| Single Female/Mother | 325 (32.5%) | 2.66 |
| Non-family | 312 (31.2%) | 1.06 |
| Total Households | 1,001 (100.0%) | 2.61 |
Household Size by Marriage Status in North Shore
Out of a total of 1,001 households in North Shore, 689 (68.8%) are family households, while 312 (31.2%) are nonfamily households. The most numerous type of family households are 2-person households, comprising 334, and the most common type of nonfamily households are 1-person households, comprising 289.
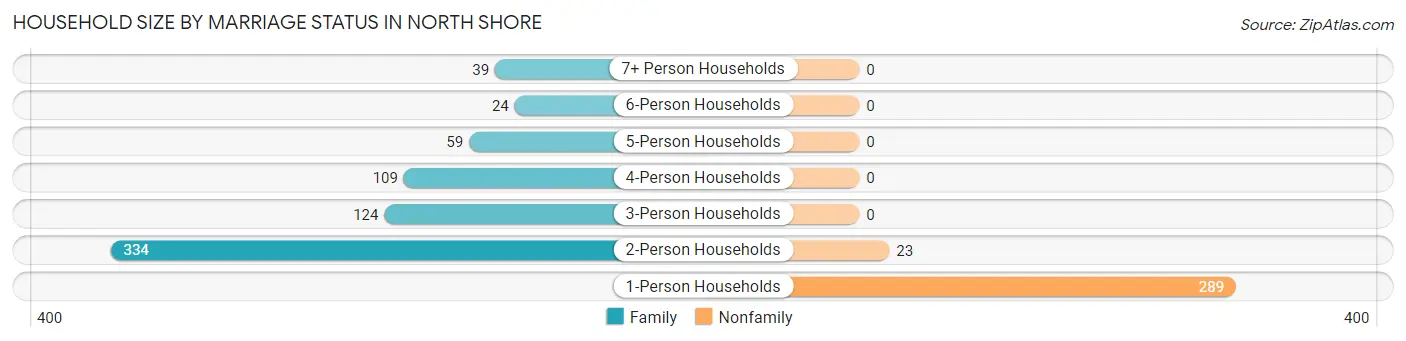
| Household Size | Family Households | Nonfamily Households |
| 1-Person Households | - | 289 (28.9%) |
| 2-Person Households | 334 (33.4%) | 23 (2.3%) |
| 3-Person Households | 124 (12.4%) | 0 (0.0%) |
| 4-Person Households | 109 (10.9%) | 0 (0.0%) |
| 5-Person Households | 59 (5.9%) | 0 (0.0%) |
| 6-Person Households | 24 (2.4%) | 0 (0.0%) |
| 7+ Person Households | 39 (3.9%) | 0 (0.0%) |
| Total | 689 (68.8%) | 312 (31.2%) |
Female Fertility in North Shore
Fertility by Age in North Shore
Average fertility rate in North Shore is 43.0 births per 1,000 women. Women in the age bracket of 20 to 34 years have the highest fertility rate with 83.0 births per 1,000 women. Women in the age bracket of 20 to 34 years acount for 74.4% of all women with births.
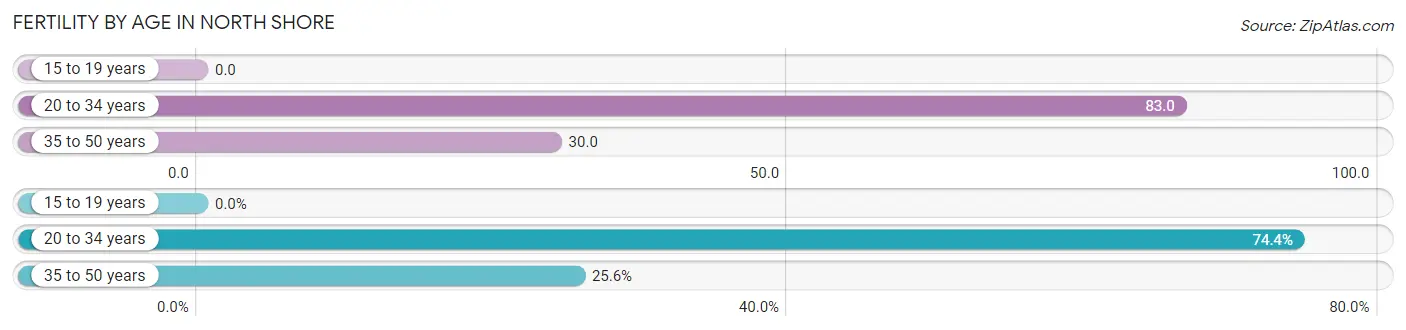
| Age Bracket | Women with Births | Births / 1,000 Women |
| 15 to 19 years | 0 (0.0%) | 0.0 |
| 20 to 34 years | 32 (74.4%) | 83.0 |
| 35 to 50 years | 11 (25.6%) | 30.0 |
| Total | 43 (100.0%) | 43.0 |
Fertility by Age by Marriage Status in North Shore
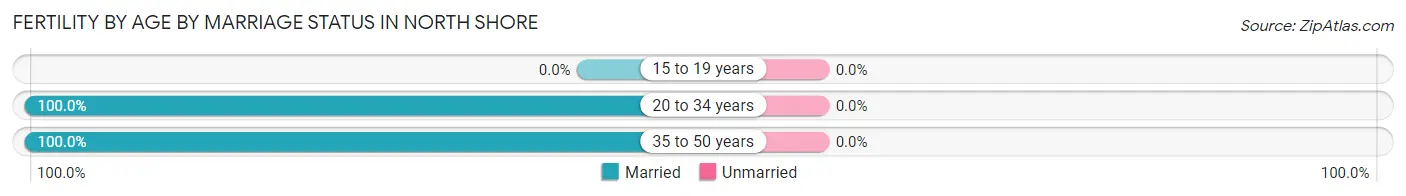
| Age Bracket | Married | Unmarried |
| 15 to 19 years | 0 (0.0%) | 0 (0.0%) |
| 20 to 34 years | 32 (100.0%) | 0 (0.0%) |
| 35 to 50 years | 11 (100.0%) | 0 (0.0%) |
| Total | 43 (100.0%) | 0 (0.0%) |
Fertility by Education in North Shore
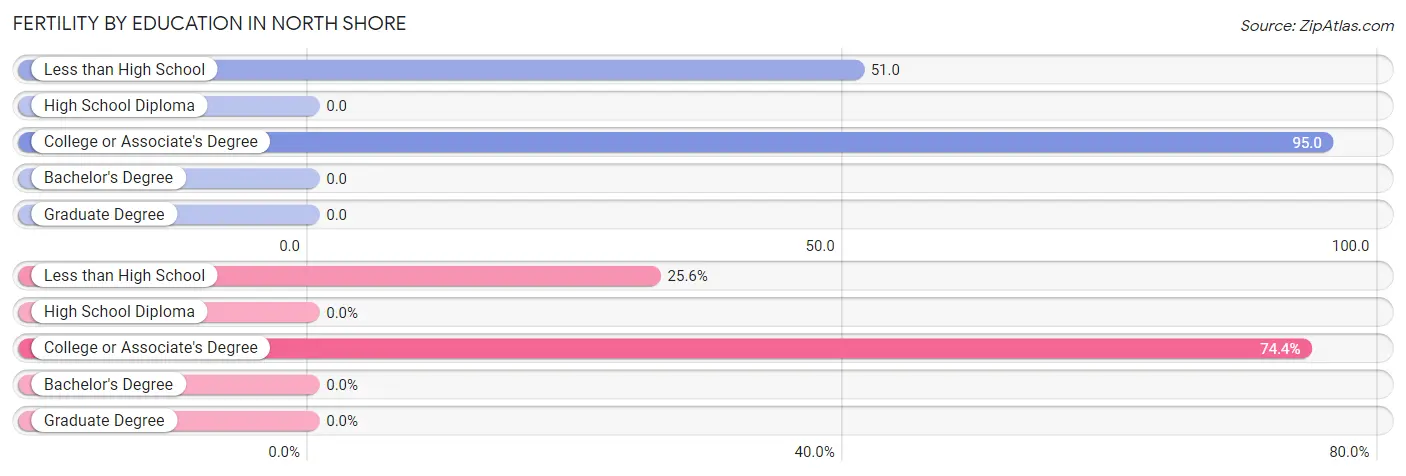
| Educational Attainment | Women with Births | Births / 1,000 Women |
| Less than High School | 11 (25.6%) | 51.0 |
| High School Diploma | 0 (0.0%) | 0.0 |
| College or Associate's Degree | 32 (74.4%) | 95.0 |
| Bachelor's Degree | 0 (0.0%) | 0.0 |
| Graduate Degree | 0 (0.0%) | 0.0 |
| Total | 43 (100.0%) | 43.0 |
Fertility by Education by Marriage Status in North Shore
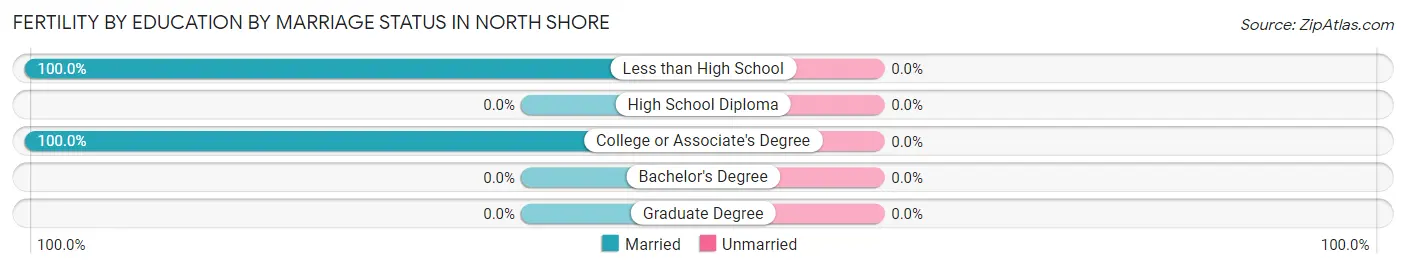
| Educational Attainment | Married | Unmarried |
| Less than High School | 11 (100.0%) | 0 (0.0%) |
| High School Diploma | 0 (0.0%) | 0 (0.0%) |
| College or Associate's Degree | 32 (100.0%) | 0 (0.0%) |
| Bachelor's Degree | 0 (0.0%) | 0 (0.0%) |
| Graduate Degree | 0 (0.0%) | 0 (0.0%) |
| Total | 43 (100.0%) | 0 (0.0%) |
Employment Characteristics in North Shore
Employment by Class of Employer in North Shore
Among the 1,449 employed individuals in North Shore, private company employees (1,003 | 69.2%), not-for-profit organizations (374 | 25.8%), and state government employees (29 | 2.0%) make up the most common classes of employment.
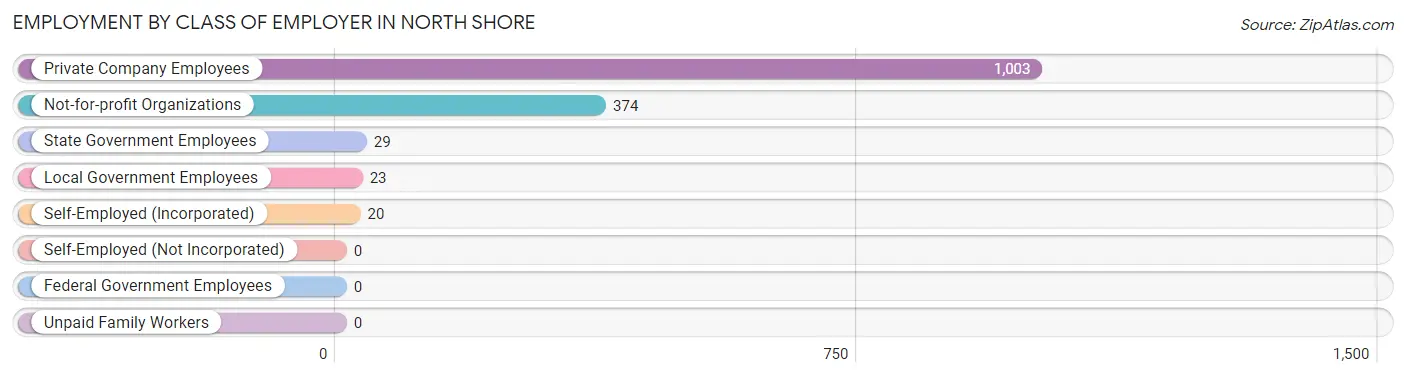
| Employer Class | # Employees | % Employees |
| Private Company Employees | 1,003 | 69.2% |
| Self-Employed (Incorporated) | 20 | 1.4% |
| Self-Employed (Not Incorporated) | 0 | 0.0% |
| Not-for-profit Organizations | 374 | 25.8% |
| Local Government Employees | 23 | 1.6% |
| State Government Employees | 29 | 2.0% |
| Federal Government Employees | 0 | 0.0% |
| Unpaid Family Workers | 0 | 0.0% |
| Total | 1,449 | 100.0% |
Employment Status by Age in North Shore
According to the labor force statistics for North Shore, out of the total population over 16 years of age (2,363), 69.6% or 1,645 individuals are in the labor force, with 10.9% or 179 of them unemployed. The age group with the highest labor force participation rate is 25 to 29 years, with 100.0% or 57 individuals in the labor force. Within the labor force, the 16 to 19 years age range has the highest percentage of unemployed individuals, with 48.2% or 80 of them being unemployed.
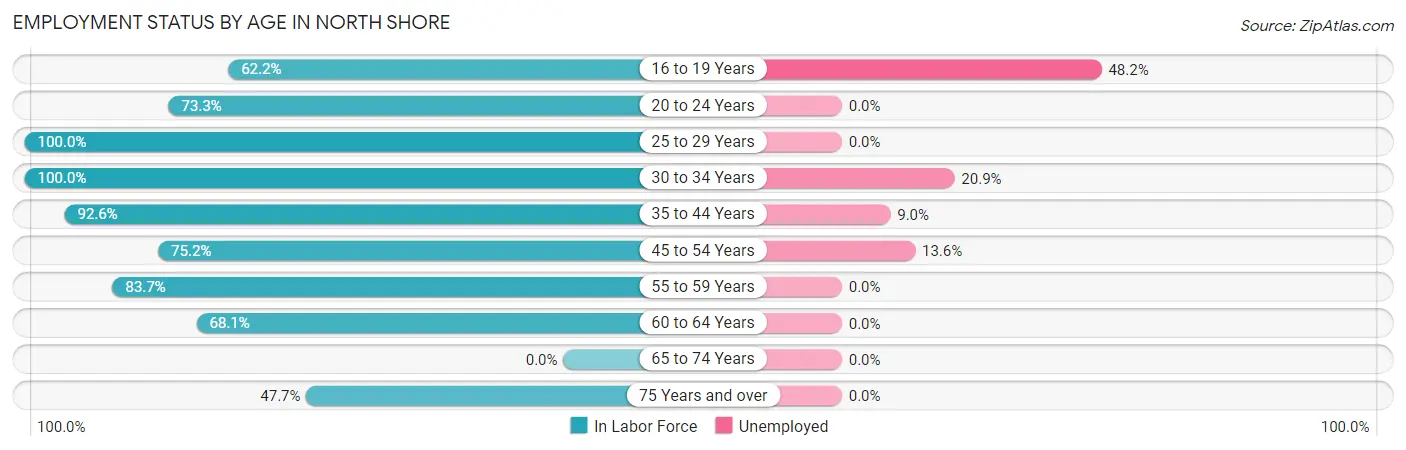
| Age Bracket | In Labor Force | Unemployed |
| 16 to 19 Years | 166 (62.2%) | 80 (48.2%) |
| 20 to 24 Years | 285 (73.3%) | 0 (0.0%) |
| 25 to 29 Years | 57 (100.0%) | 0 (0.0%) |
| 30 to 34 Years | 153 (100.0%) | 32 (20.9%) |
| 35 to 44 Years | 323 (92.6%) | 29 (9.0%) |
| 45 to 54 Years | 279 (75.2%) | 38 (13.6%) |
| 55 to 59 Years | 313 (83.7%) | 0 (0.0%) |
| 60 to 64 Years | 47 (68.1%) | 0 (0.0%) |
| 65 to 74 Years | 0 (0.0%) | 0 (0.0%) |
| 75 Years and over | 21 (47.7%) | 0 (0.0%) |
| Total | 1,645 (69.6%) | 179 (10.9%) |
Employment Status by Educational Attainment in North Shore
According to labor force statistics for North Shore, 85.4% of individuals (1,173) out of the total population between 25 and 64 years of age (1,373) are in the labor force, with 8.4% or 99 of them being unemployed. The group with the highest labor force participation rate are those with the educational attainment of bachelor's degree or higher, with 100.0% or 10 individuals in the labor force. Within the labor force, individuals with less than high school education have the highest percentage of unemployment, with 10.6% or 70 of them being unemployed.
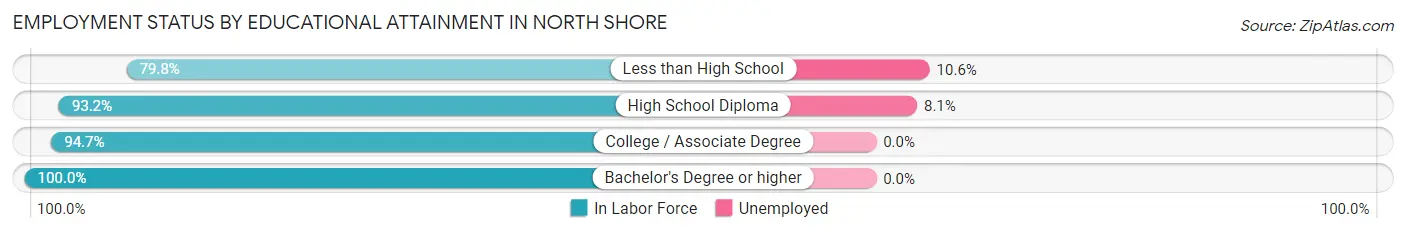
| Educational Attainment | In Labor Force | Unemployed |
| Less than High School | 661 (79.8%) | 88 (10.6%) |
| High School Diploma | 359 (93.2%) | 31 (8.1%) |
| College / Associate Degree | 142 (94.7%) | 0 (0.0%) |
| Bachelor's Degree or higher | 10 (100.0%) | 0 (0.0%) |
| Total | 1,173 (85.4%) | 115 (8.4%) |
Employment Occupations by Sex in North Shore
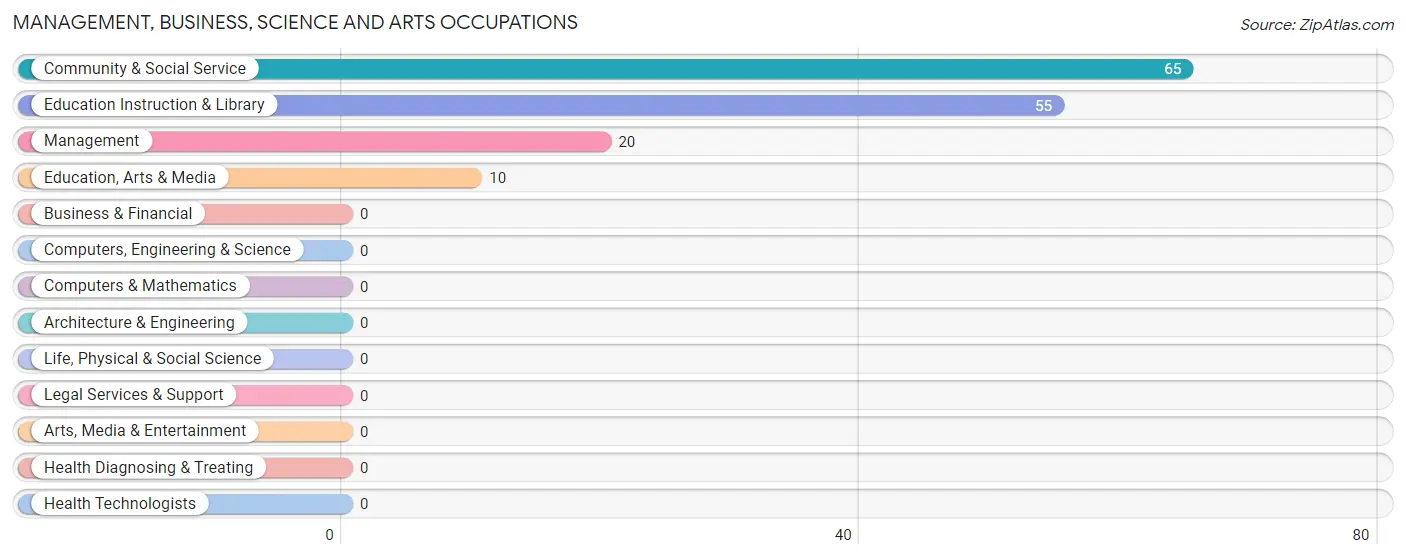
Management, Business, Science and Arts Occupations
The most common Management, Business, Science and Arts occupations in North Shore are Community & Social Service (65 | 4.4%), Education Instruction & Library (55 | 3.7%), Management (20 | 1.4%), and Education, Arts & Media (10 | 0.7%).
Management, Business, Science and Arts Occupations by Sex
Within the Management, Business, Science and Arts occupations in North Shore, the most male-oriented occupations are Education Instruction & Library (47.3%), and Community & Social Service (40.0%), while the most female-oriented occupations are Management (100.0%), Education, Arts & Media (100.0%), and Community & Social Service (60.0%).
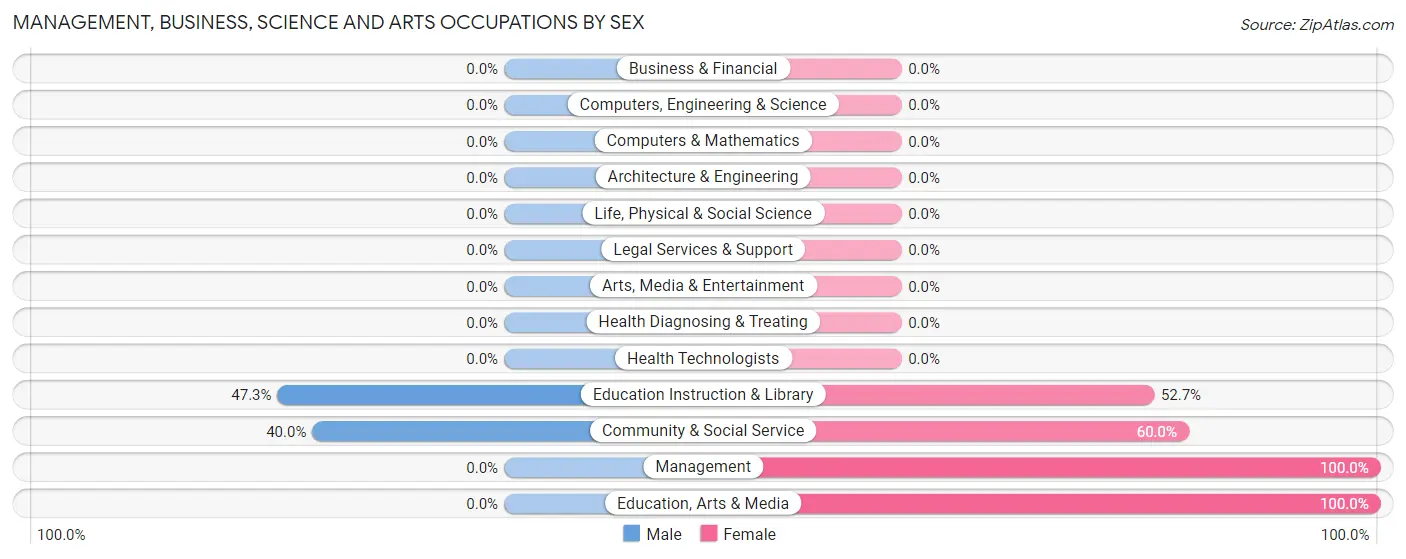
| Occupation | Male | Female |
| Management | 0 (0.0%) | 20 (100.0%) |
| Business & Financial | 0 (0.0%) | 0 (0.0%) |
| Computers, Engineering & Science | 0 (0.0%) | 0 (0.0%) |
| Computers & Mathematics | 0 (0.0%) | 0 (0.0%) |
| Architecture & Engineering | 0 (0.0%) | 0 (0.0%) |
| Life, Physical & Social Science | 0 (0.0%) | 0 (0.0%) |
| Community & Social Service | 26 (40.0%) | 39 (60.0%) |
| Education, Arts & Media | 0 (0.0%) | 10 (100.0%) |
| Legal Services & Support | 0 (0.0%) | 0 (0.0%) |
| Education Instruction & Library | 26 (47.3%) | 29 (52.7%) |
| Arts, Media & Entertainment | 0 (0.0%) | 0 (0.0%) |
| Health Diagnosing & Treating | 0 (0.0%) | 0 (0.0%) |
| Health Technologists | 0 (0.0%) | 0 (0.0%) |
| Total (Category) | 26 (30.6%) | 59 (69.4%) |
| Total (Overall) | 733 (50.0%) | 732 (50.0%) |
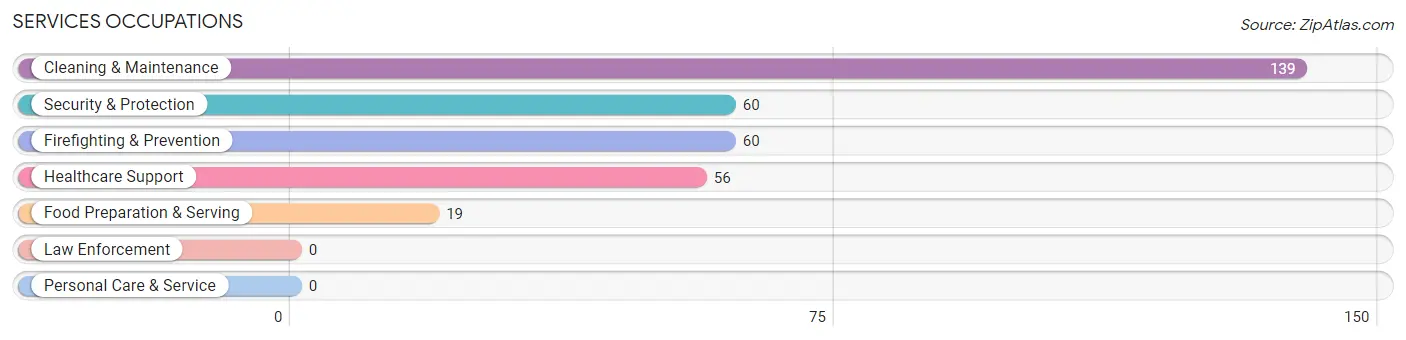
Services Occupations
The most common Services occupations in North Shore are Cleaning & Maintenance (139 | 9.5%), Security & Protection (60 | 4.1%), Firefighting & Prevention (60 | 4.1%), Healthcare Support (56 | 3.8%), and Food Preparation & Serving (19 | 1.3%).
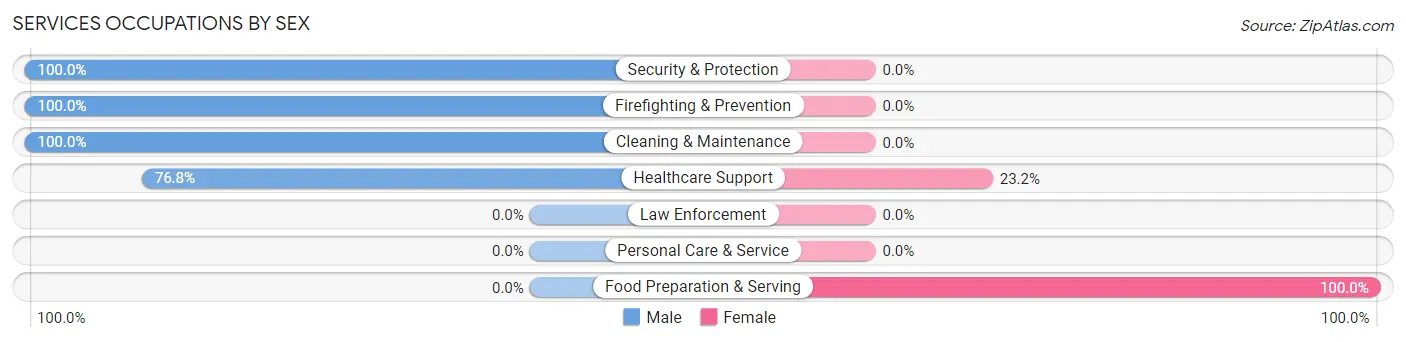
Services Occupations by Sex
Within the Services occupations in North Shore, the most male-oriented occupations are Security & Protection (100.0%), Firefighting & Prevention (100.0%), and Cleaning & Maintenance (100.0%), while the most female-oriented occupations are Food Preparation & Serving (100.0%), and Healthcare Support (23.2%).
| Occupation | Male | Female |
| Healthcare Support | 43 (76.8%) | 13 (23.2%) |
| Security & Protection | 60 (100.0%) | 0 (0.0%) |
| Firefighting & Prevention | 60 (100.0%) | 0 (0.0%) |
| Law Enforcement | 0 (0.0%) | 0 (0.0%) |
| Food Preparation & Serving | 0 (0.0%) | 19 (100.0%) |
| Cleaning & Maintenance | 139 (100.0%) | 0 (0.0%) |
| Personal Care & Service | 0 (0.0%) | 0 (0.0%) |
| Total (Category) | 242 (88.3%) | 32 (11.7%) |
| Total (Overall) | 733 (50.0%) | 732 (50.0%) |
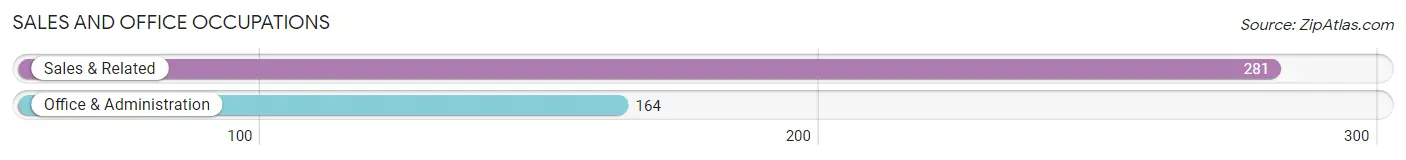
Sales and Office Occupations
The most common Sales and Office occupations in North Shore are Sales & Related (281 | 19.2%), and Office & Administration (164 | 11.2%).
Sales and Office Occupations by Sex
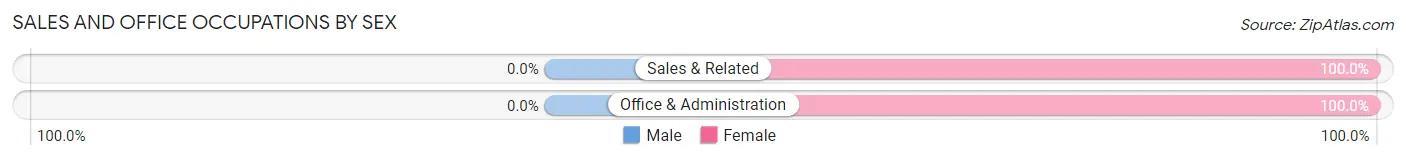
| Occupation | Male | Female |
| Sales & Related | 0 (0.0%) | 281 (100.0%) |
| Office & Administration | 0 (0.0%) | 164 (100.0%) |
| Total (Category) | 0 (0.0%) | 445 (100.0%) |
| Total (Overall) | 733 (50.0%) | 732 (50.0%) |
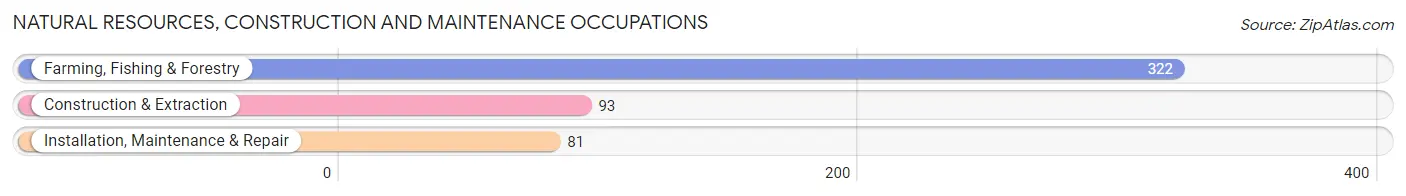
Natural Resources, Construction and Maintenance Occupations
The most common Natural Resources, Construction and Maintenance occupations in North Shore are Farming, Fishing & Forestry (322 | 22.0%), Construction & Extraction (93 | 6.4%), and Installation, Maintenance & Repair (81 | 5.5%).
Natural Resources, Construction and Maintenance Occupations by Sex
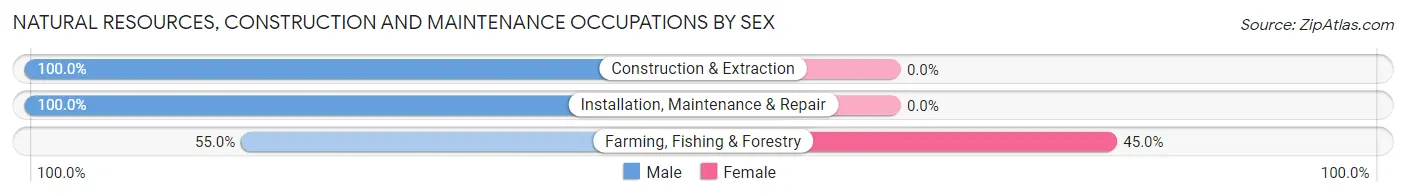
| Occupation | Male | Female |
| Farming, Fishing & Forestry | 177 (55.0%) | 145 (45.0%) |
| Construction & Extraction | 93 (100.0%) | 0 (0.0%) |
| Installation, Maintenance & Repair | 81 (100.0%) | 0 (0.0%) |
| Total (Category) | 351 (70.8%) | 145 (29.2%) |
| Total (Overall) | 733 (50.0%) | 732 (50.0%) |
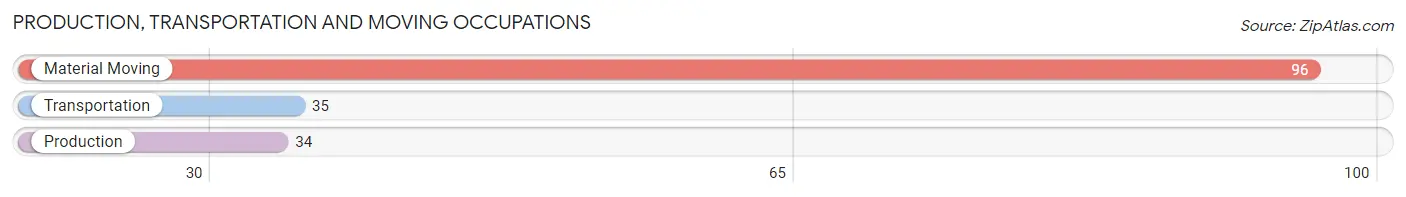
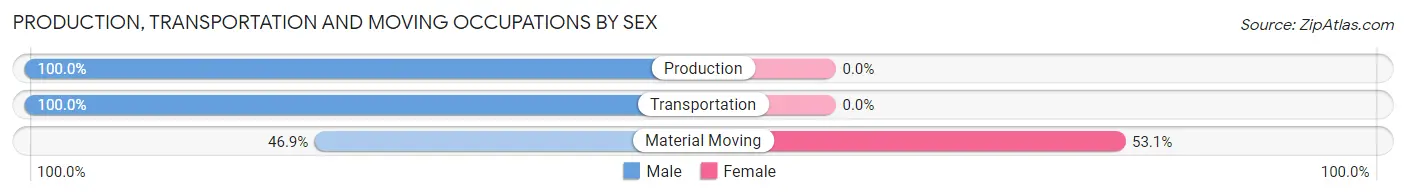
Production, Transportation and Moving Occupations
The most common Production, Transportation and Moving occupations in North Shore are Material Moving (96 | 6.6%), Transportation (35 | 2.4%), and Production (34 | 2.3%).
Production, Transportation and Moving Occupations by Sex
| Occupation | Male | Female |
| Production | 34 (100.0%) | 0 (0.0%) |
| Transportation | 35 (100.0%) | 0 (0.0%) |
| Material Moving | 45 (46.9%) | 51 (53.1%) |
| Total (Category) | 114 (69.1%) | 51 (30.9%) |
| Total (Overall) | 733 (50.0%) | 732 (50.0%) |
Employment Industries by Sex in North Shore
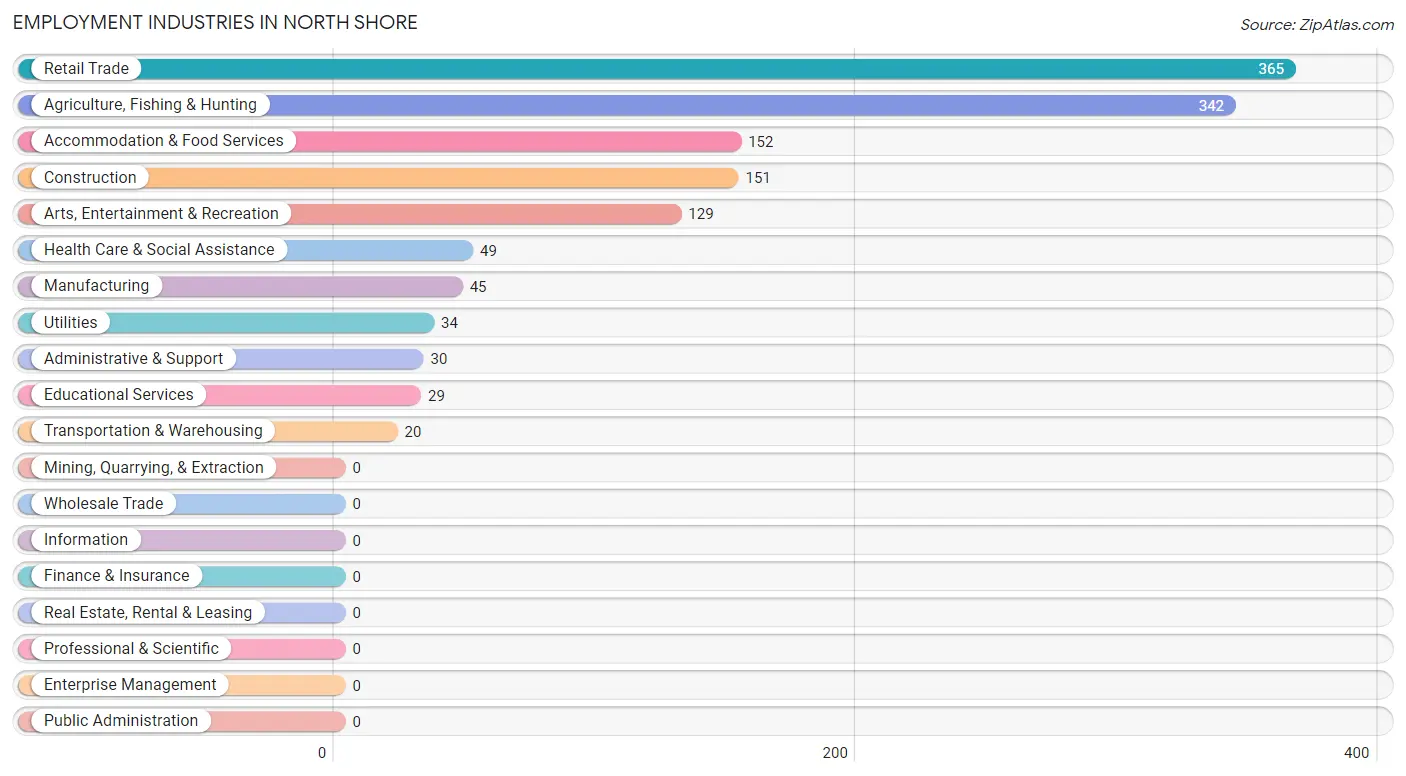
Employment Industries in North Shore
The major employment industries in North Shore include Retail Trade (365 | 24.9%), Agriculture, Fishing & Hunting (342 | 23.3%), Accommodation & Food Services (152 | 10.4%), Construction (151 | 10.3%), and Arts, Entertainment & Recreation (129 | 8.8%).
Employment Industries by Sex in North Shore
The North Shore industries that see more men than women are Construction (100.0%), Manufacturing (100.0%), and Transportation & Warehousing (100.0%), whereas the industries that tend to have a higher number of women are Utilities (100.0%), Educational Services (100.0%), and Retail Trade (92.6%).
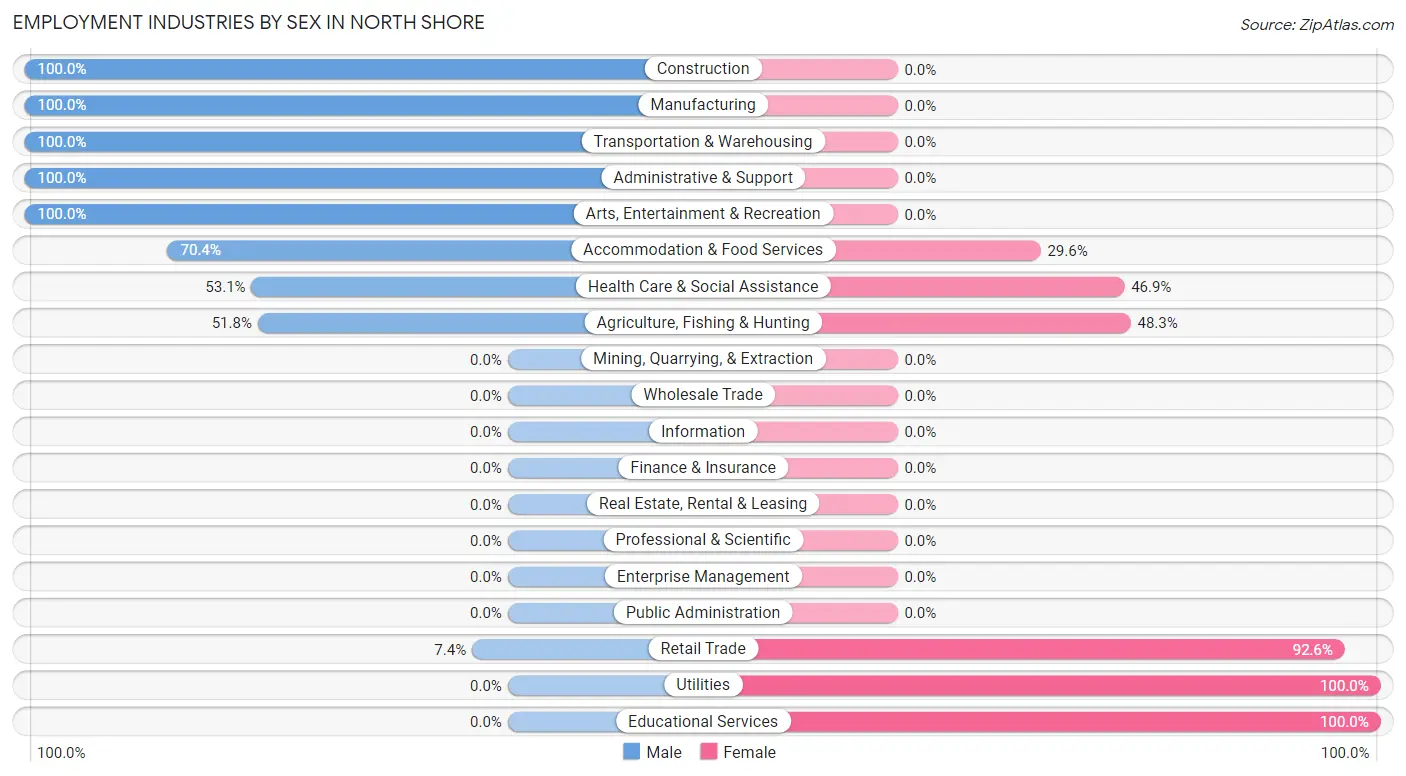
| Industry | Male | Female |
| Agriculture, Fishing & Hunting | 177 (51.7%) | 165 (48.2%) |
| Mining, Quarrying, & Extraction | 0 (0.0%) | 0 (0.0%) |
| Construction | 151 (100.0%) | 0 (0.0%) |
| Manufacturing | 45 (100.0%) | 0 (0.0%) |
| Wholesale Trade | 0 (0.0%) | 0 (0.0%) |
| Retail Trade | 27 (7.4%) | 338 (92.6%) |
| Transportation & Warehousing | 20 (100.0%) | 0 (0.0%) |
| Utilities | 0 (0.0%) | 34 (100.0%) |
| Information | 0 (0.0%) | 0 (0.0%) |
| Finance & Insurance | 0 (0.0%) | 0 (0.0%) |
| Real Estate, Rental & Leasing | 0 (0.0%) | 0 (0.0%) |
| Professional & Scientific | 0 (0.0%) | 0 (0.0%) |
| Enterprise Management | 0 (0.0%) | 0 (0.0%) |
| Administrative & Support | 30 (100.0%) | 0 (0.0%) |
| Educational Services | 0 (0.0%) | 29 (100.0%) |
| Health Care & Social Assistance | 26 (53.1%) | 23 (46.9%) |
| Arts, Entertainment & Recreation | 129 (100.0%) | 0 (0.0%) |
| Accommodation & Food Services | 107 (70.4%) | 45 (29.6%) |
| Public Administration | 0 (0.0%) | 0 (0.0%) |
| Total | 733 (50.0%) | 732 (50.0%) |
Education in North Shore
School Enrollment in North Shore
The most common levels of schooling among the 590 students in North Shore are college / undergraduate (236 | 40.0%), graduate / professional (98 | 16.6%), and elementary school (95 | 16.1%).
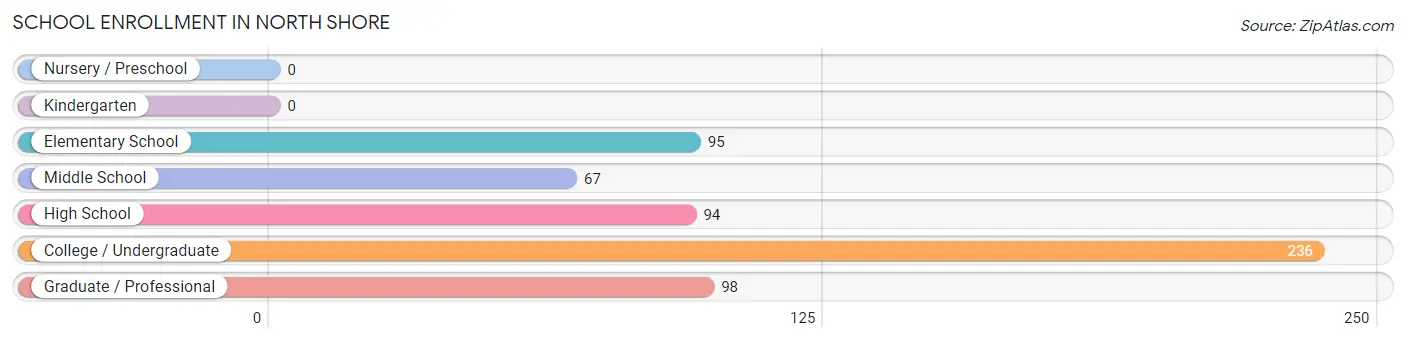
| School Level | # Students | % Students |
| Nursery / Preschool | 0 | 0.0% |
| Kindergarten | 0 | 0.0% |
| Elementary School | 95 | 16.1% |
| Middle School | 67 | 11.4% |
| High School | 94 | 15.9% |
| College / Undergraduate | 236 | 40.0% |
| Graduate / Professional | 98 | 16.6% |
| Total | 590 | 100.0% |
School Enrollment by Age by Funding Source in North Shore
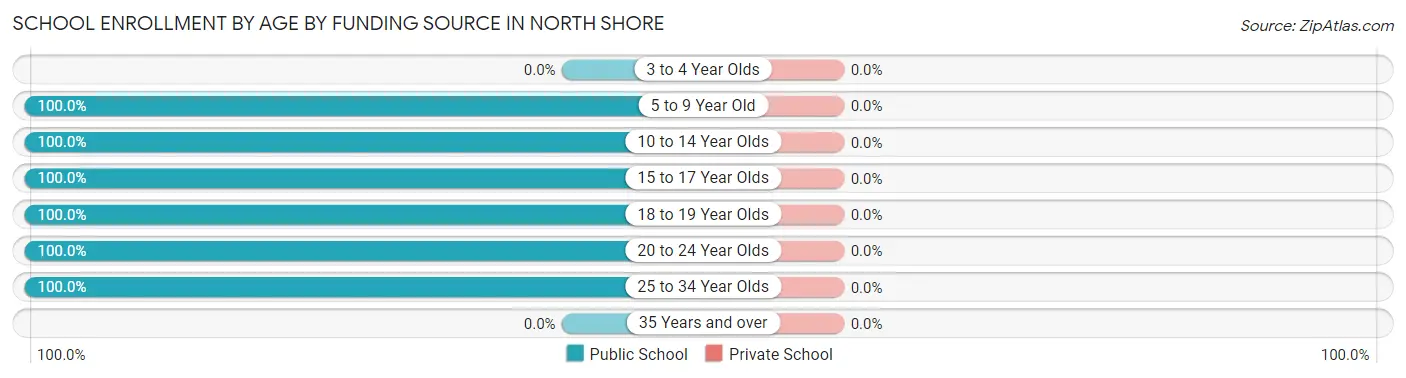
| Age Bracket | Public School | Private School |
| 3 to 4 Year Olds | 0 (0.0%) | 0 (0.0%) |
| 5 to 9 Year Old | 95 (100.0%) | 0 (0.0%) |
| 10 to 14 Year Olds | 85 (100.0%) | 0 (0.0%) |
| 15 to 17 Year Olds | 76 (100.0%) | 0 (0.0%) |
| 18 to 19 Year Olds | 111 (100.0%) | 0 (0.0%) |
| 20 to 24 Year Olds | 210 (100.0%) | 0 (0.0%) |
| 25 to 34 Year Olds | 13 (100.0%) | 0 (0.0%) |
| 35 Years and over | 0 (0.0%) | 0 (0.0%) |
| Total | 590 (100.0%) | 0 (0.0%) |
Educational Attainment by Field of Study in North Shore
, and social sciences (10 | 100.0%) are the most common fields of study among 10 individuals in North Shore who have obtained a bachelor's degree or higher.
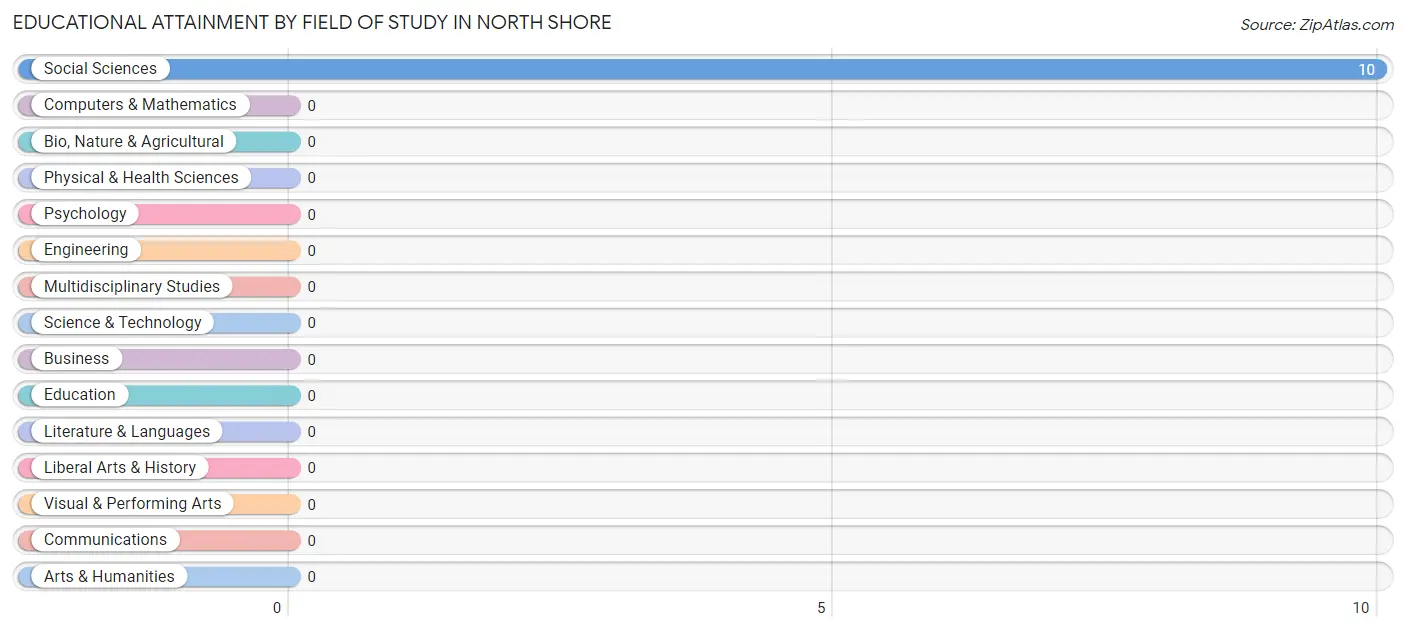
| Field of Study | # Graduates | % Graduates |
| Computers & Mathematics | 0 | 0.0% |
| Bio, Nature & Agricultural | 0 | 0.0% |
| Physical & Health Sciences | 0 | 0.0% |
| Psychology | 0 | 0.0% |
| Social Sciences | 10 | 100.0% |
| Engineering | 0 | 0.0% |
| Multidisciplinary Studies | 0 | 0.0% |
| Science & Technology | 0 | 0.0% |
| Business | 0 | 0.0% |
| Education | 0 | 0.0% |
| Literature & Languages | 0 | 0.0% |
| Liberal Arts & History | 0 | 0.0% |
| Visual & Performing Arts | 0 | 0.0% |
| Communications | 0 | 0.0% |
| Arts & Humanities | 0 | 0.0% |
| Total | 10 | 100.0% |
Transportation & Commute in North Shore
Vehicle Availability by Sex in North Shore
The most prevalent vehicle ownership categories in North Shore are males with 3 vehicles (271, accounting for 37.0%) and females with 3 vehicles (94, making up 37.9%).
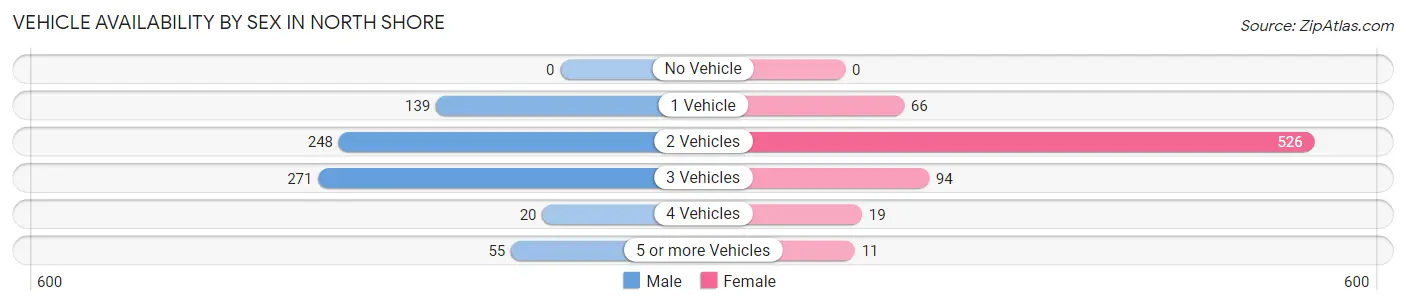
| Vehicles Available | Male | Female |
| No Vehicle | 0 (0.0%) | 0 (0.0%) |
| 1 Vehicle | 139 (19.0%) | 66 (9.2%) |
| 2 Vehicles | 248 (33.8%) | 526 (73.5%) |
| 3 Vehicles | 271 (37.0%) | 94 (13.1%) |
| 4 Vehicles | 20 (2.7%) | 19 (2.6%) |
| 5 or more Vehicles | 55 (7.5%) | 11 (1.5%) |
| Total | 733 (100.0%) | 716 (100.0%) |
Commute Time in North Shore
The most frequently occuring commute durations in North Shore are 15 to 19 minutes (519 commuters, 35.8%), 30 to 34 minutes (378 commuters, 26.1%), and 45 to 59 minutes (144 commuters, 9.9%).
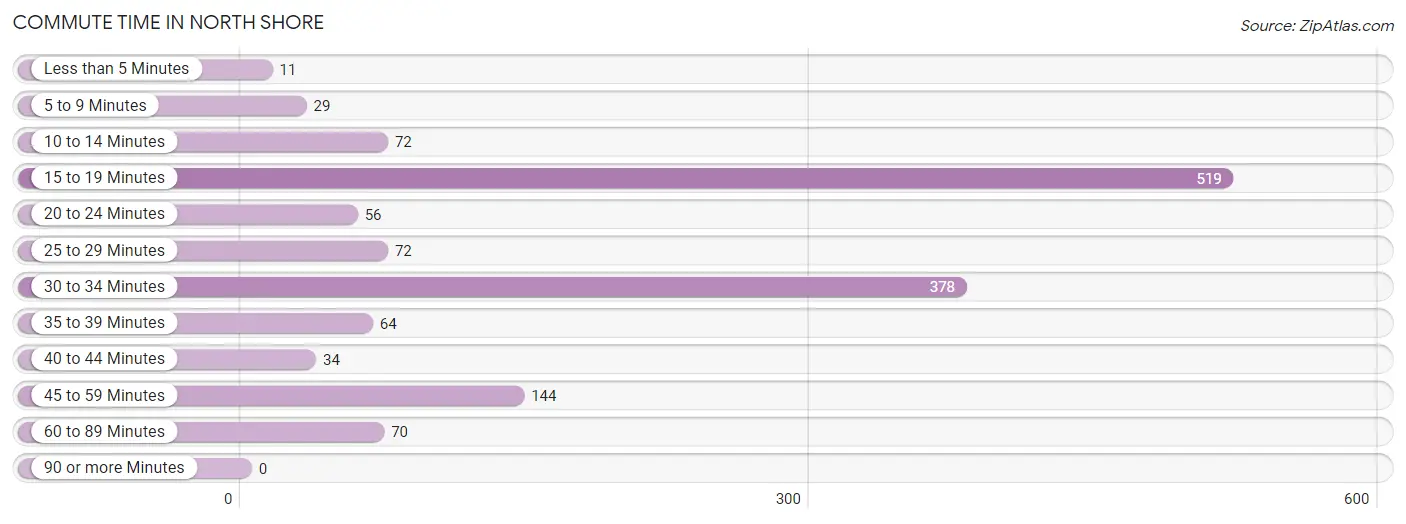
| Commute Time | # Commuters | % Commuters |
| Less than 5 Minutes | 11 | 0.8% |
| 5 to 9 Minutes | 29 | 2.0% |
| 10 to 14 Minutes | 72 | 5.0% |
| 15 to 19 Minutes | 519 | 35.8% |
| 20 to 24 Minutes | 56 | 3.9% |
| 25 to 29 Minutes | 72 | 5.0% |
| 30 to 34 Minutes | 378 | 26.1% |
| 35 to 39 Minutes | 64 | 4.4% |
| 40 to 44 Minutes | 34 | 2.4% |
| 45 to 59 Minutes | 144 | 9.9% |
| 60 to 89 Minutes | 70 | 4.8% |
| 90 or more Minutes | 0 | 0.0% |
Commute Time by Sex in North Shore
The most common commute times in North Shore are 30 to 34 minutes (320 commuters, 43.7%) for males and 15 to 19 minutes (383 commuters, 53.5%) for females.
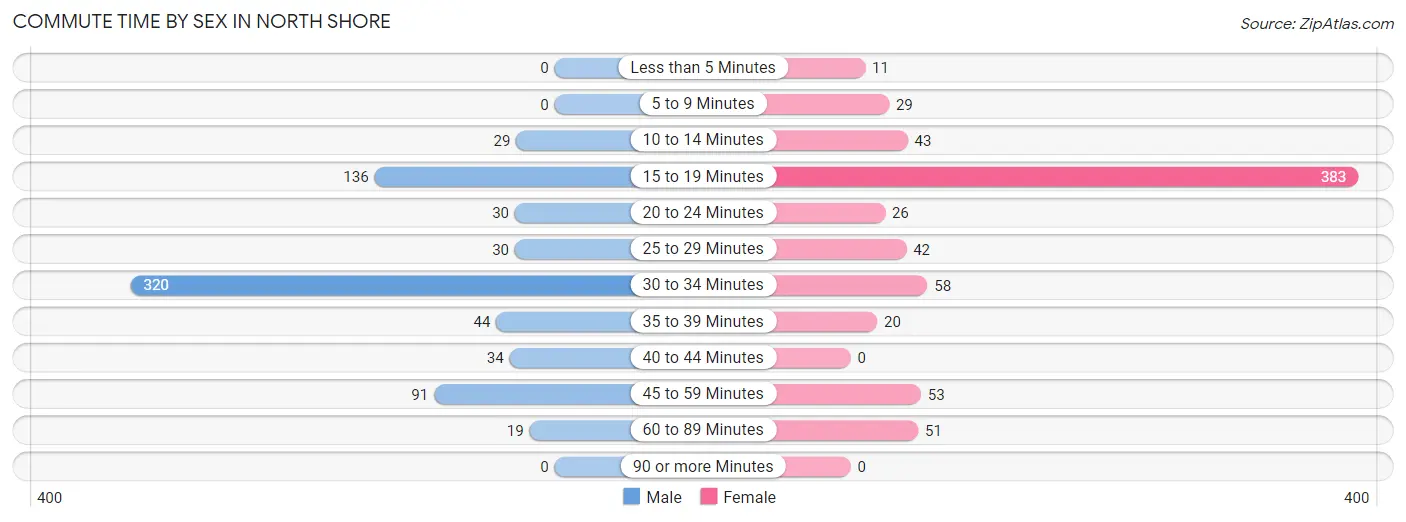
| Commute Time | Male | Female |
| Less than 5 Minutes | 0 (0.0%) | 11 (1.5%) |
| 5 to 9 Minutes | 0 (0.0%) | 29 (4.1%) |
| 10 to 14 Minutes | 29 (4.0%) | 43 (6.0%) |
| 15 to 19 Minutes | 136 (18.5%) | 383 (53.5%) |
| 20 to 24 Minutes | 30 (4.1%) | 26 (3.6%) |
| 25 to 29 Minutes | 30 (4.1%) | 42 (5.9%) |
| 30 to 34 Minutes | 320 (43.7%) | 58 (8.1%) |
| 35 to 39 Minutes | 44 (6.0%) | 20 (2.8%) |
| 40 to 44 Minutes | 34 (4.6%) | 0 (0.0%) |
| 45 to 59 Minutes | 91 (12.4%) | 53 (7.4%) |
| 60 to 89 Minutes | 19 (2.6%) | 51 (7.1%) |
| 90 or more Minutes | 0 (0.0%) | 0 (0.0%) |
Time of Departure to Work by Sex in North Shore
The most frequent times of departure to work in North Shore are 6:00 AM to 6:29 AM (166, 22.7%) for males and 8:30 AM to 8:59 AM (308, 43.0%) for females.
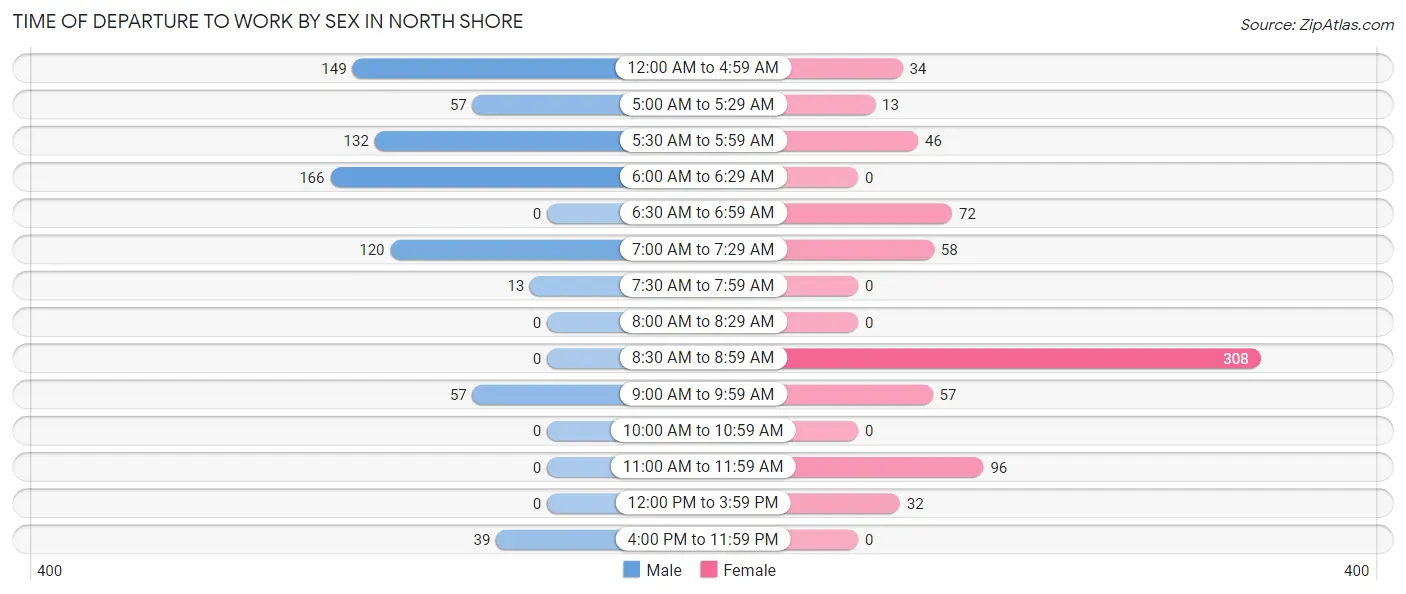
| Time of Departure | Male | Female |
| 12:00 AM to 4:59 AM | 149 (20.3%) | 34 (4.8%) |
| 5:00 AM to 5:29 AM | 57 (7.8%) | 13 (1.8%) |
| 5:30 AM to 5:59 AM | 132 (18.0%) | 46 (6.4%) |
| 6:00 AM to 6:29 AM | 166 (22.7%) | 0 (0.0%) |
| 6:30 AM to 6:59 AM | 0 (0.0%) | 72 (10.1%) |
| 7:00 AM to 7:29 AM | 120 (16.4%) | 58 (8.1%) |
| 7:30 AM to 7:59 AM | 13 (1.8%) | 0 (0.0%) |
| 8:00 AM to 8:29 AM | 0 (0.0%) | 0 (0.0%) |
| 8:30 AM to 8:59 AM | 0 (0.0%) | 308 (43.0%) |
| 9:00 AM to 9:59 AM | 57 (7.8%) | 57 (8.0%) |
| 10:00 AM to 10:59 AM | 0 (0.0%) | 0 (0.0%) |
| 11:00 AM to 11:59 AM | 0 (0.0%) | 96 (13.4%) |
| 12:00 PM to 3:59 PM | 0 (0.0%) | 32 (4.5%) |
| 4:00 PM to 11:59 PM | 39 (5.3%) | 0 (0.0%) |
| Total | 733 (100.0%) | 716 (100.0%) |
Housing Occupancy in North Shore
Occupancy by Ownership in North Shore
Of the total 1,001 dwellings in North Shore, owner-occupied units account for 969 (96.8%), while renter-occupied units make up 32 (3.2%).
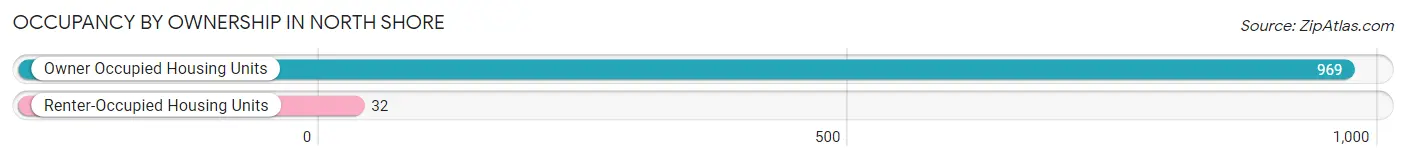
| Occupancy | # Housing Units | % Housing Units |
| Owner Occupied Housing Units | 969 | 96.8% |
| Renter-Occupied Housing Units | 32 | 3.2% |
| Total Occupied Housing Units | 1,001 | 100.0% |
Occupancy by Household Size in North Shore
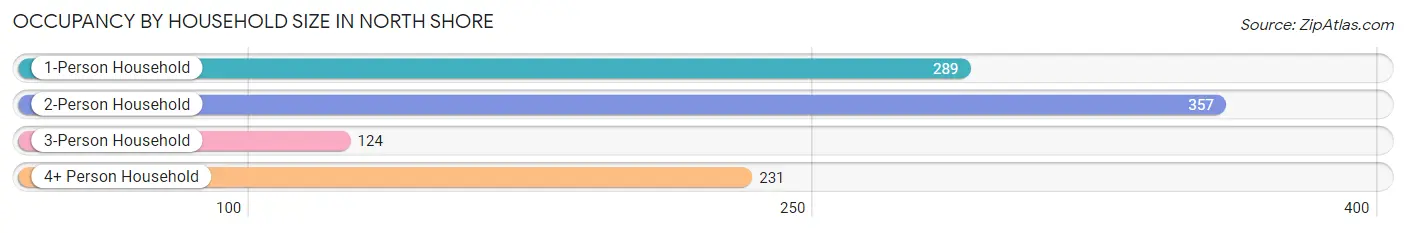
| Household Size | # Housing Units | % Housing Units |
| 1-Person Household | 289 | 28.9% |
| 2-Person Household | 357 | 35.7% |
| 3-Person Household | 124 | 12.4% |
| 4+ Person Household | 231 | 23.1% |
| Total Housing Units | 1,001 | 100.0% |
Occupancy by Ownership by Household Size in North Shore
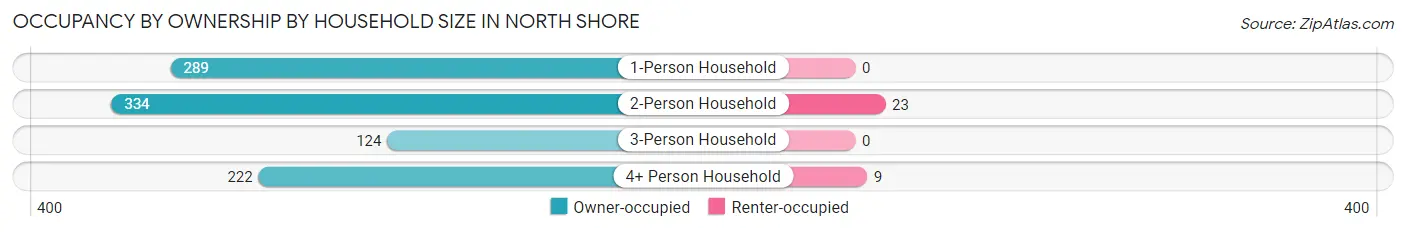
| Household Size | Owner-occupied | Renter-occupied |
| 1-Person Household | 289 (100.0%) | 0 (0.0%) |
| 2-Person Household | 334 (93.6%) | 23 (6.4%) |
| 3-Person Household | 124 (100.0%) | 0 (0.0%) |
| 4+ Person Household | 222 (96.1%) | 9 (3.9%) |
| Total Housing Units | 969 (96.8%) | 32 (3.2%) |
Occupancy by Educational Attainment in North Shore
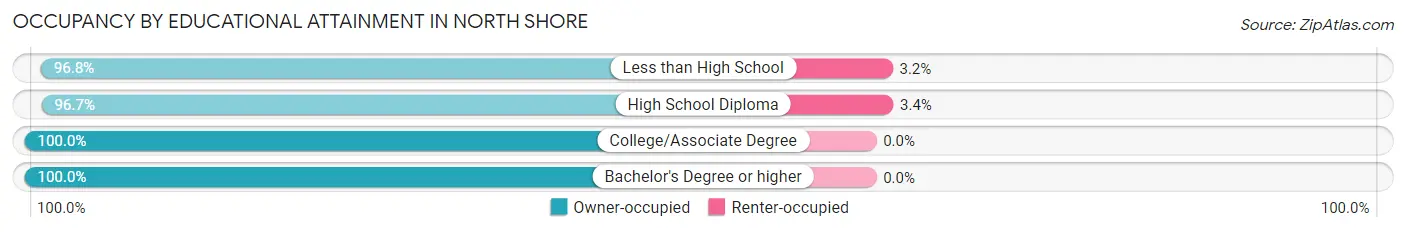
| Household Size | Owner-occupied | Renter-occupied |
| Less than High School | 686 (96.8%) | 23 (3.2%) |
| High School Diploma | 260 (96.7%) | 9 (3.4%) |
| College/Associate Degree | 13 (100.0%) | 0 (0.0%) |
| Bachelor's Degree or higher | 10 (100.0%) | 0 (0.0%) |
Occupancy by Age of Householder in North Shore
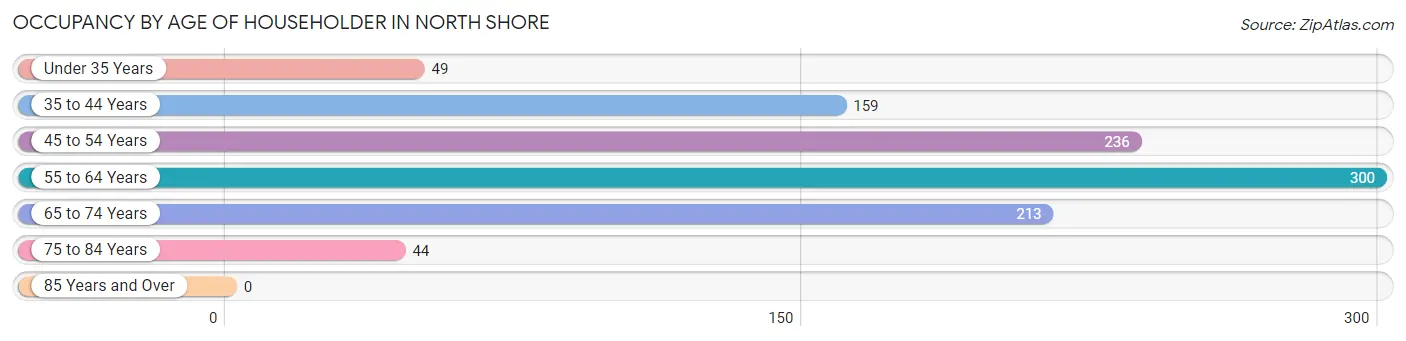
| Age Bracket | # Households | % Households |
| Under 35 Years | 49 | 4.9% |
| 35 to 44 Years | 159 | 15.9% |
| 45 to 54 Years | 236 | 23.6% |
| 55 to 64 Years | 300 | 30.0% |
| 65 to 74 Years | 213 | 21.3% |
| 75 to 84 Years | 44 | 4.4% |
| 85 Years and Over | 0 | 0.0% |
| Total | 1,001 | 100.0% |
Housing Finances in North Shore
Median Income by Occupancy in North Shore
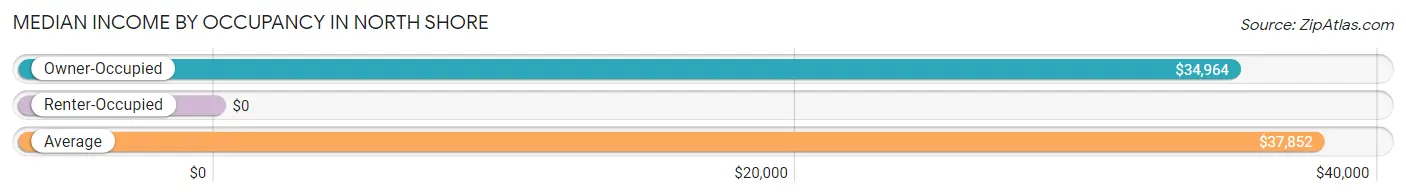
| Occupancy Type | # Households | Median Income |
| Owner-Occupied | 969 (96.8%) | $34,964 |
| Renter-Occupied | 32 (3.2%) | $0 |
| Average | 1,001 (100.0%) | $37,852 |
Occupancy by Householder Income Bracket in North Shore
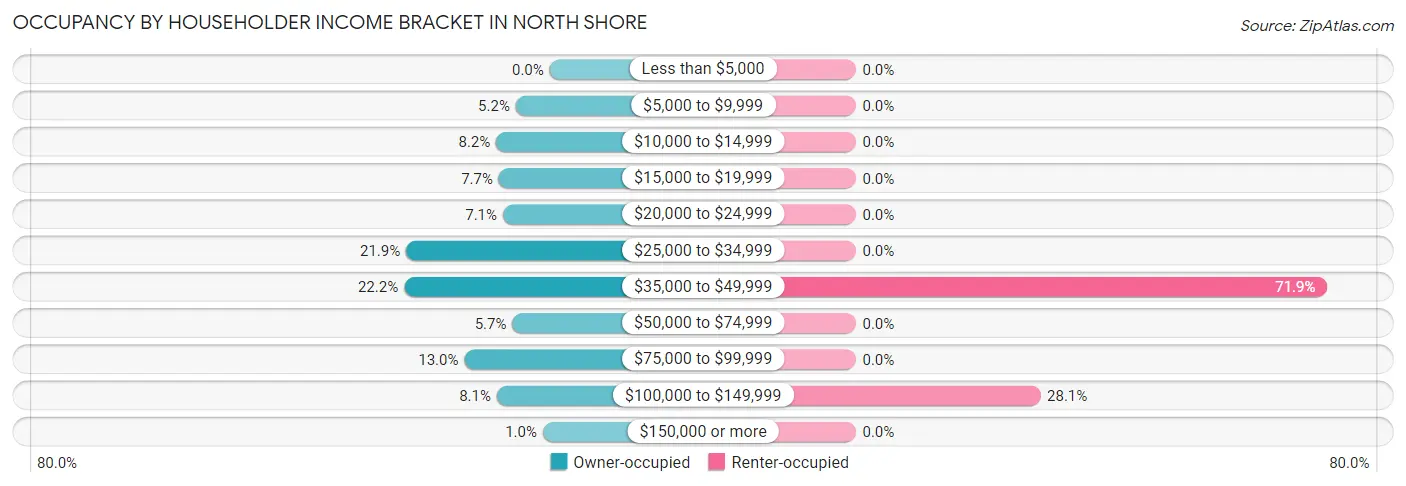
| Income Bracket | Owner-occupied | Renter-occupied |
| Less than $5,000 | 0 (0.0%) | 0 (0.0%) |
| $5,000 to $9,999 | 50 (5.2%) | 0 (0.0%) |
| $10,000 to $14,999 | 79 (8.2%) | 0 (0.0%) |
| $15,000 to $19,999 | 75 (7.7%) | 0 (0.0%) |
| $20,000 to $24,999 | 69 (7.1%) | 0 (0.0%) |
| $25,000 to $34,999 | 212 (21.9%) | 0 (0.0%) |
| $35,000 to $49,999 | 215 (22.2%) | 23 (71.9%) |
| $50,000 to $74,999 | 55 (5.7%) | 0 (0.0%) |
| $75,000 to $99,999 | 126 (13.0%) | 0 (0.0%) |
| $100,000 to $149,999 | 78 (8.1%) | 9 (28.1%) |
| $150,000 or more | 10 (1.0%) | 0 (0.0%) |
| Total | 969 (100.0%) | 32 (100.0%) |
Monthly Housing Cost Tiers in North Shore
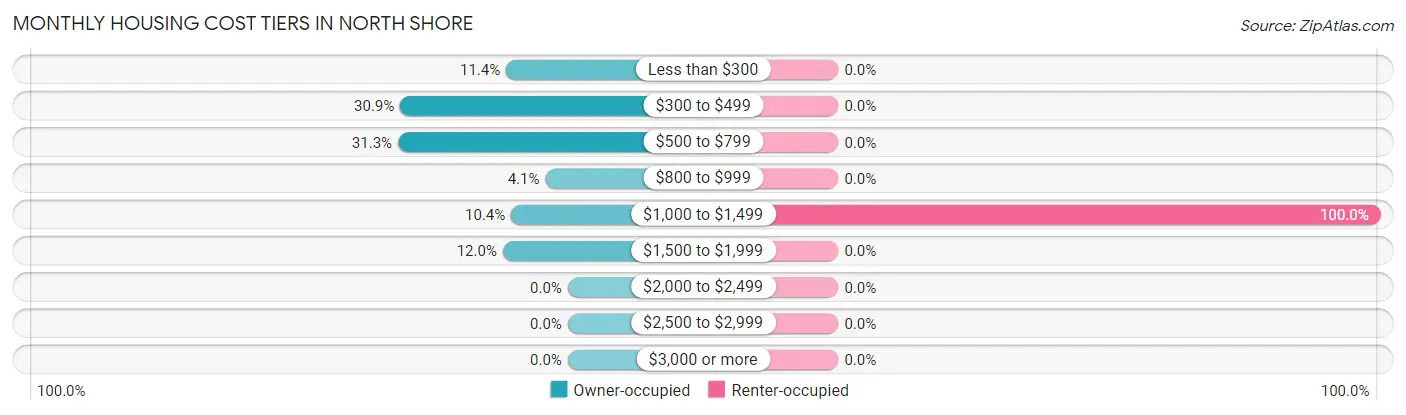
| Monthly Cost | Owner-occupied | Renter-occupied |
| Less than $300 | 110 (11.4%) | 0 (0.0%) |
| $300 to $499 | 299 (30.9%) | 0 (0.0%) |
| $500 to $799 | 303 (31.3%) | 0 (0.0%) |
| $800 to $999 | 40 (4.1%) | 0 (0.0%) |
| $1,000 to $1,499 | 101 (10.4%) | 32 (100.0%) |
| $1,500 to $1,999 | 116 (12.0%) | 0 (0.0%) |
| $2,000 to $2,499 | 0 (0.0%) | 0 (0.0%) |
| $2,500 to $2,999 | 0 (0.0%) | 0 (0.0%) |
| $3,000 or more | 0 (0.0%) | 0 (0.0%) |
| Total | 969 (100.0%) | 32 (100.0%) |
Physical Housing Characteristics in North Shore
Housing Structures in North Shore
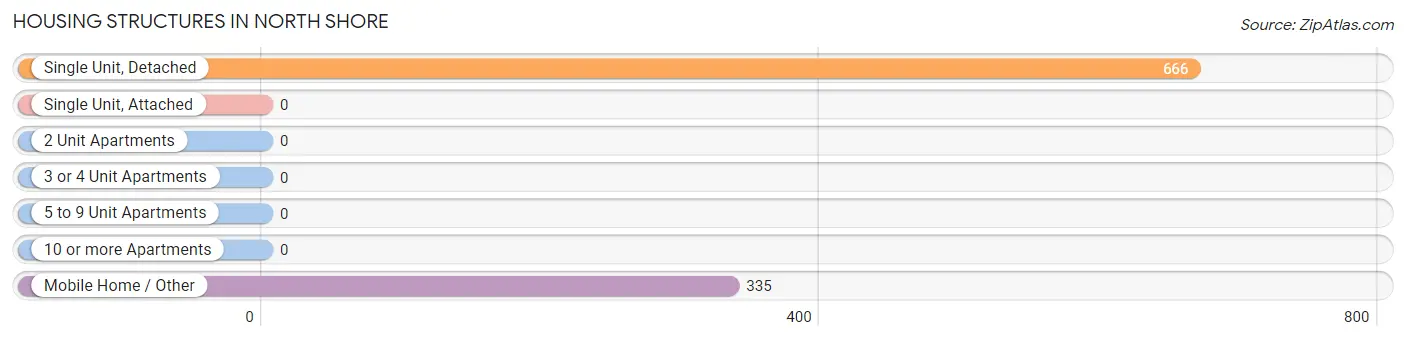
| Structure Type | # Housing Units | % Housing Units |
| Single Unit, Detached | 666 | 66.5% |
| Single Unit, Attached | 0 | 0.0% |
| 2 Unit Apartments | 0 | 0.0% |
| 3 or 4 Unit Apartments | 0 | 0.0% |
| 5 to 9 Unit Apartments | 0 | 0.0% |
| 10 or more Apartments | 0 | 0.0% |
| Mobile Home / Other | 335 | 33.5% |
| Total | 1,001 | 100.0% |
Housing Structures by Occupancy in North Shore
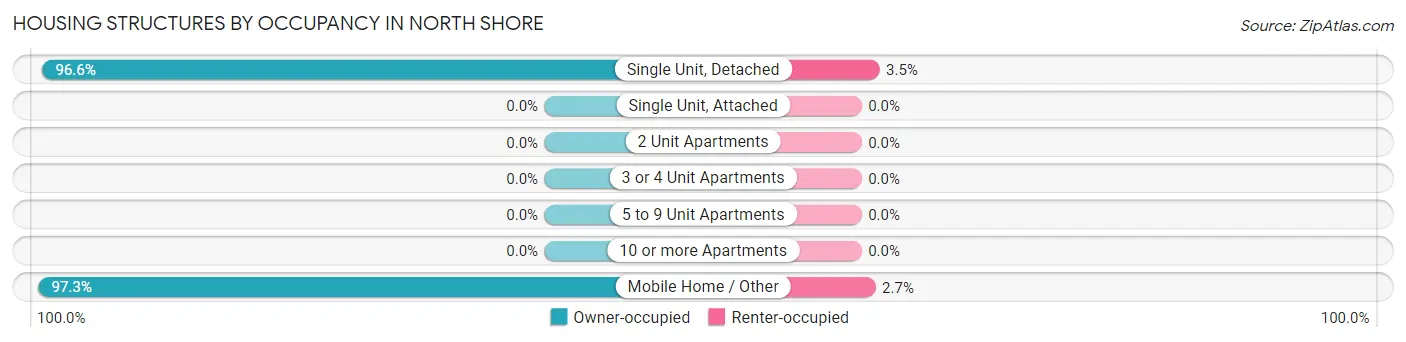
| Structure Type | Owner-occupied | Renter-occupied |
| Single Unit, Detached | 643 (96.6%) | 23 (3.5%) |
| Single Unit, Attached | 0 (0.0%) | 0 (0.0%) |
| 2 Unit Apartments | 0 (0.0%) | 0 (0.0%) |
| 3 or 4 Unit Apartments | 0 (0.0%) | 0 (0.0%) |
| 5 to 9 Unit Apartments | 0 (0.0%) | 0 (0.0%) |
| 10 or more Apartments | 0 (0.0%) | 0 (0.0%) |
| Mobile Home / Other | 326 (97.3%) | 9 (2.7%) |
| Total | 969 (96.8%) | 32 (3.2%) |
Housing Structures by Number of Rooms in North Shore
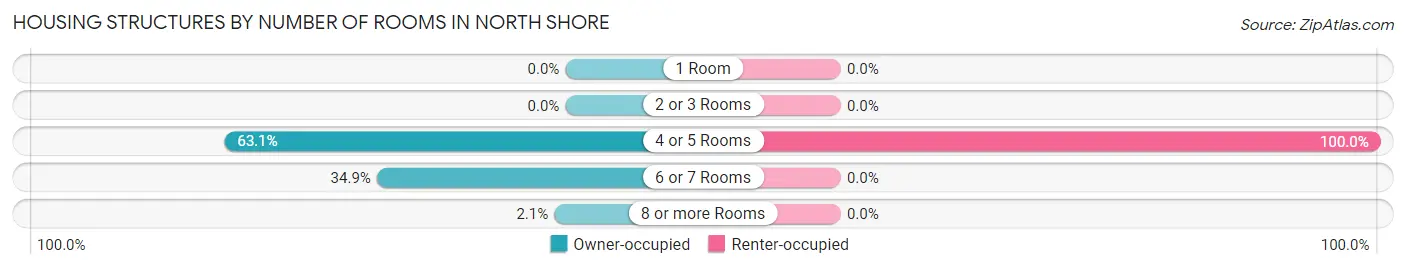
| Number of Rooms | Owner-occupied | Renter-occupied |
| 1 Room | 0 (0.0%) | 0 (0.0%) |
| 2 or 3 Rooms | 0 (0.0%) | 0 (0.0%) |
| 4 or 5 Rooms | 611 (63.0%) | 32 (100.0%) |
| 6 or 7 Rooms | 338 (34.9%) | 0 (0.0%) |
| 8 or more Rooms | 20 (2.1%) | 0 (0.0%) |
| Total | 969 (100.0%) | 32 (100.0%) |
Housing Structure by Heating Type in North Shore
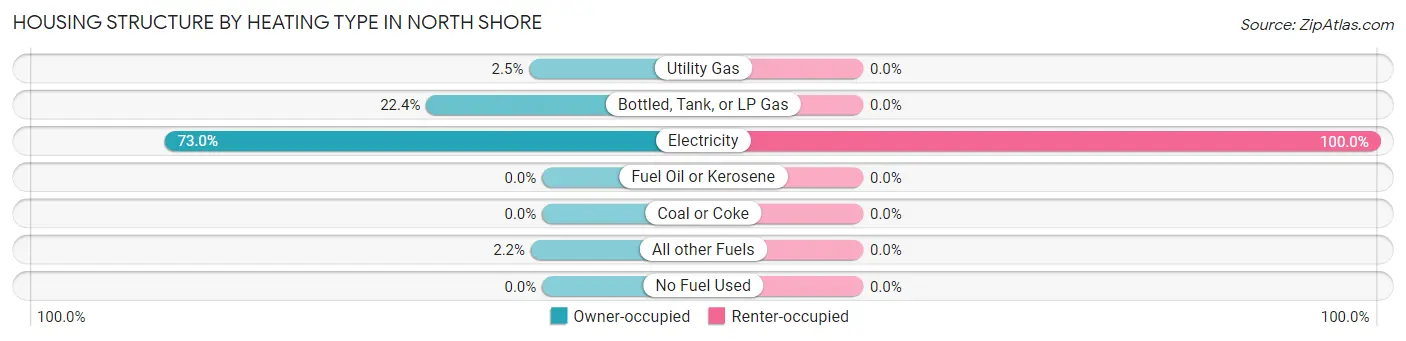
| Heating Type | Owner-occupied | Renter-occupied |
| Utility Gas | 24 (2.5%) | 0 (0.0%) |
| Bottled, Tank, or LP Gas | 217 (22.4%) | 0 (0.0%) |
| Electricity | 707 (73.0%) | 32 (100.0%) |
| Fuel Oil or Kerosene | 0 (0.0%) | 0 (0.0%) |
| Coal or Coke | 0 (0.0%) | 0 (0.0%) |
| All other Fuels | 21 (2.2%) | 0 (0.0%) |
| No Fuel Used | 0 (0.0%) | 0 (0.0%) |
| Total | 969 (100.0%) | 32 (100.0%) |
Household Vehicle Usage in North Shore
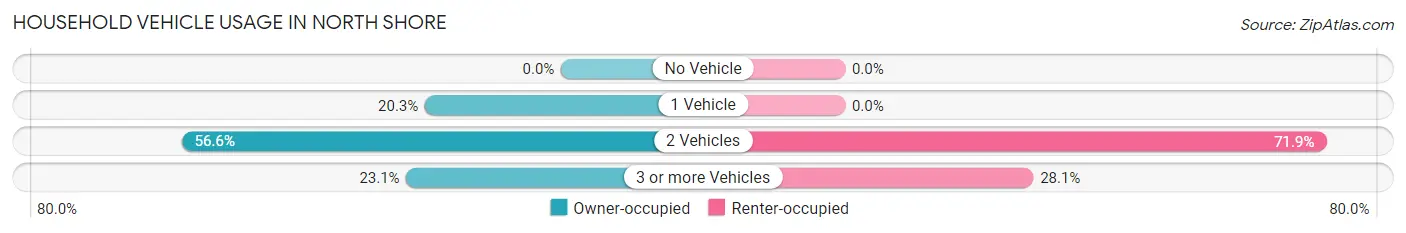
| Vehicles per Household | Owner-occupied | Renter-occupied |
| No Vehicle | 0 (0.0%) | 0 (0.0%) |
| 1 Vehicle | 197 (20.3%) | 0 (0.0%) |
| 2 Vehicles | 548 (56.6%) | 23 (71.9%) |
| 3 or more Vehicles | 224 (23.1%) | 9 (28.1%) |
| Total | 969 (100.0%) | 32 (100.0%) |
Real Estate & Mortgages in North Shore
Real Estate and Mortgage Overview in North Shore
| Characteristic | Without Mortgage | With Mortgage |
| Housing Units | 732 | 237 |
| Median Property Value | $148,900 | $192,100 |
| Median Household Income | $32,062 | $10 |
| Monthly Housing Costs | $482 | $0 |
| Real Estate Taxes | $1,373 | $26 |
Property Value by Mortgage Status in North Shore
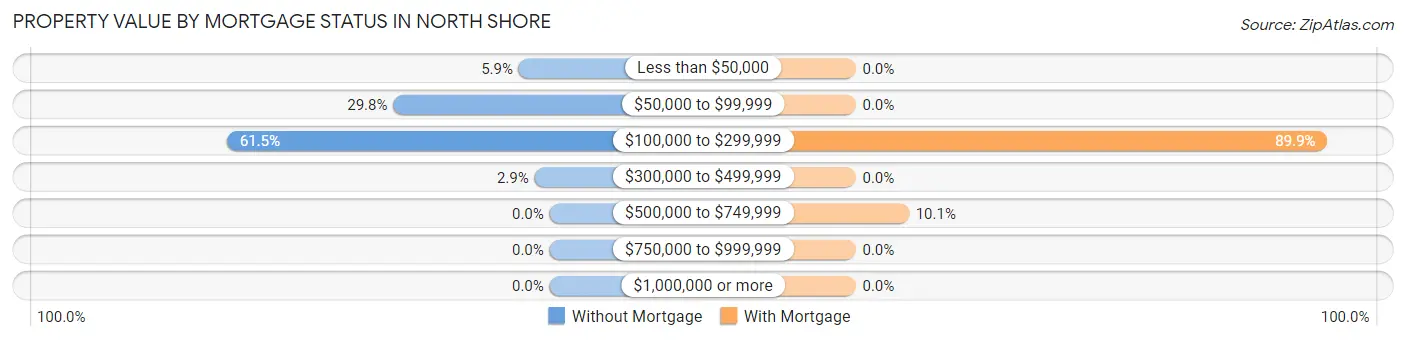
| Property Value | Without Mortgage | With Mortgage |
| Less than $50,000 | 43 (5.9%) | 0 (0.0%) |
| $50,000 to $99,999 | 218 (29.8%) | 0 (0.0%) |
| $100,000 to $299,999 | 450 (61.5%) | 213 (89.9%) |
| $300,000 to $499,999 | 21 (2.9%) | 0 (0.0%) |
| $500,000 to $749,999 | 0 (0.0%) | 24 (10.1%) |
| $750,000 to $999,999 | 0 (0.0%) | 0 (0.0%) |
| $1,000,000 or more | 0 (0.0%) | 0 (0.0%) |
| Total | 732 (100.0%) | 237 (100.0%) |
Household Income by Mortgage Status in North Shore
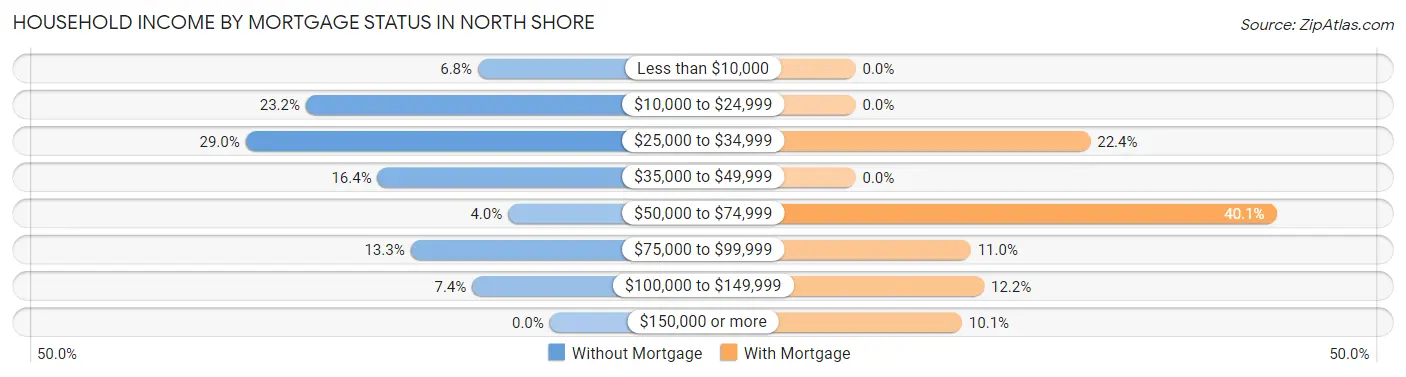
| Household Income | Without Mortgage | With Mortgage |
| Less than $10,000 | 50 (6.8%) | 0 (0.0%) |
| $10,000 to $24,999 | 170 (23.2%) | 0 (0.0%) |
| $25,000 to $34,999 | 212 (29.0%) | 53 (22.4%) |
| $35,000 to $49,999 | 120 (16.4%) | 0 (0.0%) |
| $50,000 to $74,999 | 29 (4.0%) | 95 (40.1%) |
| $75,000 to $99,999 | 97 (13.3%) | 26 (11.0%) |
| $100,000 to $149,999 | 54 (7.4%) | 29 (12.2%) |
| $150,000 or more | 0 (0.0%) | 24 (10.1%) |
| Total | 732 (100.0%) | 237 (100.0%) |
Property Value to Household Income Ratio in North Shore
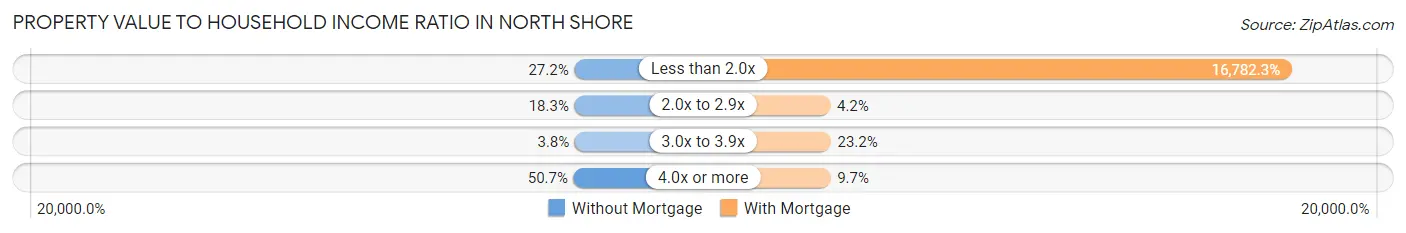
| Value-to-Income Ratio | Without Mortgage | With Mortgage |
| Less than 2.0x | 199 (27.2%) | 39,774 (16,782.3%) |
| 2.0x to 2.9x | 134 (18.3%) | 10 (4.2%) |
| 3.0x to 3.9x | 28 (3.8%) | 55 (23.2%) |
| 4.0x or more | 371 (50.7%) | 23 (9.7%) |
| Total | 732 (100.0%) | 237 (100.0%) |
Real Estate Taxes by Mortgage Status in North Shore
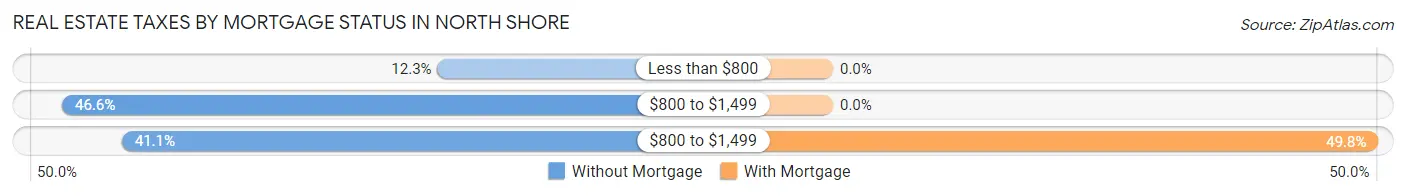
| Property Taxes | Without Mortgage | With Mortgage |
| Less than $800 | 90 (12.3%) | 0 (0.0%) |
| $800 to $1,499 | 341 (46.6%) | 0 (0.0%) |
| $800 to $1,499 | 301 (41.1%) | 118 (49.8%) |
| Total | 732 (100.0%) | 237 (100.0%) |
Health & Disability in North Shore
Health Insurance Coverage by Age in North Shore
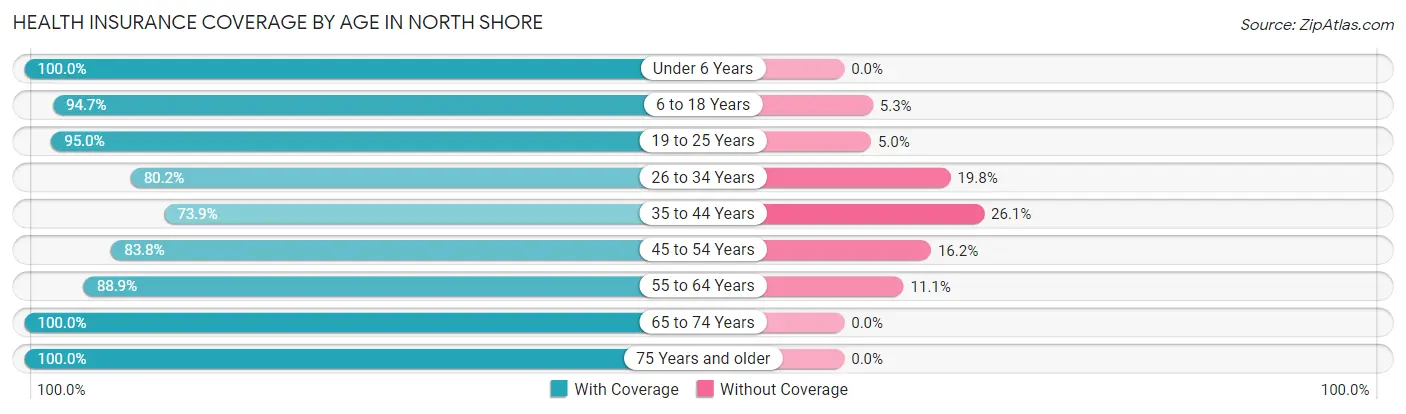
| Age Bracket | With Coverage | Without Coverage |
| Under 6 Years | 39 (100.0%) | 0 (0.0%) |
| 6 to 18 Years | 374 (94.7%) | 21 (5.3%) |
| 19 to 25 Years | 458 (95.0%) | 24 (5.0%) |
| 26 to 34 Years | 158 (80.2%) | 39 (19.8%) |
| 35 to 44 Years | 258 (73.9%) | 91 (26.1%) |
| 45 to 54 Years | 311 (83.8%) | 60 (16.2%) |
| 55 to 64 Years | 394 (88.9%) | 49 (11.1%) |
| 65 to 74 Years | 290 (100.0%) | 0 (0.0%) |
| 75 Years and older | 44 (100.0%) | 0 (0.0%) |
| Total | 2,326 (89.1%) | 284 (10.9%) |
Health Insurance Coverage by Citizenship Status in North Shore
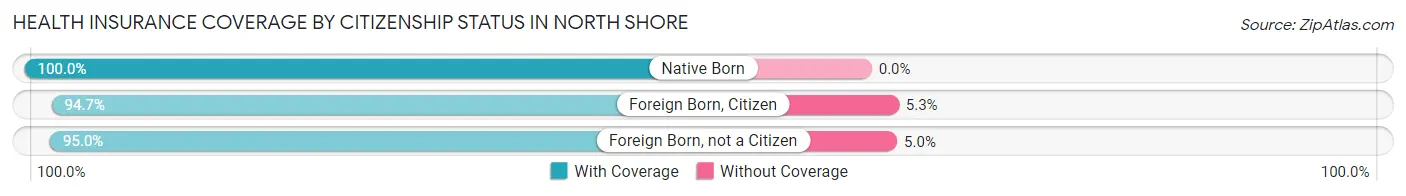
| Citizenship Status | With Coverage | Without Coverage |
| Native Born | 39 (100.0%) | 0 (0.0%) |
| Foreign Born, Citizen | 374 (94.7%) | 21 (5.3%) |
| Foreign Born, not a Citizen | 458 (95.0%) | 24 (5.0%) |
Health Insurance Coverage by Household Income in North Shore
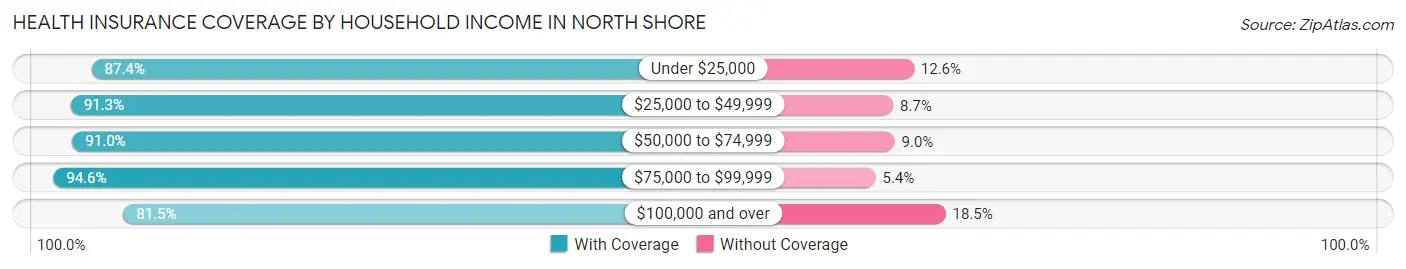
| Household Income | With Coverage | Without Coverage |
| Under $25,000 | 397 (87.4%) | 57 (12.6%) |
| $25,000 to $49,999 | 643 (91.3%) | 61 (8.7%) |
| $50,000 to $74,999 | 305 (91.0%) | 30 (9.0%) |
| $75,000 to $99,999 | 510 (94.6%) | 29 (5.4%) |
| $100,000 and over | 471 (81.5%) | 107 (18.5%) |
Public vs Private Health Insurance Coverage by Age in North Shore
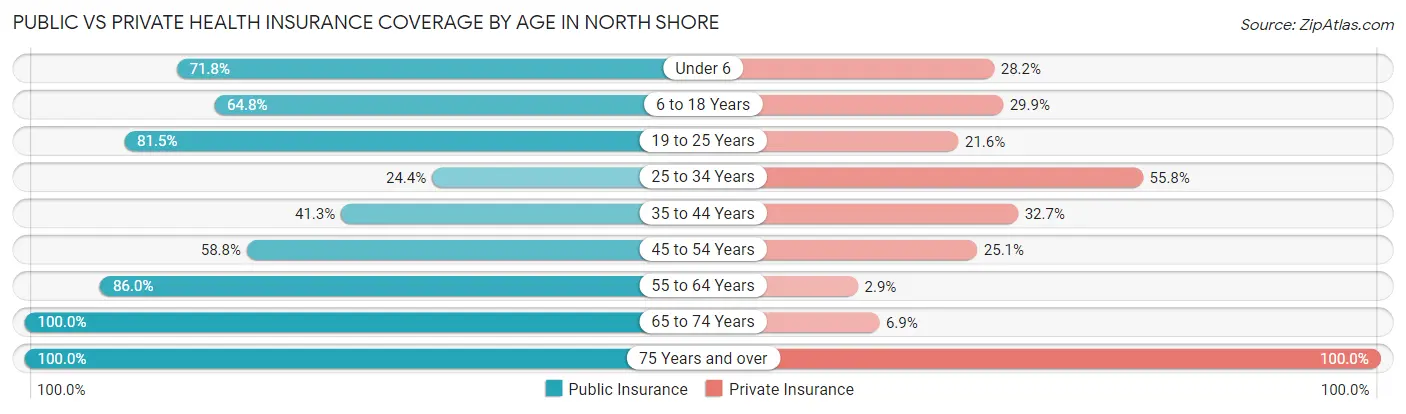
| Age Bracket | Public Insurance | Private Insurance |
| Under 6 | 28 (71.8%) | 11 (28.2%) |
| 6 to 18 Years | 256 (64.8%) | 118 (29.9%) |
| 19 to 25 Years | 393 (81.5%) | 104 (21.6%) |
| 25 to 34 Years | 48 (24.4%) | 110 (55.8%) |
| 35 to 44 Years | 144 (41.3%) | 114 (32.7%) |
| 45 to 54 Years | 218 (58.8%) | 93 (25.1%) |
| 55 to 64 Years | 381 (86.0%) | 13 (2.9%) |
| 65 to 74 Years | 290 (100.0%) | 20 (6.9%) |
| 75 Years and over | 44 (100.0%) | 44 (100.0%) |
| Total | 1,802 (69.0%) | 627 (24.0%) |
Disability Status by Sex by Age in North Shore
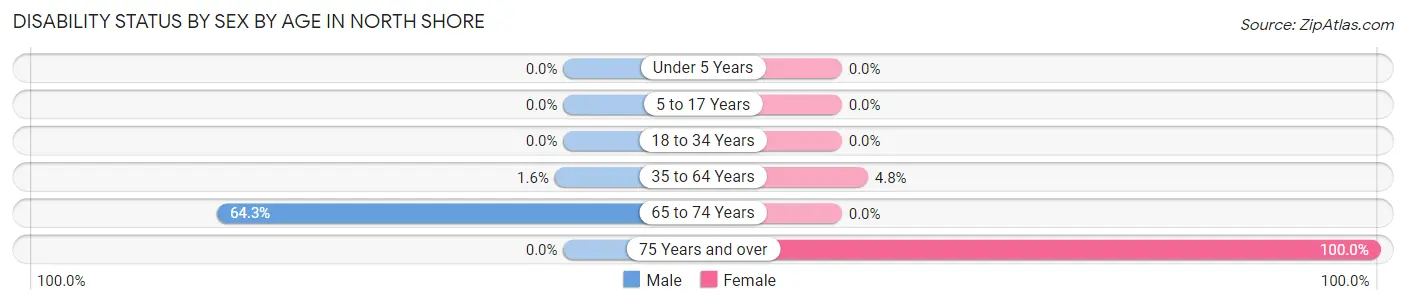
| Age Bracket | Male | Female |
| Under 5 Years | 0 (0.0%) | 0 (0.0%) |
| 5 to 17 Years | 0 (0.0%) | 0 (0.0%) |
| 18 to 34 Years | 0 (0.0%) | 0 (0.0%) |
| 35 to 64 Years | 9 (1.6%) | 29 (4.8%) |
| 65 to 74 Years | 36 (64.3%) | 0 (0.0%) |
| 75 Years and over | 0 (0.0%) | 23 (100.0%) |
Disability Class by Sex by Age in North Shore
Disability Class: Hearing Difficulty
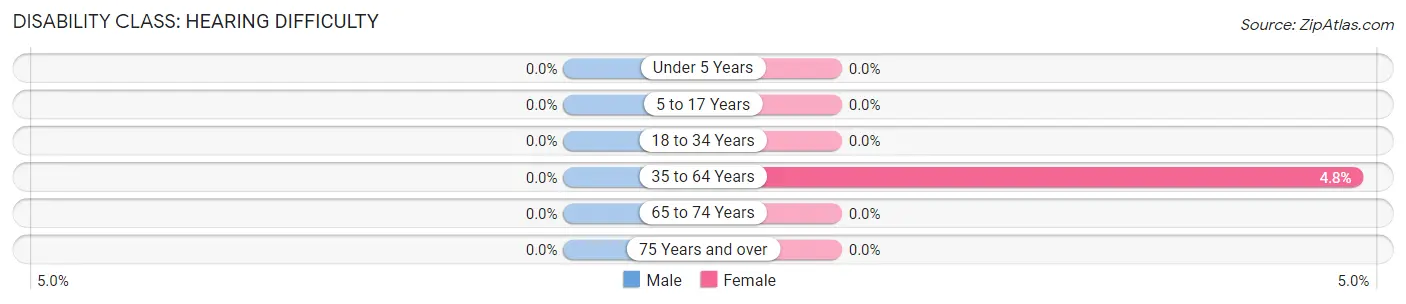
| Age Bracket | Male | Female |
| Under 5 Years | 0 (0.0%) | 0 (0.0%) |
| 5 to 17 Years | 0 (0.0%) | 0 (0.0%) |
| 18 to 34 Years | 0 (0.0%) | 0 (0.0%) |
| 35 to 64 Years | 0 (0.0%) | 29 (4.8%) |
| 65 to 74 Years | 0 (0.0%) | 0 (0.0%) |
| 75 Years and over | 0 (0.0%) | 0 (0.0%) |
Disability Class: Vision Difficulty
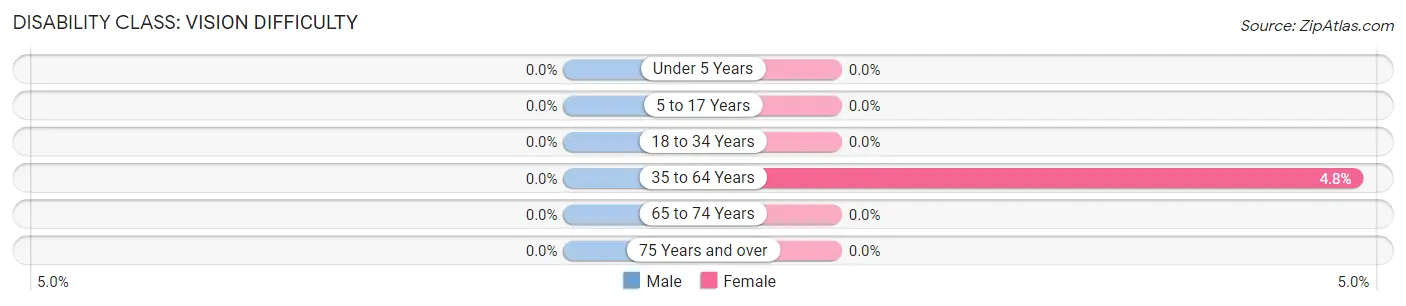
| Age Bracket | Male | Female |
| Under 5 Years | 0 (0.0%) | 0 (0.0%) |
| 5 to 17 Years | 0 (0.0%) | 0 (0.0%) |
| 18 to 34 Years | 0 (0.0%) | 0 (0.0%) |
| 35 to 64 Years | 0 (0.0%) | 29 (4.8%) |
| 65 to 74 Years | 0 (0.0%) | 0 (0.0%) |
| 75 Years and over | 0 (0.0%) | 0 (0.0%) |
Disability Class: Cognitive Difficulty
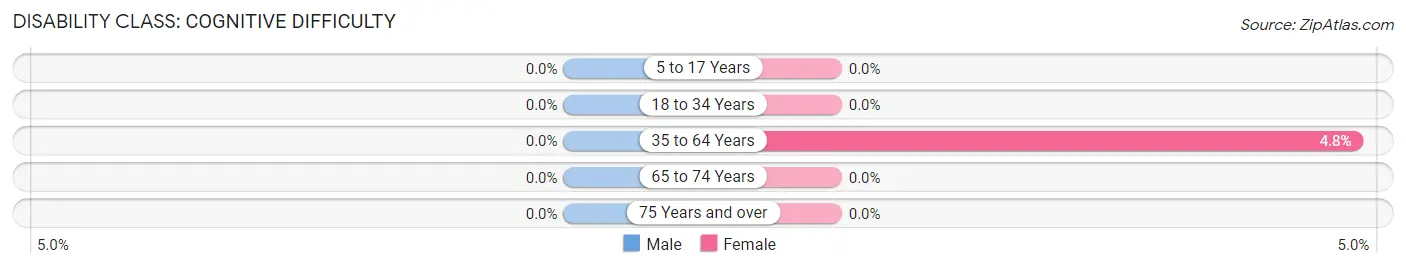
| Age Bracket | Male | Female |
| 5 to 17 Years | 0 (0.0%) | 0 (0.0%) |
| 18 to 34 Years | 0 (0.0%) | 0 (0.0%) |
| 35 to 64 Years | 0 (0.0%) | 29 (4.8%) |
| 65 to 74 Years | 0 (0.0%) | 0 (0.0%) |
| 75 Years and over | 0 (0.0%) | 0 (0.0%) |
Disability Class: Ambulatory Difficulty
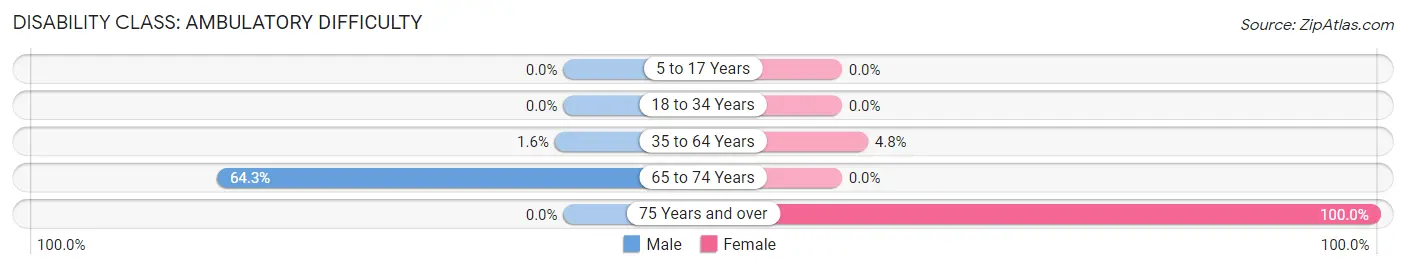
| Age Bracket | Male | Female |
| 5 to 17 Years | 0 (0.0%) | 0 (0.0%) |
| 18 to 34 Years | 0 (0.0%) | 0 (0.0%) |
| 35 to 64 Years | 9 (1.6%) | 29 (4.8%) |
| 65 to 74 Years | 36 (64.3%) | 0 (0.0%) |
| 75 Years and over | 0 (0.0%) | 23 (100.0%) |
Disability Class: Self-Care Difficulty
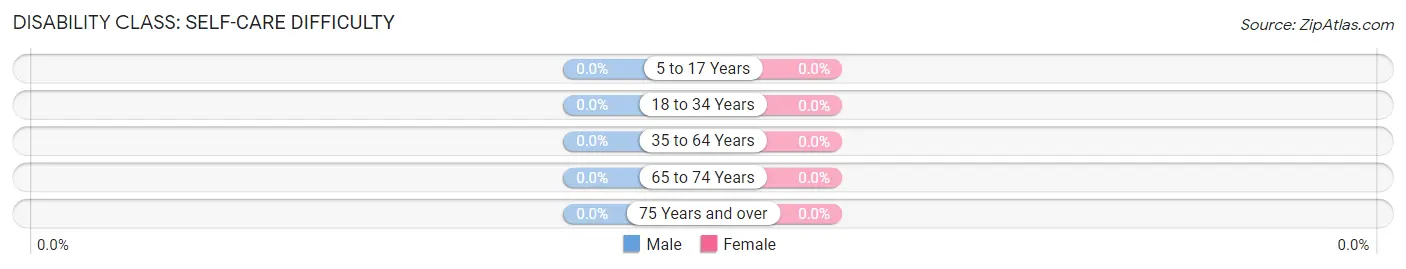
| Age Bracket | Male | Female |
| 5 to 17 Years | 0 (0.0%) | 0 (0.0%) |
| 18 to 34 Years | 0 (0.0%) | 0 (0.0%) |
| 35 to 64 Years | 0 (0.0%) | 0 (0.0%) |
| 65 to 74 Years | 0 (0.0%) | 0 (0.0%) |
| 75 Years and over | 0 (0.0%) | 0 (0.0%) |
Technology Access in North Shore
Computing Device Access in North Shore
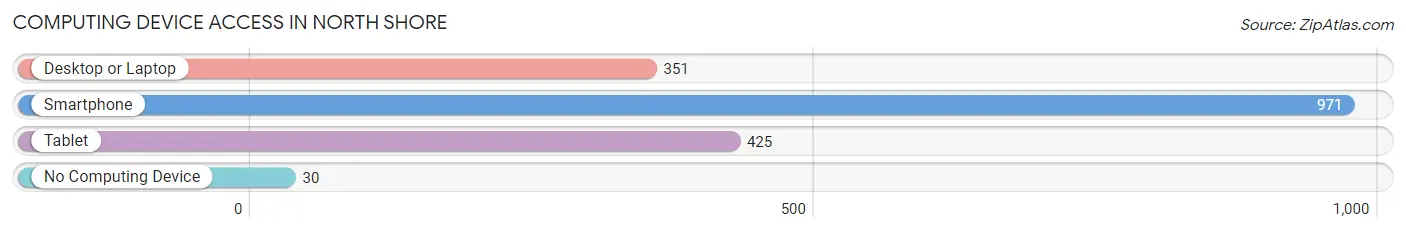
| Device Type | # Households | % Households |
| Desktop or Laptop | 351 | 35.1% |
| Smartphone | 971 | 97.0% |
| Tablet | 425 | 42.5% |
| No Computing Device | 30 | 3.0% |
| Total | 1,001 | 100.0% |
Internet Access in North Shore
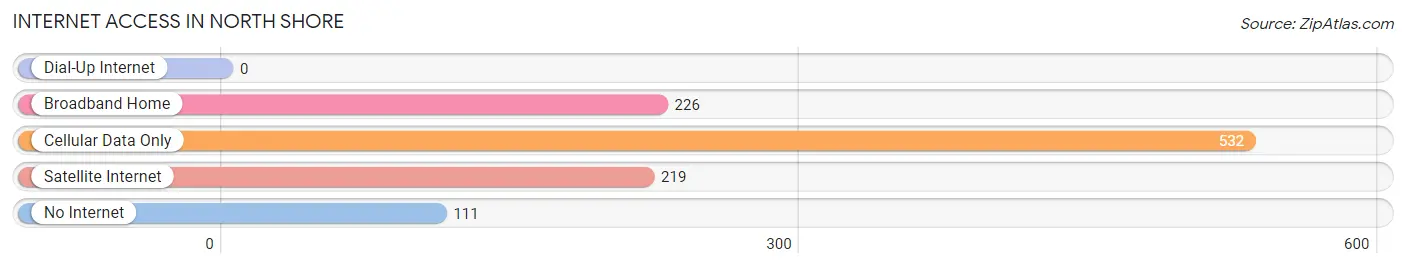
| Internet Type | # Households | % Households |
| Dial-Up Internet | 0 | 0.0% |
| Broadband Home | 226 | 22.6% |
| Cellular Data Only | 532 | 53.1% |
| Satellite Internet | 219 | 21.9% |
| No Internet | 111 | 11.1% |
| Total | 1,001 | 100.0% |
North Shore Summary
North Shore is a small, unincorporated community located in the northern part of San Diego County, California. It is situated on the Pacific Coast, just south of the city of Oceanside. The community is bordered by the cities of Carlsbad to the north, Vista to the east, and Encinitas to the south. North Shore is a popular destination for beachgoers, surfers, and outdoor enthusiasts.
History
The area now known as North Shore was originally inhabited by the Luiseño people, who were part of the larger Kumeyaay Nation. The Luiseño people lived in the area for thousands of years, and their presence is still evident in the area today.
In the late 19th century, the area was settled by homesteaders, who established small farms and ranches. The area was known as “North Shore” because of its location on the northern shore of San Diego Bay.
In the early 20th century, the area began to develop as a resort destination. The first hotel was built in 1912, and the area soon became a popular destination for vacationers.
In the 1950s, the area began to experience rapid growth as more people moved to the area. The population of North Shore increased from 1,000 in 1950 to over 10,000 by the end of the decade.
Geography
North Shore is located in the northern part of San Diego County, California. It is situated on the Pacific Coast, just south of the city of Oceanside. The community is bordered by the cities of Carlsbad to the north, Vista to the east, and Encinitas to the south.
The area is characterized by rolling hills and valleys, with the highest point being the summit of Mount Soledad at 822 feet. The area is also home to several creeks and rivers, including the San Luis Rey River, which flows through the community.
The climate in North Shore is mild and temperate, with temperatures ranging from the mid-50s in the winter to the mid-70s in the summer. The area receives an average of 10 inches of rain per year.
Economy
The economy of North Shore is largely driven by tourism. The area is home to several popular beaches, including Moonlight Beach, Swami’s Beach, and Carlsbad State Beach. The area is also home to several popular attractions, including Legoland California, the San Diego Zoo Safari Park, and SeaWorld San Diego.
In addition to tourism, North Shore is home to several businesses, including restaurants, retail stores, and professional services. The area is also home to several manufacturing companies, including a factory that produces surfboards.
Demographics
As of the 2010 census, the population of North Shore was 11,845. The population is largely white (77.3%), with smaller percentages of Hispanic (14.2%), Asian (4.2%), and African American (2.2%) residents.
The median household income in North Shore is $76,845, which is higher than the national average. The median home value is $619,000, which is also higher than the national average.
The area is home to several schools, including North Shore Elementary School, North Shore Middle School, and North Shore High School. The area is also home to several colleges and universities, including the University of California, San Diego and San Diego State University.
Common Questions
What is Per Capita Income in North Shore?
Per Capita income in North Shore is $19,500.
What is the Median Family Income in North Shore?
Median Family Income in North Shore is $39,638.
What is the Median Household income in North Shore?
Median Household Income in North Shore is $37,852.
What is Income or Wage Gap in North Shore?
Income or Wage Gap in North Shore is 44.8%.
Women in North Shore earn 55.2 cents for every dollar earned by a man.
What is Inequality or Gini Index in North Shore?
Inequality or Gini Index in North Shore is 0.38.
What is the Total Population of North Shore?
Total Population of North Shore is 2,610.
What is the Total Male Population of North Shore?
Total Male Population of North Shore is 952.
What is the Total Female Population of North Shore?
Total Female Population of North Shore is 1,658.
What is the Ratio of Males per 100 Females in North Shore?
There are 57.42 Males per 100 Females in North Shore.
What is the Ratio of Females per 100 Males in North Shore?
There are 174.16 Females per 100 Males in North Shore.
What is the Median Population Age in North Shore?
Median Population Age in North Shore is 40.7 Years.
What is the Average Family Size in North Shore
Average Family Size in North Shore is 3.3 People.
What is the Average Household Size in North Shore
Average Household Size in North Shore is 2.6 People.
How Large is the Labor Force in North Shore?
There are 1,645 People in the Labor Forcein in North Shore.
What is the Percentage of People in the Labor Force in North Shore?
69.6% of People are in the Labor Force in North Shore.
What is the Unemployment Rate in North Shore?
Unemployment Rate in North Shore is 10.9%.