Cities with the Highest Percentage of Central American Population in Illinois
RELATED REPORTS & OPTIONS
Central American
Illinois
Compare Cities
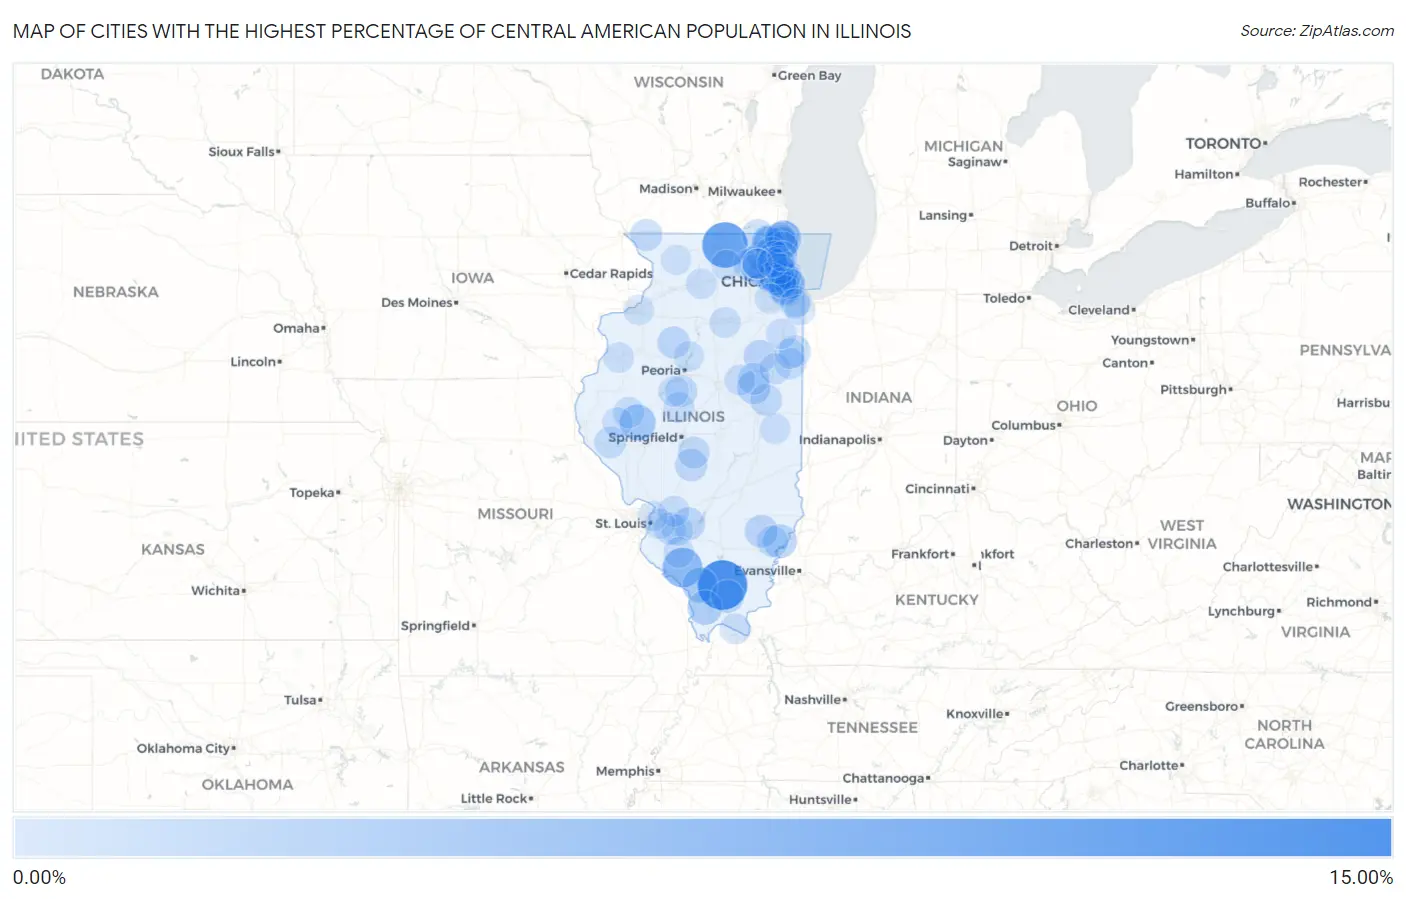
Map of Cities with the Highest Percentage of Central American Population in Illinois
0.00%
15.00%
Cities with the Highest Percentage of Central American Population in Illinois
| City | Central American | vs State | vs National | |
| 1. | Spillertown | 14.60% | 0.72%(+13.9)#1 | 1.81%(+12.8)#253 |
| 2. | Timberlane | 11.73% | 0.72%(+11.0)#2 | 1.81%(+9.92)#356 |
| 3. | Percy | 7.53% | 0.72%(+6.81)#3 | 1.81%(+5.71)#656 |
| 4. | Bensenville | 5.72% | 0.72%(+5.01)#4 | 1.81%(+3.91)#953 |
| 5. | Wood Dale | 5.46% | 0.72%(+4.74)#5 | 1.81%(+3.65)#1,013 |
| 6. | Beardstown | 5.06% | 0.72%(+4.35)#6 | 1.81%(+3.25)#1,109 |
| 7. | Beach Park | 4.62% | 0.72%(+3.90)#7 | 1.81%(+2.81)#1,221 |
| 8. | Murphysboro | 4.46% | 0.72%(+3.75)#8 | 1.81%(+2.65)#1,263 |
| 9. | Waukegan | 4.19% | 0.72%(+3.48)#9 | 1.81%(+2.38)#1,358 |
| 10. | Anna | 4.06% | 0.72%(+3.34)#10 | 1.81%(+2.25)#1,409 |
| 11. | Hanover Park | 3.86% | 0.72%(+3.14)#11 | 1.81%(+2.04)#1,477 |
| 12. | Bellmont | 3.56% | 0.72%(+2.84)#12 | 1.81%(+1.74)#1,591 |
| 13. | River Grove | 3.38% | 0.72%(+2.66)#13 | 1.81%(+1.57)#1,682 |
| 14. | Rolling Meadows | 3.38% | 0.72%(+2.66)#14 | 1.81%(+1.57)#1,683 |
| 15. | Gibson City | 3.18% | 0.72%(+2.46)#15 | 1.81%(+1.37)#1,782 |
| 16. | Park City | 3.16% | 0.72%(+2.44)#16 | 1.81%(+1.34)#1,793 |
| 17. | Cicero | 3.08% | 0.72%(+2.36)#17 | 1.81%(+1.26)#1,841 |
| 18. | Creal Springs | 3.06% | 0.72%(+2.34)#18 | 1.81%(+1.25)#1,850 |
| 19. | Melrose Park | 2.98% | 0.72%(+2.26)#19 | 1.81%(+1.17)#1,895 |
| 20. | Mount Erie | 2.96% | 0.72%(+2.24)#20 | 1.81%(+1.15)#1,902 |
| 21. | Pingree Grove | 2.94% | 0.72%(+2.22)#21 | 1.81%(+1.12)#1,918 |
| 22. | Cullom | 2.83% | 0.72%(+2.11)#22 | 1.81%(+1.02)#1,988 |
| 23. | Carpentersville | 2.78% | 0.72%(+2.07)#23 | 1.81%(+0.970)#2,020 |
| 24. | Ridgewood | 2.75% | 0.72%(+2.03)#24 | 1.81%(+0.932)#2,042 |
| 25. | Breese | 2.72% | 0.72%(+2.00)#25 | 1.81%(+0.906)#2,058 |
| 26. | Round Lake Heights | 2.72% | 0.72%(+2.00)#26 | 1.81%(+0.904)#2,062 |
| 27. | Northlake | 2.60% | 0.72%(+1.88)#27 | 1.81%(+0.789)#2,145 |
| 28. | Summit | 2.57% | 0.72%(+1.86)#28 | 1.81%(+0.760)#2,170 |
| 29. | Morrisonville | 2.57% | 0.72%(+1.85)#29 | 1.81%(+0.754)#2,174 |
| 30. | Fox River Grove | 2.54% | 0.72%(+1.83)#30 | 1.81%(+0.731)#2,190 |
| 31. | Wyoming | 2.53% | 0.72%(+1.81)#31 | 1.81%(+0.714)#2,203 |
| 32. | Round Lake Beach | 2.53% | 0.72%(+1.81)#32 | 1.81%(+0.714)#2,204 |
| 33. | Franklin Park | 2.48% | 0.72%(+1.76)#33 | 1.81%(+0.663)#2,247 |
| 34. | Berkeley | 2.46% | 0.72%(+1.74)#34 | 1.81%(+0.648)#2,256 |
| 35. | Berwyn | 2.38% | 0.72%(+1.66)#35 | 1.81%(+0.567)#2,317 |
| 36. | Zion | 2.36% | 0.72%(+1.65)#36 | 1.81%(+0.552)#2,325 |
| 37. | Rantoul | 2.34% | 0.72%(+1.63)#37 | 1.81%(+0.531)#2,343 |
| 38. | Addison | 2.34% | 0.72%(+1.62)#38 | 1.81%(+0.527)#2,346 |
| 39. | Scales Mound | 2.30% | 0.72%(+1.59)#39 | 1.81%(+0.491)#2,372 |
| 40. | Kincaid | 2.27% | 0.72%(+1.55)#40 | 1.81%(+0.456)#2,396 |
| 41. | North Chicago | 2.27% | 0.72%(+1.55)#41 | 1.81%(+0.453)#2,402 |
| 42. | Sibley | 2.25% | 0.72%(+1.53)#42 | 1.81%(+0.439)#2,418 |
| 43. | Scott Afb | 2.24% | 0.72%(+1.52)#43 | 1.81%(+0.424)#2,428 |
| 44. | Green Valley | 2.20% | 0.72%(+1.48)#44 | 1.81%(+0.389)#2,459 |
| 45. | Long Lake | 2.14% | 0.72%(+1.43)#45 | 1.81%(+0.331)#2,512 |
| 46. | Richmond | 2.12% | 0.72%(+1.40)#46 | 1.81%(+0.305)#2,531 |
| 47. | Baylis | 2.08% | 0.72%(+1.37)#47 | 1.81%(+0.270)#2,566 |
| 48. | Albion | 2.06% | 0.72%(+1.34)#48 | 1.81%(+0.247)#2,592 |
| 49. | Gilberts | 2.03% | 0.72%(+1.31)#49 | 1.81%(+0.216)#2,630 |
| 50. | Beaverville | 2.02% | 0.72%(+1.31)#50 | 1.81%(+0.210)#2,637 |
| 51. | Hawthorn Woods | 1.92% | 0.72%(+1.20)#51 | 1.81%(+0.108)#2,749 |
| 52. | New Baden | 1.89% | 0.72%(+1.17)#52 | 1.81%(+0.074)#2,798 |
| 53. | Onarga | 1.86% | 0.72%(+1.15)#53 | 1.81%(+0.050)#2,822 |
| 54. | Holcomb | 1.80% | 0.72%(+1.08)#54 | 1.81%(-0.017)#2,910 |
| 55. | Rushville | 1.76% | 0.72%(+1.04)#55 | 1.81%(-0.050)#2,942 |
| 56. | Watseka | 1.74% | 0.72%(+1.02)#56 | 1.81%(-0.070)#2,966 |
| 57. | Marine | 1.74% | 0.72%(+1.02)#57 | 1.81%(-0.072)#2,969 |
| 58. | Schiller Park | 1.71% | 0.72%(+0.989)#58 | 1.81%(-0.106)#3,012 |
| 59. | Rosemont | 1.68% | 0.72%(+0.964)#59 | 1.81%(-0.131)#3,044 |
| 60. | Elmwood Park | 1.68% | 0.72%(+0.962)#60 | 1.81%(-0.133)#3,048 |
| 61. | Naplate | 1.68% | 0.72%(+0.959)#61 | 1.81%(-0.136)#3,050 |
| 62. | Harwood Heights | 1.67% | 0.72%(+0.948)#62 | 1.81%(-0.147)#3,068 |
| 63. | Bridgeview | 1.60% | 0.72%(+0.882)#63 | 1.81%(-0.213)#3,175 |
| 64. | Tilden | 1.58% | 0.72%(+0.860)#64 | 1.81%(-0.235)#3,205 |
| 65. | Colfax | 1.57% | 0.72%(+0.855)#65 | 1.81%(-0.240)#3,210 |
| 66. | Long Grove | 1.56% | 0.72%(+0.840)#66 | 1.81%(-0.255)#3,228 |
| 67. | Mason City | 1.50% | 0.72%(+0.786)#67 | 1.81%(-0.309)#3,313 |
| 68. | Wheeling | 1.50% | 0.72%(+0.784)#68 | 1.81%(-0.311)#3,316 |
| 69. | Martinton | 1.49% | 0.72%(+0.770)#69 | 1.81%(-0.325)#3,338 |
| 70. | Phoenix | 1.49% | 0.72%(+0.769)#70 | 1.81%(-0.326)#3,340 |
| 71. | Prospect Heights | 1.46% | 0.72%(+0.745)#71 | 1.81%(-0.350)#3,378 |
| 72. | Metropolis | 1.46% | 0.72%(+0.741)#72 | 1.81%(-0.354)#3,384 |
| 73. | Broadview | 1.46% | 0.72%(+0.740)#73 | 1.81%(-0.355)#3,386 |
| 74. | Villa Park | 1.45% | 0.72%(+0.737)#74 | 1.81%(-0.358)#3,395 |
| 75. | Franklin Grove | 1.45% | 0.72%(+0.734)#75 | 1.81%(-0.361)#3,401 |
| 76. | Manito | 1.40% | 0.72%(+0.678)#76 | 1.81%(-0.417)#3,506 |
| 77. | Kirkwood | 1.36% | 0.72%(+0.642)#77 | 1.81%(-0.452)#3,576 |
| 78. | Broadlands | 1.36% | 0.72%(+0.638)#78 | 1.81%(-0.457)#3,586 |
| 79. | Glendale Heights | 1.35% | 0.72%(+0.630)#79 | 1.81%(-0.465)#3,601 |
| 80. | Bourbonnais | 1.35% | 0.72%(+0.628)#80 | 1.81%(-0.467)#3,602 |
| 81. | Caseyville | 1.34% | 0.72%(+0.618)#81 | 1.81%(-0.477)#3,620 |
| 82. | Mount Sterling | 1.33% | 0.72%(+0.614)#82 | 1.81%(-0.481)#3,627 |
| 83. | Elgin | 1.32% | 0.72%(+0.604)#83 | 1.81%(-0.491)#3,642 |
| 84. | West Dundee | 1.29% | 0.72%(+0.569)#84 | 1.81%(-0.525)#3,721 |
| 85. | Kirkland | 1.27% | 0.72%(+0.555)#85 | 1.81%(-0.540)#3,756 |
| 86. | Justice | 1.25% | 0.72%(+0.535)#86 | 1.81%(-0.559)#3,791 |
| 87. | Rome | 1.25% | 0.72%(+0.528)#87 | 1.81%(-0.567)#3,801 |
| 88. | Westchester | 1.25% | 0.72%(+0.528)#88 | 1.81%(-0.567)#3,802 |
| 89. | Silvis | 1.22% | 0.72%(+0.504)#89 | 1.81%(-0.591)#3,838 |
| 90. | Chicago | 1.21% | 0.72%(+0.495)#90 | 1.81%(-0.600)#3,854 |
| 91. | Madison | 1.20% | 0.72%(+0.477)#91 | 1.81%(-0.618)#3,876 |
| 92. | Sleepy Hollow | 1.19% | 0.72%(+0.468)#92 | 1.81%(-0.627)#3,908 |
| 93. | Romeoville | 1.17% | 0.72%(+0.456)#93 | 1.81%(-0.639)#3,931 |
| 94. | Des Plaines | 1.16% | 0.72%(+0.447)#94 | 1.81%(-0.648)#3,950 |
| 95. | Palatine | 1.16% | 0.72%(+0.441)#95 | 1.81%(-0.654)#3,963 |
| 96. | Shannon | 1.15% | 0.72%(+0.430)#96 | 1.81%(-0.665)#3,994 |
| 97. | Sauk Village | 1.14% | 0.72%(+0.418)#97 | 1.81%(-0.677)#4,025 |
| 98. | Wadsworth | 1.13% | 0.72%(+0.413)#98 | 1.81%(-0.682)#4,032 |
| 99. | Bannockburn | 1.13% | 0.72%(+0.409)#99 | 1.81%(-0.686)#4,040 |
| 100. | East Hazel Crest | 1.12% | 0.72%(+0.400)#100 | 1.81%(-0.694)#4,060 |
Common Questions
What are the Top 10 Cities with the Highest Percentage of Central American Population in Illinois?
Top 10 Cities with the Highest Percentage of Central American Population in Illinois are:
#1
14.60%
#2
11.73%
#3
7.53%
#4
5.72%
#5
5.46%
#6
5.06%
#7
4.62%
#8
4.46%
#9
4.19%
#10
4.06%
What city has the Highest Percentage of Central American Population in Illinois?
Spillertown has the Highest Percentage of Central American Population in Illinois with 14.60%.
What is the Percentage of Central American Population in the State of Illinois?
Percentage of Central American Population in Illinois is 0.72%.
What is the Percentage of Central American Population in the United States?
Percentage of Central American Population in the United States is 1.81%.