South El Monte, CA Map & Demographics
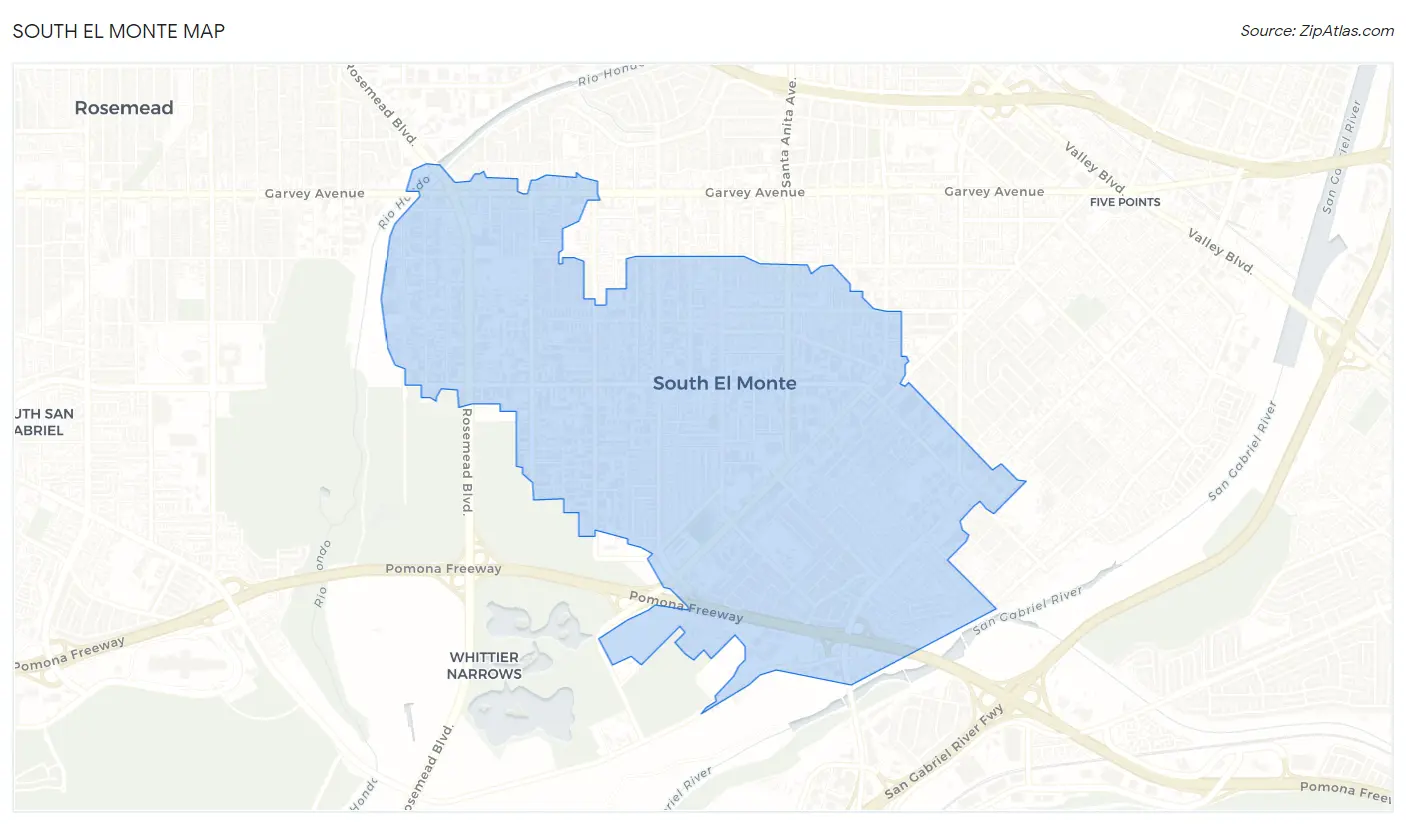
South El Monte Map
South El Monte Overview
$22,248
PER CAPITA INCOME
$64,727
AVG FAMILY INCOME
$67,724
AVG HOUSEHOLD INCOME
19.6%
WAGE / INCOME GAP [ % ]
80.4¢/ $1
WAGE / INCOME GAP [ $ ]
$9,274
FAMILY INCOME DEFICIT
0.41
INEQUALITY / GINI INDEX
19,694
TOTAL POPULATION
9,986
MALE POPULATION
9,708
FEMALE POPULATION
102.86
MALES / 100 FEMALES
97.22
FEMALES / 100 MALES
37.4
MEDIAN AGE
4.1
AVG FAMILY SIZE
3.9
AVG HOUSEHOLD SIZE
9,383
LABOR FORCE [ PEOPLE ]
59.3%
PERCENT IN LABOR FORCE
6.7%
UNEMPLOYMENT RATE
South El Monte Zip Codes
Income in South El Monte
Income Overview in South El Monte
Per Capita Income in South El Monte is $22,248, while median incomes of families and households are $64,727 and $67,724 respectively.
| Characteristic | Number | Measure |
| Per Capita Income | 19,694 | $22,248 |
| Median Family Income | 4,294 | $64,727 |
| Mean Family Income | 4,294 | $82,122 |
| Median Household Income | 5,033 | $67,724 |
| Mean Household Income | 5,033 | $81,535 |
| Income Deficit | 4,294 | $9,274 |
| Wage / Income Gap (%) | 19,694 | 19.64% |
| Wage / Income Gap ($) | 19,694 | 80.36¢ per $1 |
| Gini / Inequality Index | 19,694 | 0.41 |
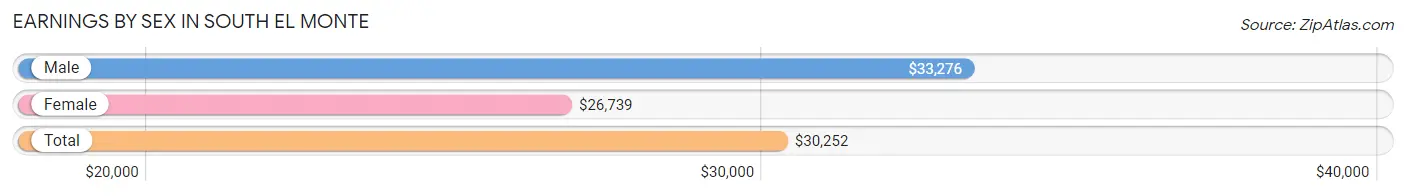
Earnings by Sex in South El Monte
Average Earnings in South El Monte are $30,252, $33,276 for men and $26,739 for women, a difference of 19.6%.
| Sex | Number | Average Earnings |
| Male | 5,322 (56.9%) | $33,276 |
| Female | 4,038 (43.1%) | $26,739 |
| Total | 9,360 (100.0%) | $30,252 |
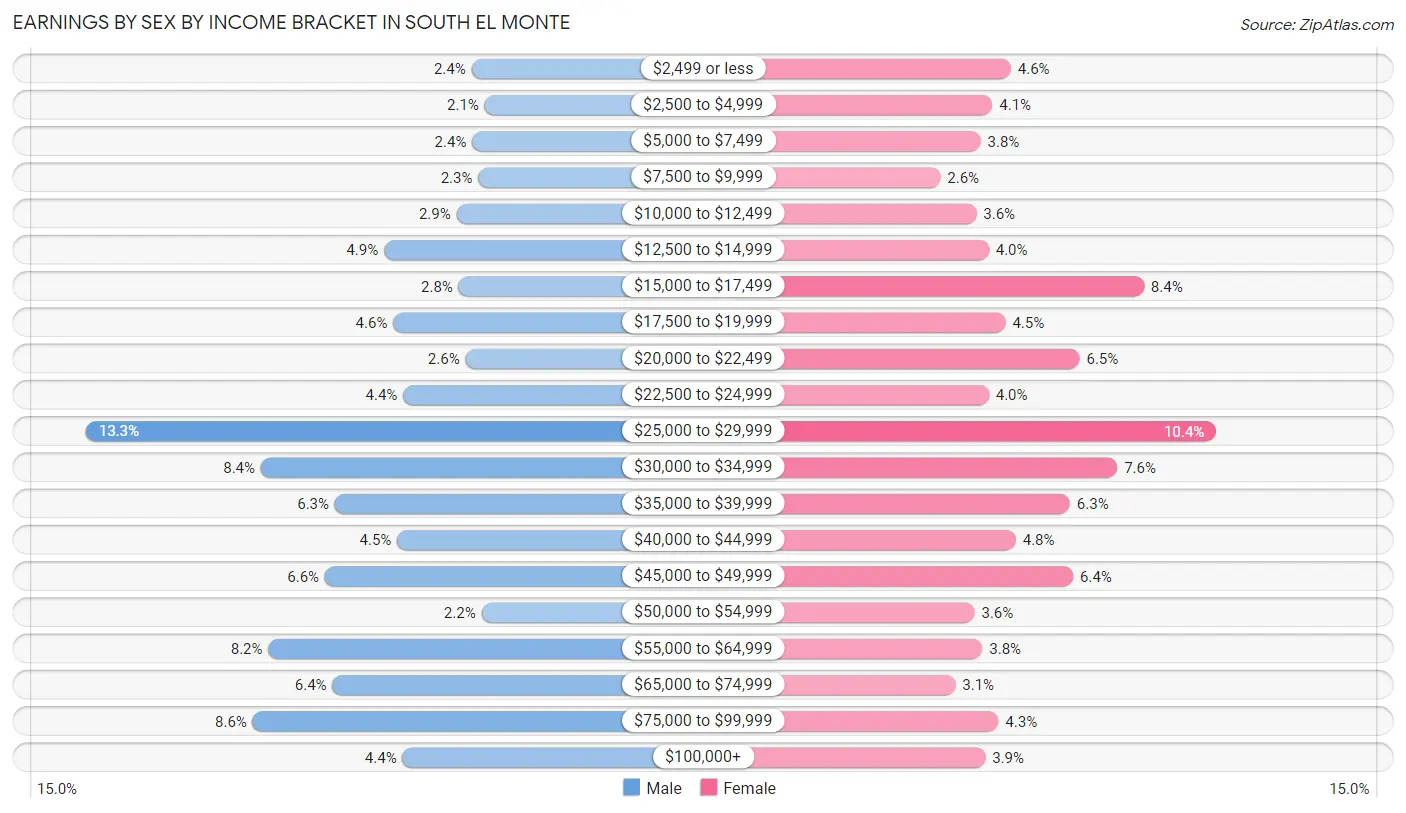
Earnings by Sex by Income Bracket in South El Monte
The most common earnings brackets in South El Monte are $25,000 to $29,999 for men (707 | 13.3%) and $25,000 to $29,999 for women (419 | 10.4%).
| Income | Male | Female |
| $2,499 or less | 130 (2.4%) | 186 (4.6%) |
| $2,500 to $4,999 | 110 (2.1%) | 165 (4.1%) |
| $5,000 to $7,499 | 129 (2.4%) | 152 (3.8%) |
| $7,500 to $9,999 | 120 (2.2%) | 106 (2.6%) |
| $10,000 to $12,499 | 152 (2.9%) | 147 (3.6%) |
| $12,500 to $14,999 | 261 (4.9%) | 161 (4.0%) |
| $15,000 to $17,499 | 149 (2.8%) | 337 (8.4%) |
| $17,500 to $19,999 | 247 (4.6%) | 180 (4.5%) |
| $20,000 to $22,499 | 139 (2.6%) | 264 (6.5%) |
| $22,500 to $24,999 | 232 (4.4%) | 161 (4.0%) |
| $25,000 to $29,999 | 707 (13.3%) | 419 (10.4%) |
| $30,000 to $34,999 | 445 (8.4%) | 307 (7.6%) |
| $35,000 to $39,999 | 334 (6.3%) | 253 (6.3%) |
| $40,000 to $44,999 | 241 (4.5%) | 192 (4.8%) |
| $45,000 to $49,999 | 349 (6.6%) | 257 (6.4%) |
| $50,000 to $54,999 | 115 (2.2%) | 145 (3.6%) |
| $55,000 to $64,999 | 434 (8.2%) | 154 (3.8%) |
| $65,000 to $74,999 | 338 (6.4%) | 123 (3.0%) |
| $75,000 to $99,999 | 457 (8.6%) | 172 (4.3%) |
| $100,000+ | 233 (4.4%) | 157 (3.9%) |
| Total | 5,322 (100.0%) | 4,038 (100.0%) |
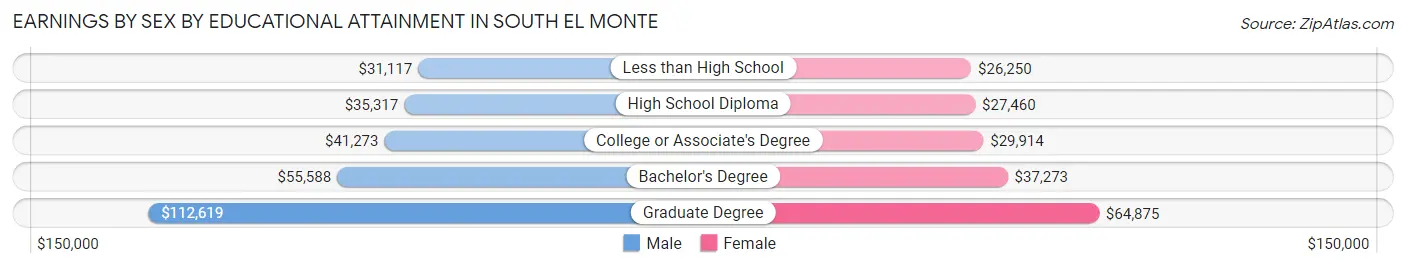
Earnings by Sex by Educational Attainment in South El Monte
Average earnings in South El Monte are $37,154 for men and $28,482 for women, a difference of 23.3%. Men with an educational attainment of graduate degree enjoy the highest average annual earnings of $112,619, while those with less than high school education earn the least with $31,117. Women with an educational attainment of graduate degree earn the most with the average annual earnings of $64,875, while those with less than high school education have the smallest earnings of $26,250.
| Educational Attainment | Male Income | Female Income |
| Less than High School | $31,117 | $26,250 |
| High School Diploma | $35,317 | $27,460 |
| College or Associate's Degree | $41,273 | $29,914 |
| Bachelor's Degree | $55,588 | $37,273 |
| Graduate Degree | $112,619 | $64,875 |
| Total | $37,154 | $28,482 |
Family Income in South El Monte
Family Income Brackets in South El Monte
According to the South El Monte family income data, there are 833 families falling into the $100,000 to $149,999 income range, which is the most common income bracket and makes up 19.4% of all families. Conversely, the less than $10,000 income bracket is the least frequent group with only 52 families (1.2%) belonging to this category.
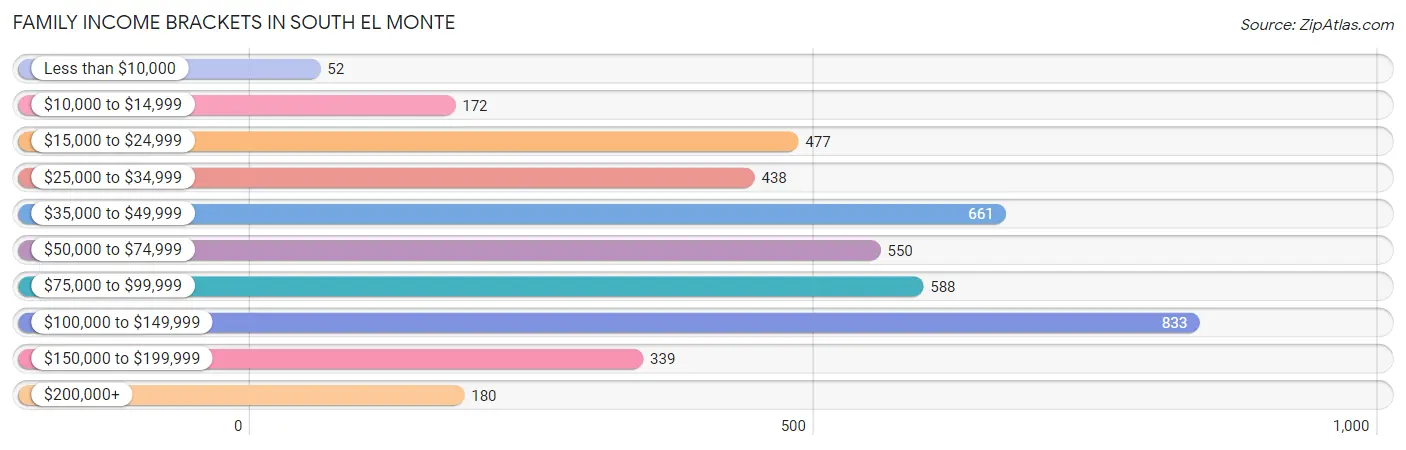
| Income Bracket | # Families | % Families |
| Less than $10,000 | 52 | 1.2% |
| $10,000 to $14,999 | 172 | 4.0% |
| $15,000 to $24,999 | 477 | 11.1% |
| $25,000 to $34,999 | 438 | 10.2% |
| $35,000 to $49,999 | 661 | 15.4% |
| $50,000 to $74,999 | 550 | 12.8% |
| $75,000 to $99,999 | 588 | 13.7% |
| $100,000 to $149,999 | 833 | 19.4% |
| $150,000 to $199,999 | 339 | 7.9% |
| $200,000+ | 180 | 4.2% |
Family Income by Famaliy Size in South El Monte
6-person families (303 | 7.1%) account for the highest median family income in South El Monte with $127,109 per family, while 4-person families (1,006 | 23.4%) have the highest median income of $23,730 per family member.
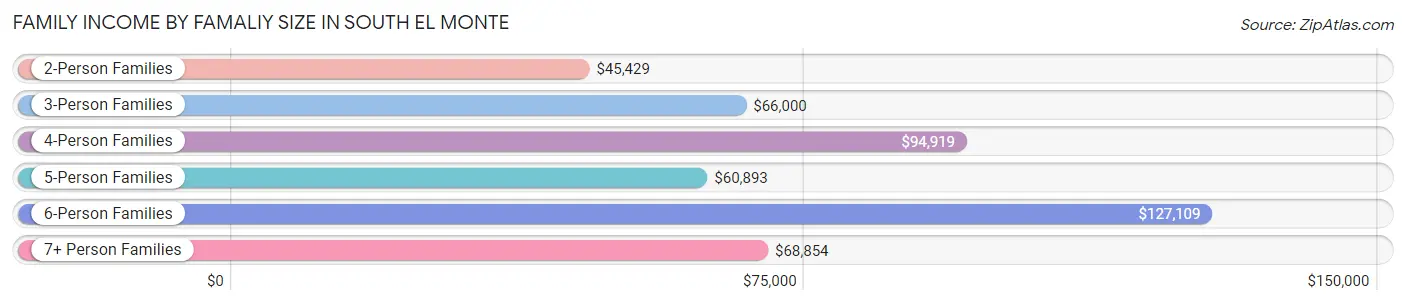
| Income Bracket | # Families | Median Income |
| 2-Person Families | 1,045 (24.3%) | $45,429 |
| 3-Person Families | 1,074 (25.0%) | $66,000 |
| 4-Person Families | 1,006 (23.4%) | $94,919 |
| 5-Person Families | 649 (15.1%) | $60,893 |
| 6-Person Families | 303 (7.1%) | $127,109 |
| 7+ Person Families | 217 (5.1%) | $68,854 |
| Total | 4,294 (100.0%) | $64,727 |
Family Income by Number of Earners in South El Monte
The median family income in South El Monte is $64,727, with families comprising 3+ earners (1,005) having the highest median family income of $129,006, while families with no earners (582) have the lowest median family income of $22,283, accounting for 23.4% and 13.6% of families, respectively.
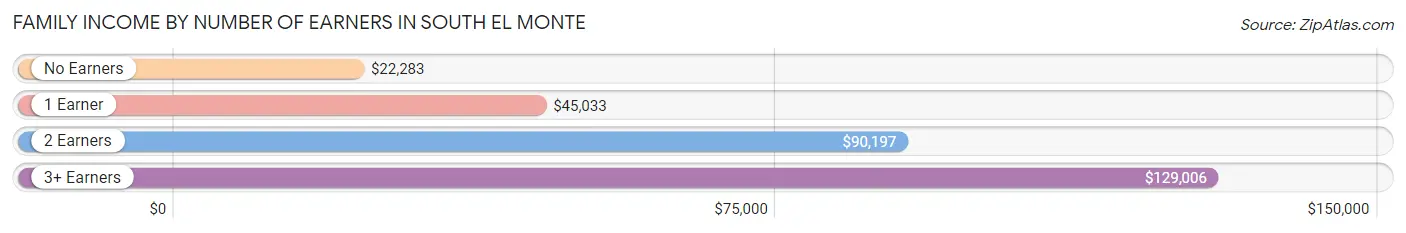
| Number of Earners | # Families | Median Income |
| No Earners | 582 (13.6%) | $22,283 |
| 1 Earner | 1,474 (34.3%) | $45,033 |
| 2 Earners | 1,233 (28.7%) | $90,197 |
| 3+ Earners | 1,005 (23.4%) | $129,006 |
| Total | 4,294 (100.0%) | $64,727 |
Household Income in South El Monte
Household Income Brackets in South El Monte
With 941 households falling in the category, the $100,000 to $149,999 income range is the most frequent in South El Monte, accounting for 18.7% of all households. In contrast, only 106 households (2.1%) fall into the less than $10,000 income bracket, making it the least populous group.
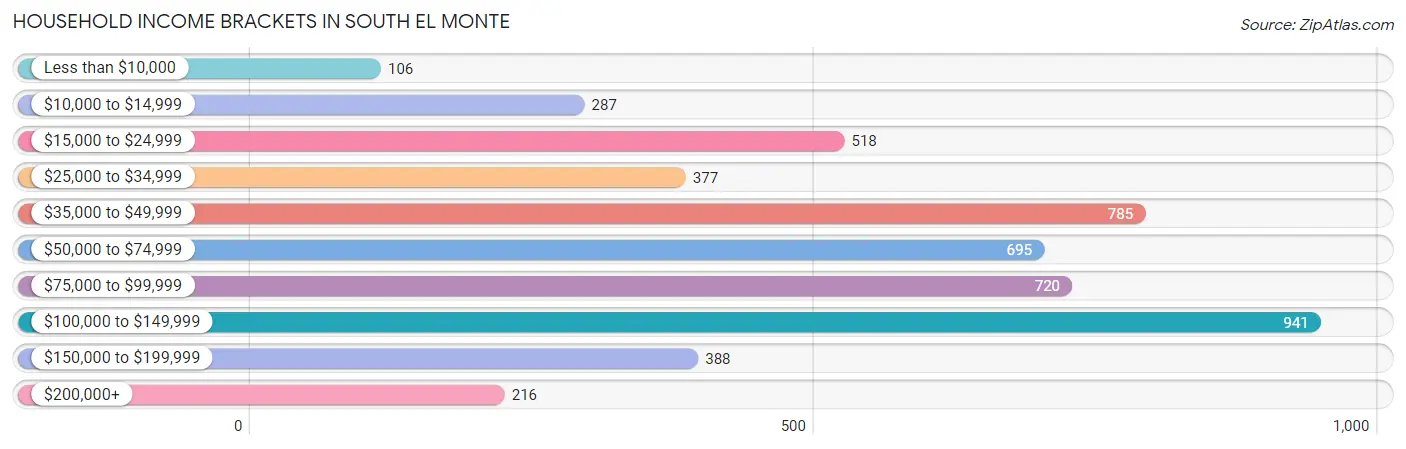
| Income Bracket | # Households | % Households |
| Less than $10,000 | 106 | 2.1% |
| $10,000 to $14,999 | 287 | 5.7% |
| $15,000 to $24,999 | 518 | 10.3% |
| $25,000 to $34,999 | 377 | 7.5% |
| $35,000 to $49,999 | 785 | 15.6% |
| $50,000 to $74,999 | 695 | 13.8% |
| $75,000 to $99,999 | 720 | 14.3% |
| $100,000 to $149,999 | 941 | 18.7% |
| $150,000 to $199,999 | 388 | 7.7% |
| $200,000+ | 216 | 4.3% |
Household Income by Householder Age in South El Monte
The median household income in South El Monte is $67,724, with the highest median household income of $82,734 found in the 25 to 44 years age bracket for the primary householder. A total of 1,470 households (29.2%) fall into this category. Meanwhile, the 15 to 24 years age bracket for the primary householder has the lowest median household income of $41,912, with 88 households (1.8%) in this group.
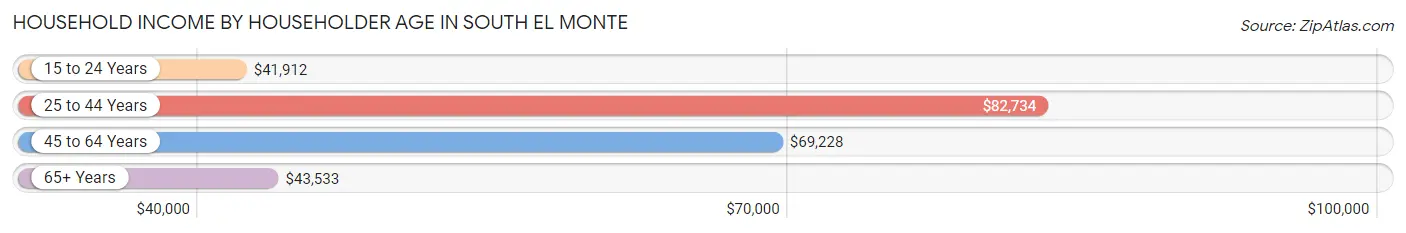
| Income Bracket | # Households | Median Income |
| 15 to 24 Years | 88 (1.8%) | $41,912 |
| 25 to 44 Years | 1,470 (29.2%) | $82,734 |
| 45 to 64 Years | 2,134 (42.4%) | $69,228 |
| 65+ Years | 1,341 (26.6%) | $43,533 |
| Total | 5,033 (100.0%) | $67,724 |
Poverty in South El Monte
Income Below Poverty by Sex and Age in South El Monte
With 19.6% poverty level for males and 22.8% for females among the residents of South El Monte, 15 year old males and 5 year old females are the most vulnerable to poverty, with 107 males (64.1%) and 25 females (54.3%) in their respective age groups living below the poverty level.
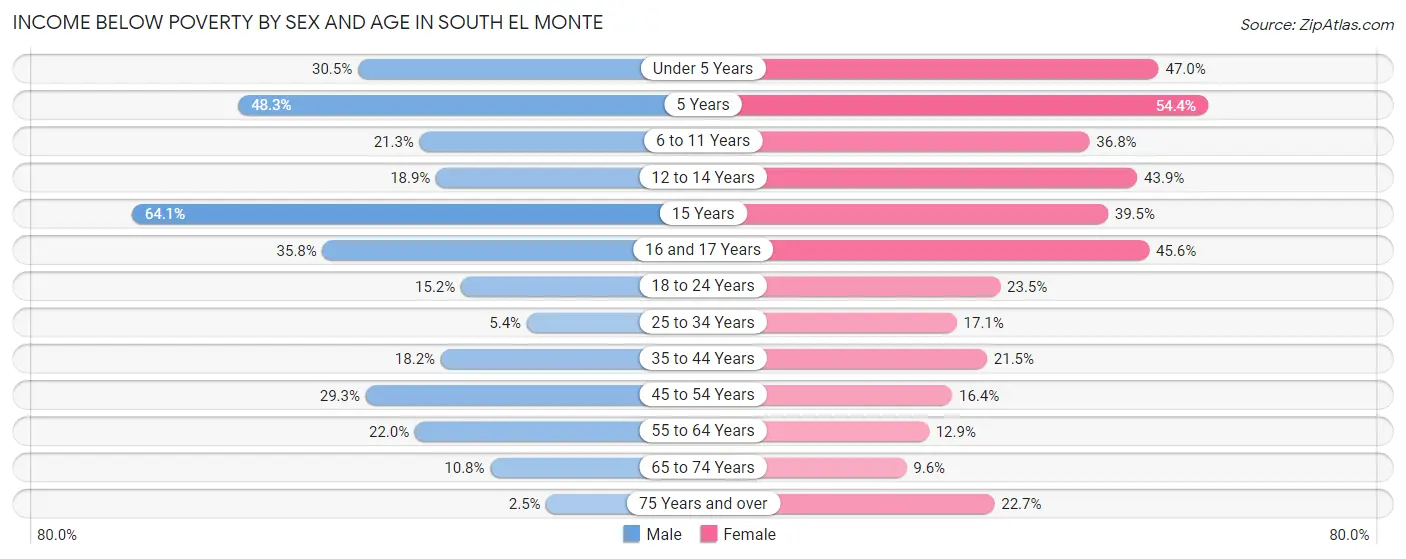
| Age Bracket | Male | Female |
| Under 5 Years | 157 (30.5%) | 294 (47.0%) |
| 5 Years | 42 (48.3%) | 25 (54.3%) |
| 6 to 11 Years | 144 (21.3%) | 189 (36.8%) |
| 12 to 14 Years | 108 (18.9%) | 100 (43.9%) |
| 15 Years | 107 (64.1%) | 126 (39.5%) |
| 16 and 17 Years | 138 (35.7%) | 115 (45.6%) |
| 18 to 24 Years | 143 (15.2%) | 237 (23.5%) |
| 25 to 34 Years | 73 (5.4%) | 231 (17.1%) |
| 35 to 44 Years | 243 (18.2%) | 246 (21.5%) |
| 45 to 54 Years | 389 (29.3%) | 220 (16.4%) |
| 55 to 64 Years | 310 (22.0%) | 162 (12.9%) |
| 65 to 74 Years | 79 (10.8%) | 73 (9.6%) |
| 75 Years and over | 11 (2.5%) | 176 (22.7%) |
| Total | 1,944 (19.6%) | 2,194 (22.8%) |
Income Above Poverty by Sex and Age in South El Monte
According to the poverty statistics in South El Monte, males aged 75 years and over and females aged 65 to 74 years are the age groups that are most secure financially, with 97.5% of males and 90.4% of females in these age groups living above the poverty line.
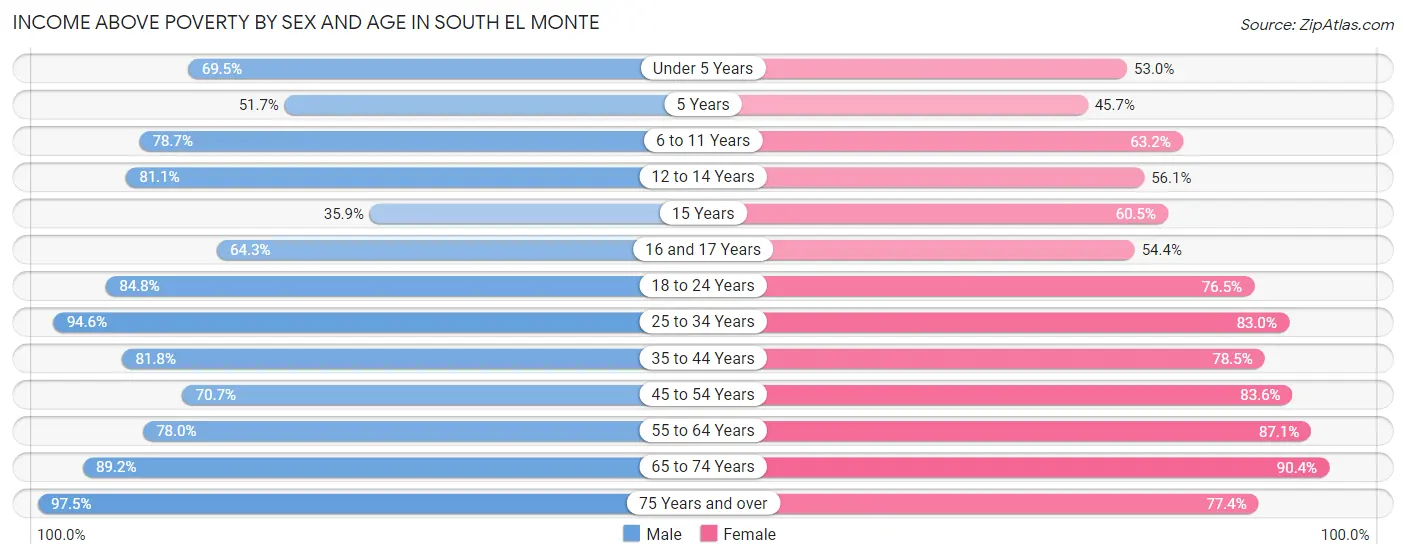
| Age Bracket | Male | Female |
| Under 5 Years | 358 (69.5%) | 331 (53.0%) |
| 5 Years | 45 (51.7%) | 21 (45.7%) |
| 6 to 11 Years | 531 (78.7%) | 325 (63.2%) |
| 12 to 14 Years | 464 (81.1%) | 128 (56.1%) |
| 15 Years | 60 (35.9%) | 193 (60.5%) |
| 16 and 17 Years | 248 (64.2%) | 137 (54.4%) |
| 18 to 24 Years | 799 (84.8%) | 771 (76.5%) |
| 25 to 34 Years | 1,276 (94.6%) | 1,124 (83.0%) |
| 35 to 44 Years | 1,094 (81.8%) | 896 (78.5%) |
| 45 to 54 Years | 937 (70.7%) | 1,124 (83.6%) |
| 55 to 64 Years | 1,098 (78.0%) | 1,093 (87.1%) |
| 65 to 74 Years | 650 (89.2%) | 688 (90.4%) |
| 75 Years and over | 428 (97.5%) | 601 (77.3%) |
| Total | 7,988 (80.4%) | 7,432 (77.2%) |
Income Below Poverty Among Married-Couple Families in South El Monte
The poverty statistics for married-couple families in South El Monte show that 10.6% or 258 of the total 2,425 families live below the poverty line. Families with 3 or 4 children have the highest poverty rate of 30.3%, comprising of 78 families. On the other hand, families with 5 or more children have the lowest poverty rate of 0.0%, which includes 0 families.
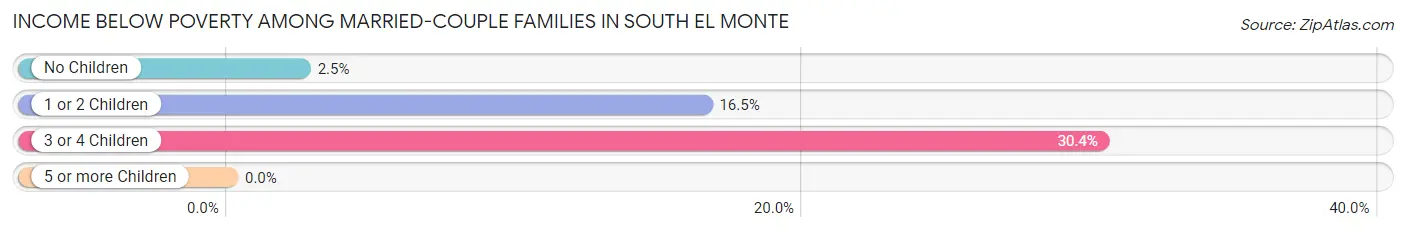
| Children | Above Poverty | Below Poverty |
| No Children | 1,231 (97.5%) | 32 (2.5%) |
| 1 or 2 Children | 748 (83.5%) | 148 (16.5%) |
| 3 or 4 Children | 179 (69.7%) | 78 (30.3%) |
| 5 or more Children | 9 (100.0%) | 0 (0.0%) |
| Total | 2,167 (89.4%) | 258 (10.6%) |
Income Below Poverty Among Single-Parent Households in South El Monte
According to the poverty data in South El Monte, 23.0% or 179 single-father households and 27.6% or 301 single-mother households are living below the poverty line. Among single-father households, those with 3 or 4 children have the highest poverty rate, with 16 households (59.3%) experiencing poverty. Likewise, among single-mother households, those with 5 or more children have the highest poverty rate, with 17 households (100.0%) falling below the poverty line.
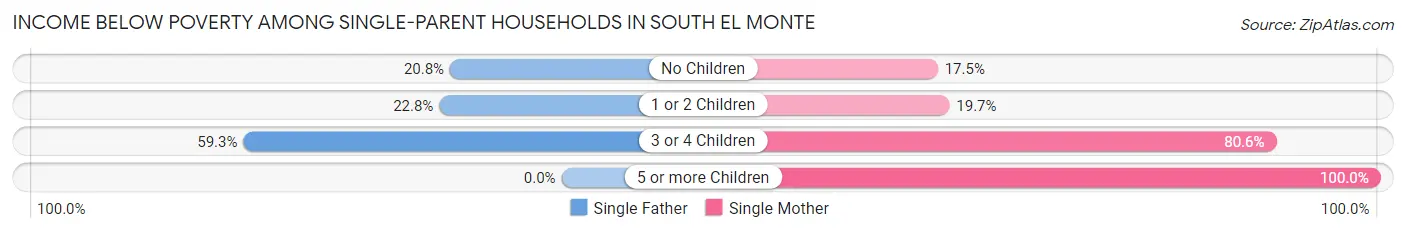
| Children | Single Father | Single Mother |
| No Children | 86 (20.8%) | 96 (17.5%) |
| 1 or 2 Children | 77 (22.8%) | 76 (19.7%) |
| 3 or 4 Children | 16 (59.3%) | 112 (80.6%) |
| 5 or more Children | 0 (0.0%) | 17 (100.0%) |
| Total | 179 (23.0%) | 301 (27.6%) |
Income Below Poverty Among Married-Couple vs Single-Parent Households in South El Monte
The poverty data for South El Monte shows that 258 of the married-couple family households (10.6%) and 480 of the single-parent households (25.7%) are living below the poverty level. Within the married-couple family households, those with 3 or 4 children have the highest poverty rate, with 78 households (30.3%) falling below the poverty line. Among the single-parent households, those with 5 or more children have the highest poverty rate, with 17 household (100.0%) living below poverty.
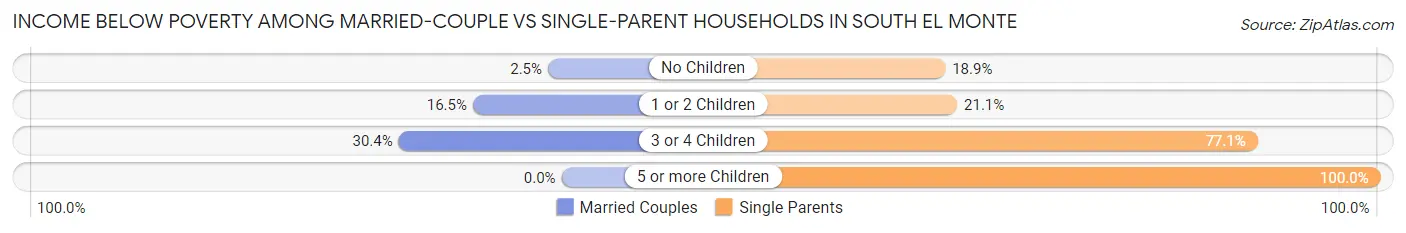
| Children | Married-Couple Families | Single-Parent Households |
| No Children | 32 (2.5%) | 182 (18.9%) |
| 1 or 2 Children | 148 (16.5%) | 153 (21.1%) |
| 3 or 4 Children | 78 (30.3%) | 128 (77.1%) |
| 5 or more Children | 0 (0.0%) | 17 (100.0%) |
| Total | 258 (10.6%) | 480 (25.7%) |
Race in South El Monte
The most populous races in South El Monte are Hispanic or Latino (15,524 | 78.8%), Some other Race (8,276 | 42.0%), and White / Caucasian (4,721 | 24.0%).
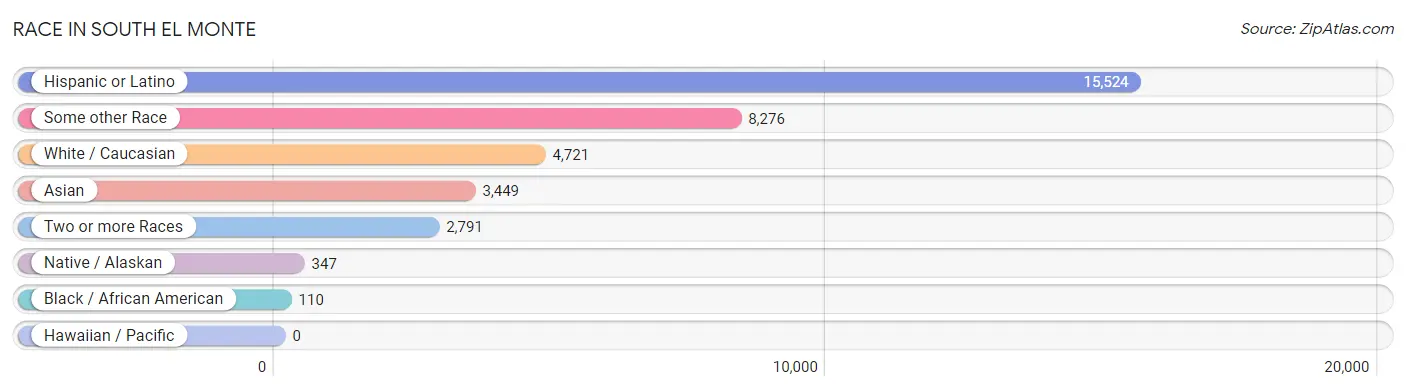
| Race | # Population | % Population |
| Asian | 3,449 | 17.5% |
| Black / African American | 110 | 0.6% |
| Hawaiian / Pacific | 0 | 0.0% |
| Hispanic or Latino | 15,524 | 78.8% |
| Native / Alaskan | 347 | 1.8% |
| White / Caucasian | 4,721 | 24.0% |
| Two or more Races | 2,791 | 14.2% |
| Some other Race | 8,276 | 42.0% |
| Total | 19,694 | 100.0% |
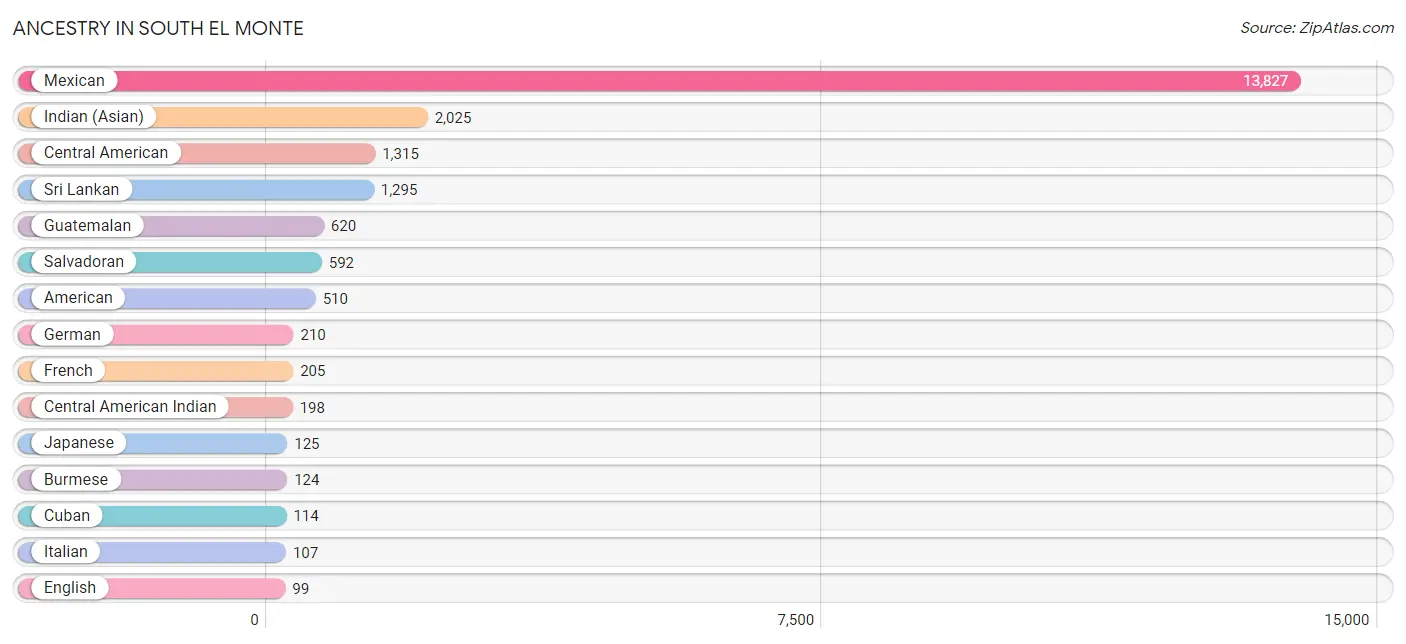
Ancestry in South El Monte
The most populous ancestries reported in South El Monte are Mexican (13,827 | 70.2%), Indian (Asian) (2,025 | 10.3%), Central American (1,315 | 6.7%), Sri Lankan (1,295 | 6.6%), and Guatemalan (620 | 3.2%), together accounting for 96.9% of all South El Monte residents.
| Ancestry | # Population | % Population |
| African | 42 | 0.2% |
| American | 510 | 2.6% |
| Apache | 7 | 0.0% |
| Armenian | 12 | 0.1% |
| British | 6 | 0.0% |
| Burmese | 124 | 0.6% |
| Cape Verdean | 18 | 0.1% |
| Central American | 1,315 | 6.7% |
| Central American Indian | 198 | 1.0% |
| Cheyenne | 3 | 0.0% |
| Colombian | 7 | 0.0% |
| Cuban | 114 | 0.6% |
| Czech | 5 | 0.0% |
| Czechoslovakian | 5 | 0.0% |
| Dutch | 3 | 0.0% |
| Eastern European | 9 | 0.1% |
| Ecuadorian | 14 | 0.1% |
| English | 99 | 0.5% |
| European | 27 | 0.1% |
| Filipino | 8 | 0.0% |
| French | 205 | 1.0% |
| German | 210 | 1.1% |
| Guatemalan | 620 | 3.2% |
| Honduran | 26 | 0.1% |
| Indian (Asian) | 2,025 | 10.3% |
| Indonesian | 73 | 0.4% |
| Irish | 50 | 0.3% |
| Italian | 107 | 0.5% |
| Japanese | 125 | 0.6% |
| Korean | 84 | 0.4% |
| Laotian | 11 | 0.1% |
| Mexican | 13,827 | 70.2% |
| Mexican American Indian | 95 | 0.5% |
| Native Hawaiian | 35 | 0.2% |
| Navajo | 42 | 0.2% |
| Nicaraguan | 67 | 0.3% |
| Norwegian | 25 | 0.1% |
| Pakistani | 9 | 0.1% |
| Peruvian | 46 | 0.2% |
| Polish | 7 | 0.0% |
| Portuguese | 3 | 0.0% |
| Puerto Rican | 75 | 0.4% |
| Salvadoran | 592 | 3.0% |
| Samoan | 35 | 0.2% |
| Scotch-Irish | 6 | 0.0% |
| Scottish | 44 | 0.2% |
| Sioux | 8 | 0.0% |
| South American | 67 | 0.3% |
| Spanish | 22 | 0.1% |
| Sri Lankan | 1,295 | 6.6% |
| Subsaharan African | 82 | 0.4% |
| Welsh | 56 | 0.3% |
| West Indian | 16 | 0.1% |
| Yugoslavian | 16 | 0.1% | View All 54 Rows |
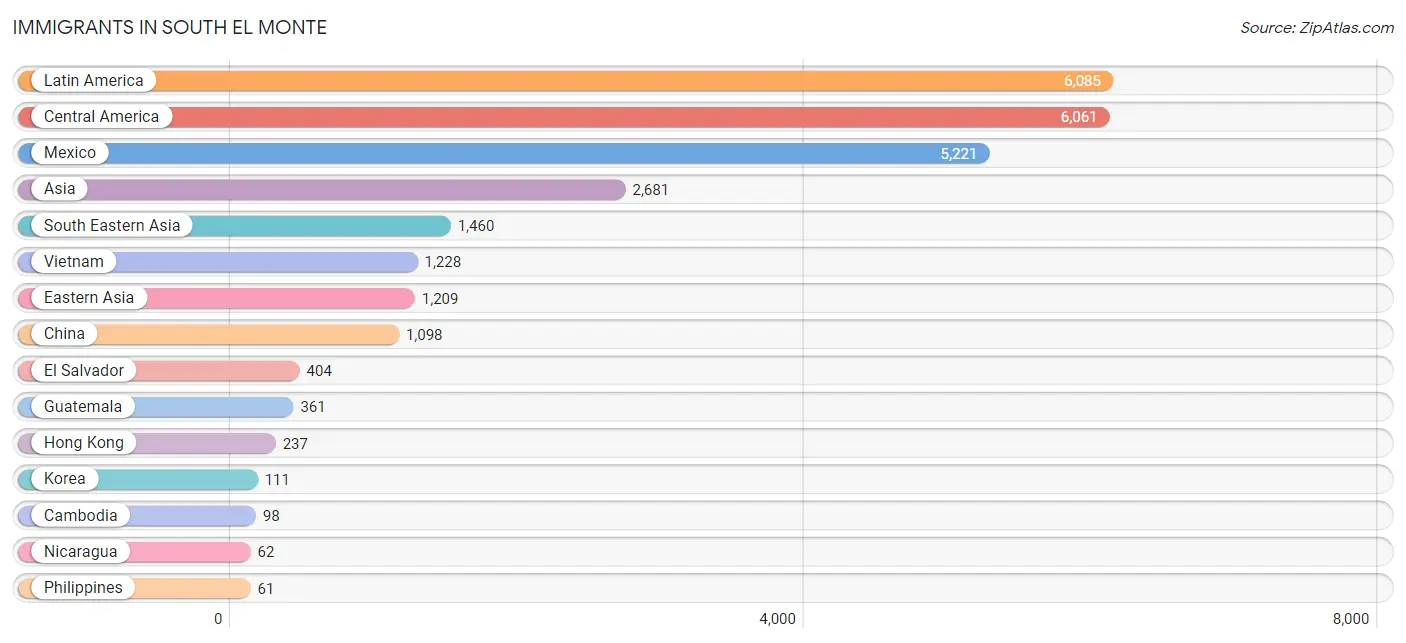
Immigrants in South El Monte
The most numerous immigrant groups reported in South El Monte came from Latin America (6,085 | 30.9%), Central America (6,061 | 30.8%), Mexico (5,221 | 26.5%), Asia (2,681 | 13.6%), and South Eastern Asia (1,460 | 7.4%), together accounting for 109.2% of all South El Monte residents.
| Immigration Origin | # Population | % Population |
| Africa | 10 | 0.1% |
| Armenia | 12 | 0.1% |
| Asia | 2,681 | 13.6% |
| Cambodia | 98 | 0.5% |
| Central America | 6,061 | 30.8% |
| China | 1,098 | 5.6% |
| Colombia | 4 | 0.0% |
| Eastern Asia | 1,209 | 6.1% |
| El Salvador | 404 | 2.1% |
| Europe | 4 | 0.0% |
| Germany | 4 | 0.0% |
| Guatemala | 361 | 1.8% |
| Honduras | 13 | 0.1% |
| Hong Kong | 237 | 1.2% |
| Indonesia | 12 | 0.1% |
| Korea | 111 | 0.6% |
| Latin America | 6,085 | 30.9% |
| Mexico | 5,221 | 26.5% |
| Nicaragua | 62 | 0.3% |
| Peru | 20 | 0.1% |
| Philippines | 61 | 0.3% |
| South America | 24 | 0.1% |
| South Eastern Asia | 1,460 | 7.4% |
| Taiwan | 26 | 0.1% |
| Thailand | 20 | 0.1% |
| Vietnam | 1,228 | 6.2% |
| Western Asia | 12 | 0.1% |
| Western Europe | 4 | 0.0% | View All 28 Rows |
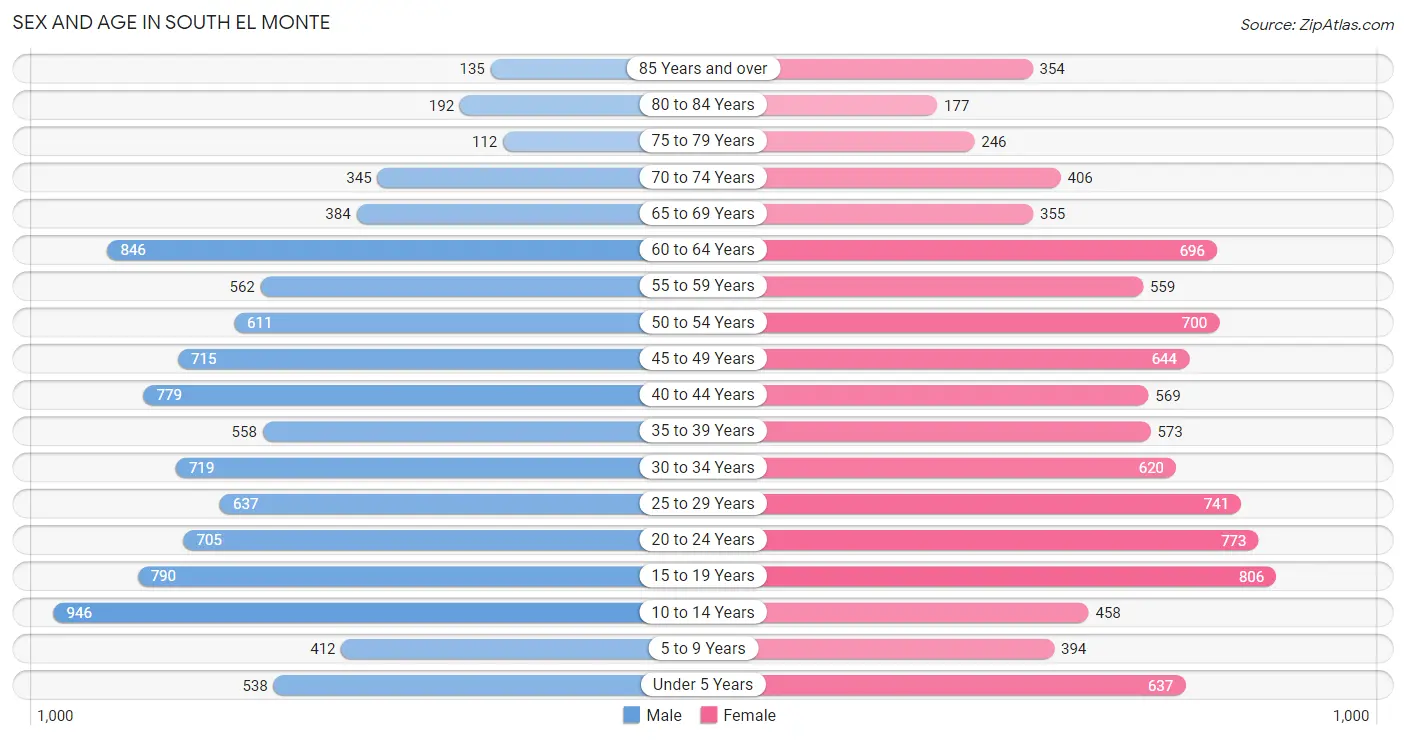
Sex and Age in South El Monte
Sex and Age in South El Monte
The most populous age groups in South El Monte are 10 to 14 Years (946 | 9.5%) for men and 15 to 19 Years (806 | 8.3%) for women.
| Age Bracket | Male | Female |
| Under 5 Years | 538 (5.4%) | 637 (6.6%) |
| 5 to 9 Years | 412 (4.1%) | 394 (4.1%) |
| 10 to 14 Years | 946 (9.5%) | 458 (4.7%) |
| 15 to 19 Years | 790 (7.9%) | 806 (8.3%) |
| 20 to 24 Years | 705 (7.1%) | 773 (8.0%) |
| 25 to 29 Years | 637 (6.4%) | 741 (7.6%) |
| 30 to 34 Years | 719 (7.2%) | 620 (6.4%) |
| 35 to 39 Years | 558 (5.6%) | 573 (5.9%) |
| 40 to 44 Years | 779 (7.8%) | 569 (5.9%) |
| 45 to 49 Years | 715 (7.2%) | 644 (6.6%) |
| 50 to 54 Years | 611 (6.1%) | 700 (7.2%) |
| 55 to 59 Years | 562 (5.6%) | 559 (5.8%) |
| 60 to 64 Years | 846 (8.5%) | 696 (7.2%) |
| 65 to 69 Years | 384 (3.8%) | 355 (3.7%) |
| 70 to 74 Years | 345 (3.5%) | 406 (4.2%) |
| 75 to 79 Years | 112 (1.1%) | 246 (2.5%) |
| 80 to 84 Years | 192 (1.9%) | 177 (1.8%) |
| 85 Years and over | 135 (1.3%) | 354 (3.6%) |
| Total | 9,986 (100.0%) | 9,708 (100.0%) |
Families and Households in South El Monte
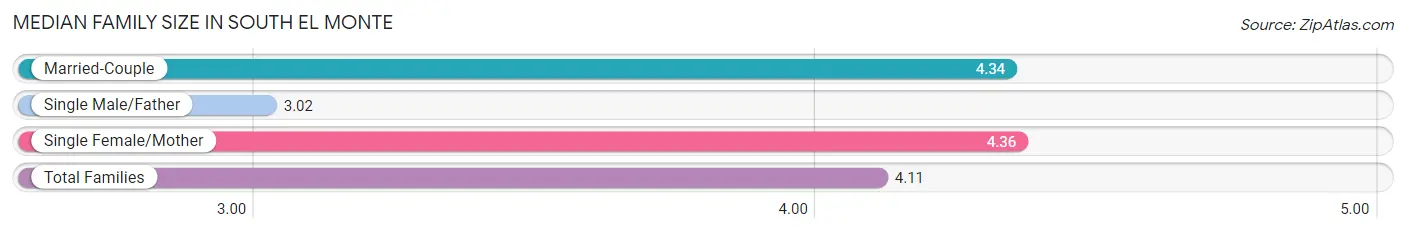
Median Family Size in South El Monte
The median family size in South El Monte is 4.11 persons per family, with single female/mother families (1,090 | 25.4%) accounting for the largest median family size of 4.36 persons per family. On the other hand, single male/father families (779 | 18.1%) represent the smallest median family size with 3.02 persons per family.
| Family Type | # Families | Family Size |
| Married-Couple | 2,425 (56.5%) | 4.34 |
| Single Male/Father | 779 (18.1%) | 3.02 |
| Single Female/Mother | 1,090 (25.4%) | 4.36 |
| Total Families | 4,294 (100.0%) | 4.11 |
Median Household Size in South El Monte
The median household size in South El Monte is 3.91 persons per household, with single female/mother households (1,090 | 21.7%) accounting for the largest median household size of 4.8 persons per household. non-family households (739 | 14.7%) represent the smallest median household size with 1.19 persons per household.

| Household Type | # Households | Household Size |
| Married-Couple | 2,425 (48.2%) | 4.45 |
| Single Male/Father | 779 (15.5%) | 3.53 |
| Single Female/Mother | 1,090 (21.7%) | 4.80 |
| Non-family | 739 (14.7%) | 1.19 |
| Total Households | 5,033 (100.0%) | 3.91 |
Household Size by Marriage Status in South El Monte
Out of a total of 5,033 households in South El Monte, 4,294 (85.3%) are family households, while 739 (14.7%) are nonfamily households. The most numerous type of family households are 4-person households, comprising 1,068, and the most common type of nonfamily households are 1-person households, comprising 645.

| Household Size | Family Households | Nonfamily Households |
| 1-Person Households | - | 645 (12.8%) |
| 2-Person Households | 847 (16.8%) | 72 (1.4%) |
| 3-Person Households | 972 (19.3%) | 4 (0.1%) |
| 4-Person Households | 1,068 (21.2%) | 18 (0.4%) |
| 5-Person Households | 713 (14.2%) | 0 (0.0%) |
| 6-Person Households | 426 (8.5%) | 0 (0.0%) |
| 7+ Person Households | 268 (5.3%) | 0 (0.0%) |
| Total | 4,294 (85.3%) | 739 (14.7%) |
Female Fertility in South El Monte
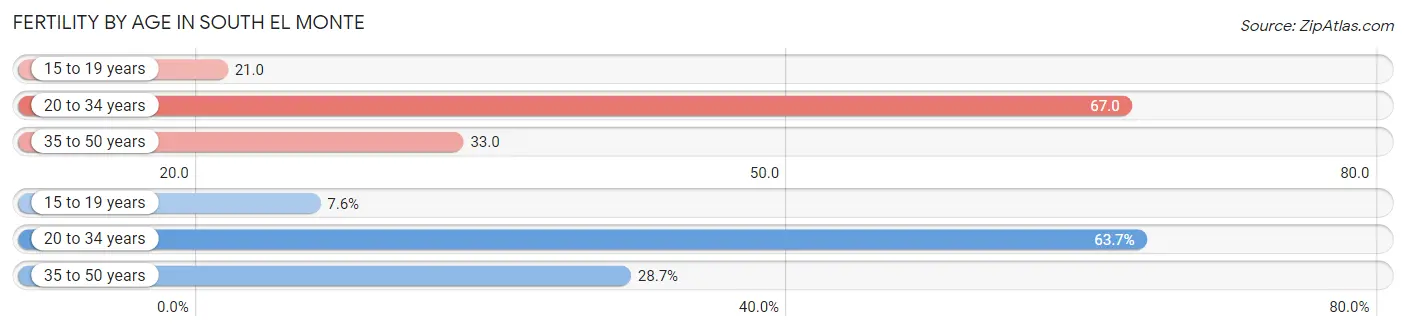
Fertility by Age in South El Monte
Average fertility rate in South El Monte is 46.0 births per 1,000 women. Women in the age bracket of 20 to 34 years have the highest fertility rate with 67.0 births per 1,000 women. Women in the age bracket of 20 to 34 years acount for 63.7% of all women with births.
| Age Bracket | Women with Births | Births / 1,000 Women |
| 15 to 19 years | 17 (7.6%) | 21.0 |
| 20 to 34 years | 142 (63.7%) | 67.0 |
| 35 to 50 years | 64 (28.7%) | 33.0 |
| Total | 223 (100.0%) | 46.0 |
Fertility by Age by Marriage Status in South El Monte
55.6% of women with births (223) in South El Monte are married. The highest percentage of unmarried women with births falls into 15 to 19 years age bracket with 100.0% of them unmarried at the time of birth, while the lowest percentage of unmarried women with births belong to 35 to 50 years age bracket with 0.0% of them unmarried.
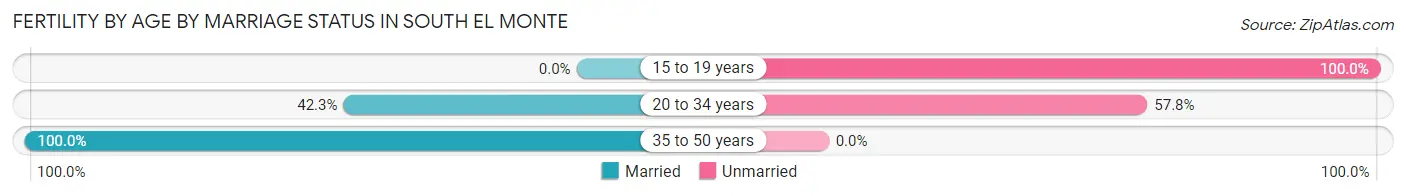
| Age Bracket | Married | Unmarried |
| 15 to 19 years | 0 (0.0%) | 17 (100.0%) |
| 20 to 34 years | 60 (42.2%) | 82 (57.8%) |
| 35 to 50 years | 64 (100.0%) | 0 (0.0%) |
| Total | 124 (55.6%) | 99 (44.4%) |
Fertility by Education in South El Monte
Average fertility rate in South El Monte is 46.0 births per 1,000 women. Women with the education attainment of graduate degree have the highest fertility rate of 214.0 births per 1,000 women, while women with the education attainment of high school diploma have the lowest fertility at 9.0 births per 1,000 women. Women with the education attainment of less than high school represent 36.3% of all women with births.
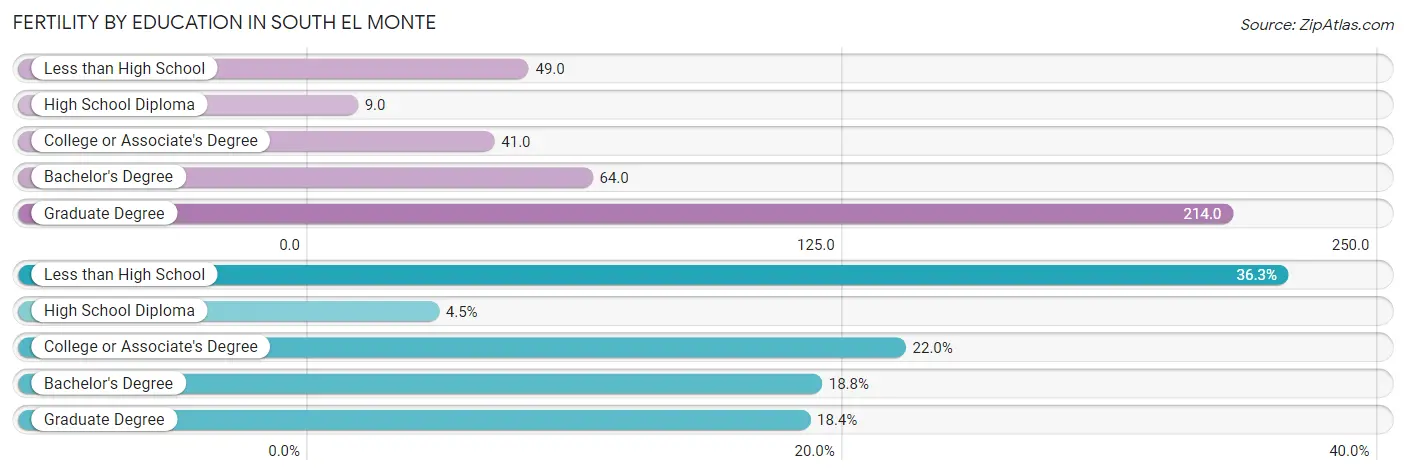
| Educational Attainment | Women with Births | Births / 1,000 Women |
| Less than High School | 81 (36.3%) | 49.0 |
| High School Diploma | 10 (4.5%) | 9.0 |
| College or Associate's Degree | 49 (22.0%) | 41.0 |
| Bachelor's Degree | 42 (18.8%) | 64.0 |
| Graduate Degree | 41 (18.4%) | 214.0 |
| Total | 223 (100.0%) | 46.0 |
Fertility by Education by Marriage Status in South El Monte
44.4% of women with births in South El Monte are unmarried. Women with the educational attainment of bachelor's degree are most likely to be married with 100.0% of them married at childbirth, while women with the educational attainment of graduate degree are least likely to be married with 82.9% of them unmarried at childbirth.
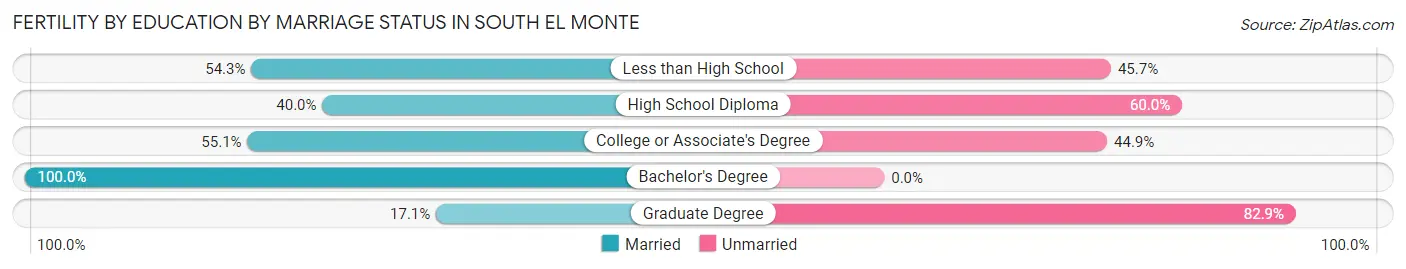
| Educational Attainment | Married | Unmarried |
| Less than High School | 44 (54.3%) | 37 (45.7%) |
| High School Diploma | 4 (40.0%) | 6 (60.0%) |
| College or Associate's Degree | 27 (55.1%) | 22 (44.9%) |
| Bachelor's Degree | 42 (100.0%) | 0 (0.0%) |
| Graduate Degree | 7 (17.1%) | 34 (82.9%) |
| Total | 124 (55.6%) | 99 (44.4%) |
Employment Characteristics in South El Monte
Employment by Class of Employer in South El Monte
Among the 8,525 employed individuals in South El Monte, private company employees (6,621 | 77.7%), local government employees (541 | 6.4%), and self-employed (not incorporated) (411 | 4.8%) make up the most common classes of employment.
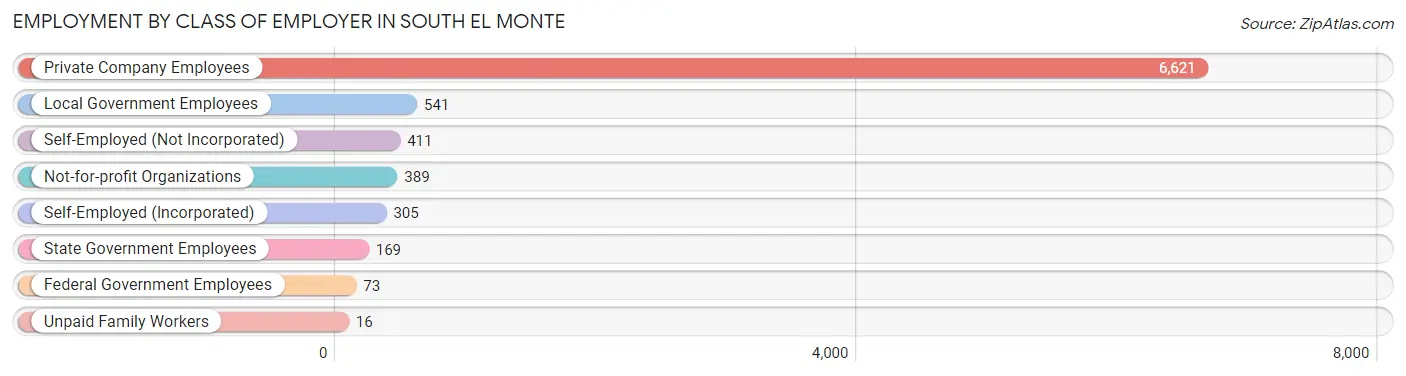
| Employer Class | # Employees | % Employees |
| Private Company Employees | 6,621 | 77.7% |
| Self-Employed (Incorporated) | 305 | 3.6% |
| Self-Employed (Not Incorporated) | 411 | 4.8% |
| Not-for-profit Organizations | 389 | 4.6% |
| Local Government Employees | 541 | 6.4% |
| State Government Employees | 169 | 2.0% |
| Federal Government Employees | 73 | 0.9% |
| Unpaid Family Workers | 16 | 0.2% |
| Total | 8,525 | 100.0% |
Employment Status by Age in South El Monte
According to the labor force statistics for South El Monte, out of the total population over 16 years of age (15,823), 59.3% or 9,383 individuals are in the labor force, with 6.7% or 629 of them unemployed. The age group with the highest labor force participation rate is 30 to 34 years, with 88.6% or 1,186 individuals in the labor force. Within the labor force, the 30 to 34 years age range has the highest percentage of unemployed individuals, with 16.1% or 191 of them being unemployed.
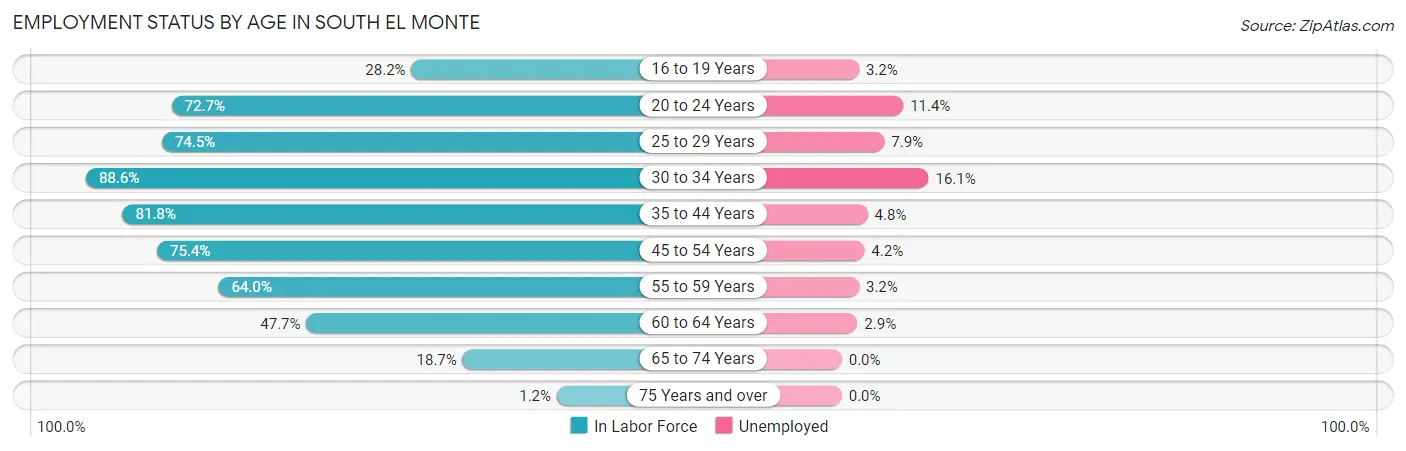
| Age Bracket | In Labor Force | Unemployed |
| 16 to 19 Years | 313 (28.2%) | 10 (3.2%) |
| 20 to 24 Years | 1,075 (72.7%) | 123 (11.4%) |
| 25 to 29 Years | 1,027 (74.5%) | 81 (7.9%) |
| 30 to 34 Years | 1,186 (88.6%) | 191 (16.1%) |
| 35 to 44 Years | 2,028 (81.8%) | 97 (4.8%) |
| 45 to 54 Years | 2,013 (75.4%) | 85 (4.2%) |
| 55 to 59 Years | 717 (64.0%) | 23 (3.2%) |
| 60 to 64 Years | 736 (47.7%) | 21 (2.9%) |
| 65 to 74 Years | 279 (18.7%) | 0 (0.0%) |
| 75 Years and over | 15 (1.2%) | 0 (0.0%) |
| Total | 9,383 (59.3%) | 629 (6.7%) |
Employment Status by Educational Attainment in South El Monte
According to labor force statistics for South El Monte, 73.2% of individuals (7,707) out of the total population between 25 and 64 years of age (10,529) are in the labor force, with 6.5% or 501 of them being unemployed. The group with the highest labor force participation rate are those with the educational attainment of bachelor's degree or higher, with 92.9% or 1,140 individuals in the labor force. Within the labor force, individuals with high school diploma education have the highest percentage of unemployment, with 10.1% or 229 of them being unemployed.
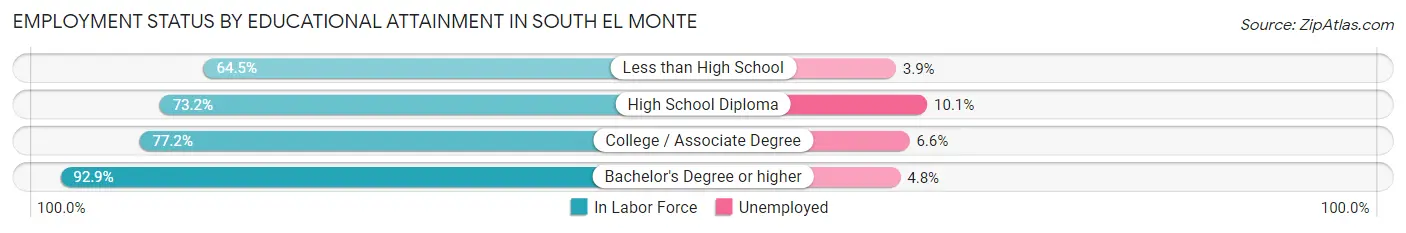
| Educational Attainment | In Labor Force | Unemployed |
| Less than High School | 2,508 (64.5%) | 152 (3.9%) |
| High School Diploma | 2,268 (73.2%) | 313 (10.1%) |
| College / Associate Degree | 1,788 (77.2%) | 153 (6.6%) |
| Bachelor's Degree or higher | 1,140 (92.9%) | 59 (4.8%) |
| Total | 7,707 (73.2%) | 684 (6.5%) |
Employment Occupations by Sex in South El Monte
Management, Business, Science and Arts Occupations
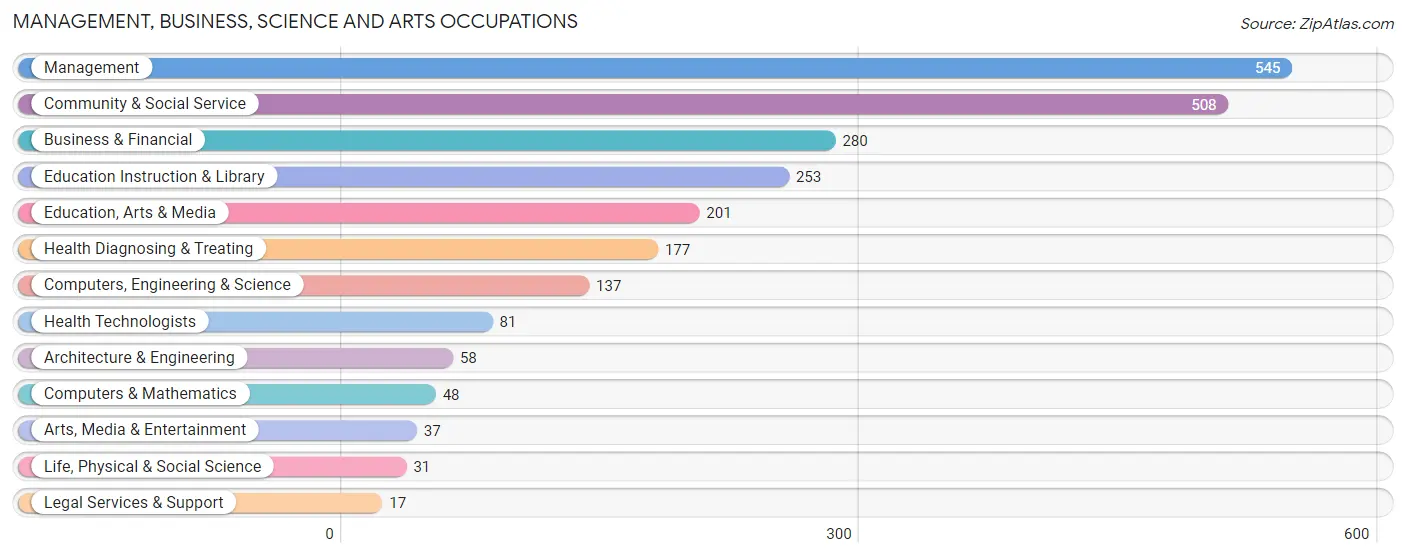
The most common Management, Business, Science and Arts occupations in South El Monte are Management (545 | 6.2%), Community & Social Service (508 | 5.8%), Business & Financial (280 | 3.2%), Education Instruction & Library (253 | 2.9%), and Education, Arts & Media (201 | 2.3%).
Management, Business, Science and Arts Occupations by Sex
Within the Management, Business, Science and Arts occupations in South El Monte, the most male-oriented occupations are Computers & Mathematics (79.2%), Architecture & Engineering (77.6%), and Arts, Media & Entertainment (75.7%), while the most female-oriented occupations are Legal Services & Support (100.0%), Business & Financial (87.1%), and Education Instruction & Library (78.7%).
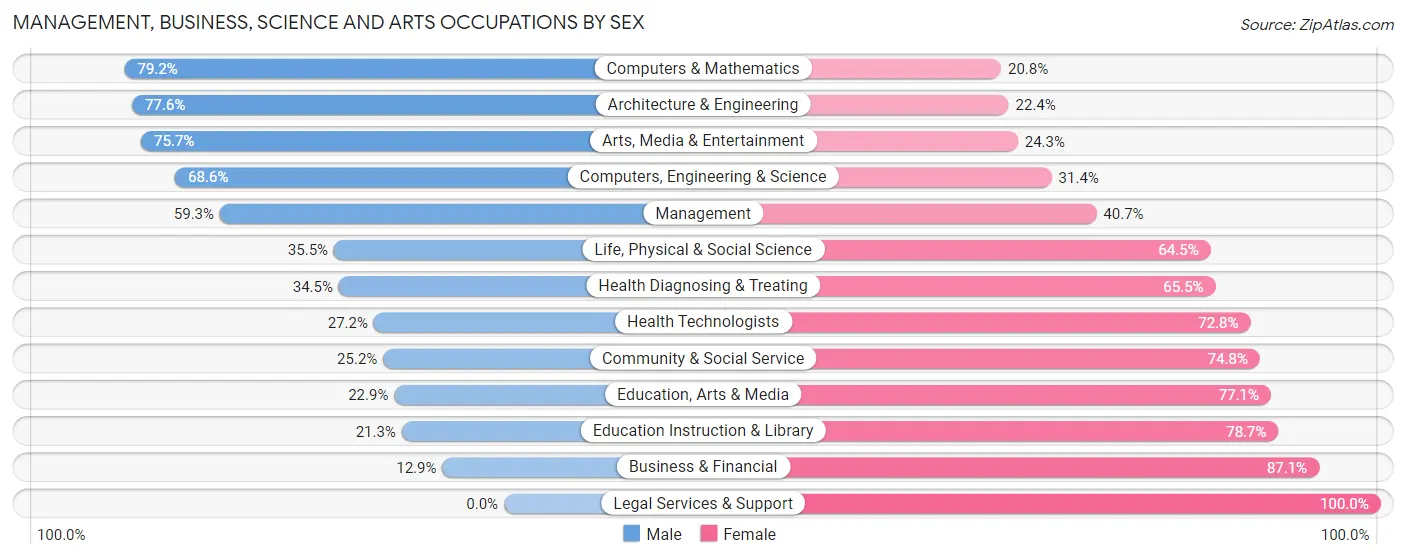
| Occupation | Male | Female |
| Management | 323 (59.3%) | 222 (40.7%) |
| Business & Financial | 36 (12.9%) | 244 (87.1%) |
| Computers, Engineering & Science | 94 (68.6%) | 43 (31.4%) |
| Computers & Mathematics | 38 (79.2%) | 10 (20.8%) |
| Architecture & Engineering | 45 (77.6%) | 13 (22.4%) |
| Life, Physical & Social Science | 11 (35.5%) | 20 (64.5%) |
| Community & Social Service | 128 (25.2%) | 380 (74.8%) |
| Education, Arts & Media | 46 (22.9%) | 155 (77.1%) |
| Legal Services & Support | 0 (0.0%) | 17 (100.0%) |
| Education Instruction & Library | 54 (21.3%) | 199 (78.7%) |
| Arts, Media & Entertainment | 28 (75.7%) | 9 (24.3%) |
| Health Diagnosing & Treating | 61 (34.5%) | 116 (65.5%) |
| Health Technologists | 22 (27.2%) | 59 (72.8%) |
| Total (Category) | 642 (39.0%) | 1,005 (61.0%) |
| Total (Overall) | 5,020 (57.4%) | 3,729 (42.6%) |
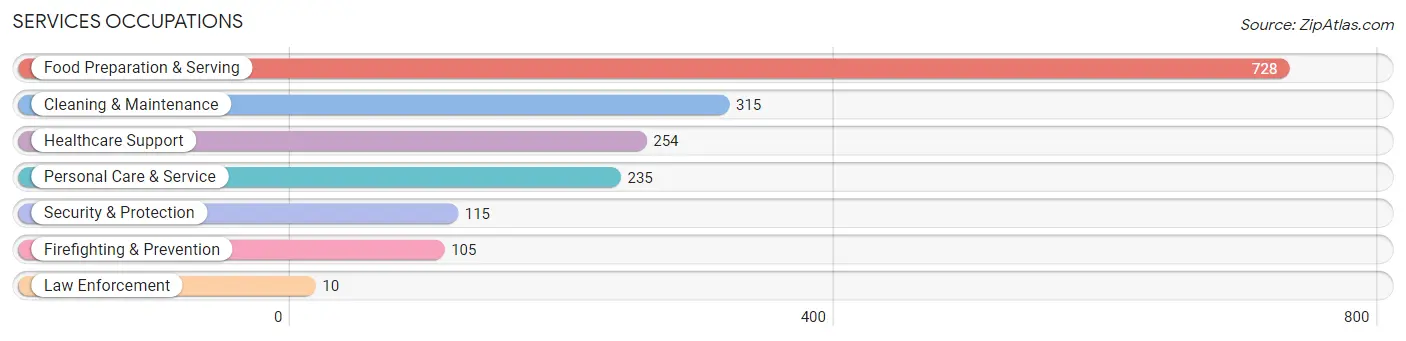
Services Occupations
The most common Services occupations in South El Monte are Food Preparation & Serving (728 | 8.3%), Cleaning & Maintenance (315 | 3.6%), Healthcare Support (254 | 2.9%), Personal Care & Service (235 | 2.7%), and Security & Protection (115 | 1.3%).
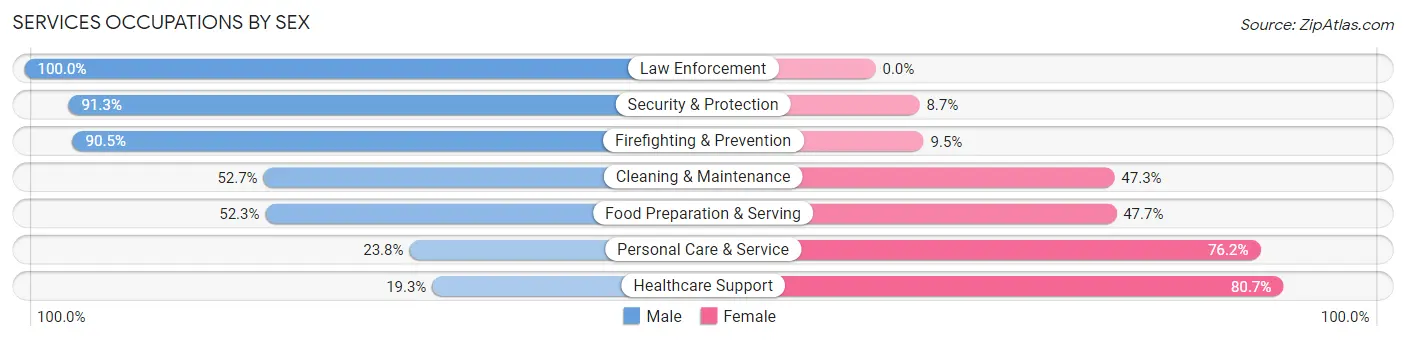
Services Occupations by Sex
Within the Services occupations in South El Monte, the most male-oriented occupations are Law Enforcement (100.0%), Security & Protection (91.3%), and Firefighting & Prevention (90.5%), while the most female-oriented occupations are Healthcare Support (80.7%), Personal Care & Service (76.2%), and Food Preparation & Serving (47.7%).
| Occupation | Male | Female |
| Healthcare Support | 49 (19.3%) | 205 (80.7%) |
| Security & Protection | 105 (91.3%) | 10 (8.7%) |
| Firefighting & Prevention | 95 (90.5%) | 10 (9.5%) |
| Law Enforcement | 10 (100.0%) | 0 (0.0%) |
| Food Preparation & Serving | 381 (52.3%) | 347 (47.7%) |
| Cleaning & Maintenance | 166 (52.7%) | 149 (47.3%) |
| Personal Care & Service | 56 (23.8%) | 179 (76.2%) |
| Total (Category) | 757 (46.0%) | 890 (54.0%) |
| Total (Overall) | 5,020 (57.4%) | 3,729 (42.6%) |
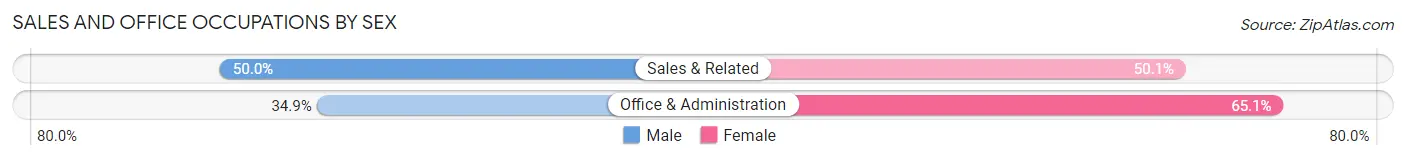
Sales and Office Occupations
The most common Sales and Office occupations in South El Monte are Office & Administration (1,262 | 14.4%), and Sales & Related (969 | 11.1%).

Sales and Office Occupations by Sex
| Occupation | Male | Female |
| Sales & Related | 484 (49.9%) | 485 (50.0%) |
| Office & Administration | 441 (34.9%) | 821 (65.1%) |
| Total (Category) | 925 (41.5%) | 1,306 (58.5%) |
| Total (Overall) | 5,020 (57.4%) | 3,729 (42.6%) |
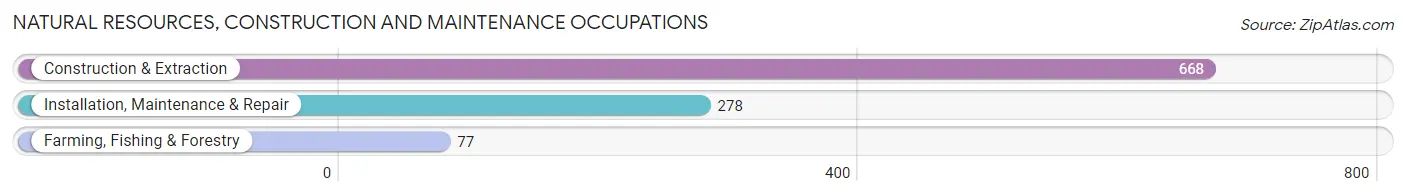
Natural Resources, Construction and Maintenance Occupations
The most common Natural Resources, Construction and Maintenance occupations in South El Monte are Construction & Extraction (668 | 7.6%), Installation, Maintenance & Repair (278 | 3.2%), and Farming, Fishing & Forestry (77 | 0.9%).
Natural Resources, Construction and Maintenance Occupations by Sex
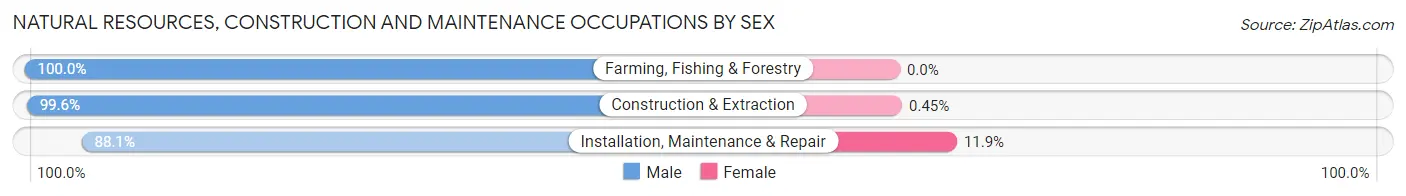
| Occupation | Male | Female |
| Farming, Fishing & Forestry | 77 (100.0%) | 0 (0.0%) |
| Construction & Extraction | 665 (99.6%) | 3 (0.4%) |
| Installation, Maintenance & Repair | 245 (88.1%) | 33 (11.9%) |
| Total (Category) | 987 (96.5%) | 36 (3.5%) |
| Total (Overall) | 5,020 (57.4%) | 3,729 (42.6%) |
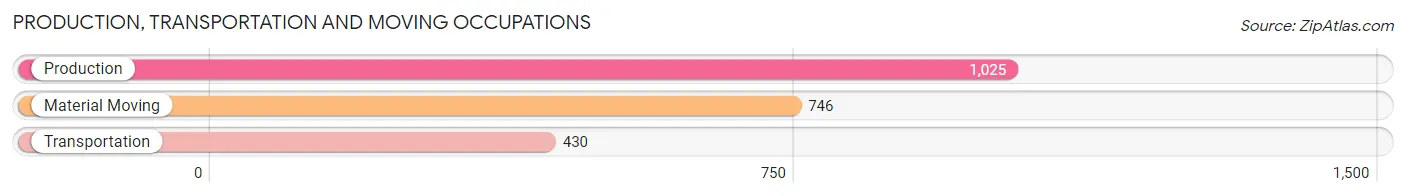
Production, Transportation and Moving Occupations
The most common Production, Transportation and Moving occupations in South El Monte are Production (1,025 | 11.7%), Material Moving (746 | 8.5%), and Transportation (430 | 4.9%).
Production, Transportation and Moving Occupations by Sex
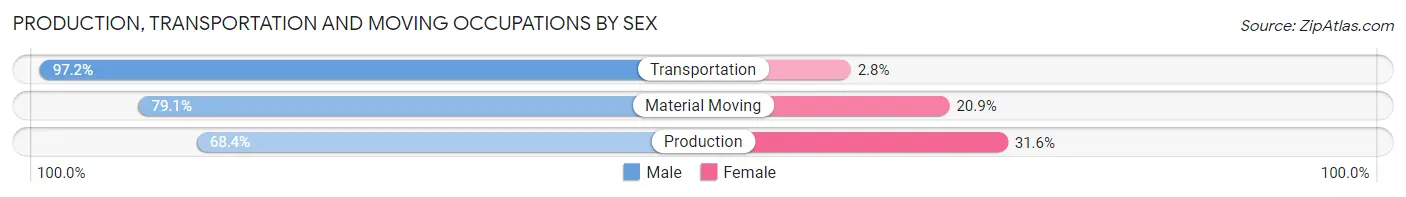
| Occupation | Male | Female |
| Production | 701 (68.4%) | 324 (31.6%) |
| Transportation | 418 (97.2%) | 12 (2.8%) |
| Material Moving | 590 (79.1%) | 156 (20.9%) |
| Total (Category) | 1,709 (77.6%) | 492 (22.4%) |
| Total (Overall) | 5,020 (57.4%) | 3,729 (42.6%) |
Employment Industries by Sex in South El Monte
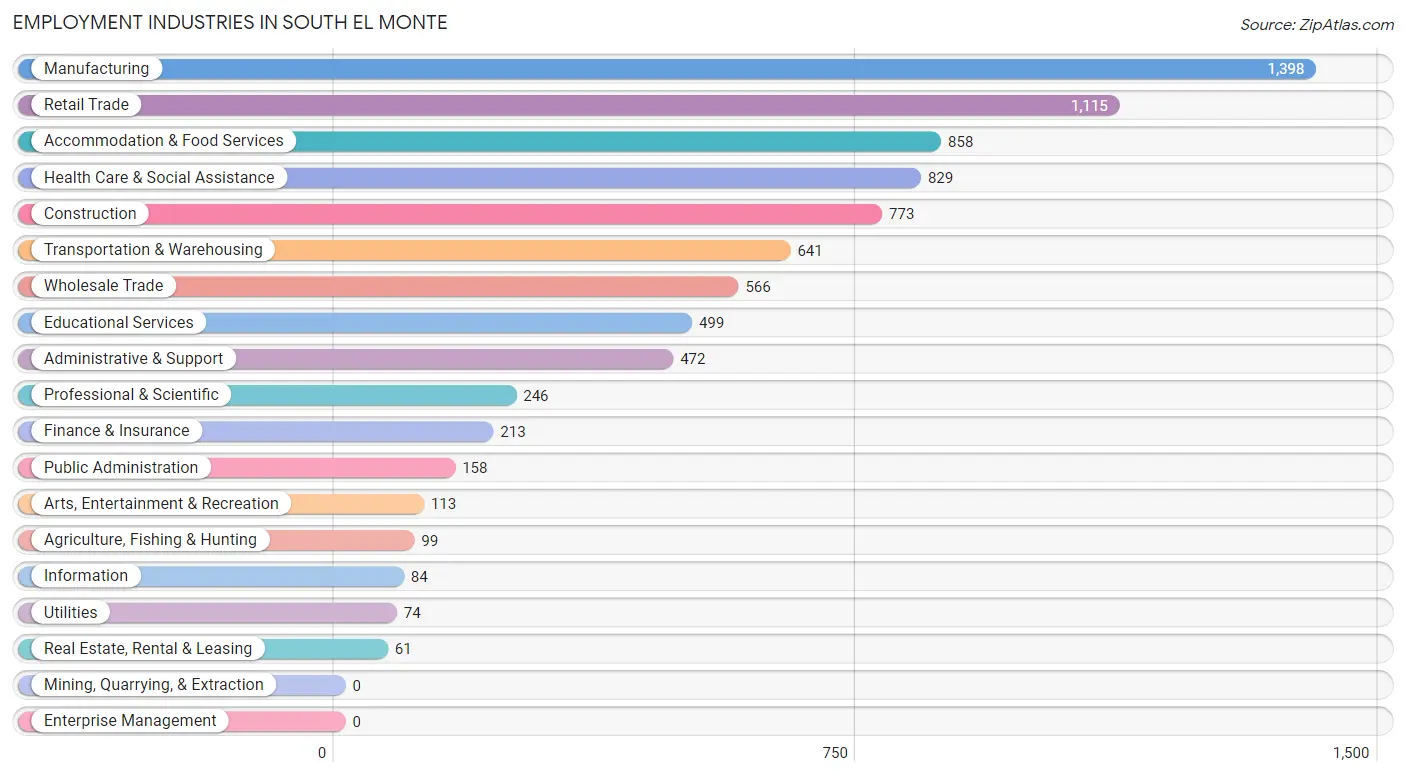
Employment Industries in South El Monte
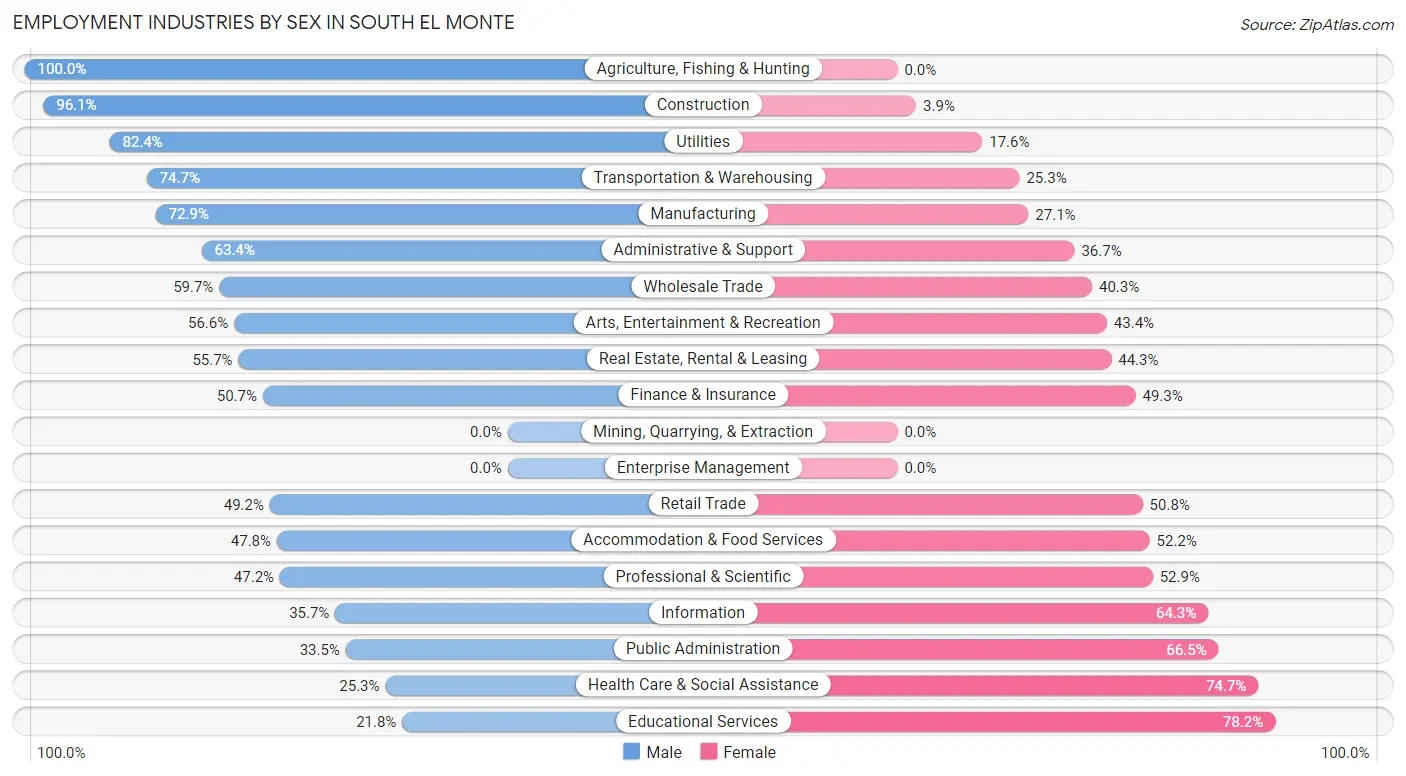
The major employment industries in South El Monte include Manufacturing (1,398 | 16.0%), Retail Trade (1,115 | 12.7%), Accommodation & Food Services (858 | 9.8%), Health Care & Social Assistance (829 | 9.5%), and Construction (773 | 8.8%).
Employment Industries by Sex in South El Monte
The South El Monte industries that see more men than women are Agriculture, Fishing & Hunting (100.0%), Construction (96.1%), and Utilities (82.4%), whereas the industries that tend to have a higher number of women are Educational Services (78.2%), Health Care & Social Assistance (74.7%), and Public Administration (66.5%).
| Industry | Male | Female |
| Agriculture, Fishing & Hunting | 99 (100.0%) | 0 (0.0%) |
| Mining, Quarrying, & Extraction | 0 (0.0%) | 0 (0.0%) |
| Construction | 743 (96.1%) | 30 (3.9%) |
| Manufacturing | 1,019 (72.9%) | 379 (27.1%) |
| Wholesale Trade | 338 (59.7%) | 228 (40.3%) |
| Retail Trade | 549 (49.2%) | 566 (50.8%) |
| Transportation & Warehousing | 479 (74.7%) | 162 (25.3%) |
| Utilities | 61 (82.4%) | 13 (17.6%) |
| Information | 30 (35.7%) | 54 (64.3%) |
| Finance & Insurance | 108 (50.7%) | 105 (49.3%) |
| Real Estate, Rental & Leasing | 34 (55.7%) | 27 (44.3%) |
| Professional & Scientific | 116 (47.1%) | 130 (52.8%) |
| Enterprise Management | 0 (0.0%) | 0 (0.0%) |
| Administrative & Support | 299 (63.3%) | 173 (36.6%) |
| Educational Services | 109 (21.8%) | 390 (78.2%) |
| Health Care & Social Assistance | 210 (25.3%) | 619 (74.7%) |
| Arts, Entertainment & Recreation | 64 (56.6%) | 49 (43.4%) |
| Accommodation & Food Services | 410 (47.8%) | 448 (52.2%) |
| Public Administration | 53 (33.5%) | 105 (66.5%) |
| Total | 5,020 (57.4%) | 3,729 (42.6%) |
Education in South El Monte
School Enrollment in South El Monte
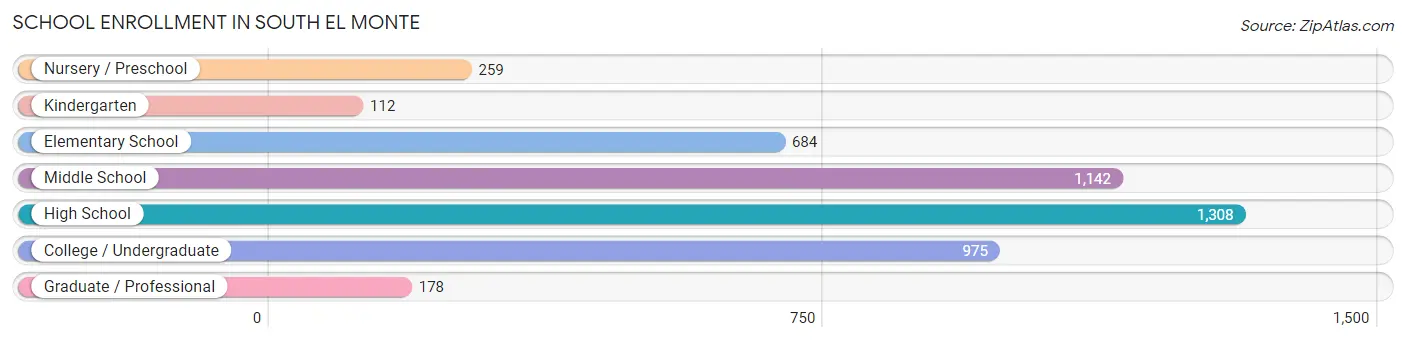
The most common levels of schooling among the 4,658 students in South El Monte are high school (1,308 | 28.1%), middle school (1,142 | 24.5%), and college / undergraduate (975 | 20.9%).
| School Level | # Students | % Students |
| Nursery / Preschool | 259 | 5.6% |
| Kindergarten | 112 | 2.4% |
| Elementary School | 684 | 14.7% |
| Middle School | 1,142 | 24.5% |
| High School | 1,308 | 28.1% |
| College / Undergraduate | 975 | 20.9% |
| Graduate / Professional | 178 | 3.8% |
| Total | 4,658 | 100.0% |
School Enrollment by Age by Funding Source in South El Monte
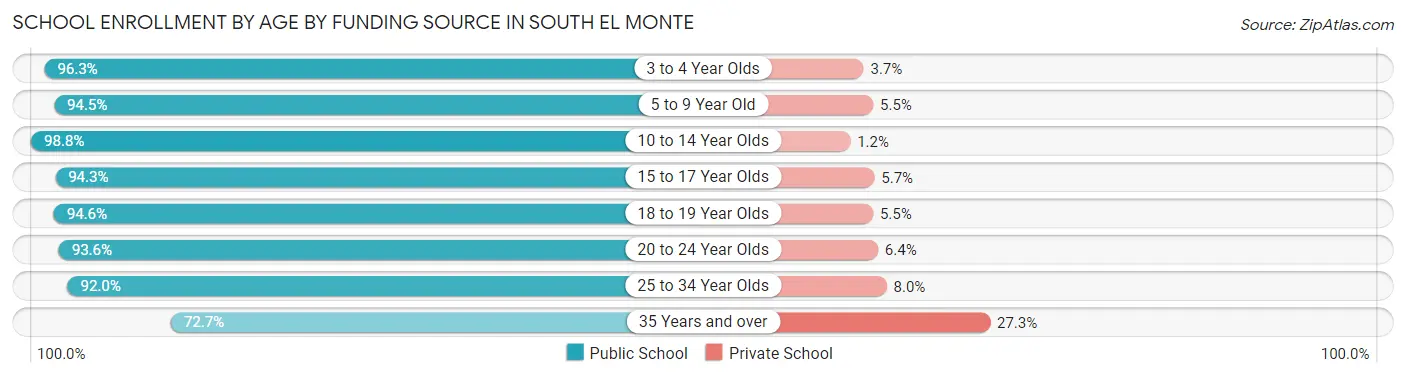
Out of a total of 4,658 students who are enrolled in schools in South El Monte, 233 (5.0%) attend a private institution, while the remaining 4,425 (95.0%) are enrolled in public schools. The age group of 35 years and over has the highest likelihood of being enrolled in private schools, with 36 (27.3% in the age bracket) enrolled. Conversely, the age group of 10 to 14 year olds has the lowest likelihood of being enrolled in a private school, with 1,371 (98.8% in the age bracket) attending a public institution.
| Age Bracket | Public School | Private School |
| 3 to 4 Year Olds | 182 (96.3%) | 7 (3.7%) |
| 5 to 9 Year Old | 741 (94.5%) | 43 (5.5%) |
| 10 to 14 Year Olds | 1,371 (98.8%) | 17 (1.2%) |
| 15 to 17 Year Olds | 1,024 (94.3%) | 62 (5.7%) |
| 18 to 19 Year Olds | 295 (94.6%) | 17 (5.4%) |
| 20 to 24 Year Olds | 484 (93.6%) | 33 (6.4%) |
| 25 to 34 Year Olds | 230 (92.0%) | 20 (8.0%) |
| 35 Years and over | 96 (72.7%) | 36 (27.3%) |
| Total | 4,425 (95.0%) | 233 (5.0%) |
Educational Attainment by Field of Study in South El Monte
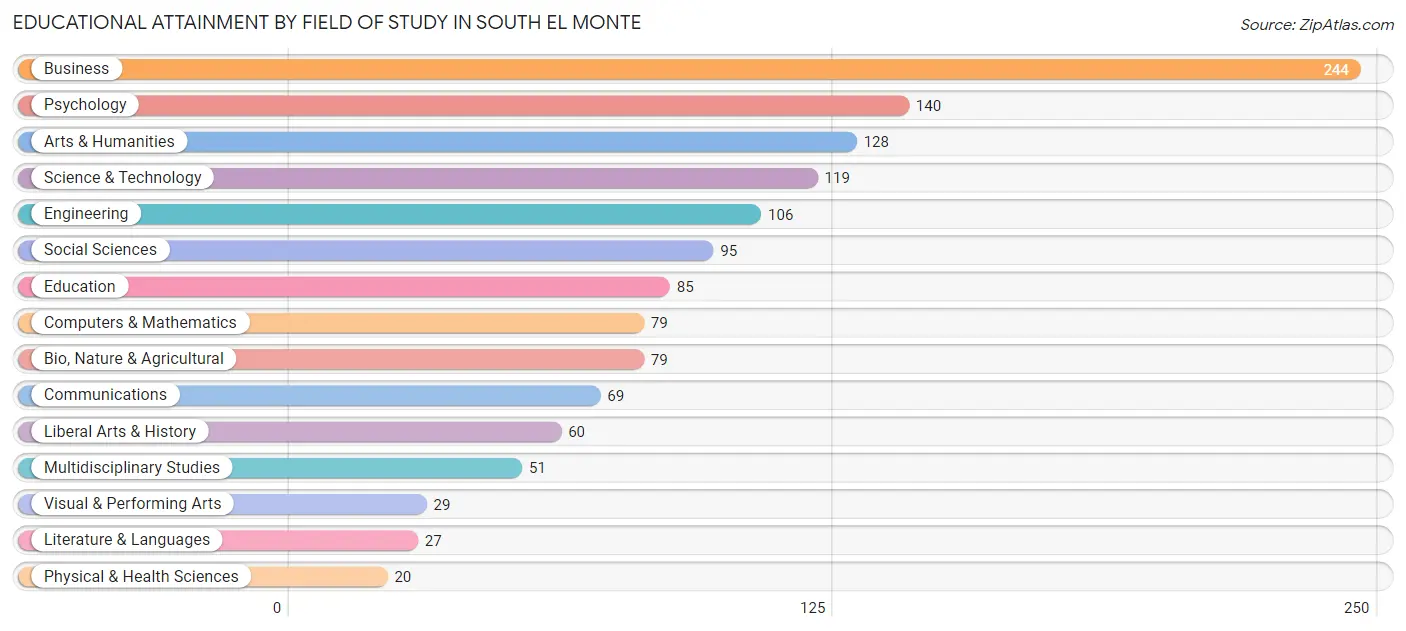
Business (244 | 18.3%), psychology (140 | 10.5%), arts & humanities (128 | 9.6%), science & technology (119 | 8.9%), and engineering (106 | 8.0%) are the most common fields of study among 1,331 individuals in South El Monte who have obtained a bachelor's degree or higher.
| Field of Study | # Graduates | % Graduates |
| Computers & Mathematics | 79 | 5.9% |
| Bio, Nature & Agricultural | 79 | 5.9% |
| Physical & Health Sciences | 20 | 1.5% |
| Psychology | 140 | 10.5% |
| Social Sciences | 95 | 7.1% |
| Engineering | 106 | 8.0% |
| Multidisciplinary Studies | 51 | 3.8% |
| Science & Technology | 119 | 8.9% |
| Business | 244 | 18.3% |
| Education | 85 | 6.4% |
| Literature & Languages | 27 | 2.0% |
| Liberal Arts & History | 60 | 4.5% |
| Visual & Performing Arts | 29 | 2.2% |
| Communications | 69 | 5.2% |
| Arts & Humanities | 128 | 9.6% |
| Total | 1,331 | 100.0% |
Transportation & Commute in South El Monte
Vehicle Availability by Sex in South El Monte
The most prevalent vehicle ownership categories in South El Monte are males with 3 vehicles (1,517, accounting for 30.6%) and females with 3 vehicles (1,015, making up 42.5%).
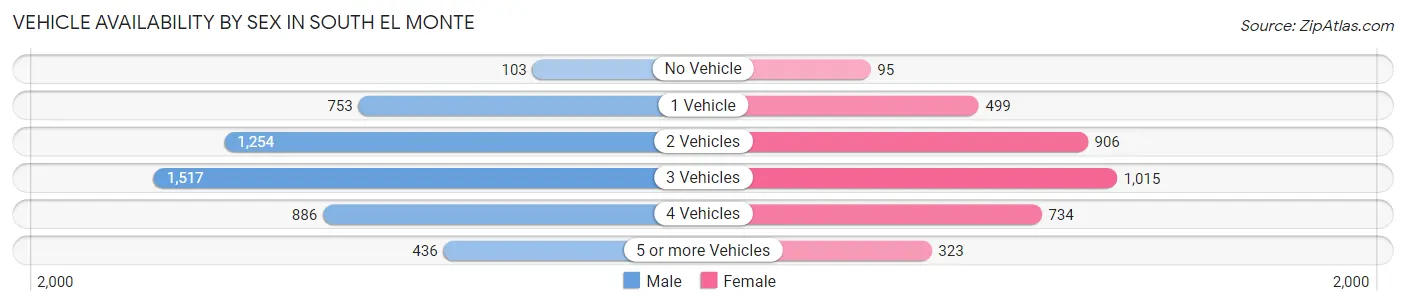
| Vehicles Available | Male | Female |
| No Vehicle | 103 (2.1%) | 95 (2.7%) |
| 1 Vehicle | 753 (15.2%) | 499 (14.0%) |
| 2 Vehicles | 1,254 (25.3%) | 906 (25.4%) |
| 3 Vehicles | 1,517 (30.6%) | 1,015 (28.4%) |
| 4 Vehicles | 886 (17.9%) | 734 (20.5%) |
| 5 or more Vehicles | 436 (8.8%) | 323 (9.0%) |
| Total | 4,949 (100.0%) | 3,572 (100.0%) |
Commute Time in South El Monte
The most frequently occuring commute durations in South El Monte are 30 to 34 minutes (1,295 commuters, 15.8%), 10 to 14 minutes (1,244 commuters, 15.2%), and 20 to 24 minutes (1,072 commuters, 13.1%).
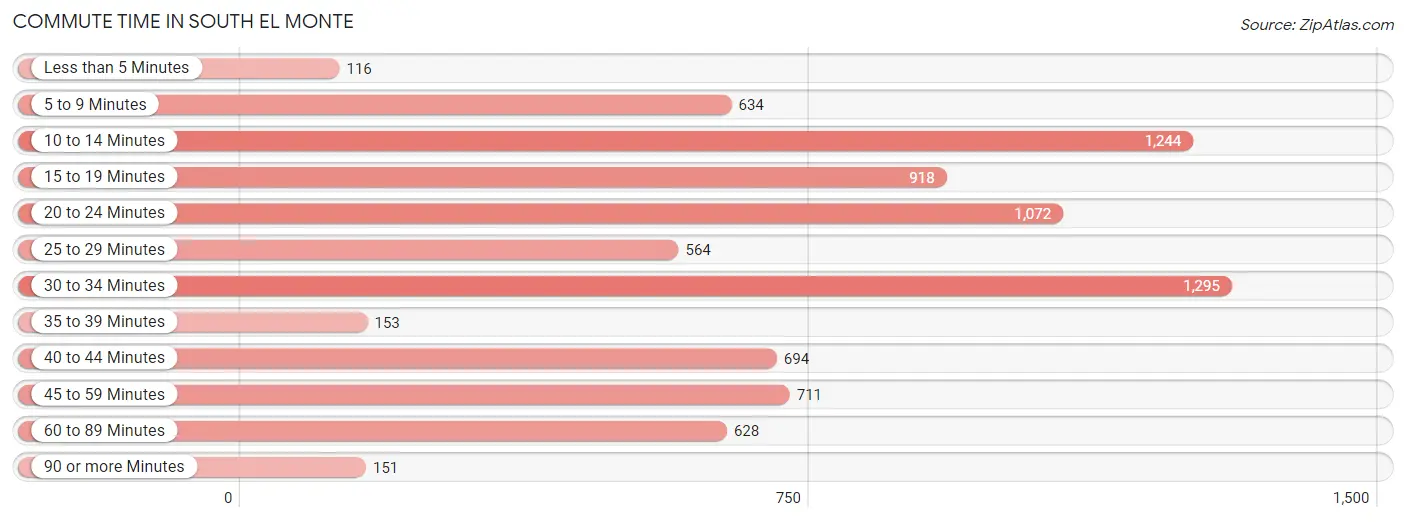
| Commute Time | # Commuters | % Commuters |
| Less than 5 Minutes | 116 | 1.4% |
| 5 to 9 Minutes | 634 | 7.7% |
| 10 to 14 Minutes | 1,244 | 15.2% |
| 15 to 19 Minutes | 918 | 11.2% |
| 20 to 24 Minutes | 1,072 | 13.1% |
| 25 to 29 Minutes | 564 | 6.9% |
| 30 to 34 Minutes | 1,295 | 15.8% |
| 35 to 39 Minutes | 153 | 1.9% |
| 40 to 44 Minutes | 694 | 8.5% |
| 45 to 59 Minutes | 711 | 8.7% |
| 60 to 89 Minutes | 628 | 7.7% |
| 90 or more Minutes | 151 | 1.8% |
Commute Time by Sex in South El Monte
The most common commute times in South El Monte are 30 to 34 minutes (811 commuters, 16.8%) for males and 20 to 24 minutes (564 commuters, 16.8%) for females.
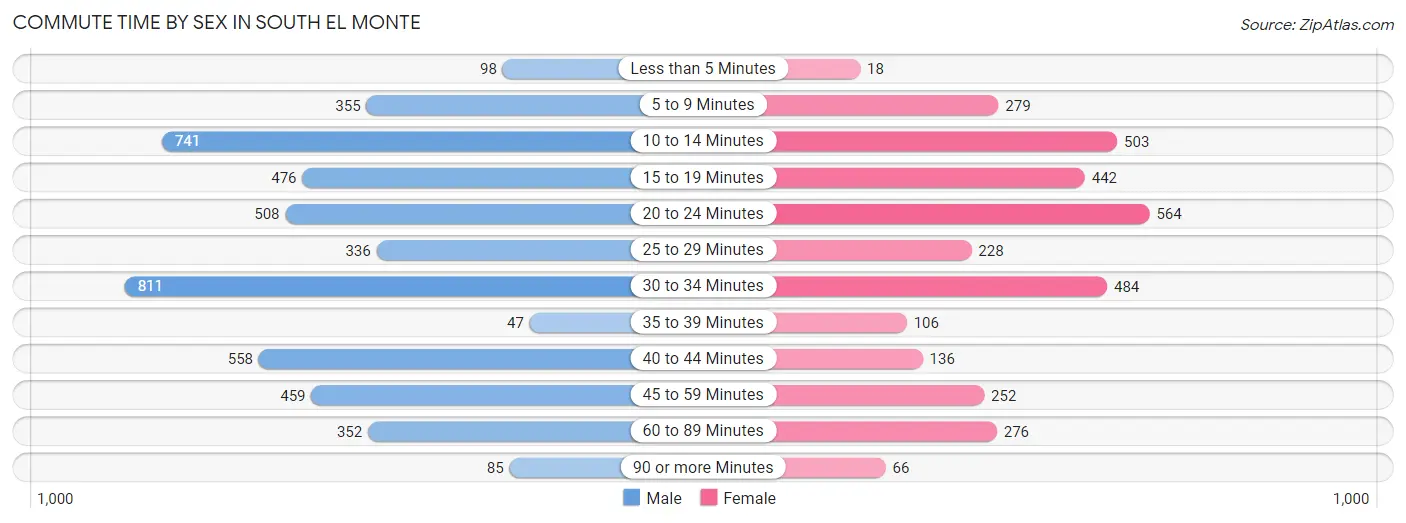
| Commute Time | Male | Female |
| Less than 5 Minutes | 98 (2.0%) | 18 (0.5%) |
| 5 to 9 Minutes | 355 (7.4%) | 279 (8.3%) |
| 10 to 14 Minutes | 741 (15.3%) | 503 (15.0%) |
| 15 to 19 Minutes | 476 (9.9%) | 442 (13.2%) |
| 20 to 24 Minutes | 508 (10.5%) | 564 (16.8%) |
| 25 to 29 Minutes | 336 (7.0%) | 228 (6.8%) |
| 30 to 34 Minutes | 811 (16.8%) | 484 (14.4%) |
| 35 to 39 Minutes | 47 (1.0%) | 106 (3.2%) |
| 40 to 44 Minutes | 558 (11.6%) | 136 (4.1%) |
| 45 to 59 Minutes | 459 (9.5%) | 252 (7.5%) |
| 60 to 89 Minutes | 352 (7.3%) | 276 (8.2%) |
| 90 or more Minutes | 85 (1.8%) | 66 (2.0%) |
Time of Departure to Work by Sex in South El Monte
The most frequent times of departure to work in South El Monte are 6:00 AM to 6:29 AM (615, 12.7%) for males and 8:00 AM to 8:29 AM (445, 13.3%) for females.
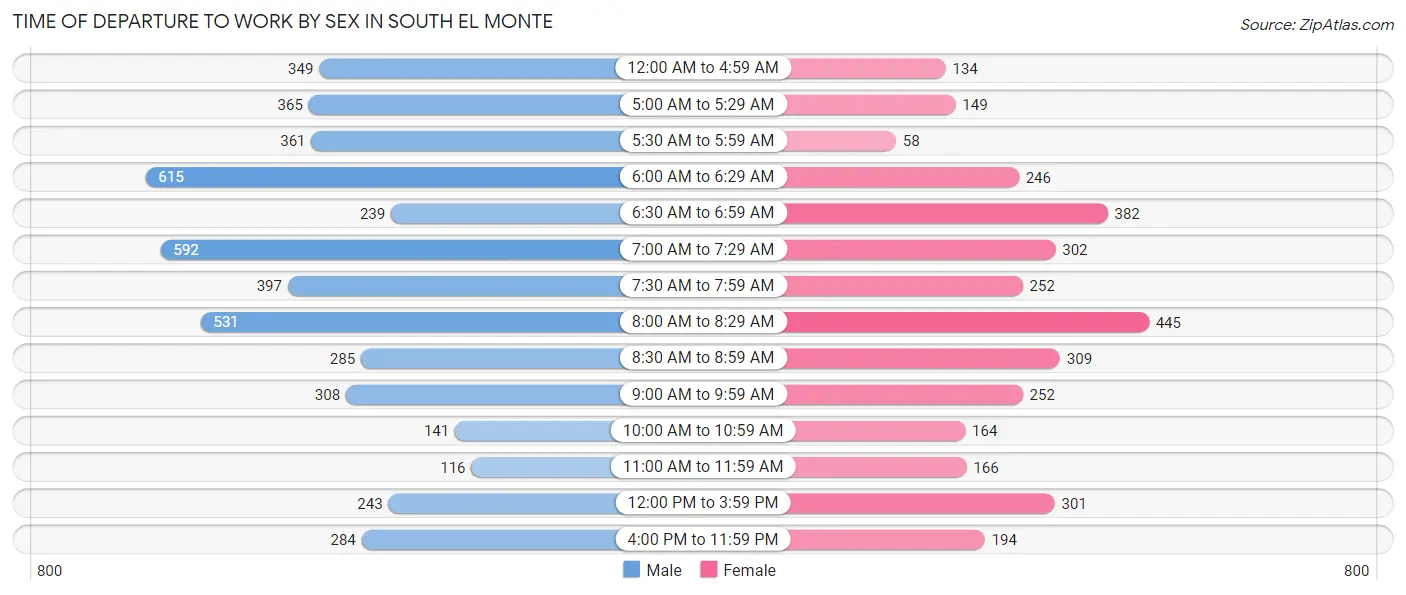
| Time of Departure | Male | Female |
| 12:00 AM to 4:59 AM | 349 (7.2%) | 134 (4.0%) |
| 5:00 AM to 5:29 AM | 365 (7.6%) | 149 (4.4%) |
| 5:30 AM to 5:59 AM | 361 (7.5%) | 58 (1.7%) |
| 6:00 AM to 6:29 AM | 615 (12.7%) | 246 (7.3%) |
| 6:30 AM to 6:59 AM | 239 (5.0%) | 382 (11.4%) |
| 7:00 AM to 7:29 AM | 592 (12.3%) | 302 (9.0%) |
| 7:30 AM to 7:59 AM | 397 (8.2%) | 252 (7.5%) |
| 8:00 AM to 8:29 AM | 531 (11.0%) | 445 (13.3%) |
| 8:30 AM to 8:59 AM | 285 (5.9%) | 309 (9.2%) |
| 9:00 AM to 9:59 AM | 308 (6.4%) | 252 (7.5%) |
| 10:00 AM to 10:59 AM | 141 (2.9%) | 164 (4.9%) |
| 11:00 AM to 11:59 AM | 116 (2.4%) | 166 (5.0%) |
| 12:00 PM to 3:59 PM | 243 (5.0%) | 301 (9.0%) |
| 4:00 PM to 11:59 PM | 284 (5.9%) | 194 (5.8%) |
| Total | 4,826 (100.0%) | 3,354 (100.0%) |
Housing Occupancy in South El Monte
Occupancy by Ownership in South El Monte
Of the total 5,033 dwellings in South El Monte, owner-occupied units account for 2,473 (49.1%), while renter-occupied units make up 2,560 (50.9%).
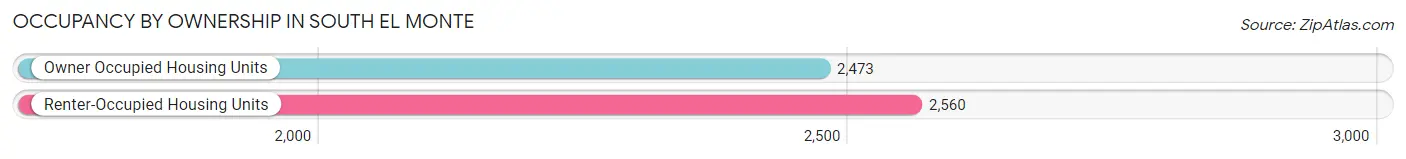
| Occupancy | # Housing Units | % Housing Units |
| Owner Occupied Housing Units | 2,473 | 49.1% |
| Renter-Occupied Housing Units | 2,560 | 50.9% |
| Total Occupied Housing Units | 5,033 | 100.0% |
Occupancy by Household Size in South El Monte
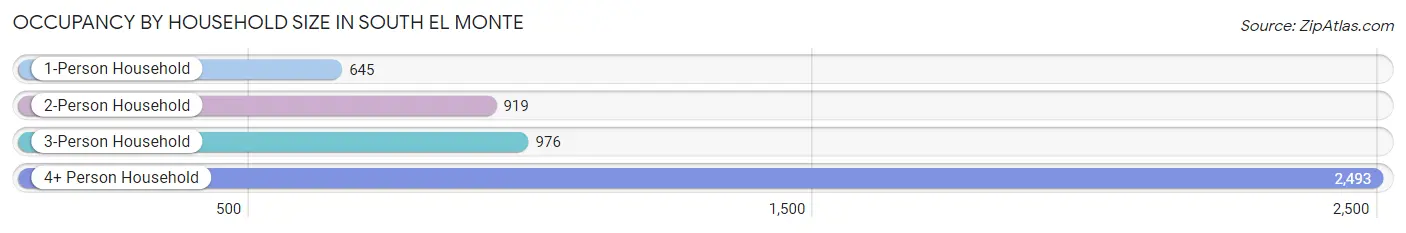
| Household Size | # Housing Units | % Housing Units |
| 1-Person Household | 645 | 12.8% |
| 2-Person Household | 919 | 18.3% |
| 3-Person Household | 976 | 19.4% |
| 4+ Person Household | 2,493 | 49.5% |
| Total Housing Units | 5,033 | 100.0% |
Occupancy by Ownership by Household Size in South El Monte
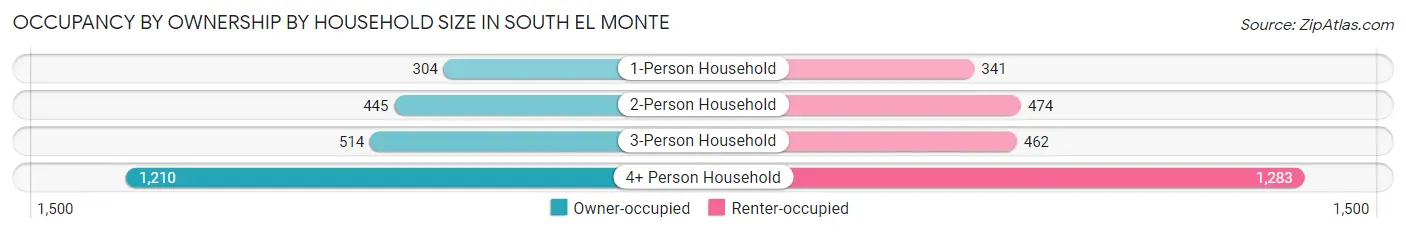
| Household Size | Owner-occupied | Renter-occupied |
| 1-Person Household | 304 (47.1%) | 341 (52.9%) |
| 2-Person Household | 445 (48.4%) | 474 (51.6%) |
| 3-Person Household | 514 (52.7%) | 462 (47.3%) |
| 4+ Person Household | 1,210 (48.5%) | 1,283 (51.5%) |
| Total Housing Units | 2,473 (49.1%) | 2,560 (50.9%) |
Occupancy by Educational Attainment in South El Monte
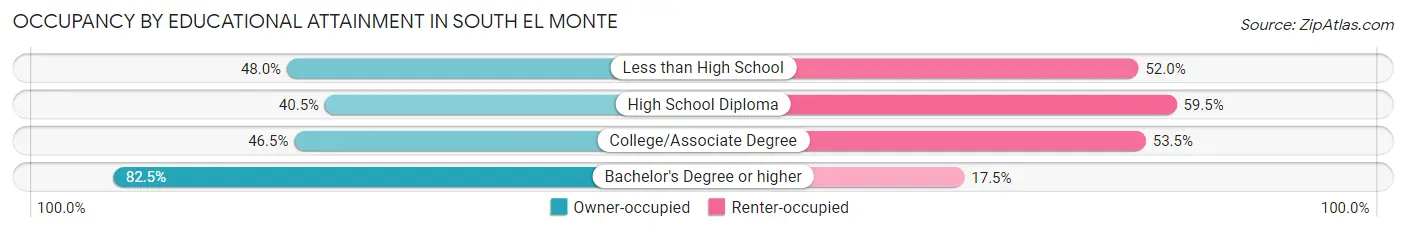
| Household Size | Owner-occupied | Renter-occupied |
| Less than High School | 1,005 (48.0%) | 1,089 (52.0%) |
| High School Diploma | 496 (40.5%) | 730 (59.5%) |
| College/Associate Degree | 571 (46.5%) | 656 (53.5%) |
| Bachelor's Degree or higher | 401 (82.5%) | 85 (17.5%) |
Occupancy by Age of Householder in South El Monte
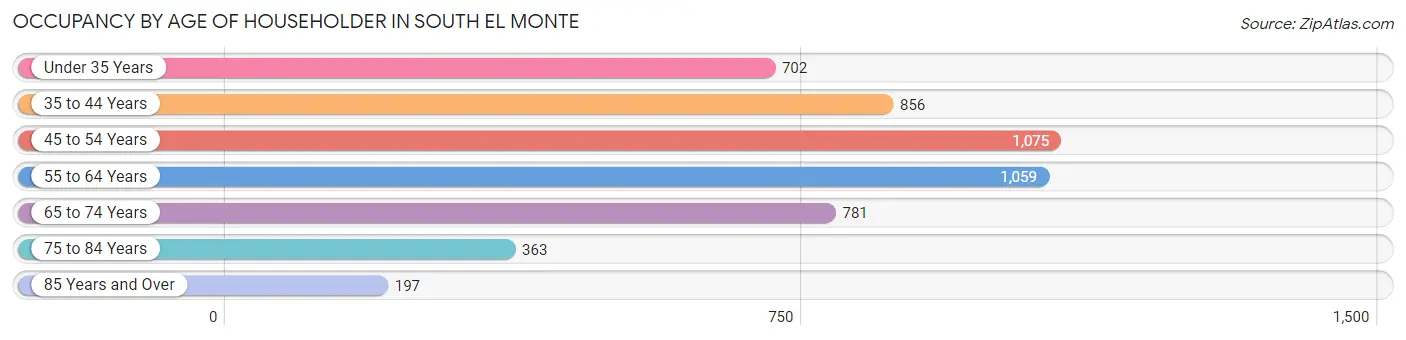
| Age Bracket | # Households | % Households |
| Under 35 Years | 702 | 14.0% |
| 35 to 44 Years | 856 | 17.0% |
| 45 to 54 Years | 1,075 | 21.4% |
| 55 to 64 Years | 1,059 | 21.0% |
| 65 to 74 Years | 781 | 15.5% |
| 75 to 84 Years | 363 | 7.2% |
| 85 Years and Over | 197 | 3.9% |
| Total | 5,033 | 100.0% |
Housing Finances in South El Monte
Median Income by Occupancy in South El Monte
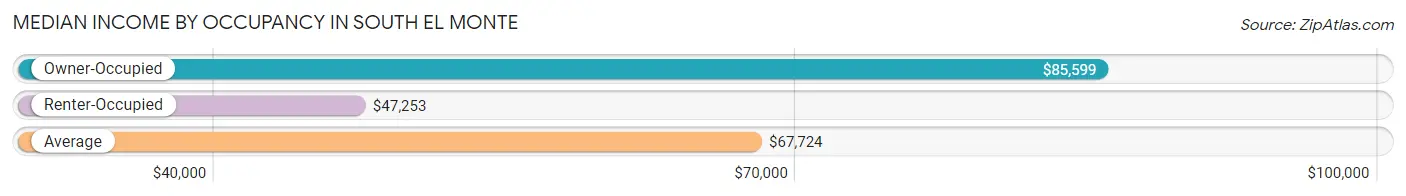
| Occupancy Type | # Households | Median Income |
| Owner-Occupied | 2,473 (49.1%) | $85,599 |
| Renter-Occupied | 2,560 (50.9%) | $47,253 |
| Average | 5,033 (100.0%) | $67,724 |
Occupancy by Householder Income Bracket in South El Monte
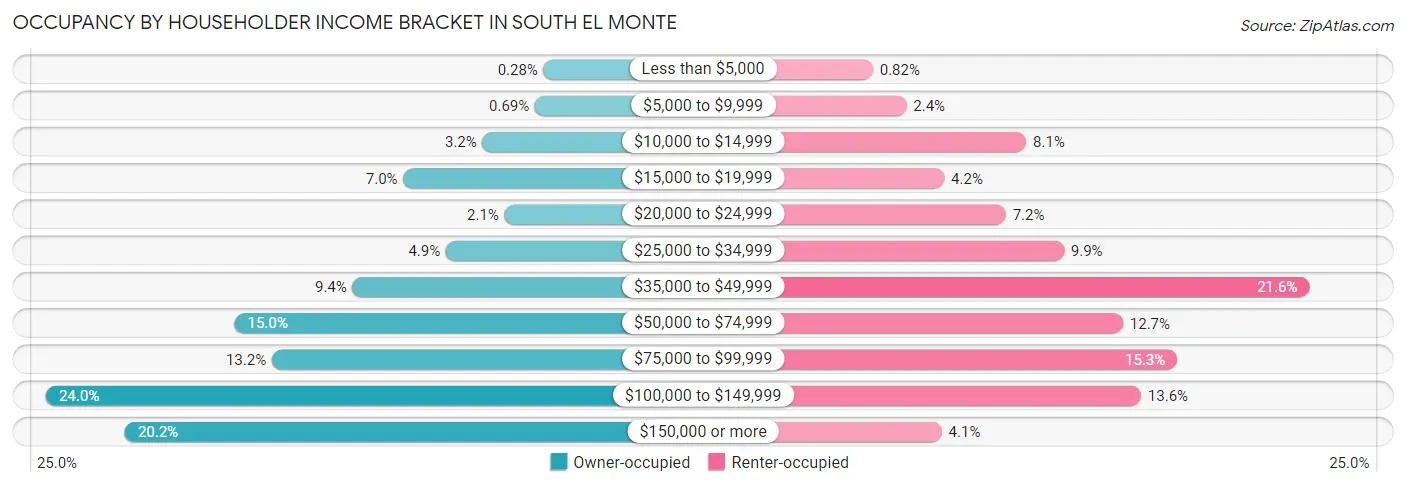
| Income Bracket | Owner-occupied | Renter-occupied |
| Less than $5,000 | 7 (0.3%) | 21 (0.8%) |
| $5,000 to $9,999 | 17 (0.7%) | 62 (2.4%) |
| $10,000 to $14,999 | 79 (3.2%) | 208 (8.1%) |
| $15,000 to $19,999 | 172 (7.0%) | 108 (4.2%) |
| $20,000 to $24,999 | 53 (2.1%) | 183 (7.1%) |
| $25,000 to $34,999 | 122 (4.9%) | 254 (9.9%) |
| $35,000 to $49,999 | 232 (9.4%) | 553 (21.6%) |
| $50,000 to $74,999 | 371 (15.0%) | 326 (12.7%) |
| $75,000 to $99,999 | 327 (13.2%) | 392 (15.3%) |
| $100,000 to $149,999 | 593 (24.0%) | 348 (13.6%) |
| $150,000 or more | 500 (20.2%) | 105 (4.1%) |
| Total | 2,473 (100.0%) | 2,560 (100.0%) |
Monthly Housing Cost Tiers in South El Monte
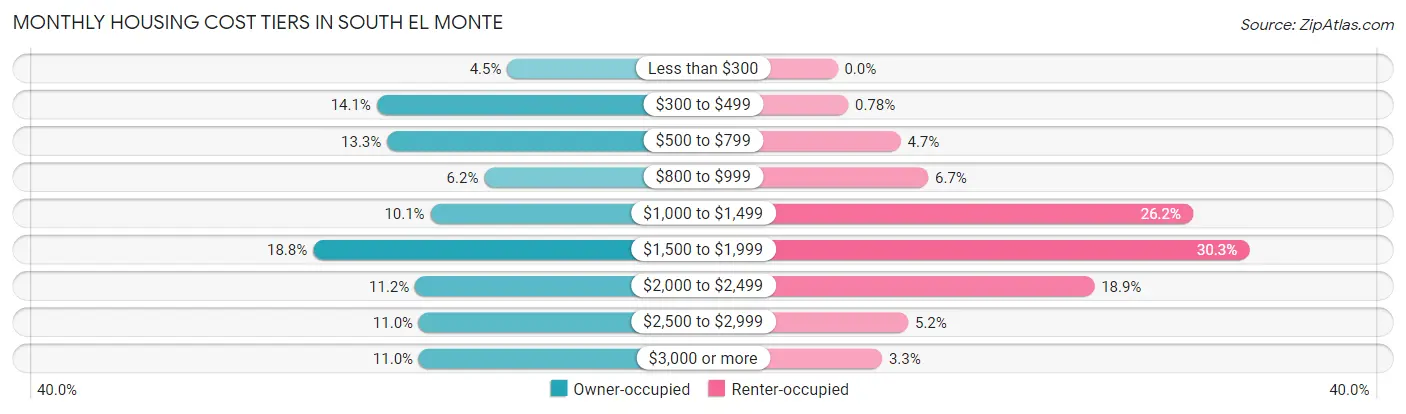
| Monthly Cost | Owner-occupied | Renter-occupied |
| Less than $300 | 110 (4.4%) | 0 (0.0%) |
| $300 to $499 | 348 (14.1%) | 20 (0.8%) |
| $500 to $799 | 329 (13.3%) | 119 (4.6%) |
| $800 to $999 | 152 (6.1%) | 171 (6.7%) |
| $1,000 to $1,499 | 250 (10.1%) | 670 (26.2%) |
| $1,500 to $1,999 | 464 (18.8%) | 776 (30.3%) |
| $2,000 to $2,499 | 278 (11.2%) | 484 (18.9%) |
| $2,500 to $2,999 | 271 (11.0%) | 133 (5.2%) |
| $3,000 or more | 271 (11.0%) | 84 (3.3%) |
| Total | 2,473 (100.0%) | 2,560 (100.0%) |
Physical Housing Characteristics in South El Monte
Housing Structures in South El Monte
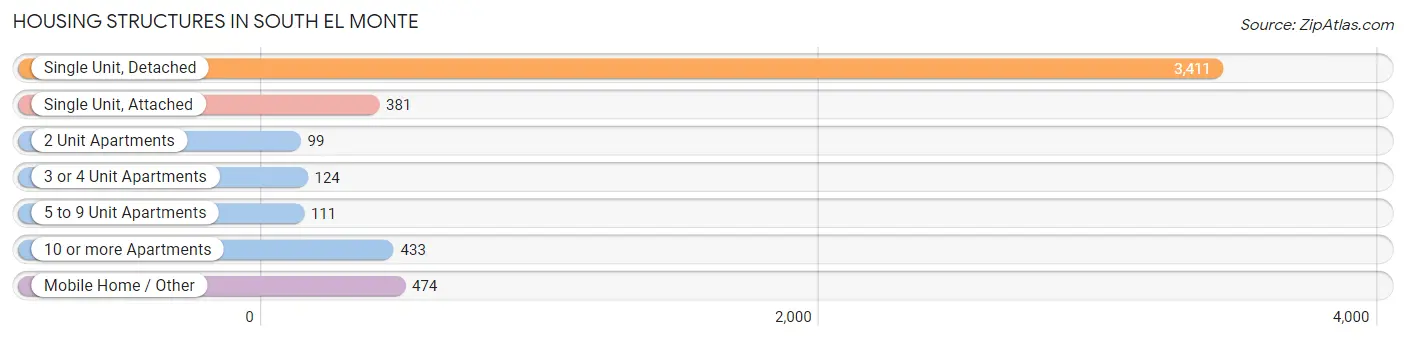
| Structure Type | # Housing Units | % Housing Units |
| Single Unit, Detached | 3,411 | 67.8% |
| Single Unit, Attached | 381 | 7.6% |
| 2 Unit Apartments | 99 | 2.0% |
| 3 or 4 Unit Apartments | 124 | 2.5% |
| 5 to 9 Unit Apartments | 111 | 2.2% |
| 10 or more Apartments | 433 | 8.6% |
| Mobile Home / Other | 474 | 9.4% |
| Total | 5,033 | 100.0% |
Housing Structures by Occupancy in South El Monte
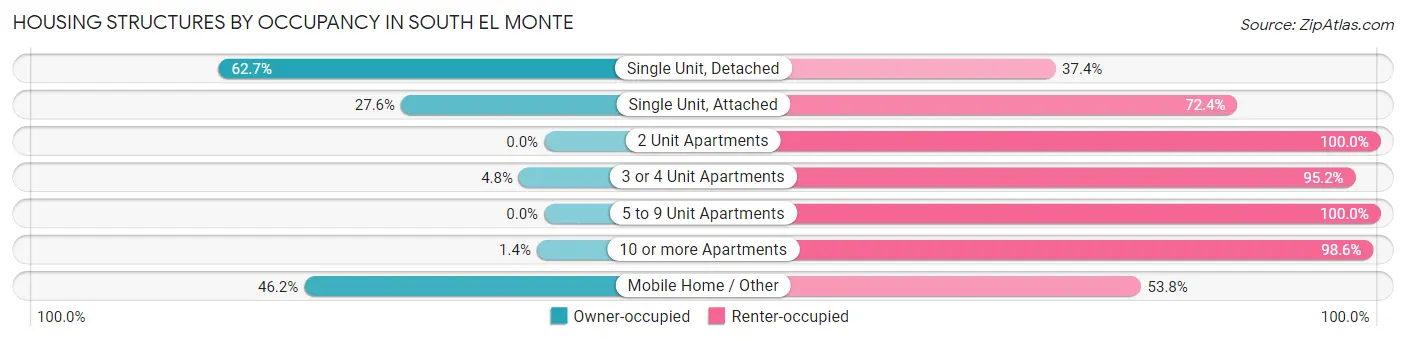
| Structure Type | Owner-occupied | Renter-occupied |
| Single Unit, Detached | 2,137 (62.6%) | 1,274 (37.3%) |
| Single Unit, Attached | 105 (27.6%) | 276 (72.4%) |
| 2 Unit Apartments | 0 (0.0%) | 99 (100.0%) |
| 3 or 4 Unit Apartments | 6 (4.8%) | 118 (95.2%) |
| 5 to 9 Unit Apartments | 0 (0.0%) | 111 (100.0%) |
| 10 or more Apartments | 6 (1.4%) | 427 (98.6%) |
| Mobile Home / Other | 219 (46.2%) | 255 (53.8%) |
| Total | 2,473 (49.1%) | 2,560 (50.9%) |
Housing Structures by Number of Rooms in South El Monte
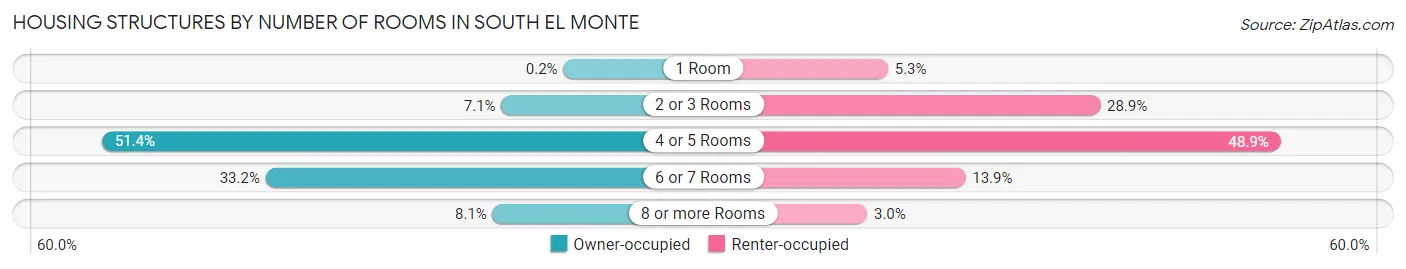
| Number of Rooms | Owner-occupied | Renter-occupied |
| 1 Room | 5 (0.2%) | 136 (5.3%) |
| 2 or 3 Rooms | 175 (7.1%) | 739 (28.9%) |
| 4 or 5 Rooms | 1,272 (51.4%) | 1,252 (48.9%) |
| 6 or 7 Rooms | 822 (33.2%) | 356 (13.9%) |
| 8 or more Rooms | 199 (8.1%) | 77 (3.0%) |
| Total | 2,473 (100.0%) | 2,560 (100.0%) |
Housing Structure by Heating Type in South El Monte
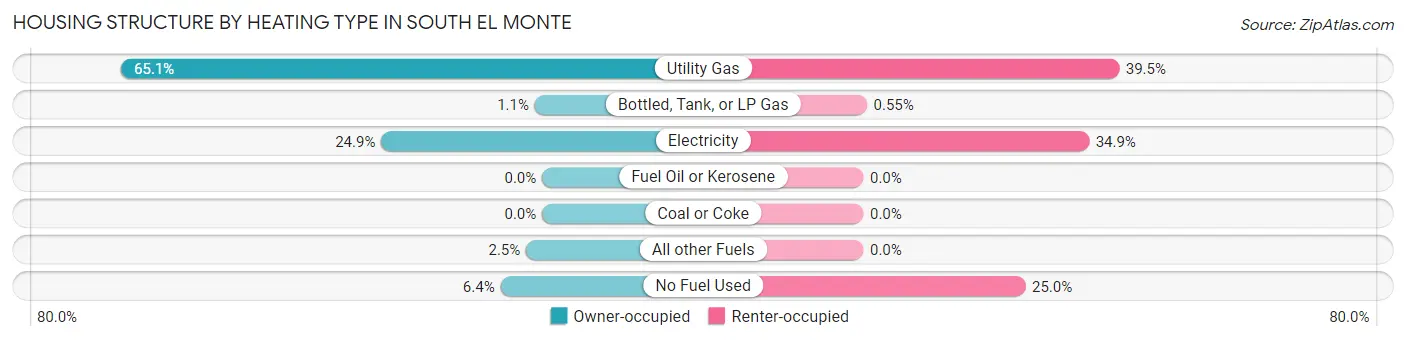
| Heating Type | Owner-occupied | Renter-occupied |
| Utility Gas | 1,610 (65.1%) | 1,012 (39.5%) |
| Bottled, Tank, or LP Gas | 28 (1.1%) | 14 (0.5%) |
| Electricity | 615 (24.9%) | 893 (34.9%) |
| Fuel Oil or Kerosene | 0 (0.0%) | 0 (0.0%) |
| Coal or Coke | 0 (0.0%) | 0 (0.0%) |
| All other Fuels | 61 (2.5%) | 0 (0.0%) |
| No Fuel Used | 159 (6.4%) | 641 (25.0%) |
| Total | 2,473 (100.0%) | 2,560 (100.0%) |
Household Vehicle Usage in South El Monte
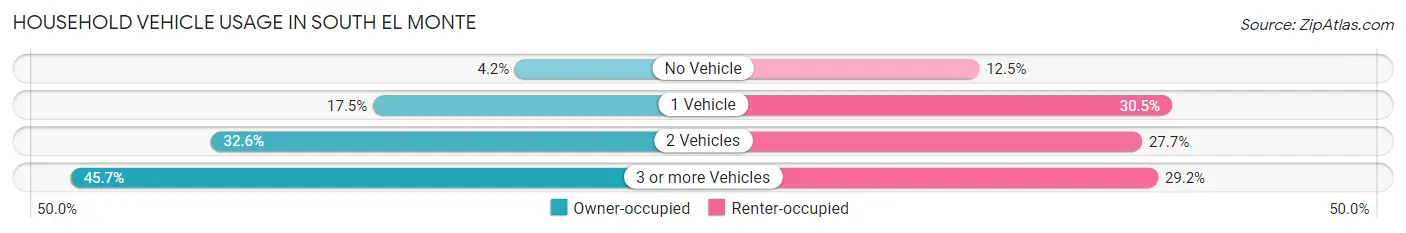
| Vehicles per Household | Owner-occupied | Renter-occupied |
| No Vehicle | 104 (4.2%) | 321 (12.5%) |
| 1 Vehicle | 432 (17.5%) | 781 (30.5%) |
| 2 Vehicles | 807 (32.6%) | 710 (27.7%) |
| 3 or more Vehicles | 1,130 (45.7%) | 748 (29.2%) |
| Total | 2,473 (100.0%) | 2,560 (100.0%) |
Real Estate & Mortgages in South El Monte
Real Estate and Mortgage Overview in South El Monte
| Characteristic | Without Mortgage | With Mortgage |
| Housing Units | 1,071 | 1,402 |
| Median Property Value | $544,400 | $586,800 |
| Median Household Income | $71,098 | $327 |
| Monthly Housing Costs | $561 | $271 |
| Real Estate Taxes | $2,854 | $10 |
Property Value by Mortgage Status in South El Monte
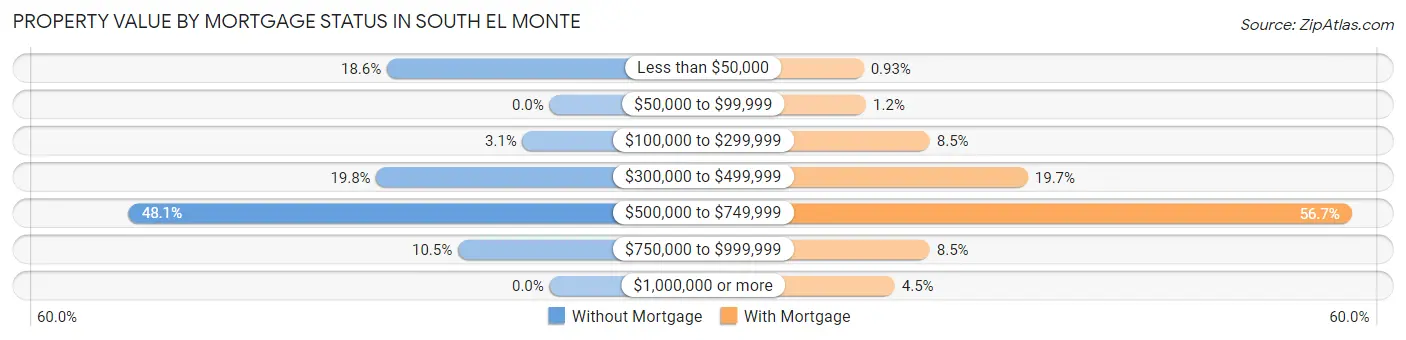
| Property Value | Without Mortgage | With Mortgage |
| Less than $50,000 | 199 (18.6%) | 13 (0.9%) |
| $50,000 to $99,999 | 0 (0.0%) | 17 (1.2%) |
| $100,000 to $299,999 | 33 (3.1%) | 119 (8.5%) |
| $300,000 to $499,999 | 212 (19.8%) | 276 (19.7%) |
| $500,000 to $749,999 | 515 (48.1%) | 795 (56.7%) |
| $750,000 to $999,999 | 112 (10.5%) | 119 (8.5%) |
| $1,000,000 or more | 0 (0.0%) | 63 (4.5%) |
| Total | 1,071 (100.0%) | 1,402 (100.0%) |
Household Income by Mortgage Status in South El Monte
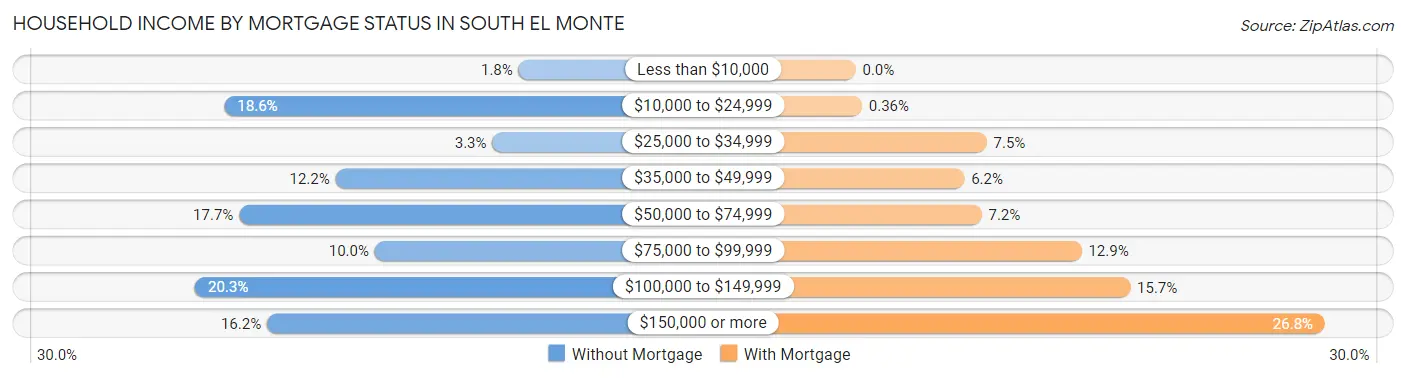
| Household Income | Without Mortgage | With Mortgage |
| Less than $10,000 | 19 (1.8%) | 0 (0.0%) |
| $10,000 to $24,999 | 199 (18.6%) | 5 (0.4%) |
| $25,000 to $34,999 | 35 (3.3%) | 105 (7.5%) |
| $35,000 to $49,999 | 131 (12.2%) | 87 (6.2%) |
| $50,000 to $74,999 | 190 (17.7%) | 101 (7.2%) |
| $75,000 to $99,999 | 107 (10.0%) | 181 (12.9%) |
| $100,000 to $149,999 | 217 (20.3%) | 220 (15.7%) |
| $150,000 or more | 173 (16.2%) | 376 (26.8%) |
| Total | 1,071 (100.0%) | 1,402 (100.0%) |
Property Value to Household Income Ratio in South El Monte
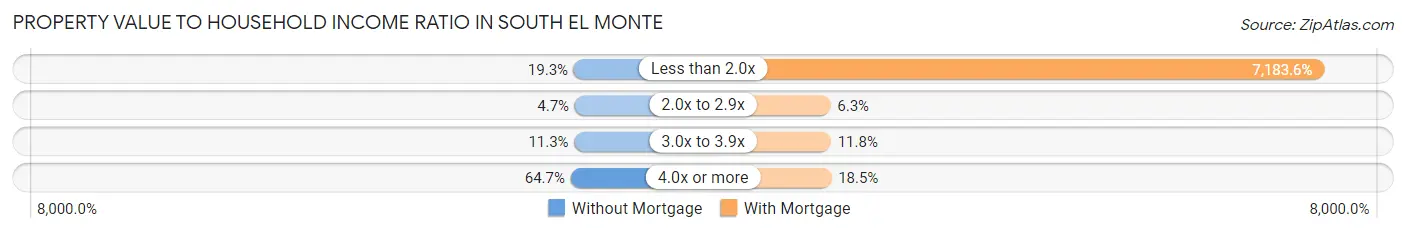
| Value-to-Income Ratio | Without Mortgage | With Mortgage |
| Less than 2.0x | 207 (19.3%) | 100,714 (7,183.6%) |
| 2.0x to 2.9x | 50 (4.7%) | 88 (6.3%) |
| 3.0x to 3.9x | 121 (11.3%) | 166 (11.8%) |
| 4.0x or more | 693 (64.7%) | 259 (18.5%) |
| Total | 1,071 (100.0%) | 1,402 (100.0%) |
Real Estate Taxes by Mortgage Status in South El Monte
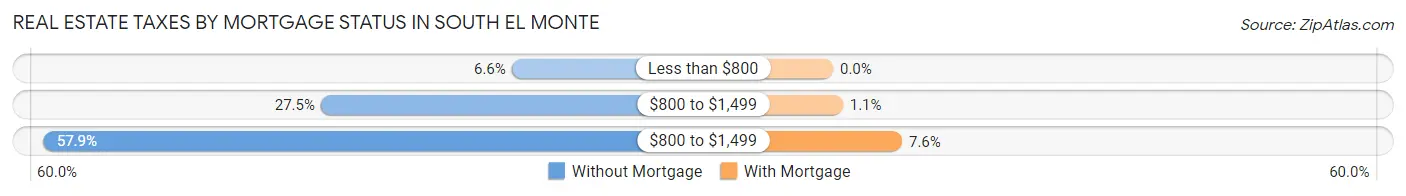
| Property Taxes | Without Mortgage | With Mortgage |
| Less than $800 | 71 (6.6%) | 0 (0.0%) |
| $800 to $1,499 | 295 (27.5%) | 15 (1.1%) |
| $800 to $1,499 | 620 (57.9%) | 106 (7.6%) |
| Total | 1,071 (100.0%) | 1,402 (100.0%) |
Health & Disability in South El Monte
Health Insurance Coverage by Age in South El Monte
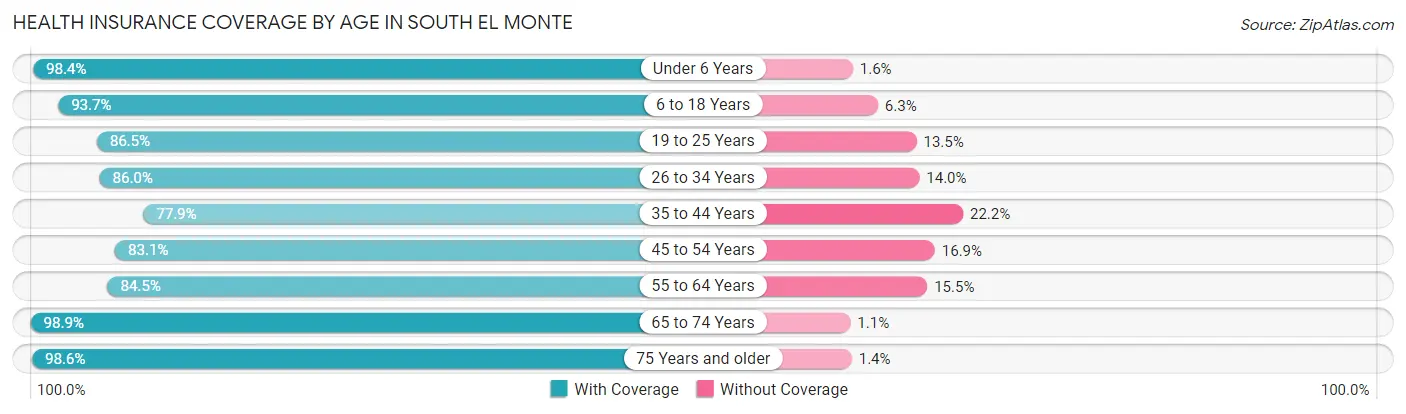
| Age Bracket | With Coverage | Without Coverage |
| Under 6 Years | 1,298 (98.4%) | 21 (1.6%) |
| 6 to 18 Years | 3,170 (93.7%) | 212 (6.3%) |
| 19 to 25 Years | 1,657 (86.5%) | 258 (13.5%) |
| 26 to 34 Years | 2,187 (86.0%) | 356 (14.0%) |
| 35 to 44 Years | 1,930 (77.8%) | 549 (22.2%) |
| 45 to 54 Years | 2,219 (83.1%) | 451 (16.9%) |
| 55 to 64 Years | 2,251 (84.5%) | 412 (15.5%) |
| 65 to 74 Years | 1,473 (98.9%) | 17 (1.1%) |
| 75 Years and older | 1,199 (98.6%) | 17 (1.4%) |
| Total | 17,384 (88.3%) | 2,293 (11.7%) |
Health Insurance Coverage by Citizenship Status in South El Monte
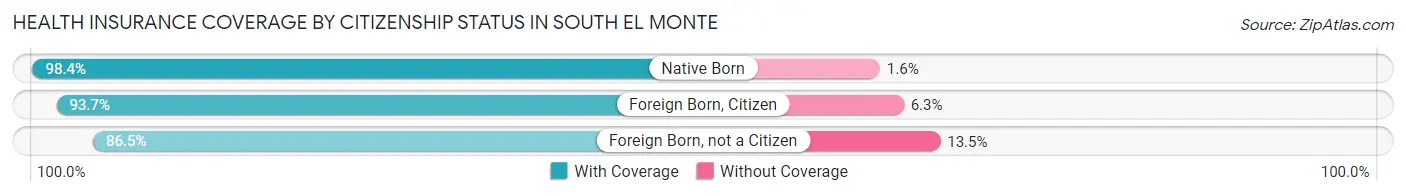
| Citizenship Status | With Coverage | Without Coverage |
| Native Born | 1,298 (98.4%) | 21 (1.6%) |
| Foreign Born, Citizen | 3,170 (93.7%) | 212 (6.3%) |
| Foreign Born, not a Citizen | 1,657 (86.5%) | 258 (13.5%) |
Health Insurance Coverage by Household Income in South El Monte
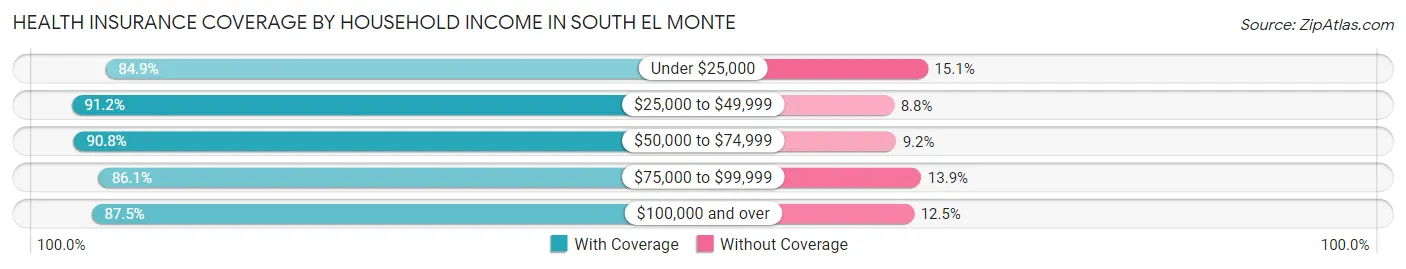
| Household Income | With Coverage | Without Coverage |
| Under $25,000 | 1,751 (84.9%) | 312 (15.1%) |
| $25,000 to $49,999 | 4,138 (91.2%) | 399 (8.8%) |
| $50,000 to $74,999 | 2,509 (90.8%) | 253 (9.2%) |
| $75,000 to $99,999 | 2,487 (86.1%) | 401 (13.9%) |
| $100,000 and over | 6,477 (87.5%) | 928 (12.5%) |
Public vs Private Health Insurance Coverage by Age in South El Monte
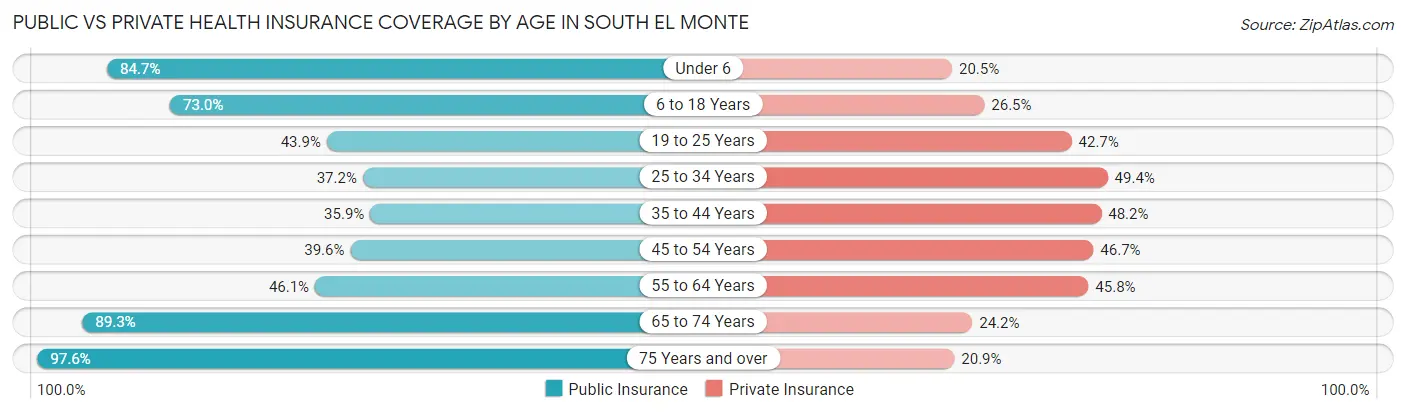
| Age Bracket | Public Insurance | Private Insurance |
| Under 6 | 1,117 (84.7%) | 270 (20.5%) |
| 6 to 18 Years | 2,469 (73.0%) | 895 (26.5%) |
| 19 to 25 Years | 841 (43.9%) | 817 (42.7%) |
| 25 to 34 Years | 947 (37.2%) | 1,255 (49.3%) |
| 35 to 44 Years | 889 (35.9%) | 1,194 (48.2%) |
| 45 to 54 Years | 1,056 (39.6%) | 1,247 (46.7%) |
| 55 to 64 Years | 1,228 (46.1%) | 1,219 (45.8%) |
| 65 to 74 Years | 1,330 (89.3%) | 361 (24.2%) |
| 75 Years and over | 1,187 (97.6%) | 254 (20.9%) |
| Total | 11,064 (56.2%) | 7,512 (38.2%) |
Disability Status by Sex by Age in South El Monte
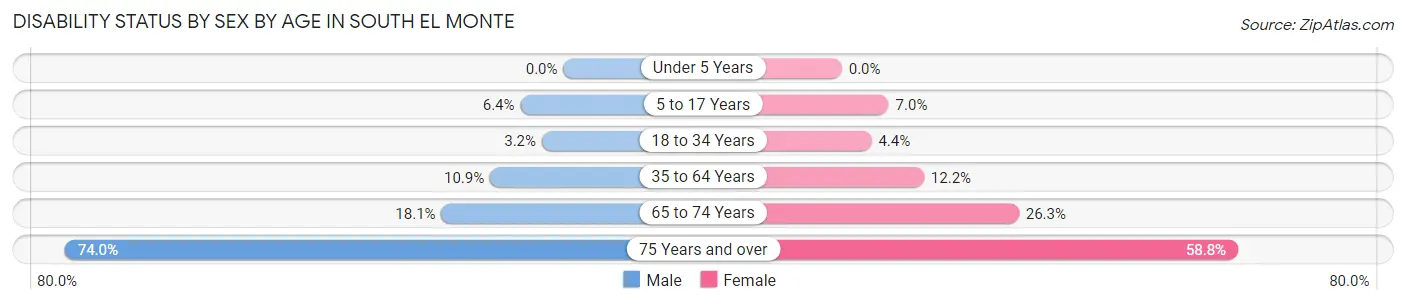
| Age Bracket | Male | Female |
| Under 5 Years | 0 (0.0%) | 0 (0.0%) |
| 5 to 17 Years | 122 (6.4%) | 99 (7.0%) |
| 18 to 34 Years | 73 (3.2%) | 104 (4.4%) |
| 35 to 64 Years | 443 (10.9%) | 456 (12.2%) |
| 65 to 74 Years | 132 (18.1%) | 200 (26.3%) |
| 75 Years and over | 325 (74.0%) | 457 (58.8%) |
Disability Class by Sex by Age in South El Monte
Disability Class: Hearing Difficulty
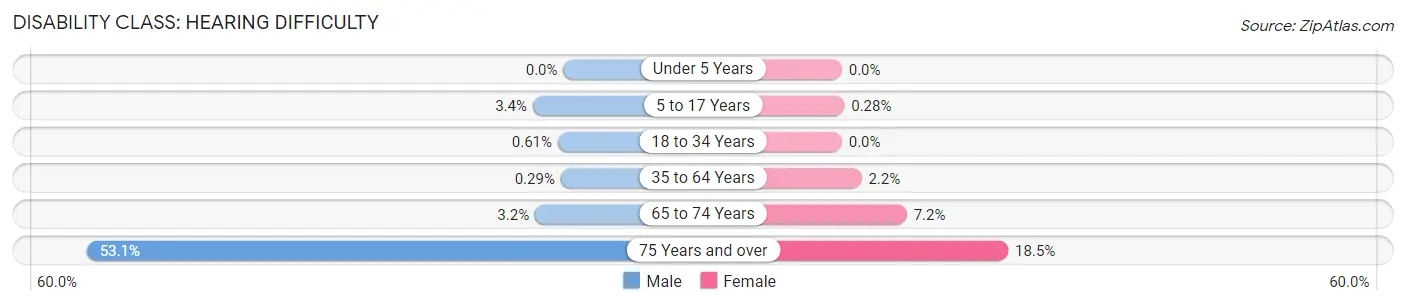
| Age Bracket | Male | Female |
| Under 5 Years | 0 (0.0%) | 0 (0.0%) |
| 5 to 17 Years | 65 (3.4%) | 4 (0.3%) |
| 18 to 34 Years | 14 (0.6%) | 0 (0.0%) |
| 35 to 64 Years | 12 (0.3%) | 82 (2.2%) |
| 65 to 74 Years | 23 (3.2%) | 55 (7.2%) |
| 75 Years and over | 233 (53.1%) | 144 (18.5%) |
Disability Class: Vision Difficulty
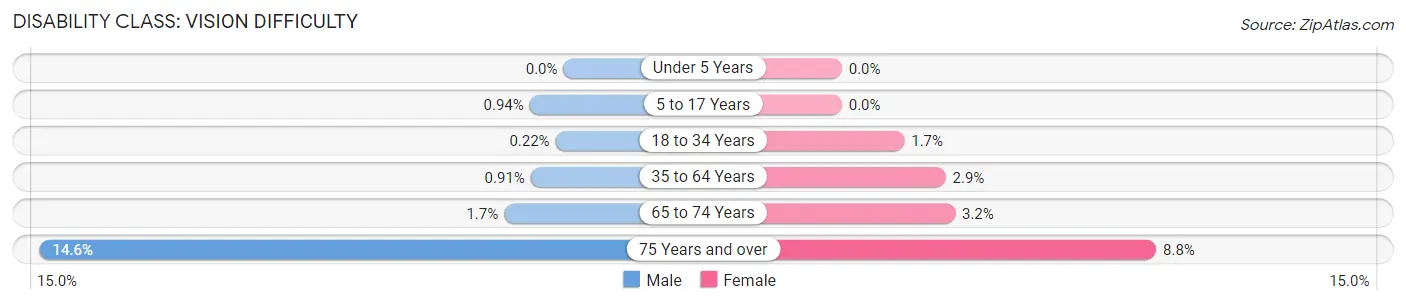
| Age Bracket | Male | Female |
| Under 5 Years | 0 (0.0%) | 0 (0.0%) |
| 5 to 17 Years | 18 (0.9%) | 0 (0.0%) |
| 18 to 34 Years | 5 (0.2%) | 41 (1.7%) |
| 35 to 64 Years | 37 (0.9%) | 108 (2.9%) |
| 65 to 74 Years | 12 (1.7%) | 24 (3.2%) |
| 75 Years and over | 64 (14.6%) | 68 (8.7%) |
Disability Class: Cognitive Difficulty
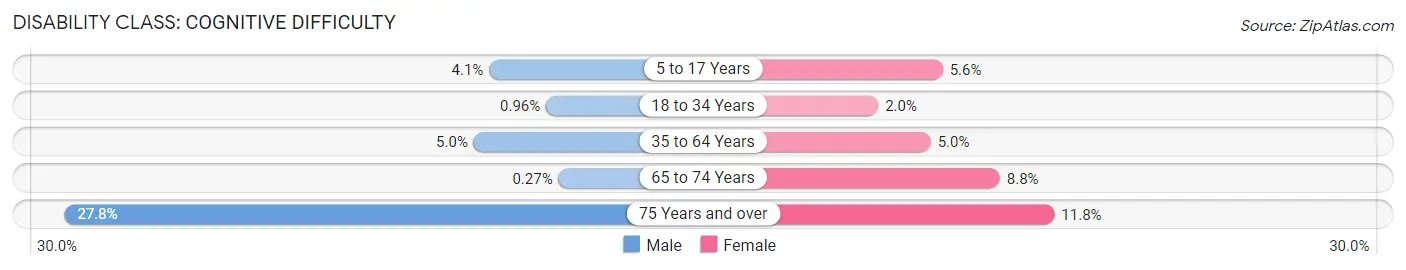
| Age Bracket | Male | Female |
| 5 to 17 Years | 79 (4.1%) | 80 (5.6%) |
| 18 to 34 Years | 22 (1.0%) | 48 (2.0%) |
| 35 to 64 Years | 203 (5.0%) | 185 (5.0%) |
| 65 to 74 Years | 2 (0.3%) | 67 (8.8%) |
| 75 Years and over | 122 (27.8%) | 92 (11.8%) |
Disability Class: Ambulatory Difficulty
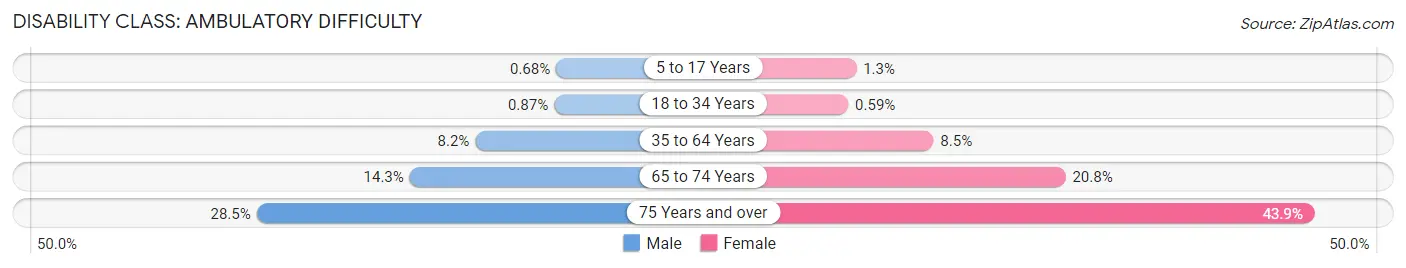
| Age Bracket | Male | Female |
| 5 to 17 Years | 13 (0.7%) | 19 (1.3%) |
| 18 to 34 Years | 20 (0.9%) | 14 (0.6%) |
| 35 to 64 Years | 333 (8.2%) | 318 (8.5%) |
| 65 to 74 Years | 104 (14.3%) | 158 (20.8%) |
| 75 Years and over | 125 (28.5%) | 341 (43.9%) |
Disability Class: Self-Care Difficulty
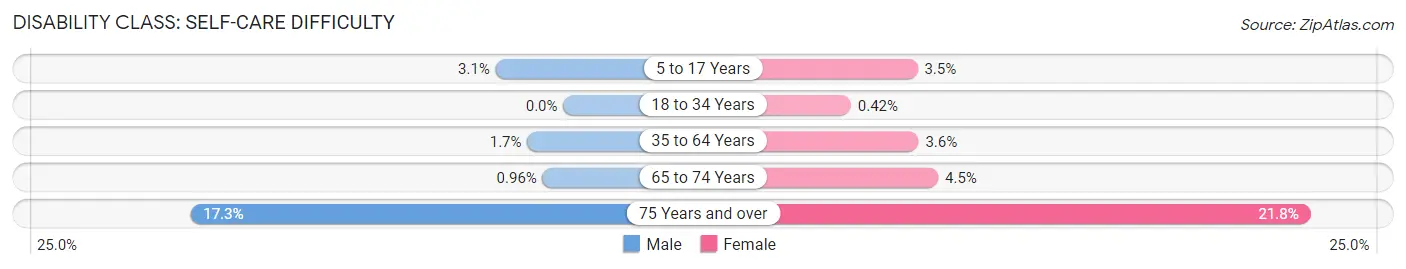
| Age Bracket | Male | Female |
| 5 to 17 Years | 60 (3.1%) | 50 (3.5%) |
| 18 to 34 Years | 0 (0.0%) | 10 (0.4%) |
| 35 to 64 Years | 68 (1.7%) | 133 (3.6%) |
| 65 to 74 Years | 7 (1.0%) | 34 (4.5%) |
| 75 Years and over | 76 (17.3%) | 169 (21.7%) |
Technology Access in South El Monte
Computing Device Access in South El Monte
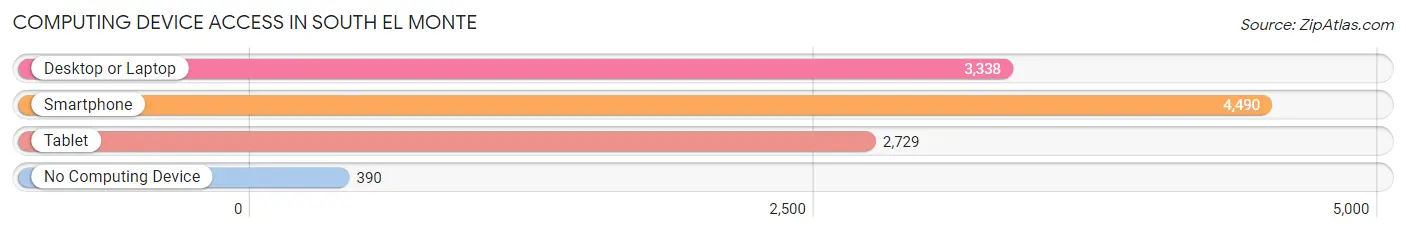
| Device Type | # Households | % Households |
| Desktop or Laptop | 3,338 | 66.3% |
| Smartphone | 4,490 | 89.2% |
| Tablet | 2,729 | 54.2% |
| No Computing Device | 390 | 7.7% |
| Total | 5,033 | 100.0% |
Internet Access in South El Monte
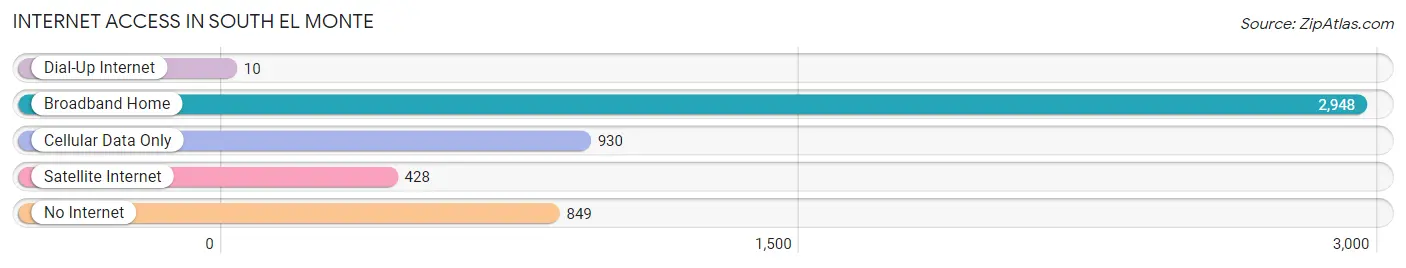
| Internet Type | # Households | % Households |
| Dial-Up Internet | 10 | 0.2% |
| Broadband Home | 2,948 | 58.6% |
| Cellular Data Only | 930 | 18.5% |
| Satellite Internet | 428 | 8.5% |
| No Internet | 849 | 16.9% |
| Total | 5,033 | 100.0% |
South El Monte Summary
History
South El Monte is a city located in the San Gabriel Valley of Los Angeles County, California. It is bordered by El Monte to the north, Rosemead to the east, Pico Rivera to the south, and the San Gabriel River to the west. The city was incorporated in 1958 and has a population of approximately 20,000 people.
The area that is now South El Monte has a long and rich history. The first inhabitants of the area were the Tongva people, who lived in the area for thousands of years before the arrival of Europeans. The first Europeans to settle in the area were Spanish missionaries, who established the Mission San Gabriel Arcangel in 1771. The mission was the first in the area and served as a base for the Spanish colonization of California.
In the mid-1800s, the area was divided into large ranchos, which were granted to prominent Californios. One of these ranchos was Rancho Potrero Grande, which was granted to Don Antonio Maria Lugo in 1845. Lugo's son, Antonio Maria Lugo, inherited the rancho and built a large adobe home on the property. This home, known as the Lugo Adobe, still stands today and is listed on the National Register of Historic Places.
In the late 1800s, the area began to be developed as a residential community. The first subdivision was established in 1887 and was named South El Monte. The area quickly grew in popularity and by the early 1900s, it was a thriving community.
Geography
South El Monte is located in the San Gabriel Valley of Los Angeles County, California. It is bordered by El Monte to the north, Rosemead to the east, Pico Rivera to the south, and the San Gabriel River to the west. The city covers an area of 3.7 square miles and has a population of approximately 20,000 people.
The city is located at the base of the San Gabriel Mountains and is surrounded by several parks and recreational areas. The Rio Hondo River runs through the city and is a popular spot for fishing and other outdoor activities. The city is also home to several golf courses, including the South El Monte Golf Course.
Economy
South El Monte is a primarily residential city, but it does have a few businesses and industries. The city is home to several manufacturing companies, including a plastics factory and a metal fabrication plant. The city is also home to several retail stores, restaurants, and other businesses.
The city is served by the El Monte Union High School District, which operates several public schools in the area. The city is also home to several private schools, including the South El Monte Christian School.
Demographics
As of the 2010 census, South El Monte had a population of 20,116 people. The racial makeup of the city was 57.2% White, 1.3% African American, 0.7% Native American, 11.2% Asian, 0.2% Pacific Islander, and 28.2% from other races. Hispanic or Latino of any race were 64.2% of the population.
The median household income in South El Monte was $45,845, and the median family income was $50,945. The per capita income was $19,945. About 17.2% of families and 20.3% of the population were below the poverty line, including 28.2% of those under age 18 and 11.2% of those age 65 or over.
Common Questions
What is Per Capita Income in South El Monte?
Per Capita income in South El Monte is $22,248.
What is the Median Family Income in South El Monte?
Median Family Income in South El Monte is $64,727.
What is the Median Household income in South El Monte?
Median Household Income in South El Monte is $67,724.
What is Income or Wage Gap in South El Monte?
Income or Wage Gap in South El Monte is 19.6%.
Women in South El Monte earn 80.4 cents for every dollar earned by a man.
What is Family Income Deficit in South El Monte?
Family Income Deficit in South El Monte is $9,274.
Families that are below poverty line in South El Monte earn $9,274 less on average than the poverty threshold level.
What is Inequality or Gini Index in South El Monte?
Inequality or Gini Index in South El Monte is 0.41.
What is the Total Population of South El Monte?
Total Population of South El Monte is 19,694.
What is the Total Male Population of South El Monte?
Total Male Population of South El Monte is 9,986.
What is the Total Female Population of South El Monte?
Total Female Population of South El Monte is 9,708.
What is the Ratio of Males per 100 Females in South El Monte?
There are 102.86 Males per 100 Females in South El Monte.
What is the Ratio of Females per 100 Males in South El Monte?
There are 97.22 Females per 100 Males in South El Monte.
What is the Median Population Age in South El Monte?
Median Population Age in South El Monte is 37.4 Years.
What is the Average Family Size in South El Monte
Average Family Size in South El Monte is 4.1 People.
What is the Average Household Size in South El Monte
Average Household Size in South El Monte is 3.9 People.
How Large is the Labor Force in South El Monte?
There are 9,383 People in the Labor Forcein in South El Monte.
What is the Percentage of People in the Labor Force in South El Monte?
59.3% of People are in the Labor Force in South El Monte.
What is the Unemployment Rate in South El Monte?
Unemployment Rate in South El Monte is 6.7%.