Foothill Farms, CA Map & Demographics
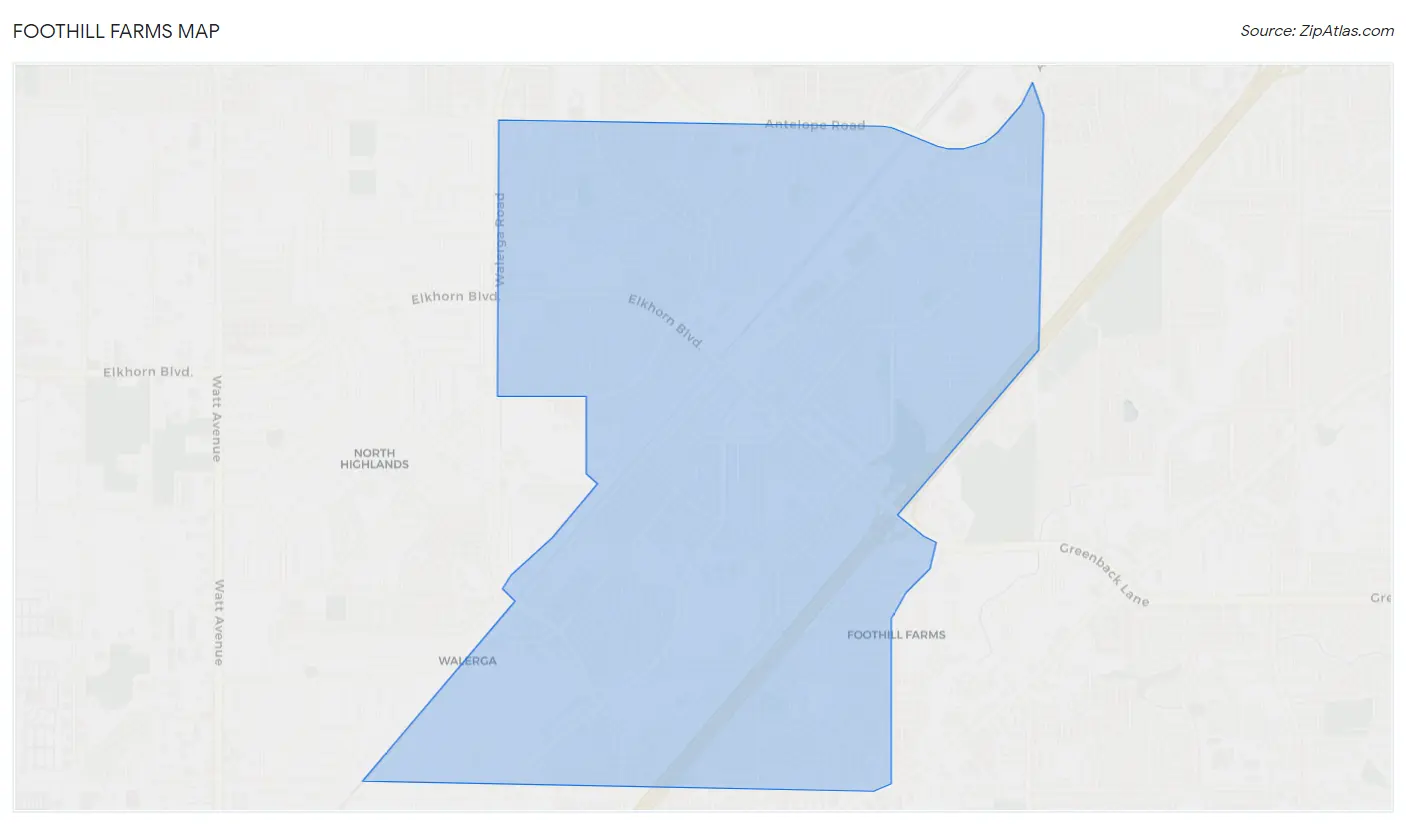
Foothill Farms Map
Foothill Farms Overview
$26,576
PER CAPITA INCOME
$72,027
AVG FAMILY INCOME
$65,793
AVG HOUSEHOLD INCOME
15.3%
WAGE / INCOME GAP [ % ]
84.7¢/ $1
WAGE / INCOME GAP [ $ ]
$12,622
FAMILY INCOME DEFICIT
0.39
INEQUALITY / GINI INDEX
37,635
TOTAL POPULATION
18,884
MALE POPULATION
18,751
FEMALE POPULATION
100.71
MALES / 100 FEMALES
99.30
FEMALES / 100 MALES
32.8
MEDIAN AGE
3.4
AVG FAMILY SIZE
3.0
AVG HOUSEHOLD SIZE
17,472
LABOR FORCE [ PEOPLE ]
63.0%
PERCENT IN LABOR FORCE
7.7%
UNEMPLOYMENT RATE
Income in Foothill Farms
Income Overview in Foothill Farms
Per Capita Income in Foothill Farms is $26,576, while median incomes of families and households are $72,027 and $65,793 respectively.
| Characteristic | Number | Measure |
| Per Capita Income | 37,635 | $26,576 |
| Median Family Income | 8,897 | $72,027 |
| Mean Family Income | 8,897 | $79,165 |
| Median Household Income | 12,653 | $65,793 |
| Mean Household Income | 12,653 | $76,316 |
| Income Deficit | 8,897 | $12,622 |
| Wage / Income Gap (%) | 37,635 | 15.27% |
| Wage / Income Gap ($) | 37,635 | 84.73¢ per $1 |
| Gini / Inequality Index | 37,635 | 0.39 |
Earnings by Sex in Foothill Farms
Average Earnings in Foothill Farms are $37,670, $41,093 for men and $34,818 for women, a difference of 15.3%.
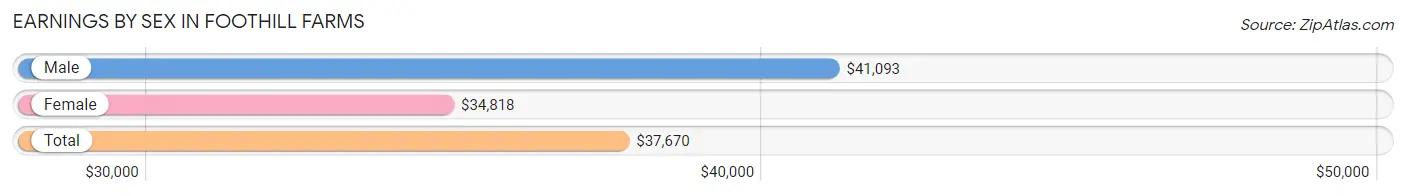
| Sex | Number | Average Earnings |
| Male | 9,762 (54.4%) | $41,093 |
| Female | 8,185 (45.6%) | $34,818 |
| Total | 17,947 (100.0%) | $37,670 |
Earnings by Sex by Income Bracket in Foothill Farms
The most common earnings brackets in Foothill Farms are $75,000 to $99,999 for men (1,023 | 10.5%) and $25,000 to $29,999 for women (801 | 9.8%).
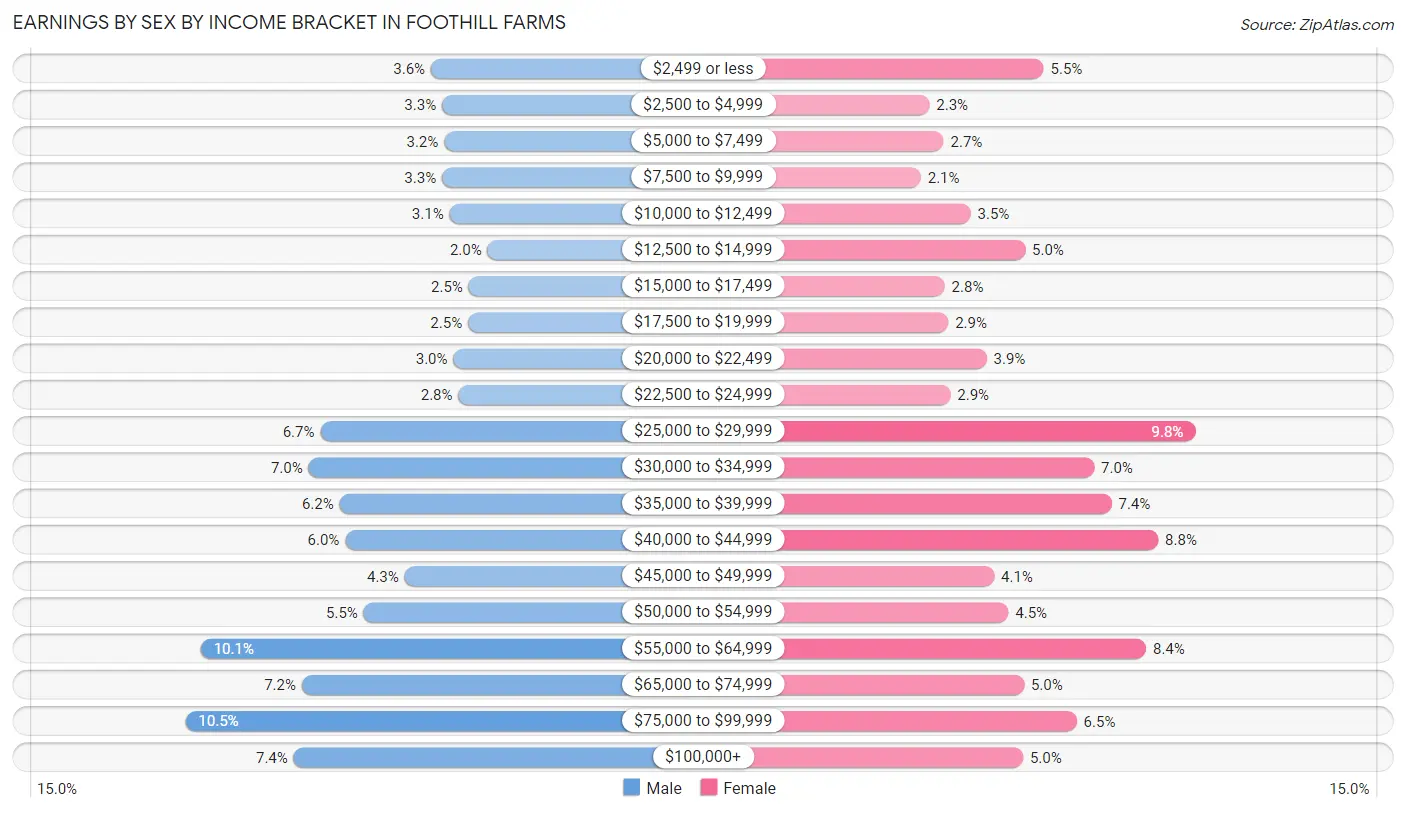
| Income | Male | Female |
| $2,499 or less | 349 (3.6%) | 453 (5.5%) |
| $2,500 to $4,999 | 319 (3.3%) | 190 (2.3%) |
| $5,000 to $7,499 | 313 (3.2%) | 223 (2.7%) |
| $7,500 to $9,999 | 319 (3.3%) | 170 (2.1%) |
| $10,000 to $12,499 | 299 (3.1%) | 285 (3.5%) |
| $12,500 to $14,999 | 194 (2.0%) | 410 (5.0%) |
| $15,000 to $17,499 | 246 (2.5%) | 225 (2.8%) |
| $17,500 to $19,999 | 248 (2.5%) | 233 (2.9%) |
| $20,000 to $22,499 | 288 (2.9%) | 322 (3.9%) |
| $22,500 to $24,999 | 274 (2.8%) | 238 (2.9%) |
| $25,000 to $29,999 | 653 (6.7%) | 801 (9.8%) |
| $30,000 to $34,999 | 685 (7.0%) | 569 (7.0%) |
| $35,000 to $39,999 | 600 (6.1%) | 609 (7.4%) |
| $40,000 to $44,999 | 585 (6.0%) | 716 (8.7%) |
| $45,000 to $49,999 | 422 (4.3%) | 339 (4.1%) |
| $50,000 to $54,999 | 534 (5.5%) | 372 (4.5%) |
| $55,000 to $64,999 | 981 (10.1%) | 688 (8.4%) |
| $65,000 to $74,999 | 704 (7.2%) | 408 (5.0%) |
| $75,000 to $99,999 | 1,023 (10.5%) | 529 (6.5%) |
| $100,000+ | 726 (7.4%) | 405 (5.0%) |
| Total | 9,762 (100.0%) | 8,185 (100.0%) |
Earnings by Sex by Educational Attainment in Foothill Farms
Average earnings in Foothill Farms are $45,120 for men and $38,492 for women, a difference of 14.7%. Men with an educational attainment of graduate degree enjoy the highest average annual earnings of $70,572, while those with less than high school education earn the least with $35,260. Women with an educational attainment of bachelor's degree earn the most with the average annual earnings of $54,792, while those with less than high school education have the smallest earnings of $22,821.
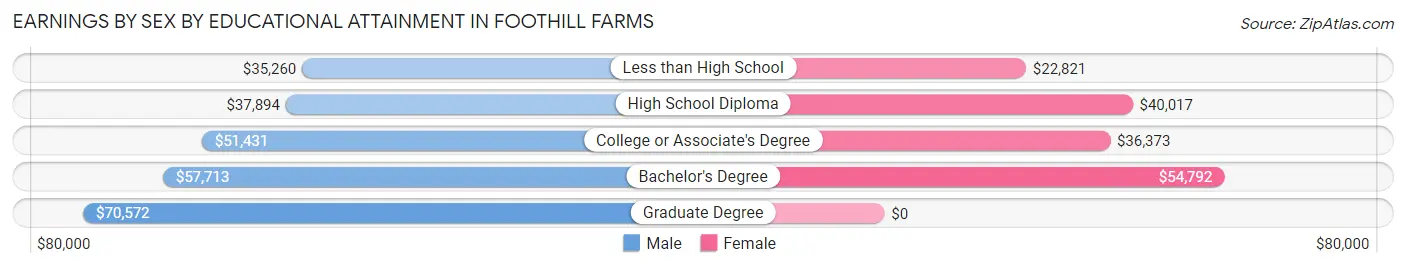
| Educational Attainment | Male Income | Female Income |
| Less than High School | $35,260 | $22,821 |
| High School Diploma | $37,894 | $40,017 |
| College or Associate's Degree | $51,431 | $36,373 |
| Bachelor's Degree | $57,713 | $54,792 |
| Graduate Degree | $70,572 | $0 |
| Total | $45,120 | $38,492 |
Family Income in Foothill Farms
Family Income Brackets in Foothill Farms
According to the Foothill Farms family income data, there are 1,735 families falling into the $100,000 to $149,999 income range, which is the most common income bracket and makes up 19.5% of all families. Conversely, the $200,000+ income bracket is the least frequent group with only 214 families (2.4%) belonging to this category.
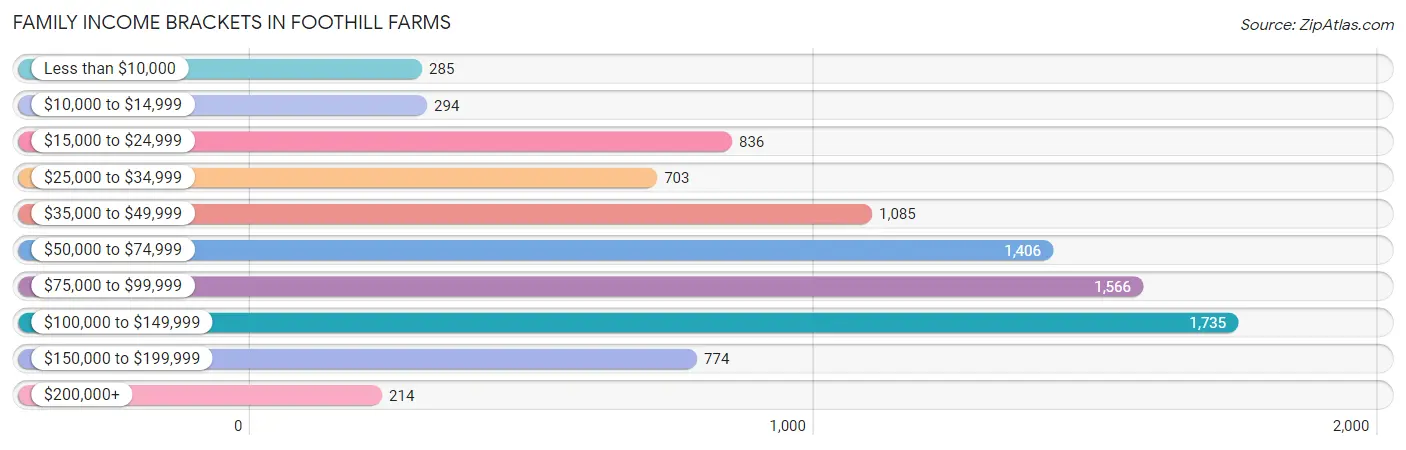
| Income Bracket | # Families | % Families |
| Less than $10,000 | 285 | 3.2% |
| $10,000 to $14,999 | 294 | 3.3% |
| $15,000 to $24,999 | 836 | 9.4% |
| $25,000 to $34,999 | 703 | 7.9% |
| $35,000 to $49,999 | 1,085 | 12.2% |
| $50,000 to $74,999 | 1,406 | 15.8% |
| $75,000 to $99,999 | 1,566 | 17.6% |
| $100,000 to $149,999 | 1,735 | 19.5% |
| $150,000 to $199,999 | 774 | 8.7% |
| $200,000+ | 214 | 2.4% |
Family Income by Famaliy Size in Foothill Farms
7+ person families (300 | 3.4%) account for the highest median family income in Foothill Farms with $130,882 per family, while 2-person families (3,498 | 39.3%) have the highest median income of $36,314 per family member.
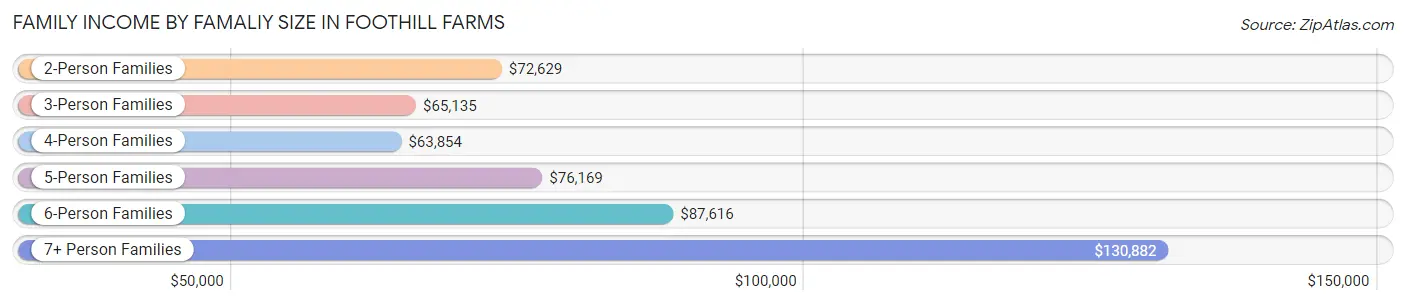
| Income Bracket | # Families | Median Income |
| 2-Person Families | 3,498 (39.3%) | $72,629 |
| 3-Person Families | 2,115 (23.8%) | $65,135 |
| 4-Person Families | 1,743 (19.6%) | $63,854 |
| 5-Person Families | 818 (9.2%) | $76,169 |
| 6-Person Families | 423 (4.8%) | $87,616 |
| 7+ Person Families | 300 (3.4%) | $130,882 |
| Total | 8,897 (100.0%) | $72,027 |
Family Income by Number of Earners in Foothill Farms
The median family income in Foothill Farms is $72,027, with families comprising 3+ earners (1,048) having the highest median family income of $131,653, while families with no earners (1,116) have the lowest median family income of $26,992, accounting for 11.8% and 12.5% of families, respectively.
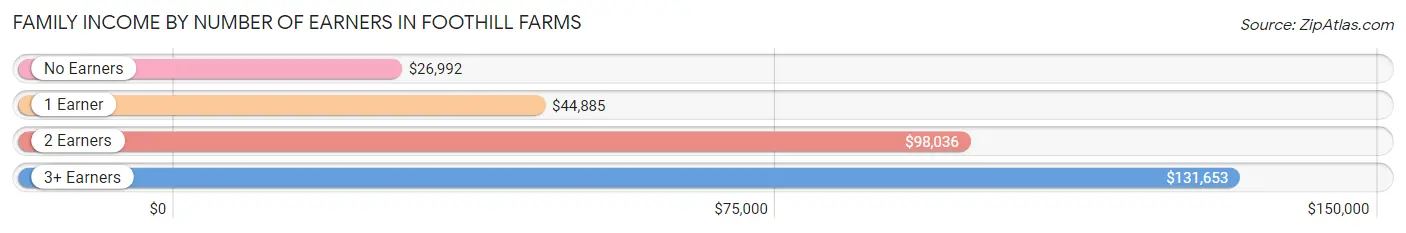
| Number of Earners | # Families | Median Income |
| No Earners | 1,116 (12.5%) | $26,992 |
| 1 Earner | 3,899 (43.8%) | $44,885 |
| 2 Earners | 2,834 (31.9%) | $98,036 |
| 3+ Earners | 1,048 (11.8%) | $131,653 |
| Total | 8,897 (100.0%) | $72,027 |
Household Income in Foothill Farms
Household Income Brackets in Foothill Farms
With 2,429 households falling in the category, the $50,000 to $74,999 income range is the most frequent in Foothill Farms, accounting for 19.2% of all households. In contrast, only 354 households (2.8%) fall into the $200,000+ income bracket, making it the least populous group.
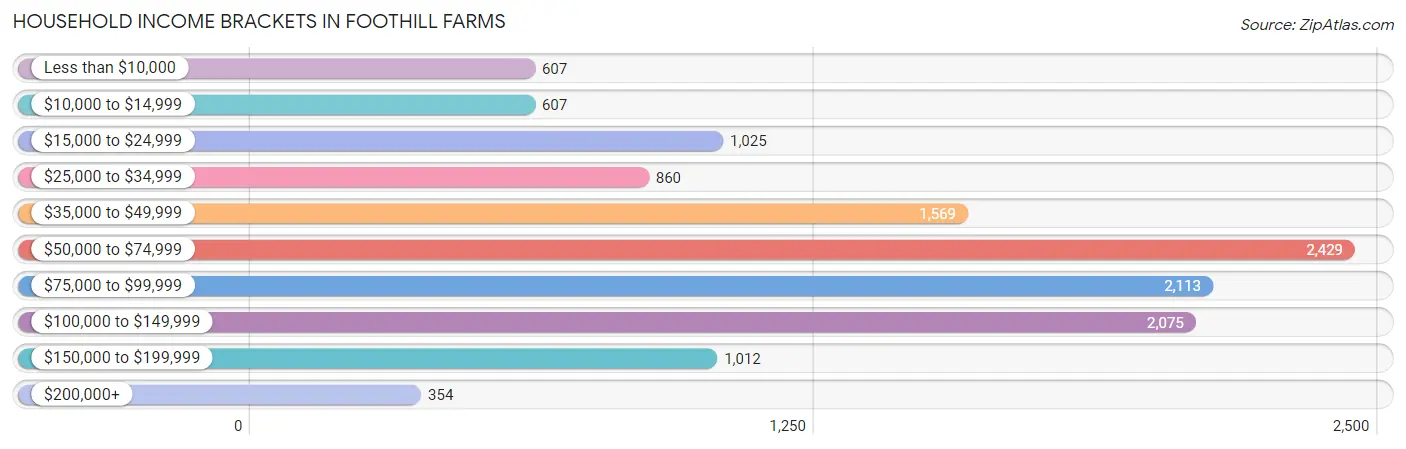
| Income Bracket | # Households | % Households |
| Less than $10,000 | 607 | 4.8% |
| $10,000 to $14,999 | 607 | 4.8% |
| $15,000 to $24,999 | 1,025 | 8.1% |
| $25,000 to $34,999 | 860 | 6.8% |
| $35,000 to $49,999 | 1,569 | 12.4% |
| $50,000 to $74,999 | 2,429 | 19.2% |
| $75,000 to $99,999 | 2,113 | 16.7% |
| $100,000 to $149,999 | 2,075 | 16.4% |
| $150,000 to $199,999 | 1,012 | 8.0% |
| $200,000+ | 354 | 2.8% |
Household Income by Householder Age in Foothill Farms
The median household income in Foothill Farms is $65,793, with the highest median household income of $78,229 found in the 45 to 64 years age bracket for the primary householder. A total of 4,554 households (36.0%) fall into this category. Meanwhile, the 65+ years age bracket for the primary householder has the lowest median household income of $54,321, with 2,423 households (19.2%) in this group.
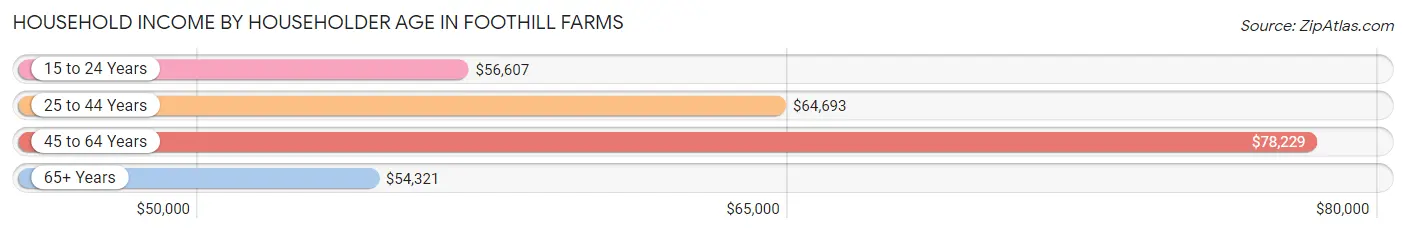
| Income Bracket | # Households | Median Income |
| 15 to 24 Years | 450 (3.6%) | $56,607 |
| 25 to 44 Years | 5,226 (41.3%) | $64,693 |
| 45 to 64 Years | 4,554 (36.0%) | $78,229 |
| 65+ Years | 2,423 (19.2%) | $54,321 |
| Total | 12,653 (100.0%) | $65,793 |
Poverty in Foothill Farms
Income Below Poverty by Sex and Age in Foothill Farms
With 14.2% poverty level for males and 19.9% for females among the residents of Foothill Farms, 15 year old males and 5 year old females are the most vulnerable to poverty, with 77 males (32.6%) and 130 females (42.3%) in their respective age groups living below the poverty level.
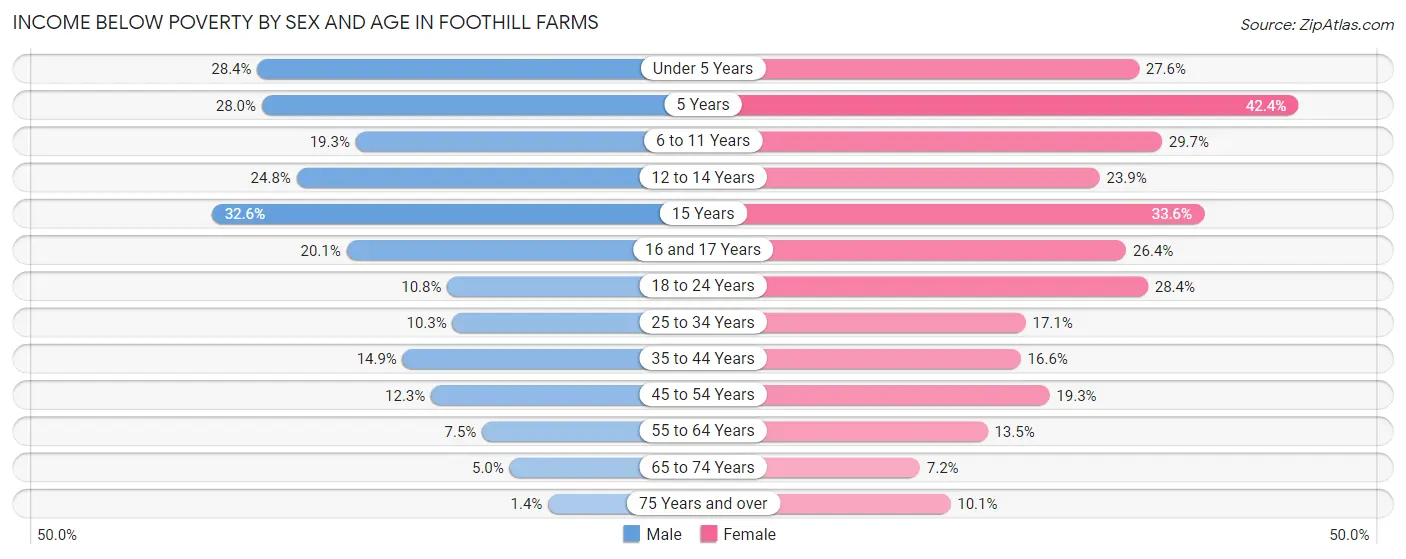
| Age Bracket | Male | Female |
| Under 5 Years | 428 (28.4%) | 390 (27.6%) |
| 5 Years | 108 (28.0%) | 130 (42.3%) |
| 6 to 11 Years | 317 (19.3%) | 542 (29.7%) |
| 12 to 14 Years | 251 (24.7%) | 182 (23.9%) |
| 15 Years | 77 (32.6%) | 84 (33.6%) |
| 16 and 17 Years | 103 (20.1%) | 109 (26.4%) |
| 18 to 24 Years | 184 (10.8%) | 403 (28.4%) |
| 25 to 34 Years | 299 (10.3%) | 608 (17.1%) |
| 35 to 44 Years | 402 (14.9%) | 404 (16.6%) |
| 45 to 54 Years | 235 (12.3%) | 371 (19.3%) |
| 55 to 64 Years | 161 (7.5%) | 272 (13.5%) |
| 65 to 74 Years | 61 (5.0%) | 98 (7.2%) |
| 75 Years and over | 9 (1.4%) | 86 (10.1%) |
| Total | 2,635 (14.2%) | 3,679 (19.9%) |
Income Above Poverty by Sex and Age in Foothill Farms
According to the poverty statistics in Foothill Farms, males aged 75 years and over and females aged 65 to 74 years are the age groups that are most secure financially, with 98.6% of males and 92.8% of females in these age groups living above the poverty line.
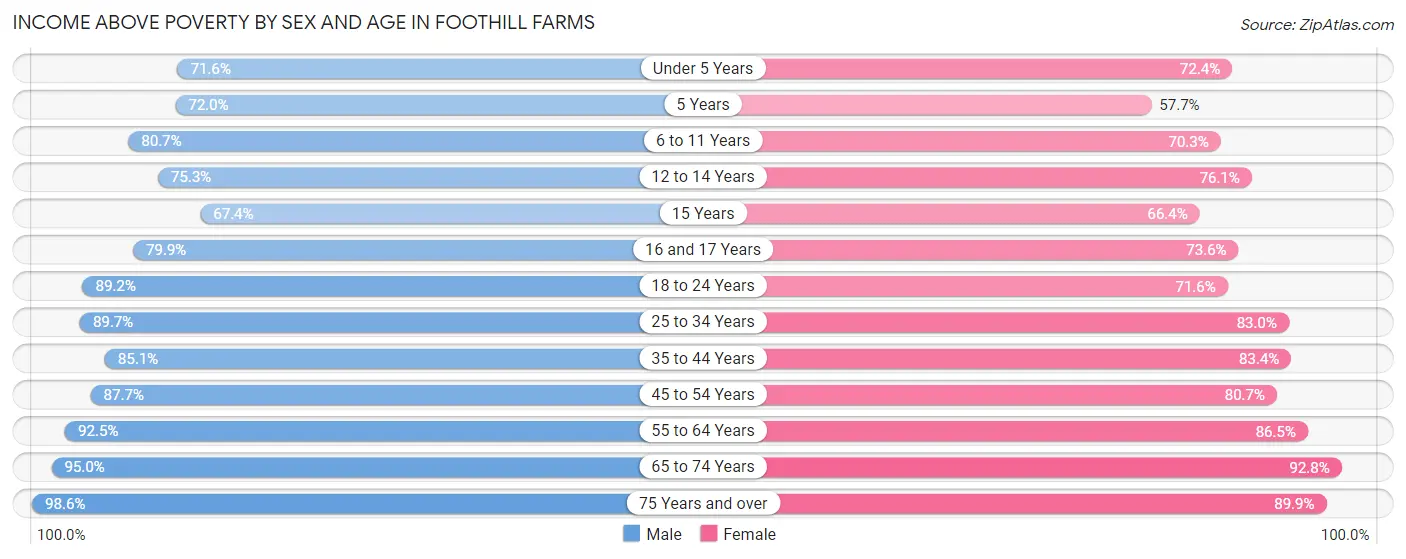
| Age Bracket | Male | Female |
| Under 5 Years | 1,079 (71.6%) | 1,025 (72.4%) |
| 5 Years | 278 (72.0%) | 177 (57.7%) |
| 6 to 11 Years | 1,328 (80.7%) | 1,283 (70.3%) |
| 12 to 14 Years | 763 (75.2%) | 579 (76.1%) |
| 15 Years | 159 (67.4%) | 166 (66.4%) |
| 16 and 17 Years | 409 (79.9%) | 304 (73.6%) |
| 18 to 24 Years | 1,524 (89.2%) | 1,016 (71.6%) |
| 25 to 34 Years | 2,610 (89.7%) | 2,957 (83.0%) |
| 35 to 44 Years | 2,295 (85.1%) | 2,030 (83.4%) |
| 45 to 54 Years | 1,681 (87.7%) | 1,554 (80.7%) |
| 55 to 64 Years | 1,977 (92.5%) | 1,740 (86.5%) |
| 65 to 74 Years | 1,161 (95.0%) | 1,255 (92.8%) |
| 75 Years and over | 628 (98.6%) | 768 (89.9%) |
| Total | 15,892 (85.8%) | 14,854 (80.1%) |
Income Below Poverty Among Married-Couple Families in Foothill Farms
The poverty statistics for married-couple families in Foothill Farms show that 9.3% or 470 of the total 5,062 families live below the poverty line. Families with 5 or more children have the highest poverty rate of 35.7%, comprising of 30 families. On the other hand, families with no children have the lowest poverty rate of 2.9%, which includes 71 families.
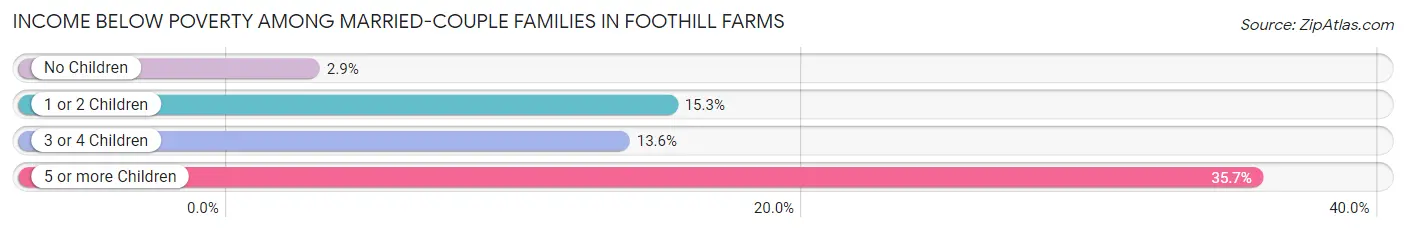
| Children | Above Poverty | Below Poverty |
| No Children | 2,424 (97.2%) | 71 (2.9%) |
| 1 or 2 Children | 1,538 (84.7%) | 278 (15.3%) |
| 3 or 4 Children | 576 (86.4%) | 91 (13.6%) |
| 5 or more Children | 54 (64.3%) | 30 (35.7%) |
| Total | 4,592 (90.7%) | 470 (9.3%) |
Income Below Poverty Among Single-Parent Households in Foothill Farms
According to the poverty data in Foothill Farms, 14.1% or 156 single-father households and 20.6% or 564 single-mother households are living below the poverty line. Among single-father households, those with 5 or more children have the highest poverty rate, with 24 households (100.0%) experiencing poverty. Likewise, among single-mother households, those with 5 or more children have the highest poverty rate, with 17 households (100.0%) falling below the poverty line.
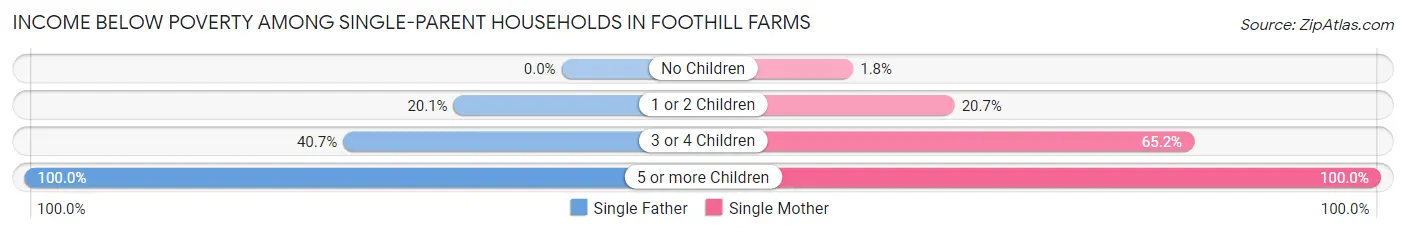
| Children | Single Father | Single Mother |
| No Children | 0 (0.0%) | 18 (1.8%) |
| 1 or 2 Children | 97 (20.1%) | 272 (20.7%) |
| 3 or 4 Children | 35 (40.7%) | 257 (65.2%) |
| 5 or more Children | 24 (100.0%) | 17 (100.0%) |
| Total | 156 (14.1%) | 564 (20.6%) |
Income Below Poverty Among Married-Couple vs Single-Parent Households in Foothill Farms
The poverty data for Foothill Farms shows that 470 of the married-couple family households (9.3%) and 720 of the single-parent households (18.8%) are living below the poverty level. Within the married-couple family households, those with 5 or more children have the highest poverty rate, with 30 households (35.7%) falling below the poverty line. Among the single-parent households, those with 5 or more children have the highest poverty rate, with 41 household (100.0%) living below poverty.
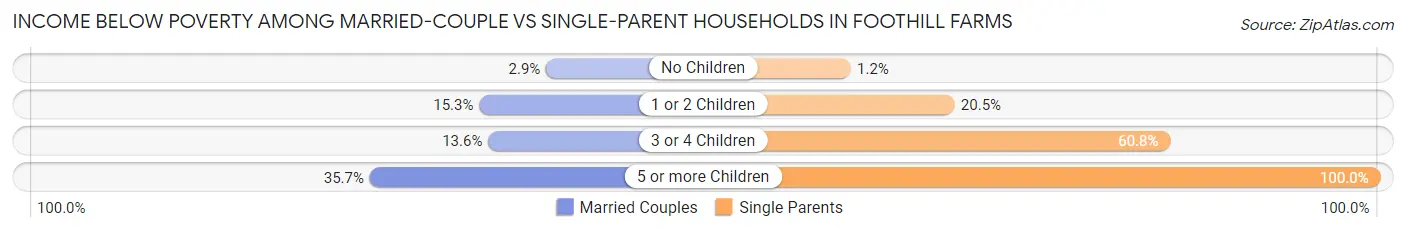
| Children | Married-Couple Families | Single-Parent Households |
| No Children | 71 (2.9%) | 18 (1.2%) |
| 1 or 2 Children | 278 (15.3%) | 369 (20.5%) |
| 3 or 4 Children | 91 (13.6%) | 292 (60.8%) |
| 5 or more Children | 30 (35.7%) | 41 (100.0%) |
| Total | 470 (9.3%) | 720 (18.8%) |
Race in Foothill Farms
The most populous races in Foothill Farms are White / Caucasian (21,223 | 56.4%), Hispanic or Latino (8,109 | 21.5%), and Black / African American (4,742 | 12.6%).
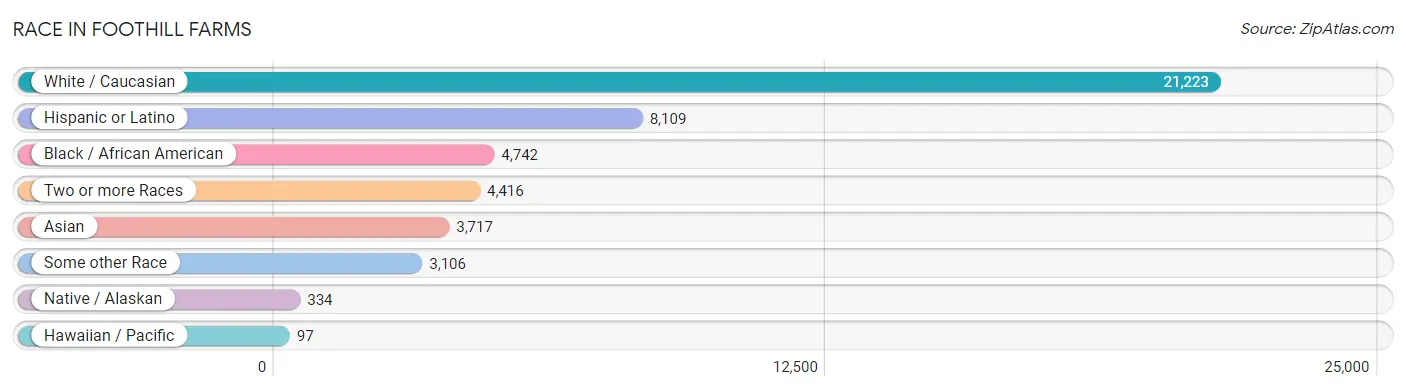
| Race | # Population | % Population |
| Asian | 3,717 | 9.9% |
| Black / African American | 4,742 | 12.6% |
| Hawaiian / Pacific | 97 | 0.3% |
| Hispanic or Latino | 8,109 | 21.5% |
| Native / Alaskan | 334 | 0.9% |
| White / Caucasian | 21,223 | 56.4% |
| Two or more Races | 4,416 | 11.7% |
| Some other Race | 3,106 | 8.3% |
| Total | 37,635 | 100.0% |
Ancestry in Foothill Farms
The most populous ancestries reported in Foothill Farms are Mexican (6,547 | 17.4%), German (2,621 | 7.0%), English (2,614 | 7.0%), Ukrainian (2,247 | 6.0%), and Irish (1,729 | 4.6%), together accounting for 41.9% of all Foothill Farms residents.
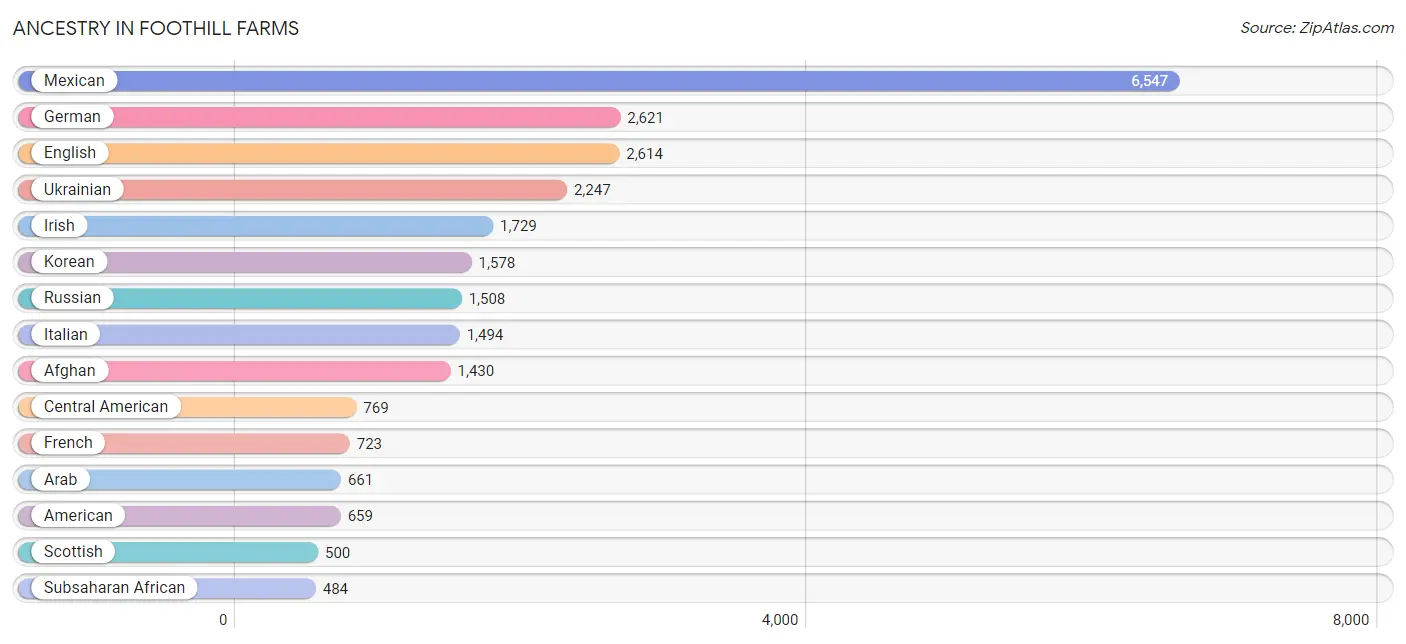
| Ancestry | # Population | % Population |
| Afghan | 1,430 | 3.8% |
| African | 310 | 0.8% |
| American | 659 | 1.8% |
| Apache | 61 | 0.2% |
| Arab | 661 | 1.8% |
| Argentinean | 44 | 0.1% |
| Armenian | 16 | 0.0% |
| Australian | 94 | 0.3% |
| Austrian | 46 | 0.1% |
| Bangladeshi | 48 | 0.1% |
| Basque | 12 | 0.0% |
| Belgian | 9 | 0.0% |
| Bhutanese | 186 | 0.5% |
| Blackfeet | 122 | 0.3% |
| British | 87 | 0.2% |
| Bulgarian | 55 | 0.2% |
| Burmese | 82 | 0.2% |
| Canadian | 36 | 0.1% |
| Cape Verdean | 7 | 0.0% |
| Central American | 769 | 2.0% |
| Cherokee | 235 | 0.6% |
| Chickasaw | 9 | 0.0% |
| Chilean | 6 | 0.0% |
| Choctaw | 15 | 0.0% |
| Colombian | 36 | 0.1% |
| Costa Rican | 47 | 0.1% |
| Croatian | 45 | 0.1% |
| Crow | 30 | 0.1% |
| Cuban | 31 | 0.1% |
| Czech | 43 | 0.1% |
| Danish | 80 | 0.2% |
| Dominican | 14 | 0.0% |
| Dutch | 109 | 0.3% |
| Eastern European | 59 | 0.2% |
| English | 2,614 | 7.0% |
| Ethiopian | 124 | 0.3% |
| European | 410 | 1.1% |
| Finnish | 92 | 0.2% |
| French | 723 | 1.9% |
| French American Indian | 10 | 0.0% |
| French Canadian | 186 | 0.5% |
| German | 2,621 | 7.0% |
| Greek | 62 | 0.2% |
| Guamanian / Chamorro | 68 | 0.2% |
| Guatemalan | 246 | 0.6% |
| Guyanese | 19 | 0.1% |
| Haitian | 44 | 0.1% |
| Honduran | 21 | 0.1% |
| Hungarian | 9 | 0.0% |
| Indian (Asian) | 220 | 0.6% |
| Indonesian | 46 | 0.1% |
| Iranian | 13 | 0.0% |
| Irish | 1,729 | 4.6% |
| Iroquois | 13 | 0.0% |
| Italian | 1,494 | 4.0% |
| Jamaican | 42 | 0.1% |
| Japanese | 43 | 0.1% |
| Jordanian | 19 | 0.1% |
| Korean | 1,578 | 4.2% |
| Laotian | 86 | 0.2% |
| Lebanese | 17 | 0.1% |
| Lithuanian | 11 | 0.0% |
| Malaysian | 58 | 0.2% |
| Mexican | 6,547 | 17.4% |
| Mexican American Indian | 103 | 0.3% |
| Native Hawaiian | 1 | 0.0% |
| Navajo | 9 | 0.0% |
| Nepalese | 24 | 0.1% |
| Nicaraguan | 39 | 0.1% |
| Northern European | 45 | 0.1% |
| Norwegian | 372 | 1.0% |
| Paiute | 3 | 0.0% |
| Pakistani | 102 | 0.3% |
| Palestinian | 41 | 0.1% |
| Pennsylvania German | 7 | 0.0% |
| Peruvian | 92 | 0.2% |
| Pima | 29 | 0.1% |
| Polish | 256 | 0.7% |
| Portuguese | 202 | 0.5% |
| Pueblo | 19 | 0.1% |
| Puerto Rican | 245 | 0.6% |
| Romanian | 220 | 0.6% |
| Russian | 1,508 | 4.0% |
| Salvadoran | 416 | 1.1% |
| Scandinavian | 51 | 0.1% |
| Scotch-Irish | 211 | 0.6% |
| Scottish | 500 | 1.3% |
| Seminole | 3 | 0.0% |
| Slavic | 5 | 0.0% |
| South African | 19 | 0.1% |
| South American | 191 | 0.5% |
| Spaniard | 77 | 0.2% |
| Spanish | 84 | 0.2% |
| Spanish American | 9 | 0.0% |
| Sri Lankan | 402 | 1.1% |
| Subsaharan African | 484 | 1.3% |
| Swedish | 380 | 1.0% |
| Swiss | 13 | 0.0% |
| Syrian | 217 | 0.6% |
| Thai | 296 | 0.8% |
| Turkish | 46 | 0.1% |
| Ukrainian | 2,247 | 6.0% |
| Welsh | 209 | 0.6% | View All 103 Rows |
Immigrants in Foothill Farms
The most numerous immigrant groups reported in Foothill Farms came from Asia (3,679 | 9.8%), Europe (3,158 | 8.4%), Eastern Europe (3,084 | 8.2%), Latin America (2,101 | 5.6%), and Central America (1,886 | 5.0%), together accounting for 36.9% of all Foothill Farms residents.
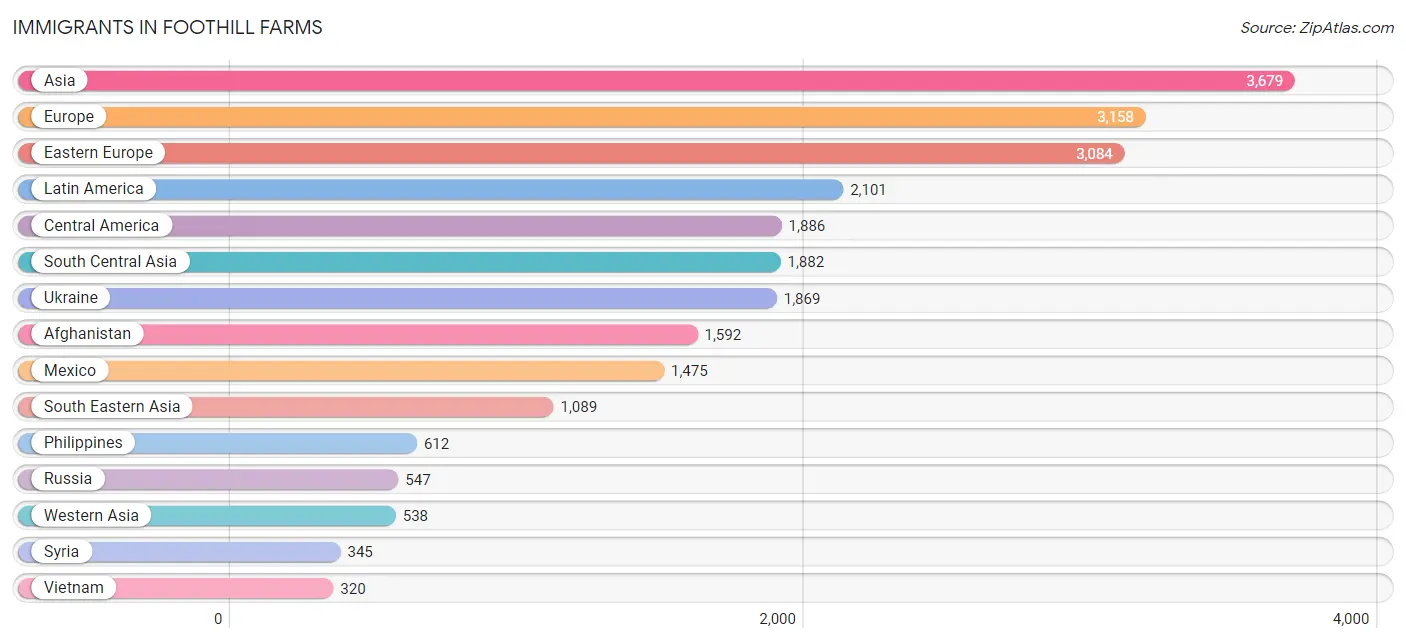
| Immigration Origin | # Population | % Population |
| Afghanistan | 1,592 | 4.2% |
| Africa | 124 | 0.3% |
| Argentina | 44 | 0.1% |
| Asia | 3,679 | 9.8% |
| Belarus | 256 | 0.7% |
| Cambodia | 27 | 0.1% |
| Canada | 5 | 0.0% |
| Caribbean | 38 | 0.1% |
| Central America | 1,886 | 5.0% |
| Chile | 6 | 0.0% |
| Colombia | 59 | 0.2% |
| Costa Rica | 9 | 0.0% |
| Croatia | 13 | 0.0% |
| Czechoslovakia | 8 | 0.0% |
| Eastern Africa | 111 | 0.3% |
| Eastern Asia | 170 | 0.4% |
| Eastern Europe | 3,084 | 8.2% |
| El Salvador | 195 | 0.5% |
| England | 7 | 0.0% |
| Ethiopia | 111 | 0.3% |
| Europe | 3,158 | 8.4% |
| Fiji | 31 | 0.1% |
| France | 26 | 0.1% |
| Germany | 14 | 0.0% |
| Greece | 14 | 0.0% |
| Guatemala | 167 | 0.4% |
| India | 166 | 0.4% |
| Iran | 13 | 0.0% |
| Iraq | 11 | 0.0% |
| Italy | 6 | 0.0% |
| Jamaica | 38 | 0.1% |
| Japan | 90 | 0.2% |
| Jordan | 48 | 0.1% |
| Kazakhstan | 38 | 0.1% |
| Korea | 80 | 0.2% |
| Kuwait | 38 | 0.1% |
| Laos | 30 | 0.1% |
| Latin America | 2,101 | 5.6% |
| Latvia | 17 | 0.1% |
| Mexico | 1,475 | 3.9% |
| Moldova | 102 | 0.3% |
| Nicaragua | 11 | 0.0% |
| Northern Europe | 14 | 0.0% |
| Oceania | 67 | 0.2% |
| Panama | 29 | 0.1% |
| Peru | 68 | 0.2% |
| Philippines | 612 | 1.6% |
| Poland | 26 | 0.1% |
| Romania | 125 | 0.3% |
| Russia | 547 | 1.5% |
| Saudi Arabia | 87 | 0.2% |
| South Africa | 13 | 0.0% |
| South America | 177 | 0.5% |
| South Central Asia | 1,882 | 5.0% |
| South Eastern Asia | 1,089 | 2.9% |
| Southern Europe | 20 | 0.1% |
| Syria | 345 | 0.9% |
| Thailand | 54 | 0.1% |
| Ukraine | 1,869 | 5.0% |
| Uzbekistan | 18 | 0.1% |
| Vietnam | 320 | 0.9% |
| Western Asia | 538 | 1.4% |
| Western Europe | 40 | 0.1% | View All 63 Rows |
Sex and Age in Foothill Farms
Sex and Age in Foothill Farms
The most populous age groups in Foothill Farms are 5 to 9 Years (1,762 | 9.3%) for men and 30 to 34 Years (1,983 | 10.6%) for women.
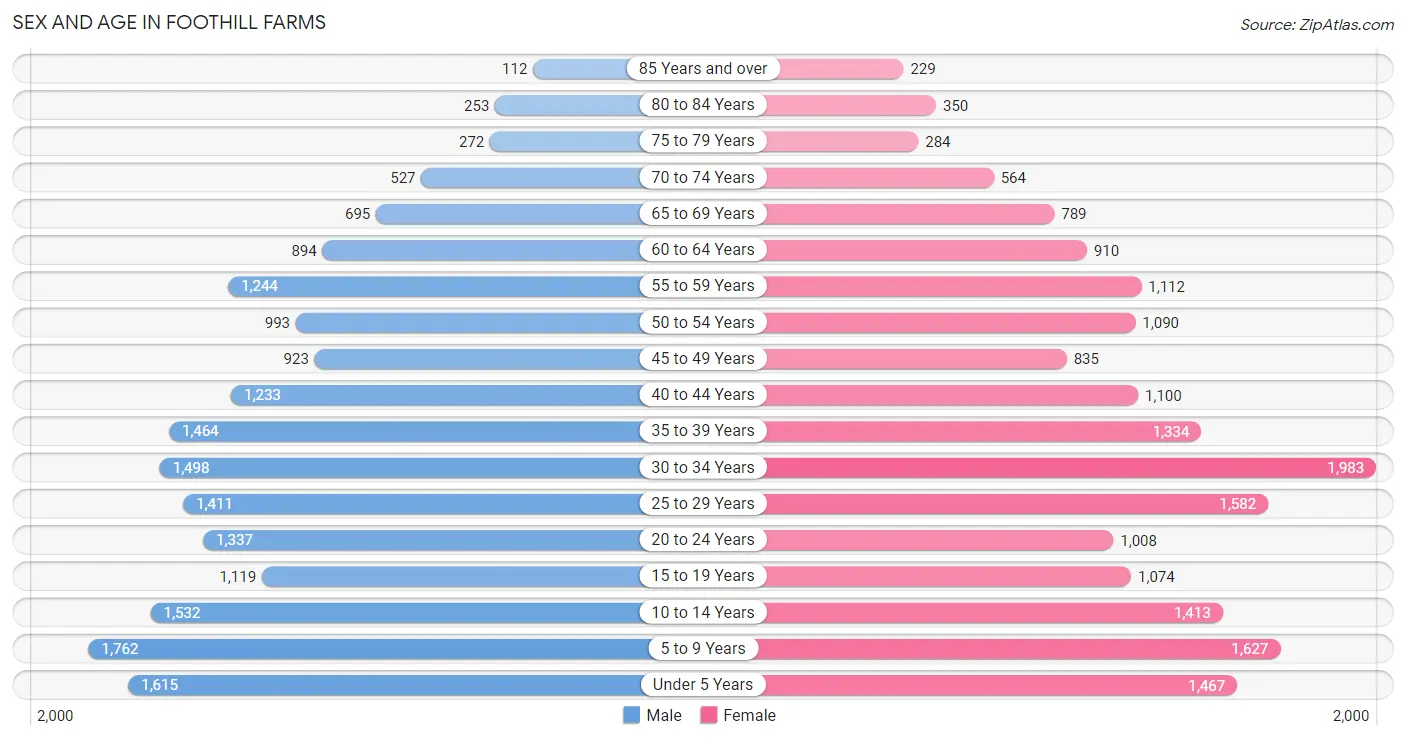
| Age Bracket | Male | Female |
| Under 5 Years | 1,615 (8.6%) | 1,467 (7.8%) |
| 5 to 9 Years | 1,762 (9.3%) | 1,627 (8.7%) |
| 10 to 14 Years | 1,532 (8.1%) | 1,413 (7.5%) |
| 15 to 19 Years | 1,119 (5.9%) | 1,074 (5.7%) |
| 20 to 24 Years | 1,337 (7.1%) | 1,008 (5.4%) |
| 25 to 29 Years | 1,411 (7.5%) | 1,582 (8.4%) |
| 30 to 34 Years | 1,498 (7.9%) | 1,983 (10.6%) |
| 35 to 39 Years | 1,464 (7.7%) | 1,334 (7.1%) |
| 40 to 44 Years | 1,233 (6.5%) | 1,100 (5.9%) |
| 45 to 49 Years | 923 (4.9%) | 835 (4.4%) |
| 50 to 54 Years | 993 (5.3%) | 1,090 (5.8%) |
| 55 to 59 Years | 1,244 (6.6%) | 1,112 (5.9%) |
| 60 to 64 Years | 894 (4.7%) | 910 (4.9%) |
| 65 to 69 Years | 695 (3.7%) | 789 (4.2%) |
| 70 to 74 Years | 527 (2.8%) | 564 (3.0%) |
| 75 to 79 Years | 272 (1.4%) | 284 (1.5%) |
| 80 to 84 Years | 253 (1.3%) | 350 (1.9%) |
| 85 Years and over | 112 (0.6%) | 229 (1.2%) |
| Total | 18,884 (100.0%) | 18,751 (100.0%) |
Families and Households in Foothill Farms
Median Family Size in Foothill Farms
The median family size in Foothill Farms is 3.43 persons per family, with married-couple families (5,062 | 56.9%) accounting for the largest median family size of 3.65 persons per family. On the other hand, single female/mother families (2,732 | 30.7%) represent the smallest median family size with 3.12 persons per family.
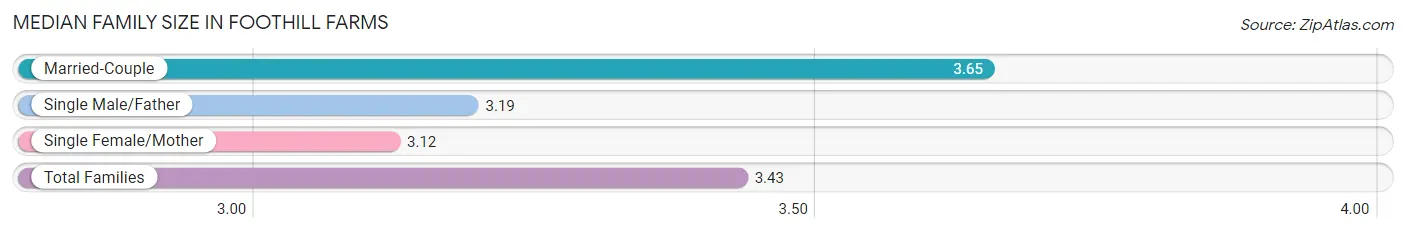
| Family Type | # Families | Family Size |
| Married-Couple | 5,062 (56.9%) | 3.65 |
| Single Male/Father | 1,103 (12.4%) | 3.19 |
| Single Female/Mother | 2,732 (30.7%) | 3.12 |
| Total Families | 8,897 (100.0%) | 3.43 |
Median Household Size in Foothill Farms
The median household size in Foothill Farms is 2.97 persons per household, with married-couple households (5,062 | 40.0%) accounting for the largest median household size of 3.77 persons per household. non-family households (3,756 | 29.7%) represent the smallest median household size with 1.38 persons per household.
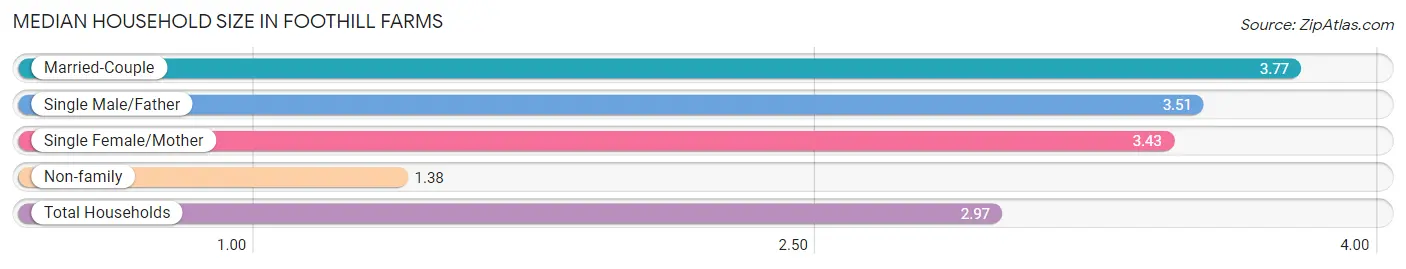
| Household Type | # Households | Household Size |
| Married-Couple | 5,062 (40.0%) | 3.77 |
| Single Male/Father | 1,103 (8.7%) | 3.51 |
| Single Female/Mother | 2,732 (21.6%) | 3.43 |
| Non-family | 3,756 (29.7%) | 1.38 |
| Total Households | 12,653 (100.0%) | 2.97 |
Household Size by Marriage Status in Foothill Farms
Out of a total of 12,653 households in Foothill Farms, 8,897 (70.3%) are family households, while 3,756 (29.7%) are nonfamily households. The most numerous type of family households are 2-person households, comprising 2,920, and the most common type of nonfamily households are 1-person households, comprising 2,769.
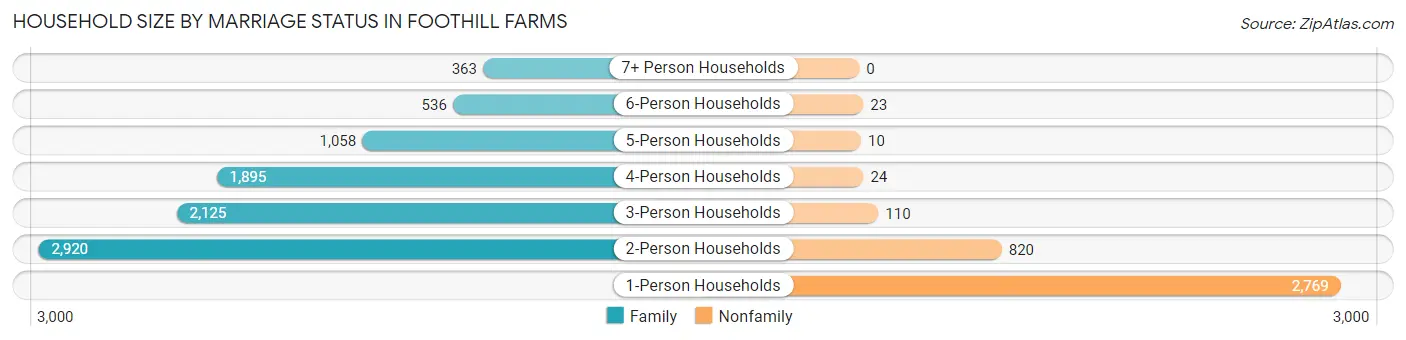
| Household Size | Family Households | Nonfamily Households |
| 1-Person Households | - | 2,769 (21.9%) |
| 2-Person Households | 2,920 (23.1%) | 820 (6.5%) |
| 3-Person Households | 2,125 (16.8%) | 110 (0.9%) |
| 4-Person Households | 1,895 (15.0%) | 24 (0.2%) |
| 5-Person Households | 1,058 (8.4%) | 10 (0.1%) |
| 6-Person Households | 536 (4.2%) | 23 (0.2%) |
| 7+ Person Households | 363 (2.9%) | 0 (0.0%) |
| Total | 8,897 (70.3%) | 3,756 (29.7%) |
Female Fertility in Foothill Farms
Fertility by Age in Foothill Farms
Average fertility rate in Foothill Farms is 89.0 births per 1,000 women. Women in the age bracket of 20 to 34 years have the highest fertility rate with 105.0 births per 1,000 women. Women in the age bracket of 20 to 34 years acount for 59.0% of all women with births.
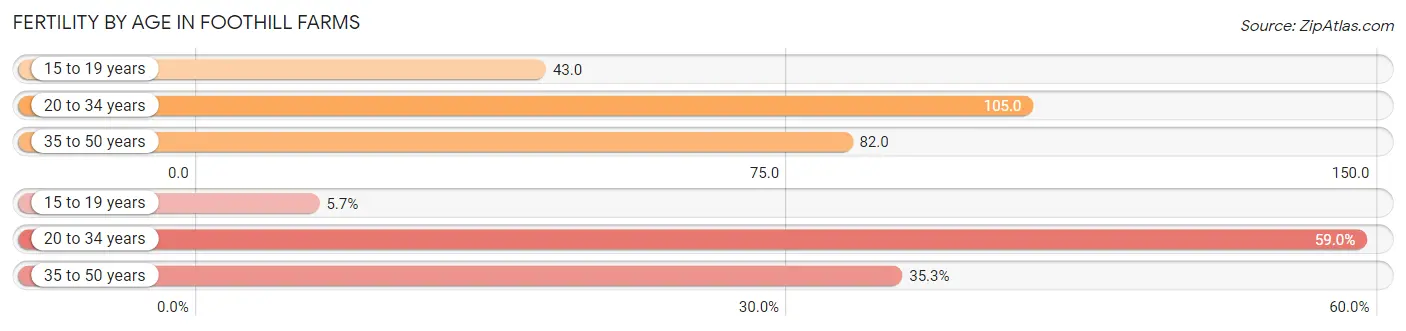
| Age Bracket | Women with Births | Births / 1,000 Women |
| 15 to 19 years | 46 (5.7%) | 43.0 |
| 20 to 34 years | 479 (59.0%) | 105.0 |
| 35 to 50 years | 287 (35.3%) | 82.0 |
| Total | 812 (100.0%) | 89.0 |
Fertility by Age by Marriage Status in Foothill Farms
71.3% of women with births (812) in Foothill Farms are married. The highest percentage of unmarried women with births falls into 15 to 19 years age bracket with 100.0% of them unmarried at the time of birth, while the lowest percentage of unmarried women with births belong to 20 to 34 years age bracket with 14.2% of them unmarried.
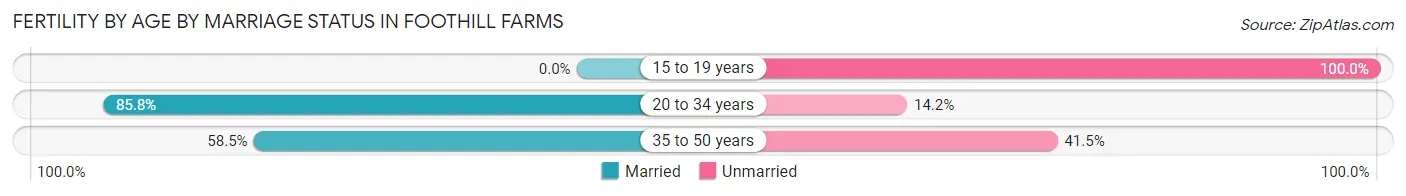
| Age Bracket | Married | Unmarried |
| 15 to 19 years | 0 (0.0%) | 46 (100.0%) |
| 20 to 34 years | 411 (85.8%) | 68 (14.2%) |
| 35 to 50 years | 168 (58.5%) | 119 (41.5%) |
| Total | 579 (71.3%) | 233 (28.7%) |
Fertility by Education in Foothill Farms
Average fertility rate in Foothill Farms is 89.0 births per 1,000 women. Women with the education attainment of graduate degree have the highest fertility rate of 342.0 births per 1,000 women, while women with the education attainment of high school diploma have the lowest fertility at 58.0 births per 1,000 women. Women with the education attainment of bachelor's degree represent 28.2% of all women with births.
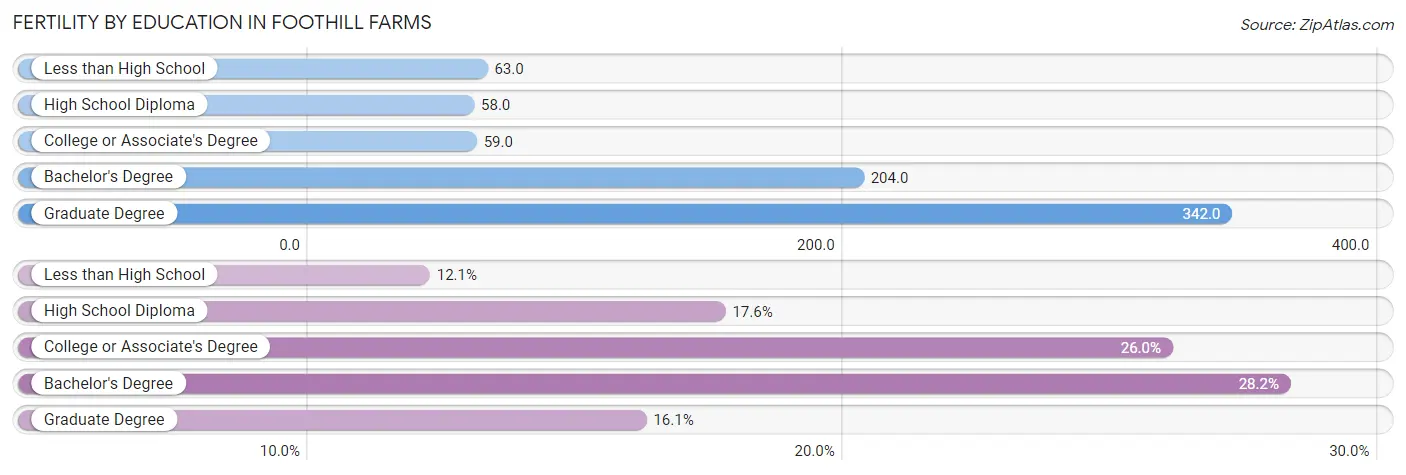
| Educational Attainment | Women with Births | Births / 1,000 Women |
| Less than High School | 98 (12.1%) | 63.0 |
| High School Diploma | 143 (17.6%) | 58.0 |
| College or Associate's Degree | 211 (26.0%) | 59.0 |
| Bachelor's Degree | 229 (28.2%) | 204.0 |
| Graduate Degree | 131 (16.1%) | 342.0 |
| Total | 812 (100.0%) | 89.0 |
Fertility by Education by Marriage Status in Foothill Farms
28.7% of women with births in Foothill Farms are unmarried. Women with the educational attainment of high school diploma are most likely to be married with 86.7% of them married at childbirth, while women with the educational attainment of graduate degree are least likely to be married with 71.8% of them unmarried at childbirth.
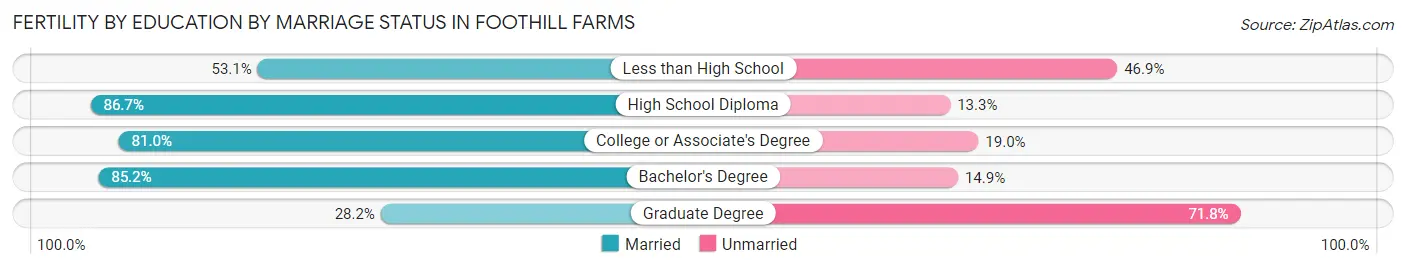
| Educational Attainment | Married | Unmarried |
| Less than High School | 52 (53.1%) | 46 (46.9%) |
| High School Diploma | 124 (86.7%) | 19 (13.3%) |
| College or Associate's Degree | 171 (81.0%) | 40 (19.0%) |
| Bachelor's Degree | 195 (85.2%) | 34 (14.8%) |
| Graduate Degree | 37 (28.2%) | 94 (71.8%) |
| Total | 579 (71.3%) | 233 (28.7%) |
Employment Characteristics in Foothill Farms
Employment by Class of Employer in Foothill Farms
Among the 15,730 employed individuals in Foothill Farms, private company employees (11,121 | 70.7%), state government employees (1,200 | 7.6%), and self-employed (not incorporated) (1,037 | 6.6%) make up the most common classes of employment.
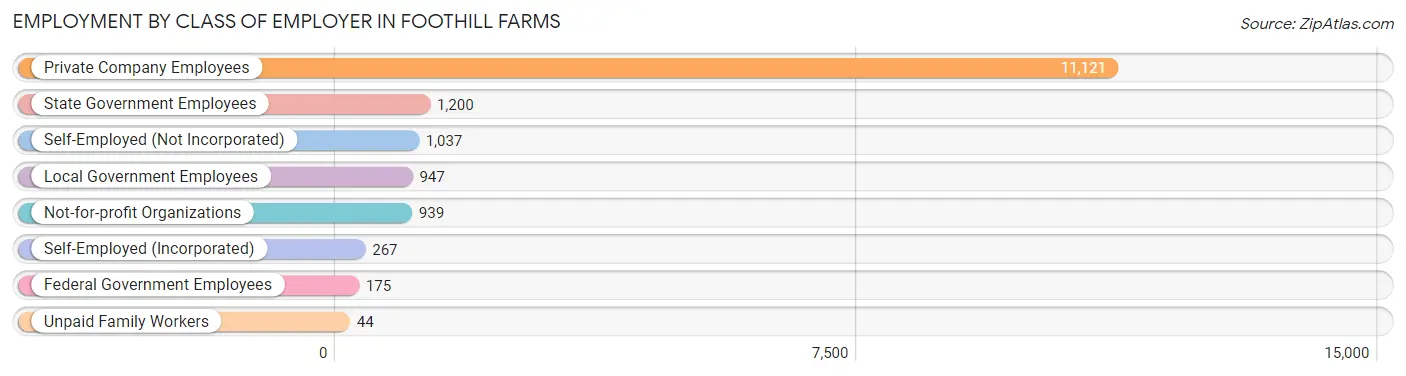
| Employer Class | # Employees | % Employees |
| Private Company Employees | 11,121 | 70.7% |
| Self-Employed (Incorporated) | 267 | 1.7% |
| Self-Employed (Not Incorporated) | 1,037 | 6.6% |
| Not-for-profit Organizations | 939 | 6.0% |
| Local Government Employees | 947 | 6.0% |
| State Government Employees | 1,200 | 7.6% |
| Federal Government Employees | 175 | 1.1% |
| Unpaid Family Workers | 44 | 0.3% |
| Total | 15,730 | 100.0% |
Employment Status by Age in Foothill Farms
According to the labor force statistics for Foothill Farms, out of the total population over 16 years of age (27,733), 63.0% or 17,472 individuals are in the labor force, with 7.7% or 1,345 of them unemployed. The age group with the highest labor force participation rate is 35 to 44 years, with 79.1% or 4,059 individuals in the labor force. Within the labor force, the 16 to 19 years age range has the highest percentage of unemployed individuals, with 22.2% or 135 of them being unemployed.
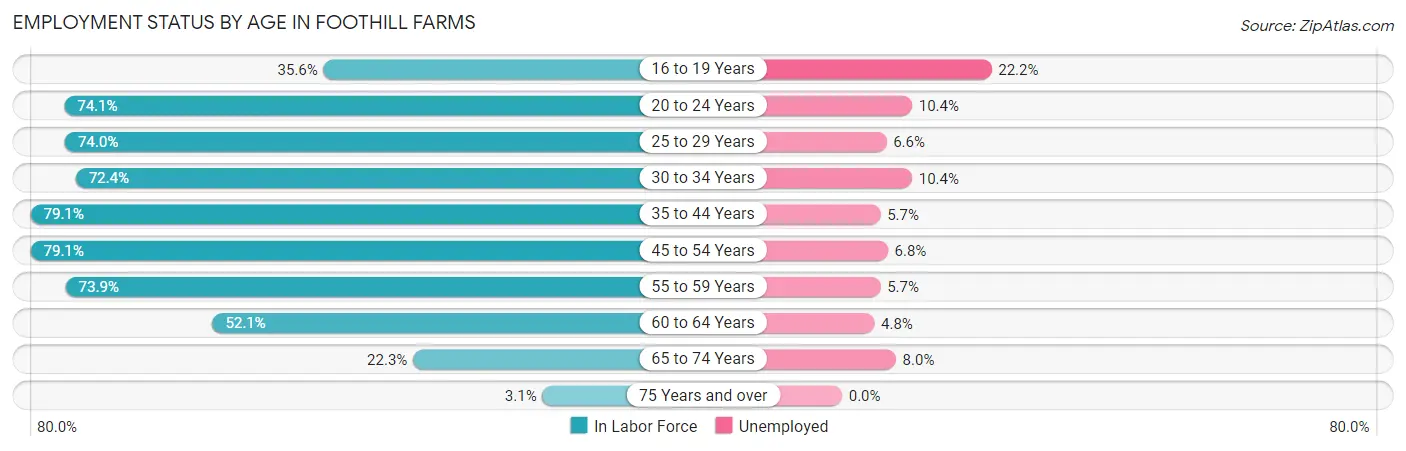
| Age Bracket | In Labor Force | Unemployed |
| 16 to 19 Years | 608 (35.6%) | 135 (22.2%) |
| 20 to 24 Years | 1,738 (74.1%) | 181 (10.4%) |
| 25 to 29 Years | 2,215 (74.0%) | 146 (6.6%) |
| 30 to 34 Years | 2,520 (72.4%) | 262 (10.4%) |
| 35 to 44 Years | 4,059 (79.1%) | 231 (5.7%) |
| 45 to 54 Years | 3,038 (79.1%) | 207 (6.8%) |
| 55 to 59 Years | 1,741 (73.9%) | 99 (5.7%) |
| 60 to 64 Years | 940 (52.1%) | 45 (4.8%) |
| 65 to 74 Years | 574 (22.3%) | 46 (8.0%) |
| 75 Years and over | 46 (3.1%) | 0 (0.0%) |
| Total | 17,472 (63.0%) | 1,345 (7.7%) |
Employment Status by Educational Attainment in Foothill Farms
According to labor force statistics for Foothill Farms, 74.0% of individuals (14,508) out of the total population between 25 and 64 years of age (19,606) are in the labor force, with 6.8% or 987 of them being unemployed. The group with the highest labor force participation rate are those with the educational attainment of college / associate degree, with 81.8% or 5,992 individuals in the labor force. Within the labor force, individuals with bachelor's degree or higher education have the highest percentage of unemployment, with 8.0% or 217 of them being unemployed.
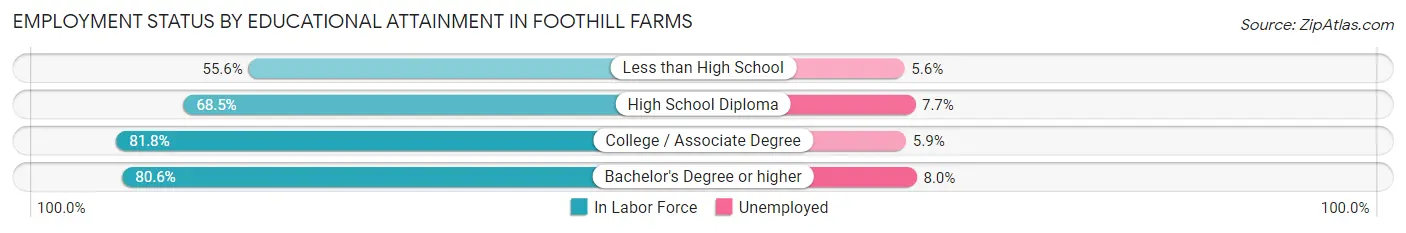
| Educational Attainment | In Labor Force | Unemployed |
| Less than High School | 1,295 (55.6%) | 130 (5.6%) |
| High School Diploma | 4,516 (68.5%) | 508 (7.7%) |
| College / Associate Degree | 5,992 (81.8%) | 432 (5.9%) |
| Bachelor's Degree or higher | 2,708 (80.6%) | 269 (8.0%) |
| Total | 14,508 (74.0%) | 1,333 (6.8%) |
Employment Occupations by Sex in Foothill Farms
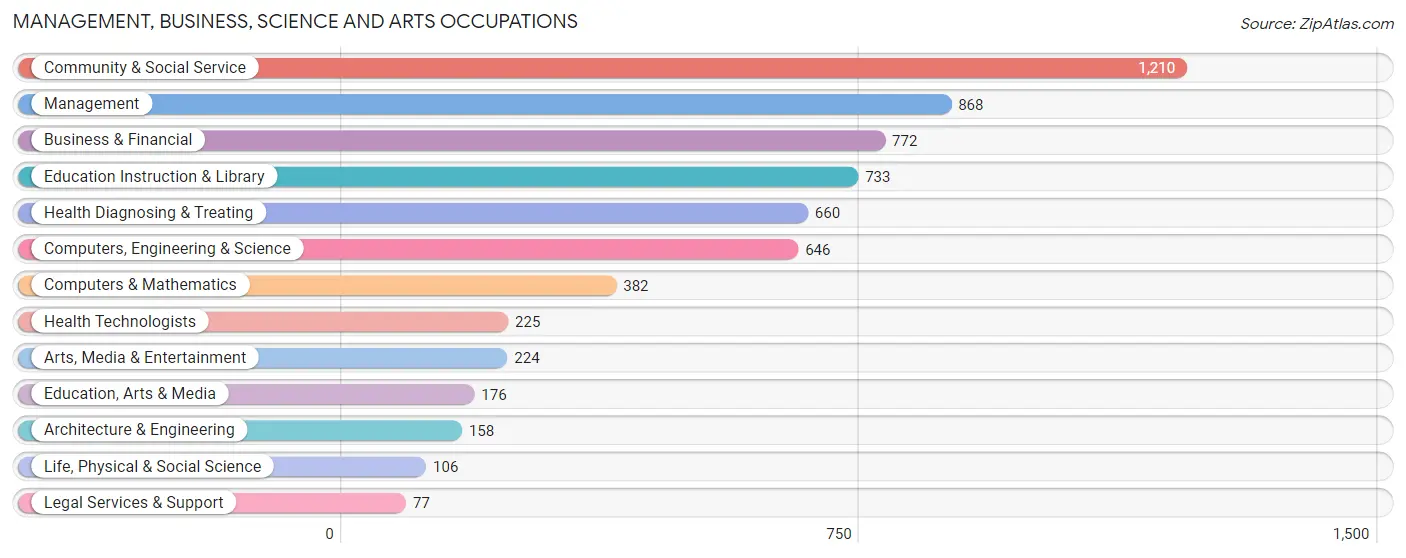
Management, Business, Science and Arts Occupations
The most common Management, Business, Science and Arts occupations in Foothill Farms are Community & Social Service (1,210 | 7.5%), Management (868 | 5.4%), Business & Financial (772 | 4.8%), Education Instruction & Library (733 | 4.5%), and Health Diagnosing & Treating (660 | 4.1%).
Management, Business, Science and Arts Occupations by Sex
Within the Management, Business, Science and Arts occupations in Foothill Farms, the most male-oriented occupations are Architecture & Engineering (93.7%), Arts, Media & Entertainment (71.9%), and Computers & Mathematics (67.3%), while the most female-oriented occupations are Health Technologists (90.7%), Health Diagnosing & Treating (81.5%), and Life, Physical & Social Science (73.6%).
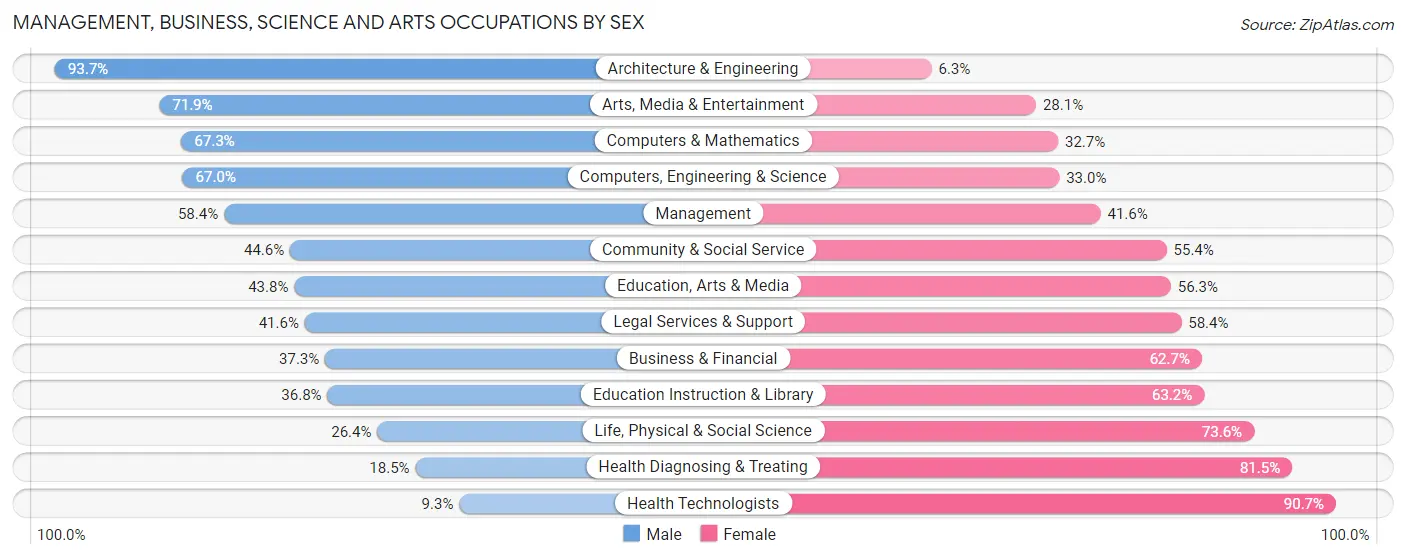
| Occupation | Male | Female |
| Management | 507 (58.4%) | 361 (41.6%) |
| Business & Financial | 288 (37.3%) | 484 (62.7%) |
| Computers, Engineering & Science | 433 (67.0%) | 213 (33.0%) |
| Computers & Mathematics | 257 (67.3%) | 125 (32.7%) |
| Architecture & Engineering | 148 (93.7%) | 10 (6.3%) |
| Life, Physical & Social Science | 28 (26.4%) | 78 (73.6%) |
| Community & Social Service | 540 (44.6%) | 670 (55.4%) |
| Education, Arts & Media | 77 (43.8%) | 99 (56.2%) |
| Legal Services & Support | 32 (41.6%) | 45 (58.4%) |
| Education Instruction & Library | 270 (36.8%) | 463 (63.2%) |
| Arts, Media & Entertainment | 161 (71.9%) | 63 (28.1%) |
| Health Diagnosing & Treating | 122 (18.5%) | 538 (81.5%) |
| Health Technologists | 21 (9.3%) | 204 (90.7%) |
| Total (Category) | 1,890 (45.5%) | 2,266 (54.5%) |
| Total (Overall) | 8,826 (54.8%) | 7,293 (45.2%) |
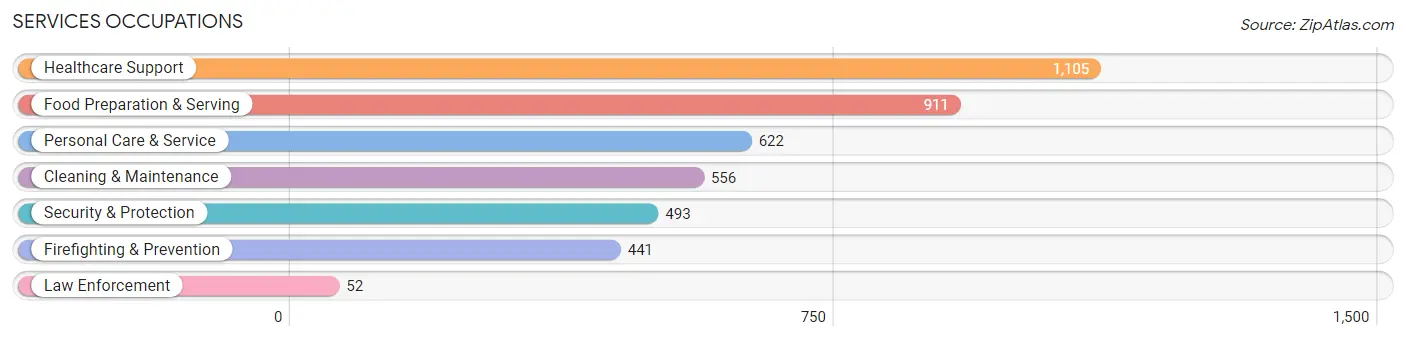
Services Occupations
The most common Services occupations in Foothill Farms are Healthcare Support (1,105 | 6.9%), Food Preparation & Serving (911 | 5.7%), Personal Care & Service (622 | 3.9%), Cleaning & Maintenance (556 | 3.5%), and Security & Protection (493 | 3.1%).
Services Occupations by Sex
Within the Services occupations in Foothill Farms, the most male-oriented occupations are Firefighting & Prevention (91.4%), Security & Protection (90.3%), and Law Enforcement (80.8%), while the most female-oriented occupations are Personal Care & Service (88.1%), Healthcare Support (75.8%), and Food Preparation & Serving (47.4%).
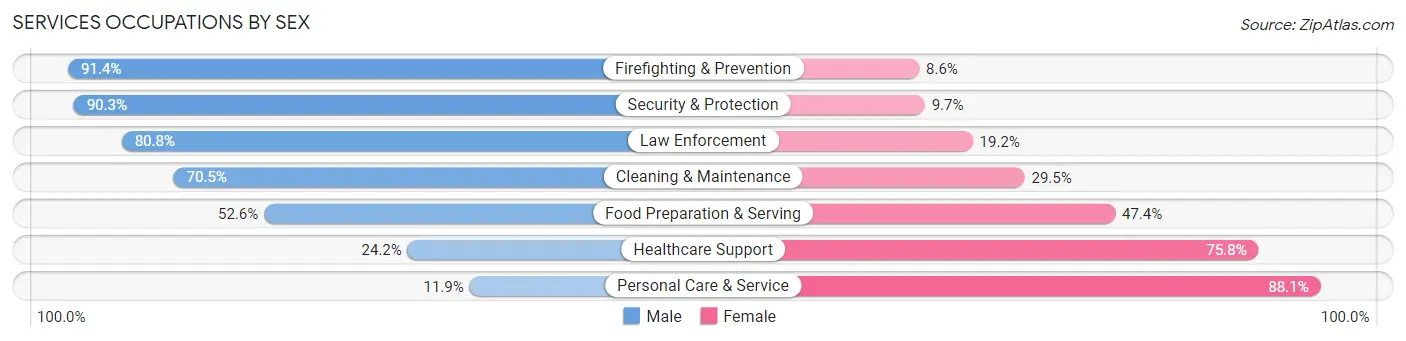
| Occupation | Male | Female |
| Healthcare Support | 267 (24.2%) | 838 (75.8%) |
| Security & Protection | 445 (90.3%) | 48 (9.7%) |
| Firefighting & Prevention | 403 (91.4%) | 38 (8.6%) |
| Law Enforcement | 42 (80.8%) | 10 (19.2%) |
| Food Preparation & Serving | 479 (52.6%) | 432 (47.4%) |
| Cleaning & Maintenance | 392 (70.5%) | 164 (29.5%) |
| Personal Care & Service | 74 (11.9%) | 548 (88.1%) |
| Total (Category) | 1,657 (44.9%) | 2,030 (55.1%) |
| Total (Overall) | 8,826 (54.8%) | 7,293 (45.2%) |
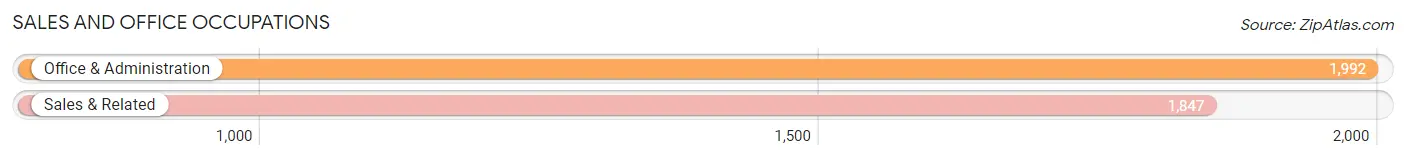
Sales and Office Occupations
The most common Sales and Office occupations in Foothill Farms are Office & Administration (1,992 | 12.4%), and Sales & Related (1,847 | 11.5%).
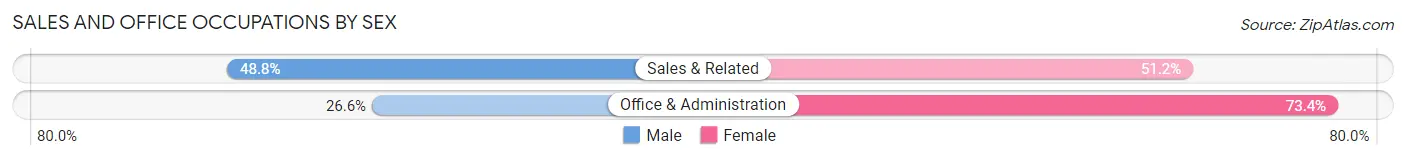
Sales and Office Occupations by Sex
| Occupation | Male | Female |
| Sales & Related | 902 (48.8%) | 945 (51.2%) |
| Office & Administration | 529 (26.6%) | 1,463 (73.4%) |
| Total (Category) | 1,431 (37.3%) | 2,408 (62.7%) |
| Total (Overall) | 8,826 (54.8%) | 7,293 (45.2%) |
Natural Resources, Construction and Maintenance Occupations
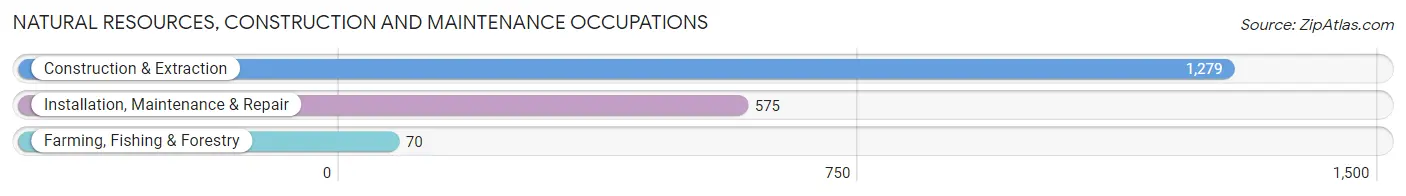
The most common Natural Resources, Construction and Maintenance occupations in Foothill Farms are Construction & Extraction (1,279 | 7.9%), Installation, Maintenance & Repair (575 | 3.6%), and Farming, Fishing & Forestry (70 | 0.4%).
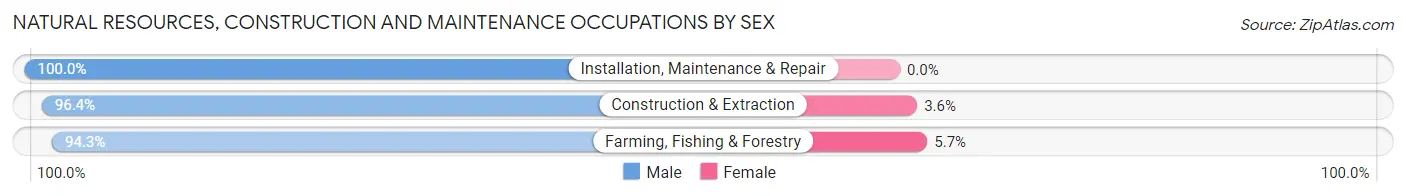
Natural Resources, Construction and Maintenance Occupations by Sex
| Occupation | Male | Female |
| Farming, Fishing & Forestry | 66 (94.3%) | 4 (5.7%) |
| Construction & Extraction | 1,233 (96.4%) | 46 (3.6%) |
| Installation, Maintenance & Repair | 575 (100.0%) | 0 (0.0%) |
| Total (Category) | 1,874 (97.4%) | 50 (2.6%) |
| Total (Overall) | 8,826 (54.8%) | 7,293 (45.2%) |
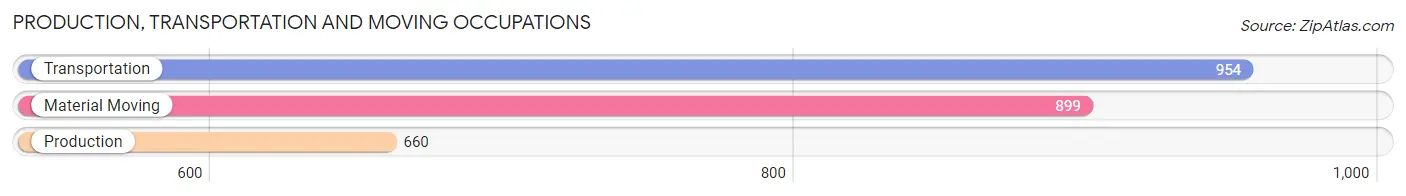
Production, Transportation and Moving Occupations
The most common Production, Transportation and Moving occupations in Foothill Farms are Transportation (954 | 5.9%), Material Moving (899 | 5.6%), and Production (660 | 4.1%).
Production, Transportation and Moving Occupations by Sex
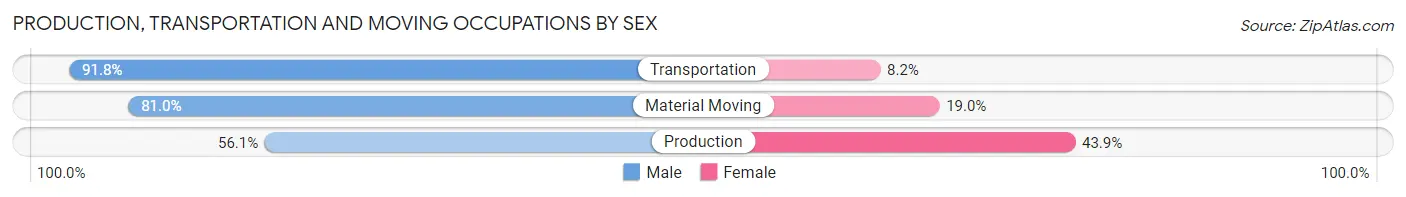
| Occupation | Male | Female |
| Production | 370 (56.1%) | 290 (43.9%) |
| Transportation | 876 (91.8%) | 78 (8.2%) |
| Material Moving | 728 (81.0%) | 171 (19.0%) |
| Total (Category) | 1,974 (78.5%) | 539 (21.4%) |
| Total (Overall) | 8,826 (54.8%) | 7,293 (45.2%) |
Employment Industries by Sex in Foothill Farms
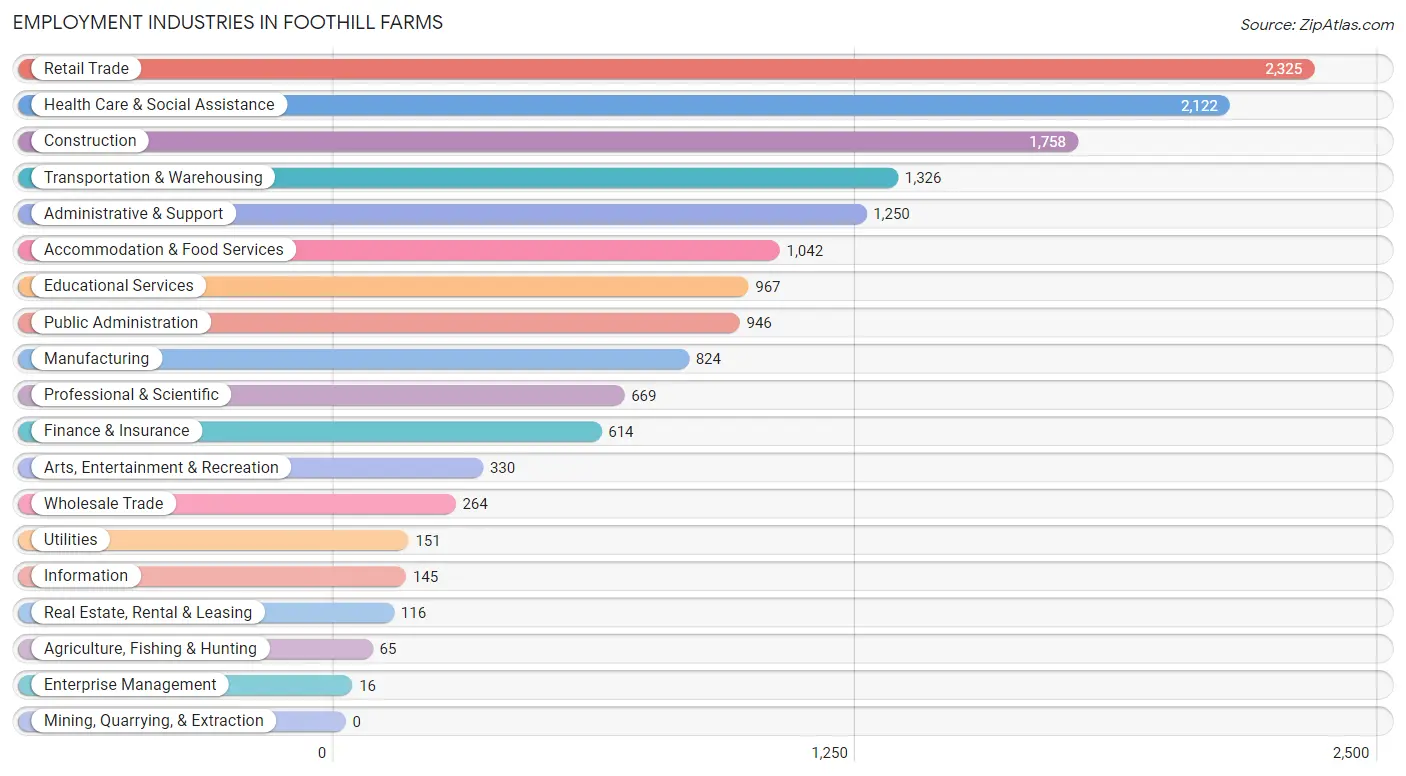
Employment Industries in Foothill Farms
The major employment industries in Foothill Farms include Retail Trade (2,325 | 14.4%), Health Care & Social Assistance (2,122 | 13.2%), Construction (1,758 | 10.9%), Transportation & Warehousing (1,326 | 8.2%), and Administrative & Support (1,250 | 7.7%).
Employment Industries by Sex in Foothill Farms
The Foothill Farms industries that see more men than women are Agriculture, Fishing & Hunting (100.0%), Enterprise Management (100.0%), and Construction (91.2%), whereas the industries that tend to have a higher number of women are Health Care & Social Assistance (79.1%), Public Administration (60.2%), and Educational Services (58.6%).
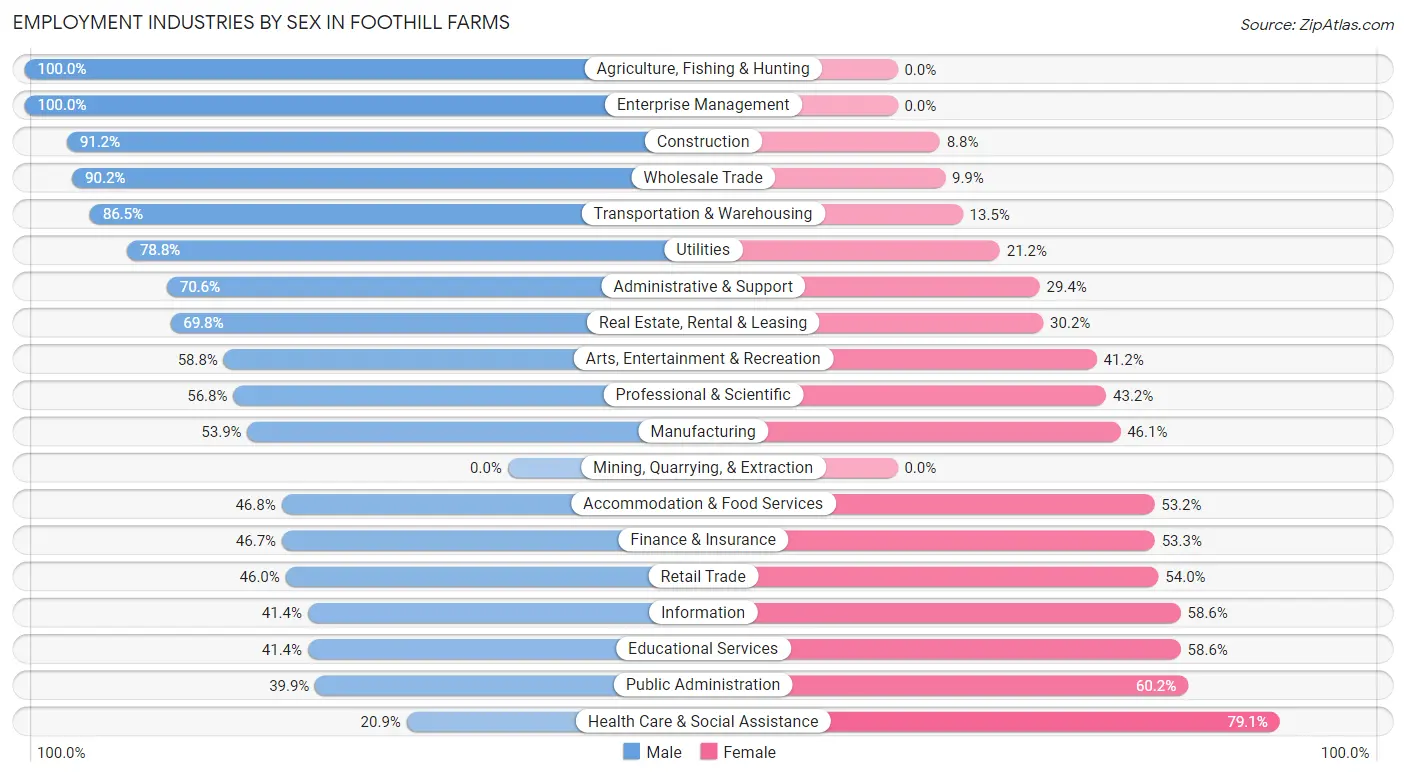
| Industry | Male | Female |
| Agriculture, Fishing & Hunting | 65 (100.0%) | 0 (0.0%) |
| Mining, Quarrying, & Extraction | 0 (0.0%) | 0 (0.0%) |
| Construction | 1,604 (91.2%) | 154 (8.8%) |
| Manufacturing | 444 (53.9%) | 380 (46.1%) |
| Wholesale Trade | 238 (90.1%) | 26 (9.9%) |
| Retail Trade | 1,069 (46.0%) | 1,256 (54.0%) |
| Transportation & Warehousing | 1,147 (86.5%) | 179 (13.5%) |
| Utilities | 119 (78.8%) | 32 (21.2%) |
| Information | 60 (41.4%) | 85 (58.6%) |
| Finance & Insurance | 287 (46.7%) | 327 (53.3%) |
| Real Estate, Rental & Leasing | 81 (69.8%) | 35 (30.2%) |
| Professional & Scientific | 380 (56.8%) | 289 (43.2%) |
| Enterprise Management | 16 (100.0%) | 0 (0.0%) |
| Administrative & Support | 882 (70.6%) | 368 (29.4%) |
| Educational Services | 400 (41.4%) | 567 (58.6%) |
| Health Care & Social Assistance | 444 (20.9%) | 1,678 (79.1%) |
| Arts, Entertainment & Recreation | 194 (58.8%) | 136 (41.2%) |
| Accommodation & Food Services | 488 (46.8%) | 554 (53.2%) |
| Public Administration | 377 (39.9%) | 569 (60.2%) |
| Total | 8,826 (54.8%) | 7,293 (45.2%) |
Education in Foothill Farms
School Enrollment in Foothill Farms
The most common levels of schooling among the 10,190 students in Foothill Farms are middle school (2,389 | 23.4%), elementary school (2,344 | 23.0%), and high school (2,067 | 20.3%).
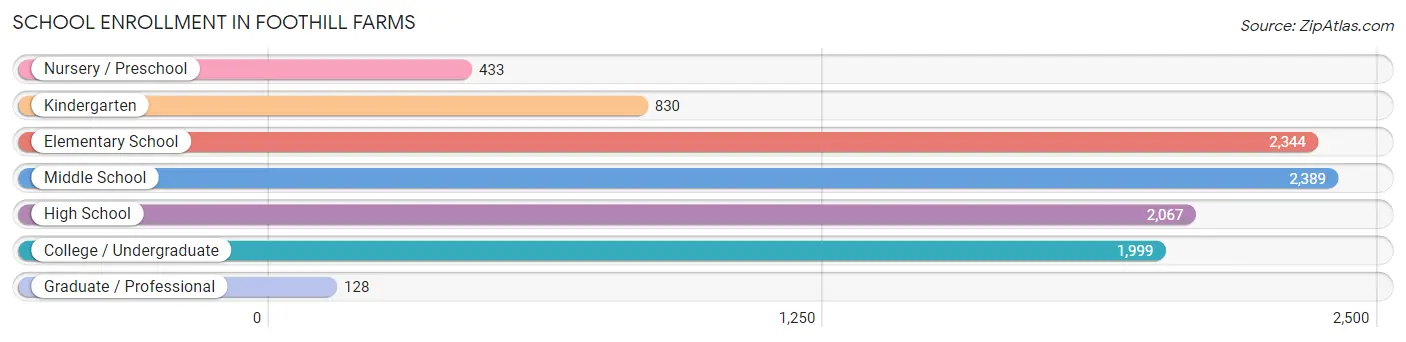
| School Level | # Students | % Students |
| Nursery / Preschool | 433 | 4.3% |
| Kindergarten | 830 | 8.2% |
| Elementary School | 2,344 | 23.0% |
| Middle School | 2,389 | 23.4% |
| High School | 2,067 | 20.3% |
| College / Undergraduate | 1,999 | 19.6% |
| Graduate / Professional | 128 | 1.3% |
| Total | 10,190 | 100.0% |
School Enrollment by Age by Funding Source in Foothill Farms
Out of a total of 10,190 students who are enrolled in schools in Foothill Farms, 856 (8.4%) attend a private institution, while the remaining 9,334 (91.6%) are enrolled in public schools. The age group of 25 to 34 year olds has the highest likelihood of being enrolled in private schools, with 163 (20.9% in the age bracket) enrolled. Conversely, the age group of 20 to 24 year olds has the lowest likelihood of being enrolled in a private school, with 595 (96.0% in the age bracket) attending a public institution.
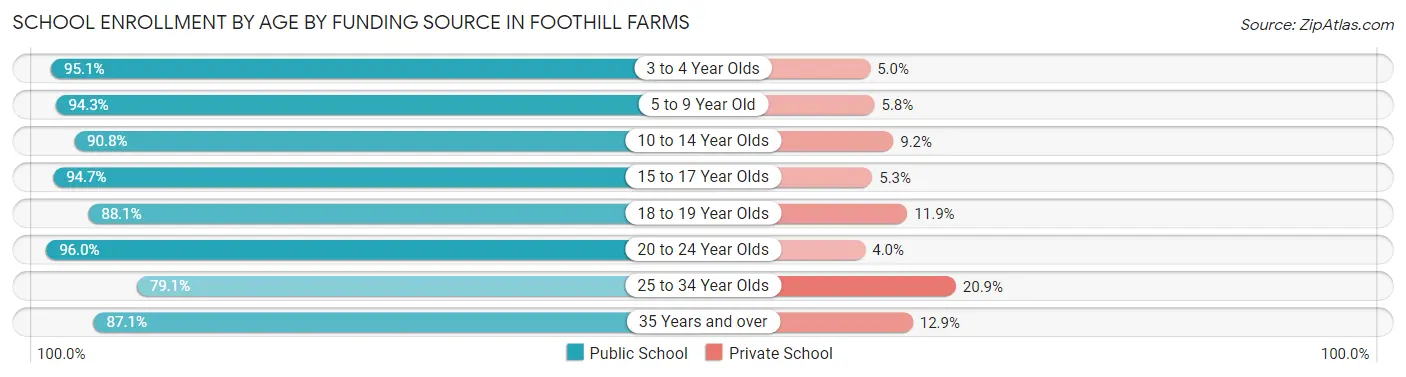
| Age Bracket | Public School | Private School |
| 3 to 4 Year Olds | 307 (95.1%) | 16 (5.0%) |
| 5 to 9 Year Old | 2,985 (94.3%) | 182 (5.8%) |
| 10 to 14 Year Olds | 2,673 (90.8%) | 272 (9.2%) |
| 15 to 17 Year Olds | 1,225 (94.7%) | 69 (5.3%) |
| 18 to 19 Year Olds | 490 (88.1%) | 66 (11.9%) |
| 20 to 24 Year Olds | 595 (96.0%) | 25 (4.0%) |
| 25 to 34 Year Olds | 617 (79.1%) | 163 (20.9%) |
| 35 Years and over | 440 (87.1%) | 65 (12.9%) |
| Total | 9,334 (91.6%) | 856 (8.4%) |
Educational Attainment by Field of Study in Foothill Farms
Business (939 | 22.9%), arts & humanities (542 | 13.2%), science & technology (401 | 9.8%), bio, nature & agricultural (391 | 9.6%), and social sciences (371 | 9.1%) are the most common fields of study among 4,094 individuals in Foothill Farms who have obtained a bachelor's degree or higher.
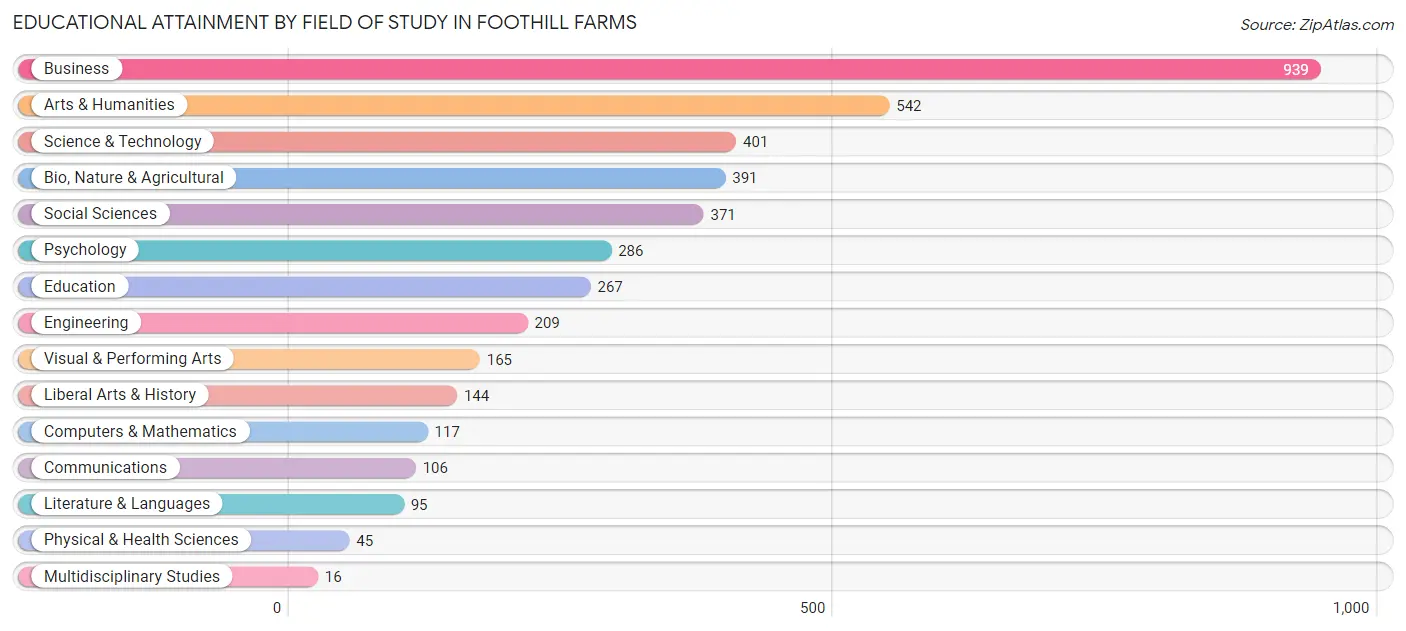
| Field of Study | # Graduates | % Graduates |
| Computers & Mathematics | 117 | 2.9% |
| Bio, Nature & Agricultural | 391 | 9.6% |
| Physical & Health Sciences | 45 | 1.1% |
| Psychology | 286 | 7.0% |
| Social Sciences | 371 | 9.1% |
| Engineering | 209 | 5.1% |
| Multidisciplinary Studies | 16 | 0.4% |
| Science & Technology | 401 | 9.8% |
| Business | 939 | 22.9% |
| Education | 267 | 6.5% |
| Literature & Languages | 95 | 2.3% |
| Liberal Arts & History | 144 | 3.5% |
| Visual & Performing Arts | 165 | 4.0% |
| Communications | 106 | 2.6% |
| Arts & Humanities | 542 | 13.2% |
| Total | 4,094 | 100.0% |
Transportation & Commute in Foothill Farms
Vehicle Availability by Sex in Foothill Farms
The most prevalent vehicle ownership categories in Foothill Farms are males with 2 vehicles (3,938, accounting for 45.3%) and females with 2 vehicles (2,707, making up 56.0%).
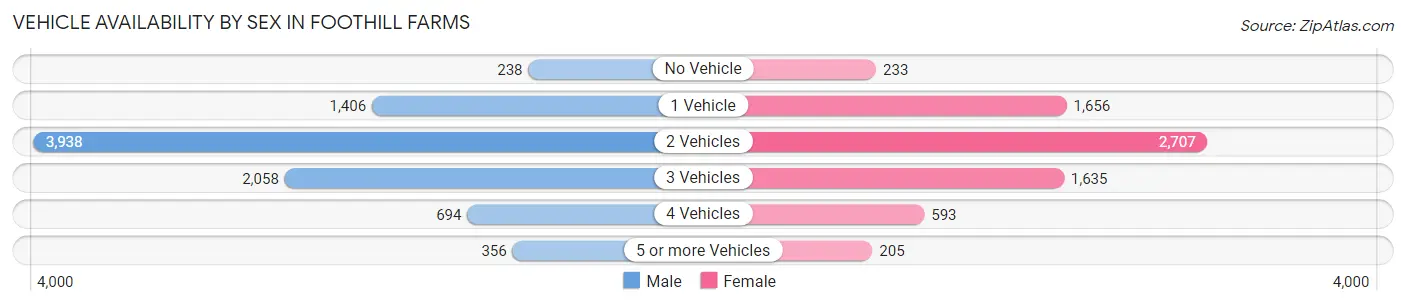
| Vehicles Available | Male | Female |
| No Vehicle | 238 (2.7%) | 233 (3.3%) |
| 1 Vehicle | 1,406 (16.2%) | 1,656 (23.6%) |
| 2 Vehicles | 3,938 (45.3%) | 2,707 (38.5%) |
| 3 Vehicles | 2,058 (23.7%) | 1,635 (23.3%) |
| 4 Vehicles | 694 (8.0%) | 593 (8.4%) |
| 5 or more Vehicles | 356 (4.1%) | 205 (2.9%) |
| Total | 8,690 (100.0%) | 7,029 (100.0%) |
Commute Time in Foothill Farms
The most frequently occuring commute durations in Foothill Farms are 20 to 24 minutes (2,704 commuters, 19.4%), 30 to 34 minutes (2,407 commuters, 17.2%), and 15 to 19 minutes (1,971 commuters, 14.1%).
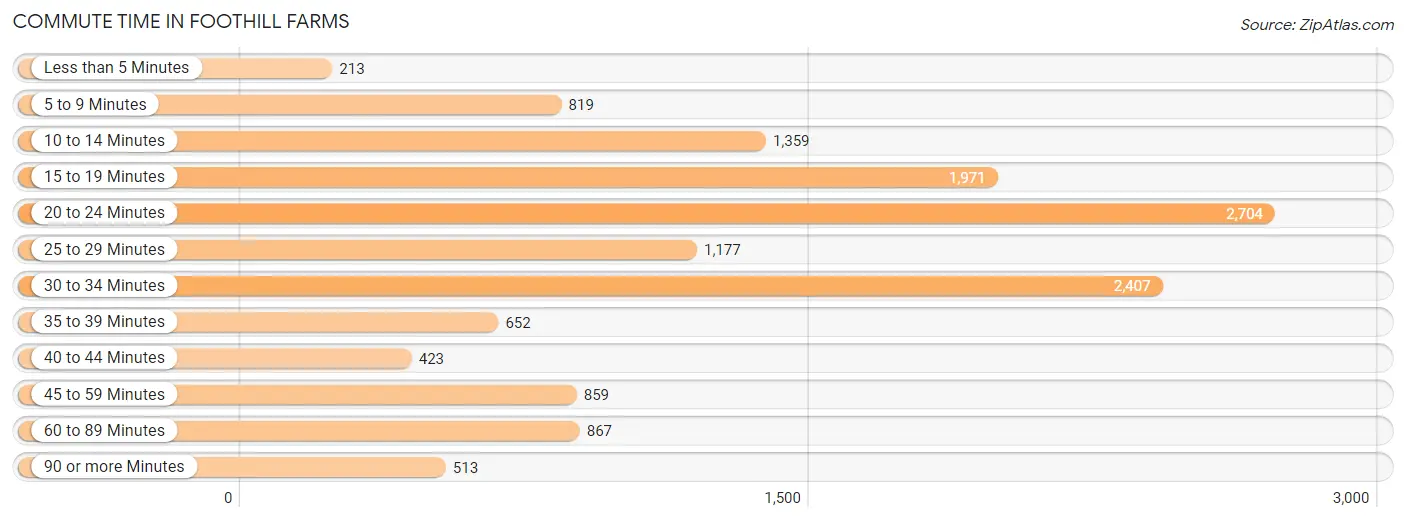
| Commute Time | # Commuters | % Commuters |
| Less than 5 Minutes | 213 | 1.5% |
| 5 to 9 Minutes | 819 | 5.9% |
| 10 to 14 Minutes | 1,359 | 9.7% |
| 15 to 19 Minutes | 1,971 | 14.1% |
| 20 to 24 Minutes | 2,704 | 19.4% |
| 25 to 29 Minutes | 1,177 | 8.4% |
| 30 to 34 Minutes | 2,407 | 17.2% |
| 35 to 39 Minutes | 652 | 4.7% |
| 40 to 44 Minutes | 423 | 3.0% |
| 45 to 59 Minutes | 859 | 6.1% |
| 60 to 89 Minutes | 867 | 6.2% |
| 90 or more Minutes | 513 | 3.7% |
Commute Time by Sex in Foothill Farms
The most common commute times in Foothill Farms are 30 to 34 minutes (1,543 commuters, 19.6%) for males and 20 to 24 minutes (1,395 commuters, 22.9%) for females.
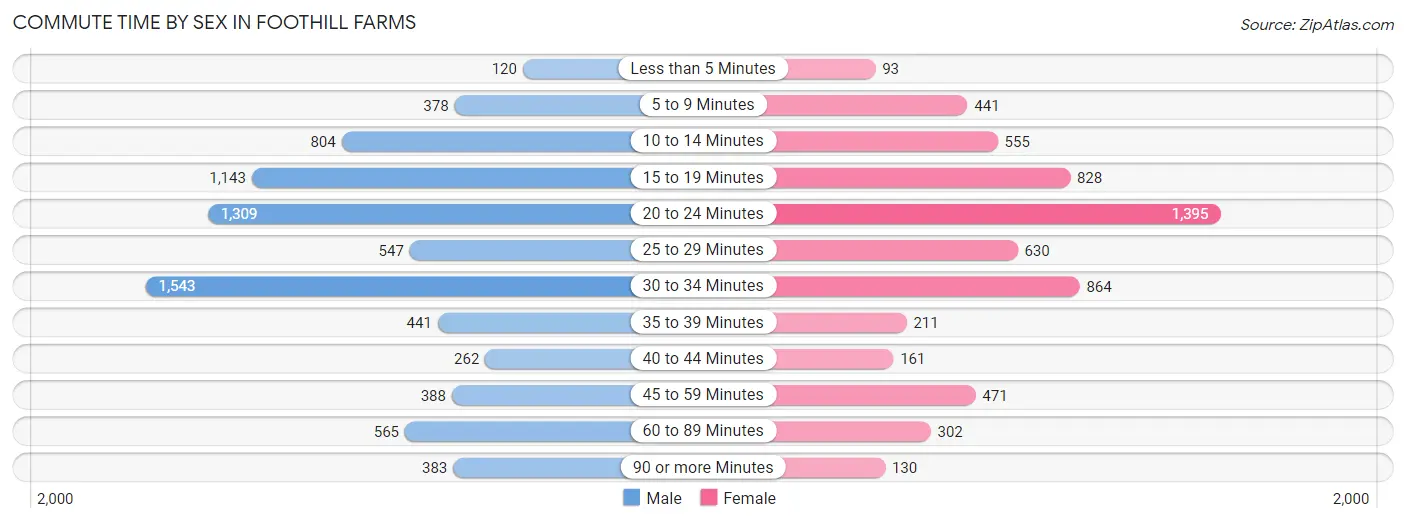
| Commute Time | Male | Female |
| Less than 5 Minutes | 120 (1.5%) | 93 (1.5%) |
| 5 to 9 Minutes | 378 (4.8%) | 441 (7.2%) |
| 10 to 14 Minutes | 804 (10.2%) | 555 (9.1%) |
| 15 to 19 Minutes | 1,143 (14.5%) | 828 (13.6%) |
| 20 to 24 Minutes | 1,309 (16.6%) | 1,395 (22.9%) |
| 25 to 29 Minutes | 547 (6.9%) | 630 (10.4%) |
| 30 to 34 Minutes | 1,543 (19.6%) | 864 (14.2%) |
| 35 to 39 Minutes | 441 (5.6%) | 211 (3.5%) |
| 40 to 44 Minutes | 262 (3.3%) | 161 (2.6%) |
| 45 to 59 Minutes | 388 (4.9%) | 471 (7.7%) |
| 60 to 89 Minutes | 565 (7.2%) | 302 (5.0%) |
| 90 or more Minutes | 383 (4.9%) | 130 (2.1%) |
Time of Departure to Work by Sex in Foothill Farms
The most frequent times of departure to work in Foothill Farms are 7:00 AM to 7:29 AM (1,009, 12.8%) for males and 7:00 AM to 7:29 AM (873, 14.4%) for females.
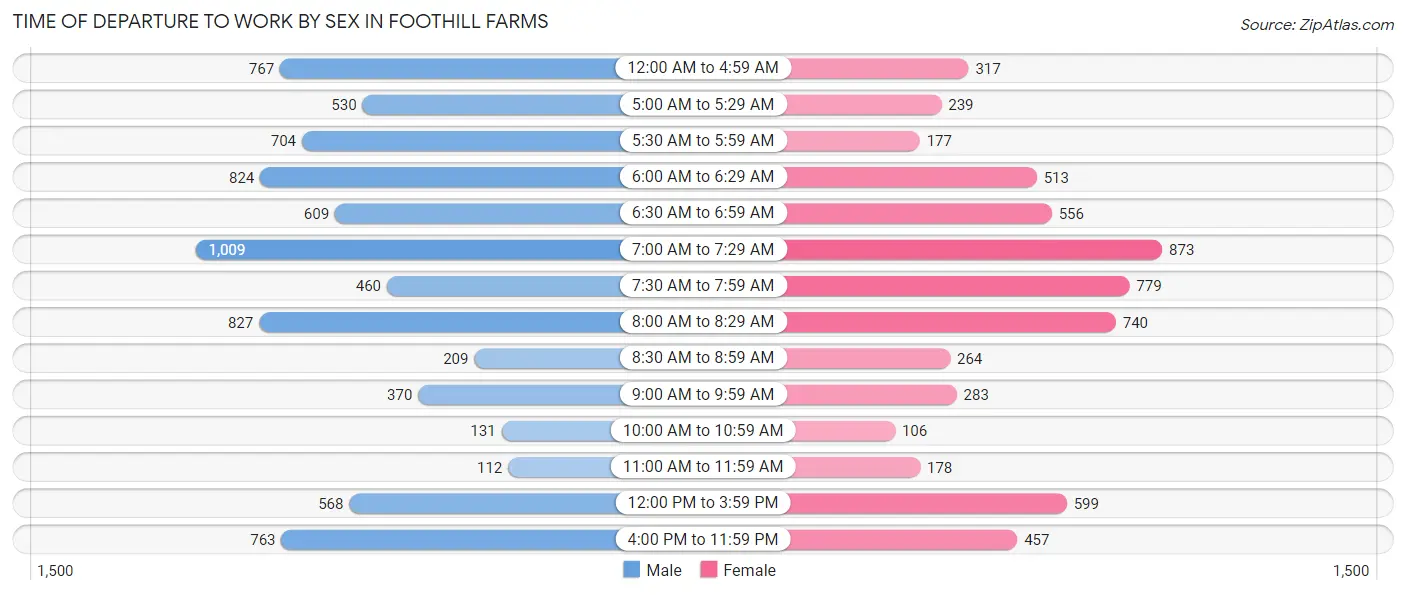
| Time of Departure | Male | Female |
| 12:00 AM to 4:59 AM | 767 (9.7%) | 317 (5.2%) |
| 5:00 AM to 5:29 AM | 530 (6.7%) | 239 (3.9%) |
| 5:30 AM to 5:59 AM | 704 (8.9%) | 177 (2.9%) |
| 6:00 AM to 6:29 AM | 824 (10.4%) | 513 (8.4%) |
| 6:30 AM to 6:59 AM | 609 (7.7%) | 556 (9.1%) |
| 7:00 AM to 7:29 AM | 1,009 (12.8%) | 873 (14.4%) |
| 7:30 AM to 7:59 AM | 460 (5.8%) | 779 (12.8%) |
| 8:00 AM to 8:29 AM | 827 (10.5%) | 740 (12.2%) |
| 8:30 AM to 8:59 AM | 209 (2.6%) | 264 (4.3%) |
| 9:00 AM to 9:59 AM | 370 (4.7%) | 283 (4.6%) |
| 10:00 AM to 10:59 AM | 131 (1.7%) | 106 (1.7%) |
| 11:00 AM to 11:59 AM | 112 (1.4%) | 178 (2.9%) |
| 12:00 PM to 3:59 PM | 568 (7.2%) | 599 (9.9%) |
| 4:00 PM to 11:59 PM | 763 (9.7%) | 457 (7.5%) |
| Total | 7,883 (100.0%) | 6,081 (100.0%) |
Housing Occupancy in Foothill Farms
Occupancy by Ownership in Foothill Farms
Of the total 12,653 dwellings in Foothill Farms, owner-occupied units account for 6,412 (50.7%), while renter-occupied units make up 6,241 (49.3%).
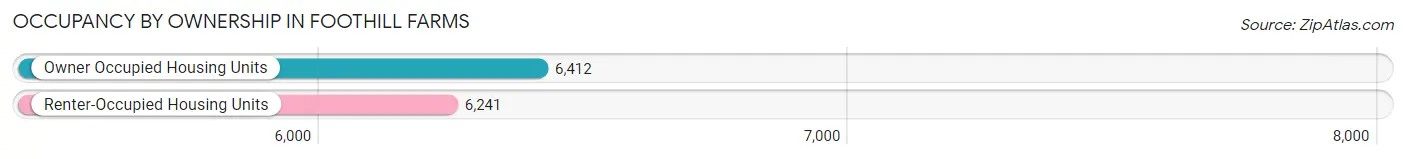
| Occupancy | # Housing Units | % Housing Units |
| Owner Occupied Housing Units | 6,412 | 50.7% |
| Renter-Occupied Housing Units | 6,241 | 49.3% |
| Total Occupied Housing Units | 12,653 | 100.0% |
Occupancy by Household Size in Foothill Farms
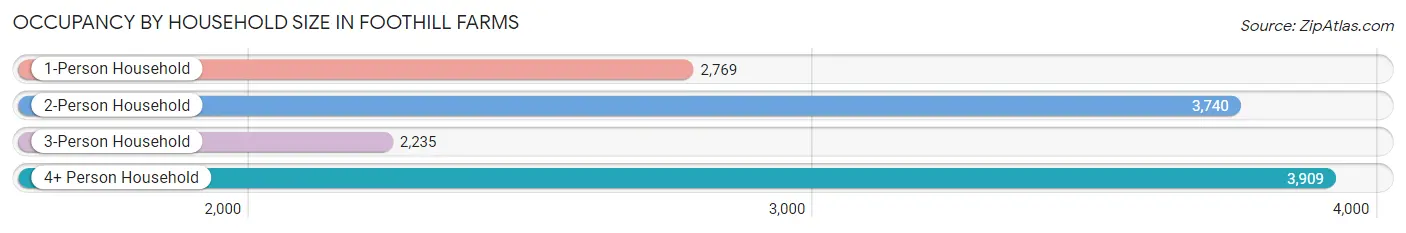
| Household Size | # Housing Units | % Housing Units |
| 1-Person Household | 2,769 | 21.9% |
| 2-Person Household | 3,740 | 29.6% |
| 3-Person Household | 2,235 | 17.7% |
| 4+ Person Household | 3,909 | 30.9% |
| Total Housing Units | 12,653 | 100.0% |
Occupancy by Ownership by Household Size in Foothill Farms
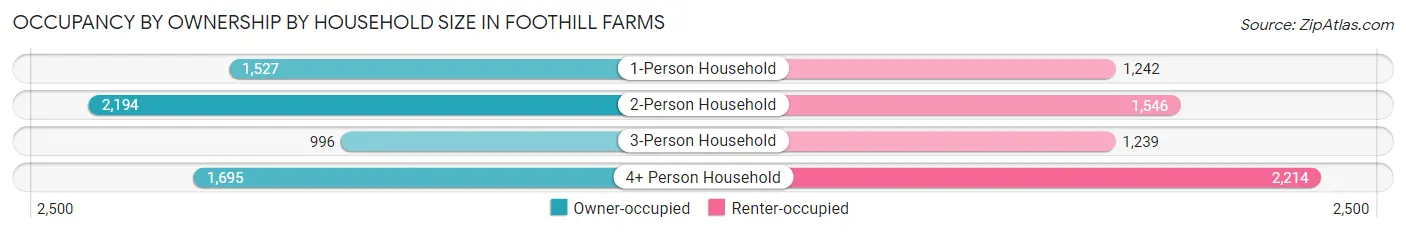
| Household Size | Owner-occupied | Renter-occupied |
| 1-Person Household | 1,527 (55.1%) | 1,242 (44.9%) |
| 2-Person Household | 2,194 (58.7%) | 1,546 (41.3%) |
| 3-Person Household | 996 (44.6%) | 1,239 (55.4%) |
| 4+ Person Household | 1,695 (43.4%) | 2,214 (56.6%) |
| Total Housing Units | 6,412 (50.7%) | 6,241 (49.3%) |
Occupancy by Educational Attainment in Foothill Farms
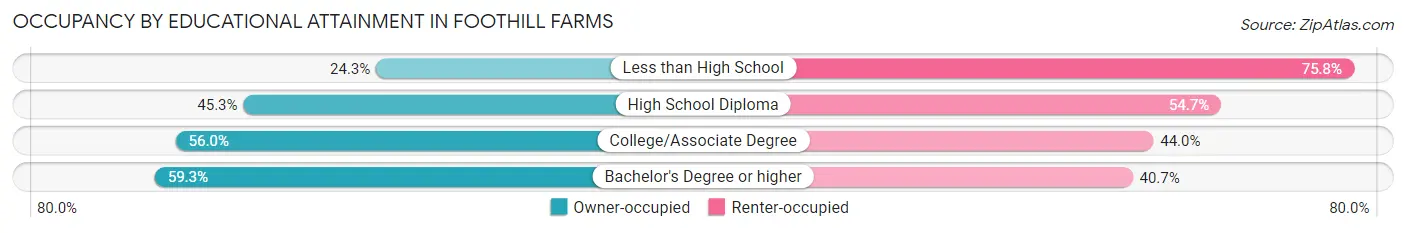
| Household Size | Owner-occupied | Renter-occupied |
| Less than High School | 306 (24.2%) | 956 (75.7%) |
| High School Diploma | 1,504 (45.3%) | 1,816 (54.7%) |
| College/Associate Degree | 3,182 (56.0%) | 2,496 (44.0%) |
| Bachelor's Degree or higher | 1,420 (59.3%) | 973 (40.7%) |
Occupancy by Age of Householder in Foothill Farms
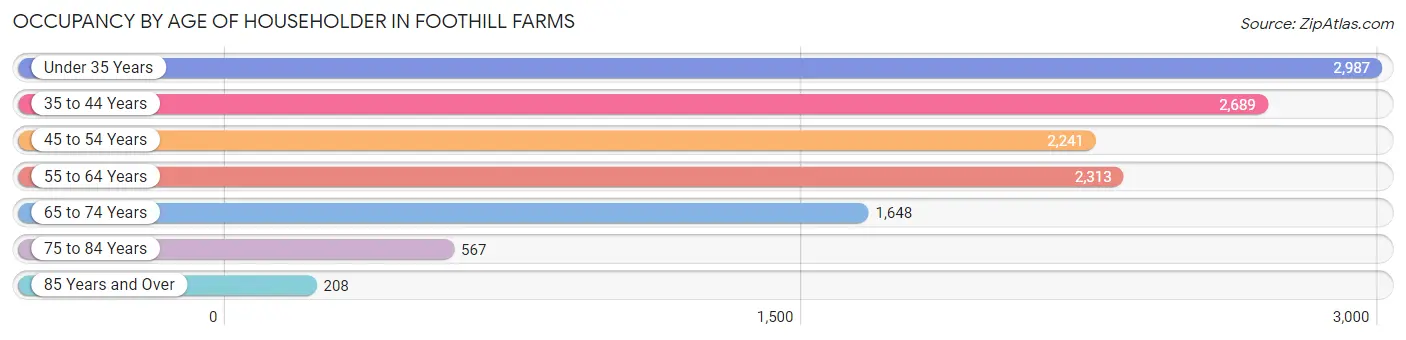
| Age Bracket | # Households | % Households |
| Under 35 Years | 2,987 | 23.6% |
| 35 to 44 Years | 2,689 | 21.2% |
| 45 to 54 Years | 2,241 | 17.7% |
| 55 to 64 Years | 2,313 | 18.3% |
| 65 to 74 Years | 1,648 | 13.0% |
| 75 to 84 Years | 567 | 4.5% |
| 85 Years and Over | 208 | 1.6% |
| Total | 12,653 | 100.0% |
Housing Finances in Foothill Farms
Median Income by Occupancy in Foothill Farms
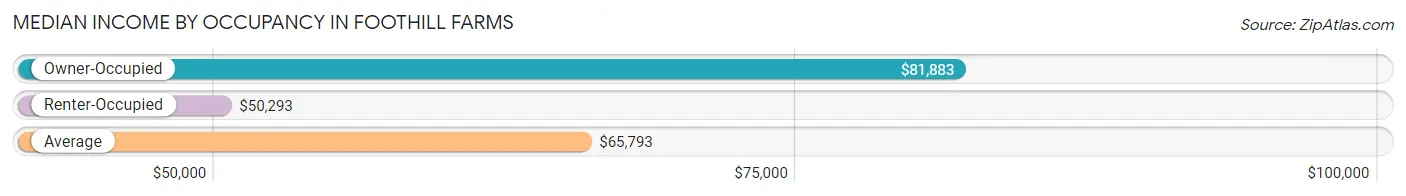
| Occupancy Type | # Households | Median Income |
| Owner-Occupied | 6,412 (50.7%) | $81,883 |
| Renter-Occupied | 6,241 (49.3%) | $50,293 |
| Average | 12,653 (100.0%) | $65,793 |
Occupancy by Householder Income Bracket in Foothill Farms
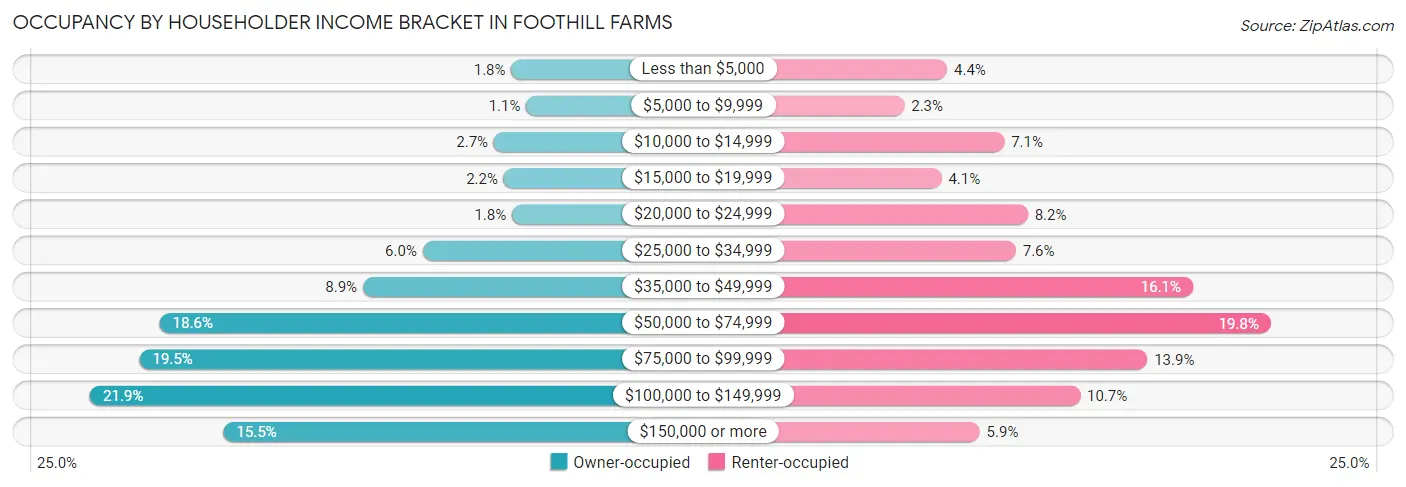
| Income Bracket | Owner-occupied | Renter-occupied |
| Less than $5,000 | 117 (1.8%) | 272 (4.4%) |
| $5,000 to $9,999 | 71 (1.1%) | 145 (2.3%) |
| $10,000 to $14,999 | 170 (2.6%) | 442 (7.1%) |
| $15,000 to $19,999 | 140 (2.2%) | 255 (4.1%) |
| $20,000 to $24,999 | 115 (1.8%) | 512 (8.2%) |
| $25,000 to $34,999 | 387 (6.0%) | 476 (7.6%) |
| $35,000 to $49,999 | 570 (8.9%) | 1,002 (16.1%) |
| $50,000 to $74,999 | 1,191 (18.6%) | 1,234 (19.8%) |
| $75,000 to $99,999 | 1,252 (19.5%) | 867 (13.9%) |
| $100,000 to $149,999 | 1,403 (21.9%) | 667 (10.7%) |
| $150,000 or more | 996 (15.5%) | 369 (5.9%) |
| Total | 6,412 (100.0%) | 6,241 (100.0%) |
Monthly Housing Cost Tiers in Foothill Farms
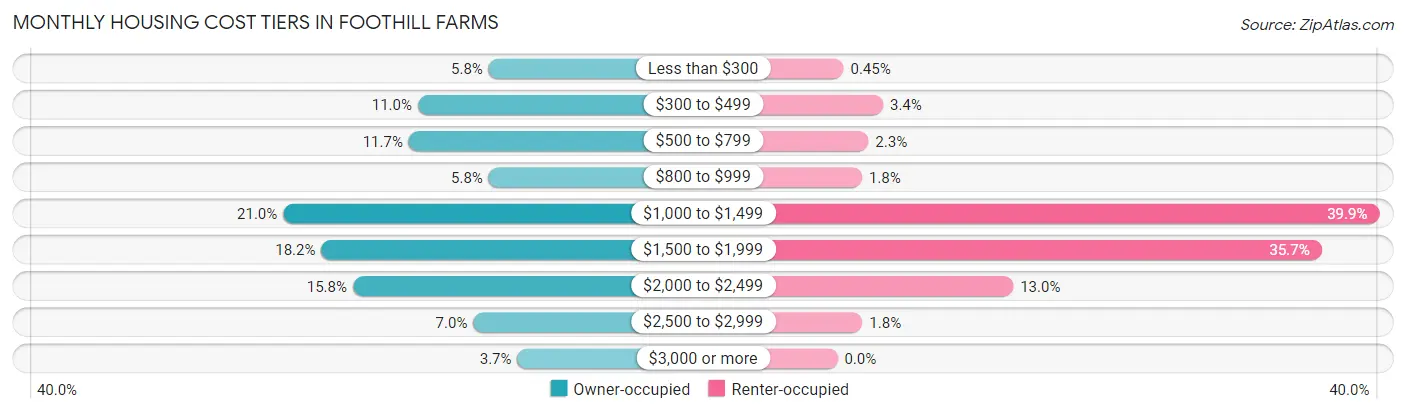
| Monthly Cost | Owner-occupied | Renter-occupied |
| Less than $300 | 373 (5.8%) | 28 (0.4%) |
| $300 to $499 | 708 (11.0%) | 210 (3.4%) |
| $500 to $799 | 751 (11.7%) | 142 (2.3%) |
| $800 to $999 | 373 (5.8%) | 113 (1.8%) |
| $1,000 to $1,499 | 1,344 (21.0%) | 2,490 (39.9%) |
| $1,500 to $1,999 | 1,164 (18.1%) | 2,225 (35.6%) |
| $2,000 to $2,499 | 1,015 (15.8%) | 808 (13.0%) |
| $2,500 to $2,999 | 446 (7.0%) | 115 (1.8%) |
| $3,000 or more | 238 (3.7%) | 0 (0.0%) |
| Total | 6,412 (100.0%) | 6,241 (100.0%) |
Physical Housing Characteristics in Foothill Farms
Housing Structures in Foothill Farms
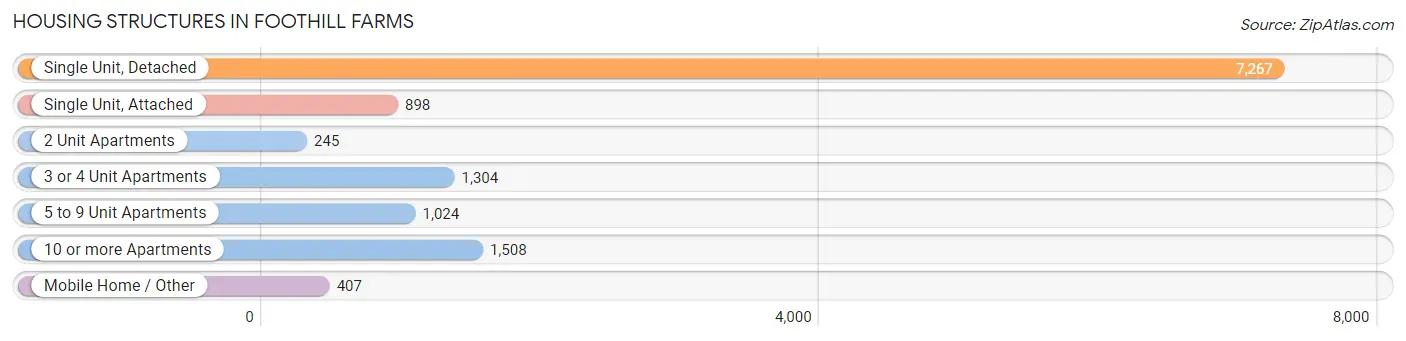
| Structure Type | # Housing Units | % Housing Units |
| Single Unit, Detached | 7,267 | 57.4% |
| Single Unit, Attached | 898 | 7.1% |
| 2 Unit Apartments | 245 | 1.9% |
| 3 or 4 Unit Apartments | 1,304 | 10.3% |
| 5 to 9 Unit Apartments | 1,024 | 8.1% |
| 10 or more Apartments | 1,508 | 11.9% |
| Mobile Home / Other | 407 | 3.2% |
| Total | 12,653 | 100.0% |
Housing Structures by Occupancy in Foothill Farms
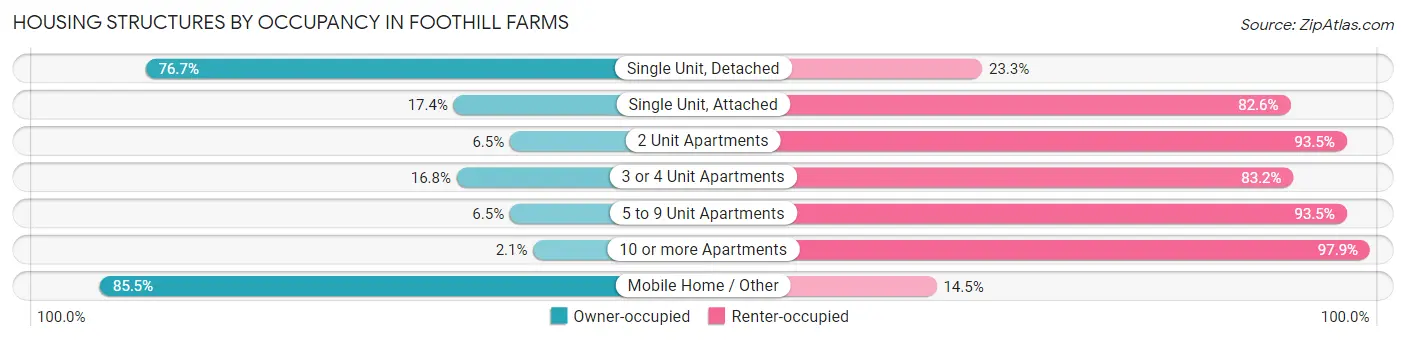
| Structure Type | Owner-occupied | Renter-occupied |
| Single Unit, Detached | 5,575 (76.7%) | 1,692 (23.3%) |
| Single Unit, Attached | 156 (17.4%) | 742 (82.6%) |
| 2 Unit Apartments | 16 (6.5%) | 229 (93.5%) |
| 3 or 4 Unit Apartments | 219 (16.8%) | 1,085 (83.2%) |
| 5 to 9 Unit Apartments | 67 (6.5%) | 957 (93.5%) |
| 10 or more Apartments | 31 (2.1%) | 1,477 (97.9%) |
| Mobile Home / Other | 348 (85.5%) | 59 (14.5%) |
| Total | 6,412 (50.7%) | 6,241 (49.3%) |
Housing Structures by Number of Rooms in Foothill Farms
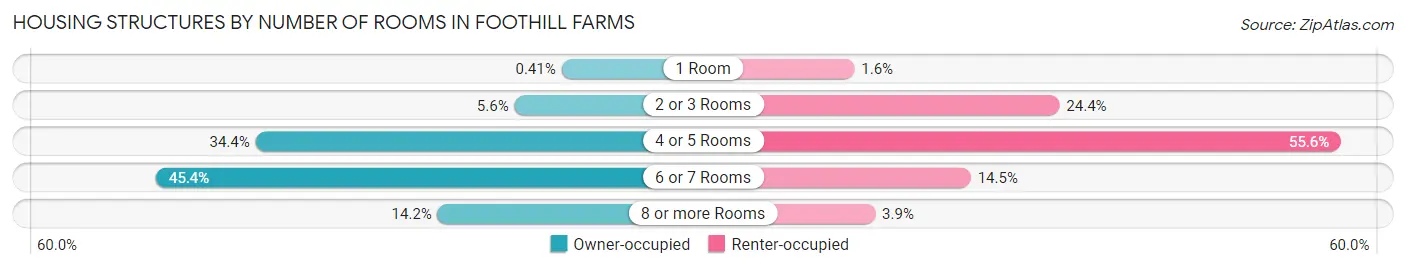
| Number of Rooms | Owner-occupied | Renter-occupied |
| 1 Room | 26 (0.4%) | 100 (1.6%) |
| 2 or 3 Rooms | 361 (5.6%) | 1,520 (24.4%) |
| 4 or 5 Rooms | 2,204 (34.4%) | 3,471 (55.6%) |
| 6 or 7 Rooms | 2,913 (45.4%) | 906 (14.5%) |
| 8 or more Rooms | 908 (14.2%) | 244 (3.9%) |
| Total | 6,412 (100.0%) | 6,241 (100.0%) |
Housing Structure by Heating Type in Foothill Farms
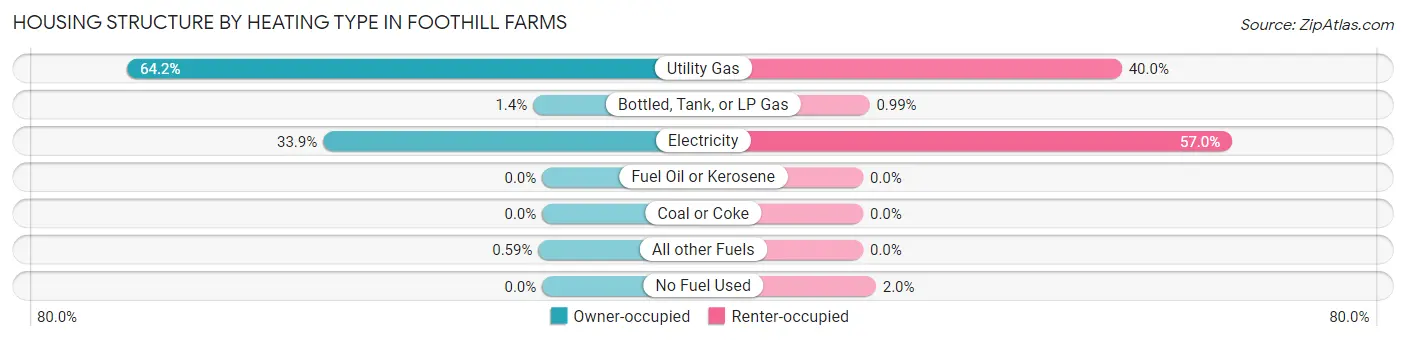
| Heating Type | Owner-occupied | Renter-occupied |
| Utility Gas | 4,113 (64.1%) | 2,496 (40.0%) |
| Bottled, Tank, or LP Gas | 90 (1.4%) | 62 (1.0%) |
| Electricity | 2,171 (33.9%) | 3,560 (57.0%) |
| Fuel Oil or Kerosene | 0 (0.0%) | 0 (0.0%) |
| Coal or Coke | 0 (0.0%) | 0 (0.0%) |
| All other Fuels | 38 (0.6%) | 0 (0.0%) |
| No Fuel Used | 0 (0.0%) | 123 (2.0%) |
| Total | 6,412 (100.0%) | 6,241 (100.0%) |
Household Vehicle Usage in Foothill Farms
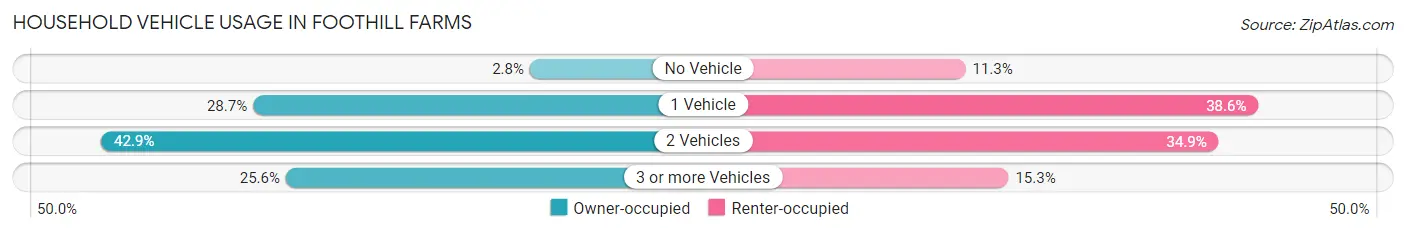
| Vehicles per Household | Owner-occupied | Renter-occupied |
| No Vehicle | 182 (2.8%) | 703 (11.3%) |
| 1 Vehicle | 1,839 (28.7%) | 2,408 (38.6%) |
| 2 Vehicles | 2,748 (42.9%) | 2,177 (34.9%) |
| 3 or more Vehicles | 1,643 (25.6%) | 953 (15.3%) |
| Total | 6,412 (100.0%) | 6,241 (100.0%) |
Real Estate & Mortgages in Foothill Farms
Real Estate and Mortgage Overview in Foothill Farms
| Characteristic | Without Mortgage | With Mortgage |
| Housing Units | 1,925 | 4,487 |
| Median Property Value | $313,100 | $352,400 |
| Median Household Income | $70,125 | $794 |
| Monthly Housing Costs | $473 | $193 |
| Real Estate Taxes | $1,362 | $130 |
Property Value by Mortgage Status in Foothill Farms
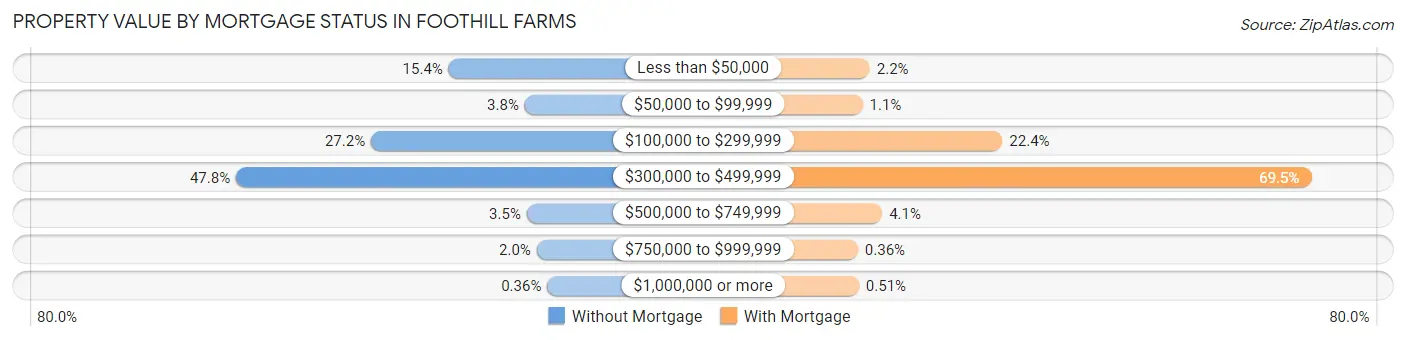
| Property Value | Without Mortgage | With Mortgage |
| Less than $50,000 | 296 (15.4%) | 98 (2.2%) |
| $50,000 to $99,999 | 73 (3.8%) | 48 (1.1%) |
| $100,000 to $299,999 | 524 (27.2%) | 1,004 (22.4%) |
| $300,000 to $499,999 | 920 (47.8%) | 3,116 (69.5%) |
| $500,000 to $749,999 | 67 (3.5%) | 182 (4.1%) |
| $750,000 to $999,999 | 38 (2.0%) | 16 (0.4%) |
| $1,000,000 or more | 7 (0.4%) | 23 (0.5%) |
| Total | 1,925 (100.0%) | 4,487 (100.0%) |
Household Income by Mortgage Status in Foothill Farms
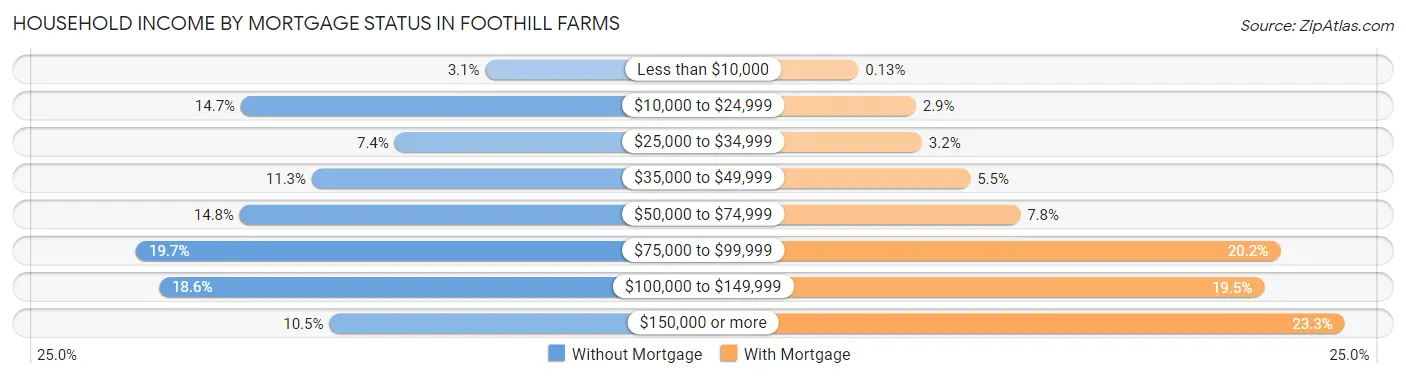
| Household Income | Without Mortgage | With Mortgage |
| Less than $10,000 | 59 (3.1%) | 6 (0.1%) |
| $10,000 to $24,999 | 283 (14.7%) | 129 (2.9%) |
| $25,000 to $34,999 | 142 (7.4%) | 142 (3.2%) |
| $35,000 to $49,999 | 218 (11.3%) | 245 (5.5%) |
| $50,000 to $74,999 | 284 (14.7%) | 352 (7.8%) |
| $75,000 to $99,999 | 379 (19.7%) | 907 (20.2%) |
| $100,000 to $149,999 | 358 (18.6%) | 873 (19.5%) |
| $150,000 or more | 202 (10.5%) | 1,045 (23.3%) |
| Total | 1,925 (100.0%) | 4,487 (100.0%) |
Property Value to Household Income Ratio in Foothill Farms
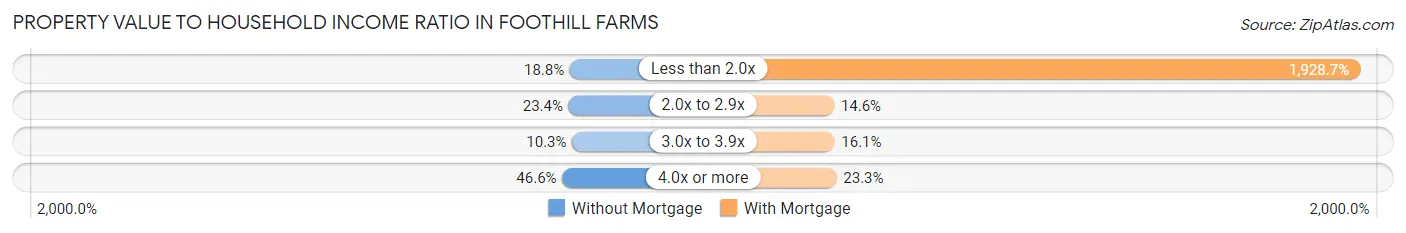
| Value-to-Income Ratio | Without Mortgage | With Mortgage |
| Less than 2.0x | 362 (18.8%) | 86,541 (1,928.7%) |
| 2.0x to 2.9x | 451 (23.4%) | 656 (14.6%) |
| 3.0x to 3.9x | 199 (10.3%) | 722 (16.1%) |
| 4.0x or more | 897 (46.6%) | 1,044 (23.3%) |
| Total | 1,925 (100.0%) | 4,487 (100.0%) |
Real Estate Taxes by Mortgage Status in Foothill Farms
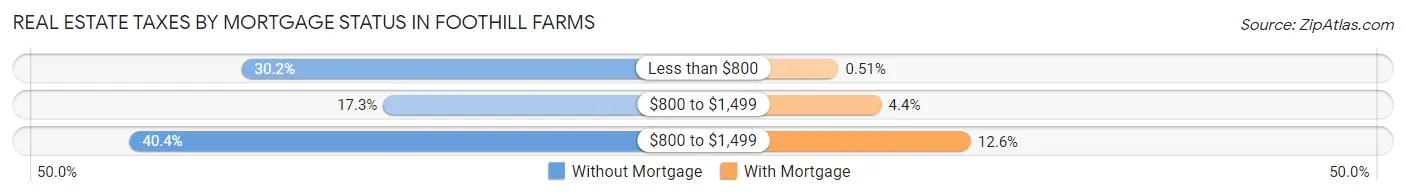
| Property Taxes | Without Mortgage | With Mortgage |
| Less than $800 | 581 (30.2%) | 23 (0.5%) |
| $800 to $1,499 | 332 (17.2%) | 199 (4.4%) |
| $800 to $1,499 | 778 (40.4%) | 565 (12.6%) |
| Total | 1,925 (100.0%) | 4,487 (100.0%) |
Health & Disability in Foothill Farms
Health Insurance Coverage by Age in Foothill Farms
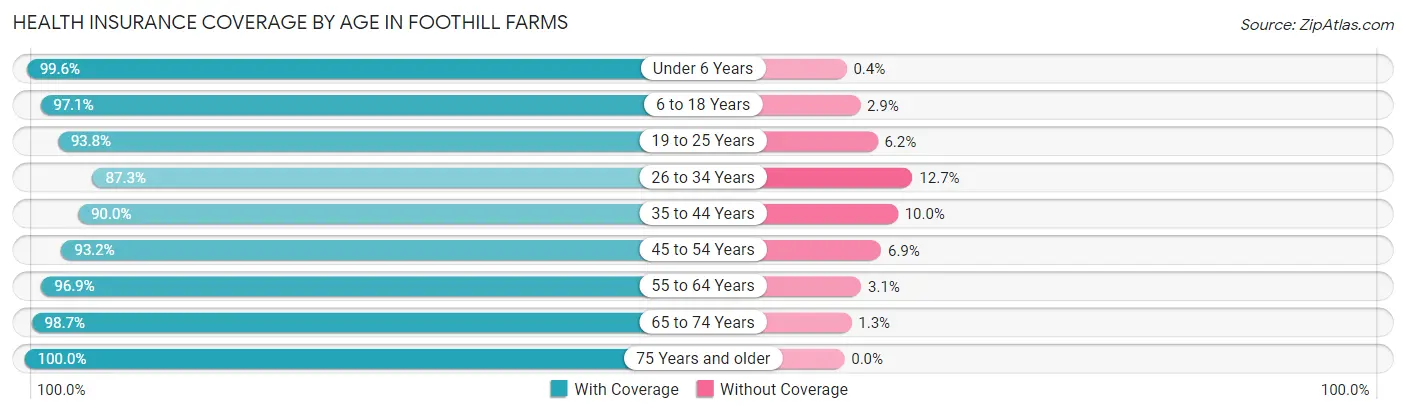
| Age Bracket | With Coverage | Without Coverage |
| Under 6 Years | 3,760 (99.6%) | 15 (0.4%) |
| 6 to 18 Years | 7,312 (97.1%) | 221 (2.9%) |
| 19 to 25 Years | 2,884 (93.8%) | 190 (6.2%) |
| 26 to 34 Years | 5,273 (87.3%) | 767 (12.7%) |
| 35 to 44 Years | 4,620 (90.0%) | 511 (10.0%) |
| 45 to 54 Years | 3,578 (93.1%) | 263 (6.9%) |
| 55 to 64 Years | 4,020 (96.9%) | 130 (3.1%) |
| 65 to 74 Years | 2,541 (98.7%) | 34 (1.3%) |
| 75 Years and older | 1,491 (100.0%) | 0 (0.0%) |
| Total | 35,479 (94.3%) | 2,131 (5.7%) |
Health Insurance Coverage by Citizenship Status in Foothill Farms
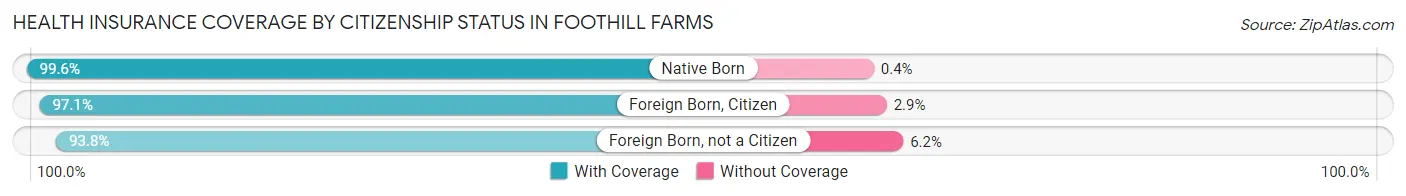
| Citizenship Status | With Coverage | Without Coverage |
| Native Born | 3,760 (99.6%) | 15 (0.4%) |
| Foreign Born, Citizen | 7,312 (97.1%) | 221 (2.9%) |
| Foreign Born, not a Citizen | 2,884 (93.8%) | 190 (6.2%) |
Health Insurance Coverage by Household Income in Foothill Farms
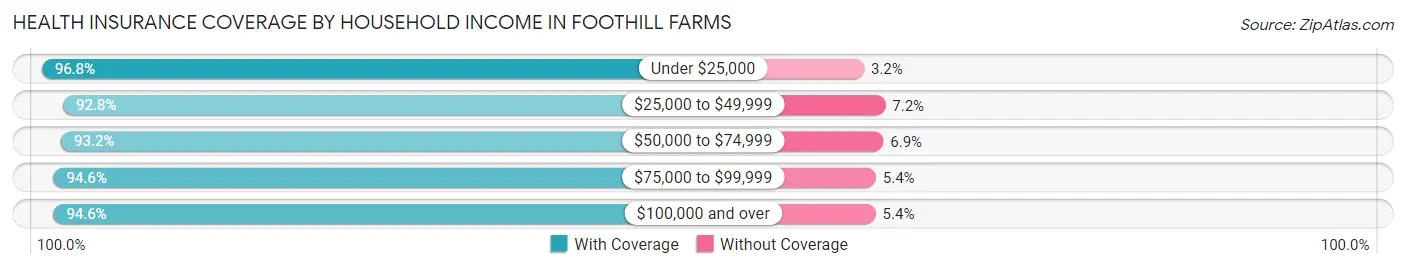
| Household Income | With Coverage | Without Coverage |
| Under $25,000 | 5,339 (96.8%) | 178 (3.2%) |
| $25,000 to $49,999 | 6,170 (92.8%) | 480 (7.2%) |
| $50,000 to $74,999 | 5,939 (93.1%) | 437 (6.9%) |
| $75,000 to $99,999 | 6,443 (94.6%) | 371 (5.4%) |
| $100,000 and over | 11,533 (94.6%) | 659 (5.4%) |
Public vs Private Health Insurance Coverage by Age in Foothill Farms
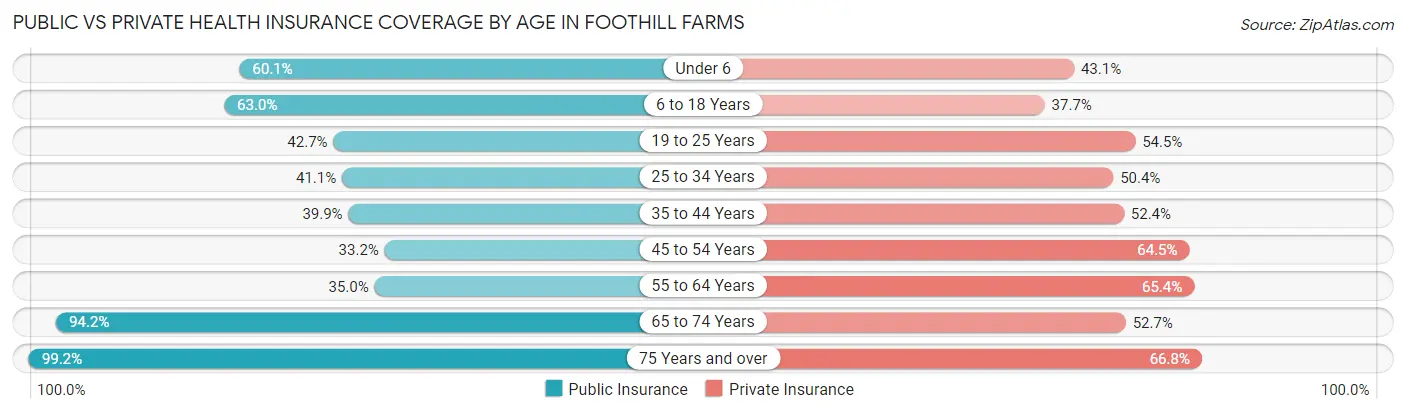
| Age Bracket | Public Insurance | Private Insurance |
| Under 6 | 2,270 (60.1%) | 1,627 (43.1%) |
| 6 to 18 Years | 4,743 (63.0%) | 2,836 (37.7%) |
| 19 to 25 Years | 1,312 (42.7%) | 1,674 (54.5%) |
| 25 to 34 Years | 2,481 (41.1%) | 3,043 (50.4%) |
| 35 to 44 Years | 2,047 (39.9%) | 2,686 (52.3%) |
| 45 to 54 Years | 1,274 (33.2%) | 2,478 (64.5%) |
| 55 to 64 Years | 1,454 (35.0%) | 2,713 (65.4%) |
| 65 to 74 Years | 2,425 (94.2%) | 1,357 (52.7%) |
| 75 Years and over | 1,479 (99.2%) | 996 (66.8%) |
| Total | 19,485 (51.8%) | 19,410 (51.6%) |
Disability Status by Sex by Age in Foothill Farms
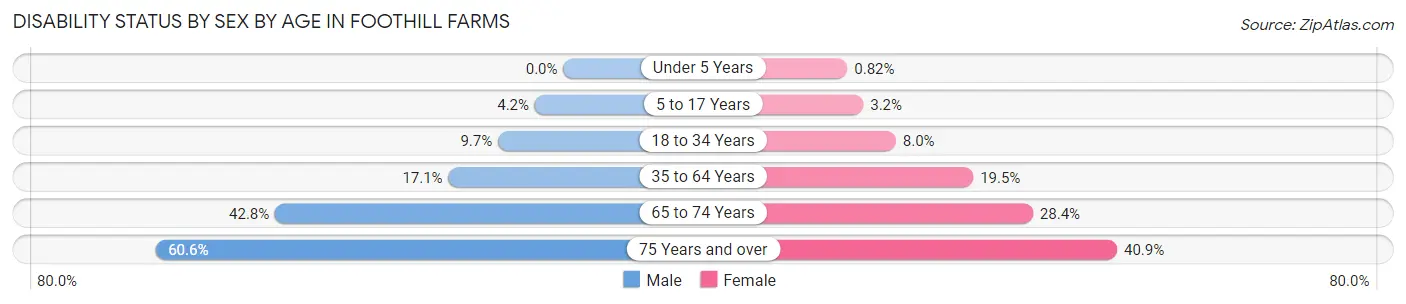
| Age Bracket | Male | Female |
| Under 5 Years | 0 (0.0%) | 12 (0.8%) |
| 5 to 17 Years | 171 (4.2%) | 118 (3.2%) |
| 18 to 34 Years | 447 (9.7%) | 400 (8.0%) |
| 35 to 64 Years | 1,152 (17.1%) | 1,243 (19.5%) |
| 65 to 74 Years | 523 (42.8%) | 384 (28.4%) |
| 75 Years and over | 386 (60.6%) | 349 (40.9%) |
Disability Class by Sex by Age in Foothill Farms
Disability Class: Hearing Difficulty
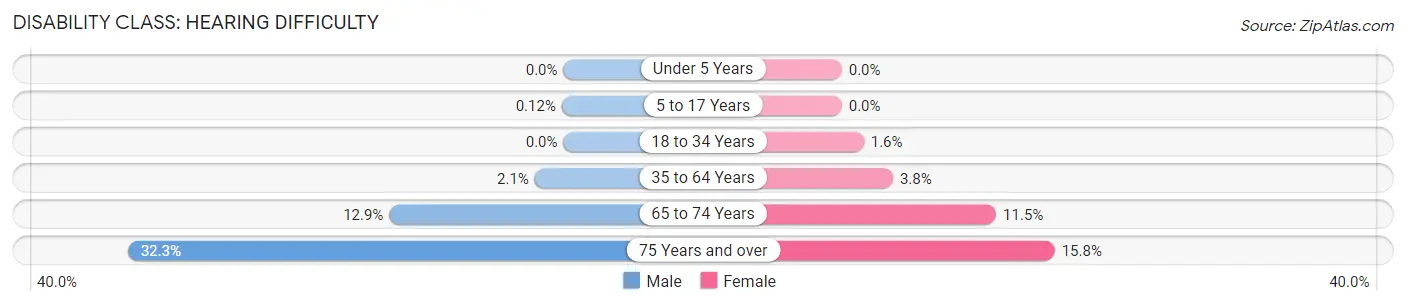
| Age Bracket | Male | Female |
| Under 5 Years | 0 (0.0%) | 0 (0.0%) |
| 5 to 17 Years | 5 (0.1%) | 0 (0.0%) |
| 18 to 34 Years | 0 (0.0%) | 81 (1.6%) |
| 35 to 64 Years | 144 (2.1%) | 242 (3.8%) |
| 65 to 74 Years | 158 (12.9%) | 155 (11.5%) |
| 75 Years and over | 206 (32.3%) | 135 (15.8%) |
Disability Class: Vision Difficulty
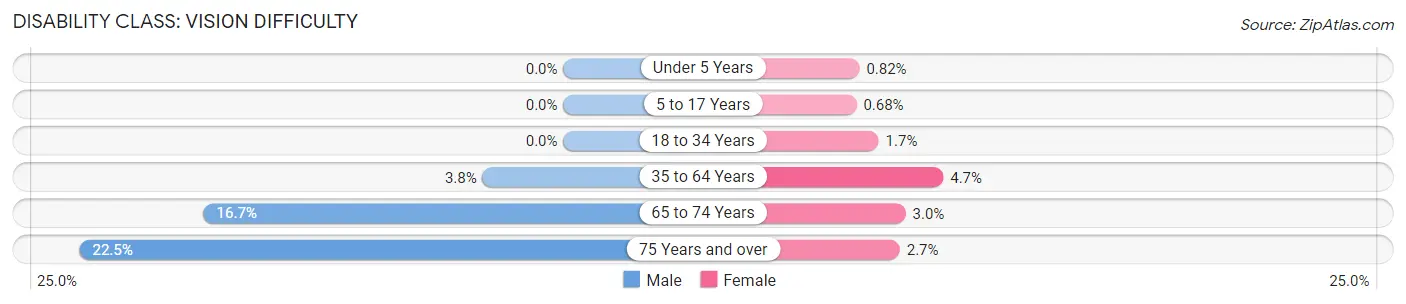
| Age Bracket | Male | Female |
| Under 5 Years | 0 (0.0%) | 12 (0.8%) |
| 5 to 17 Years | 0 (0.0%) | 25 (0.7%) |
| 18 to 34 Years | 0 (0.0%) | 85 (1.7%) |
| 35 to 64 Years | 253 (3.7%) | 300 (4.7%) |
| 65 to 74 Years | 204 (16.7%) | 40 (3.0%) |
| 75 Years and over | 143 (22.5%) | 23 (2.7%) |
Disability Class: Cognitive Difficulty
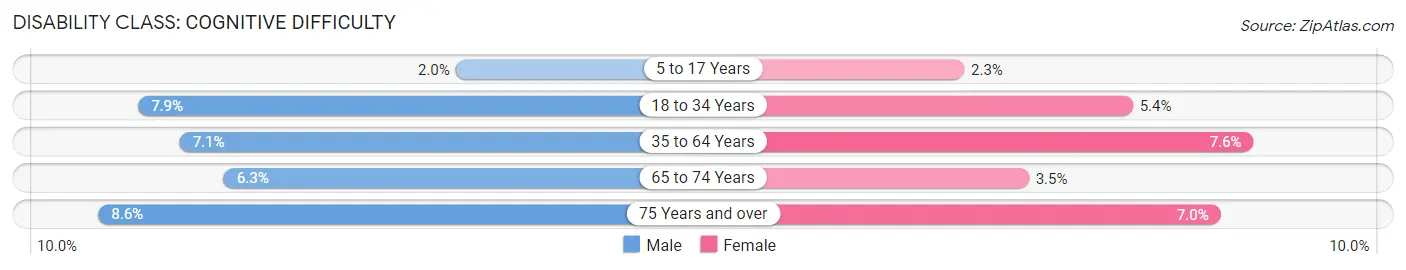
| Age Bracket | Male | Female |
| 5 to 17 Years | 81 (2.0%) | 84 (2.3%) |
| 18 to 34 Years | 364 (7.9%) | 269 (5.4%) |
| 35 to 64 Years | 481 (7.1%) | 487 (7.6%) |
| 65 to 74 Years | 77 (6.3%) | 47 (3.5%) |
| 75 Years and over | 55 (8.6%) | 60 (7.0%) |
Disability Class: Ambulatory Difficulty
| Age Bracket | Male | Female |
| 5 to 17 Years | 0 (0.0%) | 0 (0.0%) |
| 18 to 34 Years | 78 (1.7%) | 88 (1.8%) |
| 35 to 64 Years | 743 (11.0%) | 672 (10.5%) |
| 65 to 74 Years | 340 (27.8%) | 290 (21.4%) |
| 75 Years and over | 153 (24.0%) | 226 (26.5%) |
Disability Class: Self-Care Difficulty
| Age Bracket | Male | Female |
| 5 to 17 Years | 69 (1.7%) | 0 (0.0%) |
| 18 to 34 Years | 73 (1.6%) | 44 (0.9%) |
| 35 to 64 Years | 300 (4.4%) | 122 (1.9%) |
| 65 to 74 Years | 174 (14.2%) | 54 (4.0%) |
| 75 Years and over | 49 (7.7%) | 91 (10.7%) |
Technology Access in Foothill Farms
Computing Device Access in Foothill Farms
| Device Type | # Households | % Households |
| Desktop or Laptop | 10,407 | 82.3% |
| Smartphone | 11,398 | 90.1% |
| Tablet | 8,699 | 68.8% |
| No Computing Device | 564 | 4.5% |
| Total | 12,653 | 100.0% |
Internet Access in Foothill Farms
| Internet Type | # Households | % Households |
| Dial-Up Internet | 18 | 0.1% |
| Broadband Home | 9,605 | 75.9% |
| Cellular Data Only | 1,479 | 11.7% |
| Satellite Internet | 1,156 | 9.1% |
| No Internet | 1,226 | 9.7% |
| Total | 12,653 | 100.0% |
Foothill Farms Summary
Foothill Farms is a census-designated place located in Sacramento County, California. It is situated in the foothills of the Sierra Nevada Mountains, approximately 10 miles northeast of downtown Sacramento. The population was estimated to be 24,837 in 2019.
History
Foothill Farms was originally inhabited by the Maidu and Miwok Native American tribes. The area was first settled by Europeans in the mid-1800s, when gold was discovered in the nearby hills. The area was initially known as “Foothill”, but the name was changed to “Foothill Farms” in the early 1900s.
The area was primarily agricultural until the 1950s, when the population began to grow rapidly due to the influx of people from the Bay Area. The population continued to grow throughout the 1960s and 1970s, and the area was officially incorporated as a city in 1978.
Geography
Foothill Farms is located in the foothills of the Sierra Nevada Mountains, approximately 10 miles northeast of downtown Sacramento. The area is characterized by rolling hills and valleys, with elevations ranging from 200 to 1,000 feet. The climate is mild, with hot summers and cool winters.
The area is home to several parks and recreational areas, including the Foothill Farms Regional Park, which features a lake, picnic areas, and hiking trails.
Economy
Foothill Farms is primarily a residential community, with a few small businesses located in the area. The largest employers in the area are the local school district and the county government.
The median household income in Foothill Farms is $63,845, which is slightly higher than the national average. The unemployment rate is 4.2%, which is lower than the national average.
Demographics
Foothill Farms is a diverse community, with a population that is approximately 60% white, 20% Hispanic, 10% Asian, and 10% African American. The median age is 37, and the median household income is $63,845.
The area is home to a variety of religious denominations, including Christianity, Judaism, Islam, and Buddhism.
Conclusion
Foothill Farms is a census-designated place located in Sacramento County, California. It is situated in the foothills of the Sierra Nevada Mountains, approximately 10 miles northeast of downtown Sacramento. The population was estimated to be 24,837 in 2019. The area was primarily agricultural until the 1950s, when the population began to grow rapidly due to the influx of people from the Bay Area. The area is characterized by rolling hills and valleys, with elevations ranging from 200 to 1,000 feet. The climate is mild, with hot summers and cool winters. Foothill Farms is primarily a residential community, with a few small businesses located in the area. The population is approximately 60% white, 20% Hispanic, 10% Asian, and 10% African American. The median age is 37, and the median household income is $63,845. The area is home to a variety of religious denominations, including Christianity, Judaism, Islam, and Buddhism.
Common Questions
What is Per Capita Income in Foothill Farms?
Per Capita income in Foothill Farms is $26,576.
What is the Median Family Income in Foothill Farms?
Median Family Income in Foothill Farms is $72,027.
What is the Median Household income in Foothill Farms?
Median Household Income in Foothill Farms is $65,793.
What is Income or Wage Gap in Foothill Farms?
Income or Wage Gap in Foothill Farms is 15.3%.
Women in Foothill Farms earn 84.7 cents for every dollar earned by a man.
What is Family Income Deficit in Foothill Farms?
Family Income Deficit in Foothill Farms is $12,622.
Families that are below poverty line in Foothill Farms earn $12,622 less on average than the poverty threshold level.
What is Inequality or Gini Index in Foothill Farms?
Inequality or Gini Index in Foothill Farms is 0.39.
What is the Total Population of Foothill Farms?
Total Population of Foothill Farms is 37,635.
What is the Total Male Population of Foothill Farms?
Total Male Population of Foothill Farms is 18,884.
What is the Total Female Population of Foothill Farms?
Total Female Population of Foothill Farms is 18,751.
What is the Ratio of Males per 100 Females in Foothill Farms?
There are 100.71 Males per 100 Females in Foothill Farms.
What is the Ratio of Females per 100 Males in Foothill Farms?
There are 99.30 Females per 100 Males in Foothill Farms.
What is the Median Population Age in Foothill Farms?
Median Population Age in Foothill Farms is 32.8 Years.
What is the Average Family Size in Foothill Farms
Average Family Size in Foothill Farms is 3.4 People.
What is the Average Household Size in Foothill Farms
Average Household Size in Foothill Farms is 3.0 People.
How Large is the Labor Force in Foothill Farms?
There are 17,472 People in the Labor Forcein in Foothill Farms.
What is the Percentage of People in the Labor Force in Foothill Farms?
63.0% of People are in the Labor Force in Foothill Farms.
What is the Unemployment Rate in Foothill Farms?
Unemployment Rate in Foothill Farms is 7.7%.