Corcoran, CA Map & Demographics
Corcoran Map
Corcoran Overview
$13,798
PER CAPITA INCOME
$57,566
AVG FAMILY INCOME
$53,103
AVG HOUSEHOLD INCOME
16.4%
WAGE / INCOME GAP [ % ]
83.6¢/ $1
WAGE / INCOME GAP [ $ ]
$13,619
FAMILY INCOME DEFICIT
0.44
INEQUALITY / GINI INDEX
22,808
TOTAL POPULATION
14,792
MALE POPULATION
8,016
FEMALE POPULATION
184.53
MALES / 100 FEMALES
54.19
FEMALES / 100 MALES
34.0
MEDIAN AGE
3.8
AVG FAMILY SIZE
3.5
AVG HOUSEHOLD SIZE
6,009
LABOR FORCE [ PEOPLE ]
32.3%
PERCENT IN LABOR FORCE
11.2%
UNEMPLOYMENT RATE
Corcoran Zip Codes
Corcoran Area Codes
Income in Corcoran
Income Overview in Corcoran
Per Capita Income in Corcoran is $13,798, while median incomes of families and households are $57,566 and $53,103 respectively.
| Characteristic | Number | Measure |
| Per Capita Income | 22,808 | $13,798 |
| Median Family Income | 3,496 | $57,566 |
| Mean Family Income | 3,496 | $68,422 |
| Median Household Income | 4,374 | $53,103 |
| Mean Household Income | 4,374 | $64,455 |
| Income Deficit | 3,496 | $13,619 |
| Wage / Income Gap (%) | 22,808 | 16.42% |
| Wage / Income Gap ($) | 22,808 | 83.58¢ per $1 |
| Gini / Inequality Index | 22,808 | 0.44 |
Earnings by Sex in Corcoran
Average Earnings in Corcoran are $32,670, $34,104 for men and $28,503 for women, a difference of 16.4%.
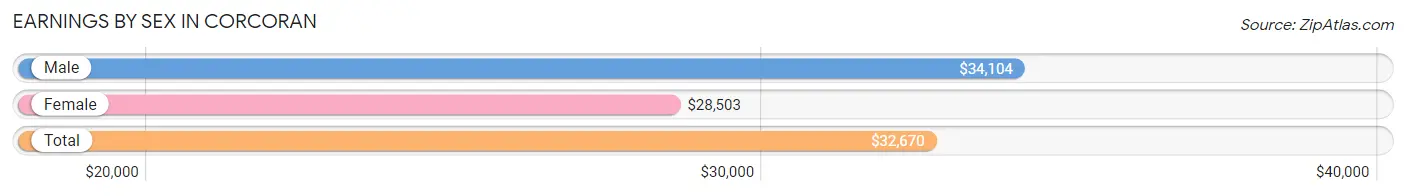
| Sex | Number | Average Earnings |
| Male | 3,526 (57.0%) | $34,104 |
| Female | 2,664 (43.0%) | $28,503 |
| Total | 6,190 (100.0%) | $32,670 |
Earnings by Sex by Income Bracket in Corcoran
The most common earnings brackets in Corcoran are $30,000 to $34,999 for men (471 | 13.4%) and $25,000 to $29,999 for women (300 | 11.3%).
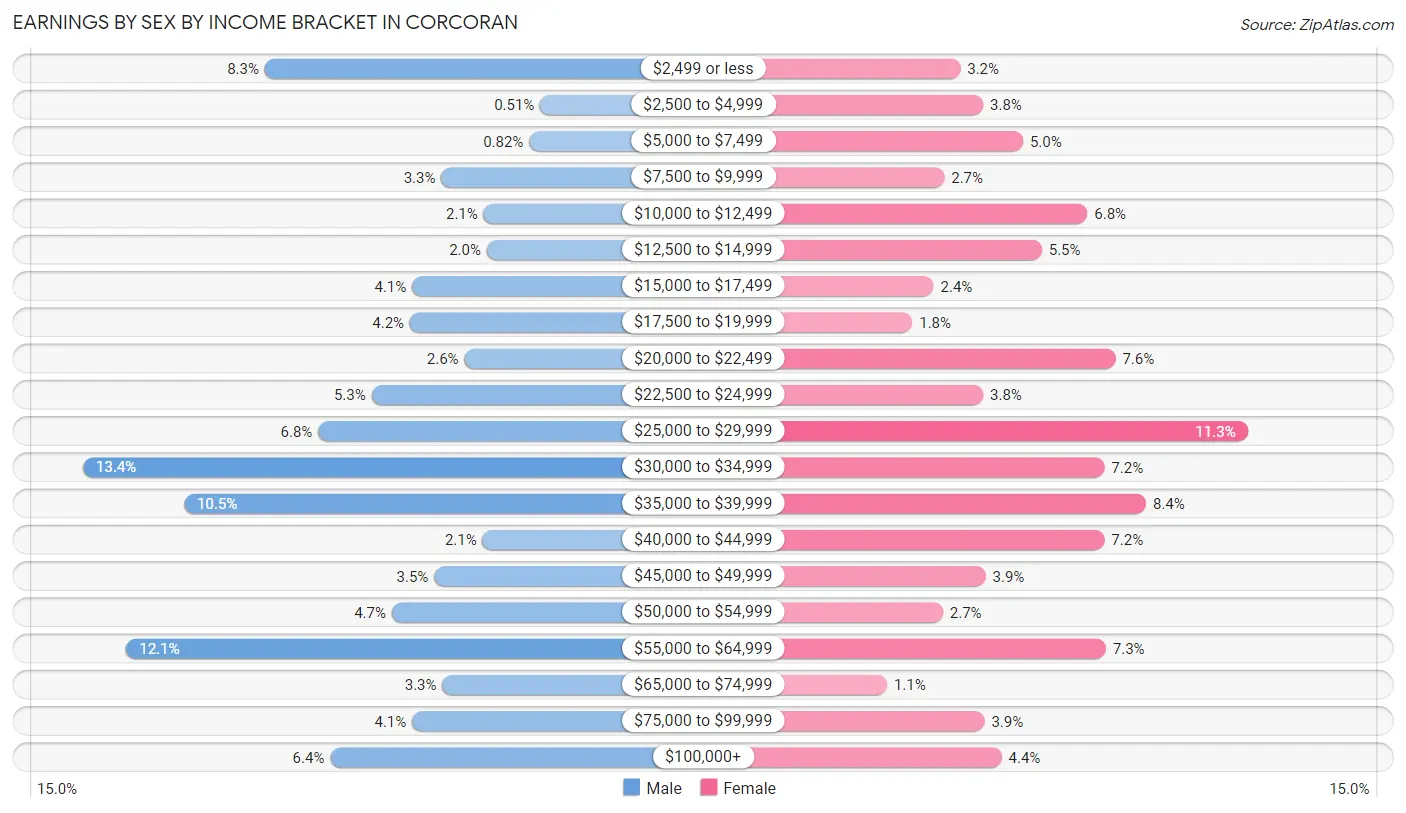
| Income | Male | Female |
| $2,499 or less | 291 (8.3%) | 85 (3.2%) |
| $2,500 to $4,999 | 18 (0.5%) | 102 (3.8%) |
| $5,000 to $7,499 | 29 (0.8%) | 132 (5.0%) |
| $7,500 to $9,999 | 116 (3.3%) | 73 (2.7%) |
| $10,000 to $12,499 | 74 (2.1%) | 180 (6.8%) |
| $12,500 to $14,999 | 71 (2.0%) | 146 (5.5%) |
| $15,000 to $17,499 | 145 (4.1%) | 65 (2.4%) |
| $17,500 to $19,999 | 147 (4.2%) | 49 (1.8%) |
| $20,000 to $22,499 | 93 (2.6%) | 201 (7.5%) |
| $22,500 to $24,999 | 185 (5.2%) | 102 (3.8%) |
| $25,000 to $29,999 | 238 (6.8%) | 300 (11.3%) |
| $30,000 to $34,999 | 471 (13.4%) | 193 (7.2%) |
| $35,000 to $39,999 | 371 (10.5%) | 224 (8.4%) |
| $40,000 to $44,999 | 75 (2.1%) | 193 (7.2%) |
| $45,000 to $49,999 | 123 (3.5%) | 104 (3.9%) |
| $50,000 to $54,999 | 165 (4.7%) | 72 (2.7%) |
| $55,000 to $64,999 | 428 (12.1%) | 194 (7.3%) |
| $65,000 to $74,999 | 115 (3.3%) | 30 (1.1%) |
| $75,000 to $99,999 | 145 (4.1%) | 103 (3.9%) |
| $100,000+ | 226 (6.4%) | 116 (4.3%) |
| Total | 3,526 (100.0%) | 2,664 (100.0%) |
Earnings by Sex by Educational Attainment in Corcoran
Average earnings in Corcoran are $36,788 for men and $32,003 for women, a difference of 13.0%. Men with an educational attainment of college or associate's degree enjoy the highest average annual earnings of $53,621, while those with bachelor's degree education earn the least with $28,563. Women with an educational attainment of graduate degree earn the most with the average annual earnings of $62,235, while those with less than high school education have the smallest earnings of $20,952.
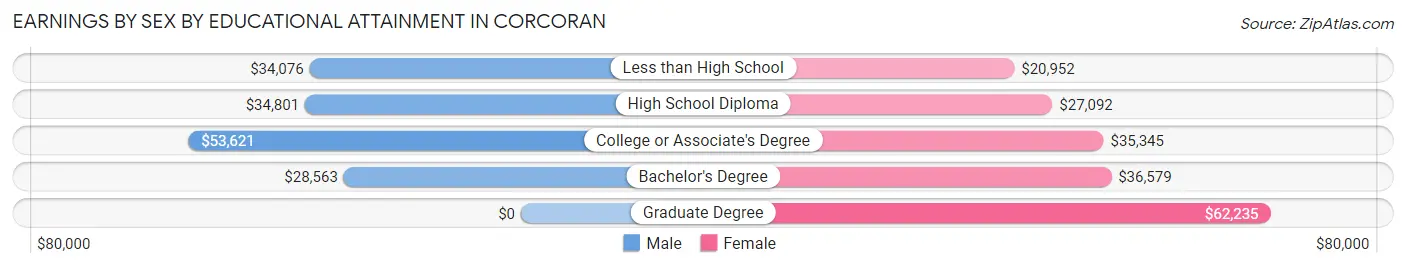
| Educational Attainment | Male Income | Female Income |
| Less than High School | $34,076 | $20,952 |
| High School Diploma | $34,801 | $27,092 |
| College or Associate's Degree | $53,621 | $35,345 |
| Bachelor's Degree | $28,563 | $36,579 |
| Graduate Degree | - | - |
| Total | $36,788 | $32,003 |
Family Income in Corcoran
Family Income Brackets in Corcoran
According to the Corcoran family income data, there are 640 families falling into the $50,000 to $74,999 income range, which is the most common income bracket and makes up 18.3% of all families. Conversely, the $10,000 to $14,999 income bracket is the least frequent group with only 52 families (1.5%) belonging to this category.
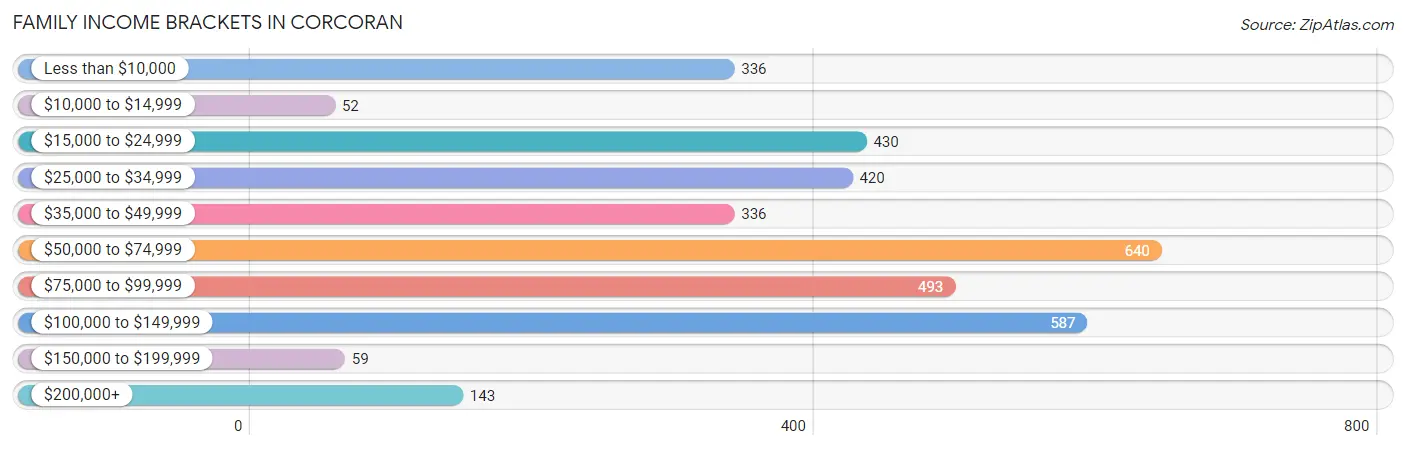
| Income Bracket | # Families | % Families |
| Less than $10,000 | 336 | 9.6% |
| $10,000 to $14,999 | 52 | 1.5% |
| $15,000 to $24,999 | 430 | 12.3% |
| $25,000 to $34,999 | 420 | 12.0% |
| $35,000 to $49,999 | 336 | 9.6% |
| $50,000 to $74,999 | 640 | 18.3% |
| $75,000 to $99,999 | 493 | 14.1% |
| $100,000 to $149,999 | 587 | 16.8% |
| $150,000 to $199,999 | 59 | 1.7% |
| $200,000+ | 143 | 4.1% |
Family Income by Famaliy Size in Corcoran
4-person families (843 | 24.1%) account for the highest median family income in Corcoran with $82,639 per family, while 2-person families (1,030 | 29.5%) have the highest median income of $21,643 per family member.
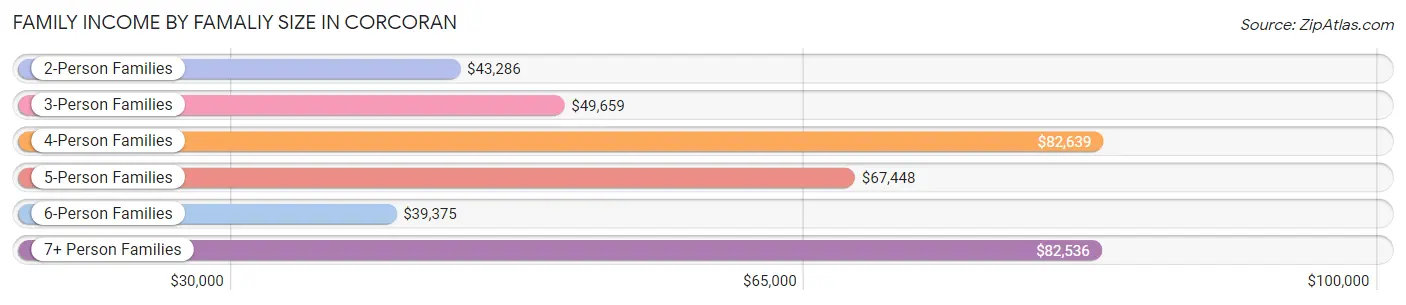
| Income Bracket | # Families | Median Income |
| 2-Person Families | 1,030 (29.5%) | $43,286 |
| 3-Person Families | 791 (22.6%) | $49,659 |
| 4-Person Families | 843 (24.1%) | $82,639 |
| 5-Person Families | 435 (12.4%) | $67,448 |
| 6-Person Families | 240 (6.9%) | $39,375 |
| 7+ Person Families | 157 (4.5%) | $82,536 |
| Total | 3,496 (100.0%) | $57,566 |
Family Income by Number of Earners in Corcoran
The median family income in Corcoran is $57,566, with families comprising 3+ earners (325) having the highest median family income of $106,042, while families with no earners (825) have the lowest median family income of $20,160, accounting for 9.3% and 23.6% of families, respectively.
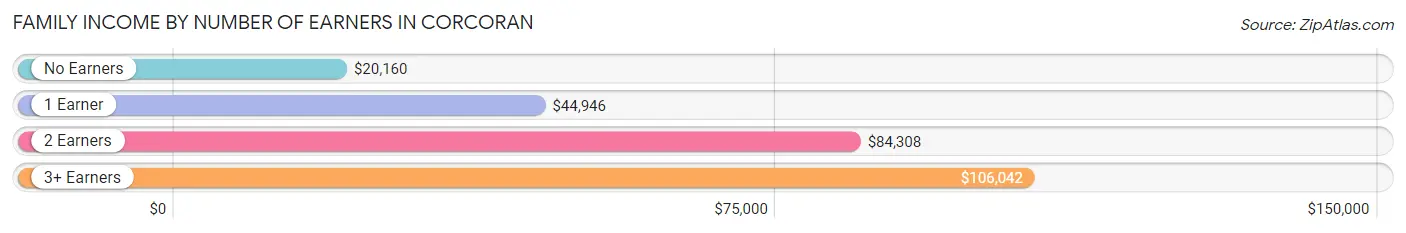
| Number of Earners | # Families | Median Income |
| No Earners | 825 (23.6%) | $20,160 |
| 1 Earner | 1,231 (35.2%) | $44,946 |
| 2 Earners | 1,115 (31.9%) | $84,308 |
| 3+ Earners | 325 (9.3%) | $106,042 |
| Total | 3,496 (100.0%) | $57,566 |
Household Income in Corcoran
Household Income Brackets in Corcoran
With 814 households falling in the category, the $50,000 to $74,999 income range is the most frequent in Corcoran, accounting for 18.6% of all households. In contrast, only 61 households (1.4%) fall into the $150,000 to $199,999 income bracket, making it the least populous group.
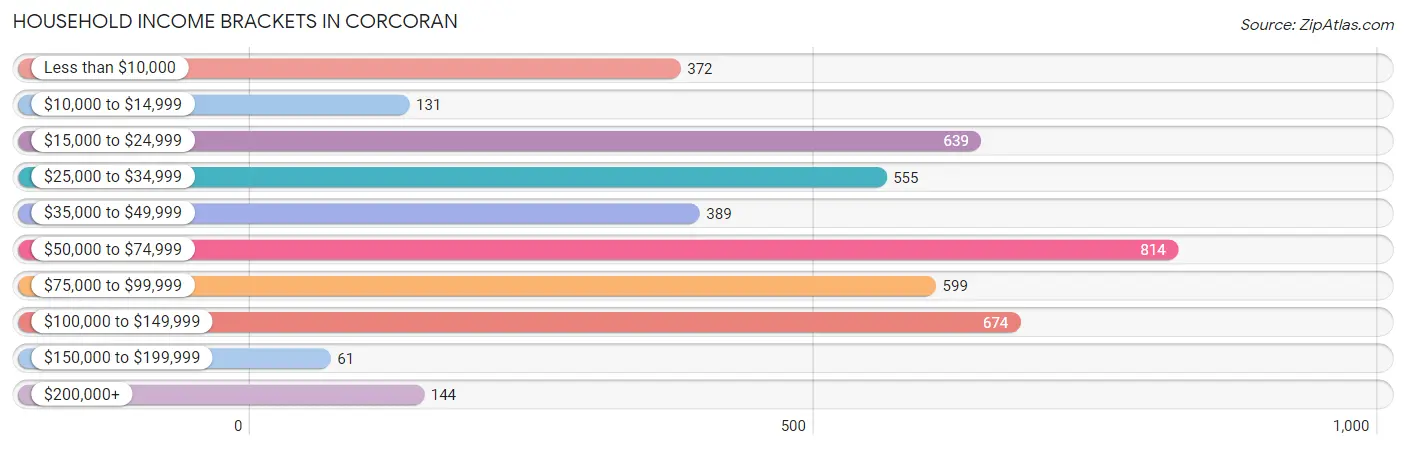
| Income Bracket | # Households | % Households |
| Less than $10,000 | 372 | 8.5% |
| $10,000 to $14,999 | 131 | 3.0% |
| $15,000 to $24,999 | 639 | 14.6% |
| $25,000 to $34,999 | 555 | 12.7% |
| $35,000 to $49,999 | 389 | 8.9% |
| $50,000 to $74,999 | 814 | 18.6% |
| $75,000 to $99,999 | 599 | 13.7% |
| $100,000 to $149,999 | 674 | 15.4% |
| $150,000 to $199,999 | 61 | 1.4% |
| $200,000+ | 144 | 3.3% |
Household Income by Householder Age in Corcoran
The median household income in Corcoran is $53,103, with the highest median household income of $62,615 found in the 45 to 64 years age bracket for the primary householder. A total of 1,594 households (36.4%) fall into this category. Meanwhile, the 15 to 24 years age bracket for the primary householder has the lowest median household income of $0, with 298 households (6.8%) in this group.
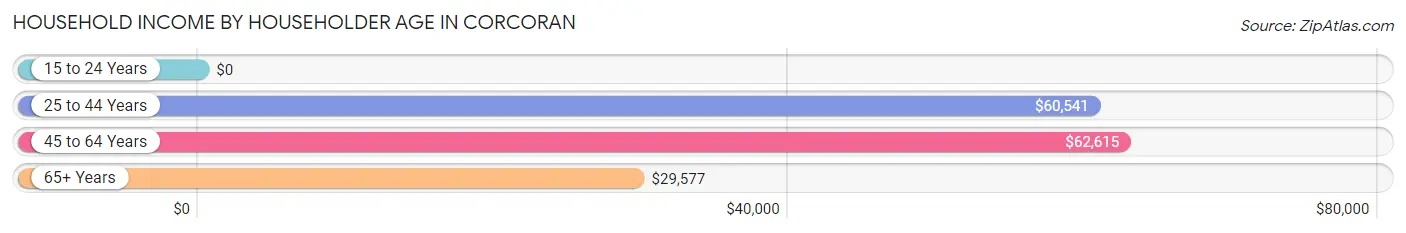
| Income Bracket | # Households | Median Income |
| 15 to 24 Years | 298 (6.8%) | $0 |
| 25 to 44 Years | 1,454 (33.2%) | $60,541 |
| 45 to 64 Years | 1,594 (36.4%) | $62,615 |
| 65+ Years | 1,028 (23.5%) | $29,577 |
| Total | 4,374 (100.0%) | $53,103 |
Poverty in Corcoran
Income Below Poverty by Sex and Age in Corcoran
With 24.1% poverty level for males and 30.7% for females among the residents of Corcoran, 16 and 17 year old males and under 5 year old females are the most vulnerable to poverty, with 161 males (56.7%) and 455 females (61.2%) in their respective age groups living below the poverty level.
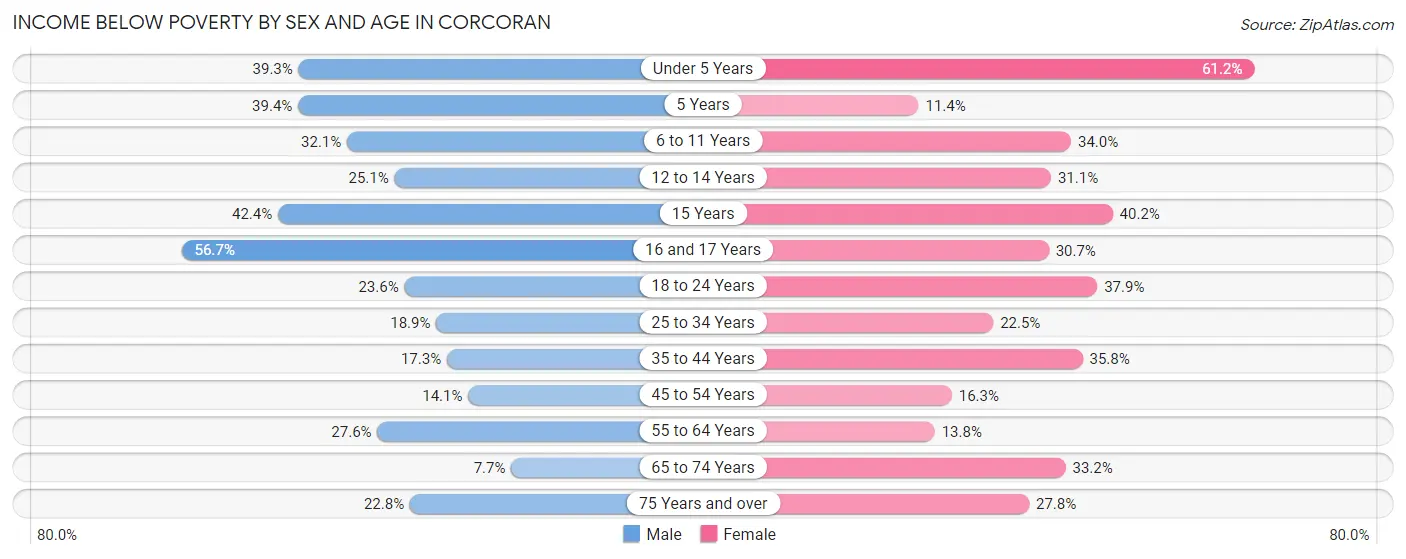
| Age Bracket | Male | Female |
| Under 5 Years | 195 (39.3%) | 455 (61.2%) |
| 5 Years | 63 (39.4%) | 13 (11.4%) |
| 6 to 11 Years | 218 (32.1%) | 241 (34.0%) |
| 12 to 14 Years | 89 (25.1%) | 214 (31.1%) |
| 15 Years | 25 (42.4%) | 37 (40.2%) |
| 16 and 17 Years | 161 (56.7%) | 90 (30.7%) |
| 18 to 24 Years | 221 (23.6%) | 297 (37.9%) |
| 25 to 34 Years | 194 (18.9%) | 294 (22.5%) |
| 35 to 44 Years | 131 (17.3%) | 242 (35.7%) |
| 45 to 54 Years | 112 (14.1%) | 128 (16.3%) |
| 55 to 64 Years | 188 (27.6%) | 90 (13.8%) |
| 65 to 74 Years | 43 (7.7%) | 223 (33.2%) |
| 75 Years and over | 69 (22.8%) | 131 (27.8%) |
| Total | 1,709 (24.1%) | 2,455 (30.7%) |
Income Above Poverty by Sex and Age in Corcoran
According to the poverty statistics in Corcoran, males aged 65 to 74 years and females aged 5 years are the age groups that are most secure financially, with 92.3% of males and 88.6% of females in these age groups living above the poverty line.
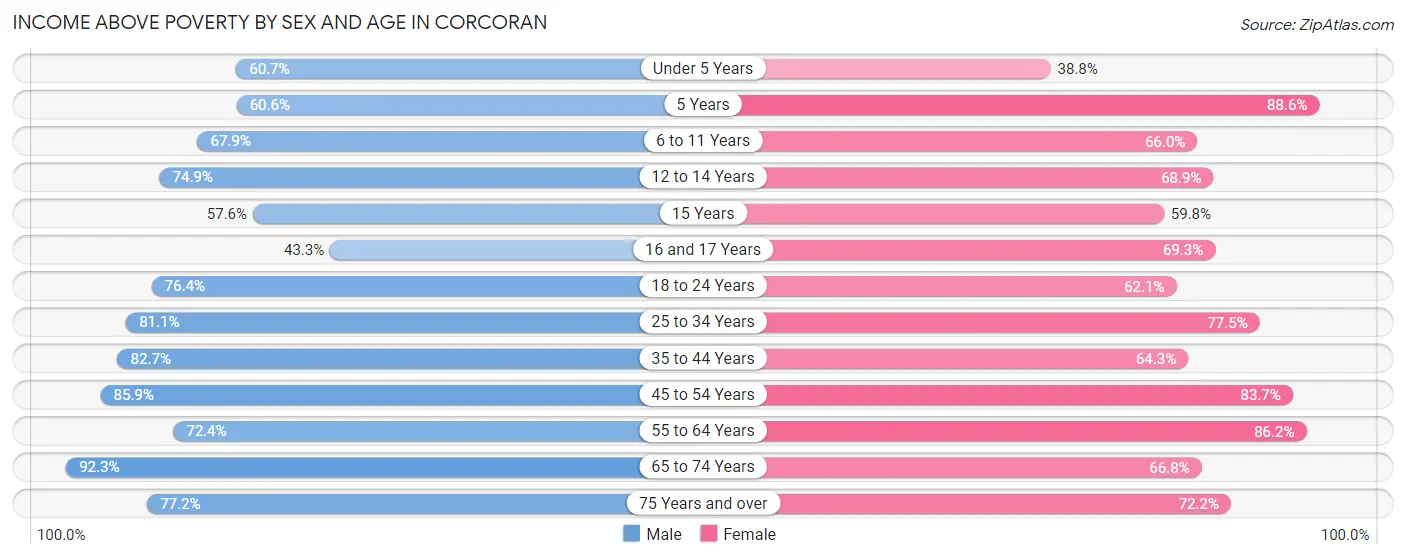
| Age Bracket | Male | Female |
| Under 5 Years | 301 (60.7%) | 288 (38.8%) |
| 5 Years | 97 (60.6%) | 101 (88.6%) |
| 6 to 11 Years | 461 (67.9%) | 467 (66.0%) |
| 12 to 14 Years | 266 (74.9%) | 475 (68.9%) |
| 15 Years | 34 (57.6%) | 55 (59.8%) |
| 16 and 17 Years | 123 (43.3%) | 203 (69.3%) |
| 18 to 24 Years | 716 (76.4%) | 486 (62.1%) |
| 25 to 34 Years | 834 (81.1%) | 1,014 (77.5%) |
| 35 to 44 Years | 627 (82.7%) | 435 (64.2%) |
| 45 to 54 Years | 681 (85.9%) | 656 (83.7%) |
| 55 to 64 Years | 493 (72.4%) | 562 (86.2%) |
| 65 to 74 Years | 513 (92.3%) | 448 (66.8%) |
| 75 Years and over | 234 (77.2%) | 340 (72.2%) |
| Total | 5,380 (75.9%) | 5,530 (69.3%) |
Income Below Poverty Among Married-Couple Families in Corcoran
The poverty statistics for married-couple families in Corcoran show that 6.5% or 122 of the total 1,881 families live below the poverty line. Families with 5 or more children have the highest poverty rate of 100.0%, comprising of 21 families. On the other hand, families with no children have the lowest poverty rate of 0.0%, which includes 0 families.
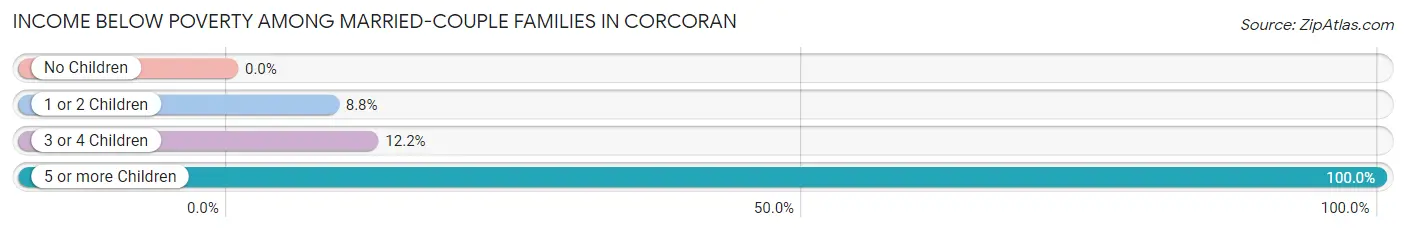
| Children | Above Poverty | Below Poverty |
| No Children | 815 (100.0%) | 0 (0.0%) |
| 1 or 2 Children | 707 (91.2%) | 68 (8.8%) |
| 3 or 4 Children | 237 (87.8%) | 33 (12.2%) |
| 5 or more Children | 0 (0.0%) | 21 (100.0%) |
| Total | 1,759 (93.5%) | 122 (6.5%) |
Income Below Poverty Among Single-Parent Households in Corcoran
According to the poverty data in Corcoran, 39.3% or 95 single-father households and 43.3% or 595 single-mother households are living below the poverty line. Among single-father households, those with 3 or 4 children have the highest poverty rate, with 25 households (41.7%) experiencing poverty. Likewise, among single-mother households, those with 5 or more children have the highest poverty rate, with 19 households (100.0%) falling below the poverty line.
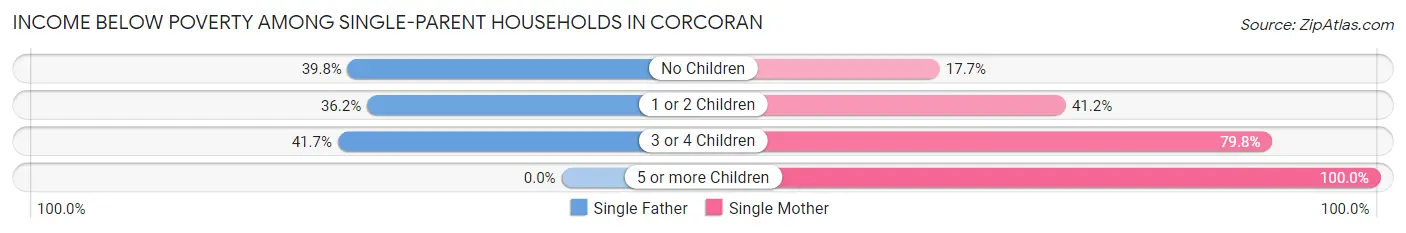
| Children | Single Father | Single Mother |
| No Children | 45 (39.8%) | 50 (17.7%) |
| 1 or 2 Children | 25 (36.2%) | 352 (41.2%) |
| 3 or 4 Children | 25 (41.7%) | 174 (79.8%) |
| 5 or more Children | 0 (0.0%) | 19 (100.0%) |
| Total | 95 (39.3%) | 595 (43.3%) |
Income Below Poverty Among Married-Couple vs Single-Parent Households in Corcoran
The poverty data for Corcoran shows that 122 of the married-couple family households (6.5%) and 690 of the single-parent households (42.7%) are living below the poverty level. Within the married-couple family households, those with 5 or more children have the highest poverty rate, with 21 households (100.0%) falling below the poverty line. Among the single-parent households, those with 5 or more children have the highest poverty rate, with 19 household (100.0%) living below poverty.
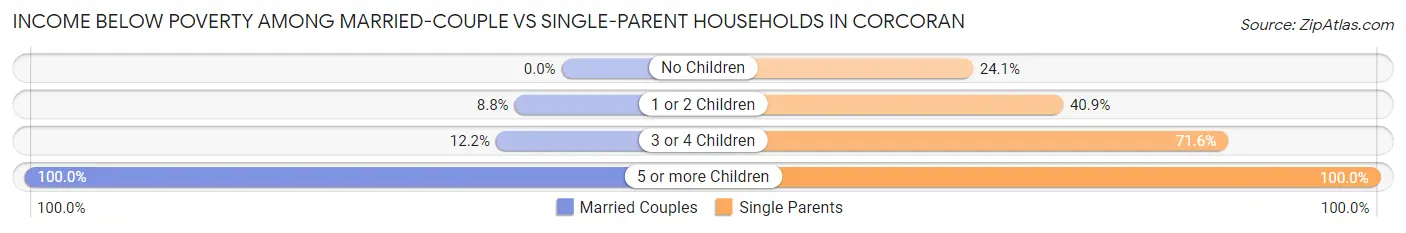
| Children | Married-Couple Families | Single-Parent Households |
| No Children | 0 (0.0%) | 95 (24.0%) |
| 1 or 2 Children | 68 (8.8%) | 377 (40.8%) |
| 3 or 4 Children | 33 (12.2%) | 199 (71.6%) |
| 5 or more Children | 21 (100.0%) | 19 (100.0%) |
| Total | 122 (6.5%) | 690 (42.7%) |
Race in Corcoran
The most populous races in Corcoran are Hispanic or Latino (16,877 | 74.0%), White / Caucasian (9,489 | 41.6%), and Some other Race (5,557 | 24.4%).
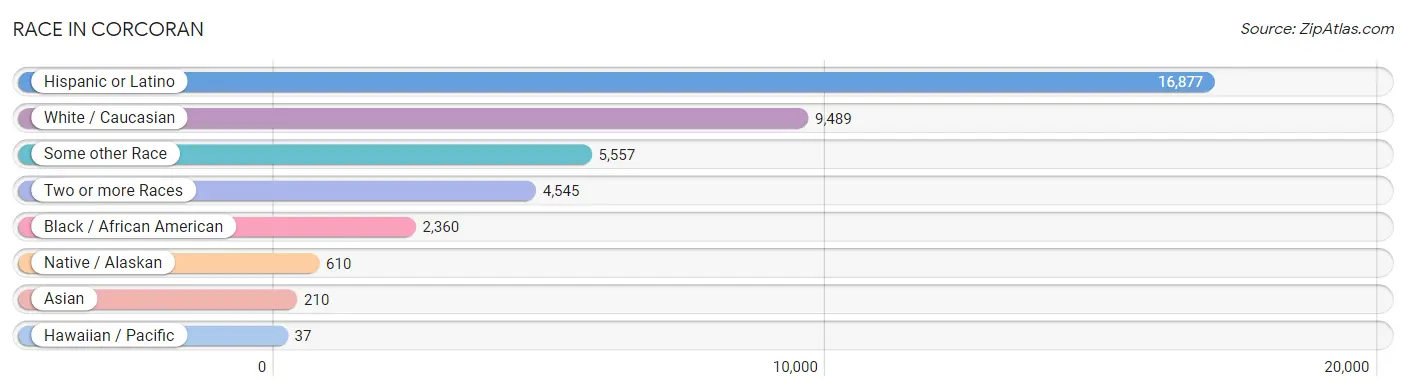
| Race | # Population | % Population |
| Asian | 210 | 0.9% |
| Black / African American | 2,360 | 10.3% |
| Hawaiian / Pacific | 37 | 0.2% |
| Hispanic or Latino | 16,877 | 74.0% |
| Native / Alaskan | 610 | 2.7% |
| White / Caucasian | 9,489 | 41.6% |
| Two or more Races | 4,545 | 19.9% |
| Some other Race | 5,557 | 24.4% |
| Total | 22,808 | 100.0% |
Ancestry in Corcoran
The most populous ancestries reported in Corcoran are Mexican (15,467 | 67.8%), German (559 | 2.5%), Italian (491 | 2.1%), Irish (454 | 2.0%), and English (422 | 1.8%), together accounting for 76.2% of all Corcoran residents.
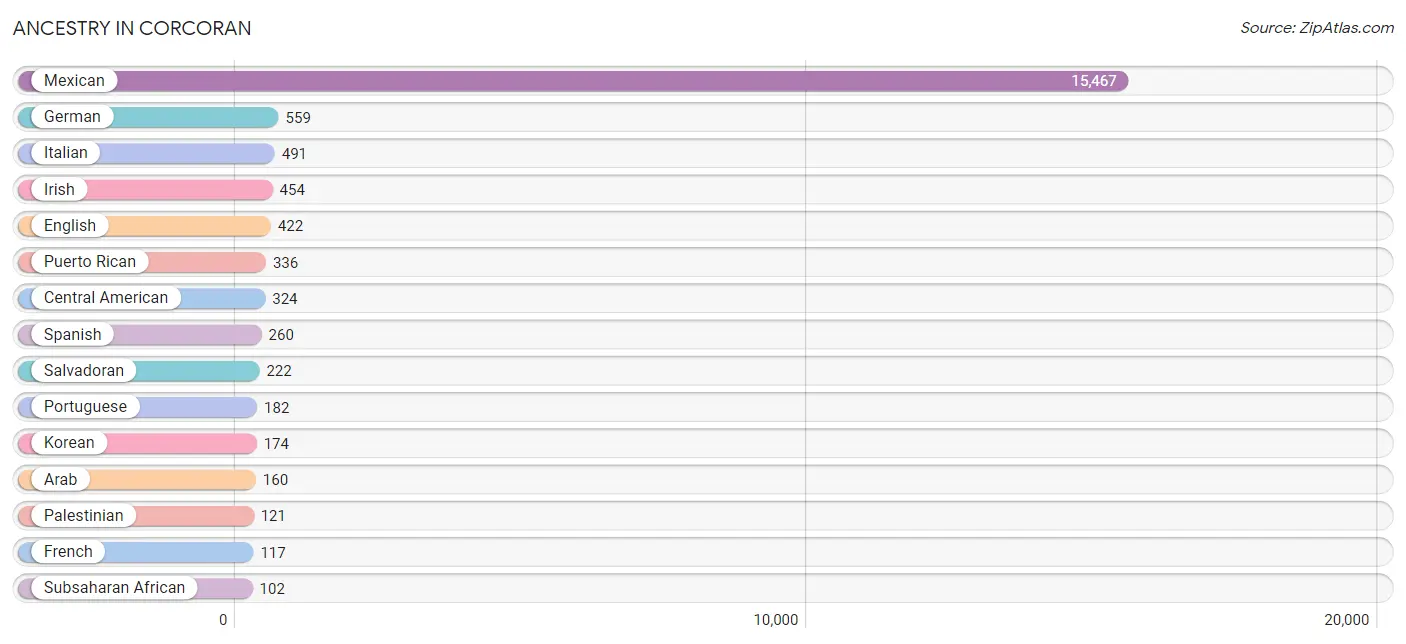
| Ancestry | # Population | % Population |
| African | 74 | 0.3% |
| American | 87 | 0.4% |
| Apache | 76 | 0.3% |
| Arab | 160 | 0.7% |
| Armenian | 55 | 0.2% |
| Bangladeshi | 20 | 0.1% |
| Belizean | 13 | 0.1% |
| Bhutanese | 34 | 0.2% |
| Blackfeet | 32 | 0.1% |
| Brazilian | 29 | 0.1% |
| British | 21 | 0.1% |
| Burmese | 12 | 0.1% |
| Canadian | 11 | 0.1% |
| Central American | 324 | 1.4% |
| Central American Indian | 7 | 0.0% |
| Cherokee | 33 | 0.1% |
| Cheyenne | 2 | 0.0% |
| Choctaw | 4 | 0.0% |
| Colombian | 36 | 0.2% |
| Cuban | 6 | 0.0% |
| Czech | 2 | 0.0% |
| Delaware | 39 | 0.2% |
| Dominican | 40 | 0.2% |
| Dutch | 40 | 0.2% |
| Ecuadorian | 9 | 0.0% |
| Egyptian | 9 | 0.0% |
| English | 422 | 1.8% |
| European | 83 | 0.4% |
| French | 117 | 0.5% |
| French American Indian | 31 | 0.1% |
| German | 559 | 2.5% |
| Guatemalan | 79 | 0.4% |
| Honduran | 9 | 0.0% |
| Hopi | 7 | 0.0% |
| Indian (Asian) | 72 | 0.3% |
| Iranian | 10 | 0.0% |
| Iraqi | 15 | 0.1% |
| Irish | 454 | 2.0% |
| Italian | 491 | 2.1% |
| Jamaican | 18 | 0.1% |
| Japanese | 22 | 0.1% |
| Jordanian | 15 | 0.1% |
| Kenyan | 21 | 0.1% |
| Korean | 174 | 0.8% |
| Malaysian | 17 | 0.1% |
| Mexican | 15,467 | 67.8% |
| Mexican American Indian | 92 | 0.4% |
| Navajo | 29 | 0.1% |
| Nicaraguan | 14 | 0.1% |
| Nigerian | 7 | 0.0% |
| Norwegian | 26 | 0.1% |
| Osage | 9 | 0.0% |
| Pakistani | 4 | 0.0% |
| Palestinian | 121 | 0.5% |
| Peruvian | 7 | 0.0% |
| Polish | 23 | 0.1% |
| Portuguese | 182 | 0.8% |
| Puerto Rican | 336 | 1.5% |
| Romanian | 9 | 0.0% |
| Russian | 41 | 0.2% |
| Salvadoran | 222 | 1.0% |
| Samoan | 38 | 0.2% |
| Scandinavian | 18 | 0.1% |
| Scotch-Irish | 28 | 0.1% |
| Scottish | 60 | 0.3% |
| Sioux | 21 | 0.1% |
| South American | 52 | 0.2% |
| Spaniard | 60 | 0.3% |
| Spanish | 260 | 1.1% |
| Sri Lankan | 34 | 0.2% |
| Subsaharan African | 102 | 0.4% |
| Swedish | 16 | 0.1% |
| Swiss | 5 | 0.0% |
| Thai | 12 | 0.1% |
| Tohono O'Odham | 88 | 0.4% |
| Tongan | 11 | 0.1% |
| Welsh | 14 | 0.1% |
| Yaqui | 18 | 0.1% | View All 78 Rows |
Immigrants in Corcoran
The most numerous immigrant groups reported in Corcoran came from Latin America (4,564 | 20.0%), Central America (4,431 | 19.4%), Mexico (4,314 | 18.9%), Asia (168 | 0.7%), and Caribbean (113 | 0.5%), together accounting for 59.6% of all Corcoran residents.
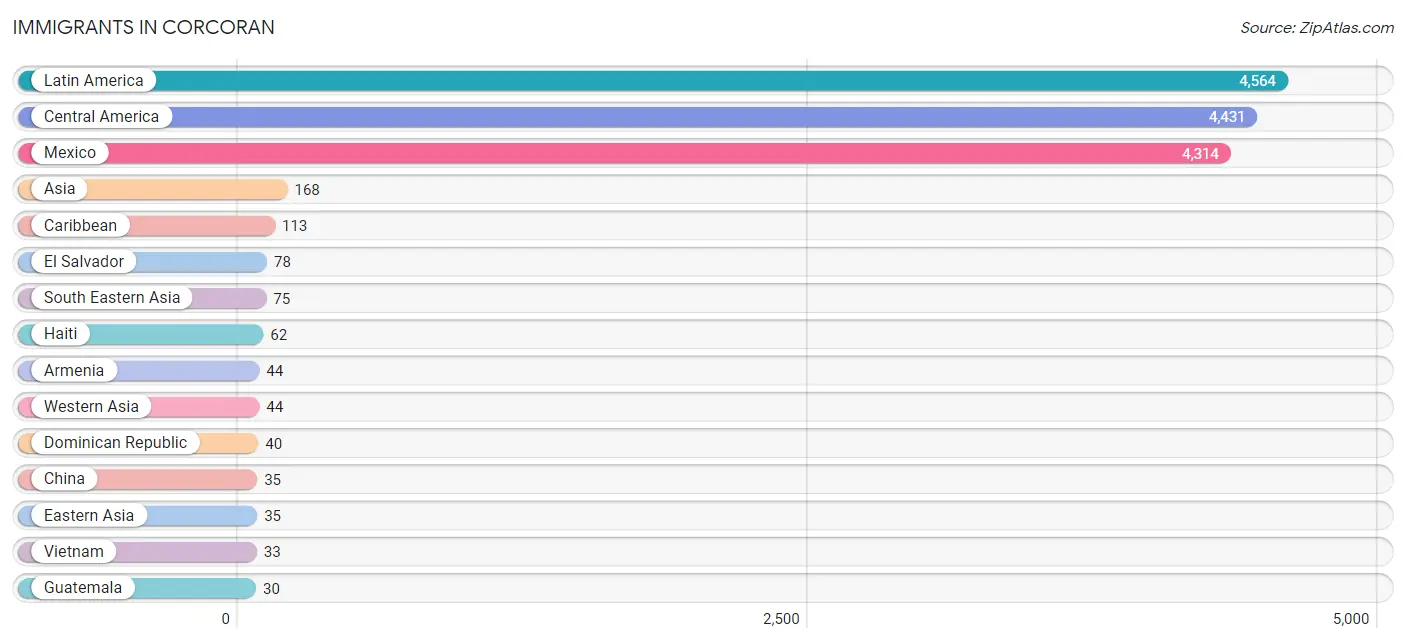
| Immigration Origin | # Population | % Population |
| Africa | 29 | 0.1% |
| Armenia | 44 | 0.2% |
| Asia | 168 | 0.7% |
| Azores | 13 | 0.1% |
| Brazil | 11 | 0.1% |
| Cambodia | 9 | 0.0% |
| Caribbean | 113 | 0.5% |
| Central America | 4,431 | 19.4% |
| China | 35 | 0.2% |
| Colombia | 9 | 0.0% |
| Cuba | 9 | 0.0% |
| Dominican Republic | 40 | 0.2% |
| Eastern Africa | 25 | 0.1% |
| Eastern Asia | 35 | 0.2% |
| Eastern Europe | 16 | 0.1% |
| Egypt | 4 | 0.0% |
| El Salvador | 78 | 0.3% |
| Europe | 29 | 0.1% |
| Guatemala | 30 | 0.1% |
| Haiti | 62 | 0.3% |
| Honduras | 9 | 0.0% |
| Iran | 10 | 0.0% |
| Jamaica | 2 | 0.0% |
| Kenya | 21 | 0.1% |
| Laos | 8 | 0.0% |
| Latin America | 4,564 | 20.0% |
| Mexico | 4,314 | 18.9% |
| Northern Africa | 4 | 0.0% |
| Oceania | 16 | 0.1% |
| Pakistan | 4 | 0.0% |
| Philippines | 13 | 0.1% |
| Portugal | 13 | 0.1% |
| Russia | 16 | 0.1% |
| South America | 20 | 0.1% |
| South Central Asia | 14 | 0.1% |
| South Eastern Asia | 75 | 0.3% |
| Southern Europe | 13 | 0.1% |
| Thailand | 12 | 0.1% |
| Vietnam | 33 | 0.1% |
| Western Asia | 44 | 0.2% | View All 40 Rows |
Sex and Age in Corcoran
Sex and Age in Corcoran
The most populous age groups in Corcoran are 30 to 34 Years (1,893 | 12.8%) for men and 10 to 14 Years (942 | 11.7%) for women.
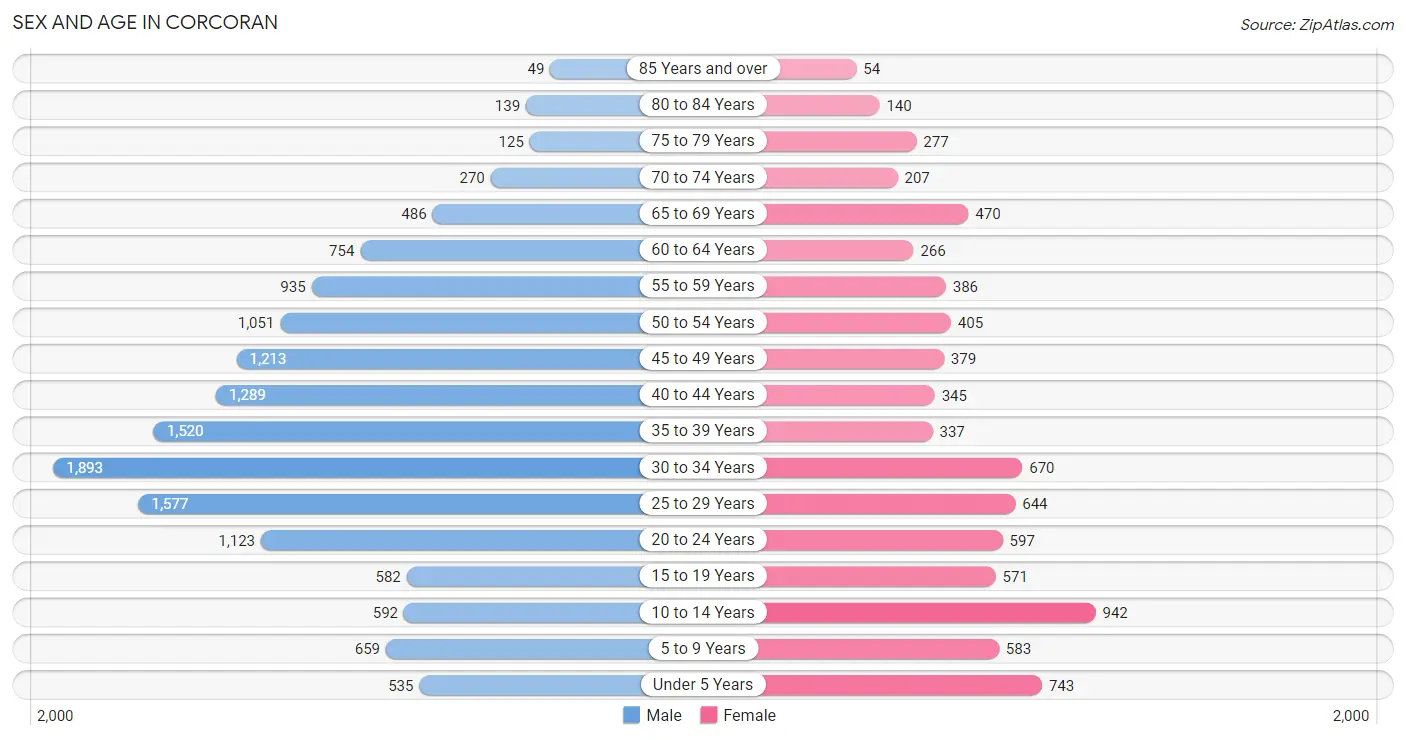
| Age Bracket | Male | Female |
| Under 5 Years | 535 (3.6%) | 743 (9.3%) |
| 5 to 9 Years | 659 (4.5%) | 583 (7.3%) |
| 10 to 14 Years | 592 (4.0%) | 942 (11.7%) |
| 15 to 19 Years | 582 (3.9%) | 571 (7.1%) |
| 20 to 24 Years | 1,123 (7.6%) | 597 (7.4%) |
| 25 to 29 Years | 1,577 (10.7%) | 644 (8.0%) |
| 30 to 34 Years | 1,893 (12.8%) | 670 (8.4%) |
| 35 to 39 Years | 1,520 (10.3%) | 337 (4.2%) |
| 40 to 44 Years | 1,289 (8.7%) | 345 (4.3%) |
| 45 to 49 Years | 1,213 (8.2%) | 379 (4.7%) |
| 50 to 54 Years | 1,051 (7.1%) | 405 (5.1%) |
| 55 to 59 Years | 935 (6.3%) | 386 (4.8%) |
| 60 to 64 Years | 754 (5.1%) | 266 (3.3%) |
| 65 to 69 Years | 486 (3.3%) | 470 (5.9%) |
| 70 to 74 Years | 270 (1.8%) | 207 (2.6%) |
| 75 to 79 Years | 125 (0.9%) | 277 (3.5%) |
| 80 to 84 Years | 139 (0.9%) | 140 (1.8%) |
| 85 Years and over | 49 (0.3%) | 54 (0.7%) |
| Total | 14,792 (100.0%) | 8,016 (100.0%) |
Families and Households in Corcoran
Median Family Size in Corcoran
The median family size in Corcoran is 3.79 persons per family, with married-couple families (1,881 | 53.8%) accounting for the largest median family size of 4 persons per family. On the other hand, single female/mother families (1,373 | 39.3%) represent the smallest median family size with 3.52 persons per family.
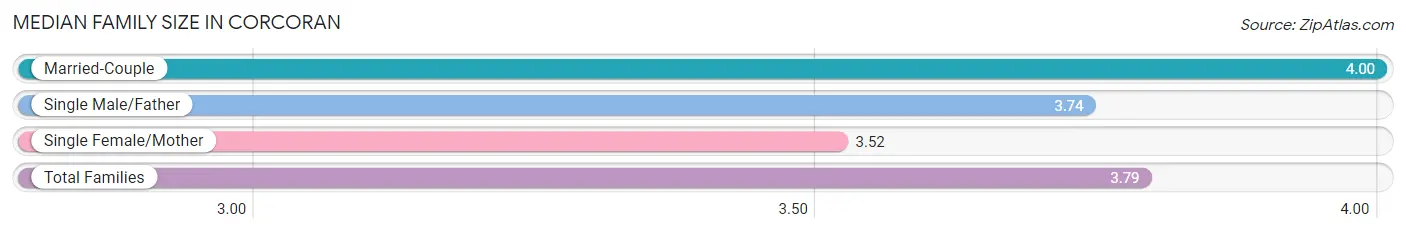
| Family Type | # Families | Family Size |
| Married-Couple | 1,881 (53.8%) | 4.00 |
| Single Male/Father | 242 (6.9%) | 3.74 |
| Single Female/Mother | 1,373 (39.3%) | 3.52 |
| Total Families | 3,496 (100.0%) | 3.79 |
Median Household Size in Corcoran
The median household size in Corcoran is 3.47 persons per household, with single male/father households (242 | 5.5%) accounting for the largest median household size of 4.27 persons per household. non-family households (878 | 20.1%) represent the smallest median household size with 1.35 persons per household.
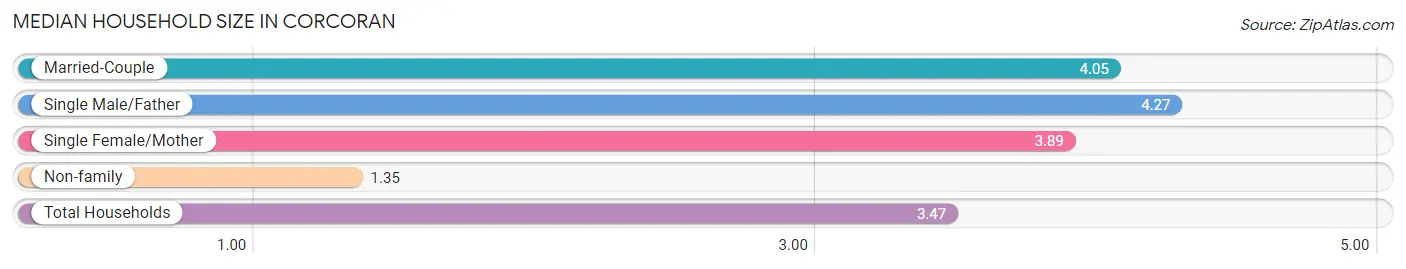
| Household Type | # Households | Household Size |
| Married-Couple | 1,881 (43.0%) | 4.05 |
| Single Male/Father | 242 (5.5%) | 4.27 |
| Single Female/Mother | 1,373 (31.4%) | 3.89 |
| Non-family | 878 (20.1%) | 1.35 |
| Total Households | 4,374 (100.0%) | 3.47 |
Household Size by Marriage Status in Corcoran
Out of a total of 4,374 households in Corcoran, 3,496 (79.9%) are family households, while 878 (20.1%) are nonfamily households. The most numerous type of family households are 4-person households, comprising 954, and the most common type of nonfamily households are 1-person households, comprising 691.
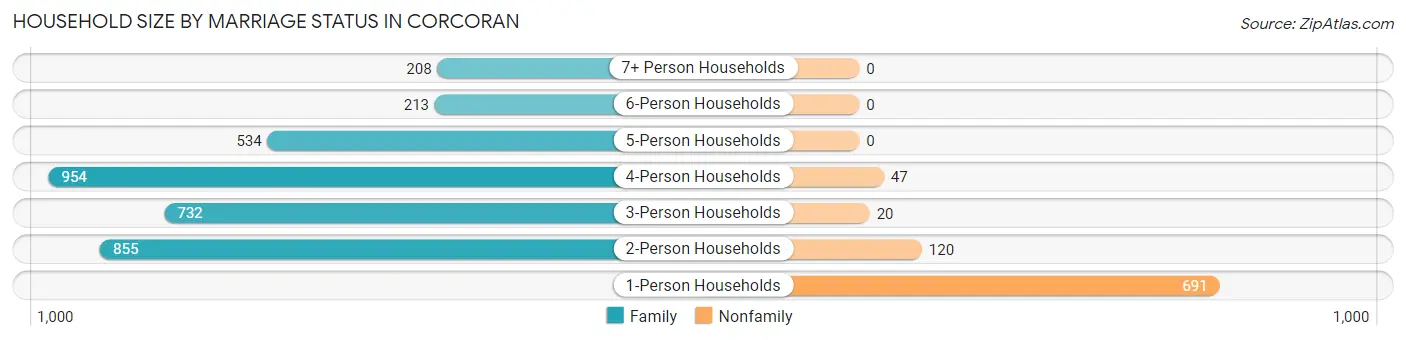
| Household Size | Family Households | Nonfamily Households |
| 1-Person Households | - | 691 (15.8%) |
| 2-Person Households | 855 (19.6%) | 120 (2.7%) |
| 3-Person Households | 732 (16.7%) | 20 (0.5%) |
| 4-Person Households | 954 (21.8%) | 47 (1.1%) |
| 5-Person Households | 534 (12.2%) | 0 (0.0%) |
| 6-Person Households | 213 (4.9%) | 0 (0.0%) |
| 7+ Person Households | 208 (4.8%) | 0 (0.0%) |
| Total | 3,496 (79.9%) | 878 (20.1%) |
Female Fertility in Corcoran
Fertility by Age in Corcoran
Average fertility rate in Corcoran is 69.0 births per 1,000 women. Women in the age bracket of 20 to 34 years have the highest fertility rate with 119.0 births per 1,000 women. Women in the age bracket of 20 to 34 years acount for 90.4% of all women with births.
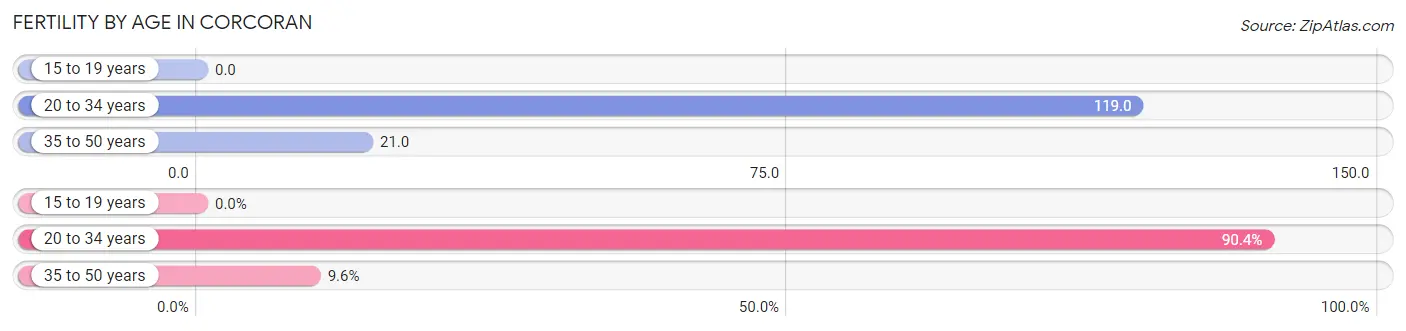
| Age Bracket | Women with Births | Births / 1,000 Women |
| 15 to 19 years | 0 (0.0%) | 0.0 |
| 20 to 34 years | 227 (90.4%) | 119.0 |
| 35 to 50 years | 24 (9.6%) | 21.0 |
| Total | 251 (100.0%) | 69.0 |
Fertility by Age by Marriage Status in Corcoran
28.3% of women with births (251) in Corcoran are married. The highest percentage of unmarried women with births falls into 20 to 34 years age bracket with 79.3% of them unmarried at the time of birth, while the lowest percentage of unmarried women with births belong to 35 to 50 years age bracket with 0.0% of them unmarried.
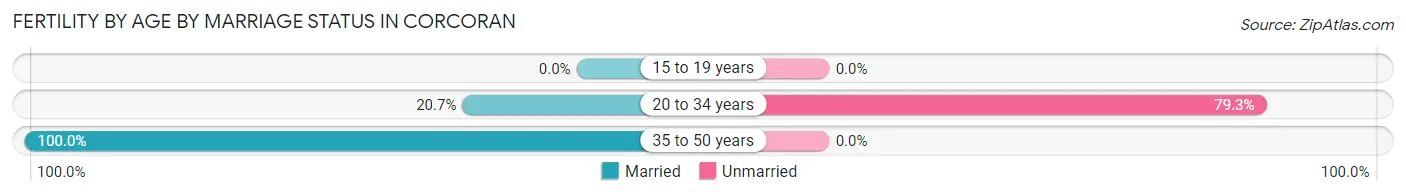
| Age Bracket | Married | Unmarried |
| 15 to 19 years | 0 (0.0%) | 0 (0.0%) |
| 20 to 34 years | 47 (20.7%) | 180 (79.3%) |
| 35 to 50 years | 24 (100.0%) | 0 (0.0%) |
| Total | 71 (28.3%) | 180 (71.7%) |
Fertility by Education in Corcoran
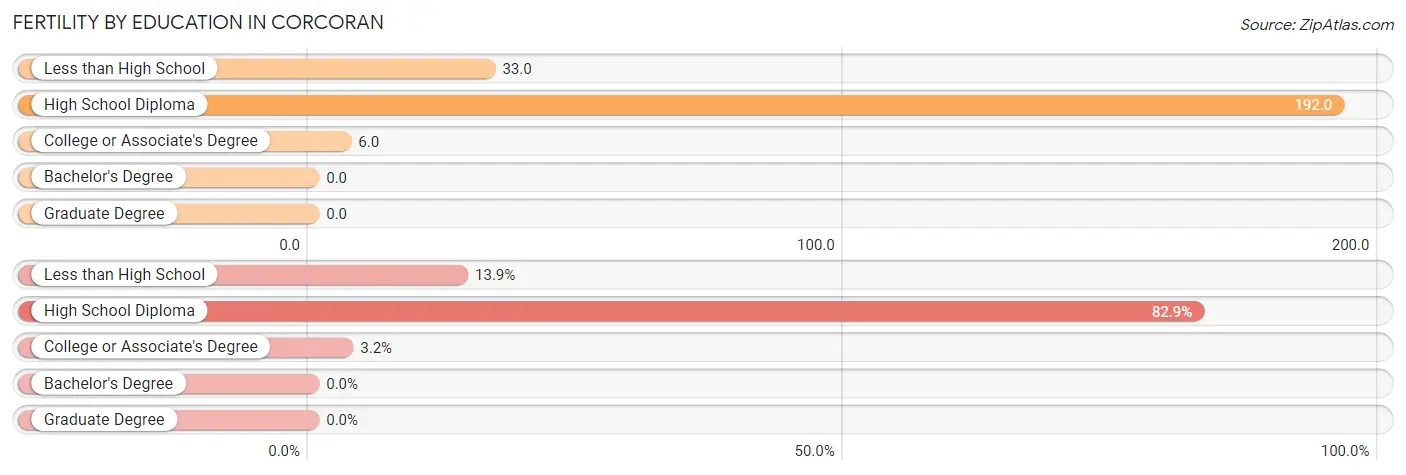
| Educational Attainment | Women with Births | Births / 1,000 Women |
| Less than High School | 35 (13.9%) | 33.0 |
| High School Diploma | 208 (82.9%) | 192.0 |
| College or Associate's Degree | 8 (3.2%) | 6.0 |
| Bachelor's Degree | 0 (0.0%) | 0.0 |
| Graduate Degree | 0 (0.0%) | 0.0 |
| Total | 251 (100.0%) | 69.0 |
Fertility by Education by Marriage Status in Corcoran
71.7% of women with births in Corcoran are unmarried. Women with the educational attainment of college or associate's degree are most likely to be married with 50.0% of them married at childbirth, while women with the educational attainment of less than high school are least likely to be married with 100.0% of them unmarried at childbirth.
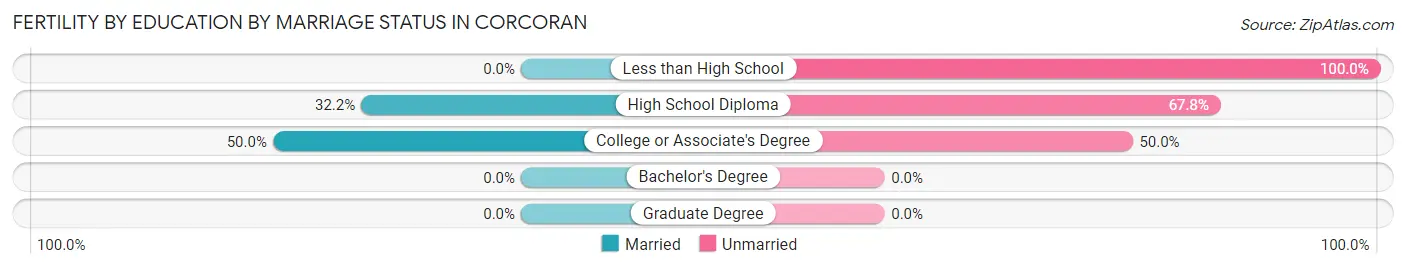
| Educational Attainment | Married | Unmarried |
| Less than High School | 0 (0.0%) | 35 (100.0%) |
| High School Diploma | 67 (32.2%) | 141 (67.8%) |
| College or Associate's Degree | 4 (50.0%) | 4 (50.0%) |
| Bachelor's Degree | 0 (0.0%) | 0 (0.0%) |
| Graduate Degree | 0 (0.0%) | 0 (0.0%) |
| Total | 71 (28.3%) | 180 (71.7%) |
Employment Characteristics in Corcoran
Employment by Class of Employer in Corcoran
Among the 5,206 employed individuals in Corcoran, private company employees (3,388 | 65.1%), local government employees (609 | 11.7%), and state government employees (513 | 9.9%) make up the most common classes of employment.
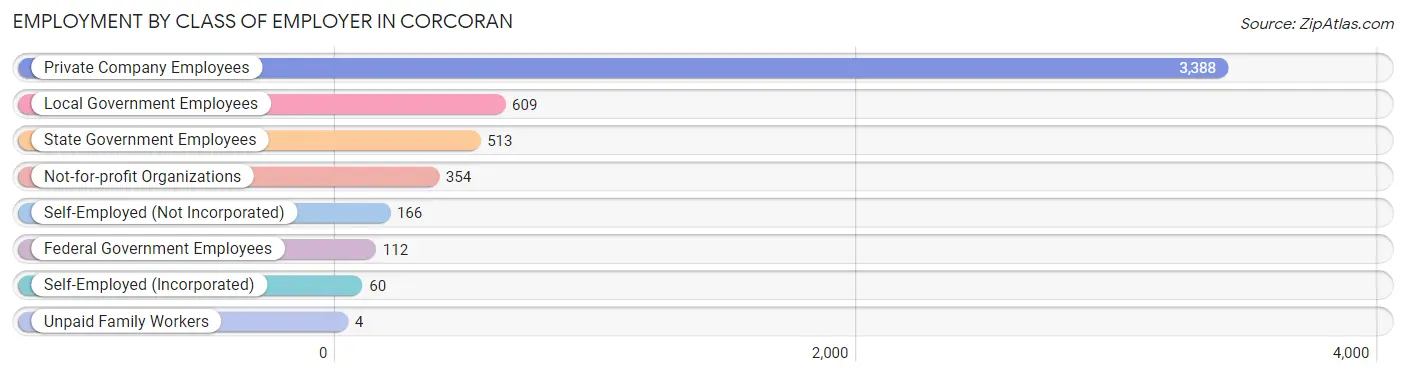
| Employer Class | # Employees | % Employees |
| Private Company Employees | 3,388 | 65.1% |
| Self-Employed (Incorporated) | 60 | 1.1% |
| Self-Employed (Not Incorporated) | 166 | 3.2% |
| Not-for-profit Organizations | 354 | 6.8% |
| Local Government Employees | 609 | 11.7% |
| State Government Employees | 513 | 9.9% |
| Federal Government Employees | 112 | 2.1% |
| Unpaid Family Workers | 4 | 0.1% |
| Total | 5,206 | 100.0% |
Employment Status by Age in Corcoran
According to the labor force statistics for Corcoran, out of the total population over 16 years of age (18,603), 32.3% or 6,009 individuals are in the labor force, with 11.2% or 673 of them unemployed. The age group with the highest labor force participation rate is 20 to 24 years, with 53.5% or 920 individuals in the labor force. Within the labor force, the 20 to 24 years age range has the highest percentage of unemployed individuals, with 30.4% or 280 of them being unemployed.
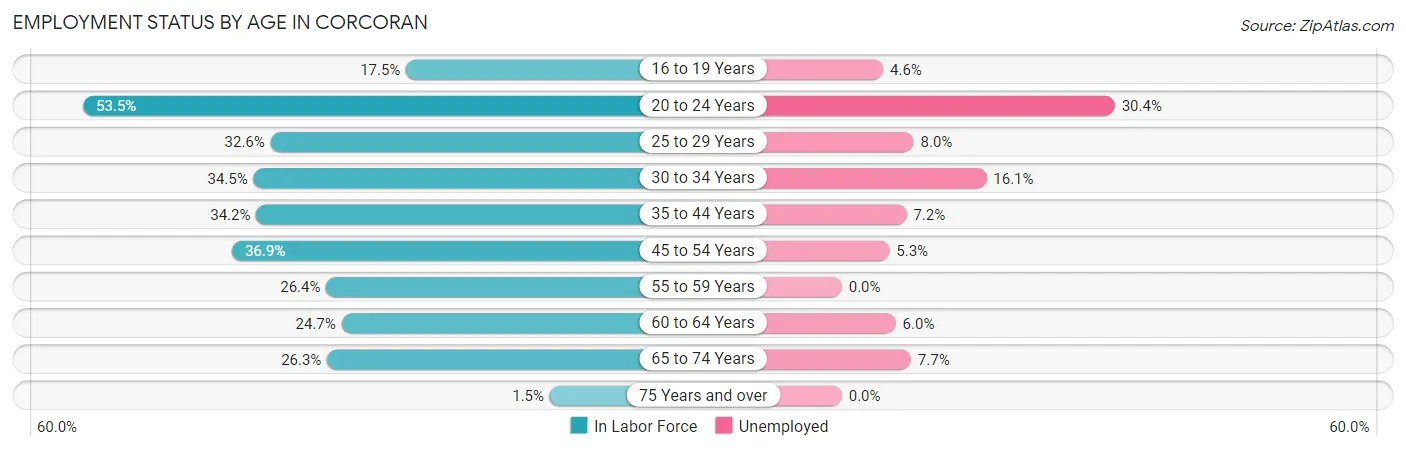
| Age Bracket | In Labor Force | Unemployed |
| 16 to 19 Years | 175 (17.5%) | 8 (4.6%) |
| 20 to 24 Years | 920 (53.5%) | 280 (30.4%) |
| 25 to 29 Years | 724 (32.6%) | 58 (8.0%) |
| 30 to 34 Years | 884 (34.5%) | 142 (16.1%) |
| 35 to 44 Years | 1,194 (34.2%) | 86 (7.2%) |
| 45 to 54 Years | 1,125 (36.9%) | 60 (5.3%) |
| 55 to 59 Years | 349 (26.4%) | 0 (0.0%) |
| 60 to 64 Years | 252 (24.7%) | 15 (6.0%) |
| 65 to 74 Years | 377 (26.3%) | 29 (7.7%) |
| 75 Years and over | 12 (1.5%) | 0 (0.0%) |
| Total | 6,009 (32.3%) | 673 (11.2%) |
Employment Status by Educational Attainment in Corcoran
According to labor force statistics for Corcoran, 33.1% of individuals (4,523) out of the total population between 25 and 64 years of age (13,664) are in the labor force, with 7.9% or 357 of them being unemployed. The group with the highest labor force participation rate are those with the educational attainment of bachelor's degree or higher, with 71.6% or 322 individuals in the labor force. Within the labor force, individuals with high school diploma education have the highest percentage of unemployment, with 16.9% or 225 of them being unemployed.
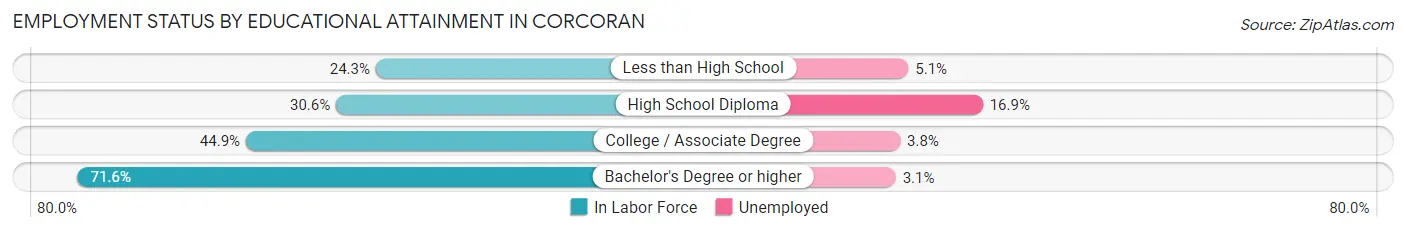
| Educational Attainment | In Labor Force | Unemployed |
| Less than High School | 1,306 (24.3%) | 274 (5.1%) |
| High School Diploma | 1,332 (30.6%) | 736 (16.9%) |
| College / Associate Degree | 1,565 (44.9%) | 132 (3.8%) |
| Bachelor's Degree or higher | 322 (71.6%) | 14 (3.1%) |
| Total | 4,523 (33.1%) | 1,079 (7.9%) |
Employment Occupations by Sex in Corcoran
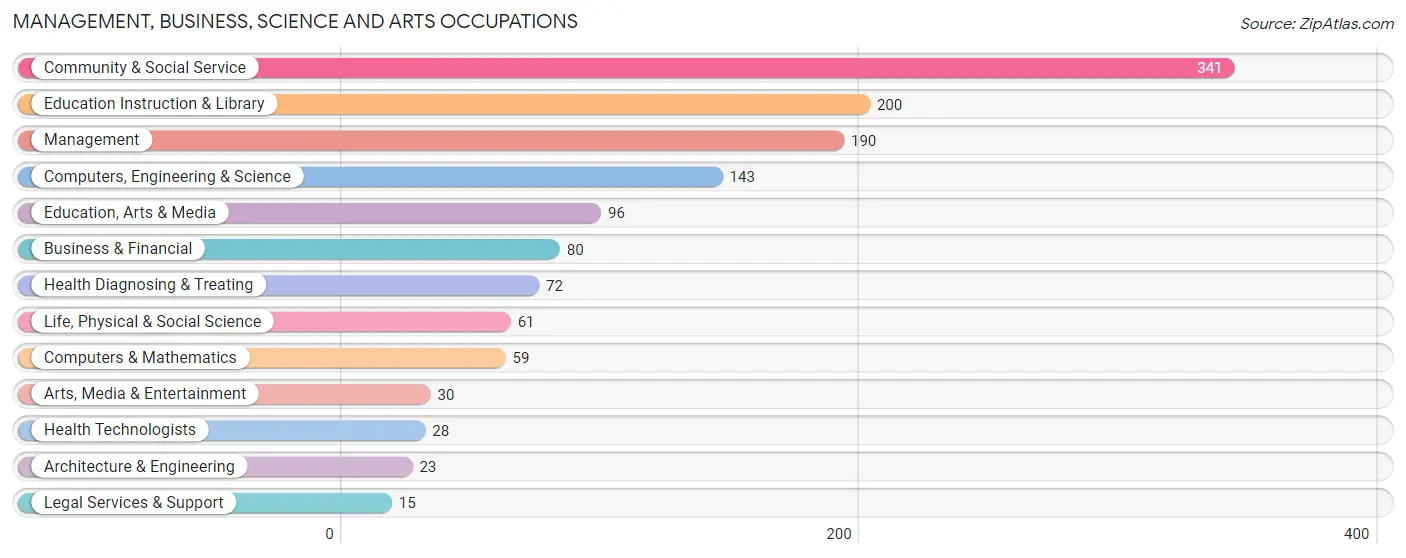
Management, Business, Science and Arts Occupations
The most common Management, Business, Science and Arts occupations in Corcoran are Community & Social Service (341 | 6.4%), Education Instruction & Library (200 | 3.8%), Management (190 | 3.6%), Computers, Engineering & Science (143 | 2.7%), and Education, Arts & Media (96 | 1.8%).
Management, Business, Science and Arts Occupations by Sex
Within the Management, Business, Science and Arts occupations in Corcoran, the most male-oriented occupations are Business & Financial (100.0%), Architecture & Engineering (100.0%), and Arts, Media & Entertainment (100.0%), while the most female-oriented occupations are Health Technologists (100.0%), Education Instruction & Library (95.0%), and Health Diagnosing & Treating (86.1%).
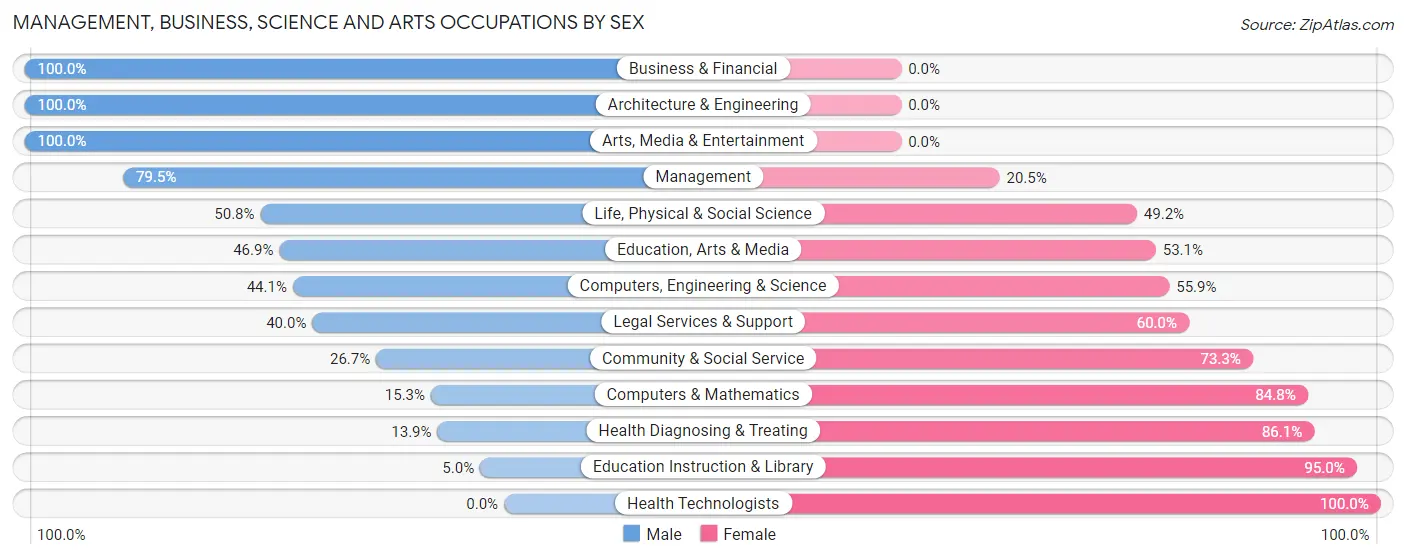
| Occupation | Male | Female |
| Management | 151 (79.5%) | 39 (20.5%) |
| Business & Financial | 80 (100.0%) | 0 (0.0%) |
| Computers, Engineering & Science | 63 (44.1%) | 80 (55.9%) |
| Computers & Mathematics | 9 (15.2%) | 50 (84.8%) |
| Architecture & Engineering | 23 (100.0%) | 0 (0.0%) |
| Life, Physical & Social Science | 31 (50.8%) | 30 (49.2%) |
| Community & Social Service | 91 (26.7%) | 250 (73.3%) |
| Education, Arts & Media | 45 (46.9%) | 51 (53.1%) |
| Legal Services & Support | 6 (40.0%) | 9 (60.0%) |
| Education Instruction & Library | 10 (5.0%) | 190 (95.0%) |
| Arts, Media & Entertainment | 30 (100.0%) | 0 (0.0%) |
| Health Diagnosing & Treating | 10 (13.9%) | 62 (86.1%) |
| Health Technologists | 0 (0.0%) | 28 (100.0%) |
| Total (Category) | 395 (47.8%) | 431 (52.2%) |
| Total (Overall) | 2,931 (55.3%) | 2,372 (44.7%) |
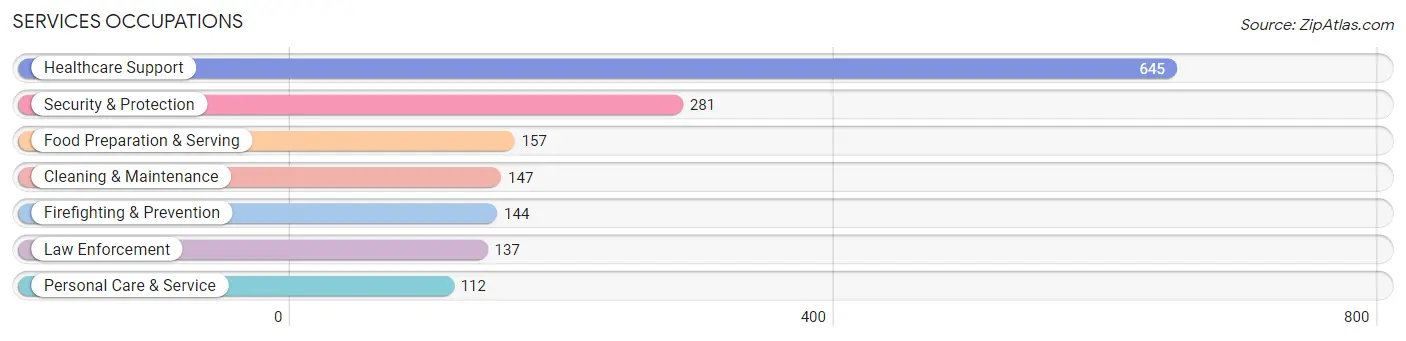
Services Occupations
The most common Services occupations in Corcoran are Healthcare Support (645 | 12.2%), Security & Protection (281 | 5.3%), Food Preparation & Serving (157 | 3.0%), Cleaning & Maintenance (147 | 2.8%), and Firefighting & Prevention (144 | 2.7%).
Services Occupations by Sex
Within the Services occupations in Corcoran, the most male-oriented occupations are Cleaning & Maintenance (59.2%), Firefighting & Prevention (50.7%), and Security & Protection (49.8%), while the most female-oriented occupations are Personal Care & Service (100.0%), Healthcare Support (85.9%), and Food Preparation & Serving (63.7%).
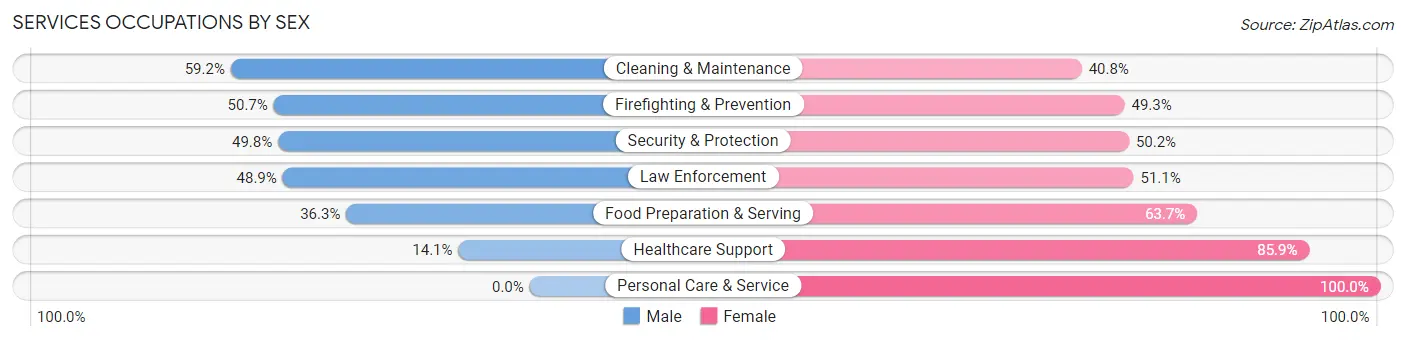
| Occupation | Male | Female |
| Healthcare Support | 91 (14.1%) | 554 (85.9%) |
| Security & Protection | 140 (49.8%) | 141 (50.2%) |
| Firefighting & Prevention | 73 (50.7%) | 71 (49.3%) |
| Law Enforcement | 67 (48.9%) | 70 (51.1%) |
| Food Preparation & Serving | 57 (36.3%) | 100 (63.7%) |
| Cleaning & Maintenance | 87 (59.2%) | 60 (40.8%) |
| Personal Care & Service | 0 (0.0%) | 112 (100.0%) |
| Total (Category) | 375 (27.9%) | 967 (72.1%) |
| Total (Overall) | 2,931 (55.3%) | 2,372 (44.7%) |
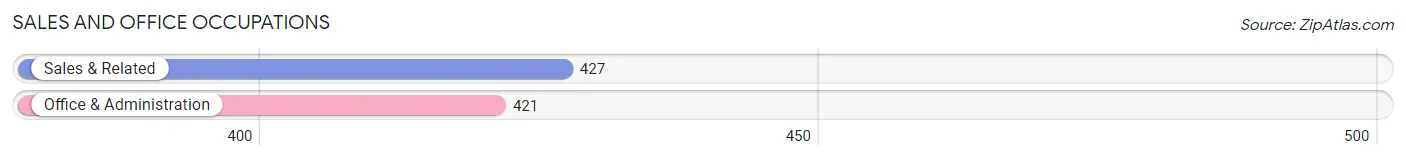
Sales and Office Occupations
The most common Sales and Office occupations in Corcoran are Sales & Related (427 | 8.1%), and Office & Administration (421 | 7.9%).
Sales and Office Occupations by Sex
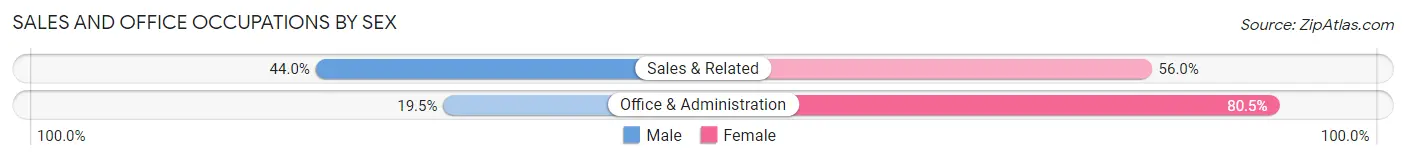
| Occupation | Male | Female |
| Sales & Related | 188 (44.0%) | 239 (56.0%) |
| Office & Administration | 82 (19.5%) | 339 (80.5%) |
| Total (Category) | 270 (31.8%) | 578 (68.2%) |
| Total (Overall) | 2,931 (55.3%) | 2,372 (44.7%) |
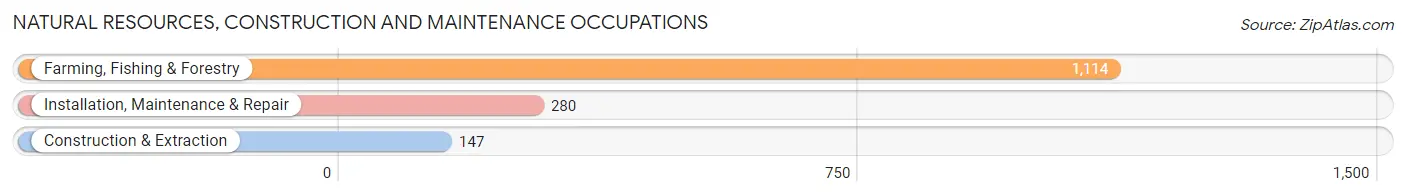
Natural Resources, Construction and Maintenance Occupations
The most common Natural Resources, Construction and Maintenance occupations in Corcoran are Farming, Fishing & Forestry (1,114 | 21.0%), Installation, Maintenance & Repair (280 | 5.3%), and Construction & Extraction (147 | 2.8%).
Natural Resources, Construction and Maintenance Occupations by Sex
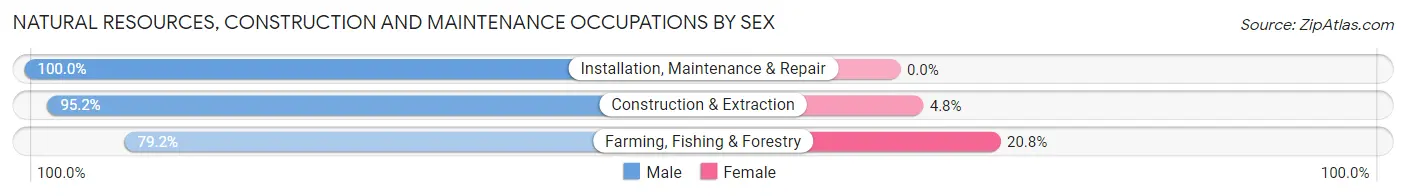
| Occupation | Male | Female |
| Farming, Fishing & Forestry | 882 (79.2%) | 232 (20.8%) |
| Construction & Extraction | 140 (95.2%) | 7 (4.8%) |
| Installation, Maintenance & Repair | 280 (100.0%) | 0 (0.0%) |
| Total (Category) | 1,302 (84.5%) | 239 (15.5%) |
| Total (Overall) | 2,931 (55.3%) | 2,372 (44.7%) |
Production, Transportation and Moving Occupations
The most common Production, Transportation and Moving occupations in Corcoran are Production (289 | 5.4%), Transportation (260 | 4.9%), and Material Moving (197 | 3.7%).
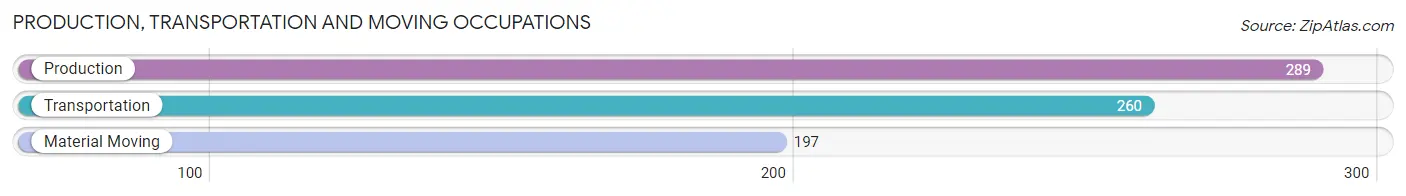
Production, Transportation and Moving Occupations by Sex
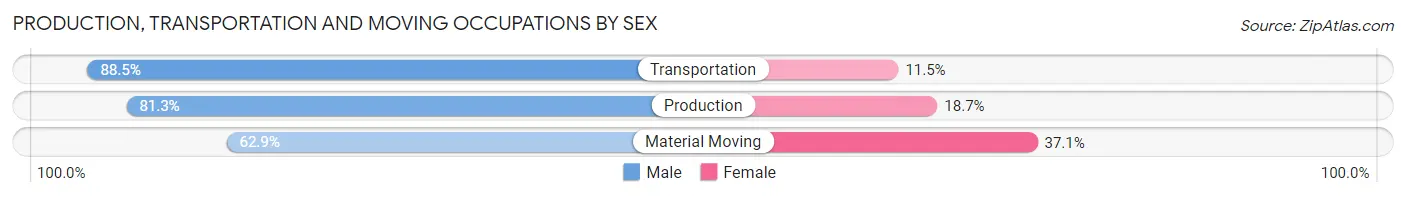
| Occupation | Male | Female |
| Production | 235 (81.3%) | 54 (18.7%) |
| Transportation | 230 (88.5%) | 30 (11.5%) |
| Material Moving | 124 (62.9%) | 73 (37.1%) |
| Total (Category) | 589 (78.9%) | 157 (21.0%) |
| Total (Overall) | 2,931 (55.3%) | 2,372 (44.7%) |
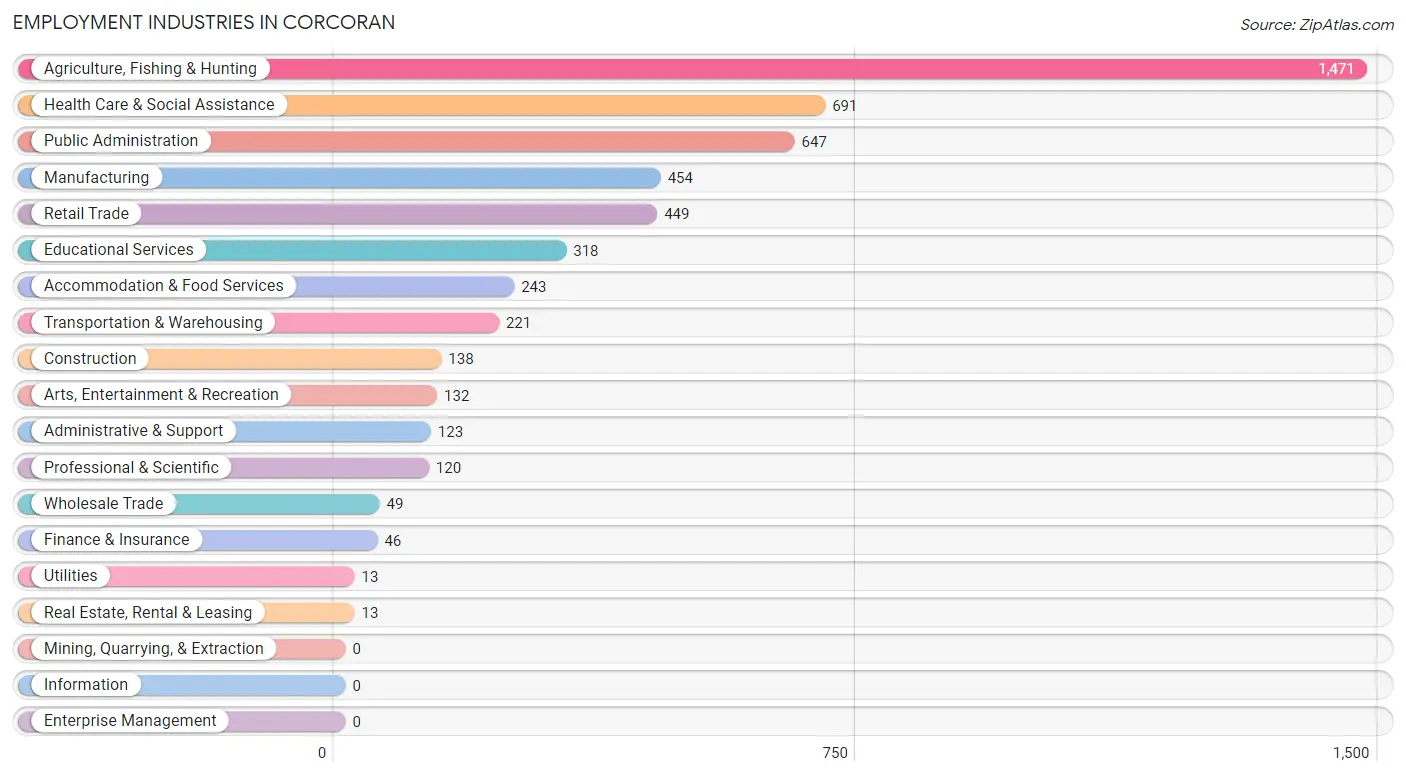
Employment Industries by Sex in Corcoran
Employment Industries in Corcoran
The major employment industries in Corcoran include Agriculture, Fishing & Hunting (1,471 | 27.7%), Health Care & Social Assistance (691 | 13.0%), Public Administration (647 | 12.2%), Manufacturing (454 | 8.6%), and Retail Trade (449 | 8.5%).
Employment Industries by Sex in Corcoran
The Corcoran industries that see more men than women are Utilities (100.0%), Real Estate, Rental & Leasing (100.0%), and Construction (94.9%), whereas the industries that tend to have a higher number of women are Finance & Insurance (100.0%), Educational Services (91.2%), and Health Care & Social Assistance (89.0%).
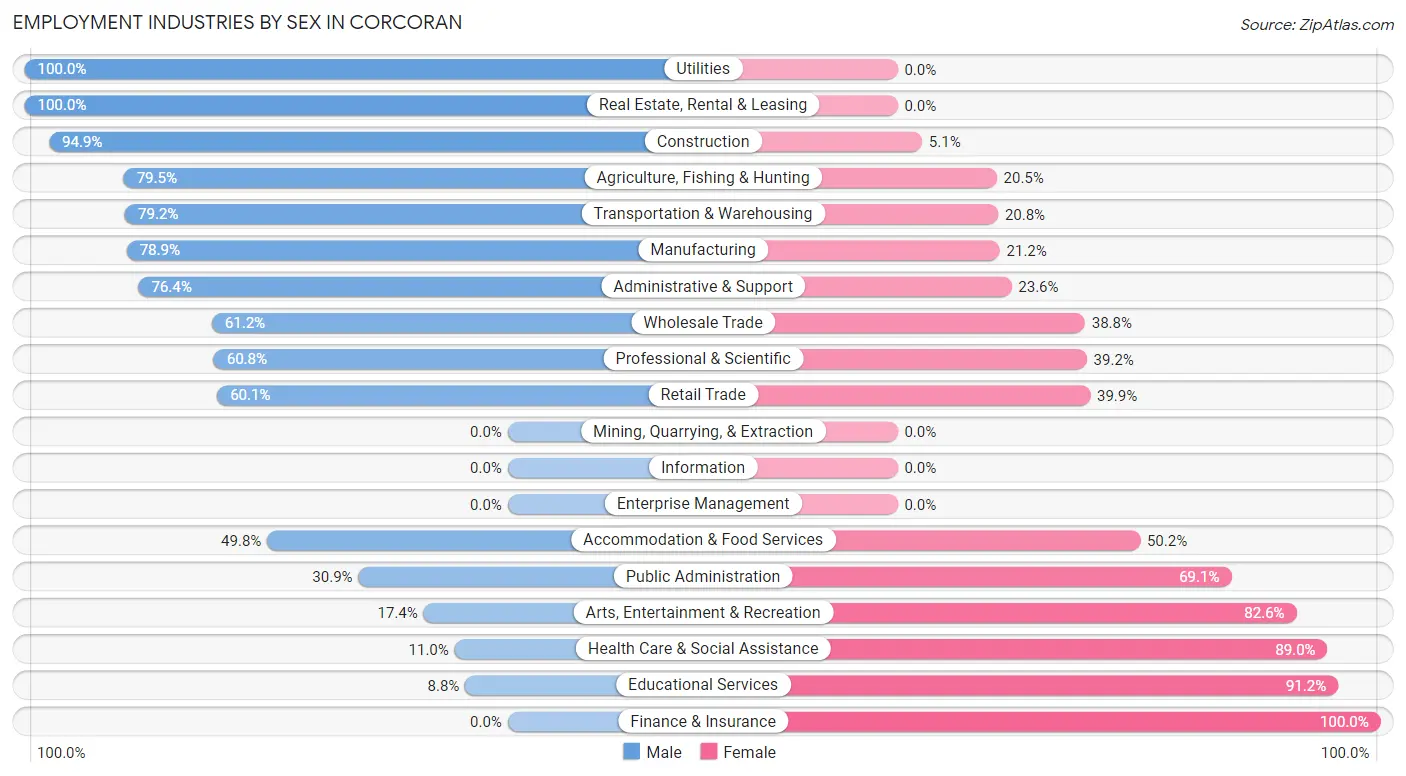
| Industry | Male | Female |
| Agriculture, Fishing & Hunting | 1,169 (79.5%) | 302 (20.5%) |
| Mining, Quarrying, & Extraction | 0 (0.0%) | 0 (0.0%) |
| Construction | 131 (94.9%) | 7 (5.1%) |
| Manufacturing | 358 (78.8%) | 96 (21.1%) |
| Wholesale Trade | 30 (61.2%) | 19 (38.8%) |
| Retail Trade | 270 (60.1%) | 179 (39.9%) |
| Transportation & Warehousing | 175 (79.2%) | 46 (20.8%) |
| Utilities | 13 (100.0%) | 0 (0.0%) |
| Information | 0 (0.0%) | 0 (0.0%) |
| Finance & Insurance | 0 (0.0%) | 46 (100.0%) |
| Real Estate, Rental & Leasing | 13 (100.0%) | 0 (0.0%) |
| Professional & Scientific | 73 (60.8%) | 47 (39.2%) |
| Enterprise Management | 0 (0.0%) | 0 (0.0%) |
| Administrative & Support | 94 (76.4%) | 29 (23.6%) |
| Educational Services | 28 (8.8%) | 290 (91.2%) |
| Health Care & Social Assistance | 76 (11.0%) | 615 (89.0%) |
| Arts, Entertainment & Recreation | 23 (17.4%) | 109 (82.6%) |
| Accommodation & Food Services | 121 (49.8%) | 122 (50.2%) |
| Public Administration | 200 (30.9%) | 447 (69.1%) |
| Total | 2,931 (55.3%) | 2,372 (44.7%) |
Education in Corcoran
School Enrollment in Corcoran
The most common levels of schooling among the 6,443 students in Corcoran are high school (2,300 | 35.7%), college / undergraduate (1,355 | 21.0%), and middle school (1,287 | 20.0%).
| School Level | # Students | % Students |
| Nursery / Preschool | 301 | 4.7% |
| Kindergarten | 184 | 2.9% |
| Elementary School | 944 | 14.6% |
| Middle School | 1,287 | 20.0% |
| High School | 2,300 | 35.7% |
| College / Undergraduate | 1,355 | 21.0% |
| Graduate / Professional | 72 | 1.1% |
| Total | 6,443 | 100.0% |
School Enrollment by Age by Funding Source in Corcoran
Out of a total of 6,443 students who are enrolled in schools in Corcoran, 1,682 (26.1%) attend a private institution, while the remaining 4,761 (73.9%) are enrolled in public schools. The age group of 35 years and over has the highest likelihood of being enrolled in private schools, with 938 (70.2% in the age bracket) enrolled. Conversely, the age group of 3 to 4 year olds has the lowest likelihood of being enrolled in a private school, with 196 (100.0% in the age bracket) attending a public institution.
| Age Bracket | Public School | Private School |
| 3 to 4 Year Olds | 196 (100.0%) | 0 (0.0%) |
| 5 to 9 Year Old | 1,183 (100.0%) | 0 (0.0%) |
| 10 to 14 Year Olds | 1,498 (99.0%) | 15 (1.0%) |
| 15 to 17 Year Olds | 721 (99.0%) | 7 (1.0%) |
| 18 to 19 Year Olds | 206 (77.7%) | 59 (22.3%) |
| 20 to 24 Year Olds | 271 (67.4%) | 131 (32.6%) |
| 25 to 34 Year Olds | 289 (35.3%) | 530 (64.7%) |
| 35 Years and over | 399 (29.8%) | 938 (70.2%) |
| Total | 4,761 (73.9%) | 1,682 (26.1%) |
Educational Attainment by Field of Study in Corcoran
Arts & humanities (104 | 16.5%), education (92 | 14.6%), science & technology (75 | 11.9%), liberal arts & history (51 | 8.1%), and business (45 | 7.1%) are the most common fields of study among 631 individuals in Corcoran who have obtained a bachelor's degree or higher.
| Field of Study | # Graduates | % Graduates |
| Computers & Mathematics | 12 | 1.9% |
| Bio, Nature & Agricultural | 28 | 4.4% |
| Physical & Health Sciences | 38 | 6.0% |
| Psychology | 39 | 6.2% |
| Social Sciences | 38 | 6.0% |
| Engineering | 28 | 4.4% |
| Multidisciplinary Studies | 40 | 6.3% |
| Science & Technology | 75 | 11.9% |
| Business | 45 | 7.1% |
| Education | 92 | 14.6% |
| Literature & Languages | 21 | 3.3% |
| Liberal Arts & History | 51 | 8.1% |
| Visual & Performing Arts | 10 | 1.6% |
| Communications | 10 | 1.6% |
| Arts & Humanities | 104 | 16.5% |
| Total | 631 | 100.0% |
Transportation & Commute in Corcoran
Vehicle Availability by Sex in Corcoran
The most prevalent vehicle ownership categories in Corcoran are males with 3 vehicles (913, accounting for 31.8%) and females with 3 vehicles (444, making up 39.3%).
| Vehicles Available | Male | Female |
| No Vehicle | 100 (3.5%) | 71 (3.1%) |
| 1 Vehicle | 561 (19.6%) | 475 (20.4%) |
| 2 Vehicles | 844 (29.4%) | 873 (37.6%) |
| 3 Vehicles | 913 (31.8%) | 444 (19.1%) |
| 4 Vehicles | 260 (9.1%) | 291 (12.5%) |
| 5 or more Vehicles | 190 (6.6%) | 170 (7.3%) |
| Total | 2,868 (100.0%) | 2,324 (100.0%) |
Commute Time in Corcoran
The most frequently occuring commute durations in Corcoran are 5 to 9 minutes (1,231 commuters, 24.9%), 30 to 34 minutes (795 commuters, 16.1%), and 10 to 14 minutes (781 commuters, 15.8%).
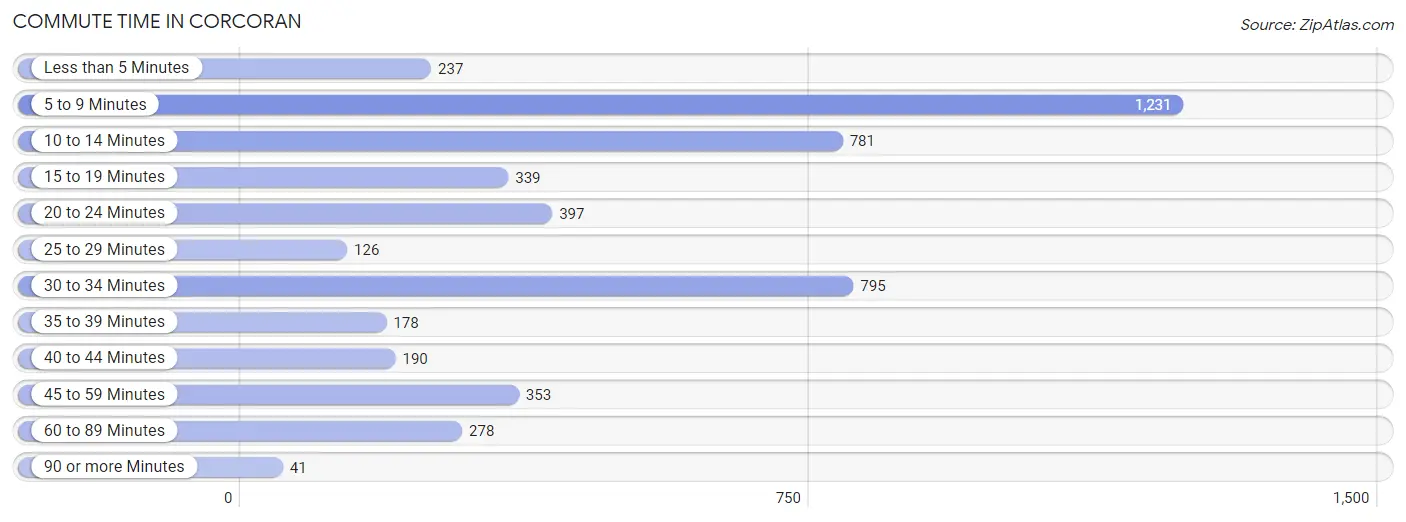
| Commute Time | # Commuters | % Commuters |
| Less than 5 Minutes | 237 | 4.8% |
| 5 to 9 Minutes | 1,231 | 24.9% |
| 10 to 14 Minutes | 781 | 15.8% |
| 15 to 19 Minutes | 339 | 6.9% |
| 20 to 24 Minutes | 397 | 8.0% |
| 25 to 29 Minutes | 126 | 2.5% |
| 30 to 34 Minutes | 795 | 16.1% |
| 35 to 39 Minutes | 178 | 3.6% |
| 40 to 44 Minutes | 190 | 3.8% |
| 45 to 59 Minutes | 353 | 7.1% |
| 60 to 89 Minutes | 278 | 5.6% |
| 90 or more Minutes | 41 | 0.8% |
Commute Time by Sex in Corcoran
The most common commute times in Corcoran are 5 to 9 minutes (750 commuters, 26.8%) for males and 5 to 9 minutes (481 commuters, 22.4%) for females.
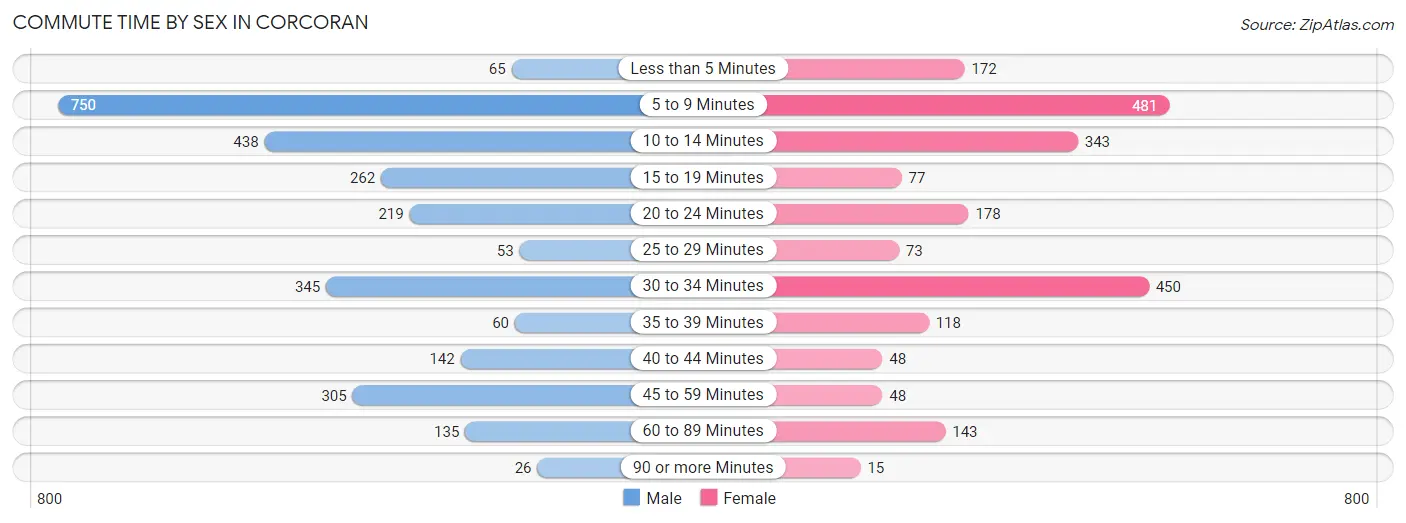
| Commute Time | Male | Female |
| Less than 5 Minutes | 65 (2.3%) | 172 (8.0%) |
| 5 to 9 Minutes | 750 (26.8%) | 481 (22.4%) |
| 10 to 14 Minutes | 438 (15.6%) | 343 (16.0%) |
| 15 to 19 Minutes | 262 (9.4%) | 77 (3.6%) |
| 20 to 24 Minutes | 219 (7.8%) | 178 (8.3%) |
| 25 to 29 Minutes | 53 (1.9%) | 73 (3.4%) |
| 30 to 34 Minutes | 345 (12.3%) | 450 (21.0%) |
| 35 to 39 Minutes | 60 (2.1%) | 118 (5.5%) |
| 40 to 44 Minutes | 142 (5.1%) | 48 (2.2%) |
| 45 to 59 Minutes | 305 (10.9%) | 48 (2.2%) |
| 60 to 89 Minutes | 135 (4.8%) | 143 (6.7%) |
| 90 or more Minutes | 26 (0.9%) | 15 (0.7%) |
Time of Departure to Work by Sex in Corcoran
The most frequent times of departure to work in Corcoran are 5:30 AM to 5:59 AM (577, 20.6%) for males and 7:30 AM to 7:59 AM (558, 26.0%) for females.
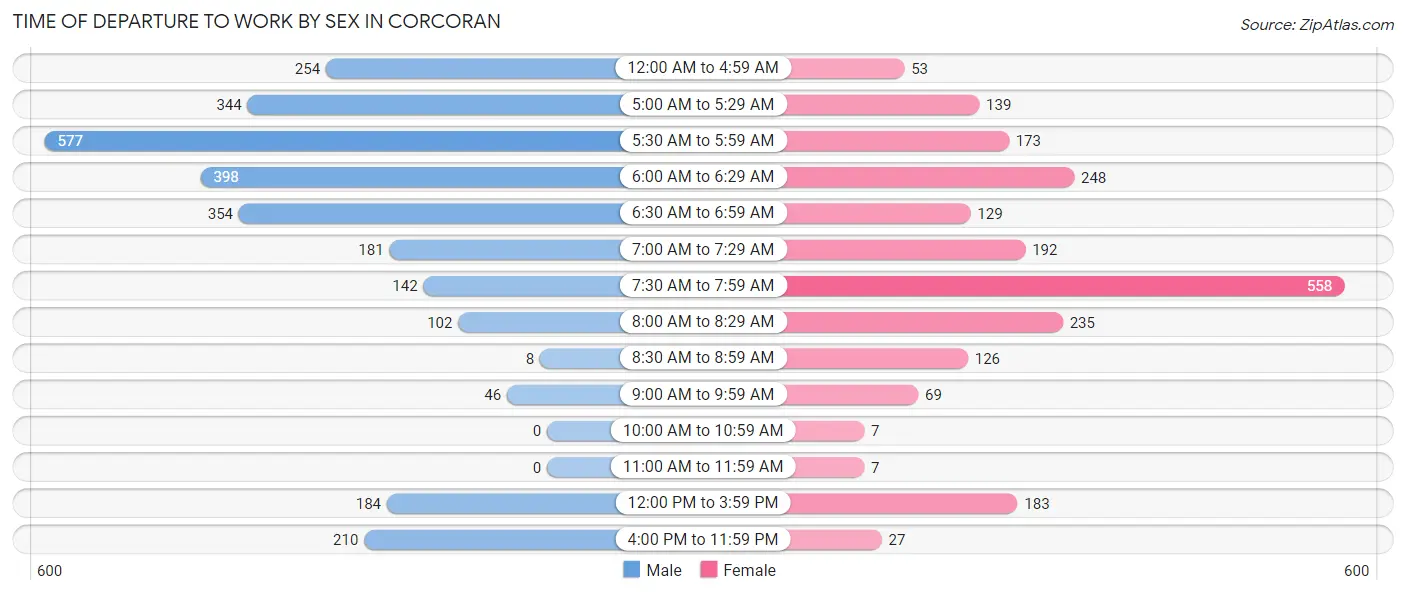
| Time of Departure | Male | Female |
| 12:00 AM to 4:59 AM | 254 (9.1%) | 53 (2.5%) |
| 5:00 AM to 5:29 AM | 344 (12.3%) | 139 (6.5%) |
| 5:30 AM to 5:59 AM | 577 (20.6%) | 173 (8.1%) |
| 6:00 AM to 6:29 AM | 398 (14.2%) | 248 (11.6%) |
| 6:30 AM to 6:59 AM | 354 (12.6%) | 129 (6.0%) |
| 7:00 AM to 7:29 AM | 181 (6.5%) | 192 (8.9%) |
| 7:30 AM to 7:59 AM | 142 (5.1%) | 558 (26.0%) |
| 8:00 AM to 8:29 AM | 102 (3.6%) | 235 (11.0%) |
| 8:30 AM to 8:59 AM | 8 (0.3%) | 126 (5.9%) |
| 9:00 AM to 9:59 AM | 46 (1.6%) | 69 (3.2%) |
| 10:00 AM to 10:59 AM | 0 (0.0%) | 7 (0.3%) |
| 11:00 AM to 11:59 AM | 0 (0.0%) | 7 (0.3%) |
| 12:00 PM to 3:59 PM | 184 (6.6%) | 183 (8.5%) |
| 4:00 PM to 11:59 PM | 210 (7.5%) | 27 (1.3%) |
| Total | 2,800 (100.0%) | 2,146 (100.0%) |
Housing Occupancy in Corcoran
Occupancy by Ownership in Corcoran
Of the total 4,374 dwellings in Corcoran, owner-occupied units account for 2,243 (51.3%), while renter-occupied units make up 2,131 (48.7%).
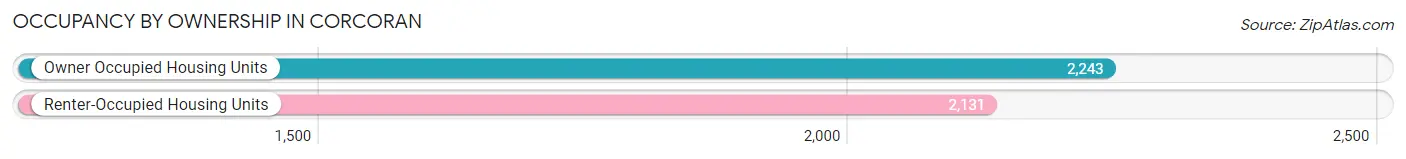
| Occupancy | # Housing Units | % Housing Units |
| Owner Occupied Housing Units | 2,243 | 51.3% |
| Renter-Occupied Housing Units | 2,131 | 48.7% |
| Total Occupied Housing Units | 4,374 | 100.0% |
Occupancy by Household Size in Corcoran
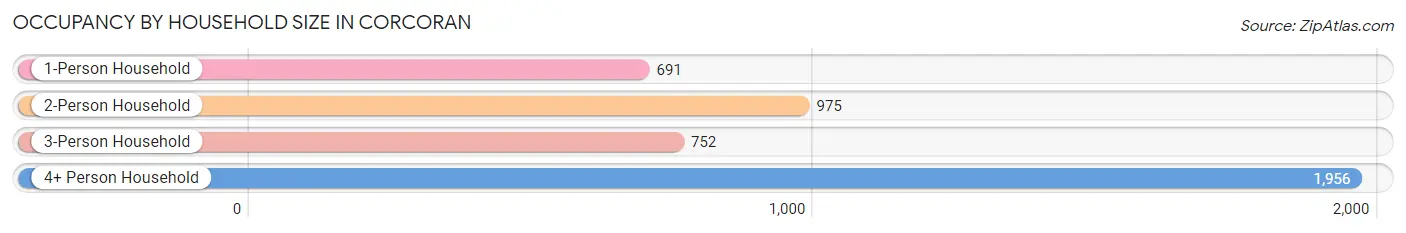
| Household Size | # Housing Units | % Housing Units |
| 1-Person Household | 691 | 15.8% |
| 2-Person Household | 975 | 22.3% |
| 3-Person Household | 752 | 17.2% |
| 4+ Person Household | 1,956 | 44.7% |
| Total Housing Units | 4,374 | 100.0% |
Occupancy by Ownership by Household Size in Corcoran
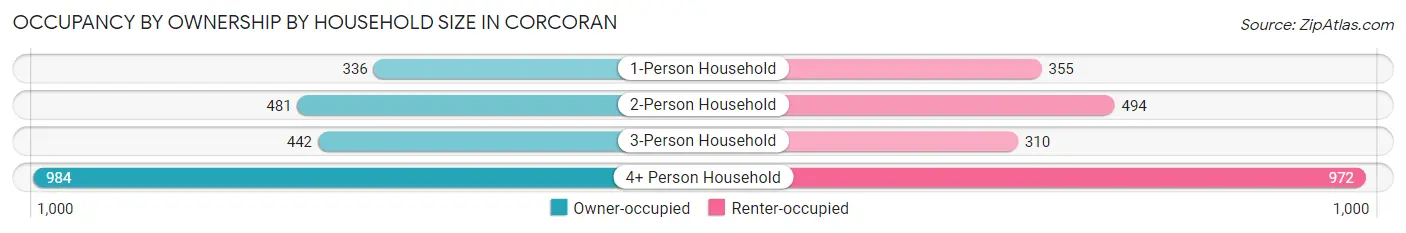
| Household Size | Owner-occupied | Renter-occupied |
| 1-Person Household | 336 (48.6%) | 355 (51.4%) |
| 2-Person Household | 481 (49.3%) | 494 (50.7%) |
| 3-Person Household | 442 (58.8%) | 310 (41.2%) |
| 4+ Person Household | 984 (50.3%) | 972 (49.7%) |
| Total Housing Units | 2,243 (51.3%) | 2,131 (48.7%) |
Occupancy by Educational Attainment in Corcoran

| Household Size | Owner-occupied | Renter-occupied |
| Less than High School | 916 (57.5%) | 676 (42.5%) |
| High School Diploma | 579 (44.7%) | 715 (55.3%) |
| College/Associate Degree | 541 (46.4%) | 626 (53.6%) |
| Bachelor's Degree or higher | 207 (64.5%) | 114 (35.5%) |
Occupancy by Age of Householder in Corcoran
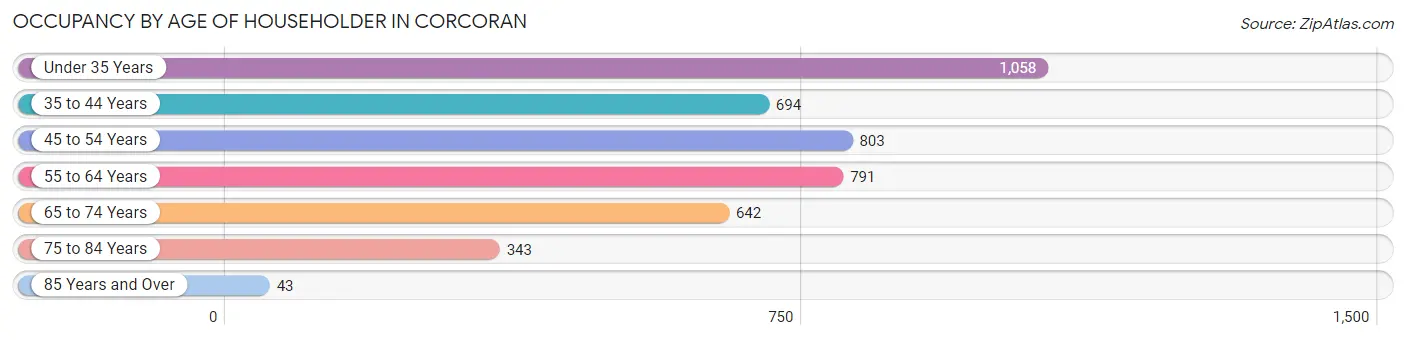
| Age Bracket | # Households | % Households |
| Under 35 Years | 1,058 | 24.2% |
| 35 to 44 Years | 694 | 15.9% |
| 45 to 54 Years | 803 | 18.4% |
| 55 to 64 Years | 791 | 18.1% |
| 65 to 74 Years | 642 | 14.7% |
| 75 to 84 Years | 343 | 7.8% |
| 85 Years and Over | 43 | 1.0% |
| Total | 4,374 | 100.0% |
Housing Finances in Corcoran
Median Income by Occupancy in Corcoran
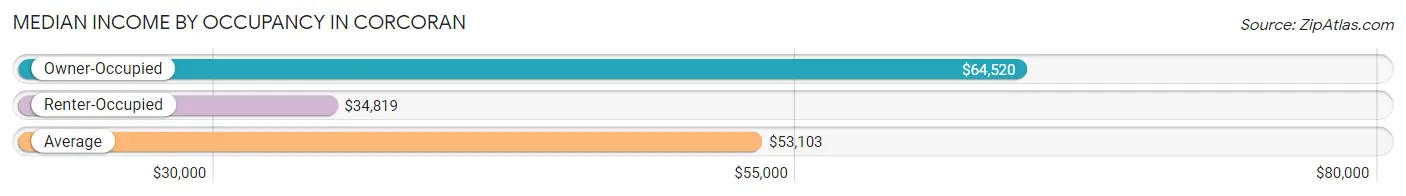
| Occupancy Type | # Households | Median Income |
| Owner-Occupied | 2,243 (51.3%) | $64,520 |
| Renter-Occupied | 2,131 (48.7%) | $34,819 |
| Average | 4,374 (100.0%) | $53,103 |
Occupancy by Householder Income Bracket in Corcoran
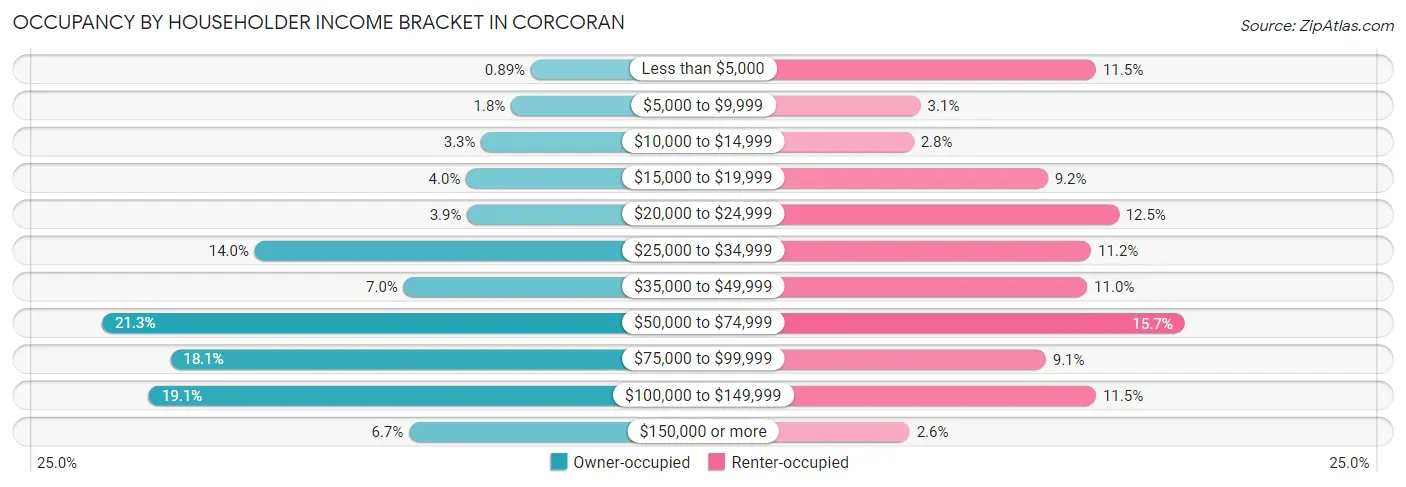
| Income Bracket | Owner-occupied | Renter-occupied |
| Less than $5,000 | 20 (0.9%) | 244 (11.5%) |
| $5,000 to $9,999 | 41 (1.8%) | 66 (3.1%) |
| $10,000 to $14,999 | 73 (3.3%) | 59 (2.8%) |
| $15,000 to $19,999 | 89 (4.0%) | 195 (9.1%) |
| $20,000 to $24,999 | 88 (3.9%) | 267 (12.5%) |
| $25,000 to $34,999 | 315 (14.0%) | 239 (11.2%) |
| $35,000 to $49,999 | 156 (7.0%) | 235 (11.0%) |
| $50,000 to $74,999 | 478 (21.3%) | 334 (15.7%) |
| $75,000 to $99,999 | 405 (18.1%) | 193 (9.1%) |
| $100,000 to $149,999 | 428 (19.1%) | 244 (11.5%) |
| $150,000 or more | 150 (6.7%) | 55 (2.6%) |
| Total | 2,243 (100.0%) | 2,131 (100.0%) |
Monthly Housing Cost Tiers in Corcoran
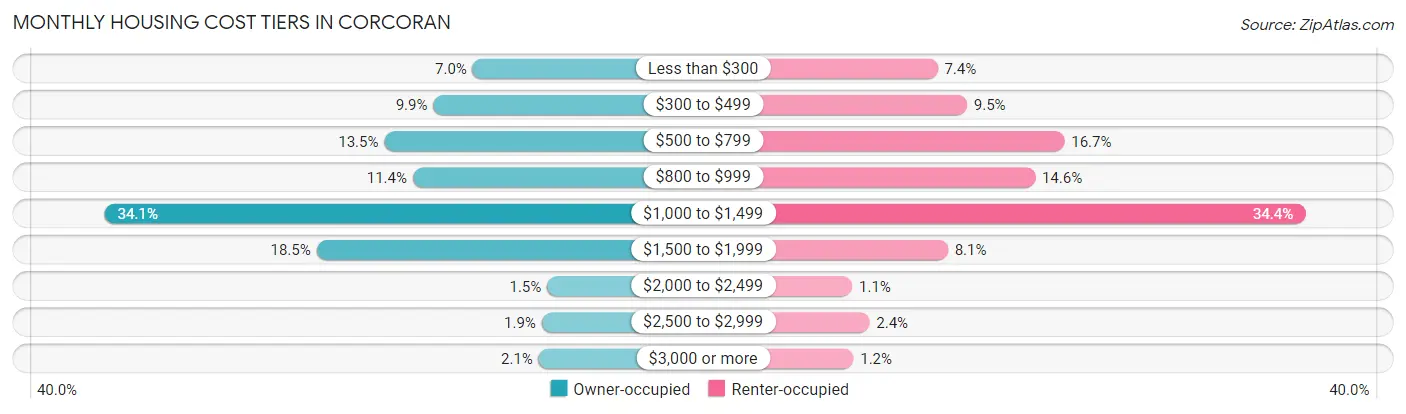
| Monthly Cost | Owner-occupied | Renter-occupied |
| Less than $300 | 157 (7.0%) | 157 (7.4%) |
| $300 to $499 | 222 (9.9%) | 203 (9.5%) |
| $500 to $799 | 303 (13.5%) | 356 (16.7%) |
| $800 to $999 | 256 (11.4%) | 310 (14.5%) |
| $1,000 to $1,499 | 765 (34.1%) | 734 (34.4%) |
| $1,500 to $1,999 | 415 (18.5%) | 173 (8.1%) |
| $2,000 to $2,499 | 34 (1.5%) | 23 (1.1%) |
| $2,500 to $2,999 | 43 (1.9%) | 50 (2.4%) |
| $3,000 or more | 48 (2.1%) | 25 (1.2%) |
| Total | 2,243 (100.0%) | 2,131 (100.0%) |
Physical Housing Characteristics in Corcoran
Housing Structures in Corcoran
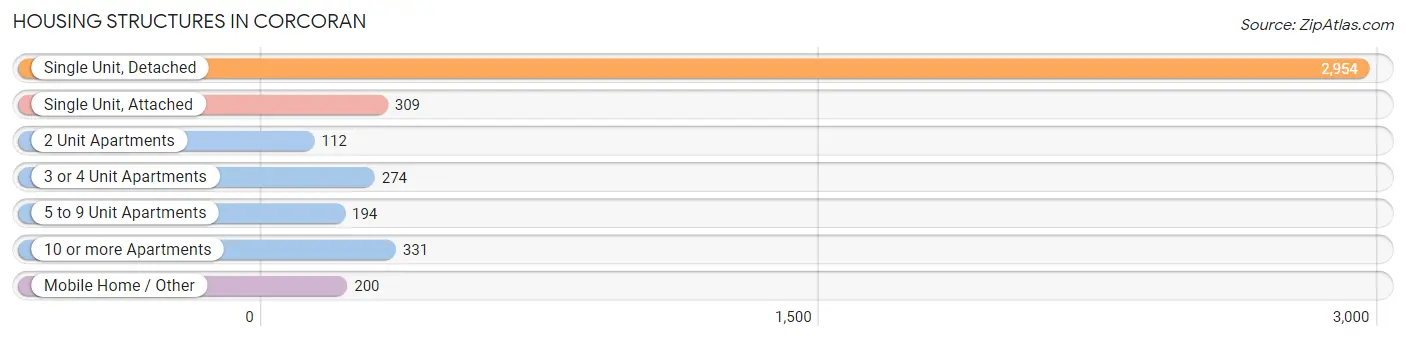
| Structure Type | # Housing Units | % Housing Units |
| Single Unit, Detached | 2,954 | 67.5% |
| Single Unit, Attached | 309 | 7.1% |
| 2 Unit Apartments | 112 | 2.6% |
| 3 or 4 Unit Apartments | 274 | 6.3% |
| 5 to 9 Unit Apartments | 194 | 4.4% |
| 10 or more Apartments | 331 | 7.6% |
| Mobile Home / Other | 200 | 4.6% |
| Total | 4,374 | 100.0% |
Housing Structures by Occupancy in Corcoran
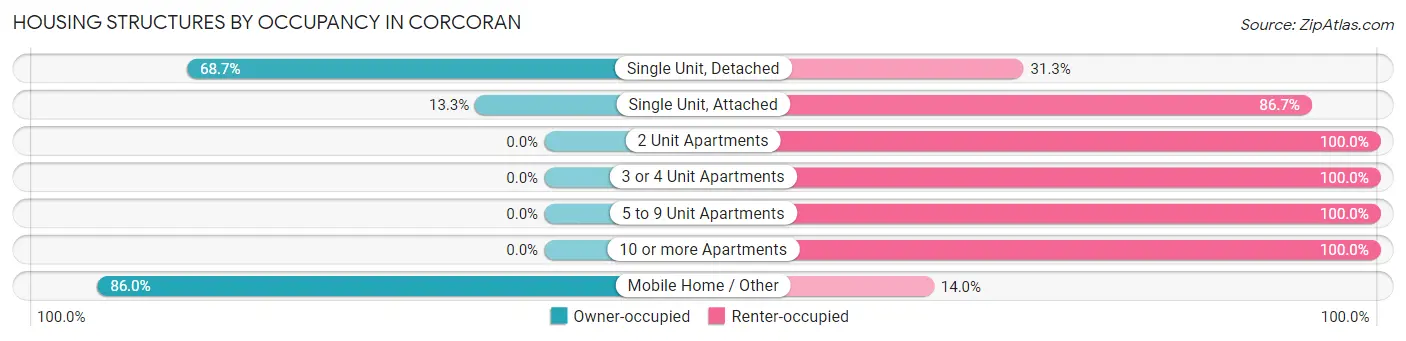
| Structure Type | Owner-occupied | Renter-occupied |
| Single Unit, Detached | 2,030 (68.7%) | 924 (31.3%) |
| Single Unit, Attached | 41 (13.3%) | 268 (86.7%) |
| 2 Unit Apartments | 0 (0.0%) | 112 (100.0%) |
| 3 or 4 Unit Apartments | 0 (0.0%) | 274 (100.0%) |
| 5 to 9 Unit Apartments | 0 (0.0%) | 194 (100.0%) |
| 10 or more Apartments | 0 (0.0%) | 331 (100.0%) |
| Mobile Home / Other | 172 (86.0%) | 28 (14.0%) |
| Total | 2,243 (51.3%) | 2,131 (48.7%) |
Housing Structures by Number of Rooms in Corcoran
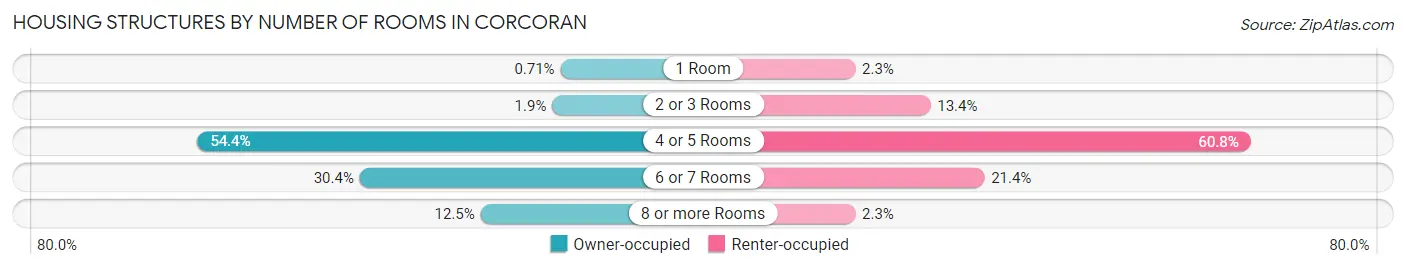
| Number of Rooms | Owner-occupied | Renter-occupied |
| 1 Room | 16 (0.7%) | 48 (2.2%) |
| 2 or 3 Rooms | 43 (1.9%) | 285 (13.4%) |
| 4 or 5 Rooms | 1,221 (54.4%) | 1,295 (60.8%) |
| 6 or 7 Rooms | 682 (30.4%) | 455 (21.3%) |
| 8 or more Rooms | 281 (12.5%) | 48 (2.2%) |
| Total | 2,243 (100.0%) | 2,131 (100.0%) |
Housing Structure by Heating Type in Corcoran
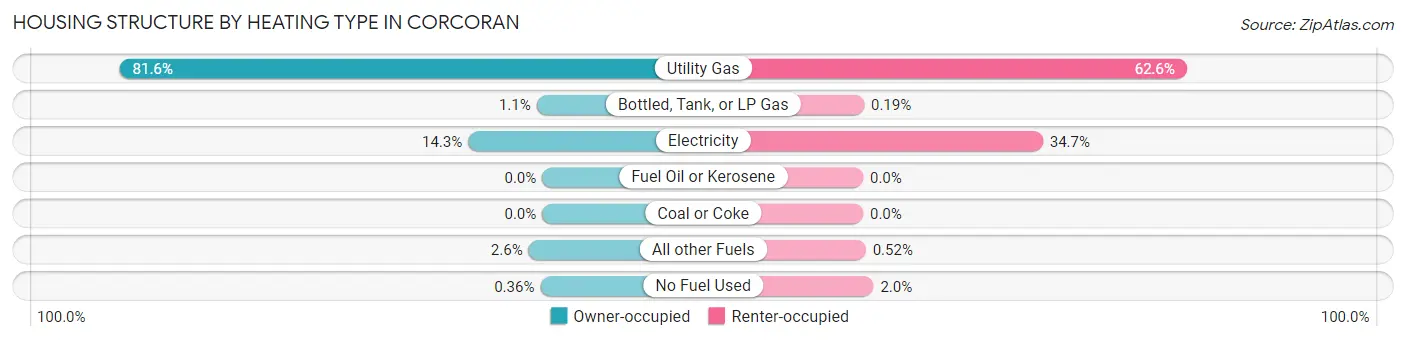
| Heating Type | Owner-occupied | Renter-occupied |
| Utility Gas | 1,831 (81.6%) | 1,333 (62.5%) |
| Bottled, Tank, or LP Gas | 24 (1.1%) | 4 (0.2%) |
| Electricity | 321 (14.3%) | 740 (34.7%) |
| Fuel Oil or Kerosene | 0 (0.0%) | 0 (0.0%) |
| Coal or Coke | 0 (0.0%) | 0 (0.0%) |
| All other Fuels | 59 (2.6%) | 11 (0.5%) |
| No Fuel Used | 8 (0.4%) | 43 (2.0%) |
| Total | 2,243 (100.0%) | 2,131 (100.0%) |
Household Vehicle Usage in Corcoran
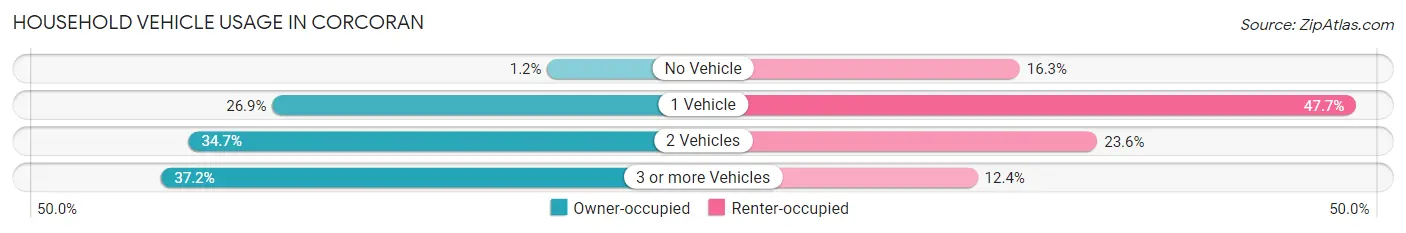
| Vehicles per Household | Owner-occupied | Renter-occupied |
| No Vehicle | 27 (1.2%) | 348 (16.3%) |
| 1 Vehicle | 603 (26.9%) | 1,017 (47.7%) |
| 2 Vehicles | 778 (34.7%) | 502 (23.6%) |
| 3 or more Vehicles | 835 (37.2%) | 264 (12.4%) |
| Total | 2,243 (100.0%) | 2,131 (100.0%) |
Real Estate & Mortgages in Corcoran
Real Estate and Mortgage Overview in Corcoran
| Characteristic | Without Mortgage | With Mortgage |
| Housing Units | 707 | 1,536 |
| Median Property Value | $169,800 | $224,200 |
| Median Household Income | $56,375 | $104 |
| Monthly Housing Costs | $471 | $48 |
| Real Estate Taxes | $884 | $8 |
Property Value by Mortgage Status in Corcoran
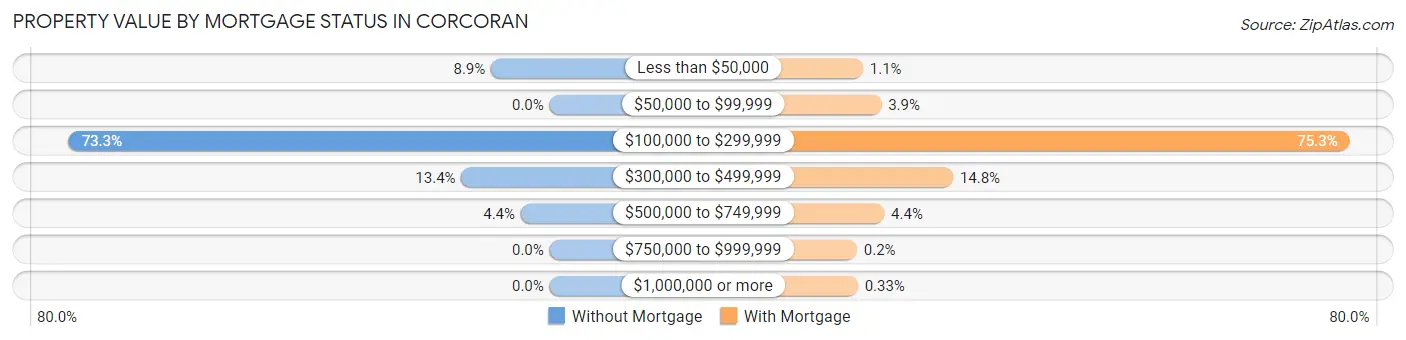
| Property Value | Without Mortgage | With Mortgage |
| Less than $50,000 | 63 (8.9%) | 17 (1.1%) |
| $50,000 to $99,999 | 0 (0.0%) | 60 (3.9%) |
| $100,000 to $299,999 | 518 (73.3%) | 1,156 (75.3%) |
| $300,000 to $499,999 | 95 (13.4%) | 228 (14.8%) |
| $500,000 to $749,999 | 31 (4.4%) | 67 (4.4%) |
| $750,000 to $999,999 | 0 (0.0%) | 3 (0.2%) |
| $1,000,000 or more | 0 (0.0%) | 5 (0.3%) |
| Total | 707 (100.0%) | 1,536 (100.0%) |
Household Income by Mortgage Status in Corcoran
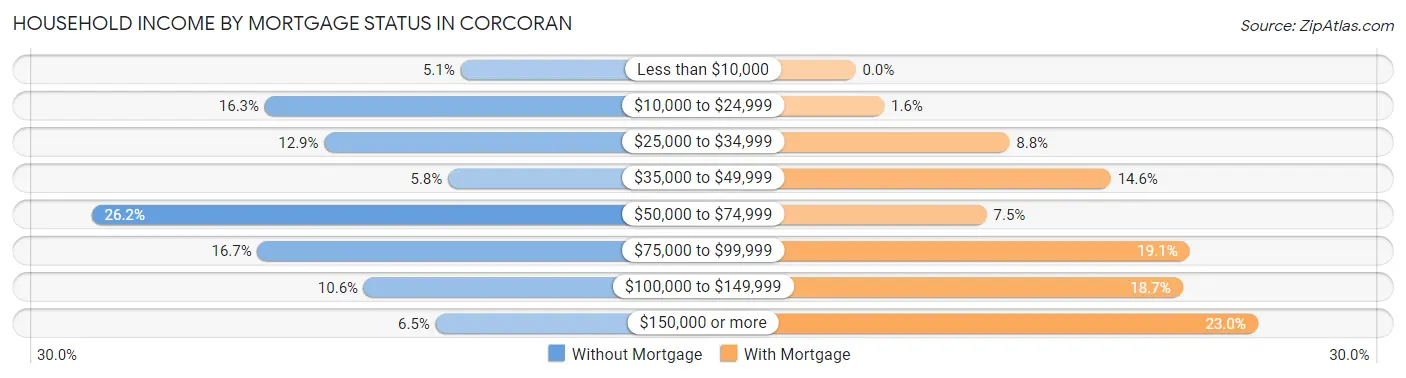
| Household Income | Without Mortgage | With Mortgage |
| Less than $10,000 | 36 (5.1%) | 0 (0.0%) |
| $10,000 to $24,999 | 115 (16.3%) | 25 (1.6%) |
| $25,000 to $34,999 | 91 (12.9%) | 135 (8.8%) |
| $35,000 to $49,999 | 41 (5.8%) | 224 (14.6%) |
| $50,000 to $74,999 | 185 (26.2%) | 115 (7.5%) |
| $75,000 to $99,999 | 118 (16.7%) | 293 (19.1%) |
| $100,000 to $149,999 | 75 (10.6%) | 287 (18.7%) |
| $150,000 or more | 46 (6.5%) | 353 (23.0%) |
| Total | 707 (100.0%) | 1,536 (100.0%) |
Property Value to Household Income Ratio in Corcoran
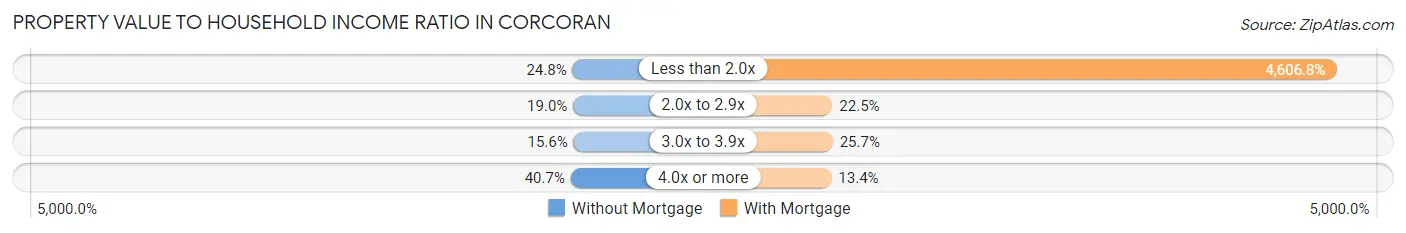
| Value-to-Income Ratio | Without Mortgage | With Mortgage |
| Less than 2.0x | 175 (24.7%) | 70,761 (4,606.8%) |
| 2.0x to 2.9x | 134 (19.0%) | 346 (22.5%) |
| 3.0x to 3.9x | 110 (15.6%) | 394 (25.7%) |
| 4.0x or more | 288 (40.7%) | 206 (13.4%) |
| Total | 707 (100.0%) | 1,536 (100.0%) |
Real Estate Taxes by Mortgage Status in Corcoran
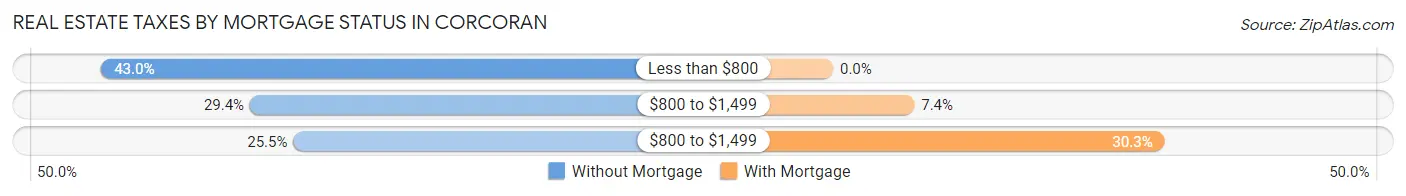
| Property Taxes | Without Mortgage | With Mortgage |
| Less than $800 | 304 (43.0%) | 0 (0.0%) |
| $800 to $1,499 | 208 (29.4%) | 114 (7.4%) |
| $800 to $1,499 | 180 (25.5%) | 465 (30.3%) |
| Total | 707 (100.0%) | 1,536 (100.0%) |
Health & Disability in Corcoran
Health Insurance Coverage by Age in Corcoran
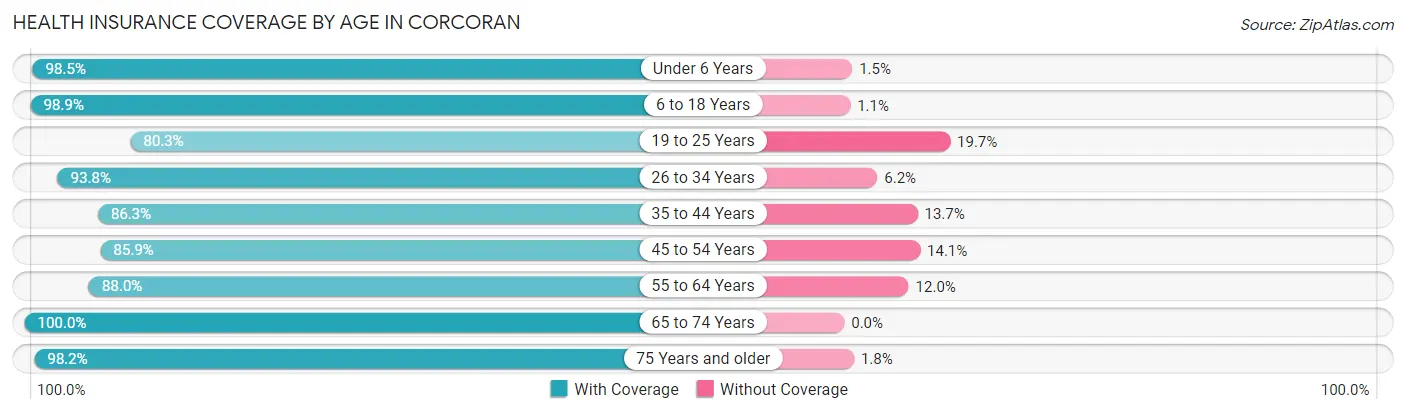
| Age Bracket | With Coverage | Without Coverage |
| Under 6 Years | 1,529 (98.5%) | 23 (1.5%) |
| 6 to 18 Years | 3,419 (98.9%) | 38 (1.1%) |
| 19 to 25 Years | 1,359 (80.3%) | 334 (19.7%) |
| 26 to 34 Years | 1,982 (93.8%) | 130 (6.2%) |
| 35 to 44 Years | 1,239 (86.3%) | 196 (13.7%) |
| 45 to 54 Years | 1,354 (85.9%) | 223 (14.1%) |
| 55 to 64 Years | 1,173 (88.0%) | 160 (12.0%) |
| 65 to 74 Years | 1,227 (100.0%) | 0 (0.0%) |
| 75 Years and older | 760 (98.2%) | 14 (1.8%) |
| Total | 14,042 (92.6%) | 1,118 (7.4%) |
Health Insurance Coverage by Citizenship Status in Corcoran
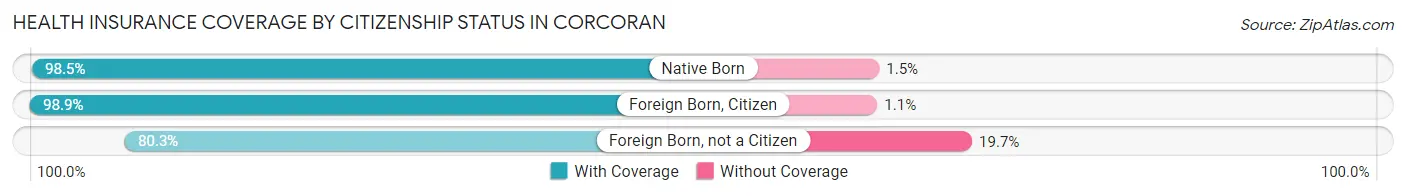
| Citizenship Status | With Coverage | Without Coverage |
| Native Born | 1,529 (98.5%) | 23 (1.5%) |
| Foreign Born, Citizen | 3,419 (98.9%) | 38 (1.1%) |
| Foreign Born, not a Citizen | 1,359 (80.3%) | 334 (19.7%) |
Health Insurance Coverage by Household Income in Corcoran
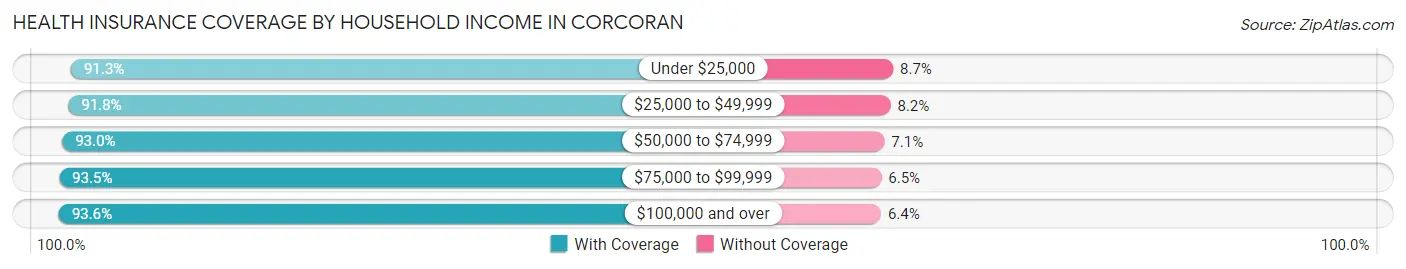
| Household Income | With Coverage | Without Coverage |
| Under $25,000 | 2,693 (91.3%) | 256 (8.7%) |
| $25,000 to $49,999 | 3,151 (91.8%) | 281 (8.2%) |
| $50,000 to $74,999 | 2,518 (92.9%) | 191 (7.0%) |
| $75,000 to $99,999 | 2,197 (93.5%) | 152 (6.5%) |
| $100,000 and over | 3,479 (93.6%) | 238 (6.4%) |
Public vs Private Health Insurance Coverage by Age in Corcoran
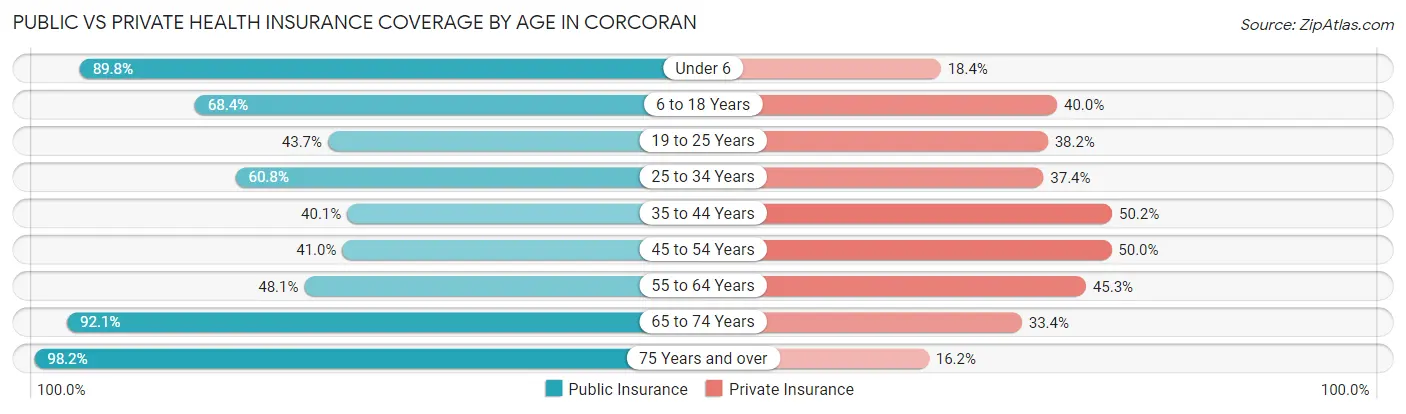
| Age Bracket | Public Insurance | Private Insurance |
| Under 6 | 1,393 (89.8%) | 285 (18.4%) |
| 6 to 18 Years | 2,364 (68.4%) | 1,381 (40.0%) |
| 19 to 25 Years | 740 (43.7%) | 647 (38.2%) |
| 25 to 34 Years | 1,285 (60.8%) | 790 (37.4%) |
| 35 to 44 Years | 576 (40.1%) | 720 (50.2%) |
| 45 to 54 Years | 647 (41.0%) | 789 (50.0%) |
| 55 to 64 Years | 641 (48.1%) | 604 (45.3%) |
| 65 to 74 Years | 1,130 (92.1%) | 410 (33.4%) |
| 75 Years and over | 760 (98.2%) | 125 (16.2%) |
| Total | 9,536 (62.9%) | 5,751 (37.9%) |
Disability Status by Sex by Age in Corcoran
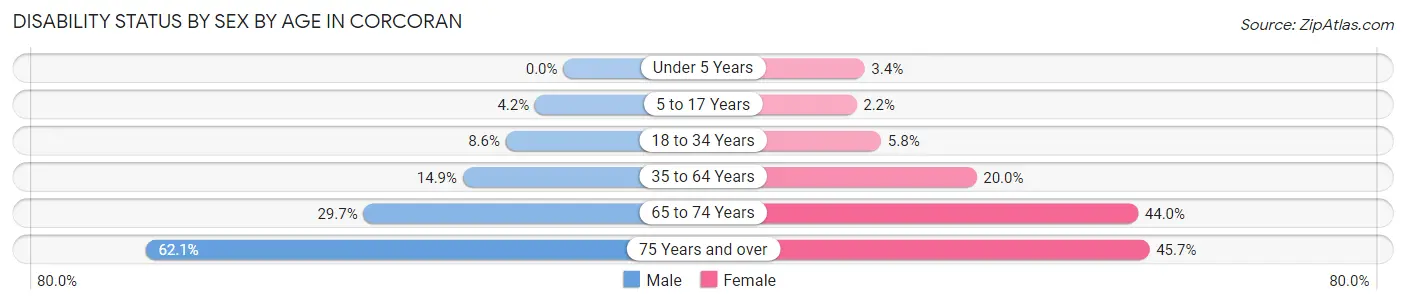
| Age Bracket | Male | Female |
| Under 5 Years | 0 (0.0%) | 25 (3.4%) |
| 5 to 17 Years | 67 (4.2%) | 41 (2.1%) |
| 18 to 34 Years | 168 (8.6%) | 120 (5.8%) |
| 35 to 64 Years | 333 (14.9%) | 422 (20.0%) |
| 65 to 74 Years | 165 (29.7%) | 295 (44.0%) |
| 75 Years and over | 188 (62.1%) | 215 (45.7%) |
Disability Class by Sex by Age in Corcoran
Disability Class: Hearing Difficulty
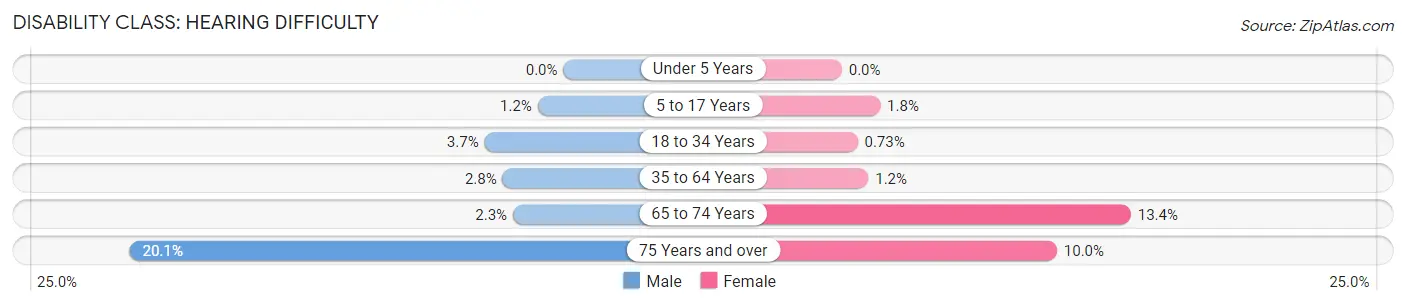
| Age Bracket | Male | Female |
| Under 5 Years | 0 (0.0%) | 0 (0.0%) |
| 5 to 17 Years | 19 (1.2%) | 34 (1.8%) |
| 18 to 34 Years | 72 (3.7%) | 15 (0.7%) |
| 35 to 64 Years | 63 (2.8%) | 26 (1.2%) |
| 65 to 74 Years | 13 (2.3%) | 90 (13.4%) |
| 75 Years and over | 61 (20.1%) | 47 (10.0%) |
Disability Class: Vision Difficulty
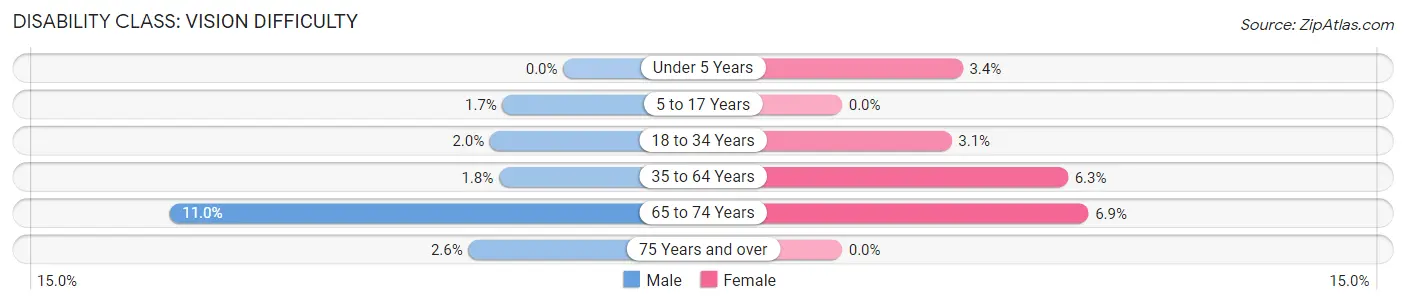
| Age Bracket | Male | Female |
| Under 5 Years | 0 (0.0%) | 25 (3.4%) |
| 5 to 17 Years | 27 (1.7%) | 0 (0.0%) |
| 18 to 34 Years | 40 (2.0%) | 63 (3.0%) |
| 35 to 64 Years | 40 (1.8%) | 133 (6.3%) |
| 65 to 74 Years | 61 (11.0%) | 46 (6.9%) |
| 75 Years and over | 8 (2.6%) | 0 (0.0%) |
Disability Class: Cognitive Difficulty
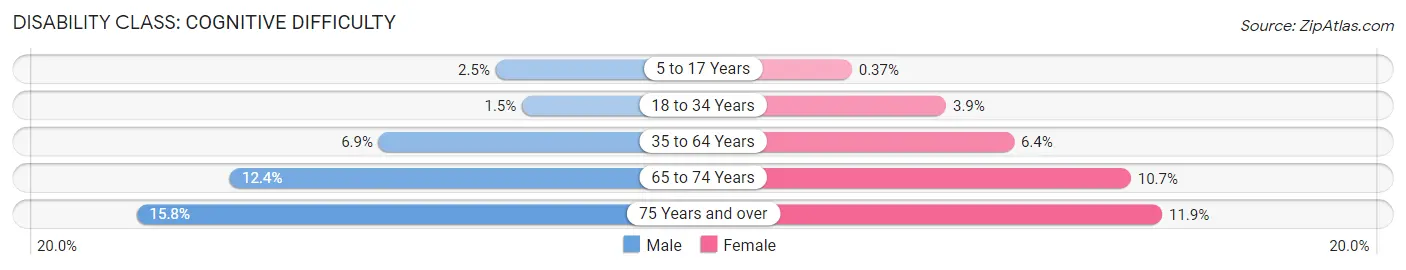
| Age Bracket | Male | Female |
| 5 to 17 Years | 40 (2.5%) | 7 (0.4%) |
| 18 to 34 Years | 30 (1.5%) | 80 (3.9%) |
| 35 to 64 Years | 153 (6.9%) | 135 (6.4%) |
| 65 to 74 Years | 69 (12.4%) | 72 (10.7%) |
| 75 Years and over | 48 (15.8%) | 56 (11.9%) |
Disability Class: Ambulatory Difficulty
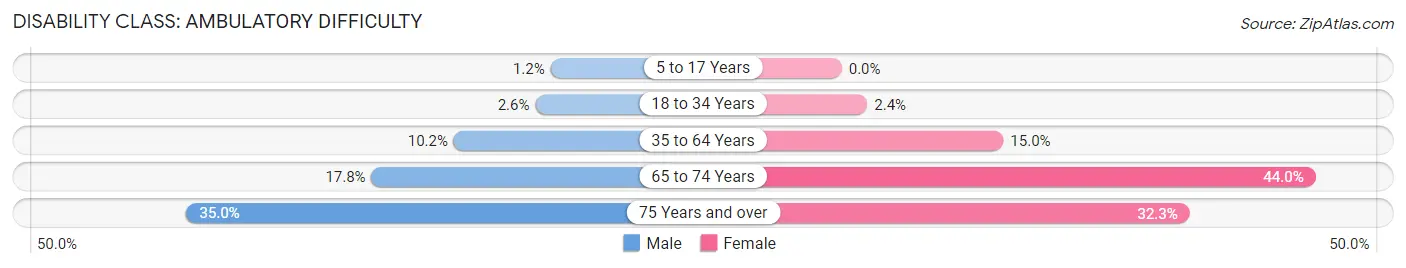
| Age Bracket | Male | Female |
| 5 to 17 Years | 19 (1.2%) | 0 (0.0%) |
| 18 to 34 Years | 51 (2.6%) | 49 (2.4%) |
| 35 to 64 Years | 227 (10.2%) | 317 (15.0%) |
| 65 to 74 Years | 99 (17.8%) | 295 (44.0%) |
| 75 Years and over | 106 (35.0%) | 152 (32.3%) |
Disability Class: Self-Care Difficulty
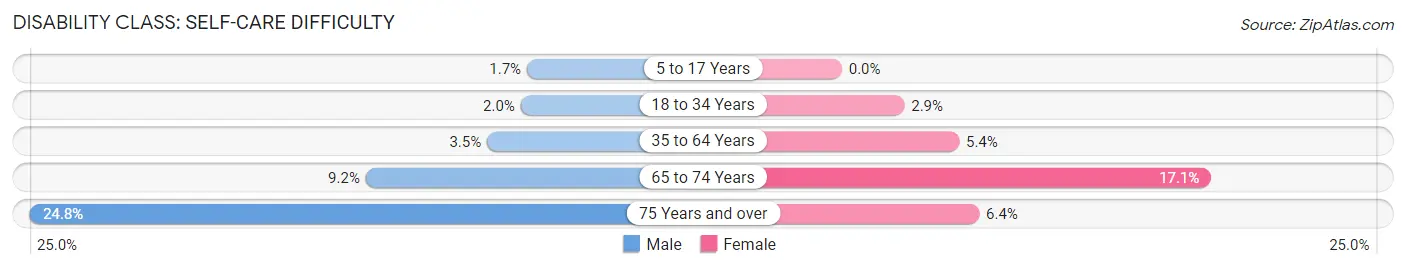
| Age Bracket | Male | Female |
| 5 to 17 Years | 27 (1.7%) | 0 (0.0%) |
| 18 to 34 Years | 39 (2.0%) | 60 (2.9%) |
| 35 to 64 Years | 79 (3.5%) | 115 (5.4%) |
| 65 to 74 Years | 51 (9.2%) | 115 (17.1%) |
| 75 Years and over | 75 (24.7%) | 30 (6.4%) |
Technology Access in Corcoran
Computing Device Access in Corcoran
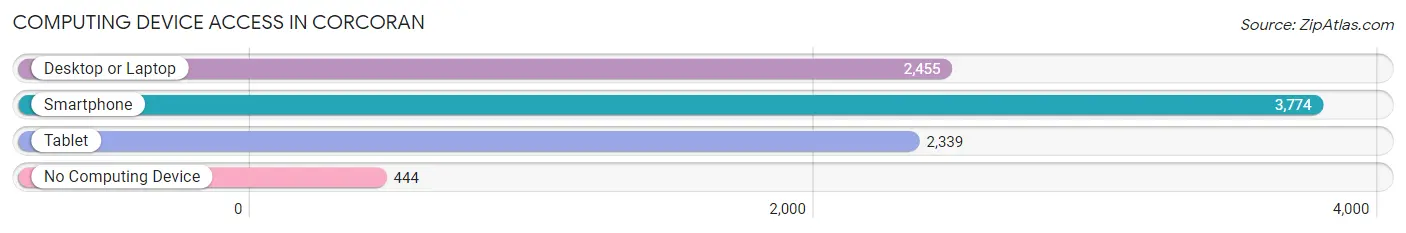
| Device Type | # Households | % Households |
| Desktop or Laptop | 2,455 | 56.1% |
| Smartphone | 3,774 | 86.3% |
| Tablet | 2,339 | 53.5% |
| No Computing Device | 444 | 10.2% |
| Total | 4,374 | 100.0% |
Internet Access in Corcoran
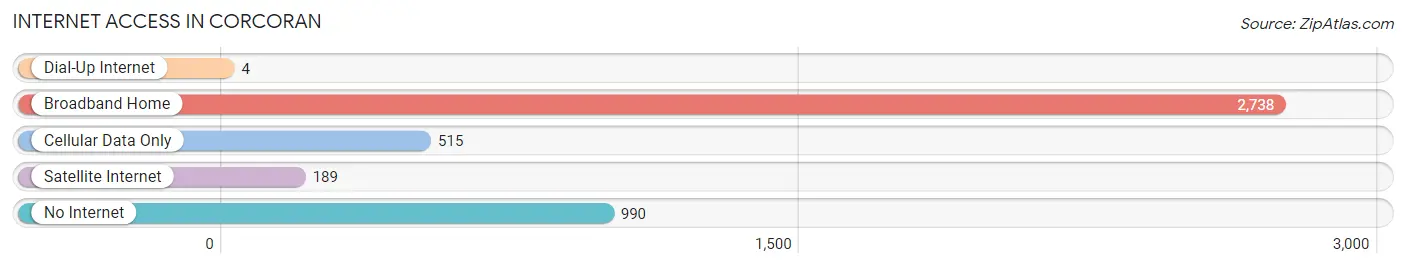
| Internet Type | # Households | % Households |
| Dial-Up Internet | 4 | 0.1% |
| Broadband Home | 2,738 | 62.6% |
| Cellular Data Only | 515 | 11.8% |
| Satellite Internet | 189 | 4.3% |
| No Internet | 990 | 22.6% |
| Total | 4,374 | 100.0% |
Corcoran Summary
Corcoran is a small city located in Kings County, California, United States. It is situated in the San Joaquin Valley, approximately 30 miles south of Fresno and 40 miles north of Bakersfield. The city was incorporated in 1910 and has a population of approximately 24,000 people.
History
The area that is now Corcoran was originally inhabited by the Yokuts Indians. The first European settlers arrived in the area in the late 1800s, and the town was officially founded in 1910. The city was named after James Corcoran, a local rancher and businessman.
In the early 1900s, Corcoran was a thriving agricultural community, with many of its residents working in the surrounding fields. The city was also home to a number of businesses, including a bank, a hotel, and a movie theater.
In the 1950s, Corcoran began to experience a population boom, as many people moved to the area to take advantage of the agricultural opportunities. This growth continued into the 1960s and 1970s, and the city was eventually incorporated in 1977.
Geography
Corcoran is located in the San Joaquin Valley, approximately 30 miles south of Fresno and 40 miles north of Bakersfield. The city is situated on the Kings River, and is surrounded by agricultural land. The city has a total area of 4.3 square miles, and is located at an elevation of approximately 200 feet.
Economy
Corcoran’s economy is largely based on agriculture. The city is home to a number of farms and ranches, and many of its residents are employed in the agricultural industry. The city is also home to a number of businesses, including restaurants, retail stores, and auto repair shops.
Demographics
As of the 2010 census, Corcoran had a population of 24,813 people. The racial makeup of the city was 57.3% White, 1.3% African American, 0.7% Native American, 0.5% Asian, 0.1% Pacific Islander, and 37.2% from other races. Hispanic or Latino of any race were 58.2% of the population.
The median household income in Corcoran was $37,945, and the median family income was $41,945. The per capita income for the city was $15,945. About 20.3% of families and 24.2% of the population were below the poverty line, including 33.3% of those under age 18 and 11.2% of those age 65 or over.
Corcoran is a small city with a rich history and a diverse population. The city’s economy is largely based on agriculture, and many of its residents are employed in the agricultural industry. The city is also home to a number of businesses, and has a median household income that is slightly below the national average.
Common Questions
What is Per Capita Income in Corcoran?
Per Capita income in Corcoran is $13,798.
What is the Median Family Income in Corcoran?
Median Family Income in Corcoran is $57,566.
What is the Median Household income in Corcoran?
Median Household Income in Corcoran is $53,103.
What is Income or Wage Gap in Corcoran?
Income or Wage Gap in Corcoran is 16.4%.
Women in Corcoran earn 83.6 cents for every dollar earned by a man.
What is Family Income Deficit in Corcoran?
Family Income Deficit in Corcoran is $13,619.
Families that are below poverty line in Corcoran earn $13,619 less on average than the poverty threshold level.
What is Inequality or Gini Index in Corcoran?
Inequality or Gini Index in Corcoran is 0.44.
What is the Total Population of Corcoran?
Total Population of Corcoran is 22,808.
What is the Total Male Population of Corcoran?
Total Male Population of Corcoran is 14,792.
What is the Total Female Population of Corcoran?
Total Female Population of Corcoran is 8,016.
What is the Ratio of Males per 100 Females in Corcoran?
There are 184.53 Males per 100 Females in Corcoran.
What is the Ratio of Females per 100 Males in Corcoran?
There are 54.19 Females per 100 Males in Corcoran.
What is the Median Population Age in Corcoran?
Median Population Age in Corcoran is 34.0 Years.
What is the Average Family Size in Corcoran
Average Family Size in Corcoran is 3.8 People.
What is the Average Household Size in Corcoran
Average Household Size in Corcoran is 3.5 People.
How Large is the Labor Force in Corcoran?
There are 6,009 People in the Labor Forcein in Corcoran.
What is the Percentage of People in the Labor Force in Corcoran?
32.3% of People are in the Labor Force in Corcoran.
What is the Unemployment Rate in Corcoran?
Unemployment Rate in Corcoran is 11.2%.