Ashland, CA Map & Demographics
Ashland Map
Ashland Overview
$32,463
PER CAPITA INCOME
$78,520
AVG FAMILY INCOME
$75,114
AVG HOUSEHOLD INCOME
29.6%
WAGE / INCOME GAP [ % ]
70.4¢/ $1
WAGE / INCOME GAP [ $ ]
$11,643
FAMILY INCOME DEFICIT
0.45
INEQUALITY / GINI INDEX
23,164
TOTAL POPULATION
10,806
MALE POPULATION
12,358
FEMALE POPULATION
87.44
MALES / 100 FEMALES
114.36
FEMALES / 100 MALES
36.2
MEDIAN AGE
3.5
AVG FAMILY SIZE
3.1
AVG HOUSEHOLD SIZE
12,192
LABOR FORCE [ PEOPLE ]
66.0%
PERCENT IN LABOR FORCE
6.8%
UNEMPLOYMENT RATE
Income in Ashland
Income Overview in Ashland
Per Capita Income in Ashland is $32,463, while median incomes of families and households are $78,520 and $75,114 respectively.
| Characteristic | Number | Measure |
| Per Capita Income | 23,164 | $32,463 |
| Median Family Income | 5,369 | $78,520 |
| Mean Family Income | 5,369 | $97,987 |
| Median Household Income | 7,431 | $75,114 |
| Mean Household Income | 7,431 | $94,373 |
| Income Deficit | 5,369 | $11,643 |
| Wage / Income Gap (%) | 23,164 | 29.62% |
| Wage / Income Gap ($) | 23,164 | 70.38¢ per $1 |
| Gini / Inequality Index | 23,164 | 0.45 |
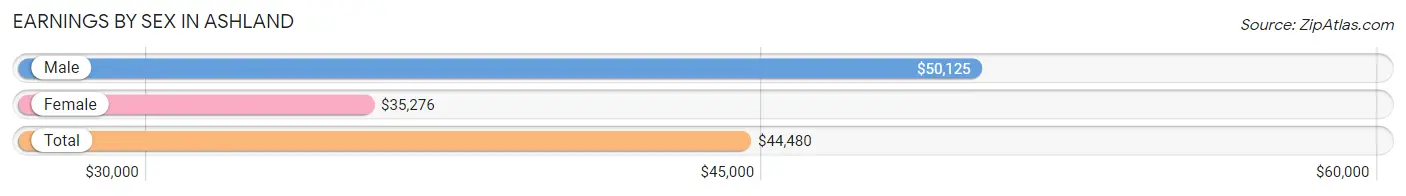
Earnings by Sex in Ashland
Average Earnings in Ashland are $44,480, $50,125 for men and $35,276 for women, a difference of 29.6%.
| Sex | Number | Average Earnings |
| Male | 6,477 (52.9%) | $50,125 |
| Female | 5,771 (47.1%) | $35,276 |
| Total | 12,248 (100.0%) | $44,480 |
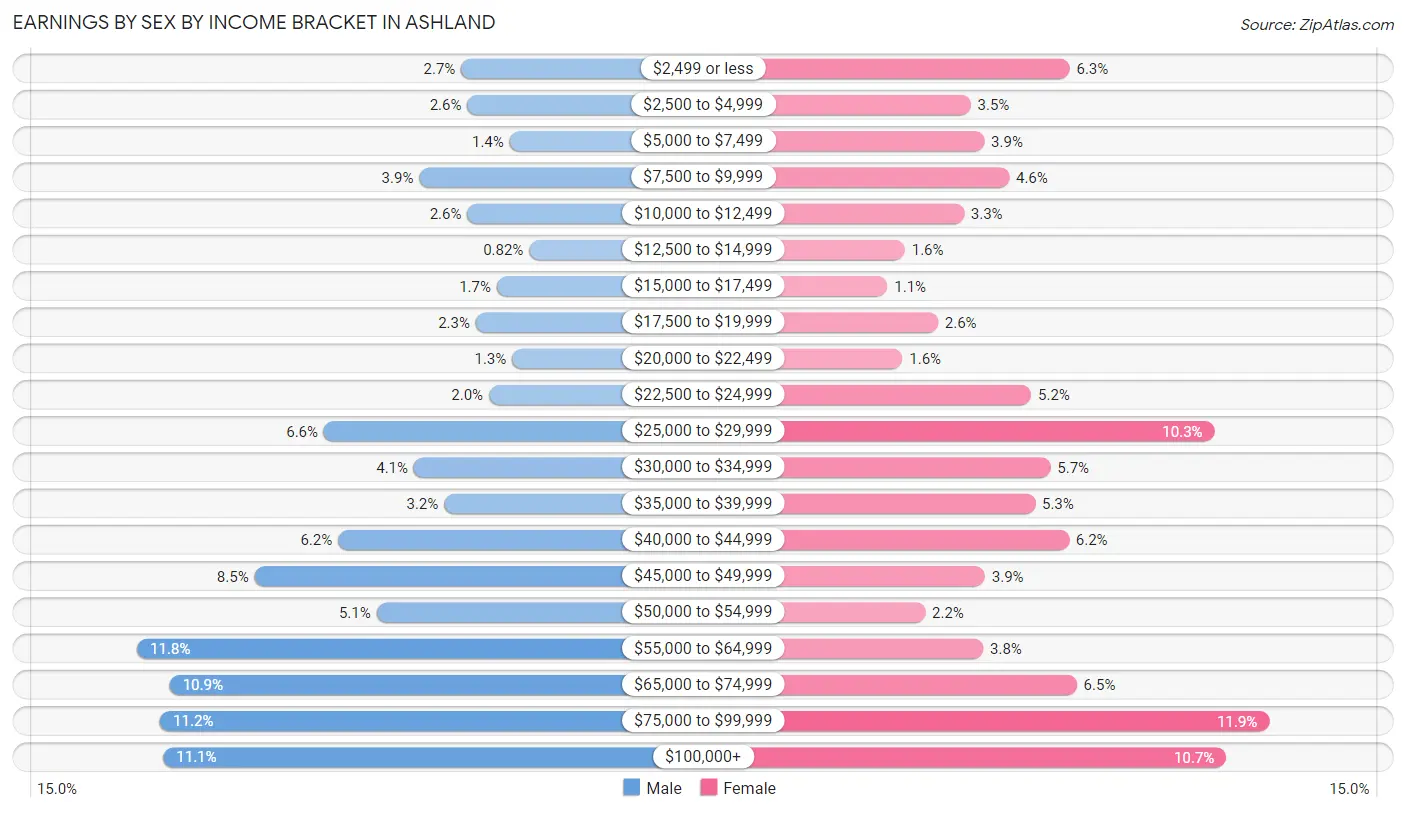
Earnings by Sex by Income Bracket in Ashland
The most common earnings brackets in Ashland are $55,000 to $64,999 for men (767 | 11.8%) and $75,000 to $99,999 for women (685 | 11.9%).
| Income | Male | Female |
| $2,499 or less | 177 (2.7%) | 361 (6.3%) |
| $2,500 to $4,999 | 166 (2.6%) | 201 (3.5%) |
| $5,000 to $7,499 | 89 (1.4%) | 223 (3.9%) |
| $7,500 to $9,999 | 253 (3.9%) | 263 (4.6%) |
| $10,000 to $12,499 | 166 (2.6%) | 190 (3.3%) |
| $12,500 to $14,999 | 53 (0.8%) | 94 (1.6%) |
| $15,000 to $17,499 | 112 (1.7%) | 66 (1.1%) |
| $17,500 to $19,999 | 150 (2.3%) | 148 (2.6%) |
| $20,000 to $22,499 | 84 (1.3%) | 90 (1.6%) |
| $22,500 to $24,999 | 126 (1.9%) | 299 (5.2%) |
| $25,000 to $29,999 | 427 (6.6%) | 596 (10.3%) |
| $30,000 to $34,999 | 263 (4.1%) | 330 (5.7%) |
| $35,000 to $39,999 | 208 (3.2%) | 305 (5.3%) |
| $40,000 to $44,999 | 401 (6.2%) | 360 (6.2%) |
| $45,000 to $49,999 | 553 (8.5%) | 224 (3.9%) |
| $50,000 to $54,999 | 331 (5.1%) | 127 (2.2%) |
| $55,000 to $64,999 | 767 (11.8%) | 221 (3.8%) |
| $65,000 to $74,999 | 707 (10.9%) | 373 (6.5%) |
| $75,000 to $99,999 | 725 (11.2%) | 685 (11.9%) |
| $100,000+ | 719 (11.1%) | 615 (10.7%) |
| Total | 6,477 (100.0%) | 5,771 (100.0%) |
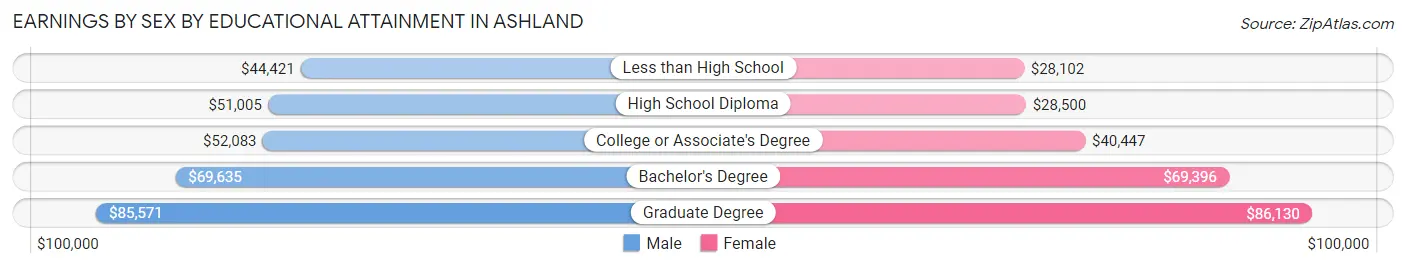
Earnings by Sex by Educational Attainment in Ashland
Average earnings in Ashland are $54,804 for men and $40,316 for women, a difference of 26.4%. Men with an educational attainment of graduate degree enjoy the highest average annual earnings of $85,571, while those with less than high school education earn the least with $44,421. Women with an educational attainment of graduate degree earn the most with the average annual earnings of $86,130, while those with less than high school education have the smallest earnings of $28,102.
| Educational Attainment | Male Income | Female Income |
| Less than High School | $44,421 | $28,102 |
| High School Diploma | $51,005 | $28,500 |
| College or Associate's Degree | $52,083 | $40,447 |
| Bachelor's Degree | $69,635 | $69,396 |
| Graduate Degree | $85,571 | $86,130 |
| Total | $54,804 | $40,316 |
Family Income in Ashland
Family Income Brackets in Ashland
According to the Ashland family income data, there are 988 families falling into the $100,000 to $149,999 income range, which is the most common income bracket and makes up 18.4% of all families. Conversely, the $10,000 to $14,999 income bracket is the least frequent group with only 75 families (1.4%) belonging to this category.
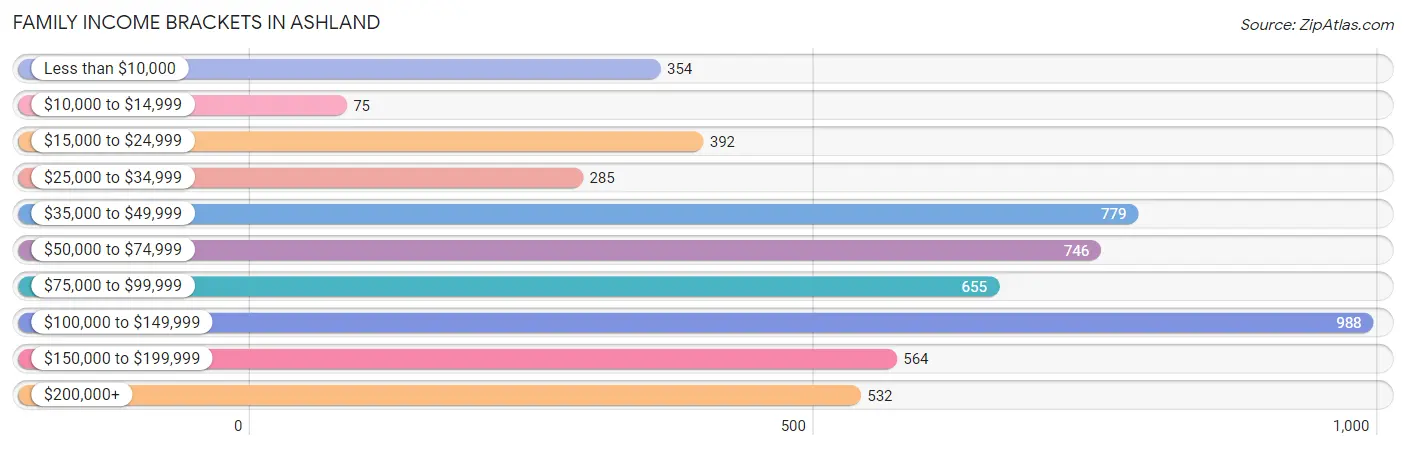
| Income Bracket | # Families | % Families |
| Less than $10,000 | 354 | 6.6% |
| $10,000 to $14,999 | 75 | 1.4% |
| $15,000 to $24,999 | 392 | 7.3% |
| $25,000 to $34,999 | 285 | 5.3% |
| $35,000 to $49,999 | 779 | 14.5% |
| $50,000 to $74,999 | 746 | 13.9% |
| $75,000 to $99,999 | 655 | 12.2% |
| $100,000 to $149,999 | 988 | 18.4% |
| $150,000 to $199,999 | 564 | 10.5% |
| $200,000+ | 532 | 9.9% |
Family Income by Famaliy Size in Ashland
5-person families (707 | 13.2%) account for the highest median family income in Ashland with $118,867 per family, while 2-person families (1,959 | 36.5%) have the highest median income of $34,282 per family member.
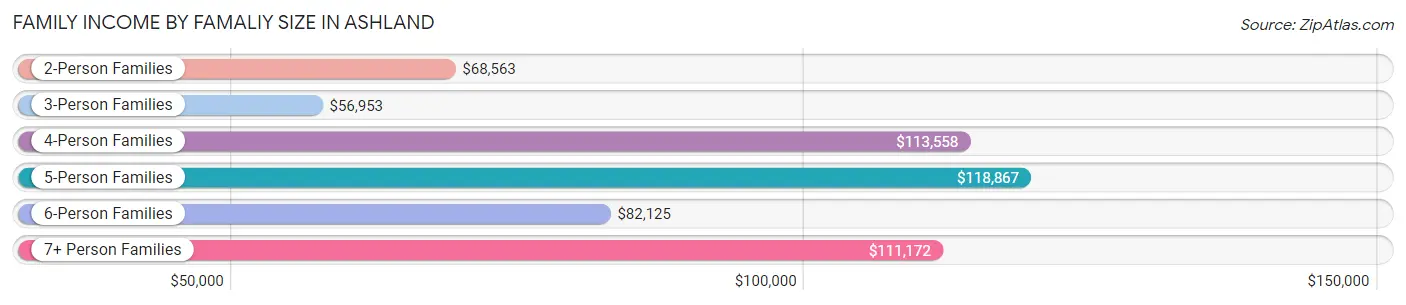
| Income Bracket | # Families | Median Income |
| 2-Person Families | 1,959 (36.5%) | $68,563 |
| 3-Person Families | 1,421 (26.5%) | $56,953 |
| 4-Person Families | 945 (17.6%) | $113,558 |
| 5-Person Families | 707 (13.2%) | $118,867 |
| 6-Person Families | 296 (5.5%) | $82,125 |
| 7+ Person Families | 41 (0.8%) | $111,172 |
| Total | 5,369 (100.0%) | $78,520 |
Family Income by Number of Earners in Ashland
The median family income in Ashland is $78,520, with families comprising 3+ earners (948) having the highest median family income of $142,308, while families with no earners (531) have the lowest median family income of $18,279, accounting for 17.7% and 9.9% of families, respectively.
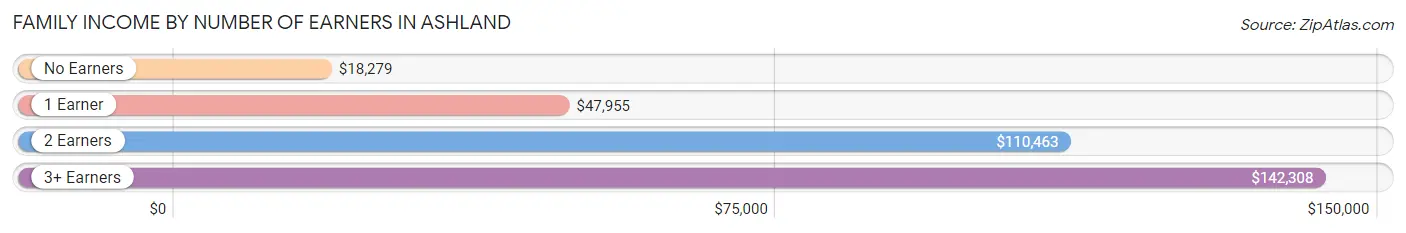
| Number of Earners | # Families | Median Income |
| No Earners | 531 (9.9%) | $18,279 |
| 1 Earner | 1,986 (37.0%) | $47,955 |
| 2 Earners | 1,904 (35.5%) | $110,463 |
| 3+ Earners | 948 (17.7%) | $142,308 |
| Total | 5,369 (100.0%) | $78,520 |
Household Income in Ashland
Household Income Brackets in Ashland
With 1,293 households falling in the category, the $100,000 to $149,999 income range is the most frequent in Ashland, accounting for 17.4% of all households. In contrast, only 223 households (3.0%) fall into the $10,000 to $14,999 income bracket, making it the least populous group.
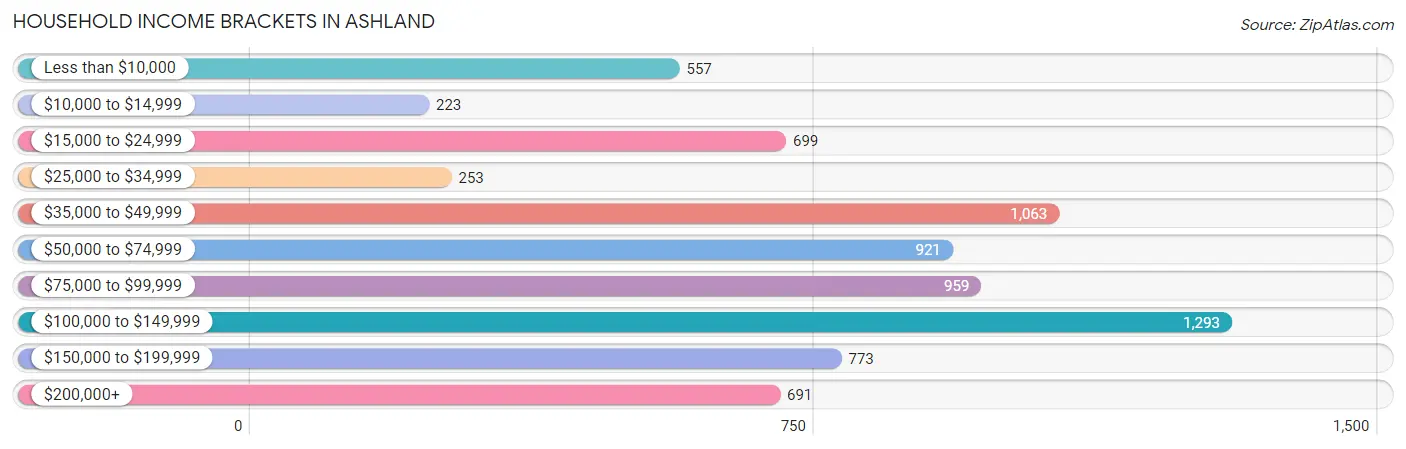
| Income Bracket | # Households | % Households |
| Less than $10,000 | 557 | 7.5% |
| $10,000 to $14,999 | 223 | 3.0% |
| $15,000 to $24,999 | 699 | 9.4% |
| $25,000 to $34,999 | 253 | 3.4% |
| $35,000 to $49,999 | 1,063 | 14.3% |
| $50,000 to $74,999 | 921 | 12.4% |
| $75,000 to $99,999 | 959 | 12.9% |
| $100,000 to $149,999 | 1,293 | 17.4% |
| $150,000 to $199,999 | 773 | 10.4% |
| $200,000+ | 691 | 9.3% |
Household Income by Householder Age in Ashland
The median household income in Ashland is $75,114, with the highest median household income of $132,200 found in the 15 to 24 years age bracket for the primary householder. A total of 60 households (0.8%) fall into this category. Meanwhile, the 65+ years age bracket for the primary householder has the lowest median household income of $40,109, with 1,422 households (19.1%) in this group.
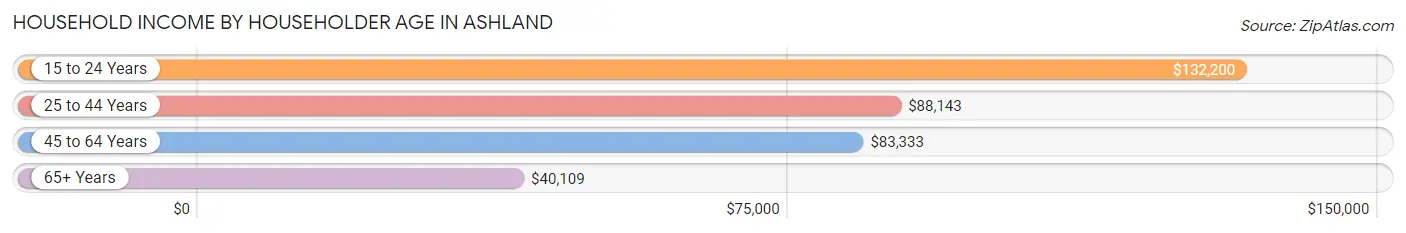
| Income Bracket | # Households | Median Income |
| 15 to 24 Years | 60 (0.8%) | $132,200 |
| 25 to 44 Years | 3,363 (45.3%) | $88,143 |
| 45 to 64 Years | 2,586 (34.8%) | $83,333 |
| 65+ Years | 1,422 (19.1%) | $40,109 |
| Total | 7,431 (100.0%) | $75,114 |
Poverty in Ashland
Income Below Poverty by Sex and Age in Ashland
With 15.2% poverty level for males and 16.5% for females among the residents of Ashland, 15 year old males and 75 year old and over females are the most vulnerable to poverty, with 19 males (46.3%) and 222 females (28.8%) in their respective age groups living below the poverty level.
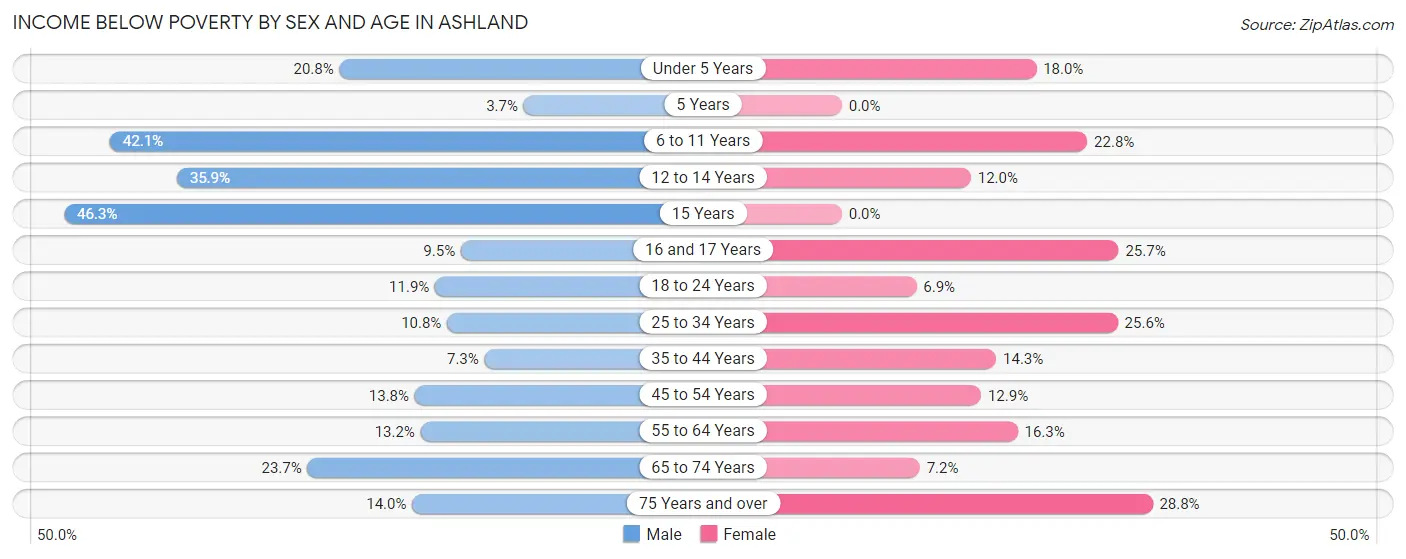
| Age Bracket | Male | Female |
| Under 5 Years | 188 (20.8%) | 151 (18.0%) |
| 5 Years | 9 (3.7%) | 0 (0.0%) |
| 6 to 11 Years | 300 (42.1%) | 163 (22.8%) |
| 12 to 14 Years | 80 (35.9%) | 88 (12.0%) |
| 15 Years | 19 (46.3%) | 0 (0.0%) |
| 16 and 17 Years | 17 (9.5%) | 85 (25.7%) |
| 18 to 24 Years | 125 (11.9%) | 64 (6.9%) |
| 25 to 34 Years | 214 (10.8%) | 473 (25.6%) |
| 35 to 44 Years | 130 (7.3%) | 262 (14.3%) |
| 45 to 54 Years | 255 (13.8%) | 221 (12.9%) |
| 55 to 64 Years | 110 (13.2%) | 224 (16.3%) |
| 65 to 74 Years | 146 (23.7%) | 69 (7.2%) |
| 75 Years and over | 45 (14.0%) | 222 (28.8%) |
| Total | 1,638 (15.2%) | 2,022 (16.5%) |
Income Above Poverty by Sex and Age in Ashland
According to the poverty statistics in Ashland, males aged 5 years and females aged 5 years are the age groups that are most secure financially, with 96.3% of males and 100.0% of females in these age groups living above the poverty line.
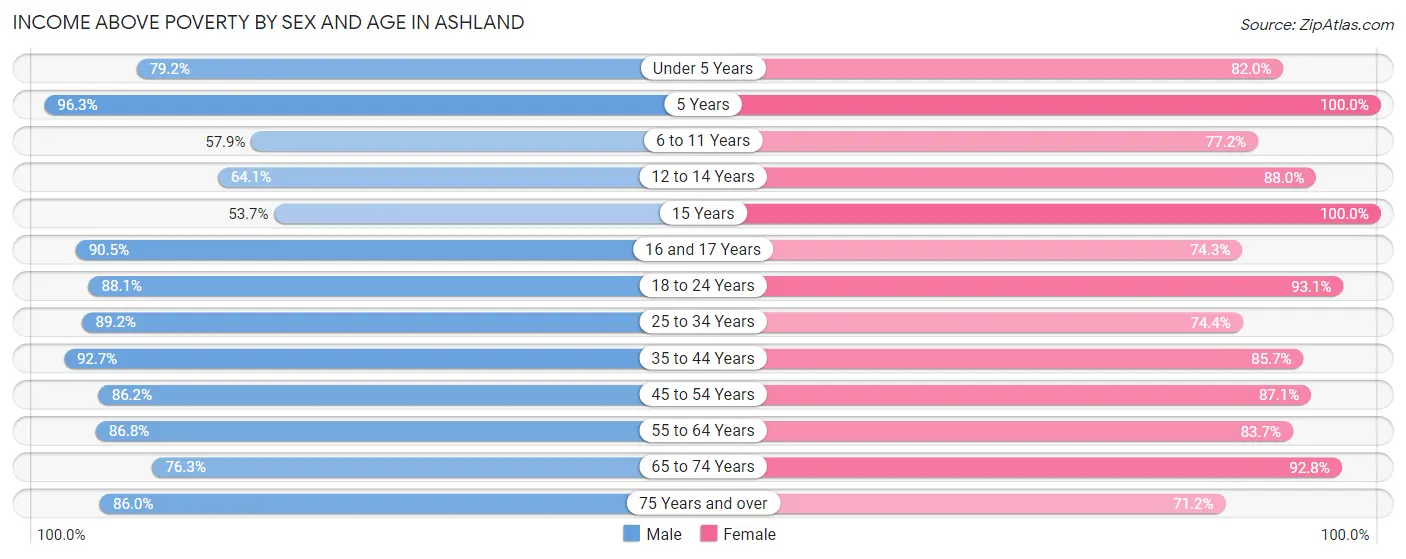
| Age Bracket | Male | Female |
| Under 5 Years | 717 (79.2%) | 686 (82.0%) |
| 5 Years | 236 (96.3%) | 189 (100.0%) |
| 6 to 11 Years | 413 (57.9%) | 553 (77.2%) |
| 12 to 14 Years | 143 (64.1%) | 647 (88.0%) |
| 15 Years | 22 (53.7%) | 38 (100.0%) |
| 16 and 17 Years | 162 (90.5%) | 246 (74.3%) |
| 18 to 24 Years | 925 (88.1%) | 861 (93.1%) |
| 25 to 34 Years | 1,772 (89.2%) | 1,375 (74.4%) |
| 35 to 44 Years | 1,649 (92.7%) | 1,567 (85.7%) |
| 45 to 54 Years | 1,596 (86.2%) | 1,489 (87.1%) |
| 55 to 64 Years | 721 (86.8%) | 1,149 (83.7%) |
| 65 to 74 Years | 469 (76.3%) | 886 (92.8%) |
| 75 Years and over | 276 (86.0%) | 548 (71.2%) |
| Total | 9,101 (84.8%) | 10,234 (83.5%) |
Income Below Poverty Among Married-Couple Families in Ashland
The poverty statistics for married-couple families in Ashland show that 7.9% or 223 of the total 2,817 families live below the poverty line. Families with 1 or 2 children have the highest poverty rate of 10.0%, comprising of 128 families. On the other hand, families with 5 or more children have the lowest poverty rate of 0.0%, which includes 0 families.
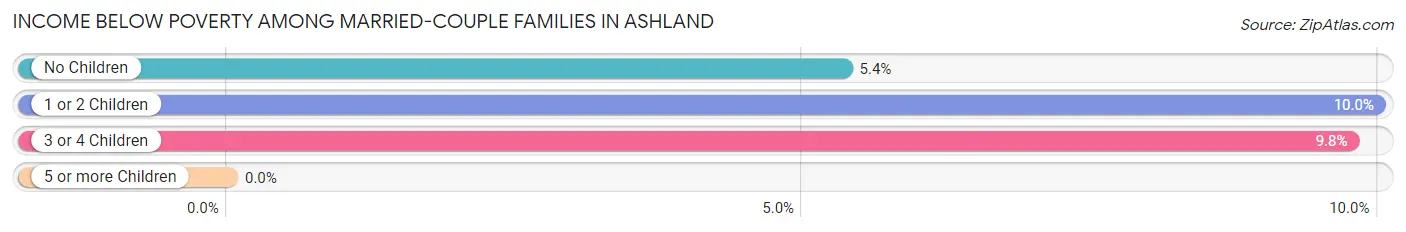
| Children | Above Poverty | Below Poverty |
| No Children | 1,168 (94.7%) | 66 (5.3%) |
| 1 or 2 Children | 1,153 (90.0%) | 128 (10.0%) |
| 3 or 4 Children | 268 (90.2%) | 29 (9.8%) |
| 5 or more Children | 5 (100.0%) | 0 (0.0%) |
| Total | 2,594 (92.1%) | 223 (7.9%) |
Income Below Poverty Among Single-Parent Households in Ashland
According to the poverty data in Ashland, 16.3% or 126 single-father households and 23.9% or 426 single-mother households are living below the poverty line. Among single-father households, those with 3 or 4 children have the highest poverty rate, with 51 households (94.4%) experiencing poverty. Likewise, among single-mother households, those with 3 or 4 children have the highest poverty rate, with 27 households (38.6%) falling below the poverty line.
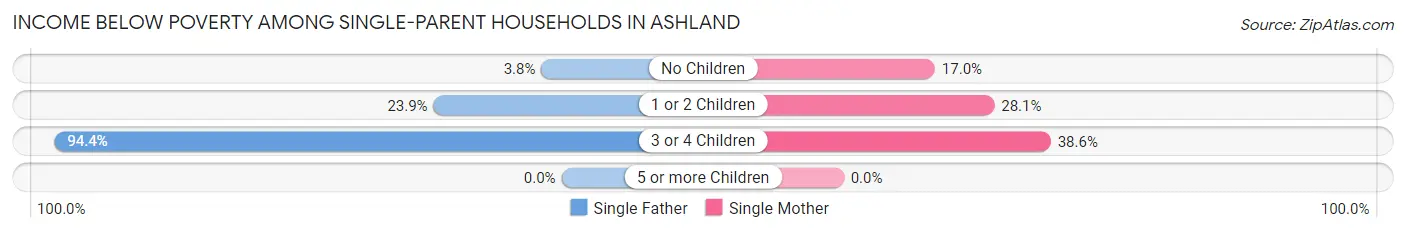
| Children | Single Father | Single Mother |
| No Children | 18 (3.8%) | 124 (17.0%) |
| 1 or 2 Children | 57 (23.8%) | 275 (28.1%) |
| 3 or 4 Children | 51 (94.4%) | 27 (38.6%) |
| 5 or more Children | 0 (0.0%) | 0 (0.0%) |
| Total | 126 (16.3%) | 426 (23.9%) |
Income Below Poverty Among Married-Couple vs Single-Parent Households in Ashland
The poverty data for Ashland shows that 223 of the married-couple family households (7.9%) and 552 of the single-parent households (21.6%) are living below the poverty level. Within the married-couple family households, those with 1 or 2 children have the highest poverty rate, with 128 households (10.0%) falling below the poverty line. Among the single-parent households, those with 3 or 4 children have the highest poverty rate, with 78 household (62.9%) living below poverty.
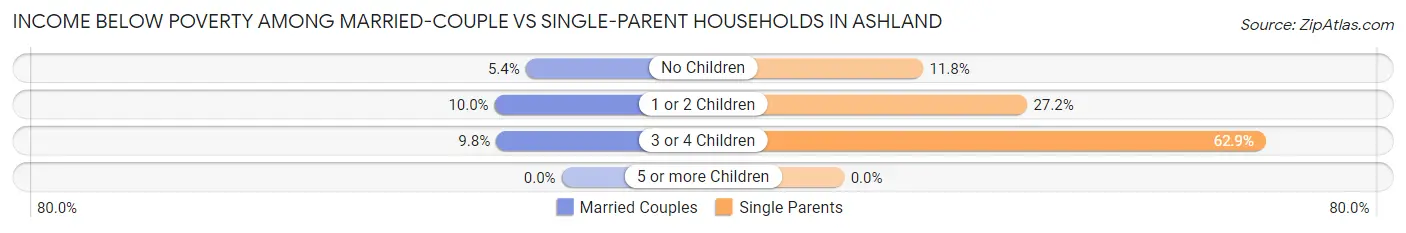
| Children | Married-Couple Families | Single-Parent Households |
| No Children | 66 (5.3%) | 142 (11.7%) |
| 1 or 2 Children | 128 (10.0%) | 332 (27.2%) |
| 3 or 4 Children | 29 (9.8%) | 78 (62.9%) |
| 5 or more Children | 0 (0.0%) | 0 (0.0%) |
| Total | 223 (7.9%) | 552 (21.6%) |
Race in Ashland
The most populous races in Ashland are Hispanic or Latino (9,557 | 41.3%), Asian (6,109 | 26.4%), and Some other Race (5,328 | 23.0%).
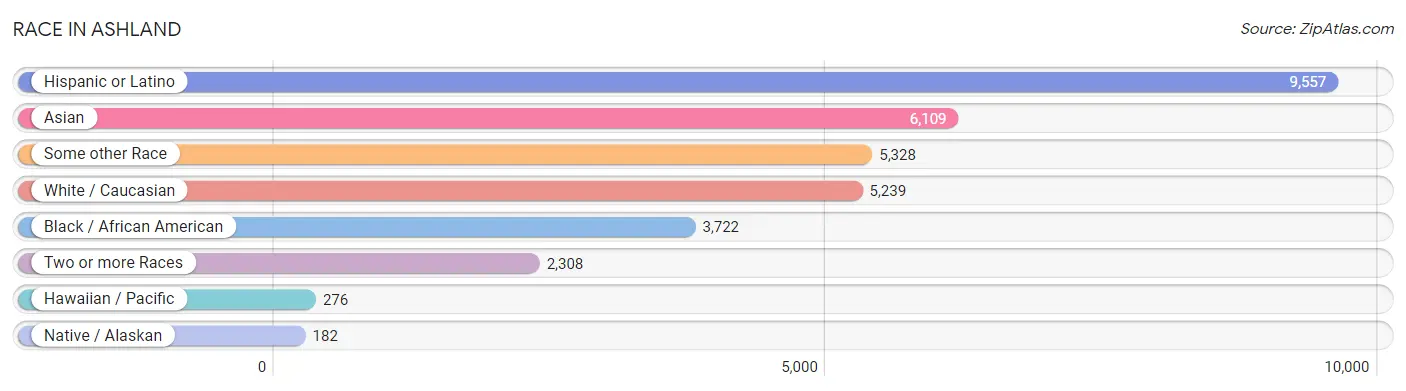
| Race | # Population | % Population |
| Asian | 6,109 | 26.4% |
| Black / African American | 3,722 | 16.1% |
| Hawaiian / Pacific | 276 | 1.2% |
| Hispanic or Latino | 9,557 | 41.3% |
| Native / Alaskan | 182 | 0.8% |
| White / Caucasian | 5,239 | 22.6% |
| Two or more Races | 2,308 | 10.0% |
| Some other Race | 5,328 | 23.0% |
| Total | 23,164 | 100.0% |
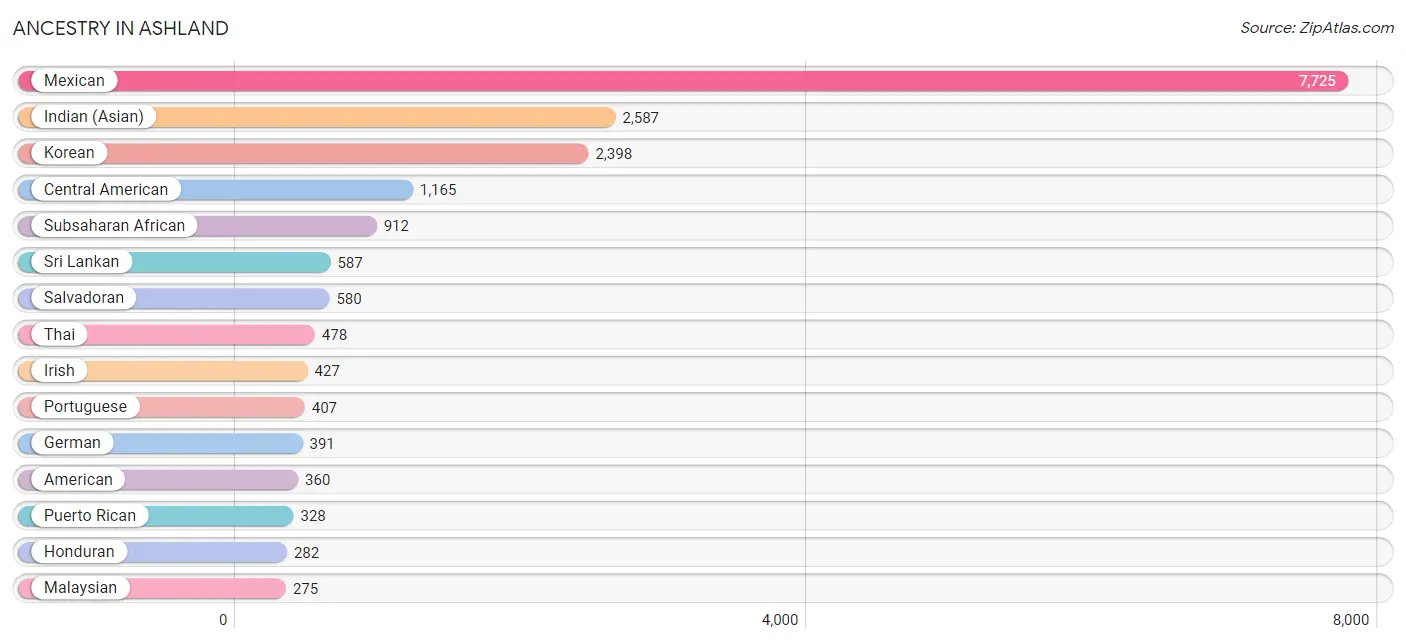
Ancestry in Ashland
The most populous ancestries reported in Ashland are Mexican (7,725 | 33.4%), Indian (Asian) (2,587 | 11.2%), Korean (2,398 | 10.3%), Central American (1,165 | 5.0%), and Subsaharan African (912 | 3.9%), together accounting for 63.8% of all Ashland residents.
| Ancestry | # Population | % Population |
| Afghan | 219 | 0.9% |
| African | 208 | 0.9% |
| American | 360 | 1.5% |
| Apache | 116 | 0.5% |
| Arab | 239 | 1.0% |
| Armenian | 7 | 0.0% |
| Austrian | 17 | 0.1% |
| Bhutanese | 116 | 0.5% |
| Blackfeet | 9 | 0.0% |
| British West Indian | 12 | 0.1% |
| Burmese | 186 | 0.8% |
| Cambodian | 7 | 0.0% |
| Central American | 1,165 | 5.0% |
| Central American Indian | 26 | 0.1% |
| Cherokee | 102 | 0.4% |
| Choctaw | 18 | 0.1% |
| Colombian | 51 | 0.2% |
| Cree | 13 | 0.1% |
| Cuban | 38 | 0.2% |
| Danish | 75 | 0.3% |
| Dutch | 5 | 0.0% |
| English | 257 | 1.1% |
| Ethiopian | 235 | 1.0% |
| European | 100 | 0.4% |
| Finnish | 33 | 0.1% |
| French | 98 | 0.4% |
| German | 391 | 1.7% |
| German Russian | 14 | 0.1% |
| Ghanaian | 260 | 1.1% |
| Guamanian / Chamorro | 8 | 0.0% |
| Guatemalan | 157 | 0.7% |
| Guyanese | 11 | 0.1% |
| Haitian | 91 | 0.4% |
| Honduran | 282 | 1.2% |
| Hungarian | 48 | 0.2% |
| Indian (Asian) | 2,587 | 11.2% |
| Inupiat | 5 | 0.0% |
| Iranian | 10 | 0.0% |
| Irish | 427 | 1.8% |
| Italian | 235 | 1.0% |
| Japanese | 125 | 0.5% |
| Korean | 2,398 | 10.3% |
| Lithuanian | 59 | 0.3% |
| Malaysian | 275 | 1.2% |
| Mexican | 7,725 | 33.4% |
| Mexican American Indian | 19 | 0.1% |
| Native Hawaiian | 21 | 0.1% |
| Navajo | 31 | 0.1% |
| Nepalese | 37 | 0.2% |
| Nicaraguan | 116 | 0.5% |
| Nigerian | 89 | 0.4% |
| Norwegian | 19 | 0.1% |
| Palestinian | 239 | 1.0% |
| Peruvian | 57 | 0.3% |
| Polish | 15 | 0.1% |
| Portuguese | 407 | 1.8% |
| Puerto Rican | 328 | 1.4% |
| Russian | 29 | 0.1% |
| Salvadoran | 580 | 2.5% |
| Samoan | 48 | 0.2% |
| Scandinavian | 75 | 0.3% |
| Scotch-Irish | 31 | 0.1% |
| Scottish | 138 | 0.6% |
| Seminole | 8 | 0.0% |
| Senegalese | 100 | 0.4% |
| Sioux | 17 | 0.1% |
| South American | 108 | 0.5% |
| Spaniard | 35 | 0.2% |
| Spanish | 53 | 0.2% |
| Sri Lankan | 587 | 2.5% |
| Subsaharan African | 912 | 3.9% |
| Swedish | 103 | 0.4% |
| Thai | 478 | 2.1% |
| Tongan | 24 | 0.1% |
| Ukrainian | 9 | 0.0% |
| Welsh | 19 | 0.1% |
| West Indian | 12 | 0.1% | View All 77 Rows |
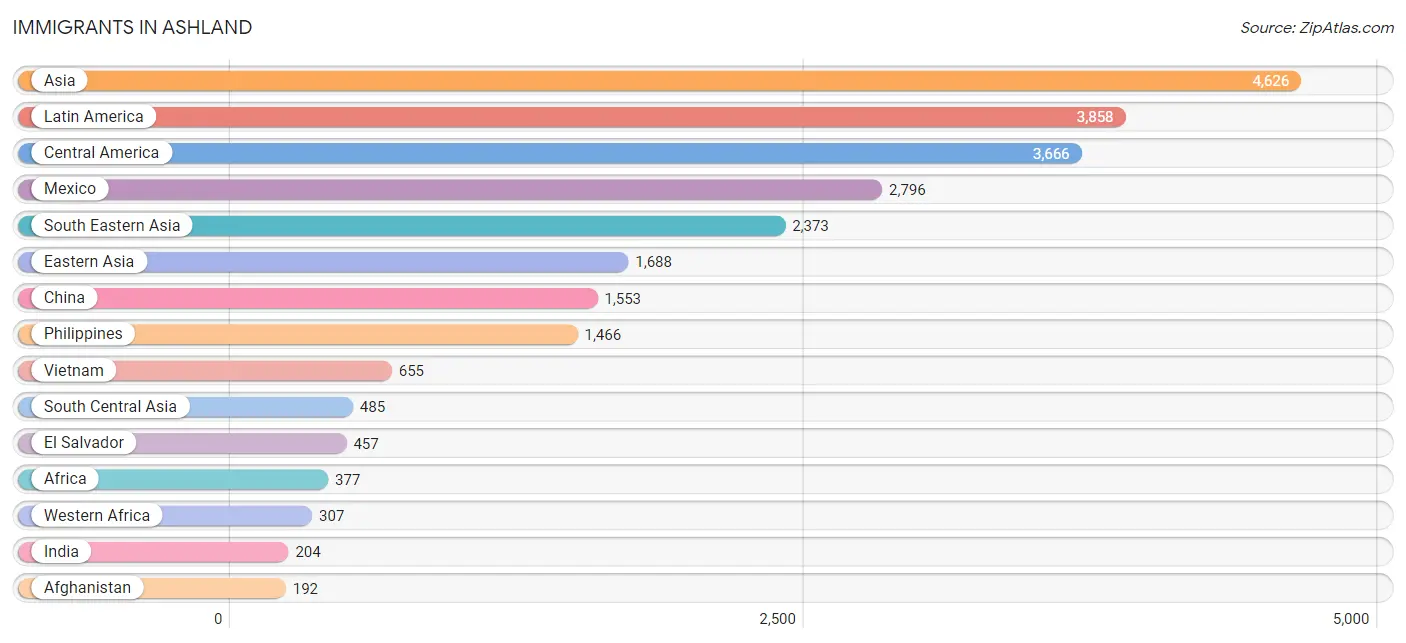
Immigrants in Ashland
The most numerous immigrant groups reported in Ashland came from Asia (4,626 | 20.0%), Latin America (3,858 | 16.7%), Central America (3,666 | 15.8%), Mexico (2,796 | 12.1%), and South Eastern Asia (2,373 | 10.2%), together accounting for 74.8% of all Ashland residents.
| Immigration Origin | # Population | % Population |
| Afghanistan | 192 | 0.8% |
| Africa | 377 | 1.6% |
| Asia | 4,626 | 20.0% |
| Belize | 19 | 0.1% |
| Brazil | 55 | 0.2% |
| Cambodia | 13 | 0.1% |
| Cameroon | 20 | 0.1% |
| Caribbean | 25 | 0.1% |
| Central America | 3,666 | 15.8% |
| China | 1,553 | 6.7% |
| Colombia | 44 | 0.2% |
| Cuba | 25 | 0.1% |
| Eastern Africa | 50 | 0.2% |
| Eastern Asia | 1,688 | 7.3% |
| Eastern Europe | 34 | 0.2% |
| El Salvador | 457 | 2.0% |
| England | 18 | 0.1% |
| Ethiopia | 50 | 0.2% |
| Europe | 78 | 0.3% |
| Fiji | 166 | 0.7% |
| Germany | 3 | 0.0% |
| Ghana | 127 | 0.5% |
| Guatemala | 94 | 0.4% |
| Guyana | 11 | 0.1% |
| Honduras | 172 | 0.7% |
| Hong Kong | 107 | 0.5% |
| India | 204 | 0.9% |
| Indonesia | 19 | 0.1% |
| Iran | 9 | 0.0% |
| Japan | 4 | 0.0% |
| Korea | 124 | 0.5% |
| Laos | 126 | 0.5% |
| Latin America | 3,858 | 16.7% |
| Mexico | 2,796 | 12.1% |
| Middle Africa | 20 | 0.1% |
| Nepal | 80 | 0.4% |
| Nicaragua | 128 | 0.5% |
| Nigeria | 140 | 0.6% |
| Northern Europe | 18 | 0.1% |
| Oceania | 166 | 0.7% |
| Peru | 57 | 0.3% |
| Philippines | 1,466 | 6.3% |
| Portugal | 23 | 0.1% |
| Russia | 25 | 0.1% |
| Senegal | 37 | 0.2% |
| Sierra Leone | 3 | 0.0% |
| Singapore | 41 | 0.2% |
| South America | 167 | 0.7% |
| South Central Asia | 485 | 2.1% |
| South Eastern Asia | 2,373 | 10.2% |
| Southern Europe | 23 | 0.1% |
| Syria | 8 | 0.0% |
| Thailand | 53 | 0.2% |
| Ukraine | 9 | 0.0% |
| Vietnam | 655 | 2.8% |
| Western Africa | 307 | 1.3% |
| Western Asia | 8 | 0.0% |
| Western Europe | 3 | 0.0% | View All 58 Rows |
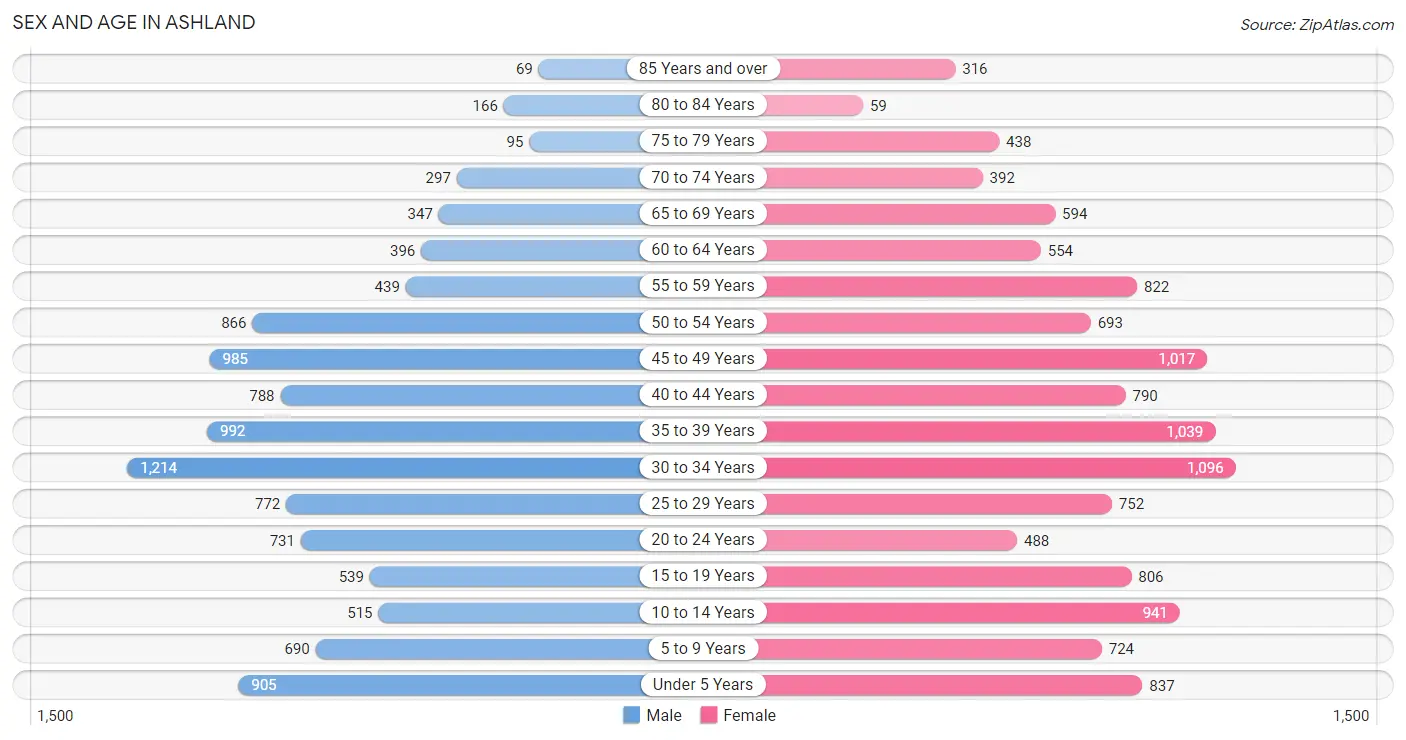
Sex and Age in Ashland
Sex and Age in Ashland
The most populous age groups in Ashland are 30 to 34 Years (1,214 | 11.2%) for men and 30 to 34 Years (1,096 | 8.9%) for women.
| Age Bracket | Male | Female |
| Under 5 Years | 905 (8.4%) | 837 (6.8%) |
| 5 to 9 Years | 690 (6.4%) | 724 (5.9%) |
| 10 to 14 Years | 515 (4.8%) | 941 (7.6%) |
| 15 to 19 Years | 539 (5.0%) | 806 (6.5%) |
| 20 to 24 Years | 731 (6.8%) | 488 (4.0%) |
| 25 to 29 Years | 772 (7.1%) | 752 (6.1%) |
| 30 to 34 Years | 1,214 (11.2%) | 1,096 (8.9%) |
| 35 to 39 Years | 992 (9.2%) | 1,039 (8.4%) |
| 40 to 44 Years | 788 (7.3%) | 790 (6.4%) |
| 45 to 49 Years | 985 (9.1%) | 1,017 (8.2%) |
| 50 to 54 Years | 866 (8.0%) | 693 (5.6%) |
| 55 to 59 Years | 439 (4.1%) | 822 (6.7%) |
| 60 to 64 Years | 396 (3.7%) | 554 (4.5%) |
| 65 to 69 Years | 347 (3.2%) | 594 (4.8%) |
| 70 to 74 Years | 297 (2.8%) | 392 (3.2%) |
| 75 to 79 Years | 95 (0.9%) | 438 (3.5%) |
| 80 to 84 Years | 166 (1.5%) | 59 (0.5%) |
| 85 Years and over | 69 (0.6%) | 316 (2.6%) |
| Total | 10,806 (100.0%) | 12,358 (100.0%) |
Families and Households in Ashland
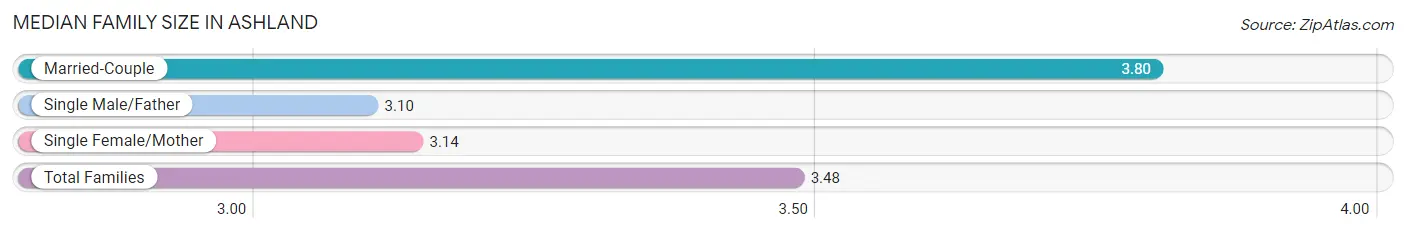
Median Family Size in Ashland
The median family size in Ashland is 3.48 persons per family, with married-couple families (2,817 | 52.5%) accounting for the largest median family size of 3.8 persons per family. On the other hand, single male/father families (772 | 14.4%) represent the smallest median family size with 3.10 persons per family.
| Family Type | # Families | Family Size |
| Married-Couple | 2,817 (52.5%) | 3.80 |
| Single Male/Father | 772 (14.4%) | 3.10 |
| Single Female/Mother | 1,780 (33.2%) | 3.14 |
| Total Families | 5,369 (100.0%) | 3.48 |
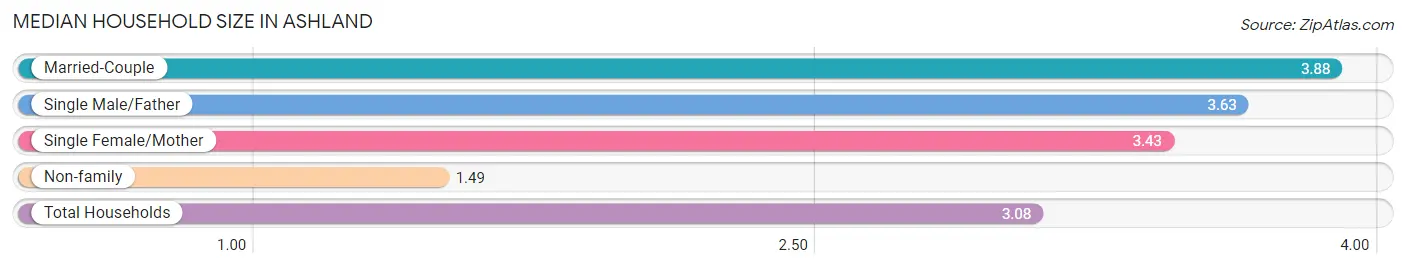
Median Household Size in Ashland
The median household size in Ashland is 3.08 persons per household, with married-couple households (2,817 | 37.9%) accounting for the largest median household size of 3.88 persons per household. non-family households (2,062 | 27.8%) represent the smallest median household size with 1.49 persons per household.
| Household Type | # Households | Household Size |
| Married-Couple | 2,817 (37.9%) | 3.88 |
| Single Male/Father | 772 (10.4%) | 3.63 |
| Single Female/Mother | 1,780 (23.9%) | 3.43 |
| Non-family | 2,062 (27.8%) | 1.49 |
| Total Households | 7,431 (100.0%) | 3.08 |
Household Size by Marriage Status in Ashland
Out of a total of 7,431 households in Ashland, 5,369 (72.3%) are family households, while 2,062 (27.8%) are nonfamily households. The most numerous type of family households are 2-person households, comprising 1,607, and the most common type of nonfamily households are 1-person households, comprising 1,487.
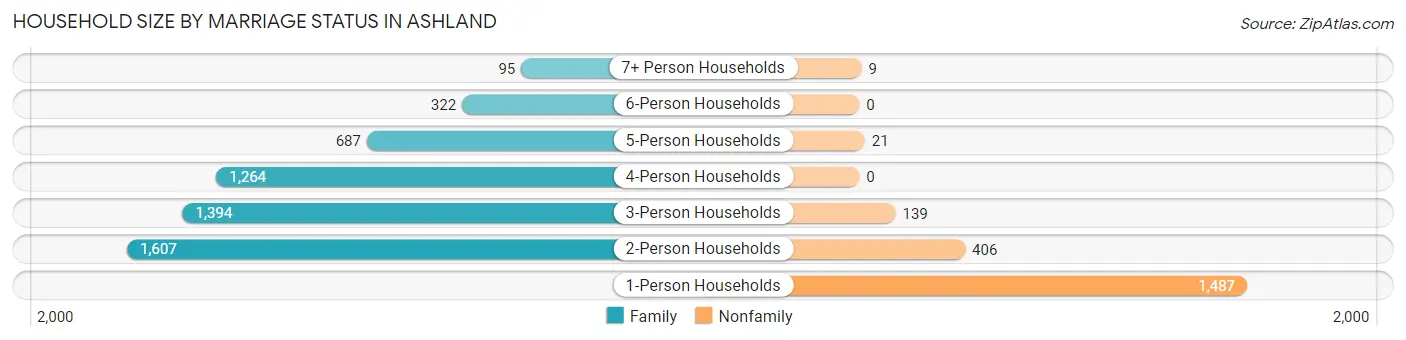
| Household Size | Family Households | Nonfamily Households |
| 1-Person Households | - | 1,487 (20.0%) |
| 2-Person Households | 1,607 (21.6%) | 406 (5.5%) |
| 3-Person Households | 1,394 (18.8%) | 139 (1.9%) |
| 4-Person Households | 1,264 (17.0%) | 0 (0.0%) |
| 5-Person Households | 687 (9.2%) | 21 (0.3%) |
| 6-Person Households | 322 (4.3%) | 0 (0.0%) |
| 7+ Person Households | 95 (1.3%) | 9 (0.1%) |
| Total | 5,369 (72.3%) | 2,062 (27.8%) |
Female Fertility in Ashland
Fertility by Age in Ashland
Average fertility rate in Ashland is 38.0 births per 1,000 women. Women in the age bracket of 20 to 34 years have the highest fertility rate with 48.0 births per 1,000 women. Women in the age bracket of 35 to 50 years acount for 51.9% of all women with births.
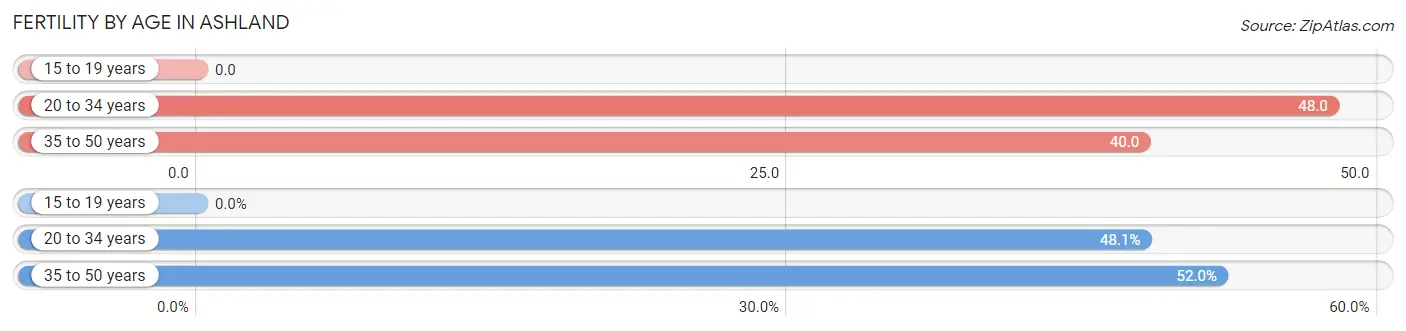
| Age Bracket | Women with Births | Births / 1,000 Women |
| 15 to 19 years | 0 (0.0%) | 0.0 |
| 20 to 34 years | 111 (48.0%) | 48.0 |
| 35 to 50 years | 120 (51.9%) | 40.0 |
| Total | 231 (100.0%) | 38.0 |
Fertility by Age by Marriage Status in Ashland
48.1% of women with births (231) in Ashland are married. The highest percentage of unmarried women with births falls into 35 to 50 years age bracket with 60.8% of them unmarried at the time of birth, while the lowest percentage of unmarried women with births belong to 20 to 34 years age bracket with 42.3% of them unmarried.
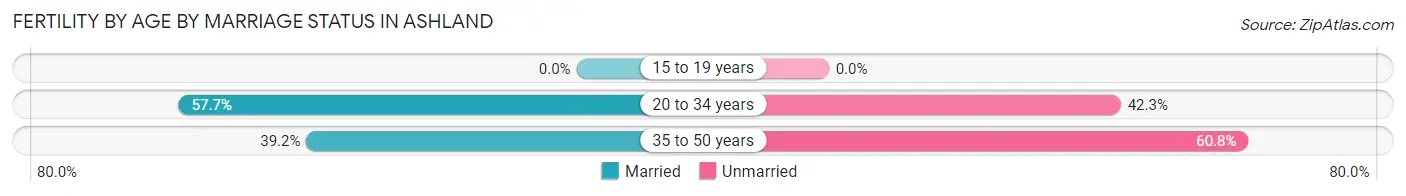
| Age Bracket | Married | Unmarried |
| 15 to 19 years | 0 (0.0%) | 0 (0.0%) |
| 20 to 34 years | 64 (57.7%) | 47 (42.3%) |
| 35 to 50 years | 47 (39.2%) | 73 (60.8%) |
| Total | 111 (48.0%) | 120 (51.9%) |
Fertility by Education in Ashland
Average fertility rate in Ashland is 38.0 births per 1,000 women. Women with the education attainment of graduate degree have the highest fertility rate of 108.0 births per 1,000 women, while women with the education attainment of less than high school have the lowest fertility at 4.0 births per 1,000 women. Women with the education attainment of college or associate's degree represent 32.5% of all women with births.
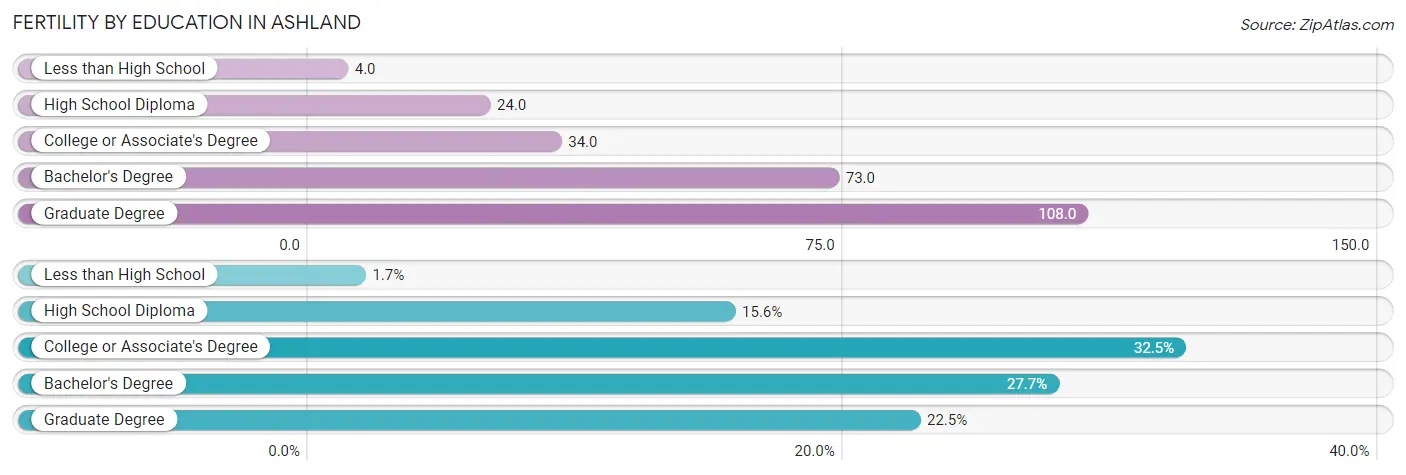
| Educational Attainment | Women with Births | Births / 1,000 Women |
| Less than High School | 4 (1.7%) | 4.0 |
| High School Diploma | 36 (15.6%) | 24.0 |
| College or Associate's Degree | 75 (32.5%) | 34.0 |
| Bachelor's Degree | 64 (27.7%) | 73.0 |
| Graduate Degree | 52 (22.5%) | 108.0 |
| Total | 231 (100.0%) | 38.0 |
Fertility by Education by Marriage Status in Ashland
51.9% of women with births in Ashland are unmarried. Women with the educational attainment of less than high school are most likely to be married with 100.0% of them married at childbirth, while women with the educational attainment of high school diploma are least likely to be married with 100.0% of them unmarried at childbirth.
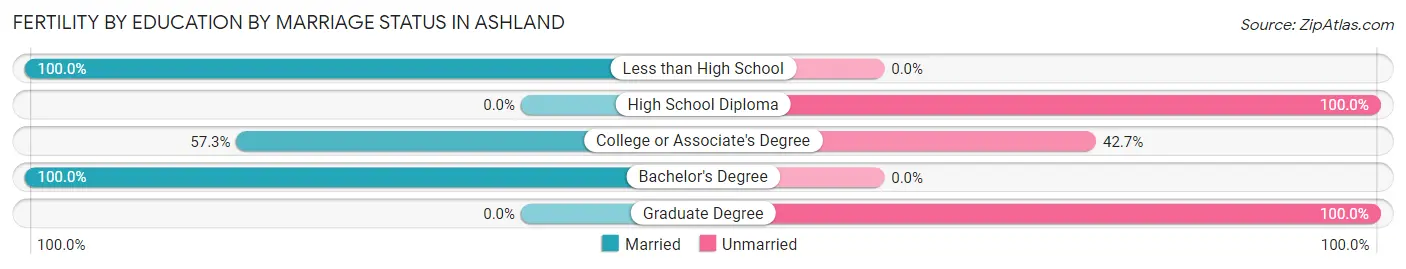
| Educational Attainment | Married | Unmarried |
| Less than High School | 4 (100.0%) | 0 (0.0%) |
| High School Diploma | 0 (0.0%) | 36 (100.0%) |
| College or Associate's Degree | 43 (57.3%) | 32 (42.7%) |
| Bachelor's Degree | 64 (100.0%) | 0 (0.0%) |
| Graduate Degree | 0 (0.0%) | 52 (100.0%) |
| Total | 111 (48.0%) | 120 (51.9%) |
Employment Characteristics in Ashland
Employment by Class of Employer in Ashland
Among the 10,999 employed individuals in Ashland, private company employees (8,329 | 75.7%), local government employees (871 | 7.9%), and not-for-profit organizations (532 | 4.8%) make up the most common classes of employment.
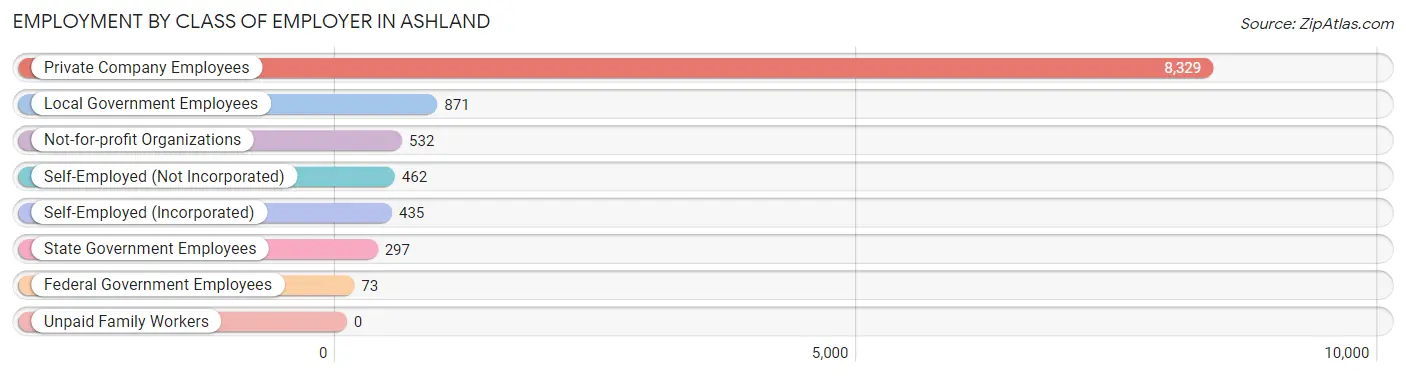
| Employer Class | # Employees | % Employees |
| Private Company Employees | 8,329 | 75.7% |
| Self-Employed (Incorporated) | 435 | 4.0% |
| Self-Employed (Not Incorporated) | 462 | 4.2% |
| Not-for-profit Organizations | 532 | 4.8% |
| Local Government Employees | 871 | 7.9% |
| State Government Employees | 297 | 2.7% |
| Federal Government Employees | 73 | 0.7% |
| Unpaid Family Workers | 0 | 0.0% |
| Total | 10,999 | 100.0% |
Employment Status by Age in Ashland
According to the labor force statistics for Ashland, out of the total population over 16 years of age (18,473), 66.0% or 12,192 individuals are in the labor force, with 6.8% or 829 of them unemployed. The age group with the highest labor force participation rate is 25 to 29 years, with 86.0% or 1,311 individuals in the labor force. Within the labor force, the 20 to 24 years age range has the highest percentage of unemployed individuals, with 13.5% or 129 of them being unemployed.
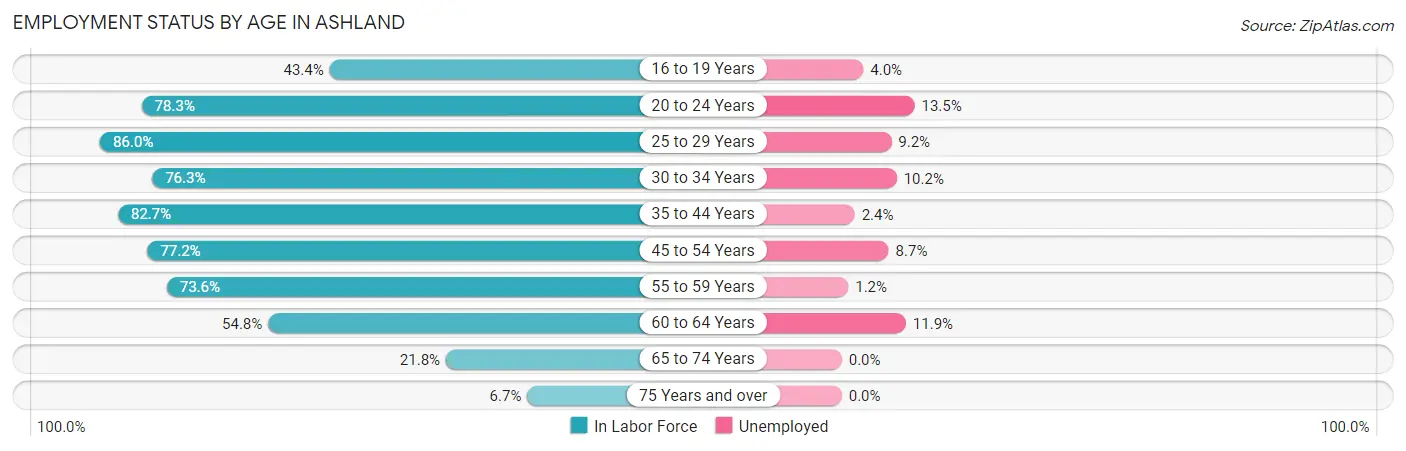
| Age Bracket | In Labor Force | Unemployed |
| 16 to 19 Years | 549 (43.4%) | 22 (4.0%) |
| 20 to 24 Years | 954 (78.3%) | 129 (13.5%) |
| 25 to 29 Years | 1,311 (86.0%) | 121 (9.2%) |
| 30 to 34 Years | 1,763 (76.3%) | 180 (10.2%) |
| 35 to 44 Years | 2,985 (82.7%) | 72 (2.4%) |
| 45 to 54 Years | 2,749 (77.2%) | 239 (8.7%) |
| 55 to 59 Years | 928 (73.6%) | 11 (1.2%) |
| 60 to 64 Years | 521 (54.8%) | 62 (11.9%) |
| 65 to 74 Years | 355 (21.8%) | 0 (0.0%) |
| 75 Years and over | 77 (6.7%) | 0 (0.0%) |
| Total | 12,192 (66.0%) | 829 (6.8%) |
Employment Status by Educational Attainment in Ashland
According to labor force statistics for Ashland, 77.6% of individuals (10,255) out of the total population between 25 and 64 years of age (13,215) are in the labor force, with 6.7% or 687 of them being unemployed. The group with the highest labor force participation rate are those with the educational attainment of bachelor's degree or higher, with 88.6% or 2,599 individuals in the labor force. Within the labor force, individuals with high school diploma education have the highest percentage of unemployment, with 8.8% or 227 of them being unemployed.
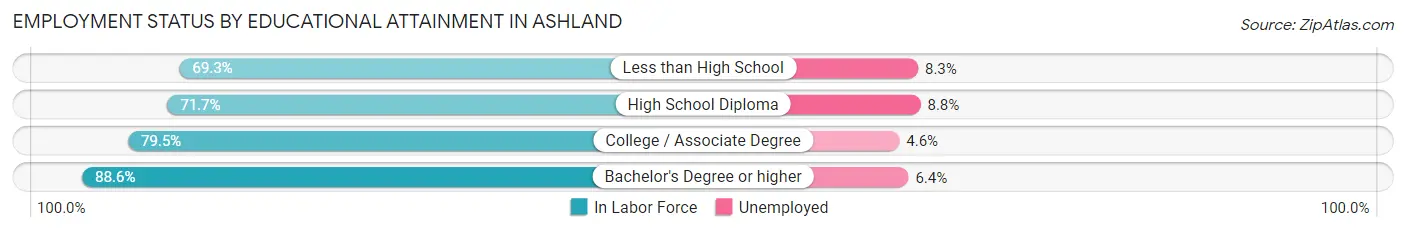
| Educational Attainment | In Labor Force | Unemployed |
| Less than High School | 1,600 (69.3%) | 192 (8.3%) |
| High School Diploma | 2,578 (71.7%) | 316 (8.8%) |
| College / Associate Degree | 3,481 (79.5%) | 201 (4.6%) |
| Bachelor's Degree or higher | 2,599 (88.6%) | 188 (6.4%) |
| Total | 10,255 (77.6%) | 885 (6.7%) |
Employment Occupations by Sex in Ashland
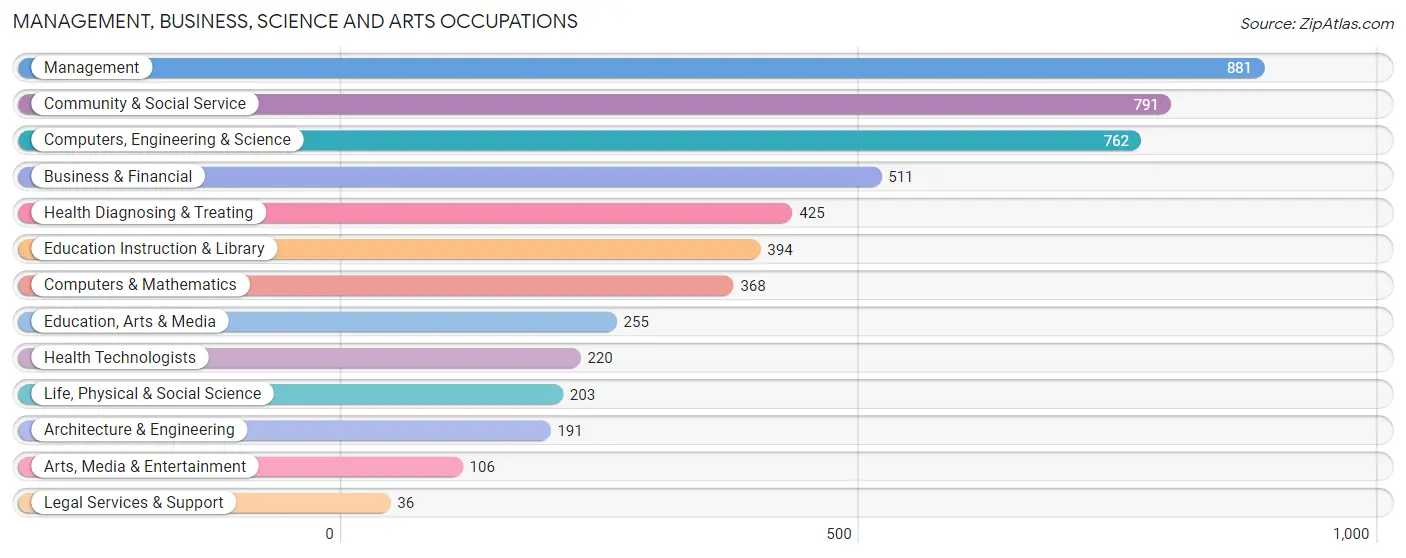
Management, Business, Science and Arts Occupations
The most common Management, Business, Science and Arts occupations in Ashland are Management (881 | 7.8%), Community & Social Service (791 | 7.0%), Computers, Engineering & Science (762 | 6.7%), Business & Financial (511 | 4.5%), and Health Diagnosing & Treating (425 | 3.7%).
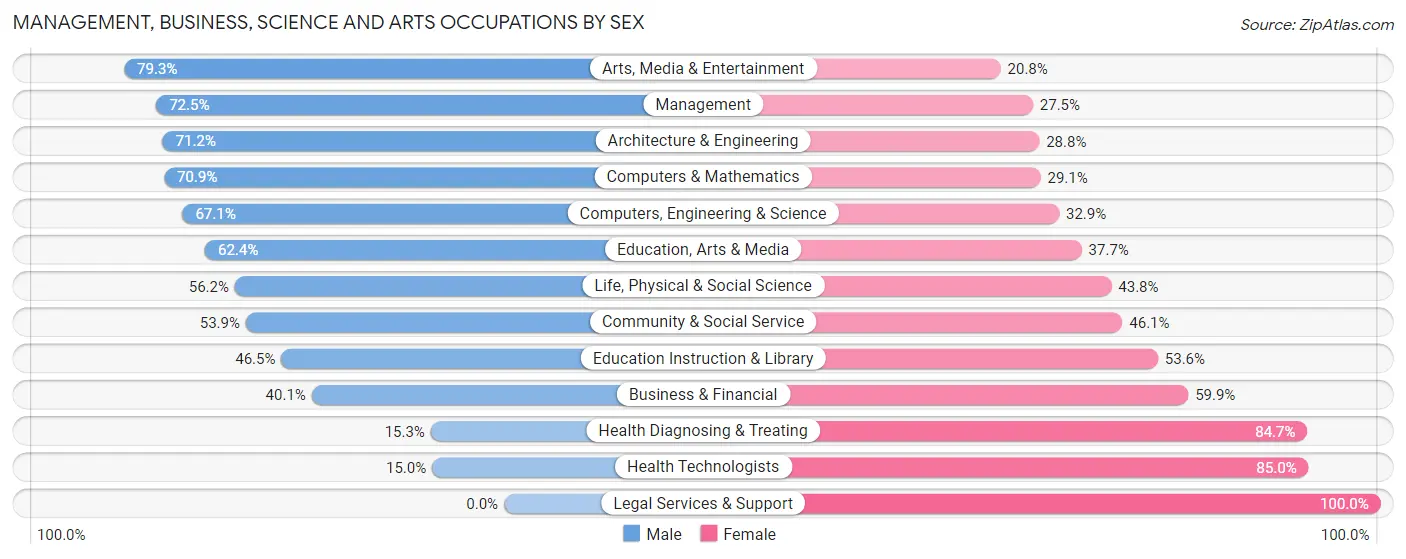
Management, Business, Science and Arts Occupations by Sex
Within the Management, Business, Science and Arts occupations in Ashland, the most male-oriented occupations are Arts, Media & Entertainment (79.2%), Management (72.5%), and Architecture & Engineering (71.2%), while the most female-oriented occupations are Legal Services & Support (100.0%), Health Technologists (85.0%), and Health Diagnosing & Treating (84.7%).
| Occupation | Male | Female |
| Management | 639 (72.5%) | 242 (27.5%) |
| Business & Financial | 205 (40.1%) | 306 (59.9%) |
| Computers, Engineering & Science | 511 (67.1%) | 251 (32.9%) |
| Computers & Mathematics | 261 (70.9%) | 107 (29.1%) |
| Architecture & Engineering | 136 (71.2%) | 55 (28.8%) |
| Life, Physical & Social Science | 114 (56.2%) | 89 (43.8%) |
| Community & Social Service | 426 (53.9%) | 365 (46.1%) |
| Education, Arts & Media | 159 (62.4%) | 96 (37.7%) |
| Legal Services & Support | 0 (0.0%) | 36 (100.0%) |
| Education Instruction & Library | 183 (46.5%) | 211 (53.5%) |
| Arts, Media & Entertainment | 84 (79.2%) | 22 (20.7%) |
| Health Diagnosing & Treating | 65 (15.3%) | 360 (84.7%) |
| Health Technologists | 33 (15.0%) | 187 (85.0%) |
| Total (Category) | 1,846 (54.8%) | 1,524 (45.2%) |
| Total (Overall) | 6,207 (54.6%) | 5,150 (45.4%) |
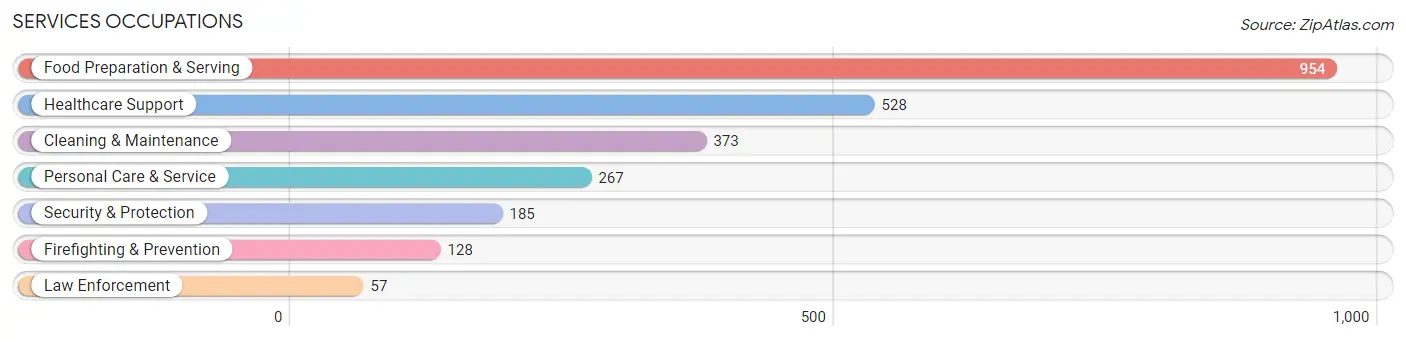
Services Occupations
The most common Services occupations in Ashland are Food Preparation & Serving (954 | 8.4%), Healthcare Support (528 | 4.6%), Cleaning & Maintenance (373 | 3.3%), Personal Care & Service (267 | 2.4%), and Security & Protection (185 | 1.6%).
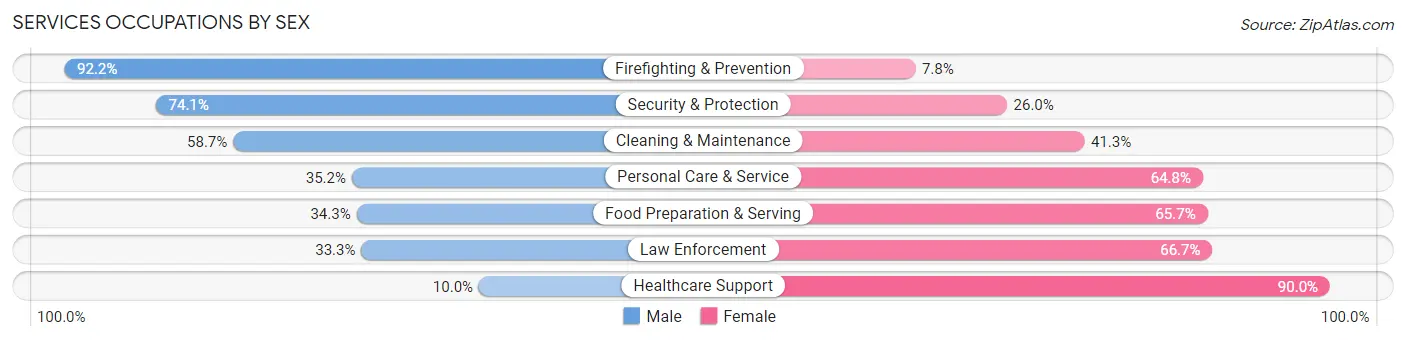
Services Occupations by Sex
Within the Services occupations in Ashland, the most male-oriented occupations are Firefighting & Prevention (92.2%), Security & Protection (74.1%), and Cleaning & Maintenance (58.7%), while the most female-oriented occupations are Healthcare Support (90.0%), Law Enforcement (66.7%), and Food Preparation & Serving (65.7%).
| Occupation | Male | Female |
| Healthcare Support | 53 (10.0%) | 475 (90.0%) |
| Security & Protection | 137 (74.1%) | 48 (26.0%) |
| Firefighting & Prevention | 118 (92.2%) | 10 (7.8%) |
| Law Enforcement | 19 (33.3%) | 38 (66.7%) |
| Food Preparation & Serving | 327 (34.3%) | 627 (65.7%) |
| Cleaning & Maintenance | 219 (58.7%) | 154 (41.3%) |
| Personal Care & Service | 94 (35.2%) | 173 (64.8%) |
| Total (Category) | 830 (36.0%) | 1,477 (64.0%) |
| Total (Overall) | 6,207 (54.6%) | 5,150 (45.4%) |
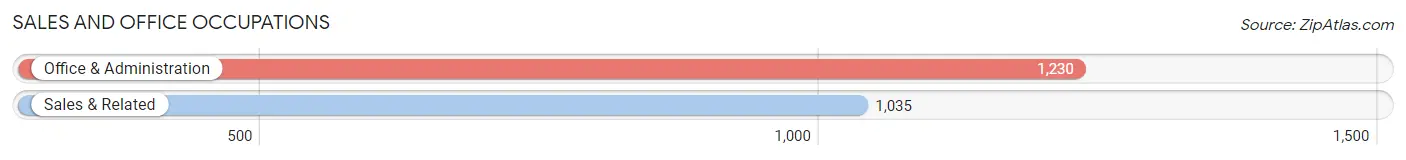
Sales and Office Occupations
The most common Sales and Office occupations in Ashland are Office & Administration (1,230 | 10.8%), and Sales & Related (1,035 | 9.1%).
Sales and Office Occupations by Sex
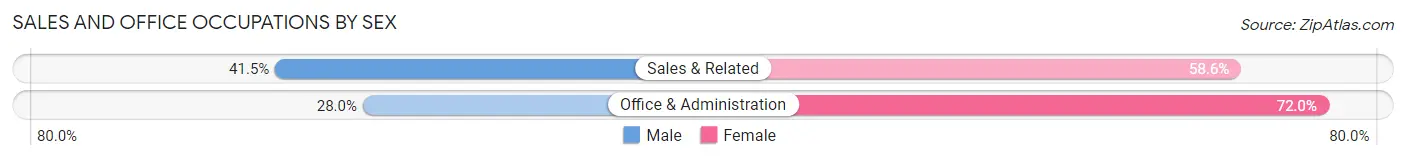
| Occupation | Male | Female |
| Sales & Related | 429 (41.4%) | 606 (58.6%) |
| Office & Administration | 344 (28.0%) | 886 (72.0%) |
| Total (Category) | 773 (34.1%) | 1,492 (65.9%) |
| Total (Overall) | 6,207 (54.6%) | 5,150 (45.4%) |
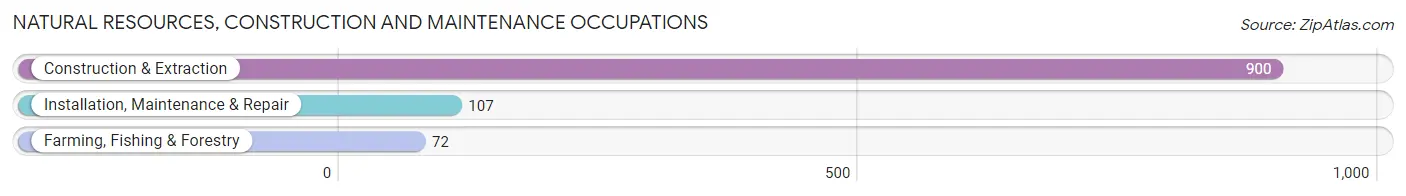
Natural Resources, Construction and Maintenance Occupations
The most common Natural Resources, Construction and Maintenance occupations in Ashland are Construction & Extraction (900 | 7.9%), Installation, Maintenance & Repair (107 | 0.9%), and Farming, Fishing & Forestry (72 | 0.6%).
Natural Resources, Construction and Maintenance Occupations by Sex
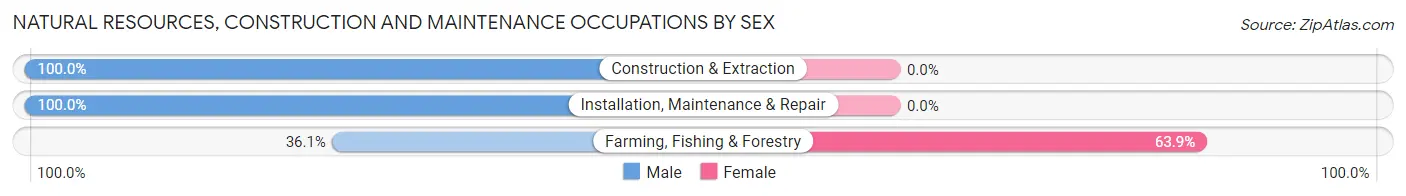
| Occupation | Male | Female |
| Farming, Fishing & Forestry | 26 (36.1%) | 46 (63.9%) |
| Construction & Extraction | 900 (100.0%) | 0 (0.0%) |
| Installation, Maintenance & Repair | 107 (100.0%) | 0 (0.0%) |
| Total (Category) | 1,033 (95.7%) | 46 (4.3%) |
| Total (Overall) | 6,207 (54.6%) | 5,150 (45.4%) |
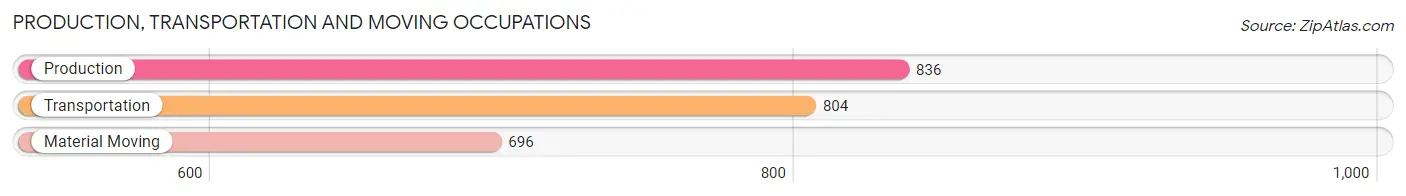
Production, Transportation and Moving Occupations
The most common Production, Transportation and Moving occupations in Ashland are Production (836 | 7.4%), Transportation (804 | 7.1%), and Material Moving (696 | 6.1%).
Production, Transportation and Moving Occupations by Sex
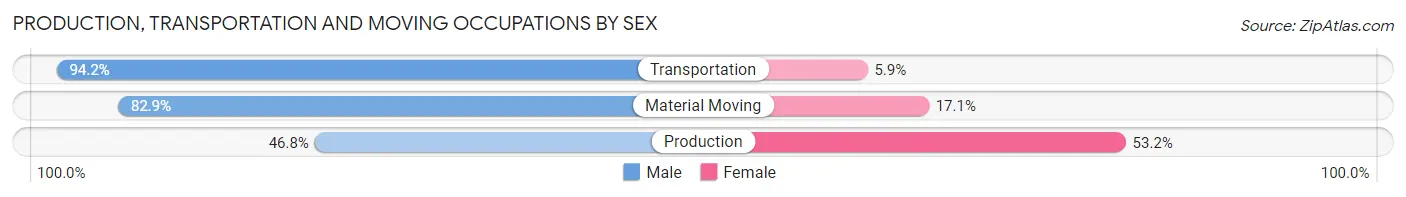
| Occupation | Male | Female |
| Production | 391 (46.8%) | 445 (53.2%) |
| Transportation | 757 (94.2%) | 47 (5.9%) |
| Material Moving | 577 (82.9%) | 119 (17.1%) |
| Total (Category) | 1,725 (73.8%) | 611 (26.2%) |
| Total (Overall) | 6,207 (54.6%) | 5,150 (45.4%) |
Employment Industries by Sex in Ashland
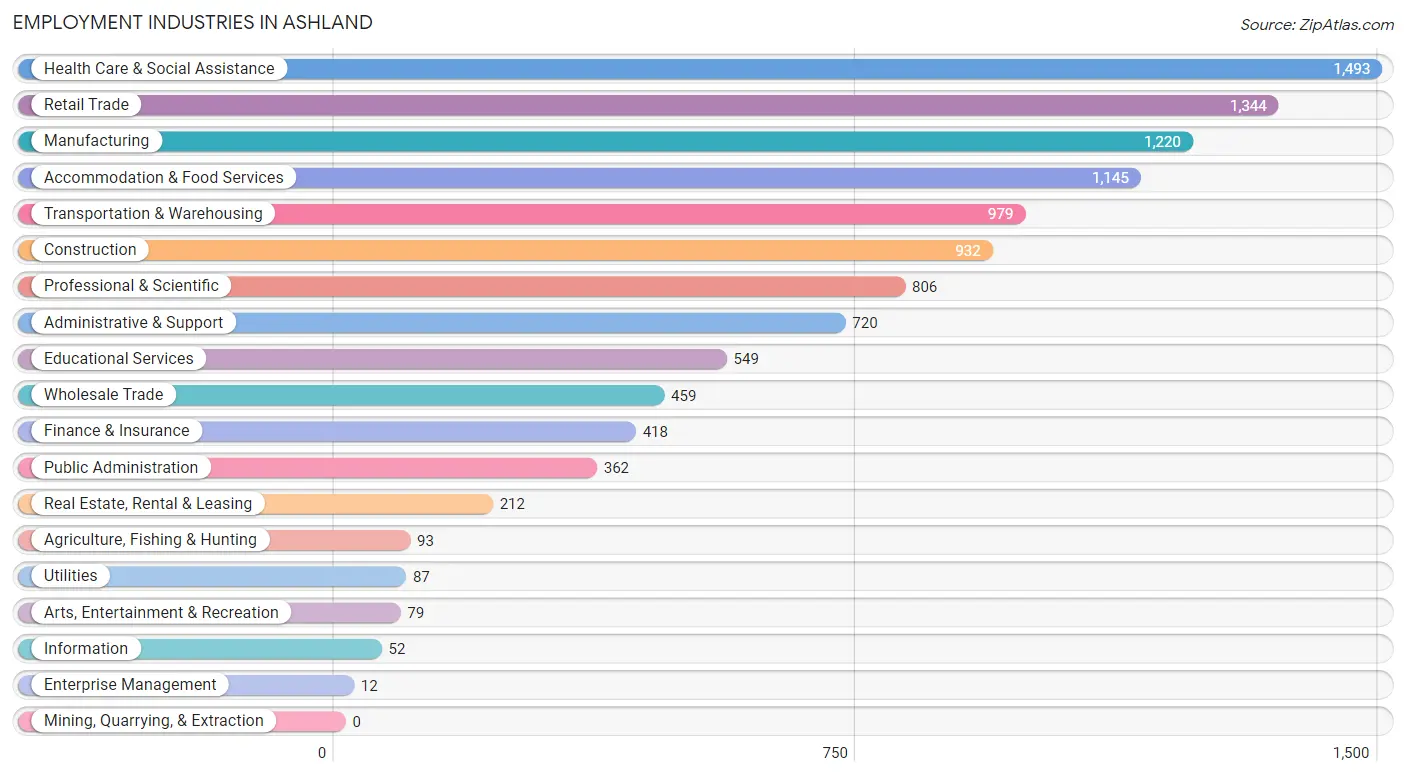
Employment Industries in Ashland
The major employment industries in Ashland include Health Care & Social Assistance (1,493 | 13.2%), Retail Trade (1,344 | 11.8%), Manufacturing (1,220 | 10.7%), Accommodation & Food Services (1,145 | 10.1%), and Transportation & Warehousing (979 | 8.6%).
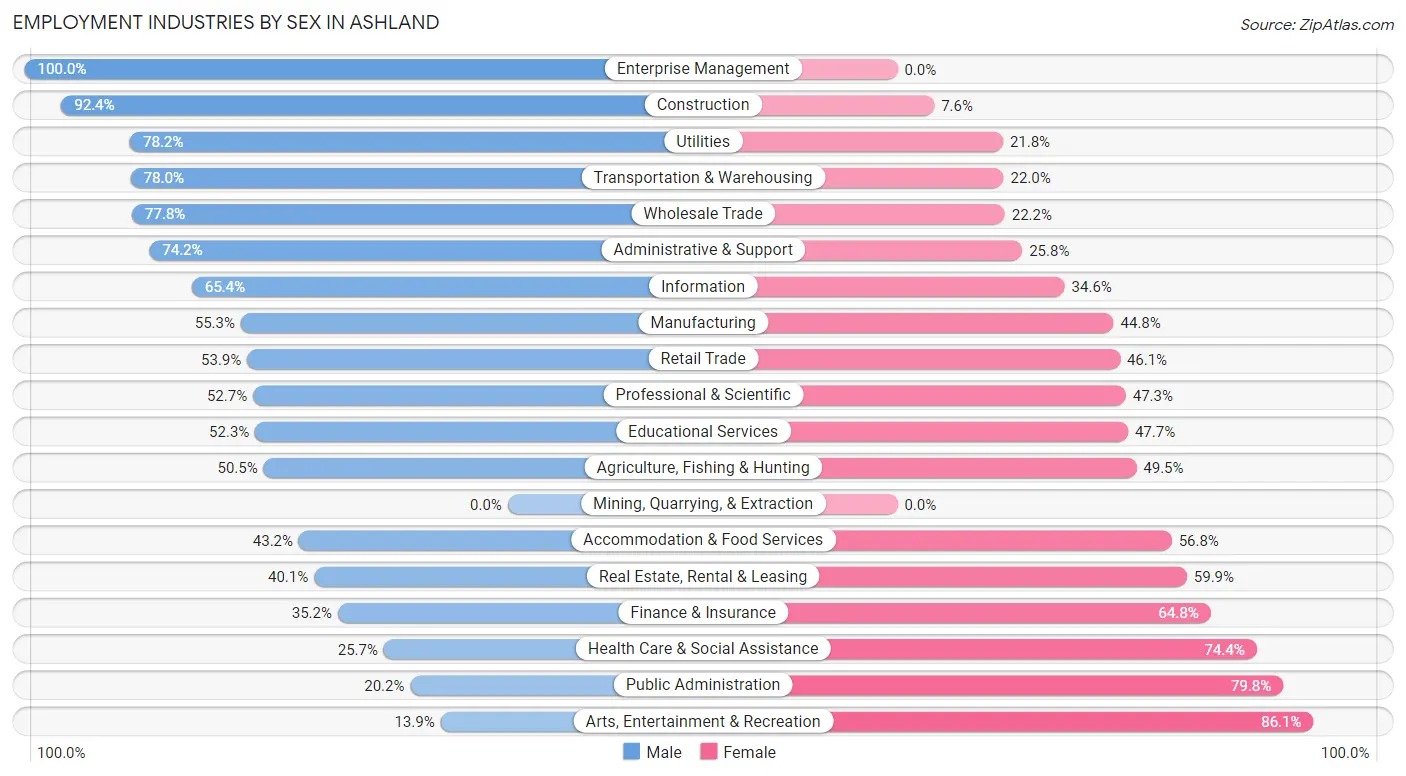
Employment Industries by Sex in Ashland
The Ashland industries that see more men than women are Enterprise Management (100.0%), Construction (92.4%), and Utilities (78.2%), whereas the industries that tend to have a higher number of women are Arts, Entertainment & Recreation (86.1%), Public Administration (79.8%), and Health Care & Social Assistance (74.4%).
| Industry | Male | Female |
| Agriculture, Fishing & Hunting | 47 (50.5%) | 46 (49.5%) |
| Mining, Quarrying, & Extraction | 0 (0.0%) | 0 (0.0%) |
| Construction | 861 (92.4%) | 71 (7.6%) |
| Manufacturing | 674 (55.2%) | 546 (44.8%) |
| Wholesale Trade | 357 (77.8%) | 102 (22.2%) |
| Retail Trade | 725 (53.9%) | 619 (46.1%) |
| Transportation & Warehousing | 764 (78.0%) | 215 (22.0%) |
| Utilities | 68 (78.2%) | 19 (21.8%) |
| Information | 34 (65.4%) | 18 (34.6%) |
| Finance & Insurance | 147 (35.2%) | 271 (64.8%) |
| Real Estate, Rental & Leasing | 85 (40.1%) | 127 (59.9%) |
| Professional & Scientific | 425 (52.7%) | 381 (47.3%) |
| Enterprise Management | 12 (100.0%) | 0 (0.0%) |
| Administrative & Support | 534 (74.2%) | 186 (25.8%) |
| Educational Services | 287 (52.3%) | 262 (47.7%) |
| Health Care & Social Assistance | 383 (25.7%) | 1,110 (74.4%) |
| Arts, Entertainment & Recreation | 11 (13.9%) | 68 (86.1%) |
| Accommodation & Food Services | 495 (43.2%) | 650 (56.8%) |
| Public Administration | 73 (20.2%) | 289 (79.8%) |
| Total | 6,207 (54.6%) | 5,150 (45.4%) |
Education in Ashland
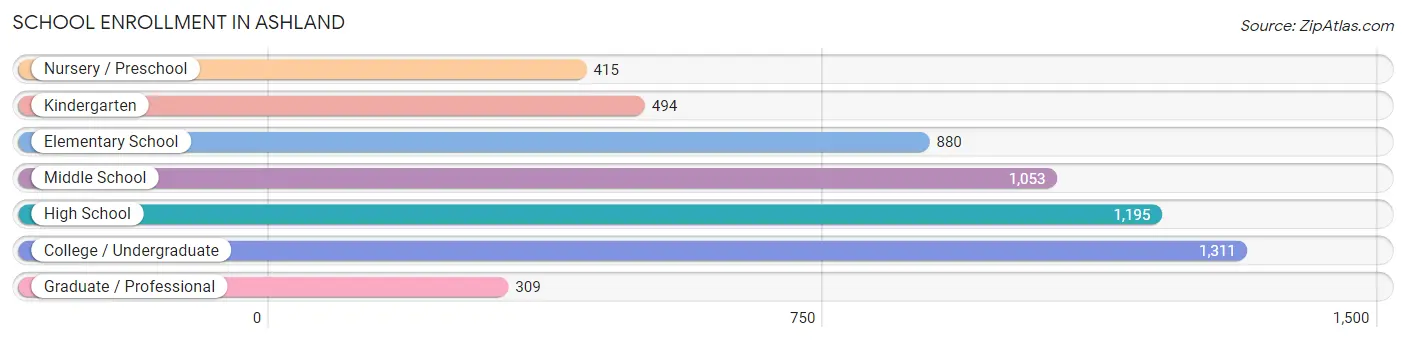
School Enrollment in Ashland
The most common levels of schooling among the 5,657 students in Ashland are college / undergraduate (1,311 | 23.2%), high school (1,195 | 21.1%), and middle school (1,053 | 18.6%).
| School Level | # Students | % Students |
| Nursery / Preschool | 415 | 7.3% |
| Kindergarten | 494 | 8.7% |
| Elementary School | 880 | 15.6% |
| Middle School | 1,053 | 18.6% |
| High School | 1,195 | 21.1% |
| College / Undergraduate | 1,311 | 23.2% |
| Graduate / Professional | 309 | 5.5% |
| Total | 5,657 | 100.0% |
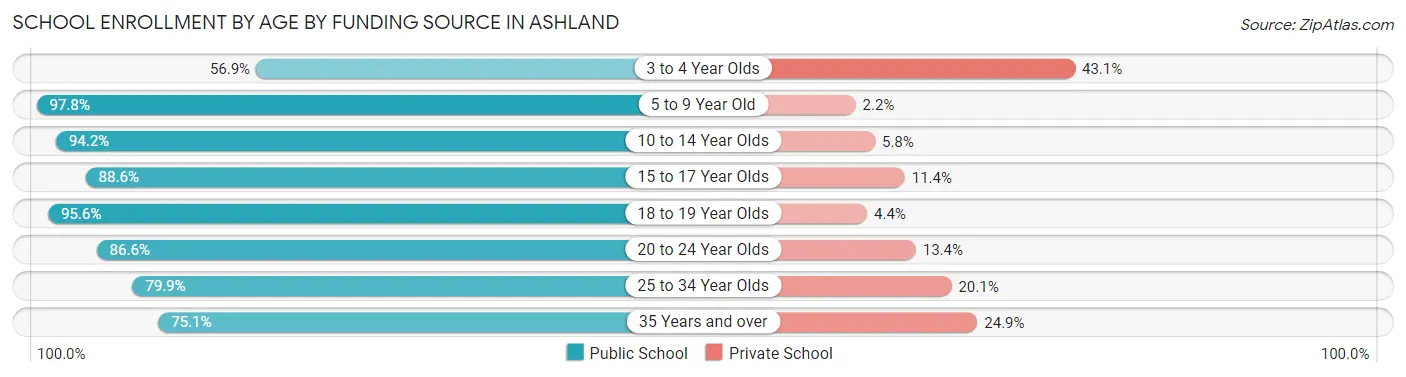
School Enrollment by Age by Funding Source in Ashland
Out of a total of 5,657 students who are enrolled in schools in Ashland, 600 (10.6%) attend a private institution, while the remaining 5,057 (89.4%) are enrolled in public schools. The age group of 3 to 4 year olds has the highest likelihood of being enrolled in private schools, with 156 (43.1% in the age bracket) enrolled. Conversely, the age group of 5 to 9 year old has the lowest likelihood of being enrolled in a private school, with 1,360 (97.8% in the age bracket) attending a public institution.
| Age Bracket | Public School | Private School |
| 3 to 4 Year Olds | 206 (56.9%) | 156 (43.1%) |
| 5 to 9 Year Old | 1,360 (97.8%) | 31 (2.2%) |
| 10 to 14 Year Olds | 1,323 (94.2%) | 82 (5.8%) |
| 15 to 17 Year Olds | 522 (88.6%) | 67 (11.4%) |
| 18 to 19 Year Olds | 571 (95.6%) | 26 (4.4%) |
| 20 to 24 Year Olds | 464 (86.6%) | 72 (13.4%) |
| 25 to 34 Year Olds | 422 (79.9%) | 106 (20.1%) |
| 35 Years and over | 187 (75.1%) | 62 (24.9%) |
| Total | 5,057 (89.4%) | 600 (10.6%) |
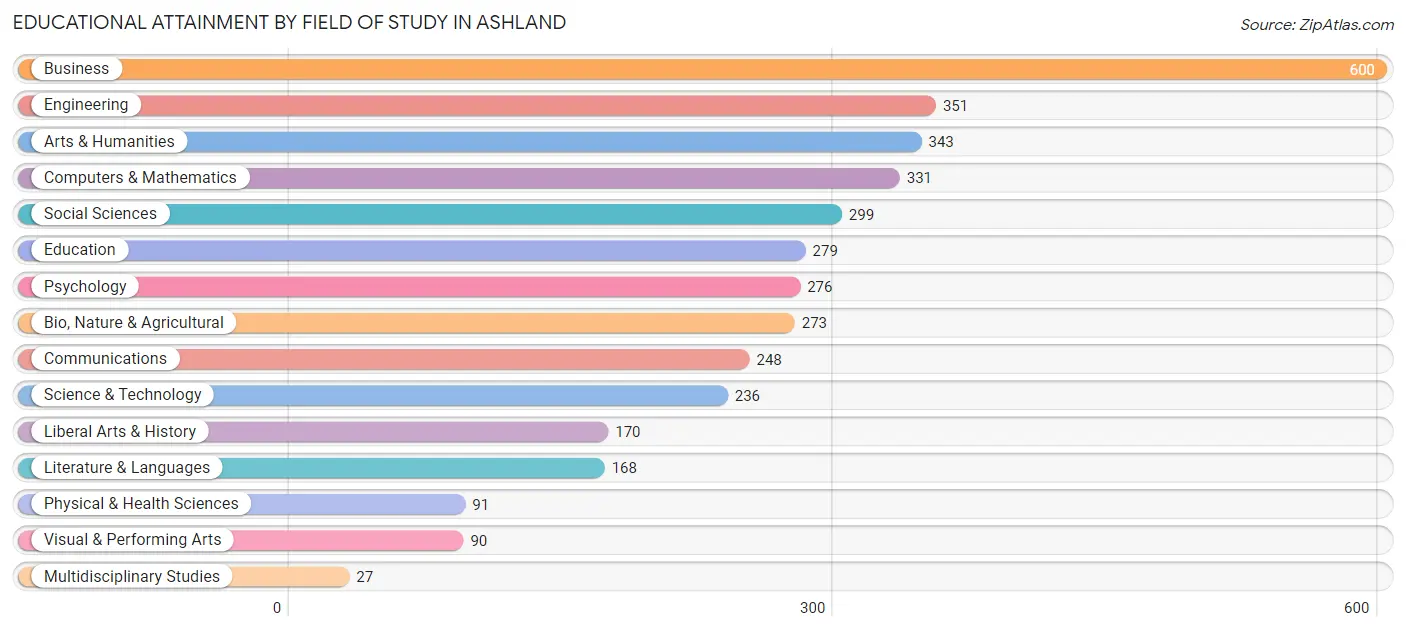
Educational Attainment by Field of Study in Ashland
Business (600 | 15.9%), engineering (351 | 9.3%), arts & humanities (343 | 9.1%), computers & mathematics (331 | 8.7%), and social sciences (299 | 7.9%) are the most common fields of study among 3,782 individuals in Ashland who have obtained a bachelor's degree or higher.
| Field of Study | # Graduates | % Graduates |
| Computers & Mathematics | 331 | 8.7% |
| Bio, Nature & Agricultural | 273 | 7.2% |
| Physical & Health Sciences | 91 | 2.4% |
| Psychology | 276 | 7.3% |
| Social Sciences | 299 | 7.9% |
| Engineering | 351 | 9.3% |
| Multidisciplinary Studies | 27 | 0.7% |
| Science & Technology | 236 | 6.2% |
| Business | 600 | 15.9% |
| Education | 279 | 7.4% |
| Literature & Languages | 168 | 4.4% |
| Liberal Arts & History | 170 | 4.5% |
| Visual & Performing Arts | 90 | 2.4% |
| Communications | 248 | 6.6% |
| Arts & Humanities | 343 | 9.1% |
| Total | 3,782 | 100.0% |
Transportation & Commute in Ashland
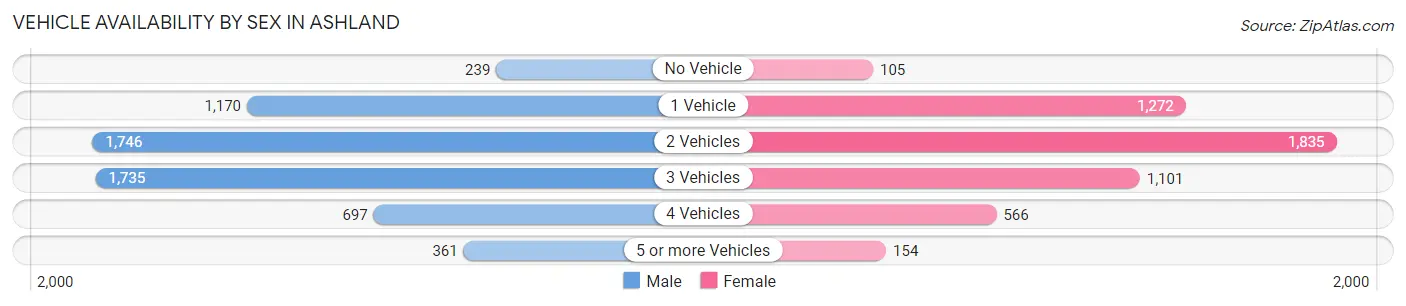
Vehicle Availability by Sex in Ashland
The most prevalent vehicle ownership categories in Ashland are males with 2 vehicles (1,746, accounting for 29.3%) and females with 2 vehicles (1,835, making up 34.7%).
| Vehicles Available | Male | Female |
| No Vehicle | 239 (4.0%) | 105 (2.1%) |
| 1 Vehicle | 1,170 (19.7%) | 1,272 (25.3%) |
| 2 Vehicles | 1,746 (29.3%) | 1,835 (36.5%) |
| 3 Vehicles | 1,735 (29.2%) | 1,101 (21.9%) |
| 4 Vehicles | 697 (11.7%) | 566 (11.3%) |
| 5 or more Vehicles | 361 (6.1%) | 154 (3.1%) |
| Total | 5,948 (100.0%) | 5,033 (100.0%) |
Commute Time in Ashland
The most frequently occuring commute durations in Ashland are 15 to 19 minutes (1,681 commuters, 16.6%), 30 to 34 minutes (1,656 commuters, 16.3%), and 60 to 89 minutes (1,354 commuters, 13.4%).
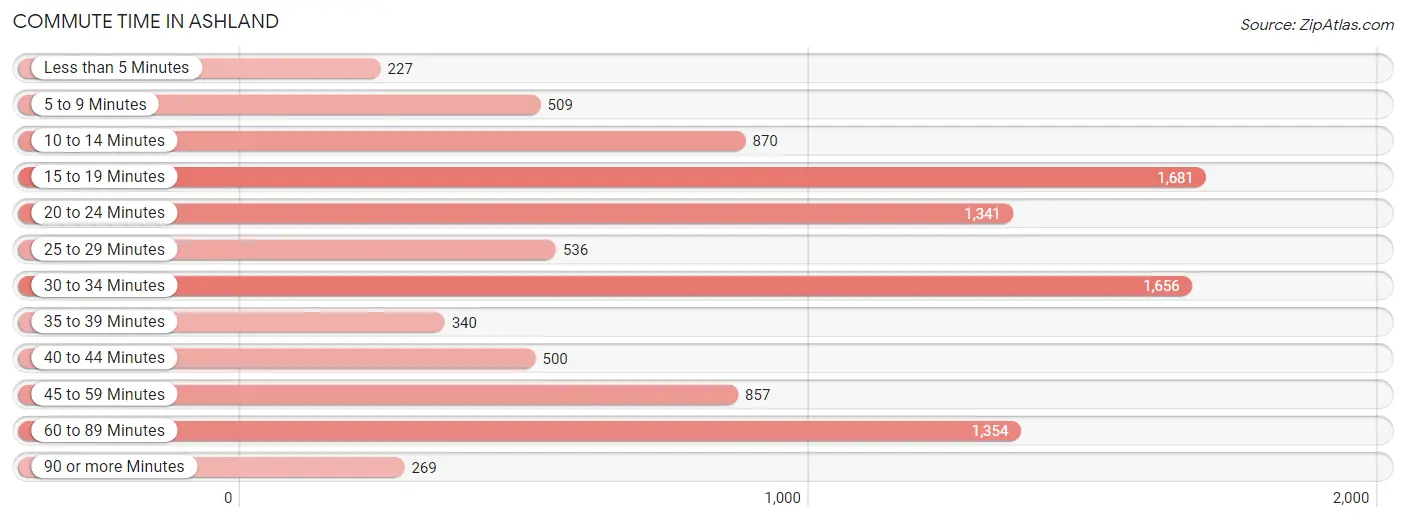
| Commute Time | # Commuters | % Commuters |
| Less than 5 Minutes | 227 | 2.2% |
| 5 to 9 Minutes | 509 | 5.0% |
| 10 to 14 Minutes | 870 | 8.6% |
| 15 to 19 Minutes | 1,681 | 16.6% |
| 20 to 24 Minutes | 1,341 | 13.2% |
| 25 to 29 Minutes | 536 | 5.3% |
| 30 to 34 Minutes | 1,656 | 16.3% |
| 35 to 39 Minutes | 340 | 3.4% |
| 40 to 44 Minutes | 500 | 4.9% |
| 45 to 59 Minutes | 857 | 8.5% |
| 60 to 89 Minutes | 1,354 | 13.4% |
| 90 or more Minutes | 269 | 2.6% |
Commute Time by Sex in Ashland
The most common commute times in Ashland are 30 to 34 minutes (995 commuters, 17.9%) for males and 15 to 19 minutes (824 commuters, 17.9%) for females.
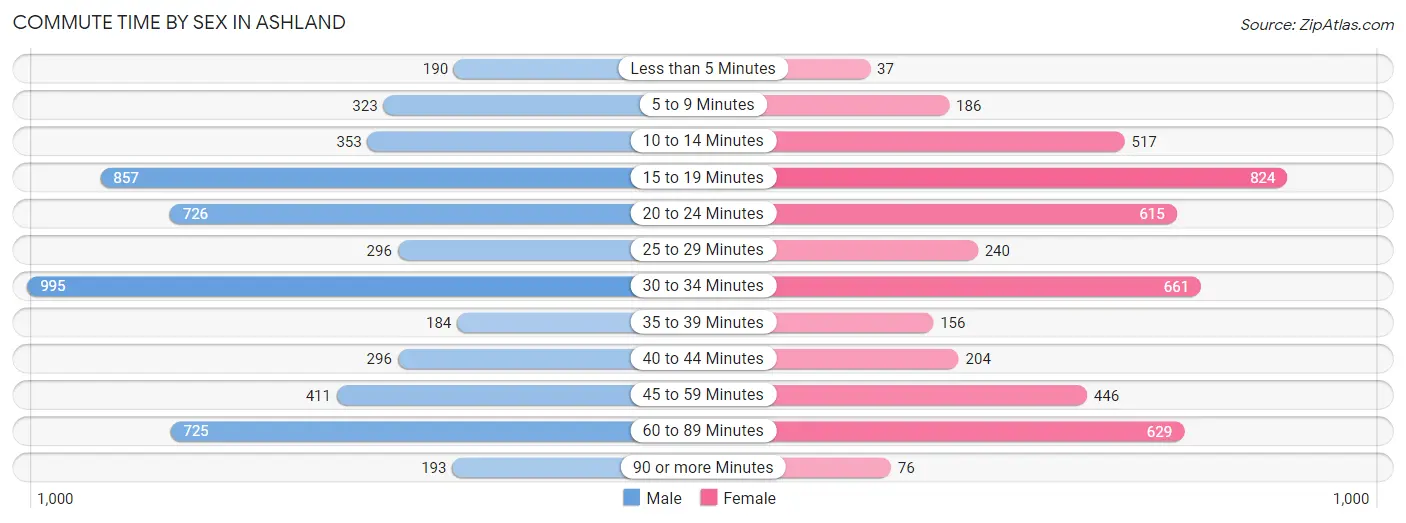
| Commute Time | Male | Female |
| Less than 5 Minutes | 190 (3.4%) | 37 (0.8%) |
| 5 to 9 Minutes | 323 (5.8%) | 186 (4.1%) |
| 10 to 14 Minutes | 353 (6.4%) | 517 (11.3%) |
| 15 to 19 Minutes | 857 (15.4%) | 824 (17.9%) |
| 20 to 24 Minutes | 726 (13.1%) | 615 (13.4%) |
| 25 to 29 Minutes | 296 (5.3%) | 240 (5.2%) |
| 30 to 34 Minutes | 995 (17.9%) | 661 (14.4%) |
| 35 to 39 Minutes | 184 (3.3%) | 156 (3.4%) |
| 40 to 44 Minutes | 296 (5.3%) | 204 (4.4%) |
| 45 to 59 Minutes | 411 (7.4%) | 446 (9.7%) |
| 60 to 89 Minutes | 725 (13.1%) | 629 (13.7%) |
| 90 or more Minutes | 193 (3.5%) | 76 (1.7%) |
Time of Departure to Work by Sex in Ashland
The most frequent times of departure to work in Ashland are 8:00 AM to 8:29 AM (624, 11.3%) for males and 7:00 AM to 7:29 AM (691, 15.0%) for females.
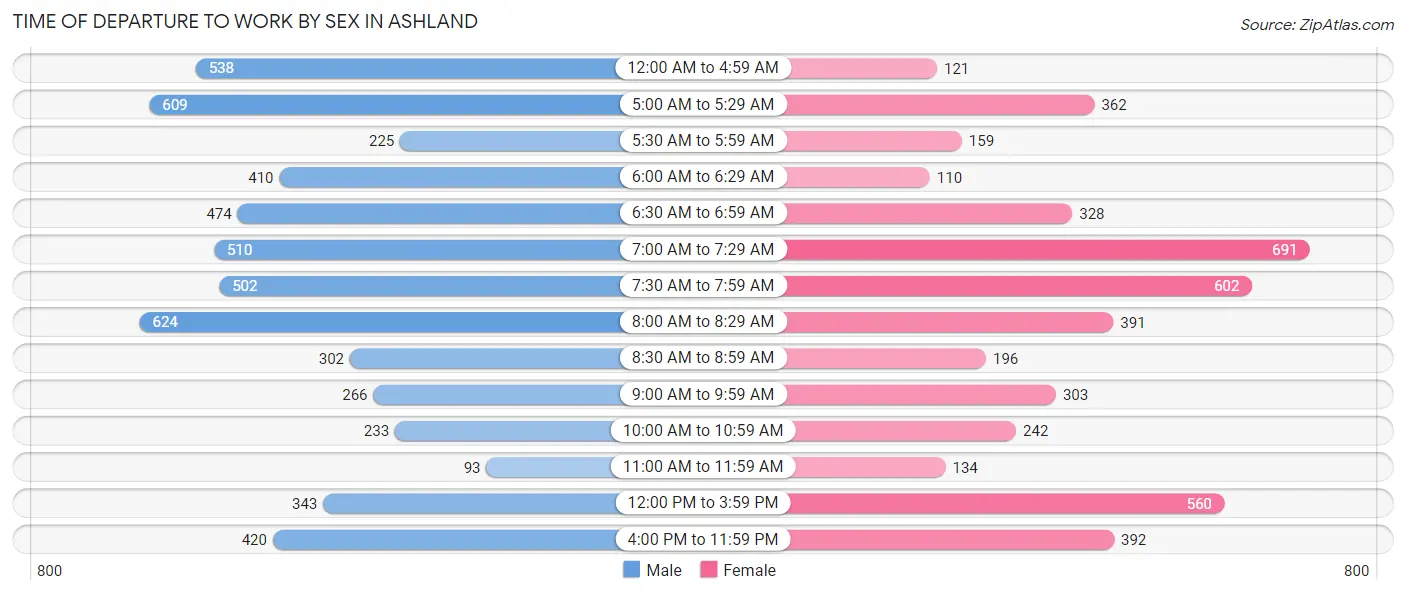
| Time of Departure | Male | Female |
| 12:00 AM to 4:59 AM | 538 (9.7%) | 121 (2.6%) |
| 5:00 AM to 5:29 AM | 609 (11.0%) | 362 (7.9%) |
| 5:30 AM to 5:59 AM | 225 (4.1%) | 159 (3.5%) |
| 6:00 AM to 6:29 AM | 410 (7.4%) | 110 (2.4%) |
| 6:30 AM to 6:59 AM | 474 (8.5%) | 328 (7.1%) |
| 7:00 AM to 7:29 AM | 510 (9.2%) | 691 (15.0%) |
| 7:30 AM to 7:59 AM | 502 (9.0%) | 602 (13.1%) |
| 8:00 AM to 8:29 AM | 624 (11.3%) | 391 (8.5%) |
| 8:30 AM to 8:59 AM | 302 (5.4%) | 196 (4.3%) |
| 9:00 AM to 9:59 AM | 266 (4.8%) | 303 (6.6%) |
| 10:00 AM to 10:59 AM | 233 (4.2%) | 242 (5.3%) |
| 11:00 AM to 11:59 AM | 93 (1.7%) | 134 (2.9%) |
| 12:00 PM to 3:59 PM | 343 (6.2%) | 560 (12.2%) |
| 4:00 PM to 11:59 PM | 420 (7.6%) | 392 (8.5%) |
| Total | 5,549 (100.0%) | 4,591 (100.0%) |
Housing Occupancy in Ashland
Occupancy by Ownership in Ashland
Of the total 7,431 dwellings in Ashland, owner-occupied units account for 2,832 (38.1%), while renter-occupied units make up 4,599 (61.9%).
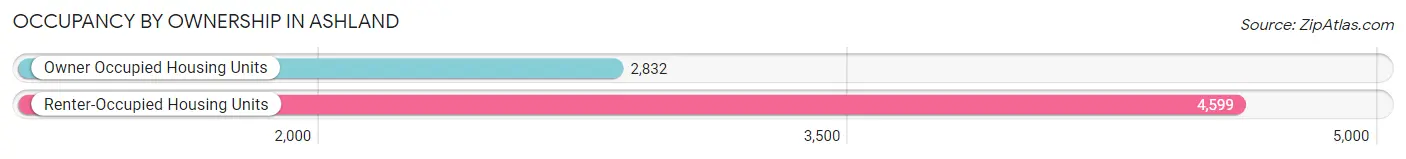
| Occupancy | # Housing Units | % Housing Units |
| Owner Occupied Housing Units | 2,832 | 38.1% |
| Renter-Occupied Housing Units | 4,599 | 61.9% |
| Total Occupied Housing Units | 7,431 | 100.0% |
Occupancy by Household Size in Ashland
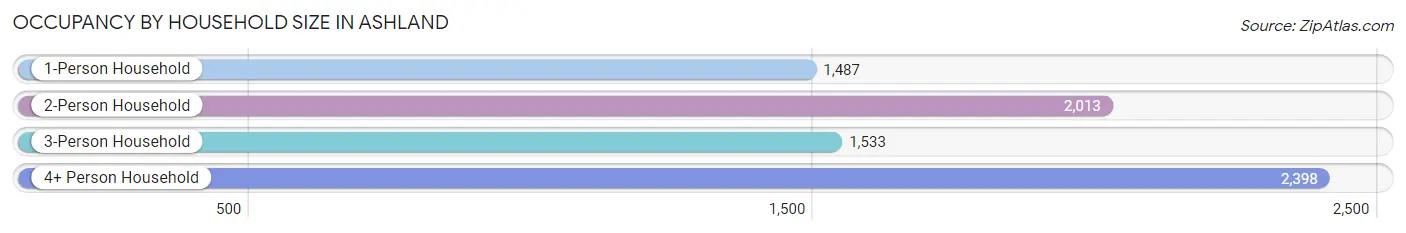
| Household Size | # Housing Units | % Housing Units |
| 1-Person Household | 1,487 | 20.0% |
| 2-Person Household | 2,013 | 27.1% |
| 3-Person Household | 1,533 | 20.6% |
| 4+ Person Household | 2,398 | 32.3% |
| Total Housing Units | 7,431 | 100.0% |
Occupancy by Ownership by Household Size in Ashland
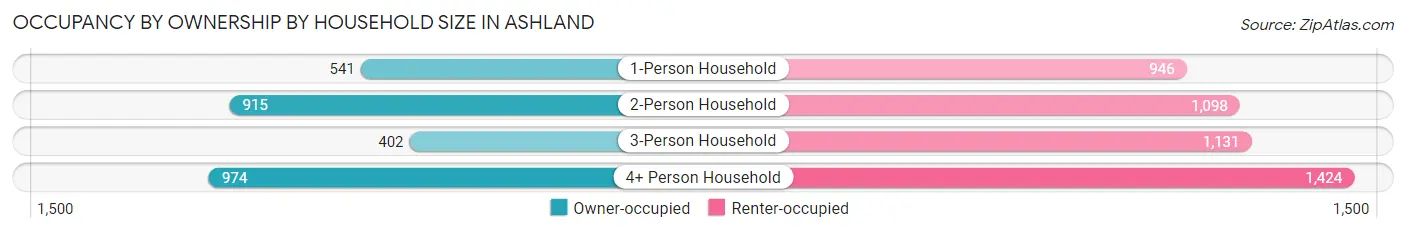
| Household Size | Owner-occupied | Renter-occupied |
| 1-Person Household | 541 (36.4%) | 946 (63.6%) |
| 2-Person Household | 915 (45.5%) | 1,098 (54.5%) |
| 3-Person Household | 402 (26.2%) | 1,131 (73.8%) |
| 4+ Person Household | 974 (40.6%) | 1,424 (59.4%) |
| Total Housing Units | 2,832 (38.1%) | 4,599 (61.9%) |
Occupancy by Educational Attainment in Ashland
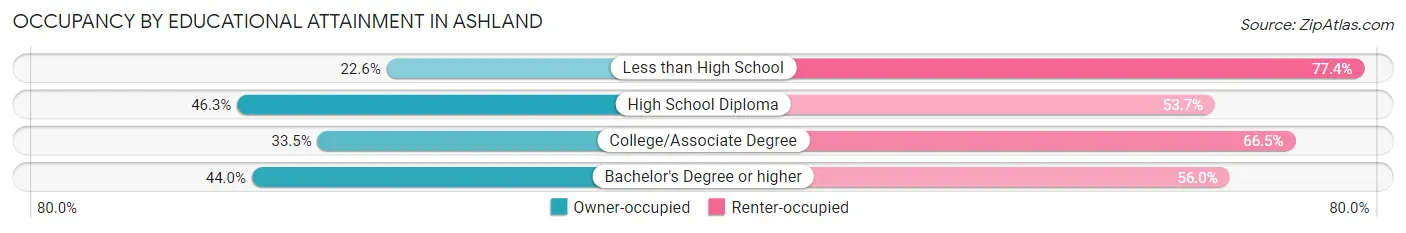
| Household Size | Owner-occupied | Renter-occupied |
| Less than High School | 212 (22.6%) | 726 (77.4%) |
| High School Diploma | 890 (46.3%) | 1,033 (53.7%) |
| College/Associate Degree | 897 (33.5%) | 1,778 (66.5%) |
| Bachelor's Degree or higher | 833 (44.0%) | 1,062 (56.0%) |
Occupancy by Age of Householder in Ashland
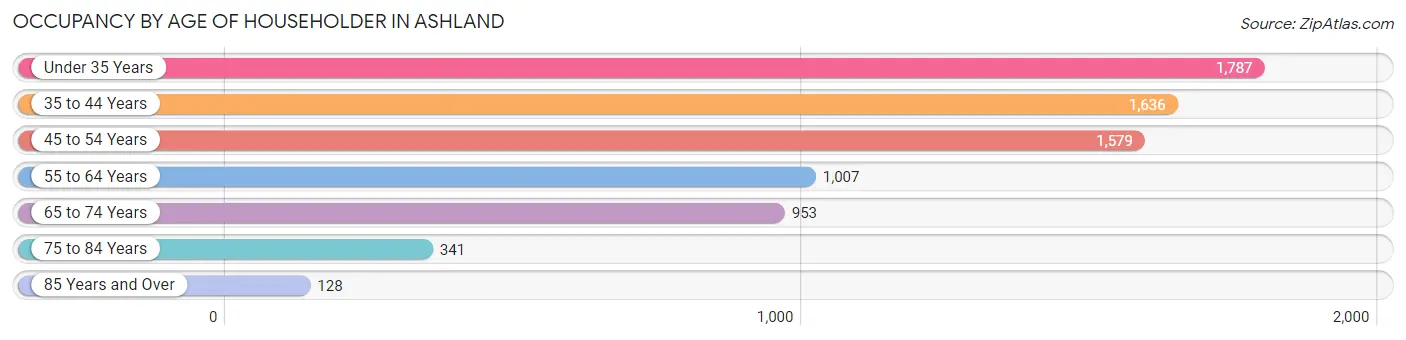
| Age Bracket | # Households | % Households |
| Under 35 Years | 1,787 | 24.0% |
| 35 to 44 Years | 1,636 | 22.0% |
| 45 to 54 Years | 1,579 | 21.2% |
| 55 to 64 Years | 1,007 | 13.6% |
| 65 to 74 Years | 953 | 12.8% |
| 75 to 84 Years | 341 | 4.6% |
| 85 Years and Over | 128 | 1.7% |
| Total | 7,431 | 100.0% |
Housing Finances in Ashland
Median Income by Occupancy in Ashland
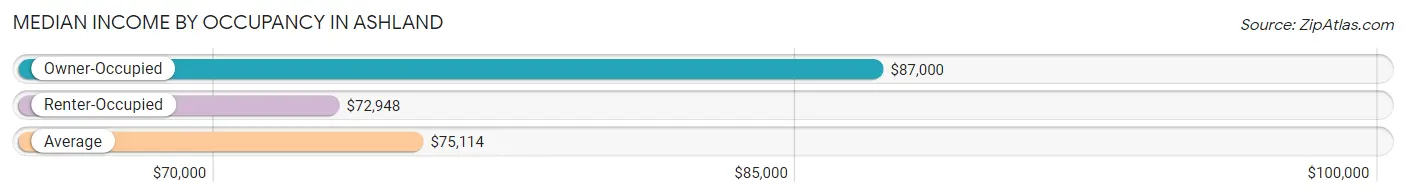
| Occupancy Type | # Households | Median Income |
| Owner-Occupied | 2,832 (38.1%) | $87,000 |
| Renter-Occupied | 4,599 (61.9%) | $72,948 |
| Average | 7,431 (100.0%) | $75,114 |
Occupancy by Householder Income Bracket in Ashland
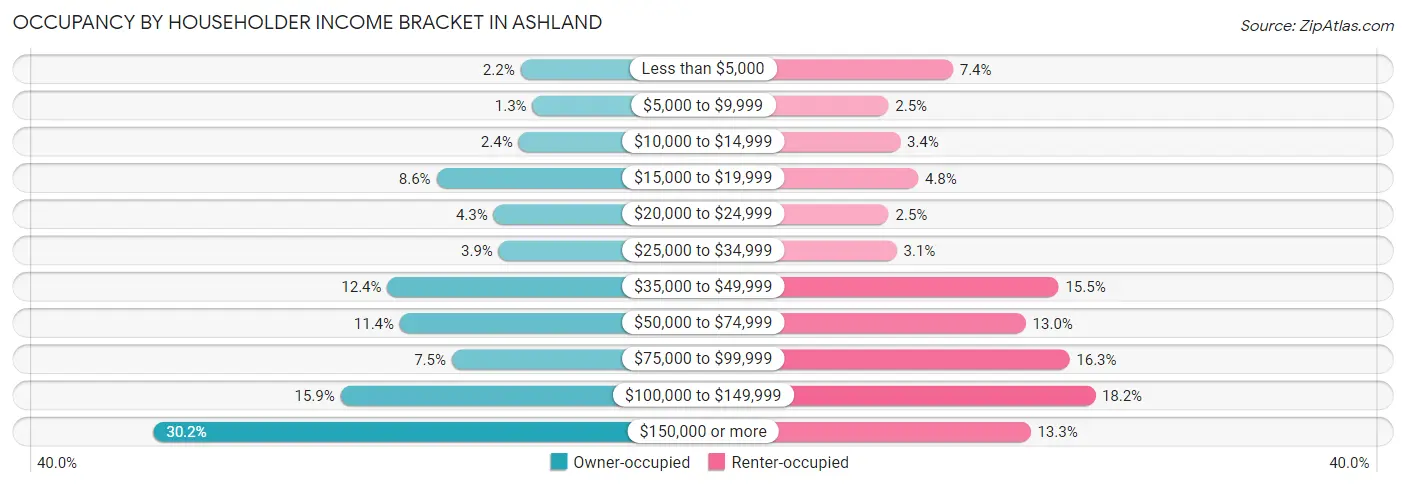
| Income Bracket | Owner-occupied | Renter-occupied |
| Less than $5,000 | 63 (2.2%) | 341 (7.4%) |
| $5,000 to $9,999 | 37 (1.3%) | 115 (2.5%) |
| $10,000 to $14,999 | 67 (2.4%) | 156 (3.4%) |
| $15,000 to $19,999 | 244 (8.6%) | 219 (4.8%) |
| $20,000 to $24,999 | 121 (4.3%) | 116 (2.5%) |
| $25,000 to $34,999 | 110 (3.9%) | 144 (3.1%) |
| $35,000 to $49,999 | 350 (12.4%) | 711 (15.5%) |
| $50,000 to $74,999 | 323 (11.4%) | 596 (13.0%) |
| $75,000 to $99,999 | 211 (7.4%) | 749 (16.3%) |
| $100,000 to $149,999 | 451 (15.9%) | 839 (18.2%) |
| $150,000 or more | 855 (30.2%) | 613 (13.3%) |
| Total | 2,832 (100.0%) | 4,599 (100.0%) |
Monthly Housing Cost Tiers in Ashland
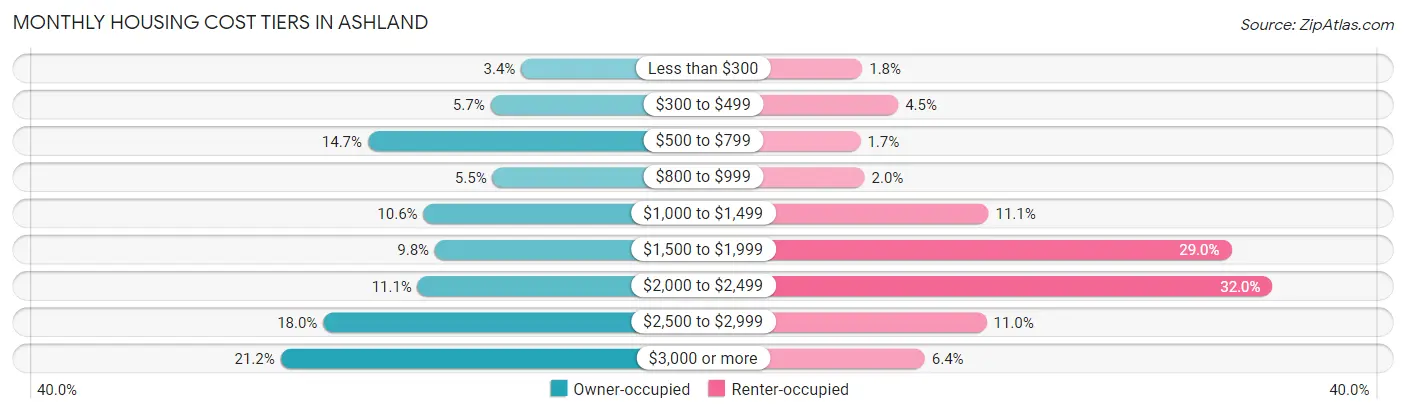
| Monthly Cost | Owner-occupied | Renter-occupied |
| Less than $300 | 97 (3.4%) | 84 (1.8%) |
| $300 to $499 | 161 (5.7%) | 206 (4.5%) |
| $500 to $799 | 417 (14.7%) | 78 (1.7%) |
| $800 to $999 | 157 (5.5%) | 92 (2.0%) |
| $1,000 to $1,499 | 301 (10.6%) | 512 (11.1%) |
| $1,500 to $1,999 | 277 (9.8%) | 1,334 (29.0%) |
| $2,000 to $2,499 | 313 (11.1%) | 1,473 (32.0%) |
| $2,500 to $2,999 | 510 (18.0%) | 505 (11.0%) |
| $3,000 or more | 599 (21.1%) | 296 (6.4%) |
| Total | 2,832 (100.0%) | 4,599 (100.0%) |
Physical Housing Characteristics in Ashland
Housing Structures in Ashland
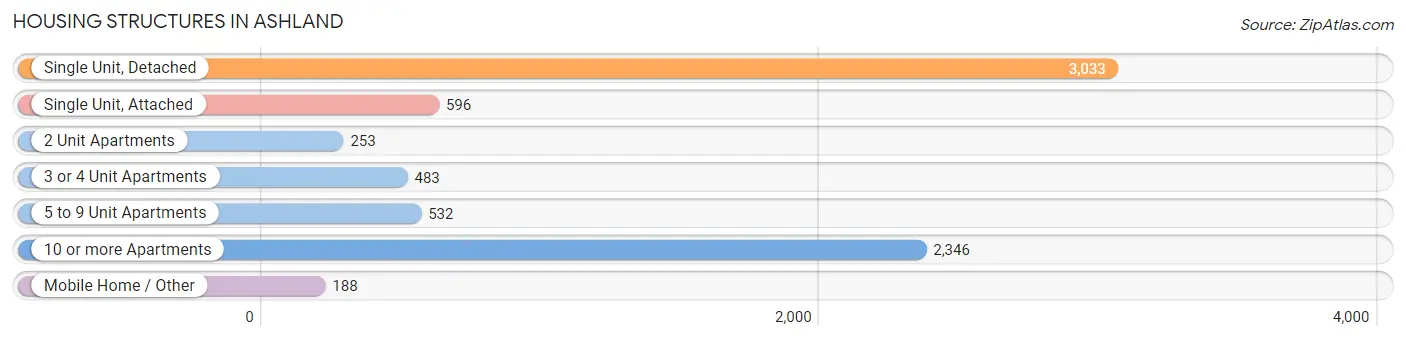
| Structure Type | # Housing Units | % Housing Units |
| Single Unit, Detached | 3,033 | 40.8% |
| Single Unit, Attached | 596 | 8.0% |
| 2 Unit Apartments | 253 | 3.4% |
| 3 or 4 Unit Apartments | 483 | 6.5% |
| 5 to 9 Unit Apartments | 532 | 7.2% |
| 10 or more Apartments | 2,346 | 31.6% |
| Mobile Home / Other | 188 | 2.5% |
| Total | 7,431 | 100.0% |
Housing Structures by Occupancy in Ashland
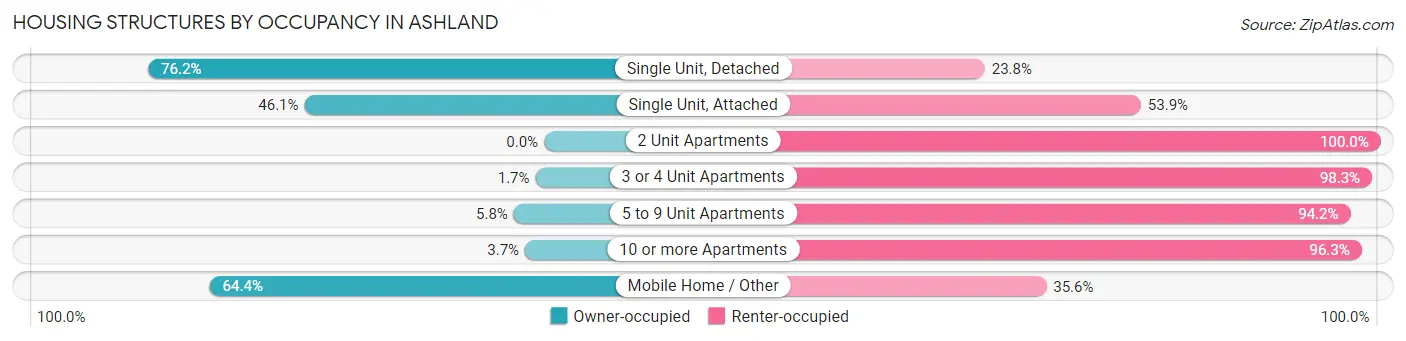
| Structure Type | Owner-occupied | Renter-occupied |
| Single Unit, Detached | 2,311 (76.2%) | 722 (23.8%) |
| Single Unit, Attached | 275 (46.1%) | 321 (53.9%) |
| 2 Unit Apartments | 0 (0.0%) | 253 (100.0%) |
| 3 or 4 Unit Apartments | 8 (1.7%) | 475 (98.3%) |
| 5 to 9 Unit Apartments | 31 (5.8%) | 501 (94.2%) |
| 10 or more Apartments | 86 (3.7%) | 2,260 (96.3%) |
| Mobile Home / Other | 121 (64.4%) | 67 (35.6%) |
| Total | 2,832 (38.1%) | 4,599 (61.9%) |
Housing Structures by Number of Rooms in Ashland
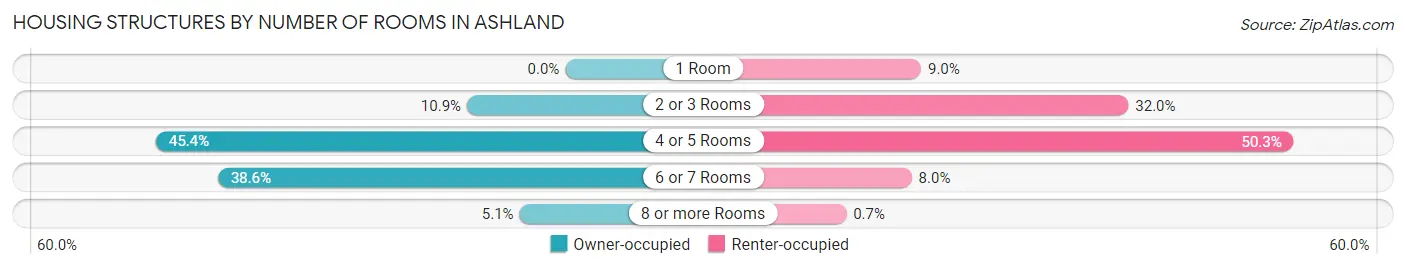
| Number of Rooms | Owner-occupied | Renter-occupied |
| 1 Room | 0 (0.0%) | 414 (9.0%) |
| 2 or 3 Rooms | 309 (10.9%) | 1,472 (32.0%) |
| 4 or 5 Rooms | 1,287 (45.4%) | 2,315 (50.3%) |
| 6 or 7 Rooms | 1,092 (38.6%) | 366 (8.0%) |
| 8 or more Rooms | 144 (5.1%) | 32 (0.7%) |
| Total | 2,832 (100.0%) | 4,599 (100.0%) |
Housing Structure by Heating Type in Ashland

| Heating Type | Owner-occupied | Renter-occupied |
| Utility Gas | 2,150 (75.9%) | 2,107 (45.8%) |
| Bottled, Tank, or LP Gas | 54 (1.9%) | 202 (4.4%) |
| Electricity | 587 (20.7%) | 2,026 (44.1%) |
| Fuel Oil or Kerosene | 0 (0.0%) | 0 (0.0%) |
| Coal or Coke | 0 (0.0%) | 0 (0.0%) |
| All other Fuels | 0 (0.0%) | 0 (0.0%) |
| No Fuel Used | 41 (1.5%) | 264 (5.7%) |
| Total | 2,832 (100.0%) | 4,599 (100.0%) |
Household Vehicle Usage in Ashland
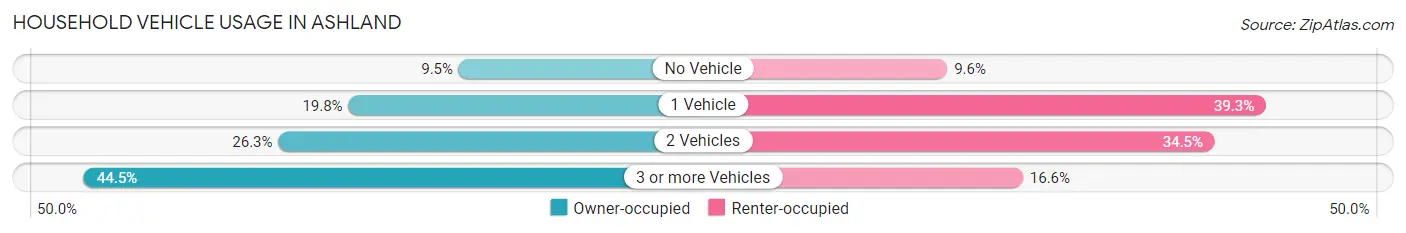
| Vehicles per Household | Owner-occupied | Renter-occupied |
| No Vehicle | 268 (9.5%) | 439 (9.6%) |
| 1 Vehicle | 560 (19.8%) | 1,808 (39.3%) |
| 2 Vehicles | 745 (26.3%) | 1,588 (34.5%) |
| 3 or more Vehicles | 1,259 (44.5%) | 764 (16.6%) |
| Total | 2,832 (100.0%) | 4,599 (100.0%) |
Real Estate & Mortgages in Ashland
Real Estate and Mortgage Overview in Ashland
| Characteristic | Without Mortgage | With Mortgage |
| Housing Units | 981 | 1,851 |
| Median Property Value | $654,200 | $678,900 |
| Median Household Income | $81,123 | $594 |
| Monthly Housing Costs | $690 | $599 |
| Real Estate Taxes | $4,448 | $19 |
Property Value by Mortgage Status in Ashland
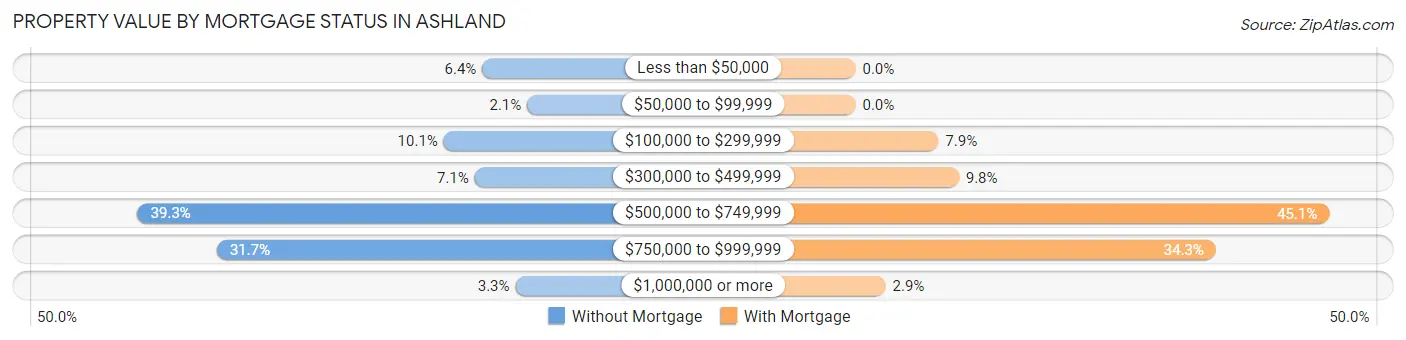
| Property Value | Without Mortgage | With Mortgage |
| Less than $50,000 | 63 (6.4%) | 0 (0.0%) |
| $50,000 to $99,999 | 21 (2.1%) | 0 (0.0%) |
| $100,000 to $299,999 | 99 (10.1%) | 146 (7.9%) |
| $300,000 to $499,999 | 70 (7.1%) | 182 (9.8%) |
| $500,000 to $749,999 | 385 (39.3%) | 835 (45.1%) |
| $750,000 to $999,999 | 311 (31.7%) | 635 (34.3%) |
| $1,000,000 or more | 32 (3.3%) | 53 (2.9%) |
| Total | 981 (100.0%) | 1,851 (100.0%) |
Household Income by Mortgage Status in Ashland
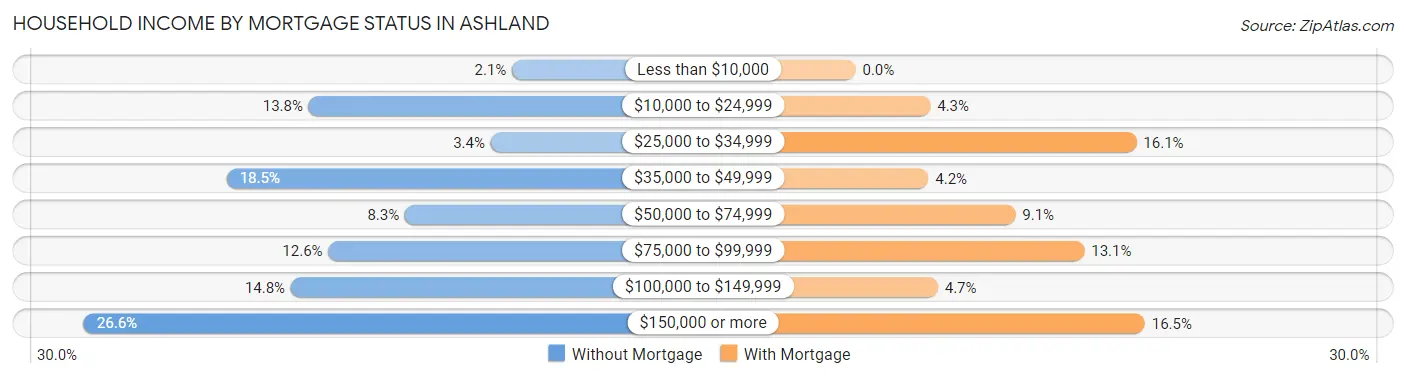
| Household Income | Without Mortgage | With Mortgage |
| Less than $10,000 | 21 (2.1%) | 0 (0.0%) |
| $10,000 to $24,999 | 135 (13.8%) | 79 (4.3%) |
| $25,000 to $34,999 | 33 (3.4%) | 297 (16.1%) |
| $35,000 to $49,999 | 181 (18.4%) | 77 (4.2%) |
| $50,000 to $74,999 | 81 (8.3%) | 169 (9.1%) |
| $75,000 to $99,999 | 124 (12.6%) | 242 (13.1%) |
| $100,000 to $149,999 | 145 (14.8%) | 87 (4.7%) |
| $150,000 or more | 261 (26.6%) | 306 (16.5%) |
| Total | 981 (100.0%) | 1,851 (100.0%) |
Property Value to Household Income Ratio in Ashland
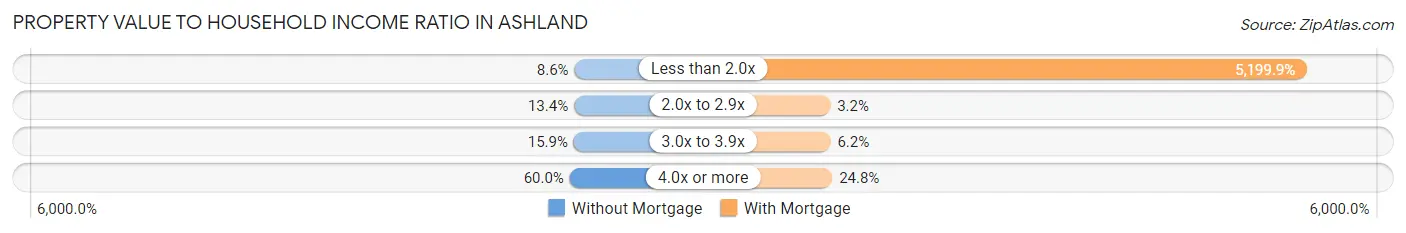
| Value-to-Income Ratio | Without Mortgage | With Mortgage |
| Less than 2.0x | 84 (8.6%) | 96,250 (5,199.9%) |
| 2.0x to 2.9x | 131 (13.4%) | 59 (3.2%) |
| 3.0x to 3.9x | 156 (15.9%) | 114 (6.2%) |
| 4.0x or more | 589 (60.0%) | 459 (24.8%) |
| Total | 981 (100.0%) | 1,851 (100.0%) |
Real Estate Taxes by Mortgage Status in Ashland
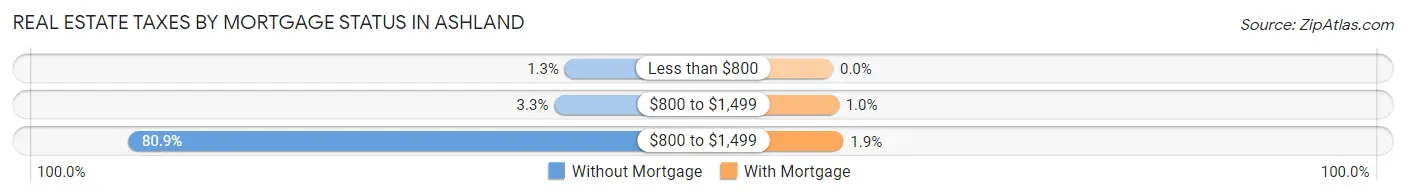
| Property Taxes | Without Mortgage | With Mortgage |
| Less than $800 | 13 (1.3%) | 0 (0.0%) |
| $800 to $1,499 | 32 (3.3%) | 19 (1.0%) |
| $800 to $1,499 | 794 (80.9%) | 35 (1.9%) |
| Total | 981 (100.0%) | 1,851 (100.0%) |
Health & Disability in Ashland
Health Insurance Coverage by Age in Ashland
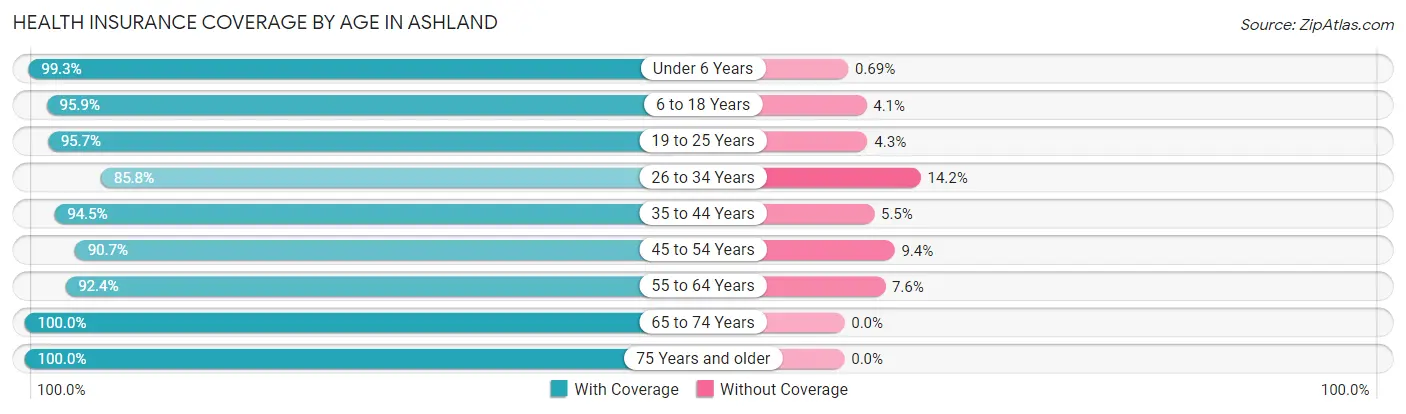
| Age Bracket | With Coverage | Without Coverage |
| Under 6 Years | 2,169 (99.3%) | 15 (0.7%) |
| 6 to 18 Years | 3,442 (95.9%) | 147 (4.1%) |
| 19 to 25 Years | 1,533 (95.7%) | 69 (4.3%) |
| 26 to 34 Years | 3,118 (85.8%) | 517 (14.2%) |
| 35 to 44 Years | 3,408 (94.5%) | 200 (5.5%) |
| 45 to 54 Years | 3,228 (90.6%) | 333 (9.3%) |
| 55 to 64 Years | 2,037 (92.4%) | 167 (7.6%) |
| 65 to 74 Years | 1,570 (100.0%) | 0 (0.0%) |
| 75 Years and older | 1,091 (100.0%) | 0 (0.0%) |
| Total | 21,596 (93.7%) | 1,448 (6.3%) |
Health Insurance Coverage by Citizenship Status in Ashland
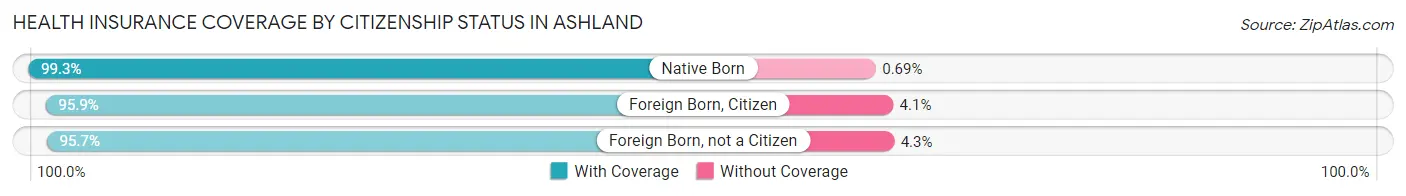
| Citizenship Status | With Coverage | Without Coverage |
| Native Born | 2,169 (99.3%) | 15 (0.7%) |
| Foreign Born, Citizen | 3,442 (95.9%) | 147 (4.1%) |
| Foreign Born, not a Citizen | 1,533 (95.7%) | 69 (4.3%) |
Health Insurance Coverage by Household Income in Ashland
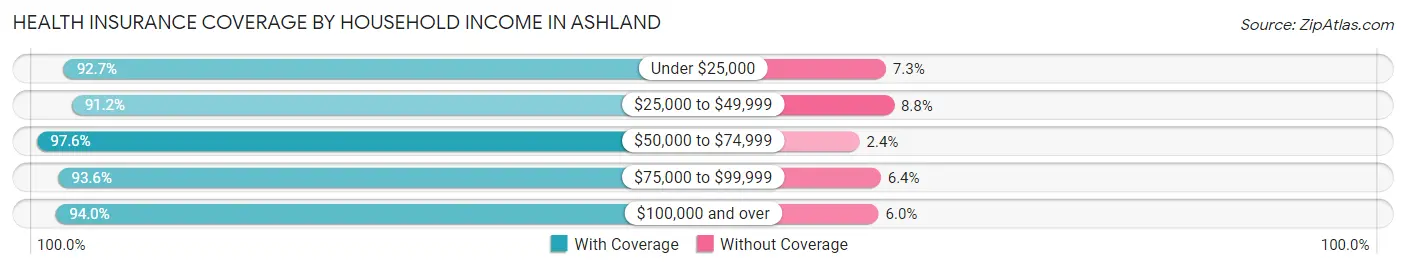
| Household Income | With Coverage | Without Coverage |
| Under $25,000 | 2,934 (92.7%) | 232 (7.3%) |
| $25,000 to $49,999 | 3,499 (91.2%) | 339 (8.8%) |
| $50,000 to $74,999 | 2,484 (97.6%) | 61 (2.4%) |
| $75,000 to $99,999 | 2,791 (93.6%) | 190 (6.4%) |
| $100,000 and over | 9,747 (94.0%) | 618 (6.0%) |
Public vs Private Health Insurance Coverage by Age in Ashland
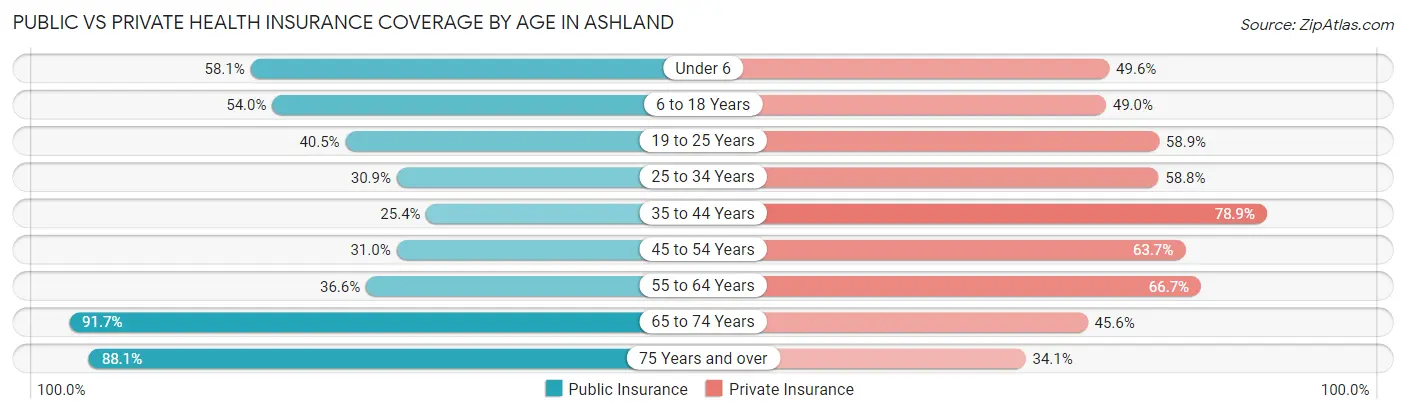
| Age Bracket | Public Insurance | Private Insurance |
| Under 6 | 1,268 (58.1%) | 1,084 (49.6%) |
| 6 to 18 Years | 1,939 (54.0%) | 1,759 (49.0%) |
| 19 to 25 Years | 648 (40.5%) | 943 (58.9%) |
| 25 to 34 Years | 1,124 (30.9%) | 2,136 (58.8%) |
| 35 to 44 Years | 917 (25.4%) | 2,846 (78.9%) |
| 45 to 54 Years | 1,103 (31.0%) | 2,269 (63.7%) |
| 55 to 64 Years | 807 (36.6%) | 1,469 (66.6%) |
| 65 to 74 Years | 1,440 (91.7%) | 716 (45.6%) |
| 75 Years and over | 961 (88.1%) | 372 (34.1%) |
| Total | 10,207 (44.3%) | 13,594 (59.0%) |
Disability Status by Sex by Age in Ashland
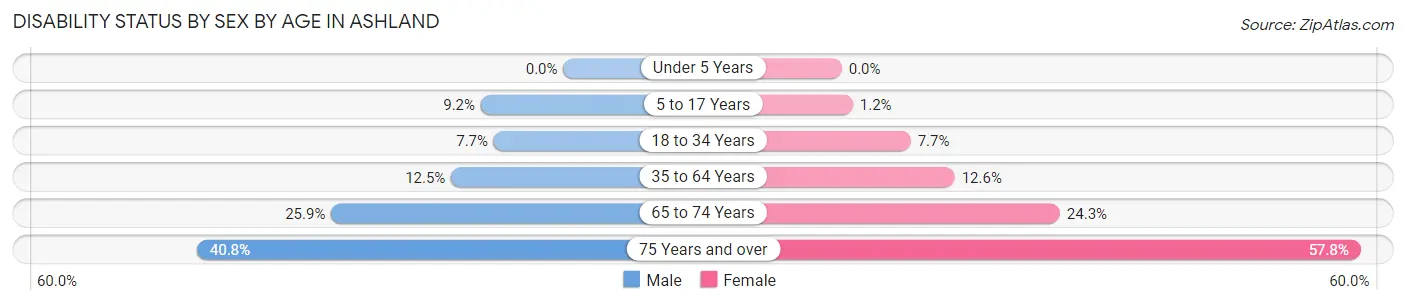
| Age Bracket | Male | Female |
| Under 5 Years | 0 (0.0%) | 0 (0.0%) |
| 5 to 17 Years | 131 (9.2%) | 25 (1.2%) |
| 18 to 34 Years | 235 (7.7%) | 213 (7.7%) |
| 35 to 64 Years | 557 (12.5%) | 618 (12.6%) |
| 65 to 74 Years | 159 (25.9%) | 232 (24.3%) |
| 75 Years and over | 131 (40.8%) | 445 (57.8%) |
Disability Class by Sex by Age in Ashland
Disability Class: Hearing Difficulty
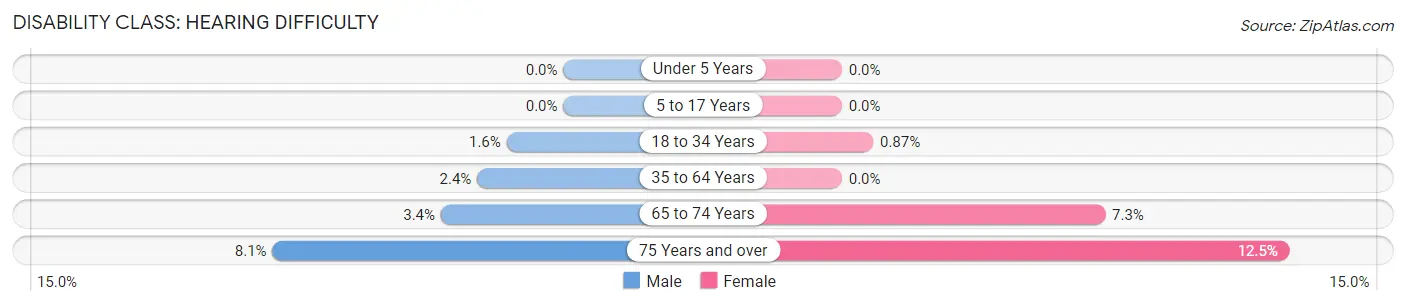
| Age Bracket | Male | Female |
| Under 5 Years | 0 (0.0%) | 0 (0.0%) |
| 5 to 17 Years | 0 (0.0%) | 0 (0.0%) |
| 18 to 34 Years | 48 (1.6%) | 24 (0.9%) |
| 35 to 64 Years | 107 (2.4%) | 0 (0.0%) |
| 65 to 74 Years | 21 (3.4%) | 70 (7.3%) |
| 75 Years and over | 26 (8.1%) | 96 (12.5%) |
Disability Class: Vision Difficulty
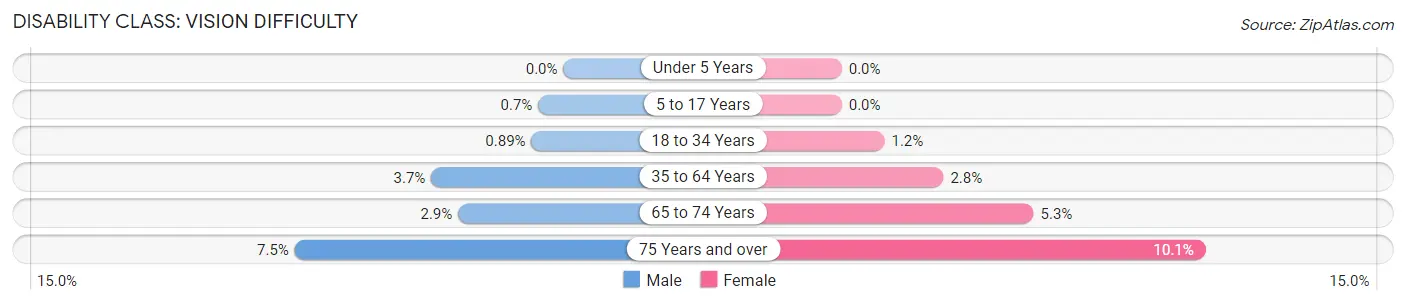
| Age Bracket | Male | Female |
| Under 5 Years | 0 (0.0%) | 0 (0.0%) |
| 5 to 17 Years | 10 (0.7%) | 0 (0.0%) |
| 18 to 34 Years | 27 (0.9%) | 33 (1.2%) |
| 35 to 64 Years | 164 (3.7%) | 139 (2.8%) |
| 65 to 74 Years | 18 (2.9%) | 51 (5.3%) |
| 75 Years and over | 24 (7.5%) | 78 (10.1%) |
Disability Class: Cognitive Difficulty
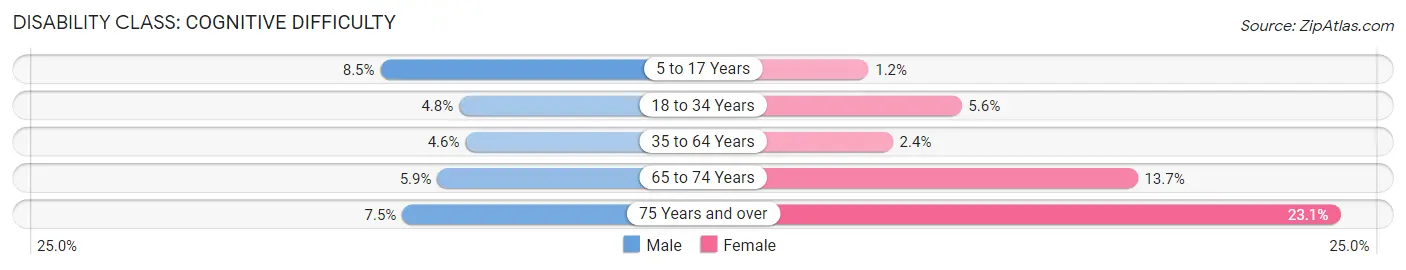
| Age Bracket | Male | Female |
| 5 to 17 Years | 121 (8.5%) | 25 (1.2%) |
| 18 to 34 Years | 147 (4.8%) | 154 (5.6%) |
| 35 to 64 Years | 203 (4.5%) | 116 (2.4%) |
| 65 to 74 Years | 36 (5.9%) | 131 (13.7%) |
| 75 Years and over | 24 (7.5%) | 178 (23.1%) |
Disability Class: Ambulatory Difficulty
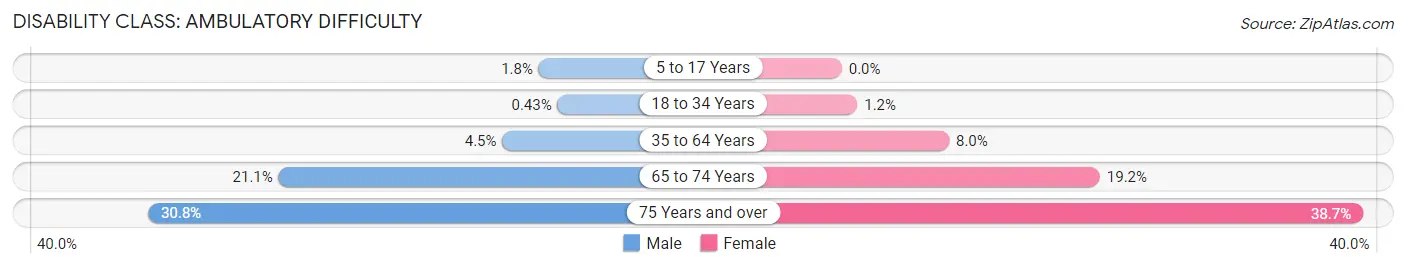
| Age Bracket | Male | Female |
| 5 to 17 Years | 26 (1.8%) | 0 (0.0%) |
| 18 to 34 Years | 13 (0.4%) | 32 (1.1%) |
| 35 to 64 Years | 202 (4.5%) | 391 (8.0%) |
| 65 to 74 Years | 130 (21.1%) | 183 (19.2%) |
| 75 Years and over | 99 (30.8%) | 298 (38.7%) |
Disability Class: Self-Care Difficulty
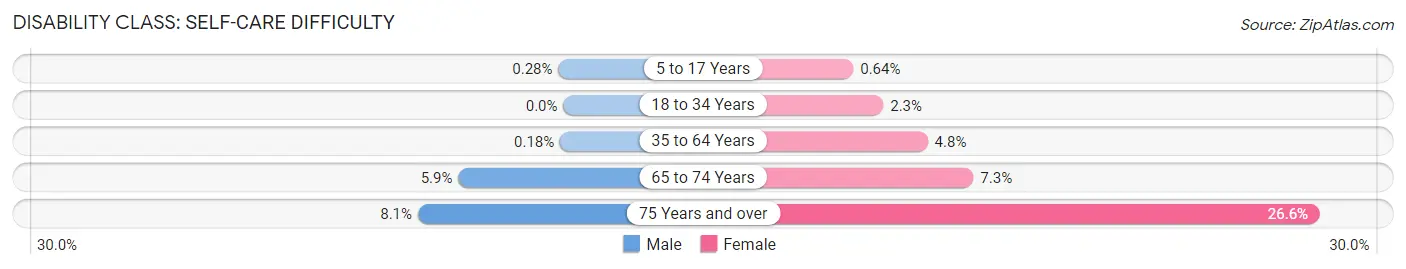
| Age Bracket | Male | Female |
| 5 to 17 Years | 4 (0.3%) | 13 (0.6%) |
| 18 to 34 Years | 0 (0.0%) | 64 (2.3%) |
| 35 to 64 Years | 8 (0.2%) | 235 (4.8%) |
| 65 to 74 Years | 36 (5.9%) | 70 (7.3%) |
| 75 Years and over | 26 (8.1%) | 205 (26.6%) |
Technology Access in Ashland
Computing Device Access in Ashland
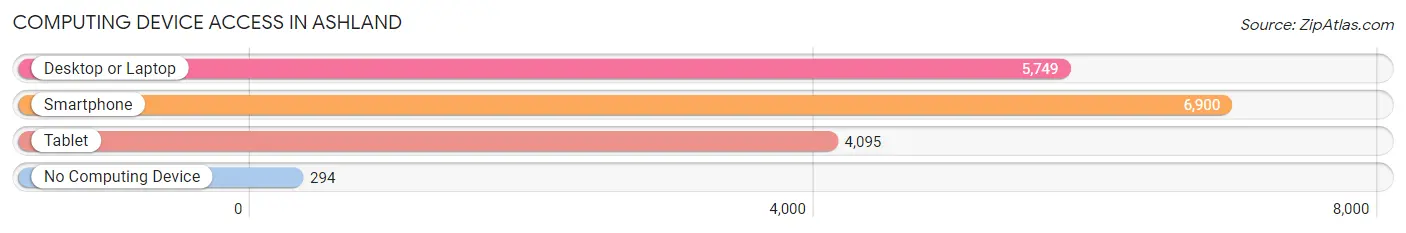
| Device Type | # Households | % Households |
| Desktop or Laptop | 5,749 | 77.4% |
| Smartphone | 6,900 | 92.8% |
| Tablet | 4,095 | 55.1% |
| No Computing Device | 294 | 4.0% |
| Total | 7,431 | 100.0% |
Internet Access in Ashland
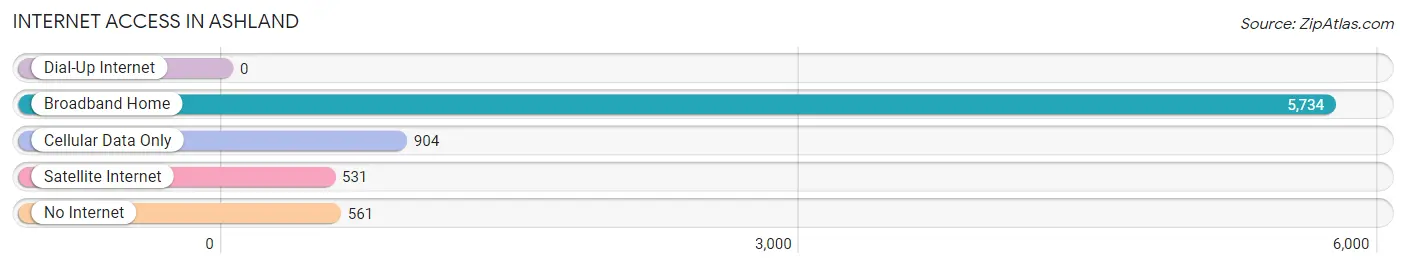
| Internet Type | # Households | % Households |
| Dial-Up Internet | 0 | 0.0% |
| Broadband Home | 5,734 | 77.2% |
| Cellular Data Only | 904 | 12.2% |
| Satellite Internet | 531 | 7.1% |
| No Internet | 561 | 7.5% |
| Total | 7,431 | 100.0% |
Ashland Summary
Ashland is a small city located in Alameda County, California, United States. It is situated in the San Francisco Bay Area, about 10 miles south of Oakland and 25 miles north of San Jose. The city has a population of approximately 20,000 people and is part of the larger Oakland-Hayward-Berkeley metropolitan area.
History
The area that is now Ashland was originally inhabited by the Ohlone people, who were the first inhabitants of the San Francisco Bay Area. The Ohlone were hunter-gatherers who lived in small villages and subsisted on the abundant natural resources of the area.
In the late 1800s, the area was settled by European immigrants, primarily from Germany and Italy. The first settlers were farmers who grew grapes, olives, and other crops. The area was known as “Ashland” after the ash trees that grew in the area.
In the early 1900s, the area began to develop as a residential community. The first post office was established in 1910 and the first school was built in 1912. The city was officially incorporated in 1915.
Geography
Ashland is located in the San Francisco Bay Area, about 10 miles south of Oakland and 25 miles north of San Jose. The city is situated in the San Francisco Bay Estuary, which is a large body of water that connects the San Francisco Bay to the Pacific Ocean.
The city is bordered by the cities of San Leandro to the north, Hayward to the east, and Union City to the south. The city is also bordered by the San Francisco Bay to the west.
The city has a total area of 4.2 square miles, of which 0.2 square miles is water. The city is located at an elevation of about 50 feet above sea level.
Economy
The economy of Ashland is largely based on the service industry. The city is home to a number of retail stores, restaurants, and other businesses. The city is also home to a number of corporate offices, including those of the Oakland A’s baseball team and the Oakland Raiders football team.
The city is also home to a number of manufacturing companies, including a number of food processing plants. The city is also home to a number of technology companies, including a number of software development firms.
Demographics
As of the 2010 census, the population of Ashland was 20,073. The racial makeup of the city was 57.3% White, 16.2% African American, 0.7% Native American, 16.2% Asian, 0.2% Pacific Islander, and 8.4% from other races. Hispanic or Latino of any race were 18.3% of the population.
The median household income in Ashland was $60,945, and the median family income was $68,945. The per capita income in the city was $27,845. About 11.2% of the population was below the poverty line.
Conclusion
Ashland is a small city located in Alameda County, California, United States. It is situated in the San Francisco Bay Area, about 10 miles south of Oakland and 25 miles north of San Jose. The city has a population of approximately 20,000 people and is part of the larger Oakland-Hayward-Berkeley metropolitan area. The area was originally inhabited by the Ohlone people and was later settled by European immigrants in the late 1800s. The economy of Ashland is largely based on the service industry, and the city is home to a number of retail stores, restaurants, and other businesses. The racial makeup of the city is 57.3% White, 16.2% African American, 0.7% Native American, 16.2% Asian, 0.2% Pacific Islander, and 8.4% from other races. The median household income in Ashland was $60,945, and the median family income was $68,945.
Common Questions
What is Per Capita Income in Ashland?
Per Capita income in Ashland is $32,463.
What is the Median Family Income in Ashland?
Median Family Income in Ashland is $78,520.
What is the Median Household income in Ashland?
Median Household Income in Ashland is $75,114.
What is Income or Wage Gap in Ashland?
Income or Wage Gap in Ashland is 29.6%.
Women in Ashland earn 70.4 cents for every dollar earned by a man.
What is Family Income Deficit in Ashland?
Family Income Deficit in Ashland is $11,643.
Families that are below poverty line in Ashland earn $11,643 less on average than the poverty threshold level.
What is Inequality or Gini Index in Ashland?
Inequality or Gini Index in Ashland is 0.45.
What is the Total Population of Ashland?
Total Population of Ashland is 23,164.
What is the Total Male Population of Ashland?
Total Male Population of Ashland is 10,806.
What is the Total Female Population of Ashland?
Total Female Population of Ashland is 12,358.
What is the Ratio of Males per 100 Females in Ashland?
There are 87.44 Males per 100 Females in Ashland.
What is the Ratio of Females per 100 Males in Ashland?
There are 114.36 Females per 100 Males in Ashland.
What is the Median Population Age in Ashland?
Median Population Age in Ashland is 36.2 Years.
What is the Average Family Size in Ashland
Average Family Size in Ashland is 3.5 People.
What is the Average Household Size in Ashland
Average Household Size in Ashland is 3.1 People.
How Large is the Labor Force in Ashland?
There are 12,192 People in the Labor Forcein in Ashland.
What is the Percentage of People in the Labor Force in Ashland?
66.0% of People are in the Labor Force in Ashland.
What is the Unemployment Rate in Ashland?
Unemployment Rate in Ashland is 6.8%.