Cities with the Highest Percentage of Black / African American Population in Oregon
RELATED REPORTS & OPTIONS
Black / African American
Oregon
Compare Cities
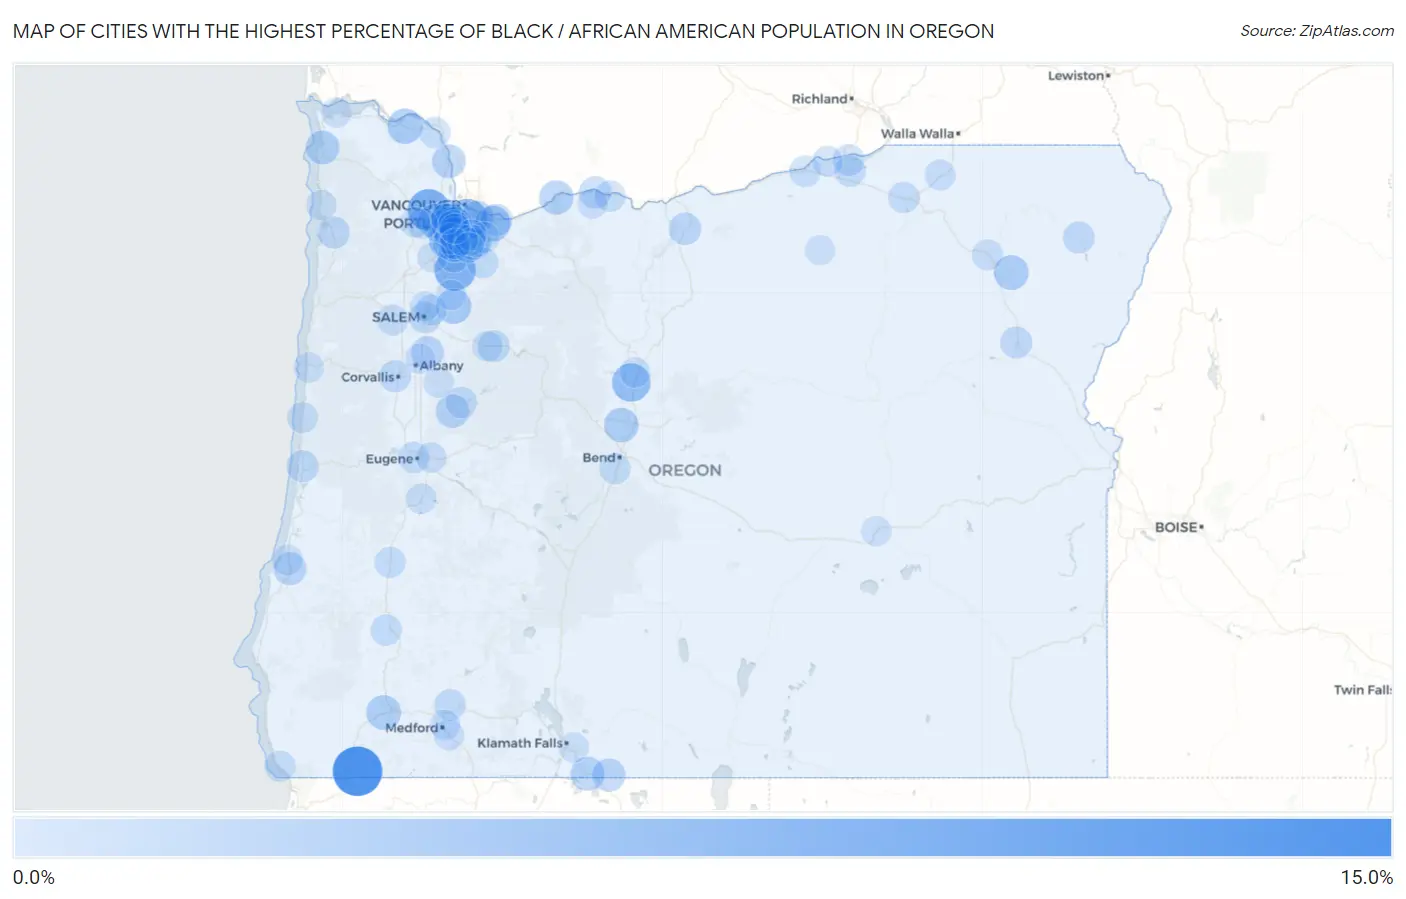
Map of Cities with the Highest Percentage of Black / African American Population in Oregon
0.0%
15.0%
Cities with the Highest Percentage of Black / African American Population in Oregon
| City | Black / African American | vs State | vs National | |
| 1. | Takilma | 11.1% | 1.9%(+9.18)#1 | 12.5%(-1.41)#5,003 |
| 2. | North Plains | 6.9% | 1.9%(+5.04)#2 | 12.5%(-5.55)#6,544 |
| 3. | Aurora | 6.6% | 1.9%(+4.75)#3 | 12.5%(-5.84)#6,699 |
| 4. | Portland | 5.9% | 1.9%(+4.00)#4 | 12.5%(-6.59)#7,132 |
| 5. | Culver | 5.1% | 1.9%(+3.23)#5 | 12.5%(-7.36)#7,638 |
| 6. | Bull Mountain | 4.3% | 1.9%(+2.40)#6 | 12.5%(-8.19)#8,302 |
| 7. | Cedar Hills | 3.9% | 1.9%(+2.01)#7 | 12.5%(-8.58)#8,673 |
| 8. | Gresham | 3.7% | 1.9%(+1.81)#8 | 12.5%(-8.78)#8,870 |
| 9. | Aloha | 3.4% | 1.9%(+1.56)#9 | 12.5%(-9.03)#9,142 |
| 10. | Silverton | 3.4% | 1.9%(+1.50)#10 | 12.5%(-9.09)#9,203 |
| 11. | Clatskanie | 3.3% | 1.9%(+1.46)#11 | 12.5%(-9.13)#9,264 |
| 12. | Marlene | 3.3% | 1.9%(+1.39)#12 | 12.5%(-9.20)#9,348 |
| 13. | Union | 3.1% | 1.9%(+1.20)#13 | 12.5%(-9.39)#9,578 |
| 14. | Redwood | 3.1% | 1.9%(+1.17)#14 | 12.5%(-9.42)#9,616 |
| 15. | Hillsboro | 3.0% | 1.9%(+1.15)#15 | 12.5%(-9.44)#9,648 |
| 16. | Eagle Crest | 3.0% | 1.9%(+1.08)#16 | 12.5%(-9.51)#9,742 |
| 17. | King City | 2.9% | 1.9%(+1.04)#17 | 12.5%(-9.55)#9,781 |
| 18. | Cascade Locks | 2.8% | 1.9%(+0.939)#18 | 12.5%(-9.65)#9,920 |
| 19. | Merrill | 2.7% | 1.9%(+0.770)#19 | 12.5%(-9.82)#10,160 |
| 20. | Beaverton | 2.6% | 1.9%(+0.738)#20 | 12.5%(-9.85)#10,207 |
| 21. | Seaside | 2.6% | 1.9%(+0.736)#21 | 12.5%(-9.85)#10,210 |
| 22. | Cedar Mill | 2.6% | 1.9%(+0.703)#22 | 12.5%(-9.89)#10,268 |
| 23. | Rivergrove | 2.5% | 1.9%(+0.627)#23 | 12.5%(-9.96)#10,378 |
| 24. | West Haven Sylvan | 2.5% | 1.9%(+0.625)#24 | 12.5%(-9.96)#10,380 |
| 25. | Columbia City | 2.5% | 1.9%(+0.600)#25 | 12.5%(-9.99)#10,420 |
| 26. | Bethany | 2.4% | 1.9%(+0.513)#26 | 12.5%(-10.1)#10,557 |
| 27. | Holley | 2.4% | 1.9%(+0.499)#27 | 12.5%(-10.1)#10,576 |
| 28. | Maywood Park | 2.3% | 1.9%(+0.419)#28 | 12.5%(-10.2)#10,722 |
| 29. | Malin | 2.3% | 1.9%(+0.388)#29 | 12.5%(-10.2)#10,782 |
| 30. | Metzger | 2.3% | 1.9%(+0.382)#30 | 12.5%(-10.2)#10,792 |
| 31. | Bunker Hill | 2.1% | 1.9%(+0.258)#31 | 12.5%(-10.3)#10,999 |
| 32. | Jefferson | 2.1% | 1.9%(+0.224)#32 | 12.5%(-10.4)#11,055 |
| 33. | Moro | 1.9% | 1.9%(+0.036)#33 | 12.5%(-10.6)#11,433 |
| 34. | Gladstone | 1.9% | 1.9%(+0.019)#34 | 12.5%(-10.6)#11,468 |
| 35. | Troutdale | 1.8% | 1.9%(-0.043)#35 | 12.5%(-10.6)#11,583 |
| 36. | Wilsonville | 1.8% | 1.9%(-0.054)#36 | 12.5%(-10.6)#11,602 |
| 37. | West Slope | 1.8% | 1.9%(-0.096)#37 | 12.5%(-10.7)#11,692 |
| 38. | Tillamook | 1.8% | 1.9%(-0.118)#38 | 12.5%(-10.7)#11,741 |
| 39. | Hood River | 1.7% | 1.9%(-0.133)#39 | 12.5%(-10.7)#11,777 |
| 40. | Corvallis | 1.7% | 1.9%(-0.188)#40 | 12.5%(-10.8)#11,909 |
| 41. | Baker City | 1.7% | 1.9%(-0.200)#41 | 12.5%(-10.8)#11,943 |
| 42. | River Road | 1.7% | 1.9%(-0.222)#42 | 12.5%(-10.8)#12,005 |
| 43. | Florence | 1.6% | 1.9%(-0.251)#43 | 12.5%(-10.8)#12,079 |
| 44. | Enterprise | 1.6% | 1.9%(-0.270)#44 | 12.5%(-10.9)#12,134 |
| 45. | Jennings Lodge | 1.6% | 1.9%(-0.290)#45 | 12.5%(-10.9)#12,183 |
| 46. | Gates | 1.6% | 1.9%(-0.330)#46 | 12.5%(-10.9)#12,273 |
| 47. | Salem | 1.5% | 1.9%(-0.345)#47 | 12.5%(-10.9)#12,318 |
| 48. | Eugene | 1.5% | 1.9%(-0.381)#48 | 12.5%(-11.0)#12,415 |
| 49. | Eagle Point | 1.5% | 1.9%(-0.382)#49 | 12.5%(-11.0)#12,418 |
| 50. | Tualatin | 1.5% | 1.9%(-0.393)#50 | 12.5%(-11.0)#12,437 |
| 51. | Sweet Home | 1.5% | 1.9%(-0.420)#51 | 12.5%(-11.0)#12,501 |
| 52. | Umatilla | 1.4% | 1.9%(-0.483)#52 | 12.5%(-11.1)#12,657 |
| 53. | Johnson City | 1.4% | 1.9%(-0.487)#53 | 12.5%(-11.1)#12,671 |
| 54. | Deschutes River Woods | 1.3% | 1.9%(-0.541)#54 | 12.5%(-11.1)#12,792 |
| 55. | Boardman | 1.3% | 1.9%(-0.550)#55 | 12.5%(-11.1)#12,811 |
| 56. | Happy Valley | 1.3% | 1.9%(-0.557)#56 | 12.5%(-11.1)#12,834 |
| 57. | Pendleton | 1.3% | 1.9%(-0.571)#57 | 12.5%(-11.2)#12,869 |
| 58. | Beavercreek | 1.3% | 1.9%(-0.580)#58 | 12.5%(-11.2)#12,897 |
| 59. | Riddle | 1.3% | 1.9%(-0.585)#59 | 12.5%(-11.2)#12,916 |
| 60. | Hayesville | 1.3% | 1.9%(-0.599)#60 | 12.5%(-11.2)#12,955 |
| 61. | Dallas | 1.3% | 1.9%(-0.601)#61 | 12.5%(-11.2)#12,961 |
| 62. | Brookings | 1.3% | 1.9%(-0.602)#62 | 12.5%(-11.2)#12,962 |
| 63. | Tigard | 1.3% | 1.9%(-0.606)#63 | 12.5%(-11.2)#12,975 |
| 64. | Hermiston | 1.3% | 1.9%(-0.610)#64 | 12.5%(-11.2)#12,990 |
| 65. | Mosier | 1.3% | 1.9%(-0.612)#65 | 12.5%(-11.2)#12,995 |
| 66. | Oak Grove | 1.3% | 1.9%(-0.616)#66 | 12.5%(-11.2)#13,006 |
| 67. | Sutherlin | 1.3% | 1.9%(-0.625)#67 | 12.5%(-11.2)#13,038 |
| 68. | Rainier | 1.2% | 1.9%(-0.638)#68 | 12.5%(-11.2)#13,087 |
| 69. | Milwaukie | 1.2% | 1.9%(-0.655)#69 | 12.5%(-11.2)#13,138 |
| 70. | Lake Oswego | 1.2% | 1.9%(-0.703)#70 | 12.5%(-11.3)#13,267 |
| 71. | La Grande | 1.2% | 1.9%(-0.714)#71 | 12.5%(-11.3)#13,310 |
| 72. | Yachats | 1.2% | 1.9%(-0.716)#72 | 12.5%(-11.3)#13,319 |
| 73. | North Bend | 1.1% | 1.9%(-0.750)#73 | 12.5%(-11.3)#13,421 |
| 74. | Athena | 1.1% | 1.9%(-0.757)#74 | 12.5%(-11.3)#13,445 |
| 75. | Running Y Ranch | 1.1% | 1.9%(-0.800)#75 | 12.5%(-11.4)#13,598 |
| 76. | Irrigon | 1.1% | 1.9%(-0.812)#76 | 12.5%(-11.4)#13,633 |
| 77. | Cornelius | 1.0% | 1.9%(-0.840)#77 | 12.5%(-11.4)#13,736 |
| 78. | Oak Hills | 1.0% | 1.9%(-0.880)#78 | 12.5%(-11.5)#13,878 |
| 79. | Forest Grove | 0.98% | 1.9%(-0.903)#79 | 12.5%(-11.5)#13,955 |
| 80. | Durham | 0.97% | 1.9%(-0.914)#80 | 12.5%(-11.5)#13,993 |
| 81. | Mill City | 0.97% | 1.9%(-0.916)#81 | 12.5%(-11.5)#14,001 |
| 82. | Cottage Grove | 0.94% | 1.9%(-0.937)#82 | 12.5%(-11.5)#14,074 |
| 83. | Phoenix | 0.93% | 1.9%(-0.948)#83 | 12.5%(-11.5)#14,106 |
| 84. | Medford | 0.92% | 1.9%(-0.963)#84 | 12.5%(-11.6)#14,160 |
| 85. | Millersburg | 0.91% | 1.9%(-0.971)#85 | 12.5%(-11.6)#14,192 |
| 86. | Raleigh Hills | 0.91% | 1.9%(-0.976)#86 | 12.5%(-11.6)#14,214 |
| 87. | Newport | 0.90% | 1.9%(-0.981)#87 | 12.5%(-11.6)#14,233 |
| 88. | Lebanon | 0.87% | 1.9%(-1.01)#88 | 12.5%(-11.6)#14,334 |
| 89. | Metolius | 0.87% | 1.9%(-1.01)#89 | 12.5%(-11.6)#14,345 |
| 90. | Springfield | 0.86% | 1.9%(-1.02)#90 | 12.5%(-11.6)#14,358 |
| 91. | Rockaway Beach | 0.86% | 1.9%(-1.02)#91 | 12.5%(-11.6)#14,366 |
| 92. | West Linn | 0.84% | 1.9%(-1.04)#92 | 12.5%(-11.6)#14,446 |
| 93. | Burns | 0.84% | 1.9%(-1.04)#93 | 12.5%(-11.6)#14,451 |
| 94. | Odell | 0.83% | 1.9%(-1.05)#94 | 12.5%(-11.6)#14,489 |
| 95. | Altamont | 0.81% | 1.9%(-1.07)#95 | 12.5%(-11.7)#14,553 |
| 96. | Mount Angel | 0.79% | 1.9%(-1.09)#96 | 12.5%(-11.7)#14,629 |
| 97. | Newberg | 0.77% | 1.9%(-1.11)#97 | 12.5%(-11.7)#14,713 |
| 98. | Astoria | 0.77% | 1.9%(-1.12)#98 | 12.5%(-11.7)#14,736 |
| 99. | Keizer | 0.76% | 1.9%(-1.12)#99 | 12.5%(-11.7)#14,763 |
| 100. | Heppner | 0.76% | 1.9%(-1.12)#100 | 12.5%(-11.7)#14,764 |
Common Questions
What are the Top 10 Cities with the Highest Percentage of Black / African American Population in Oregon?
Top 10 Cities with the Highest Percentage of Black / African American Population in Oregon are:
#1
11.1%
#2
6.9%
#3
6.6%
#4
5.9%
#5
5.1%
#6
4.3%
#7
3.9%
#8
3.7%
#9
3.4%
#10
3.4%
What city has the Highest Percentage of Black / African American Population in Oregon?
Takilma has the Highest Percentage of Black / African American Population in Oregon with 11.1%.
What is the Percentage of Black / African American Population in the State of Oregon?
Percentage of Black / African American Population in Oregon is 1.9%.
What is the Percentage of Black / African American Population in the United States?
Percentage of Black / African American Population in the United States is 12.5%.