Antelope, CA Map & Demographics
Antelope Map
Antelope Overview
$35,080
PER CAPITA INCOME
$96,741
AVG FAMILY INCOME
$92,117
AVG HOUSEHOLD INCOME
29.0%
WAGE / INCOME GAP [ % ]
71.0¢/ $1
WAGE / INCOME GAP [ $ ]
$10,403
FAMILY INCOME DEFICIT
0.38
INEQUALITY / GINI INDEX
47,629
TOTAL POPULATION
23,221
MALE POPULATION
24,408
FEMALE POPULATION
95.14
MALES / 100 FEMALES
105.11
FEMALES / 100 MALES
35.7
MEDIAN AGE
3.5
AVG FAMILY SIZE
3.1
AVG HOUSEHOLD SIZE
23,501
LABOR FORCE [ PEOPLE ]
64.1%
PERCENT IN LABOR FORCE
6.8%
UNEMPLOYMENT RATE
Antelope Zip Codes
Antelope Area Codes
Income in Antelope
Income Overview in Antelope
Per Capita Income in Antelope is $35,080, while median incomes of families and households are $96,741 and $92,117 respectively.
| Characteristic | Number | Measure |
| Per Capita Income | 47,629 | $35,080 |
| Median Family Income | 11,867 | $96,741 |
| Mean Family Income | 11,867 | $112,029 |
| Median Household Income | 15,146 | $92,117 |
| Mean Household Income | 15,146 | $106,830 |
| Income Deficit | 11,867 | $10,403 |
| Wage / Income Gap (%) | 47,629 | 28.99% |
| Wage / Income Gap ($) | 47,629 | 71.01¢ per $1 |
| Gini / Inequality Index | 47,629 | 0.38 |
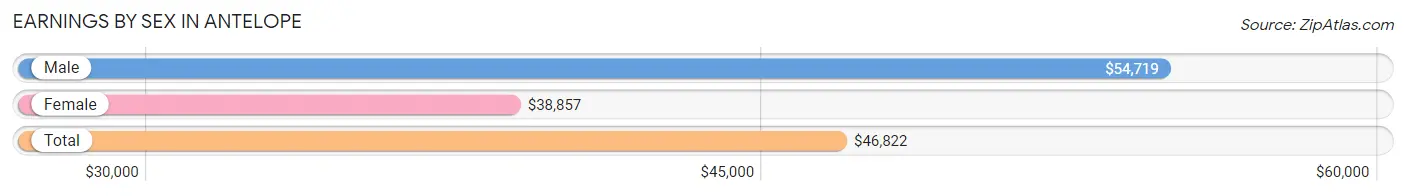
Earnings by Sex in Antelope
Average Earnings in Antelope are $46,822, $54,719 for men and $38,857 for women, a difference of 29.0%.
| Sex | Number | Average Earnings |
| Male | 12,546 (52.5%) | $54,719 |
| Female | 11,337 (47.5%) | $38,857 |
| Total | 23,883 (100.0%) | $46,822 |
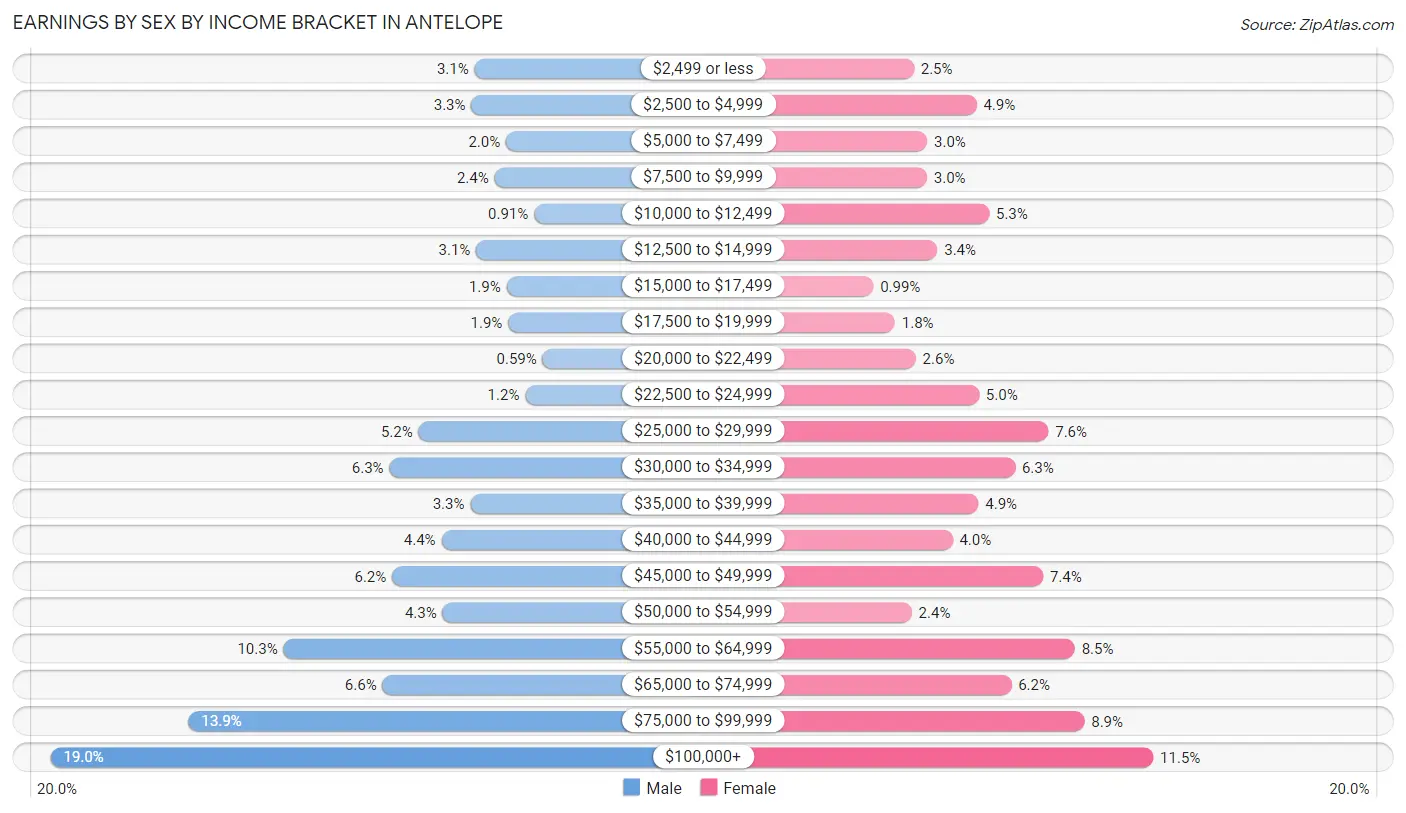
Earnings by Sex by Income Bracket in Antelope
The most common earnings brackets in Antelope are $100,000+ for men (2,387 | 19.0%) and $100,000+ for women (1,302 | 11.5%).
| Income | Male | Female |
| $2,499 or less | 394 (3.1%) | 284 (2.5%) |
| $2,500 to $4,999 | 409 (3.3%) | 551 (4.9%) |
| $5,000 to $7,499 | 246 (2.0%) | 341 (3.0%) |
| $7,500 to $9,999 | 300 (2.4%) | 340 (3.0%) |
| $10,000 to $12,499 | 114 (0.9%) | 604 (5.3%) |
| $12,500 to $14,999 | 387 (3.1%) | 384 (3.4%) |
| $15,000 to $17,499 | 243 (1.9%) | 112 (1.0%) |
| $17,500 to $19,999 | 236 (1.9%) | 204 (1.8%) |
| $20,000 to $22,499 | 74 (0.6%) | 292 (2.6%) |
| $22,500 to $24,999 | 156 (1.2%) | 561 (5.0%) |
| $25,000 to $29,999 | 657 (5.2%) | 856 (7.5%) |
| $30,000 to $34,999 | 794 (6.3%) | 714 (6.3%) |
| $35,000 to $39,999 | 414 (3.3%) | 559 (4.9%) |
| $40,000 to $44,999 | 550 (4.4%) | 449 (4.0%) |
| $45,000 to $49,999 | 782 (6.2%) | 833 (7.3%) |
| $50,000 to $54,999 | 545 (4.3%) | 276 (2.4%) |
| $55,000 to $64,999 | 1,292 (10.3%) | 968 (8.5%) |
| $65,000 to $74,999 | 827 (6.6%) | 698 (6.2%) |
| $75,000 to $99,999 | 1,739 (13.9%) | 1,009 (8.9%) |
| $100,000+ | 2,387 (19.0%) | 1,302 (11.5%) |
| Total | 12,546 (100.0%) | 11,337 (100.0%) |
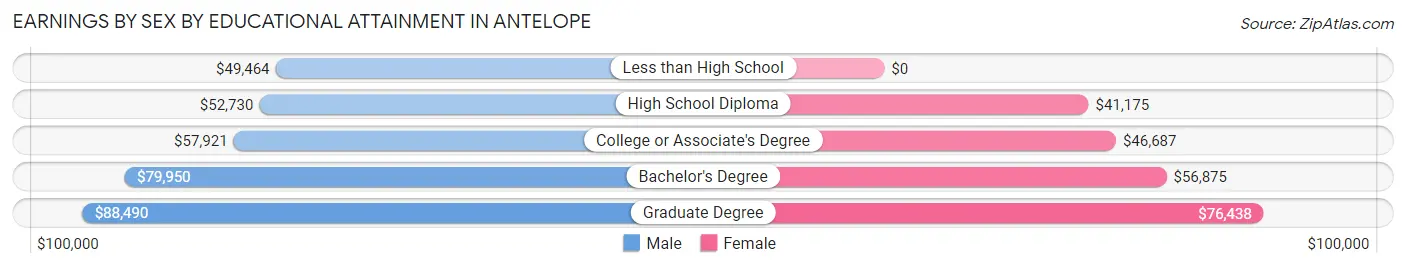
Earnings by Sex by Educational Attainment in Antelope
Average earnings in Antelope are $57,315 for men and $46,743 for women, a difference of 18.4%. Men with an educational attainment of graduate degree enjoy the highest average annual earnings of $88,490, while those with less than high school education earn the least with $49,464. Women with an educational attainment of graduate degree earn the most with the average annual earnings of $76,438, while those with high school diploma education have the smallest earnings of $41,175.
| Educational Attainment | Male Income | Female Income |
| Less than High School | $49,464 | $0 |
| High School Diploma | $52,730 | $41,175 |
| College or Associate's Degree | $57,921 | $46,687 |
| Bachelor's Degree | $79,950 | $56,875 |
| Graduate Degree | $88,490 | $76,438 |
| Total | $57,315 | $46,743 |
Family Income in Antelope
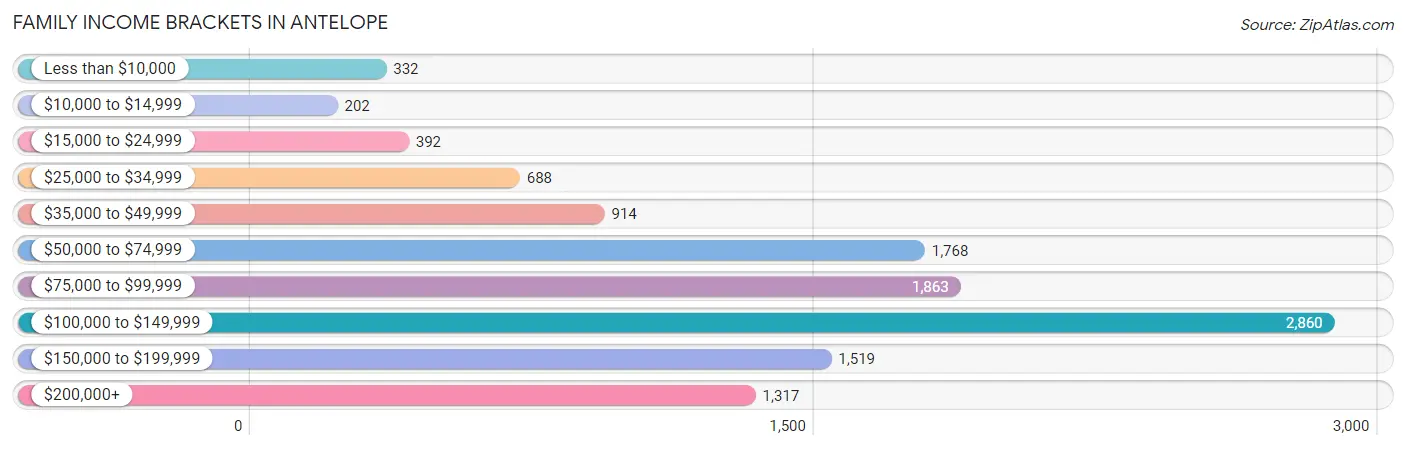
Family Income Brackets in Antelope
According to the Antelope family income data, there are 2,860 families falling into the $100,000 to $149,999 income range, which is the most common income bracket and makes up 24.1% of all families. Conversely, the $10,000 to $14,999 income bracket is the least frequent group with only 202 families (1.7%) belonging to this category.
| Income Bracket | # Families | % Families |
| Less than $10,000 | 332 | 2.8% |
| $10,000 to $14,999 | 202 | 1.7% |
| $15,000 to $24,999 | 392 | 3.3% |
| $25,000 to $34,999 | 688 | 5.8% |
| $35,000 to $49,999 | 914 | 7.7% |
| $50,000 to $74,999 | 1,768 | 14.9% |
| $75,000 to $99,999 | 1,863 | 15.7% |
| $100,000 to $149,999 | 2,860 | 24.1% |
| $150,000 to $199,999 | 1,519 | 12.8% |
| $200,000+ | 1,317 | 11.1% |
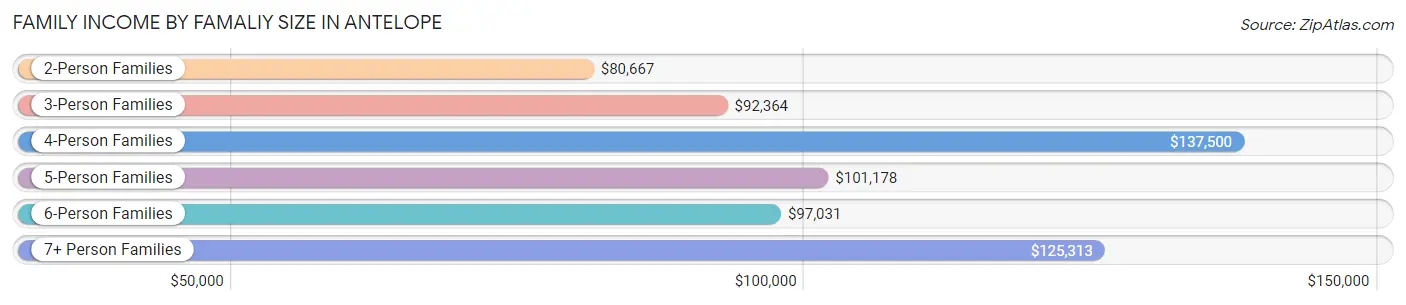
Family Income by Famaliy Size in Antelope
4-person families (2,532 | 21.3%) account for the highest median family income in Antelope with $137,500 per family, while 2-person families (4,576 | 38.6%) have the highest median income of $40,334 per family member.
| Income Bracket | # Families | Median Income |
| 2-Person Families | 4,576 (38.6%) | $80,667 |
| 3-Person Families | 2,804 (23.6%) | $92,364 |
| 4-Person Families | 2,532 (21.3%) | $137,500 |
| 5-Person Families | 1,053 (8.9%) | $101,178 |
| 6-Person Families | 497 (4.2%) | $97,031 |
| 7+ Person Families | 405 (3.4%) | $125,313 |
| Total | 11,867 (100.0%) | $96,741 |
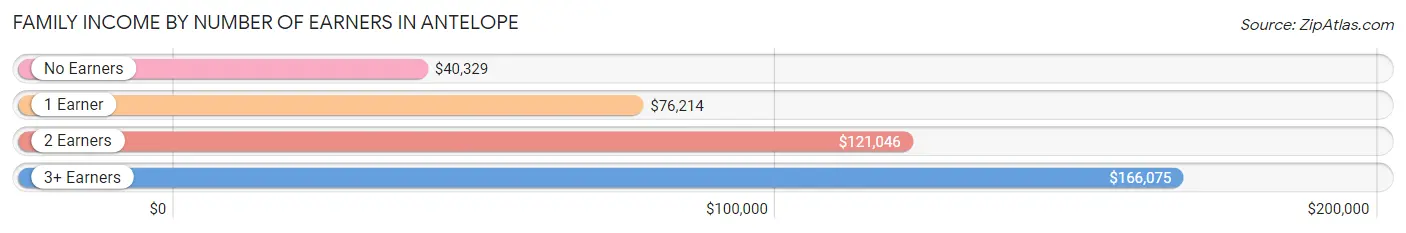
Family Income by Number of Earners in Antelope
The median family income in Antelope is $96,741, with families comprising 3+ earners (1,657) having the highest median family income of $166,075, while families with no earners (1,623) have the lowest median family income of $40,329, accounting for 14.0% and 13.7% of families, respectively.
| Number of Earners | # Families | Median Income |
| No Earners | 1,623 (13.7%) | $40,329 |
| 1 Earner | 3,904 (32.9%) | $76,214 |
| 2 Earners | 4,683 (39.5%) | $121,046 |
| 3+ Earners | 1,657 (14.0%) | $166,075 |
| Total | 11,867 (100.0%) | $96,741 |
Household Income in Antelope
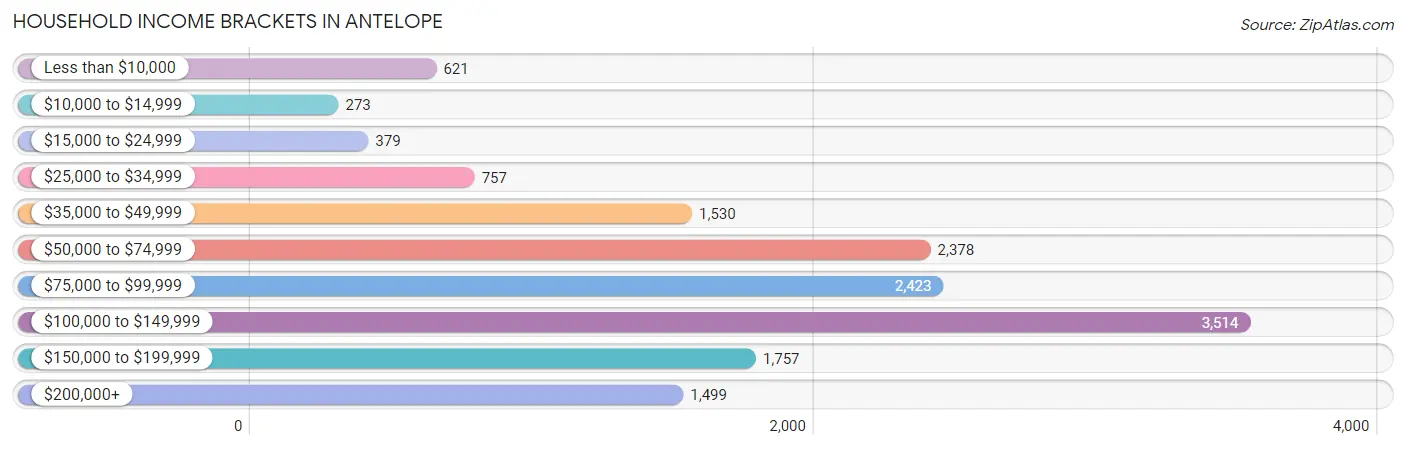
Household Income Brackets in Antelope
With 3,514 households falling in the category, the $100,000 to $149,999 income range is the most frequent in Antelope, accounting for 23.2% of all households. In contrast, only 273 households (1.8%) fall into the $10,000 to $14,999 income bracket, making it the least populous group.
| Income Bracket | # Households | % Households |
| Less than $10,000 | 621 | 4.1% |
| $10,000 to $14,999 | 273 | 1.8% |
| $15,000 to $24,999 | 379 | 2.5% |
| $25,000 to $34,999 | 757 | 5.0% |
| $35,000 to $49,999 | 1,530 | 10.1% |
| $50,000 to $74,999 | 2,378 | 15.7% |
| $75,000 to $99,999 | 2,423 | 16.0% |
| $100,000 to $149,999 | 3,514 | 23.2% |
| $150,000 to $199,999 | 1,757 | 11.6% |
| $200,000+ | 1,499 | 9.9% |
Household Income by Householder Age in Antelope
The median household income in Antelope is $92,117, with the highest median household income of $105,182 found in the 45 to 64 years age bracket for the primary householder. A total of 6,406 households (42.3%) fall into this category. Meanwhile, the 65+ years age bracket for the primary householder has the lowest median household income of $55,066, with 2,836 households (18.7%) in this group.
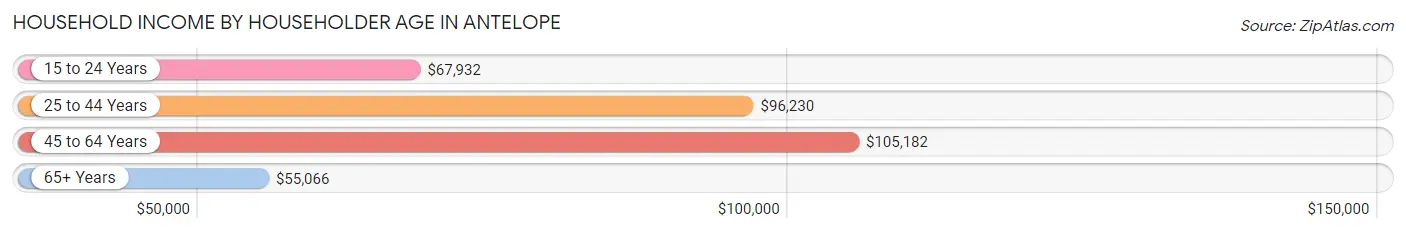
| Income Bracket | # Households | Median Income |
| 15 to 24 Years | 491 (3.2%) | $67,932 |
| 25 to 44 Years | 5,413 (35.7%) | $96,230 |
| 45 to 64 Years | 6,406 (42.3%) | $105,182 |
| 65+ Years | 2,836 (18.7%) | $55,066 |
| Total | 15,146 (100.0%) | $92,117 |
Poverty in Antelope
Income Below Poverty by Sex and Age in Antelope
With 9.7% poverty level for males and 11.1% for females among the residents of Antelope, 15 year old males and 5 year old females are the most vulnerable to poverty, with 45 males (19.0%) and 124 females (45.1%) in their respective age groups living below the poverty level.
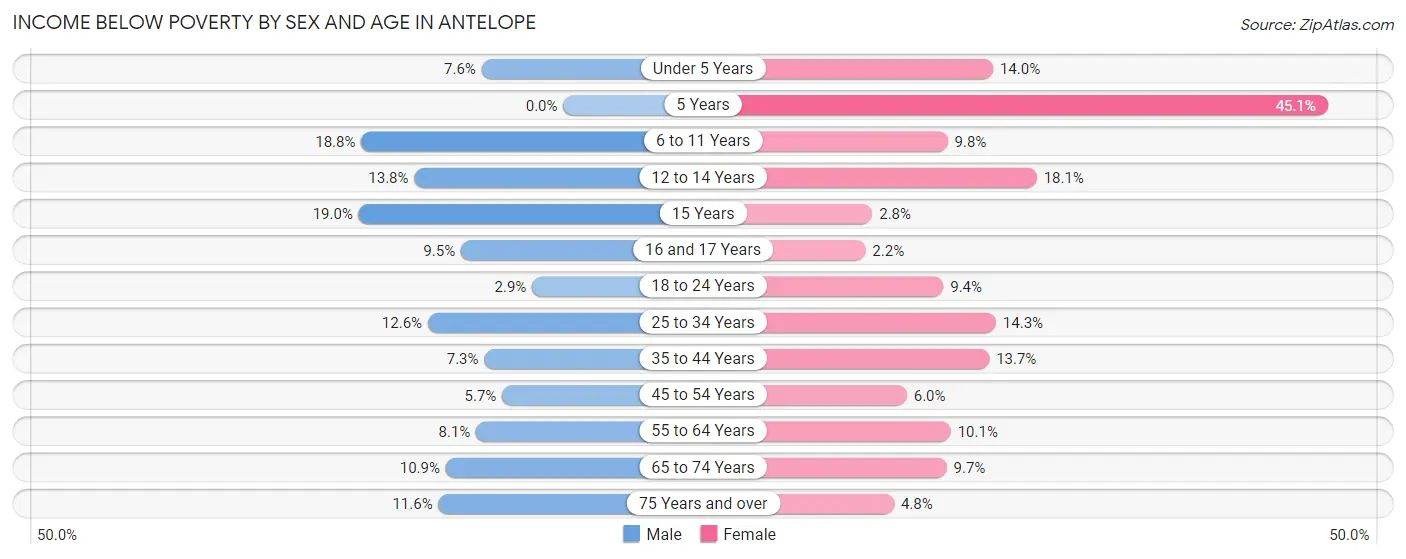
| Age Bracket | Male | Female |
| Under 5 Years | 135 (7.6%) | 226 (14.0%) |
| 5 Years | 0 (0.0%) | 124 (45.1%) |
| 6 to 11 Years | 383 (18.8%) | 201 (9.8%) |
| 12 to 14 Years | 166 (13.8%) | 188 (18.1%) |
| 15 Years | 45 (19.0%) | 10 (2.8%) |
| 16 and 17 Years | 100 (9.5%) | 12 (2.2%) |
| 18 to 24 Years | 40 (2.9%) | 251 (9.4%) |
| 25 to 34 Years | 463 (12.6%) | 429 (14.3%) |
| 35 to 44 Years | 243 (7.3%) | 488 (13.7%) |
| 45 to 54 Years | 152 (5.7%) | 175 (6.0%) |
| 55 to 64 Years | 258 (8.1%) | 360 (10.1%) |
| 65 to 74 Years | 178 (10.9%) | 190 (9.7%) |
| 75 Years and over | 81 (11.6%) | 40 (4.8%) |
| Total | 2,244 (9.7%) | 2,694 (11.1%) |
Income Above Poverty by Sex and Age in Antelope
According to the poverty statistics in Antelope, males aged 5 years and females aged 16 and 17 years are the age groups that are most secure financially, with 100.0% of males and 97.8% of females in these age groups living above the poverty line.
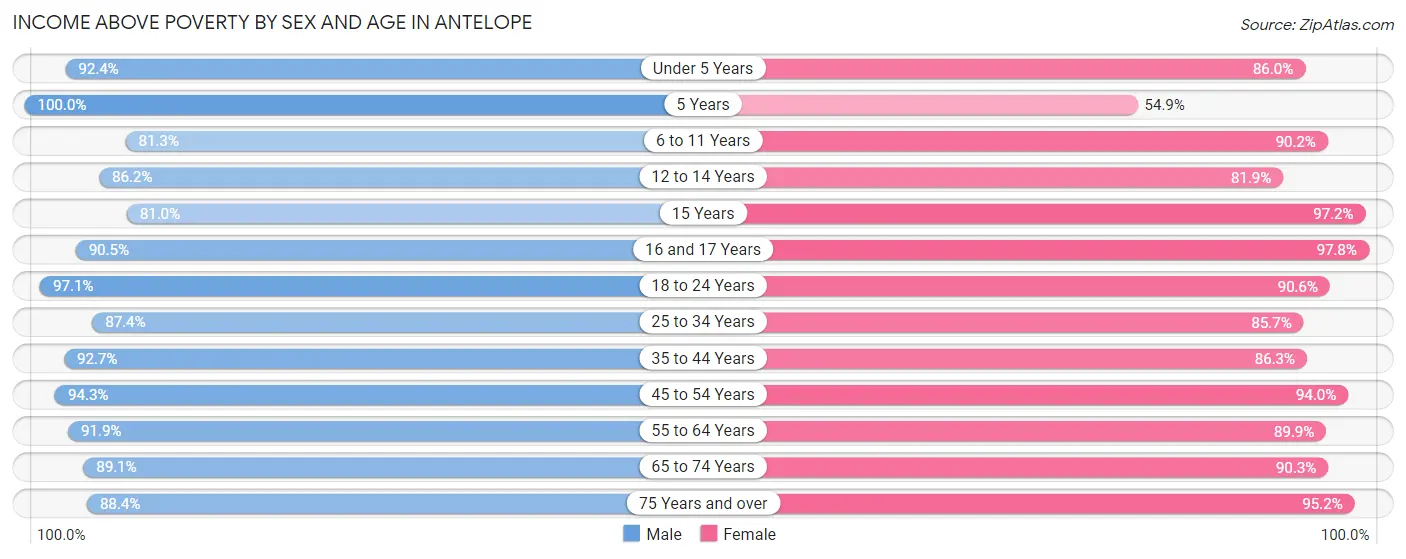
| Age Bracket | Male | Female |
| Under 5 Years | 1,647 (92.4%) | 1,385 (86.0%) |
| 5 Years | 239 (100.0%) | 151 (54.9%) |
| 6 to 11 Years | 1,660 (81.2%) | 1,846 (90.2%) |
| 12 to 14 Years | 1,034 (86.2%) | 851 (81.9%) |
| 15 Years | 192 (81.0%) | 343 (97.2%) |
| 16 and 17 Years | 953 (90.5%) | 536 (97.8%) |
| 18 to 24 Years | 1,343 (97.1%) | 2,413 (90.6%) |
| 25 to 34 Years | 3,219 (87.4%) | 2,570 (85.7%) |
| 35 to 44 Years | 3,070 (92.7%) | 3,078 (86.3%) |
| 45 to 54 Years | 2,525 (94.3%) | 2,727 (94.0%) |
| 55 to 64 Years | 2,933 (91.9%) | 3,200 (89.9%) |
| 65 to 74 Years | 1,453 (89.1%) | 1,762 (90.3%) |
| 75 Years and over | 618 (88.4%) | 787 (95.2%) |
| Total | 20,886 (90.3%) | 21,649 (88.9%) |
Income Below Poverty Among Married-Couple Families in Antelope
The poverty statistics for married-couple families in Antelope show that 5.0% or 426 of the total 8,448 families live below the poverty line. Families with 1 or 2 children have the highest poverty rate of 8.2%, comprising of 253 families. On the other hand, families with no children have the lowest poverty rate of 2.7%, which includes 115 families.
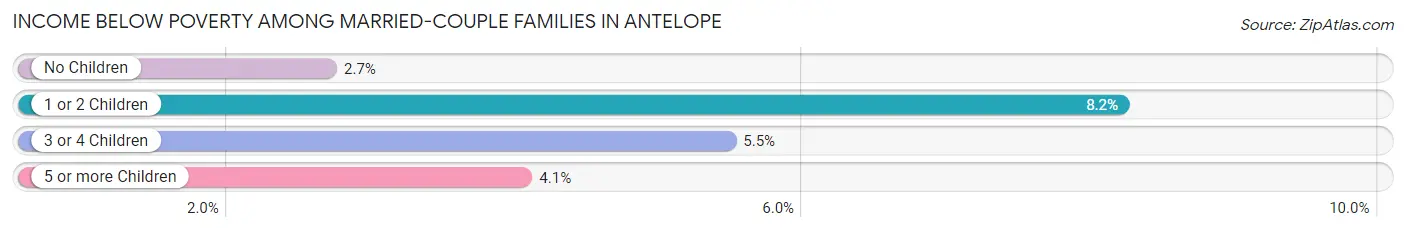
| Children | Above Poverty | Below Poverty |
| No Children | 4,154 (97.3%) | 115 (2.7%) |
| 1 or 2 Children | 2,828 (91.8%) | 253 (8.2%) |
| 3 or 4 Children | 898 (94.5%) | 52 (5.5%) |
| 5 or more Children | 142 (96.0%) | 6 (4.1%) |
| Total | 8,022 (95.0%) | 426 (5.0%) |
Income Below Poverty Among Single-Parent Households in Antelope
According to the poverty data in Antelope, 8.1% or 74 single-father households and 19.7% or 493 single-mother households are living below the poverty line. Among single-father households, those with 5 or more children have the highest poverty rate, with 14 households (100.0%) experiencing poverty. Likewise, among single-mother households, those with 3 or 4 children have the highest poverty rate, with 188 households (85.8%) falling below the poverty line.
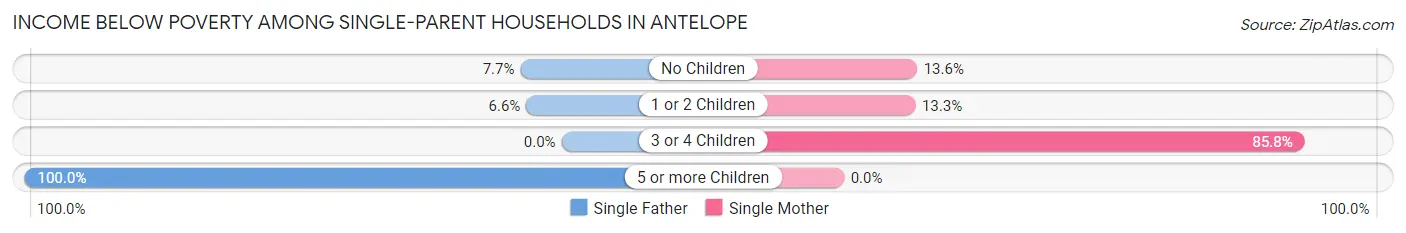
| Children | Single Father | Single Mother |
| No Children | 29 (7.7%) | 162 (13.6%) |
| 1 or 2 Children | 31 (6.6%) | 143 (13.3%) |
| 3 or 4 Children | 0 (0.0%) | 188 (85.8%) |
| 5 or more Children | 14 (100.0%) | 0 (0.0%) |
| Total | 74 (8.1%) | 493 (19.7%) |
Income Below Poverty Among Married-Couple vs Single-Parent Households in Antelope
The poverty data for Antelope shows that 426 of the married-couple family households (5.0%) and 567 of the single-parent households (16.6%) are living below the poverty level. Within the married-couple family households, those with 1 or 2 children have the highest poverty rate, with 253 households (8.2%) falling below the poverty line. Among the single-parent households, those with 3 or 4 children have the highest poverty rate, with 188 household (69.1%) living below poverty.
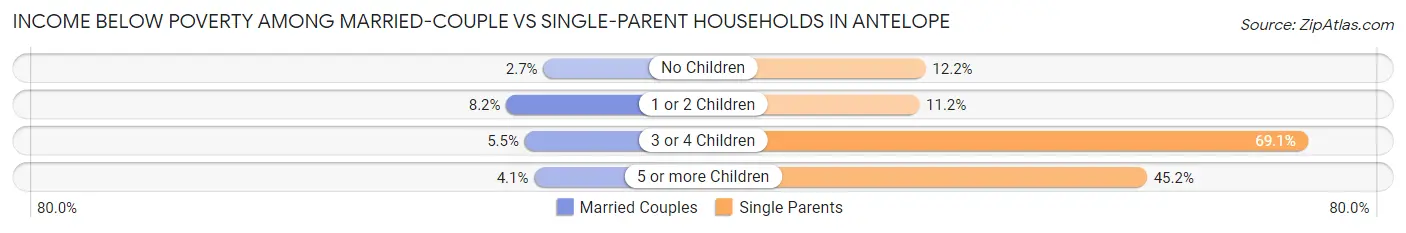
| Children | Married-Couple Families | Single-Parent Households |
| No Children | 115 (2.7%) | 191 (12.2%) |
| 1 or 2 Children | 253 (8.2%) | 174 (11.2%) |
| 3 or 4 Children | 52 (5.5%) | 188 (69.1%) |
| 5 or more Children | 6 (4.1%) | 14 (45.2%) |
| Total | 426 (5.0%) | 567 (16.6%) |
Race in Antelope
The most populous races in Antelope are White / Caucasian (30,548 | 64.1%), Hispanic or Latino (6,941 | 14.6%), and Asian (5,320 | 11.2%).
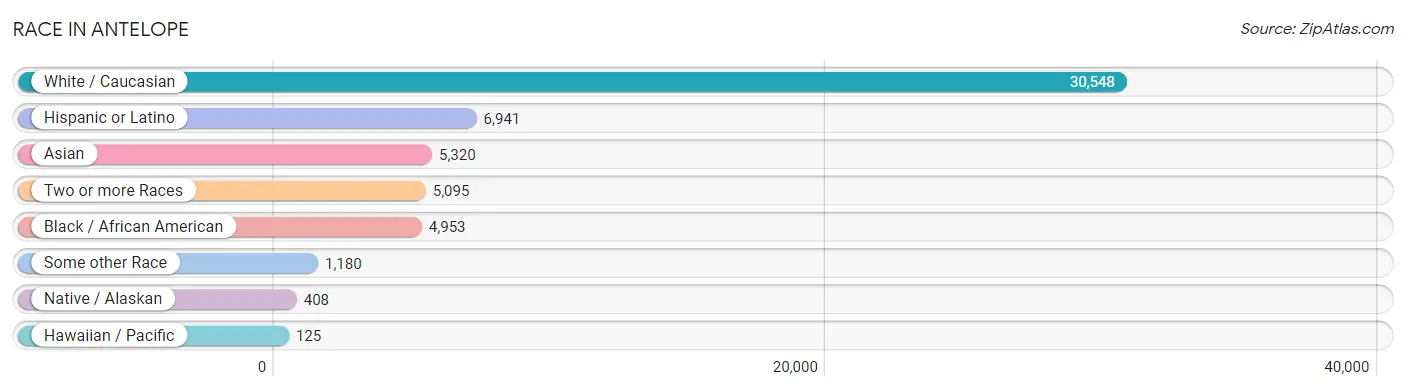
| Race | # Population | % Population |
| Asian | 5,320 | 11.2% |
| Black / African American | 4,953 | 10.4% |
| Hawaiian / Pacific | 125 | 0.3% |
| Hispanic or Latino | 6,941 | 14.6% |
| Native / Alaskan | 408 | 0.9% |
| White / Caucasian | 30,548 | 64.1% |
| Two or more Races | 5,095 | 10.7% |
| Some other Race | 1,180 | 2.5% |
| Total | 47,629 | 100.0% |
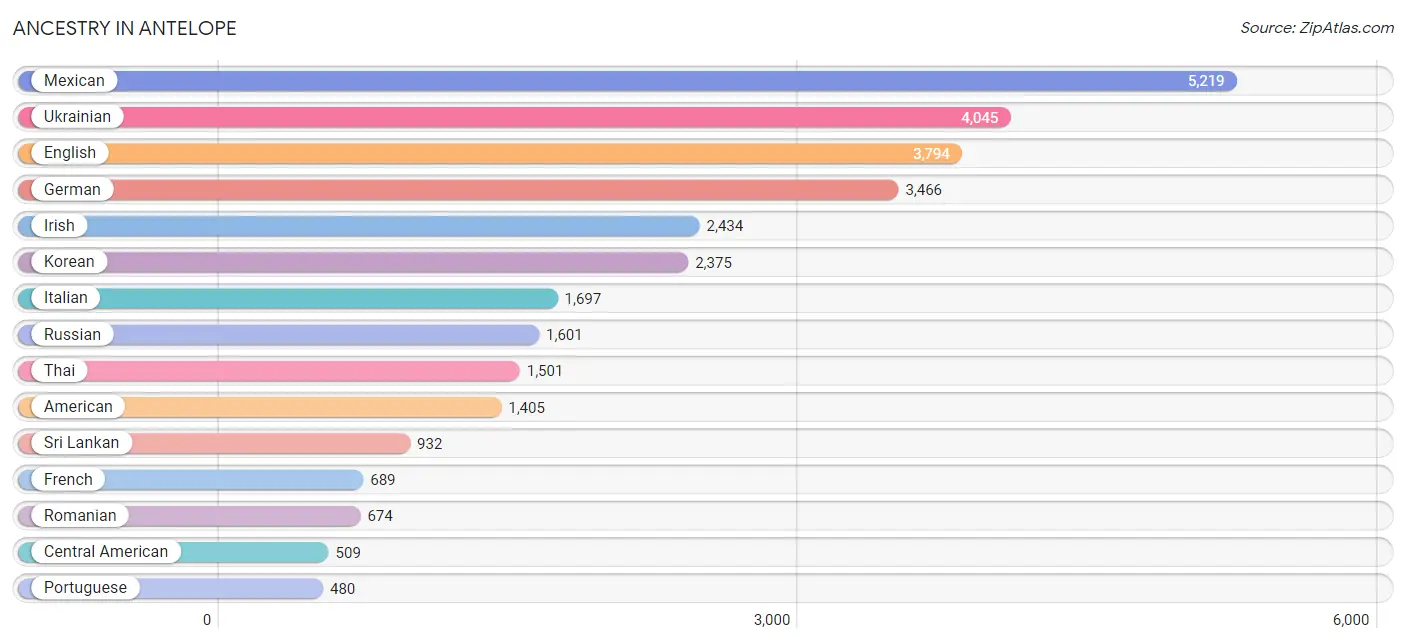
Ancestry in Antelope
The most populous ancestries reported in Antelope are Mexican (5,219 | 11.0%), Ukrainian (4,045 | 8.5%), English (3,794 | 8.0%), German (3,466 | 7.3%), and Irish (2,434 | 5.1%), together accounting for 39.8% of all Antelope residents.
| Ancestry | # Population | % Population |
| Afghan | 31 | 0.1% |
| African | 101 | 0.2% |
| American | 1,405 | 2.9% |
| Apache | 186 | 0.4% |
| Arab | 431 | 0.9% |
| Argentinean | 120 | 0.3% |
| Armenian | 71 | 0.2% |
| Assyrian / Chaldean / Syriac | 34 | 0.1% |
| Austrian | 29 | 0.1% |
| Bangladeshi | 117 | 0.3% |
| Belgian | 68 | 0.1% |
| Bhutanese | 364 | 0.8% |
| Blackfeet | 4 | 0.0% |
| British | 402 | 0.8% |
| Bulgarian | 370 | 0.8% |
| Burmese | 263 | 0.5% |
| Cajun | 4 | 0.0% |
| Cambodian | 82 | 0.2% |
| Canadian | 30 | 0.1% |
| Celtic | 2 | 0.0% |
| Central American | 509 | 1.1% |
| Central American Indian | 6 | 0.0% |
| Cherokee | 145 | 0.3% |
| Choctaw | 43 | 0.1% |
| Colombian | 75 | 0.2% |
| Costa Rican | 18 | 0.0% |
| Cuban | 58 | 0.1% |
| Czech | 25 | 0.1% |
| Czechoslovakian | 24 | 0.1% |
| Danish | 155 | 0.3% |
| Dutch | 227 | 0.5% |
| Eastern European | 109 | 0.2% |
| Egyptian | 7 | 0.0% |
| English | 3,794 | 8.0% |
| European | 469 | 1.0% |
| Finnish | 63 | 0.1% |
| French | 689 | 1.5% |
| French Canadian | 174 | 0.4% |
| German | 3,466 | 7.3% |
| German Russian | 26 | 0.1% |
| Greek | 98 | 0.2% |
| Guamanian / Chamorro | 96 | 0.2% |
| Guatemalan | 115 | 0.2% |
| Honduran | 19 | 0.0% |
| Hungarian | 47 | 0.1% |
| Indian (Asian) | 463 | 1.0% |
| Iranian | 21 | 0.0% |
| Iraqi | 215 | 0.4% |
| Irish | 2,434 | 5.1% |
| Italian | 1,697 | 3.6% |
| Jamaican | 8 | 0.0% |
| Japanese | 15 | 0.0% |
| Kenyan | 59 | 0.1% |
| Korean | 2,375 | 5.0% |
| Lebanese | 36 | 0.1% |
| Lithuanian | 79 | 0.2% |
| Malaysian | 209 | 0.4% |
| Maltese | 63 | 0.1% |
| Mexican | 5,219 | 11.0% |
| Mexican American Indian | 39 | 0.1% |
| Native Hawaiian | 97 | 0.2% |
| Nepalese | 46 | 0.1% |
| Nicaraguan | 165 | 0.4% |
| Nigerian | 21 | 0.0% |
| Northern European | 47 | 0.1% |
| Norwegian | 410 | 0.9% |
| Ottawa | 34 | 0.1% |
| Pakistani | 91 | 0.2% |
| Palestinian | 43 | 0.1% |
| Panamanian | 11 | 0.0% |
| Peruvian | 30 | 0.1% |
| Polish | 422 | 0.9% |
| Portuguese | 480 | 1.0% |
| Puerto Rican | 348 | 0.7% |
| Romanian | 674 | 1.4% |
| Russian | 1,601 | 3.4% |
| Salvadoran | 181 | 0.4% |
| Samoan | 10 | 0.0% |
| Scandinavian | 70 | 0.2% |
| Scotch-Irish | 147 | 0.3% |
| Scottish | 398 | 0.8% |
| Serbian | 11 | 0.0% |
| Sioux | 34 | 0.1% |
| South African | 10 | 0.0% |
| South American | 228 | 0.5% |
| Spaniard | 374 | 0.8% |
| Spanish American | 35 | 0.1% |
| Sri Lankan | 932 | 2.0% |
| Subsaharan African | 264 | 0.5% |
| Swedish | 216 | 0.4% |
| Swiss | 93 | 0.2% |
| Thai | 1,501 | 3.2% |
| Ukrainian | 4,045 | 8.5% |
| Welsh | 166 | 0.4% |
| Yaqui | 7 | 0.0% |
| Yugoslavian | 42 | 0.1% |
| Zimbabwean | 32 | 0.1% | View All 97 Rows |
Immigrants in Antelope
The most numerous immigrant groups reported in Antelope came from Europe (5,621 | 11.8%), Eastern Europe (5,153 | 10.8%), Asia (4,345 | 9.1%), Ukraine (3,078 | 6.5%), and South Eastern Asia (2,060 | 4.3%), together accounting for 42.5% of all Antelope residents.
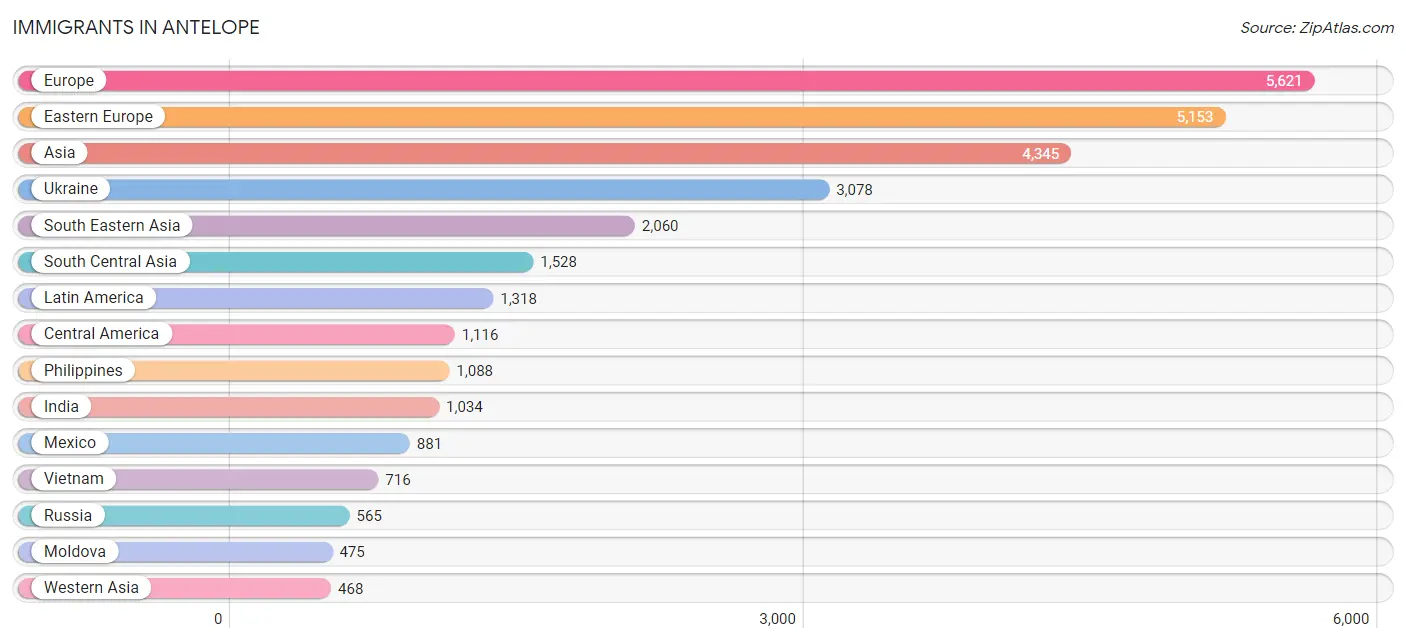
| Immigration Origin | # Population | % Population |
| Afghanistan | 163 | 0.3% |
| Africa | 133 | 0.3% |
| Argentina | 75 | 0.2% |
| Armenia | 24 | 0.1% |
| Asia | 4,345 | 9.1% |
| Azores | 12 | 0.0% |
| Belarus | 465 | 1.0% |
| Bosnia and Herzegovina | 92 | 0.2% |
| Brazil | 15 | 0.0% |
| Bulgaria | 28 | 0.1% |
| Cambodia | 22 | 0.1% |
| Canada | 95 | 0.2% |
| Caribbean | 35 | 0.1% |
| Central America | 1,116 | 2.3% |
| China | 137 | 0.3% |
| Colombia | 75 | 0.2% |
| Cuba | 27 | 0.1% |
| Eastern Africa | 66 | 0.1% |
| Eastern Asia | 289 | 0.6% |
| Eastern Europe | 5,153 | 10.8% |
| El Salvador | 69 | 0.1% |
| England | 198 | 0.4% |
| Europe | 5,621 | 11.8% |
| Fiji | 98 | 0.2% |
| France | 40 | 0.1% |
| Germany | 146 | 0.3% |
| Guatemala | 61 | 0.1% |
| Guyana | 2 | 0.0% |
| Honduras | 19 | 0.0% |
| Hong Kong | 26 | 0.1% |
| Hungary | 12 | 0.0% |
| India | 1,034 | 2.2% |
| Indonesia | 26 | 0.1% |
| Iran | 21 | 0.0% |
| Iraq | 228 | 0.5% |
| Israel | 47 | 0.1% |
| Italy | 32 | 0.1% |
| Jamaica | 8 | 0.0% |
| Japan | 23 | 0.1% |
| Jordan | 69 | 0.1% |
| Kazakhstan | 82 | 0.2% |
| Kenya | 50 | 0.1% |
| Korea | 37 | 0.1% |
| Laos | 106 | 0.2% |
| Latin America | 1,318 | 2.8% |
| Lithuania | 37 | 0.1% |
| Malaysia | 11 | 0.0% |
| Mexico | 881 | 1.8% |
| Moldova | 475 | 1.0% |
| Nicaragua | 75 | 0.2% |
| Northern Europe | 234 | 0.5% |
| Oceania | 98 | 0.2% |
| Pakistan | 36 | 0.1% |
| Panama | 11 | 0.0% |
| Philippines | 1,088 | 2.3% |
| Portugal | 12 | 0.0% |
| Romania | 267 | 0.6% |
| Russia | 565 | 1.2% |
| Serbia | 11 | 0.0% |
| South Africa | 17 | 0.0% |
| South America | 167 | 0.4% |
| South Central Asia | 1,528 | 3.2% |
| South Eastern Asia | 2,060 | 4.3% |
| Southern Europe | 44 | 0.1% |
| Switzerland | 4 | 0.0% |
| Thailand | 91 | 0.2% |
| Turkey | 9 | 0.0% |
| Ukraine | 3,078 | 6.5% |
| Uzbekistan | 38 | 0.1% |
| Vietnam | 716 | 1.5% |
| Western Africa | 40 | 0.1% |
| Western Asia | 468 | 1.0% |
| Western Europe | 190 | 0.4% |
| Zimbabwe | 15 | 0.0% | View All 74 Rows |
Sex and Age in Antelope
Sex and Age in Antelope
The most populous age groups in Antelope are 25 to 29 Years (2,270 | 9.8%) for men and 20 to 24 Years (1,990 | 8.2%) for women.
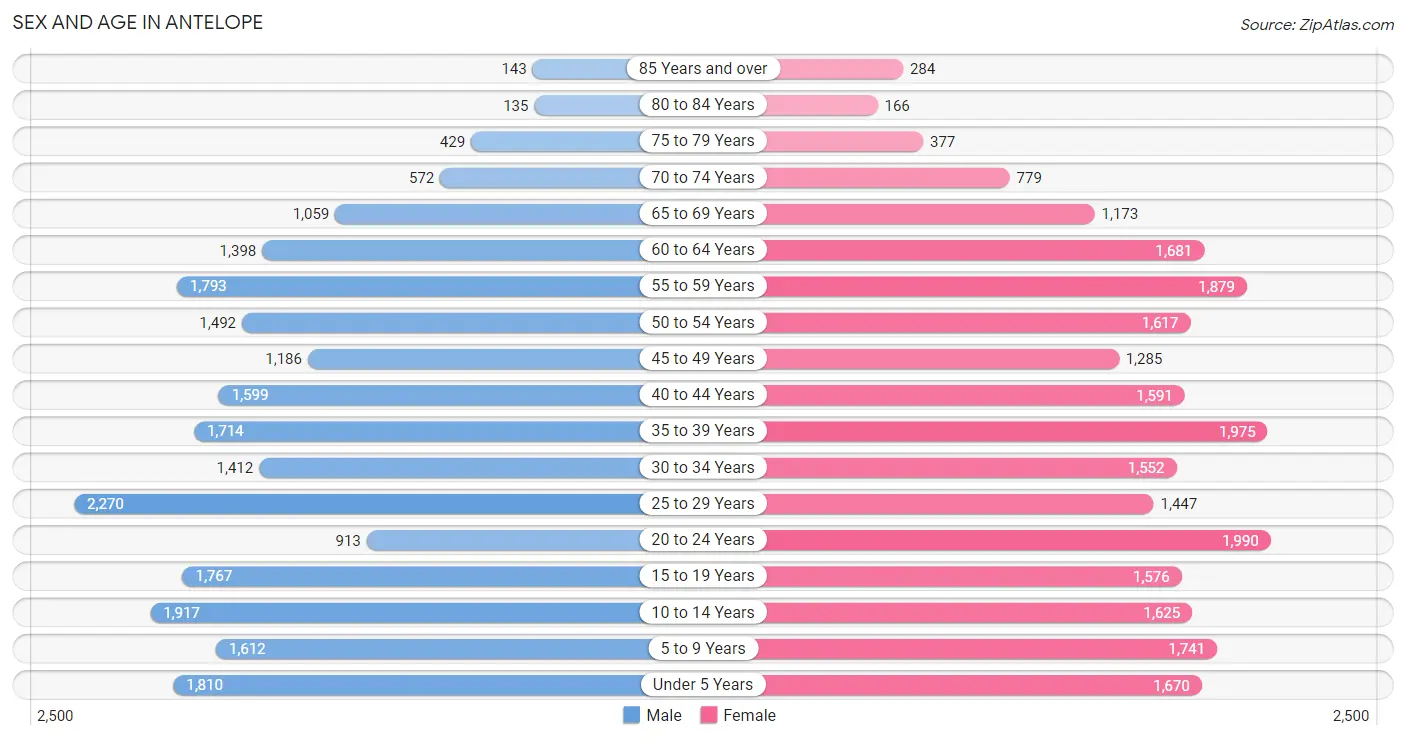
| Age Bracket | Male | Female |
| Under 5 Years | 1,810 (7.8%) | 1,670 (6.8%) |
| 5 to 9 Years | 1,612 (6.9%) | 1,741 (7.1%) |
| 10 to 14 Years | 1,917 (8.3%) | 1,625 (6.7%) |
| 15 to 19 Years | 1,767 (7.6%) | 1,576 (6.5%) |
| 20 to 24 Years | 913 (3.9%) | 1,990 (8.2%) |
| 25 to 29 Years | 2,270 (9.8%) | 1,447 (5.9%) |
| 30 to 34 Years | 1,412 (6.1%) | 1,552 (6.4%) |
| 35 to 39 Years | 1,714 (7.4%) | 1,975 (8.1%) |
| 40 to 44 Years | 1,599 (6.9%) | 1,591 (6.5%) |
| 45 to 49 Years | 1,186 (5.1%) | 1,285 (5.3%) |
| 50 to 54 Years | 1,492 (6.4%) | 1,617 (6.6%) |
| 55 to 59 Years | 1,793 (7.7%) | 1,879 (7.7%) |
| 60 to 64 Years | 1,398 (6.0%) | 1,681 (6.9%) |
| 65 to 69 Years | 1,059 (4.6%) | 1,173 (4.8%) |
| 70 to 74 Years | 572 (2.5%) | 779 (3.2%) |
| 75 to 79 Years | 429 (1.8%) | 377 (1.5%) |
| 80 to 84 Years | 135 (0.6%) | 166 (0.7%) |
| 85 Years and over | 143 (0.6%) | 284 (1.2%) |
| Total | 23,221 (100.0%) | 24,408 (100.0%) |
Families and Households in Antelope
Median Family Size in Antelope
The median family size in Antelope is 3.48 persons per family, with married-couple families (8,448 | 71.2%) accounting for the largest median family size of 3.63 persons per family. On the other hand, single male/father families (916 | 7.7%) represent the smallest median family size with 3.12 persons per family.
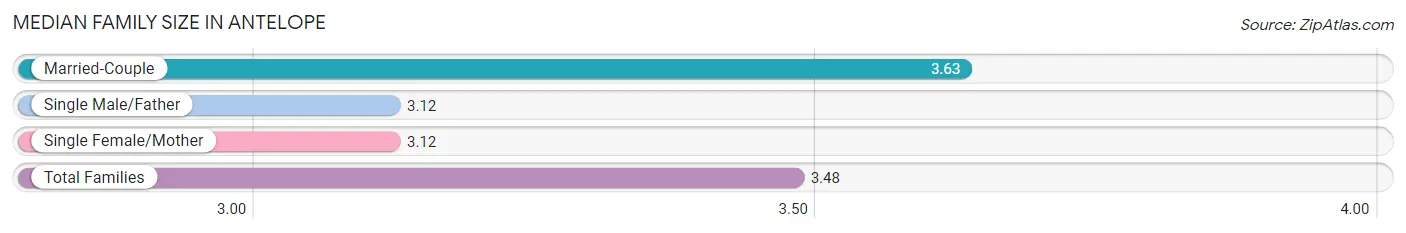
| Family Type | # Families | Family Size |
| Married-Couple | 8,448 (71.2%) | 3.63 |
| Single Male/Father | 916 (7.7%) | 3.12 |
| Single Female/Mother | 2,503 (21.1%) | 3.12 |
| Total Families | 11,867 (100.0%) | 3.48 |
Median Household Size in Antelope
The median household size in Antelope is 3.14 persons per household, with married-couple households (8,448 | 55.8%) accounting for the largest median household size of 3.65 persons per household. non-family households (3,279 | 21.6%) represent the smallest median household size with 1.38 persons per household.
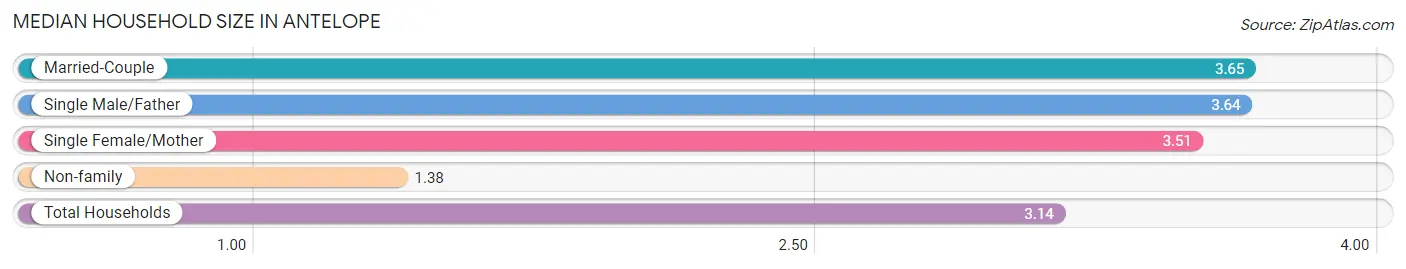
| Household Type | # Households | Household Size |
| Married-Couple | 8,448 (55.8%) | 3.65 |
| Single Male/Father | 916 (6.0%) | 3.64 |
| Single Female/Mother | 2,503 (16.5%) | 3.51 |
| Non-family | 3,279 (21.6%) | 1.38 |
| Total Households | 15,146 (100.0%) | 3.14 |
Household Size by Marriage Status in Antelope
Out of a total of 15,146 households in Antelope, 11,867 (78.3%) are family households, while 3,279 (21.6%) are nonfamily households. The most numerous type of family households are 2-person households, comprising 3,860, and the most common type of nonfamily households are 1-person households, comprising 2,377.
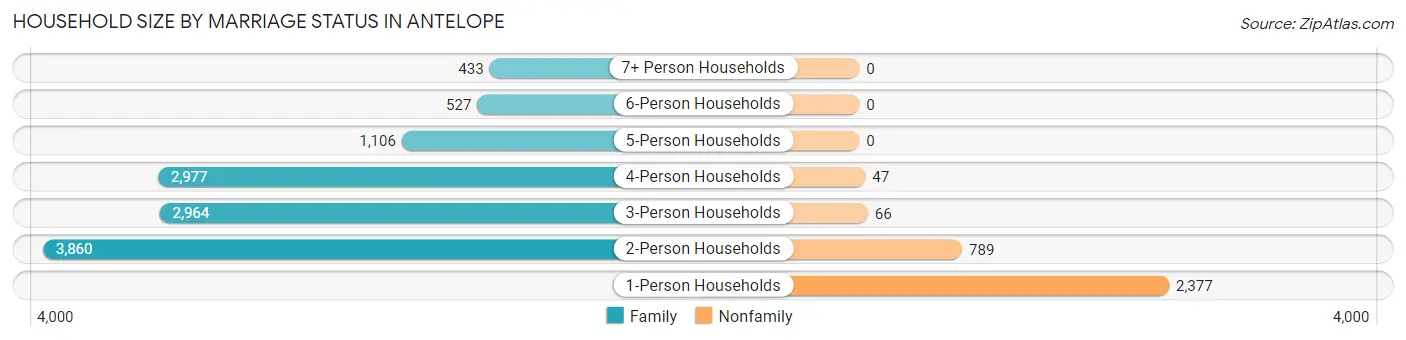
| Household Size | Family Households | Nonfamily Households |
| 1-Person Households | - | 2,377 (15.7%) |
| 2-Person Households | 3,860 (25.5%) | 789 (5.2%) |
| 3-Person Households | 2,964 (19.6%) | 66 (0.4%) |
| 4-Person Households | 2,977 (19.7%) | 47 (0.3%) |
| 5-Person Households | 1,106 (7.3%) | 0 (0.0%) |
| 6-Person Households | 527 (3.5%) | 0 (0.0%) |
| 7+ Person Households | 433 (2.9%) | 0 (0.0%) |
| Total | 11,867 (78.3%) | 3,279 (21.6%) |
Female Fertility in Antelope
Fertility by Age in Antelope
Average fertility rate in Antelope is 43.0 births per 1,000 women. Women in the age bracket of 20 to 34 years have the highest fertility rate with 71.0 births per 1,000 women. Women in the age bracket of 20 to 34 years acount for 68.7% of all women with births.
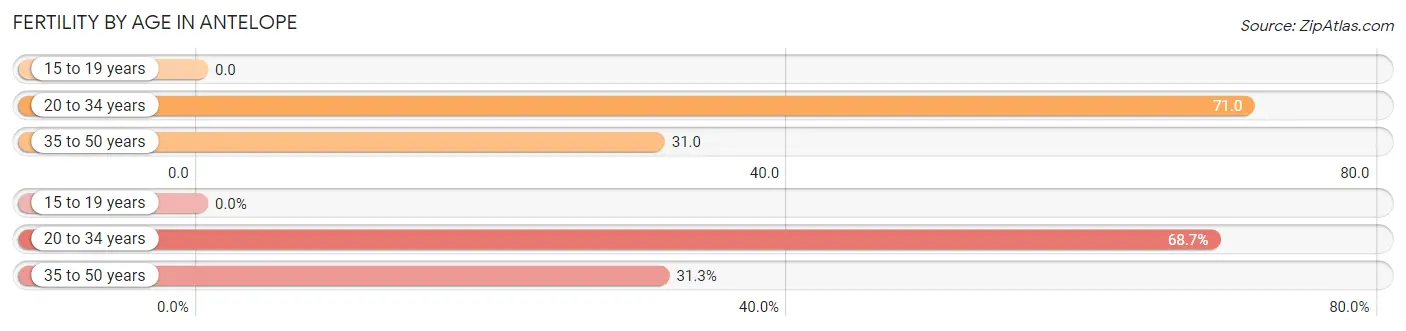
| Age Bracket | Women with Births | Births / 1,000 Women |
| 15 to 19 years | 0 (0.0%) | 0.0 |
| 20 to 34 years | 353 (68.7%) | 71.0 |
| 35 to 50 years | 161 (31.3%) | 31.0 |
| Total | 514 (100.0%) | 43.0 |
Fertility by Age by Marriage Status in Antelope
73.0% of women with births (514) in Antelope are married. The highest percentage of unmarried women with births falls into 20 to 34 years age bracket with 39.4% of them unmarried at the time of birth, while the lowest percentage of unmarried women with births belong to 35 to 50 years age bracket with 0.0% of them unmarried.
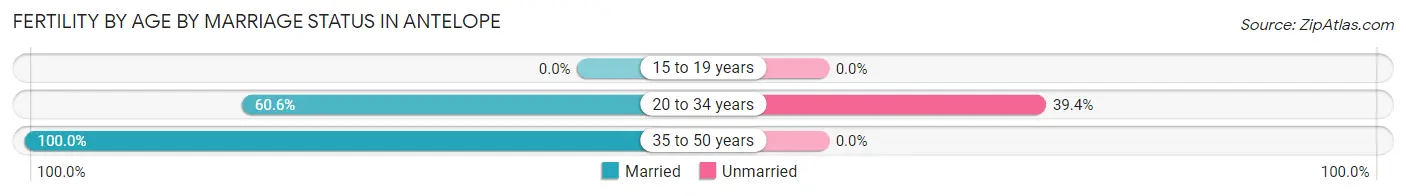
| Age Bracket | Married | Unmarried |
| 15 to 19 years | 0 (0.0%) | 0 (0.0%) |
| 20 to 34 years | 214 (60.6%) | 139 (39.4%) |
| 35 to 50 years | 161 (100.0%) | 0 (0.0%) |
| Total | 375 (73.0%) | 139 (27.0%) |
Fertility by Education in Antelope
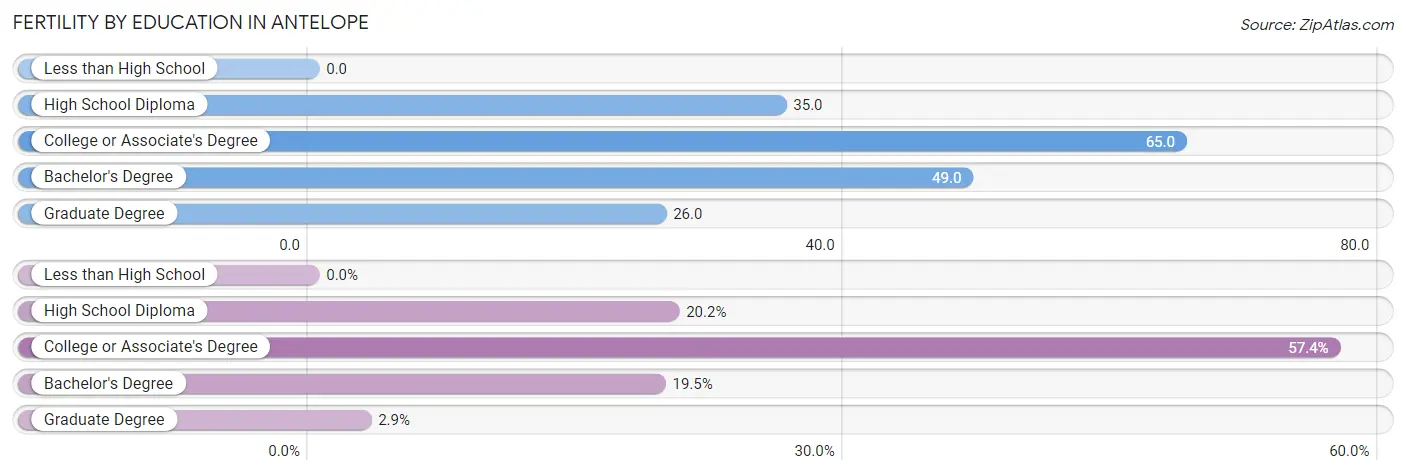
| Educational Attainment | Women with Births | Births / 1,000 Women |
| Less than High School | 0 (0.0%) | 0.0 |
| High School Diploma | 104 (20.2%) | 35.0 |
| College or Associate's Degree | 295 (57.4%) | 65.0 |
| Bachelor's Degree | 100 (19.5%) | 49.0 |
| Graduate Degree | 15 (2.9%) | 26.0 |
| Total | 514 (100.0%) | 43.0 |
Fertility by Education by Marriage Status in Antelope
27.0% of women with births in Antelope are unmarried. Women with the educational attainment of graduate degree are most likely to be married with 100.0% of them married at childbirth, while women with the educational attainment of college or associate's degree are least likely to be married with 29.5% of them unmarried at childbirth.
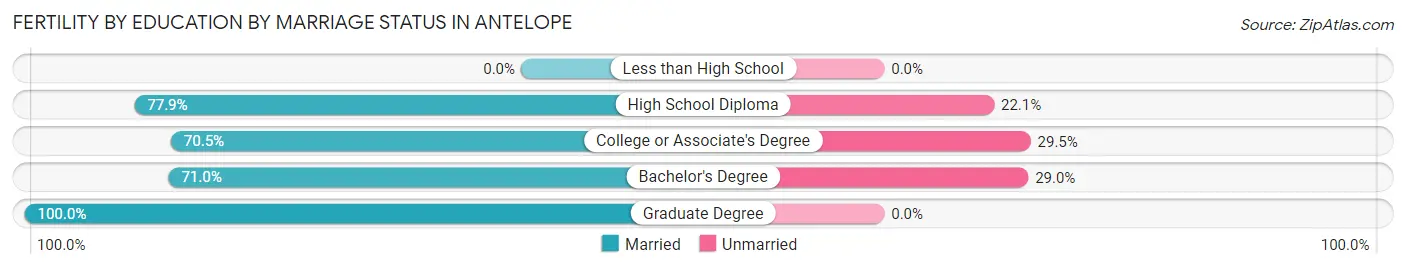
| Educational Attainment | Married | Unmarried |
| Less than High School | 0 (0.0%) | 0 (0.0%) |
| High School Diploma | 81 (77.9%) | 23 (22.1%) |
| College or Associate's Degree | 208 (70.5%) | 87 (29.5%) |
| Bachelor's Degree | 71 (71.0%) | 29 (29.0%) |
| Graduate Degree | 15 (100.0%) | 0 (0.0%) |
| Total | 375 (73.0%) | 139 (27.0%) |
Employment Characteristics in Antelope
Employment by Class of Employer in Antelope
Among the 21,640 employed individuals in Antelope, private company employees (14,495 | 67.0%), state government employees (1,955 | 9.0%), and not-for-profit organizations (1,458 | 6.7%) make up the most common classes of employment.
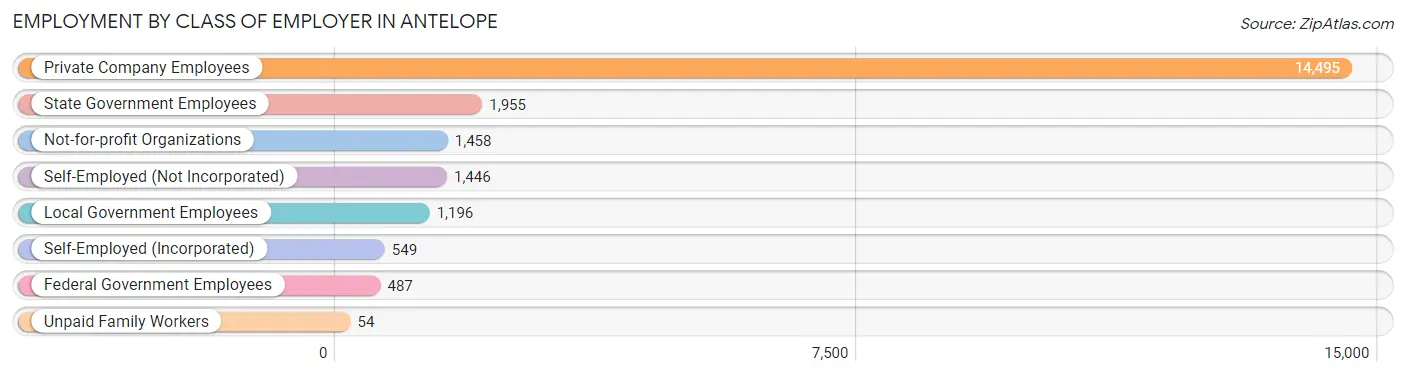
| Employer Class | # Employees | % Employees |
| Private Company Employees | 14,495 | 67.0% |
| Self-Employed (Incorporated) | 549 | 2.5% |
| Self-Employed (Not Incorporated) | 1,446 | 6.7% |
| Not-for-profit Organizations | 1,458 | 6.7% |
| Local Government Employees | 1,196 | 5.5% |
| State Government Employees | 1,955 | 9.0% |
| Federal Government Employees | 487 | 2.2% |
| Unpaid Family Workers | 54 | 0.3% |
| Total | 21,640 | 100.0% |
Employment Status by Age in Antelope
According to the labor force statistics for Antelope, out of the total population over 16 years of age (36,663), 64.1% or 23,501 individuals are in the labor force, with 6.8% or 1,598 of them unemployed. The age group with the highest labor force participation rate is 45 to 54 years, with 80.3% or 4,481 individuals in the labor force. Within the labor force, the 25 to 29 years age range has the highest percentage of unemployed individuals, with 19.3% or 572 of them being unemployed.
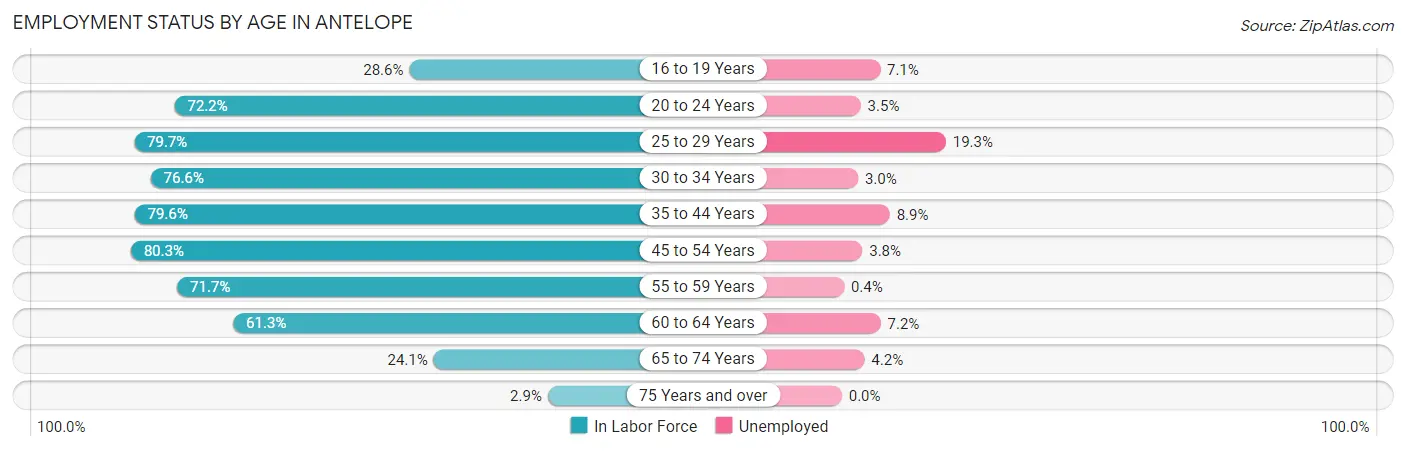
| Age Bracket | In Labor Force | Unemployed |
| 16 to 19 Years | 787 (28.6%) | 56 (7.1%) |
| 20 to 24 Years | 2,096 (72.2%) | 73 (3.5%) |
| 25 to 29 Years | 2,962 (79.7%) | 572 (19.3%) |
| 30 to 34 Years | 2,270 (76.6%) | 68 (3.0%) |
| 35 to 44 Years | 5,476 (79.6%) | 487 (8.9%) |
| 45 to 54 Years | 4,481 (80.3%) | 170 (3.8%) |
| 55 to 59 Years | 2,633 (71.7%) | 11 (0.4%) |
| 60 to 64 Years | 1,887 (61.3%) | 136 (7.2%) |
| 65 to 74 Years | 864 (24.1%) | 36 (4.2%) |
| 75 Years and over | 44 (2.9%) | 0 (0.0%) |
| Total | 23,501 (64.1%) | 1,598 (6.8%) |
Employment Status by Educational Attainment in Antelope
According to labor force statistics for Antelope, 76.1% of individuals (19,703) out of the total population between 25 and 64 years of age (25,891) are in the labor force, with 7.3% or 1,438 of them being unemployed. The group with the highest labor force participation rate are those with the educational attainment of bachelor's degree or higher, with 83.0% or 4,730 individuals in the labor force. Within the labor force, individuals with high school diploma education have the highest percentage of unemployment, with 13.2% or 773 of them being unemployed.
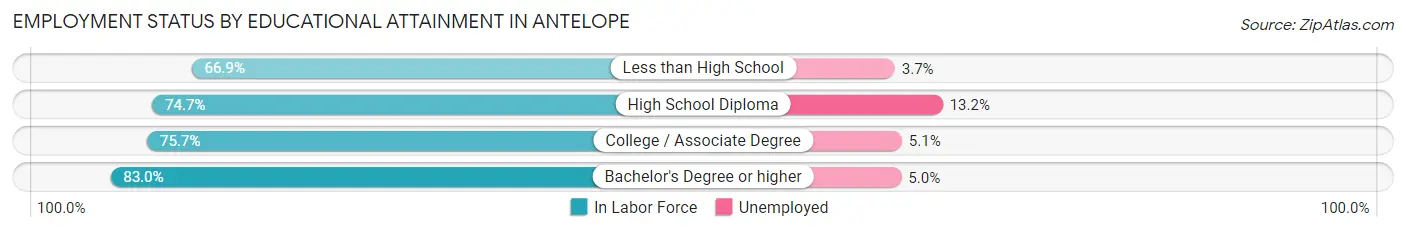
| Educational Attainment | In Labor Force | Unemployed |
| Less than High School | 1,740 (66.9%) | 96 (3.7%) |
| High School Diploma | 5,858 (74.7%) | 1,035 (13.2%) |
| College / Associate Degree | 7,380 (75.7%) | 497 (5.1%) |
| Bachelor's Degree or higher | 4,730 (83.0%) | 285 (5.0%) |
| Total | 19,703 (76.1%) | 1,890 (7.3%) |
Employment Occupations by Sex in Antelope
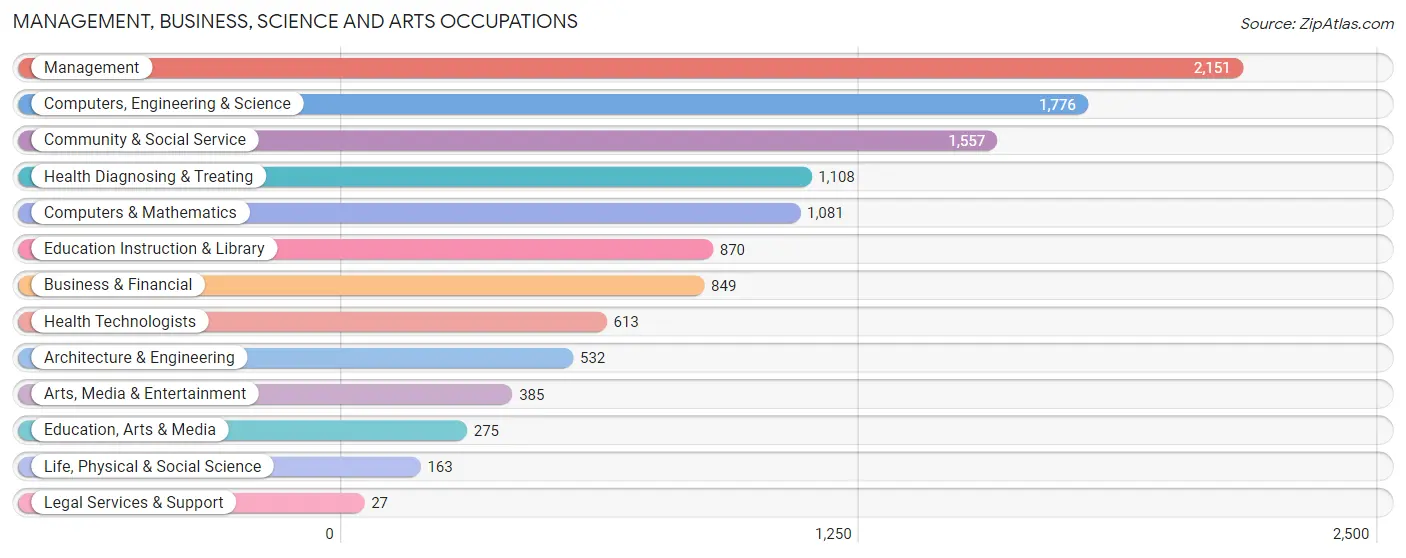
Management, Business, Science and Arts Occupations
The most common Management, Business, Science and Arts occupations in Antelope are Management (2,151 | 9.8%), Computers, Engineering & Science (1,776 | 8.1%), Community & Social Service (1,557 | 7.1%), Health Diagnosing & Treating (1,108 | 5.1%), and Computers & Mathematics (1,081 | 4.9%).
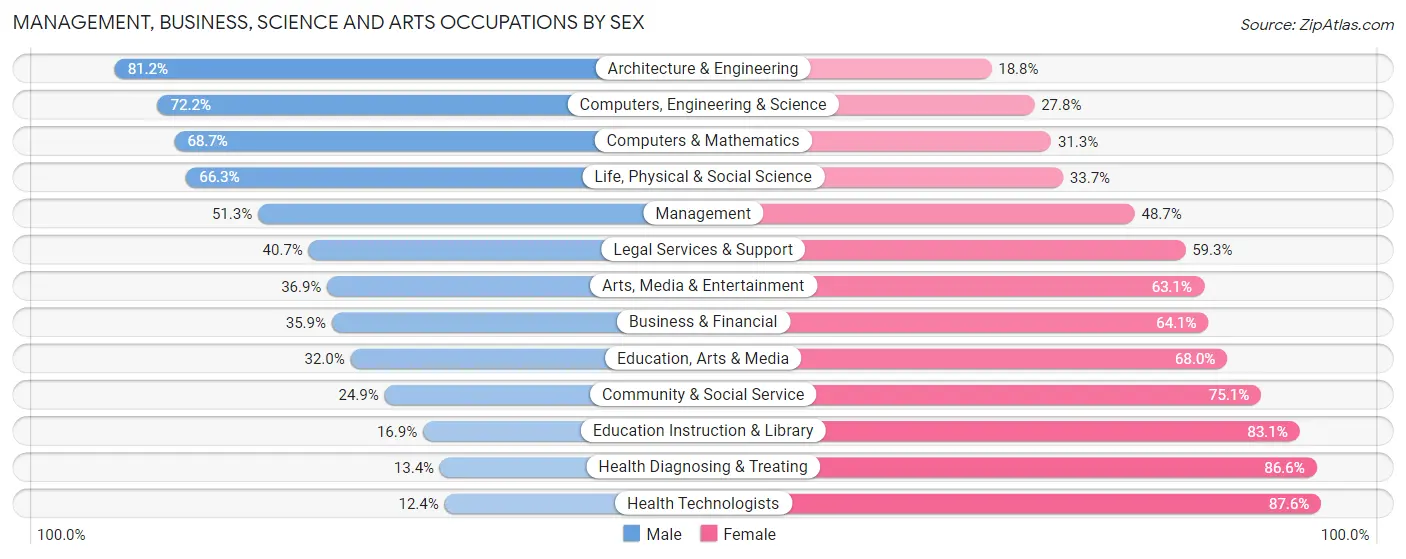
Management, Business, Science and Arts Occupations by Sex
Within the Management, Business, Science and Arts occupations in Antelope, the most male-oriented occupations are Architecture & Engineering (81.2%), Computers, Engineering & Science (72.2%), and Computers & Mathematics (68.7%), while the most female-oriented occupations are Health Technologists (87.6%), Health Diagnosing & Treating (86.6%), and Education Instruction & Library (83.1%).
| Occupation | Male | Female |
| Management | 1,104 (51.3%) | 1,047 (48.7%) |
| Business & Financial | 305 (35.9%) | 544 (64.1%) |
| Computers, Engineering & Science | 1,283 (72.2%) | 493 (27.8%) |
| Computers & Mathematics | 743 (68.7%) | 338 (31.3%) |
| Architecture & Engineering | 432 (81.2%) | 100 (18.8%) |
| Life, Physical & Social Science | 108 (66.3%) | 55 (33.7%) |
| Community & Social Service | 388 (24.9%) | 1,169 (75.1%) |
| Education, Arts & Media | 88 (32.0%) | 187 (68.0%) |
| Legal Services & Support | 11 (40.7%) | 16 (59.3%) |
| Education Instruction & Library | 147 (16.9%) | 723 (83.1%) |
| Arts, Media & Entertainment | 142 (36.9%) | 243 (63.1%) |
| Health Diagnosing & Treating | 148 (13.4%) | 960 (86.6%) |
| Health Technologists | 76 (12.4%) | 537 (87.6%) |
| Total (Category) | 3,228 (43.4%) | 4,213 (56.6%) |
| Total (Overall) | 11,317 (51.7%) | 10,557 (48.3%) |
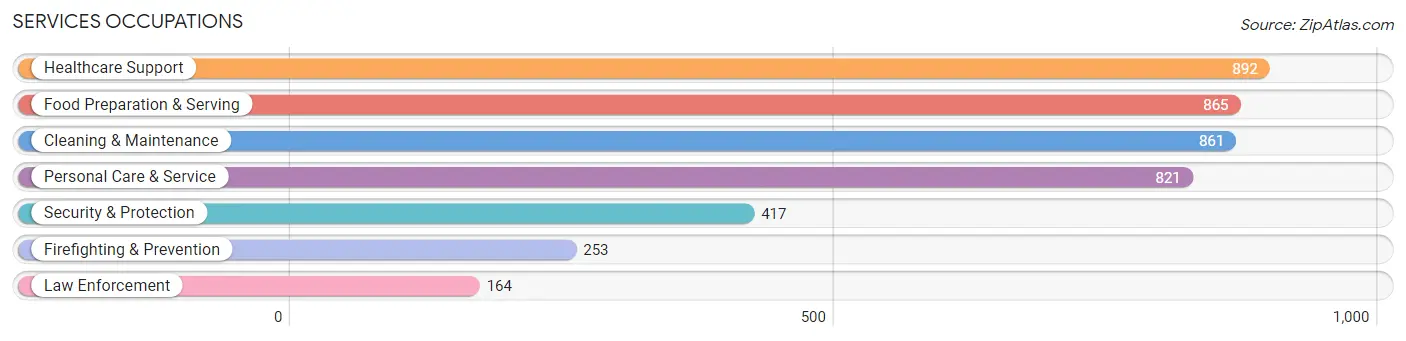
Services Occupations
The most common Services occupations in Antelope are Healthcare Support (892 | 4.1%), Food Preparation & Serving (865 | 4.0%), Cleaning & Maintenance (861 | 3.9%), Personal Care & Service (821 | 3.7%), and Security & Protection (417 | 1.9%).
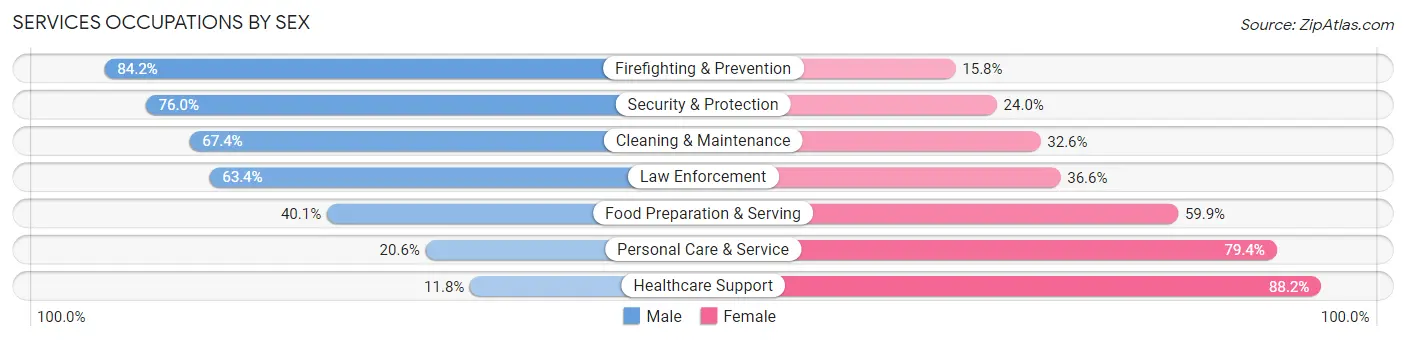
Services Occupations by Sex
Within the Services occupations in Antelope, the most male-oriented occupations are Firefighting & Prevention (84.2%), Security & Protection (76.0%), and Cleaning & Maintenance (67.4%), while the most female-oriented occupations are Healthcare Support (88.2%), Personal Care & Service (79.4%), and Food Preparation & Serving (59.9%).
| Occupation | Male | Female |
| Healthcare Support | 105 (11.8%) | 787 (88.2%) |
| Security & Protection | 317 (76.0%) | 100 (24.0%) |
| Firefighting & Prevention | 213 (84.2%) | 40 (15.8%) |
| Law Enforcement | 104 (63.4%) | 60 (36.6%) |
| Food Preparation & Serving | 347 (40.1%) | 518 (59.9%) |
| Cleaning & Maintenance | 580 (67.4%) | 281 (32.6%) |
| Personal Care & Service | 169 (20.6%) | 652 (79.4%) |
| Total (Category) | 1,518 (39.4%) | 2,338 (60.6%) |
| Total (Overall) | 11,317 (51.7%) | 10,557 (48.3%) |
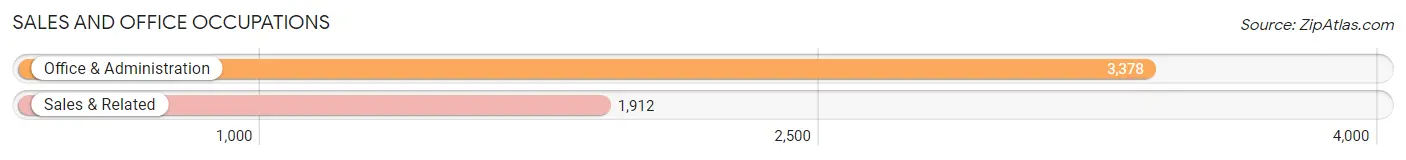
Sales and Office Occupations
The most common Sales and Office occupations in Antelope are Office & Administration (3,378 | 15.4%), and Sales & Related (1,912 | 8.7%).
Sales and Office Occupations by Sex
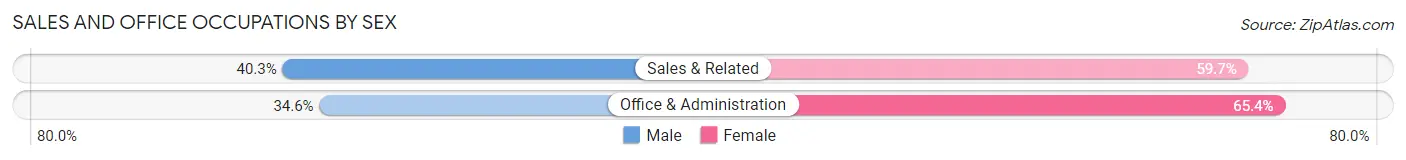
| Occupation | Male | Female |
| Sales & Related | 771 (40.3%) | 1,141 (59.7%) |
| Office & Administration | 1,170 (34.6%) | 2,208 (65.4%) |
| Total (Category) | 1,941 (36.7%) | 3,349 (63.3%) |
| Total (Overall) | 11,317 (51.7%) | 10,557 (48.3%) |
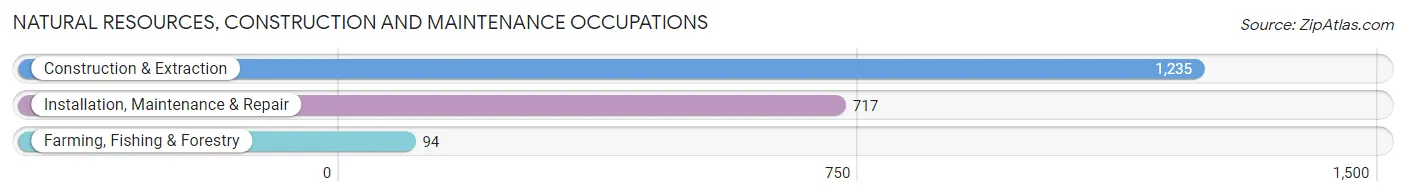
Natural Resources, Construction and Maintenance Occupations
The most common Natural Resources, Construction and Maintenance occupations in Antelope are Construction & Extraction (1,235 | 5.7%), Installation, Maintenance & Repair (717 | 3.3%), and Farming, Fishing & Forestry (94 | 0.4%).
Natural Resources, Construction and Maintenance Occupations by Sex
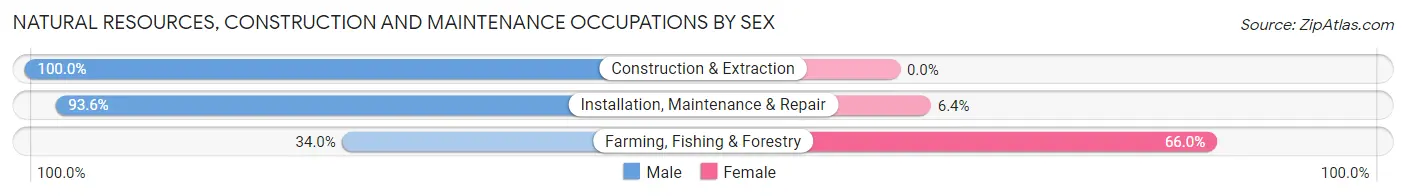
| Occupation | Male | Female |
| Farming, Fishing & Forestry | 32 (34.0%) | 62 (66.0%) |
| Construction & Extraction | 1,235 (100.0%) | 0 (0.0%) |
| Installation, Maintenance & Repair | 671 (93.6%) | 46 (6.4%) |
| Total (Category) | 1,938 (94.7%) | 108 (5.3%) |
| Total (Overall) | 11,317 (51.7%) | 10,557 (48.3%) |
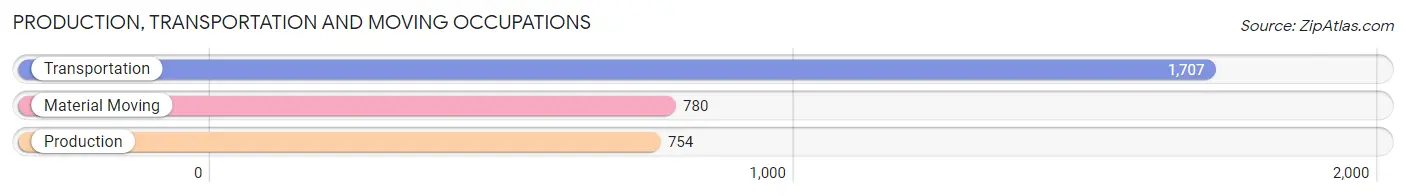
Production, Transportation and Moving Occupations
The most common Production, Transportation and Moving occupations in Antelope are Transportation (1,707 | 7.8%), Material Moving (780 | 3.6%), and Production (754 | 3.5%).
Production, Transportation and Moving Occupations by Sex
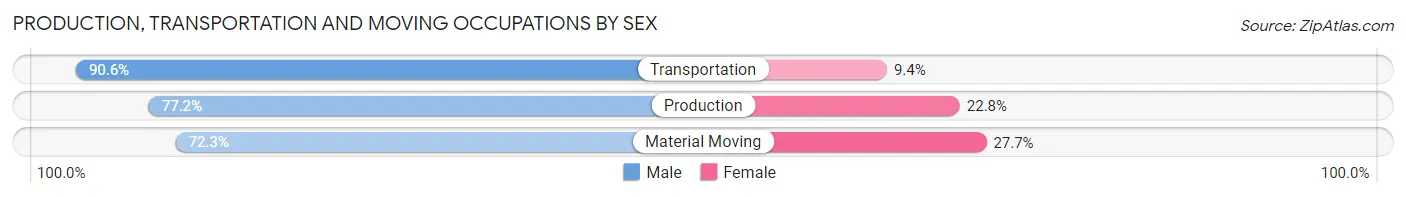
| Occupation | Male | Female |
| Production | 582 (77.2%) | 172 (22.8%) |
| Transportation | 1,546 (90.6%) | 161 (9.4%) |
| Material Moving | 564 (72.3%) | 216 (27.7%) |
| Total (Category) | 2,692 (83.1%) | 549 (16.9%) |
| Total (Overall) | 11,317 (51.7%) | 10,557 (48.3%) |
Employment Industries by Sex in Antelope
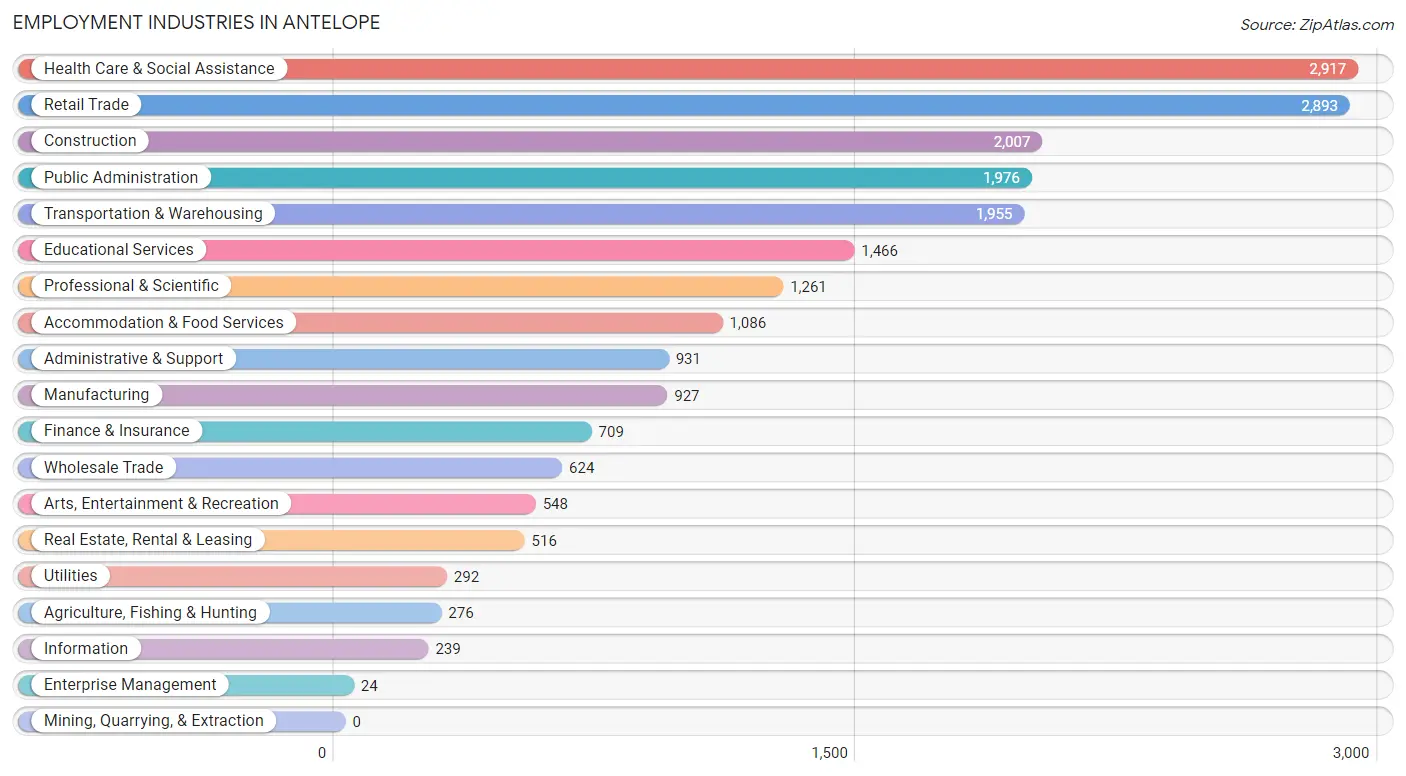
Employment Industries in Antelope
The major employment industries in Antelope include Health Care & Social Assistance (2,917 | 13.3%), Retail Trade (2,893 | 13.2%), Construction (2,007 | 9.2%), Public Administration (1,976 | 9.0%), and Transportation & Warehousing (1,955 | 8.9%).
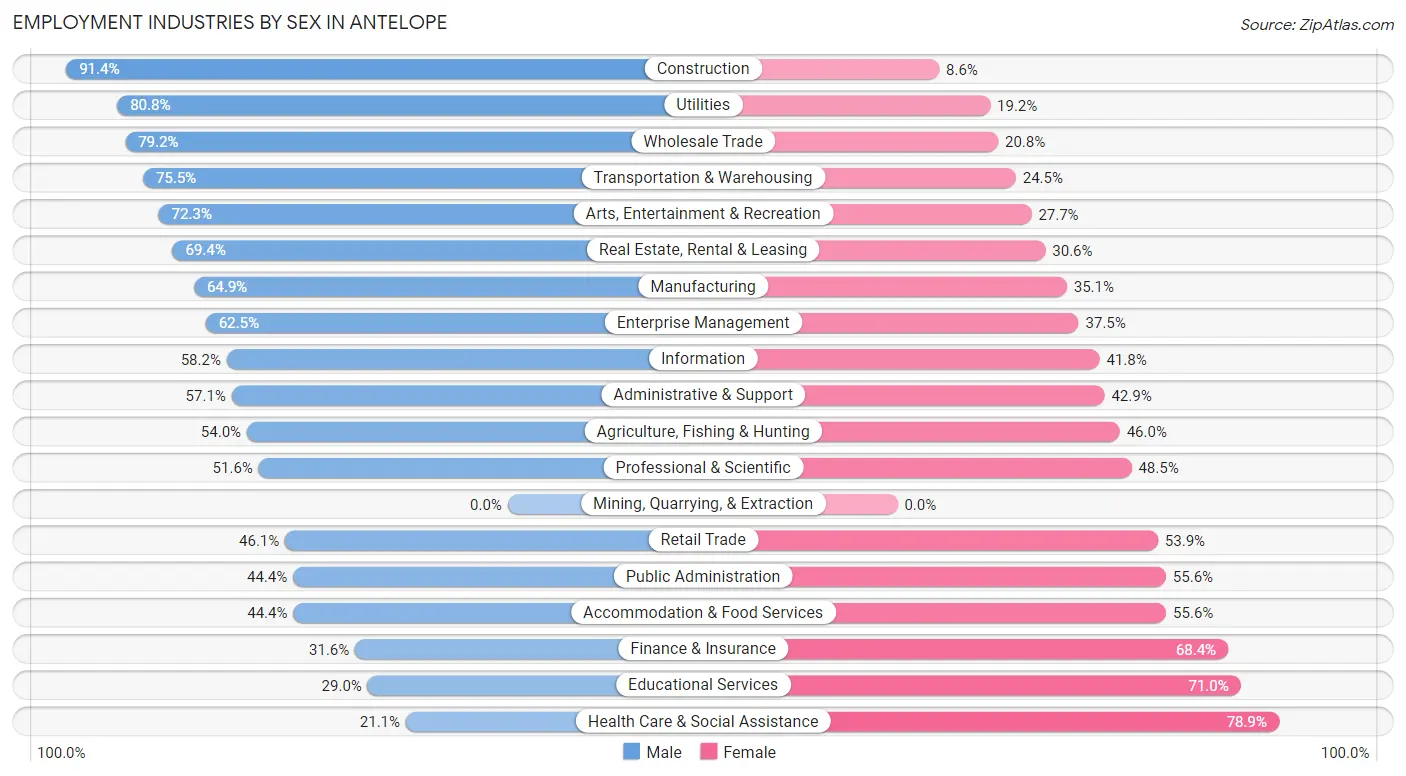
Employment Industries by Sex in Antelope
The Antelope industries that see more men than women are Construction (91.4%), Utilities (80.8%), and Wholesale Trade (79.2%), whereas the industries that tend to have a higher number of women are Health Care & Social Assistance (78.9%), Educational Services (71.0%), and Finance & Insurance (68.4%).
| Industry | Male | Female |
| Agriculture, Fishing & Hunting | 149 (54.0%) | 127 (46.0%) |
| Mining, Quarrying, & Extraction | 0 (0.0%) | 0 (0.0%) |
| Construction | 1,834 (91.4%) | 173 (8.6%) |
| Manufacturing | 602 (64.9%) | 325 (35.1%) |
| Wholesale Trade | 494 (79.2%) | 130 (20.8%) |
| Retail Trade | 1,333 (46.1%) | 1,560 (53.9%) |
| Transportation & Warehousing | 1,476 (75.5%) | 479 (24.5%) |
| Utilities | 236 (80.8%) | 56 (19.2%) |
| Information | 139 (58.2%) | 100 (41.8%) |
| Finance & Insurance | 224 (31.6%) | 485 (68.4%) |
| Real Estate, Rental & Leasing | 358 (69.4%) | 158 (30.6%) |
| Professional & Scientific | 650 (51.5%) | 611 (48.4%) |
| Enterprise Management | 15 (62.5%) | 9 (37.5%) |
| Administrative & Support | 532 (57.1%) | 399 (42.9%) |
| Educational Services | 425 (29.0%) | 1,041 (71.0%) |
| Health Care & Social Assistance | 615 (21.1%) | 2,302 (78.9%) |
| Arts, Entertainment & Recreation | 396 (72.3%) | 152 (27.7%) |
| Accommodation & Food Services | 482 (44.4%) | 604 (55.6%) |
| Public Administration | 878 (44.4%) | 1,098 (55.6%) |
| Total | 11,317 (51.7%) | 10,557 (48.3%) |
Education in Antelope
School Enrollment in Antelope
The most common levels of schooling among the 12,035 students in Antelope are high school (2,806 | 23.3%), middle school (2,727 | 22.7%), and elementary school (2,695 | 22.4%).
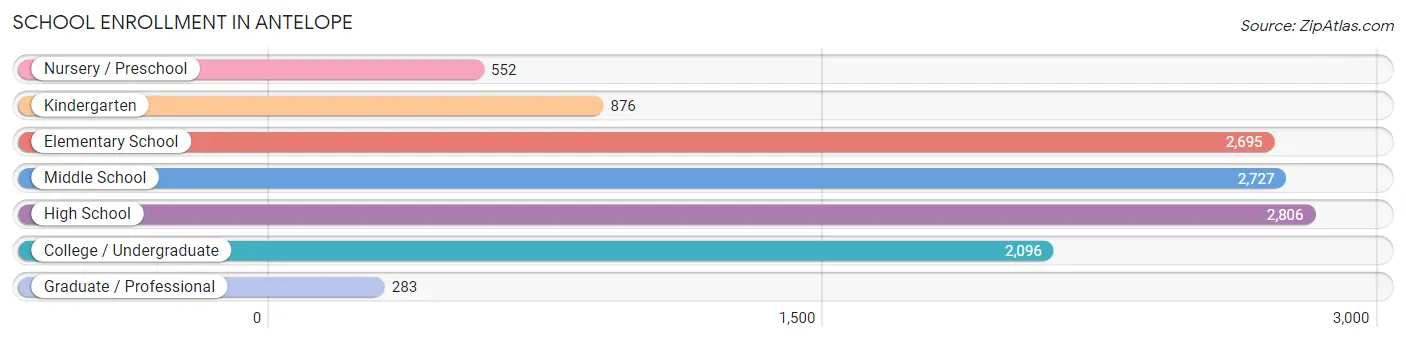
| School Level | # Students | % Students |
| Nursery / Preschool | 552 | 4.6% |
| Kindergarten | 876 | 7.3% |
| Elementary School | 2,695 | 22.4% |
| Middle School | 2,727 | 22.7% |
| High School | 2,806 | 23.3% |
| College / Undergraduate | 2,096 | 17.4% |
| Graduate / Professional | 283 | 2.4% |
| Total | 12,035 | 100.0% |
School Enrollment by Age by Funding Source in Antelope
Out of a total of 12,035 students who are enrolled in schools in Antelope, 1,468 (12.2%) attend a private institution, while the remaining 10,567 (87.8%) are enrolled in public schools. The age group of 25 to 34 year olds has the highest likelihood of being enrolled in private schools, with 143 (33.0% in the age bracket) enrolled. Conversely, the age group of 10 to 14 year olds has the lowest likelihood of being enrolled in a private school, with 3,208 (92.7% in the age bracket) attending a public institution.
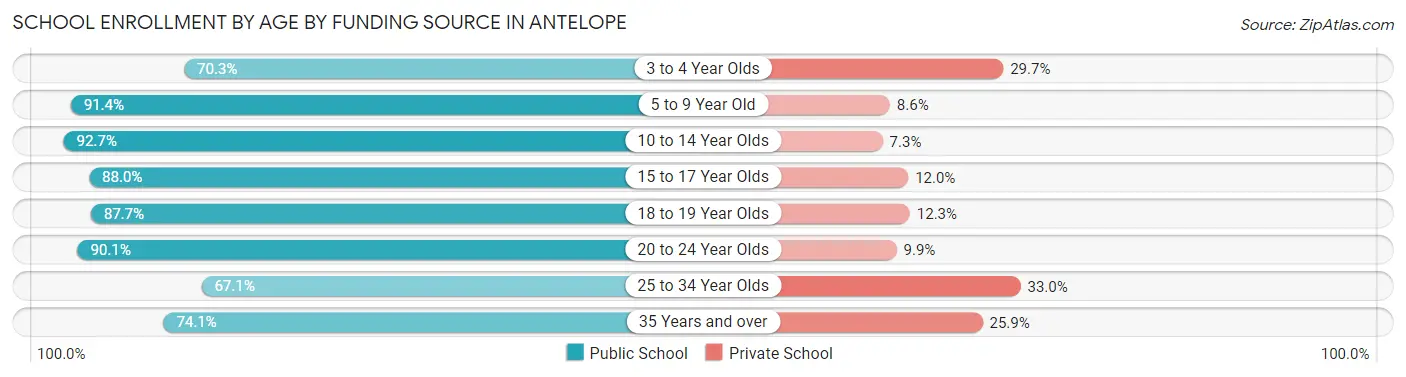
| Age Bracket | Public School | Private School |
| 3 to 4 Year Olds | 454 (70.3%) | 192 (29.7%) |
| 5 to 9 Year Old | 2,896 (91.4%) | 273 (8.6%) |
| 10 to 14 Year Olds | 3,208 (92.7%) | 251 (7.3%) |
| 15 to 17 Year Olds | 1,851 (88.0%) | 253 (12.0%) |
| 18 to 19 Year Olds | 640 (87.7%) | 90 (12.3%) |
| 20 to 24 Year Olds | 649 (90.1%) | 71 (9.9%) |
| 25 to 34 Year Olds | 291 (67.0%) | 143 (33.0%) |
| 35 Years and over | 573 (74.1%) | 200 (25.9%) |
| Total | 10,567 (87.8%) | 1,468 (12.2%) |
Educational Attainment by Field of Study in Antelope
Business (792 | 11.4%), science & technology (784 | 11.3%), engineering (763 | 11.0%), arts & humanities (559 | 8.1%), and bio, nature & agricultural (553 | 8.0%) are the most common fields of study among 6,930 individuals in Antelope who have obtained a bachelor's degree or higher.
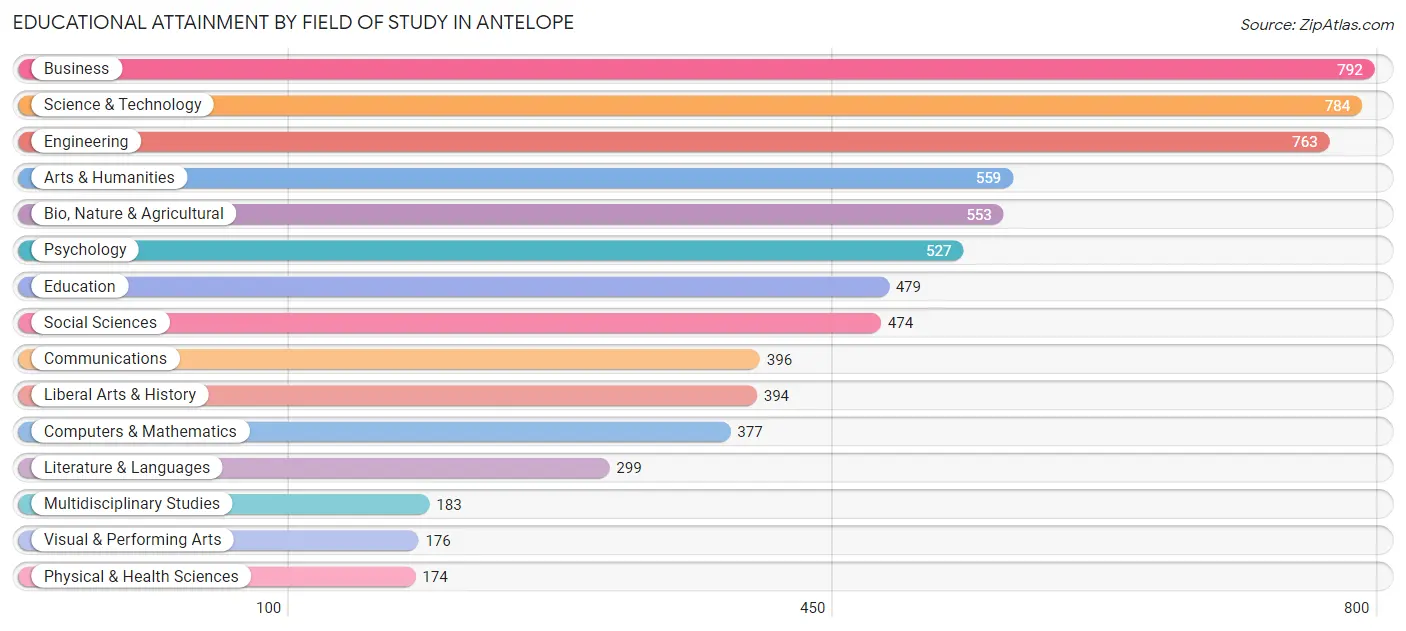
| Field of Study | # Graduates | % Graduates |
| Computers & Mathematics | 377 | 5.4% |
| Bio, Nature & Agricultural | 553 | 8.0% |
| Physical & Health Sciences | 174 | 2.5% |
| Psychology | 527 | 7.6% |
| Social Sciences | 474 | 6.8% |
| Engineering | 763 | 11.0% |
| Multidisciplinary Studies | 183 | 2.6% |
| Science & Technology | 784 | 11.3% |
| Business | 792 | 11.4% |
| Education | 479 | 6.9% |
| Literature & Languages | 299 | 4.3% |
| Liberal Arts & History | 394 | 5.7% |
| Visual & Performing Arts | 176 | 2.5% |
| Communications | 396 | 5.7% |
| Arts & Humanities | 559 | 8.1% |
| Total | 6,930 | 100.0% |
Transportation & Commute in Antelope
Vehicle Availability by Sex in Antelope
The most prevalent vehicle ownership categories in Antelope are males with 2 vehicles (5,196, accounting for 46.3%) and females with 2 vehicles (4,217, making up 50.0%).
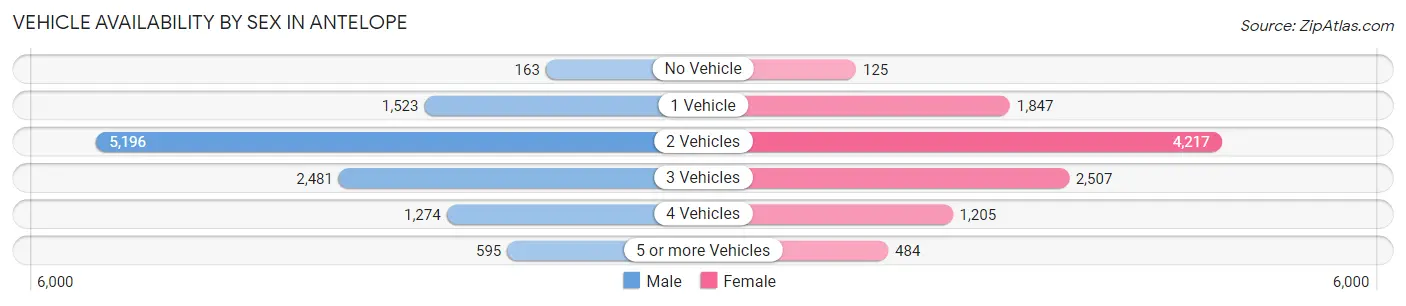
| Vehicles Available | Male | Female |
| No Vehicle | 163 (1.5%) | 125 (1.2%) |
| 1 Vehicle | 1,523 (13.6%) | 1,847 (17.8%) |
| 2 Vehicles | 5,196 (46.3%) | 4,217 (40.6%) |
| 3 Vehicles | 2,481 (22.1%) | 2,507 (24.1%) |
| 4 Vehicles | 1,274 (11.3%) | 1,205 (11.6%) |
| 5 or more Vehicles | 595 (5.3%) | 484 (4.7%) |
| Total | 11,232 (100.0%) | 10,385 (100.0%) |
Commute Time in Antelope
The most frequently occuring commute durations in Antelope are 30 to 34 minutes (4,119 commuters, 21.6%), 20 to 24 minutes (3,645 commuters, 19.1%), and 15 to 19 minutes (2,249 commuters, 11.8%).
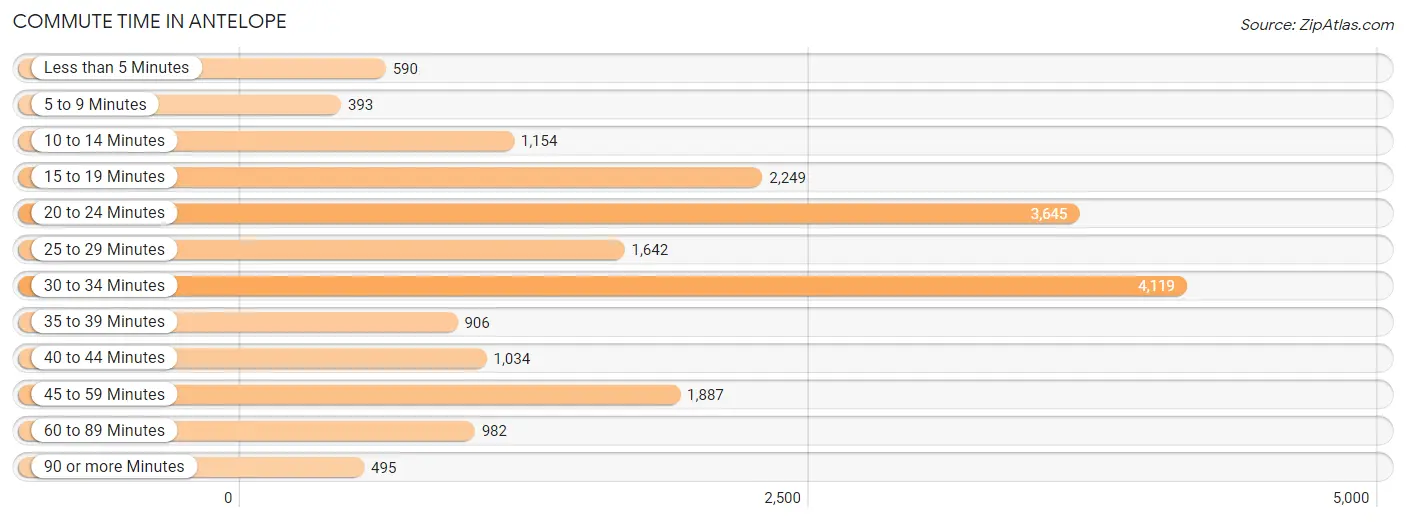
| Commute Time | # Commuters | % Commuters |
| Less than 5 Minutes | 590 | 3.1% |
| 5 to 9 Minutes | 393 | 2.1% |
| 10 to 14 Minutes | 1,154 | 6.0% |
| 15 to 19 Minutes | 2,249 | 11.8% |
| 20 to 24 Minutes | 3,645 | 19.1% |
| 25 to 29 Minutes | 1,642 | 8.6% |
| 30 to 34 Minutes | 4,119 | 21.6% |
| 35 to 39 Minutes | 906 | 4.7% |
| 40 to 44 Minutes | 1,034 | 5.4% |
| 45 to 59 Minutes | 1,887 | 9.9% |
| 60 to 89 Minutes | 982 | 5.1% |
| 90 or more Minutes | 495 | 2.6% |
Commute Time by Sex in Antelope
The most common commute times in Antelope are 30 to 34 minutes (2,204 commuters, 22.1%) for males and 30 to 34 minutes (1,915 commuters, 21.0%) for females.
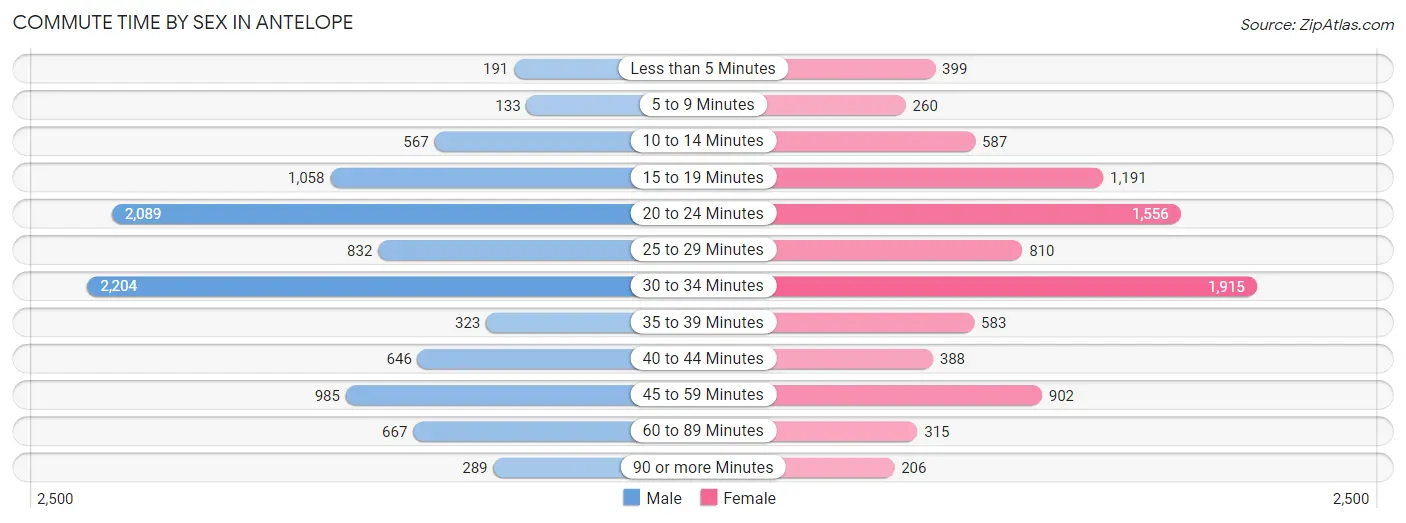
| Commute Time | Male | Female |
| Less than 5 Minutes | 191 (1.9%) | 399 (4.4%) |
| 5 to 9 Minutes | 133 (1.3%) | 260 (2.9%) |
| 10 to 14 Minutes | 567 (5.7%) | 587 (6.4%) |
| 15 to 19 Minutes | 1,058 (10.6%) | 1,191 (13.1%) |
| 20 to 24 Minutes | 2,089 (20.9%) | 1,556 (17.1%) |
| 25 to 29 Minutes | 832 (8.3%) | 810 (8.9%) |
| 30 to 34 Minutes | 2,204 (22.1%) | 1,915 (21.0%) |
| 35 to 39 Minutes | 323 (3.2%) | 583 (6.4%) |
| 40 to 44 Minutes | 646 (6.5%) | 388 (4.3%) |
| 45 to 59 Minutes | 985 (9.9%) | 902 (9.9%) |
| 60 to 89 Minutes | 667 (6.7%) | 315 (3.5%) |
| 90 or more Minutes | 289 (2.9%) | 206 (2.3%) |
Time of Departure to Work by Sex in Antelope
The most frequent times of departure to work in Antelope are 12:00 AM to 4:59 AM (1,351, 13.5%) for males and 7:00 AM to 7:29 AM (1,315, 14.4%) for females.
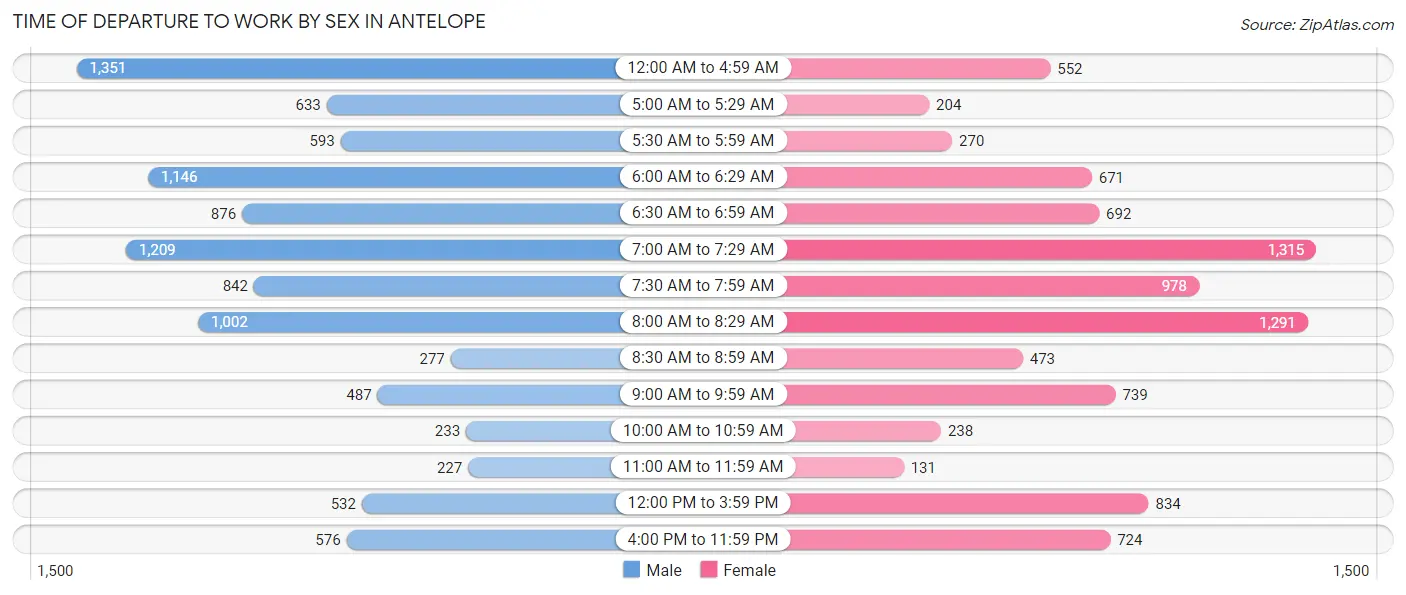
| Time of Departure | Male | Female |
| 12:00 AM to 4:59 AM | 1,351 (13.5%) | 552 (6.1%) |
| 5:00 AM to 5:29 AM | 633 (6.3%) | 204 (2.2%) |
| 5:30 AM to 5:59 AM | 593 (5.9%) | 270 (3.0%) |
| 6:00 AM to 6:29 AM | 1,146 (11.5%) | 671 (7.4%) |
| 6:30 AM to 6:59 AM | 876 (8.8%) | 692 (7.6%) |
| 7:00 AM to 7:29 AM | 1,209 (12.1%) | 1,315 (14.4%) |
| 7:30 AM to 7:59 AM | 842 (8.4%) | 978 (10.7%) |
| 8:00 AM to 8:29 AM | 1,002 (10.0%) | 1,291 (14.2%) |
| 8:30 AM to 8:59 AM | 277 (2.8%) | 473 (5.2%) |
| 9:00 AM to 9:59 AM | 487 (4.9%) | 739 (8.1%) |
| 10:00 AM to 10:59 AM | 233 (2.3%) | 238 (2.6%) |
| 11:00 AM to 11:59 AM | 227 (2.3%) | 131 (1.4%) |
| 12:00 PM to 3:59 PM | 532 (5.3%) | 834 (9.1%) |
| 4:00 PM to 11:59 PM | 576 (5.8%) | 724 (8.0%) |
| Total | 9,984 (100.0%) | 9,112 (100.0%) |
Housing Occupancy in Antelope
Occupancy by Ownership in Antelope
Of the total 15,146 dwellings in Antelope, owner-occupied units account for 10,147 (67.0%), while renter-occupied units make up 4,999 (33.0%).
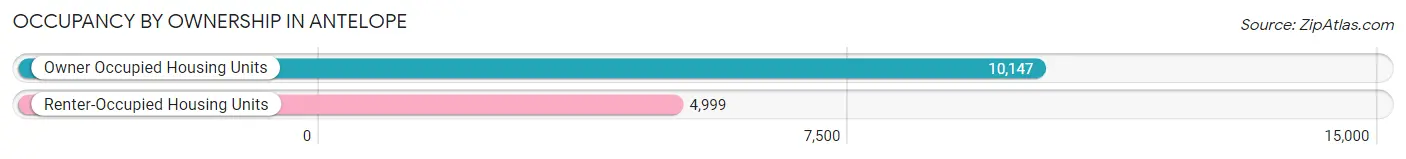
| Occupancy | # Housing Units | % Housing Units |
| Owner Occupied Housing Units | 10,147 | 67.0% |
| Renter-Occupied Housing Units | 4,999 | 33.0% |
| Total Occupied Housing Units | 15,146 | 100.0% |
Occupancy by Household Size in Antelope
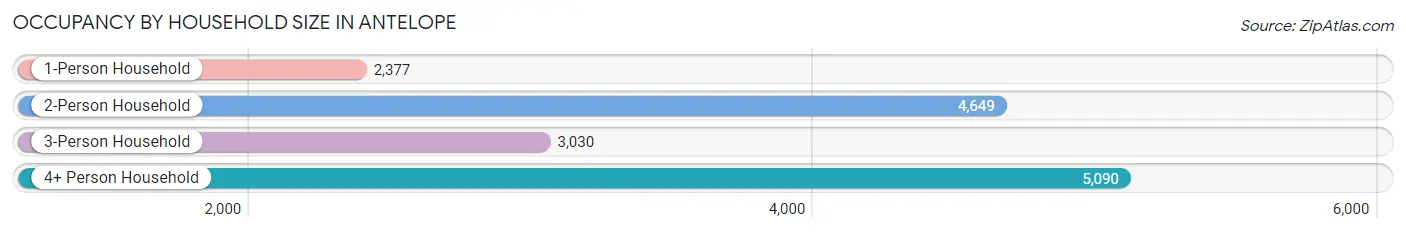
| Household Size | # Housing Units | % Housing Units |
| 1-Person Household | 2,377 | 15.7% |
| 2-Person Household | 4,649 | 30.7% |
| 3-Person Household | 3,030 | 20.0% |
| 4+ Person Household | 5,090 | 33.6% |
| Total Housing Units | 15,146 | 100.0% |
Occupancy by Ownership by Household Size in Antelope
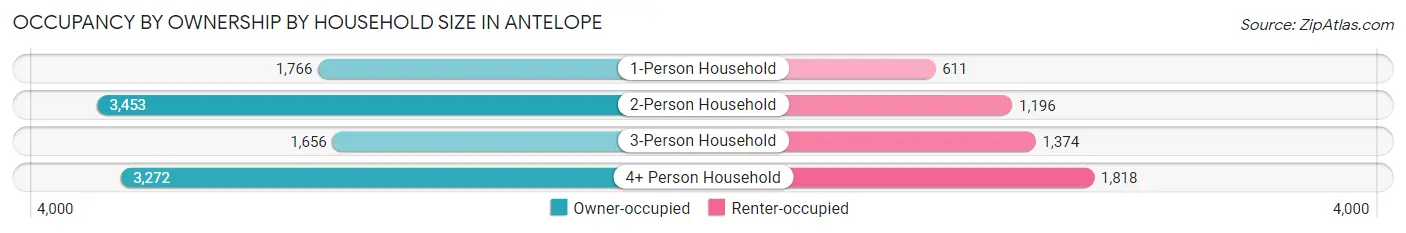
| Household Size | Owner-occupied | Renter-occupied |
| 1-Person Household | 1,766 (74.3%) | 611 (25.7%) |
| 2-Person Household | 3,453 (74.3%) | 1,196 (25.7%) |
| 3-Person Household | 1,656 (54.6%) | 1,374 (45.4%) |
| 4+ Person Household | 3,272 (64.3%) | 1,818 (35.7%) |
| Total Housing Units | 10,147 (67.0%) | 4,999 (33.0%) |
Occupancy by Educational Attainment in Antelope
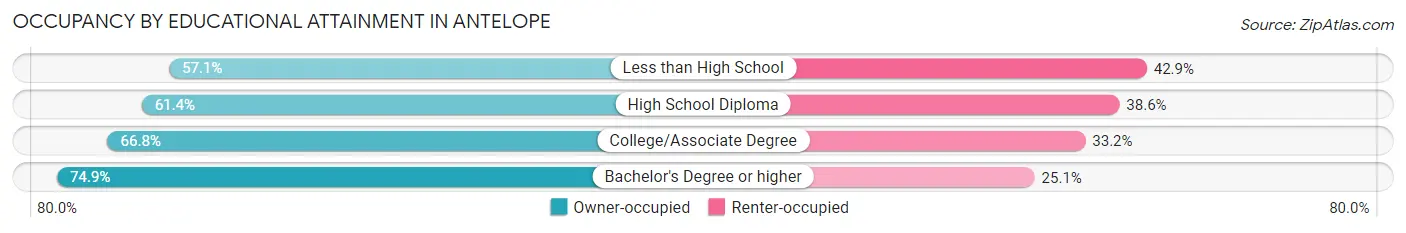
| Household Size | Owner-occupied | Renter-occupied |
| Less than High School | 492 (57.1%) | 370 (42.9%) |
| High School Diploma | 2,280 (61.4%) | 1,432 (38.6%) |
| College/Associate Degree | 4,483 (66.8%) | 2,226 (33.2%) |
| Bachelor's Degree or higher | 2,892 (74.9%) | 971 (25.1%) |
Occupancy by Age of Householder in Antelope
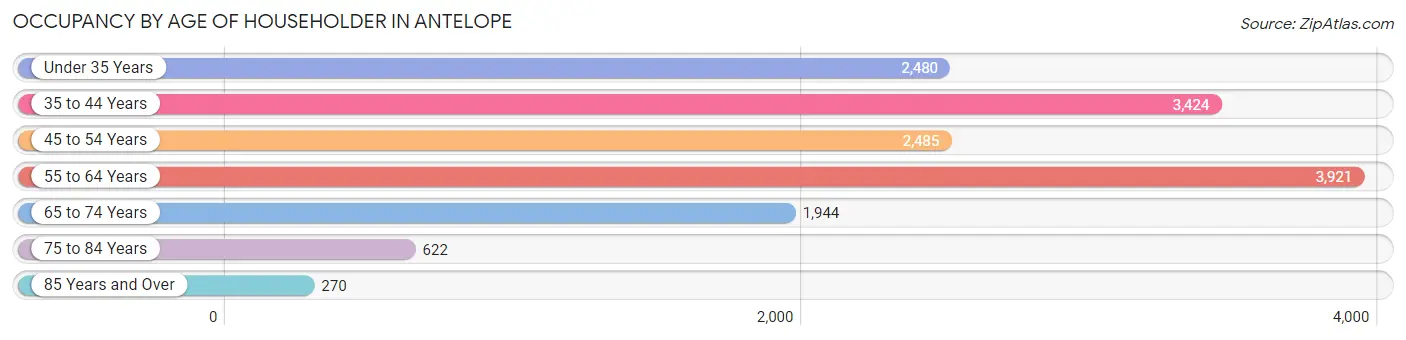
| Age Bracket | # Households | % Households |
| Under 35 Years | 2,480 | 16.4% |
| 35 to 44 Years | 3,424 | 22.6% |
| 45 to 54 Years | 2,485 | 16.4% |
| 55 to 64 Years | 3,921 | 25.9% |
| 65 to 74 Years | 1,944 | 12.8% |
| 75 to 84 Years | 622 | 4.1% |
| 85 Years and Over | 270 | 1.8% |
| Total | 15,146 | 100.0% |
Housing Finances in Antelope
Median Income by Occupancy in Antelope
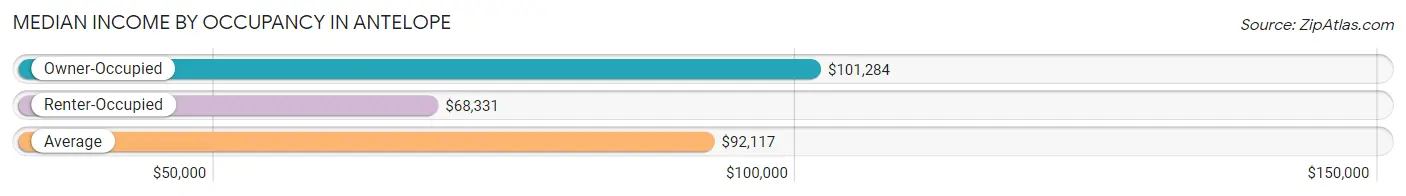
| Occupancy Type | # Households | Median Income |
| Owner-Occupied | 10,147 (67.0%) | $101,284 |
| Renter-Occupied | 4,999 (33.0%) | $68,331 |
| Average | 15,146 (100.0%) | $92,117 |
Occupancy by Householder Income Bracket in Antelope
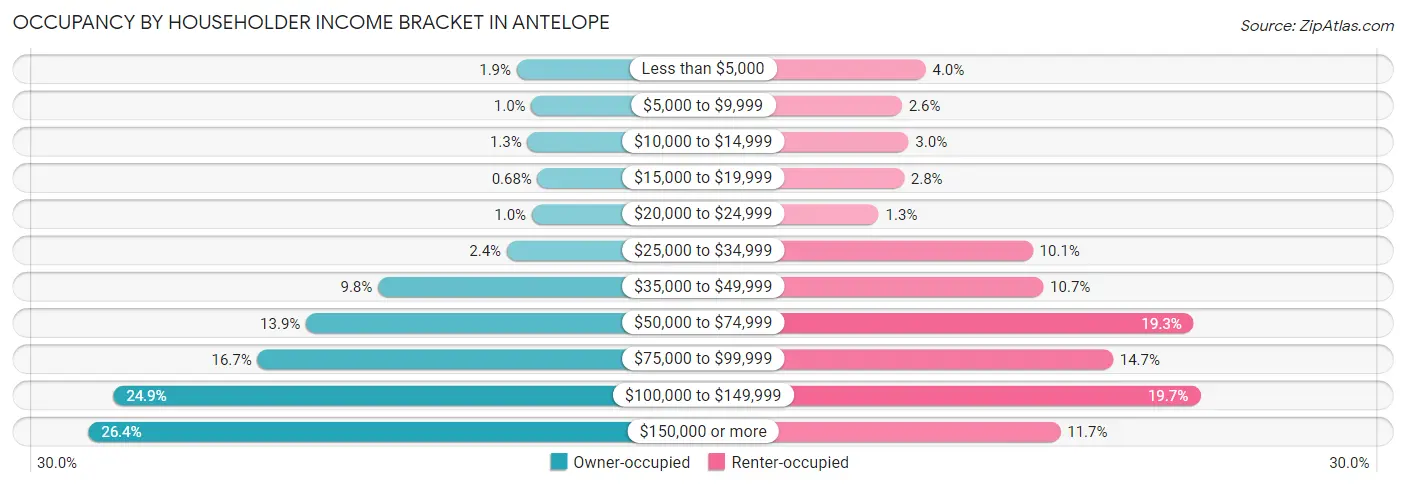
| Income Bracket | Owner-occupied | Renter-occupied |
| Less than $5,000 | 190 (1.9%) | 200 (4.0%) |
| $5,000 to $9,999 | 106 (1.0%) | 132 (2.6%) |
| $10,000 to $14,999 | 128 (1.3%) | 151 (3.0%) |
| $15,000 to $19,999 | 69 (0.7%) | 138 (2.8%) |
| $20,000 to $24,999 | 102 (1.0%) | 66 (1.3%) |
| $25,000 to $34,999 | 248 (2.4%) | 506 (10.1%) |
| $35,000 to $49,999 | 994 (9.8%) | 536 (10.7%) |
| $50,000 to $74,999 | 1,411 (13.9%) | 966 (19.3%) |
| $75,000 to $99,999 | 1,694 (16.7%) | 735 (14.7%) |
| $100,000 to $149,999 | 2,530 (24.9%) | 984 (19.7%) |
| $150,000 or more | 2,675 (26.4%) | 585 (11.7%) |
| Total | 10,147 (100.0%) | 4,999 (100.0%) |
Monthly Housing Cost Tiers in Antelope
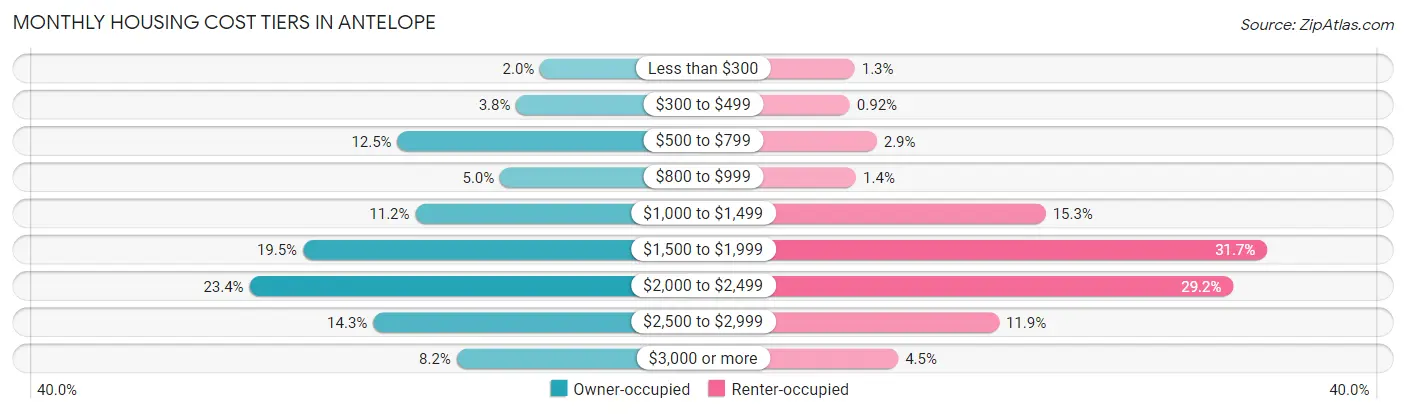
| Monthly Cost | Owner-occupied | Renter-occupied |
| Less than $300 | 206 (2.0%) | 64 (1.3%) |
| $300 to $499 | 385 (3.8%) | 46 (0.9%) |
| $500 to $799 | 1,272 (12.5%) | 145 (2.9%) |
| $800 to $999 | 505 (5.0%) | 69 (1.4%) |
| $1,000 to $1,499 | 1,138 (11.2%) | 767 (15.3%) |
| $1,500 to $1,999 | 1,979 (19.5%) | 1,582 (31.7%) |
| $2,000 to $2,499 | 2,378 (23.4%) | 1,457 (29.1%) |
| $2,500 to $2,999 | 1,454 (14.3%) | 595 (11.9%) |
| $3,000 or more | 830 (8.2%) | 224 (4.5%) |
| Total | 10,147 (100.0%) | 4,999 (100.0%) |
Physical Housing Characteristics in Antelope
Housing Structures in Antelope
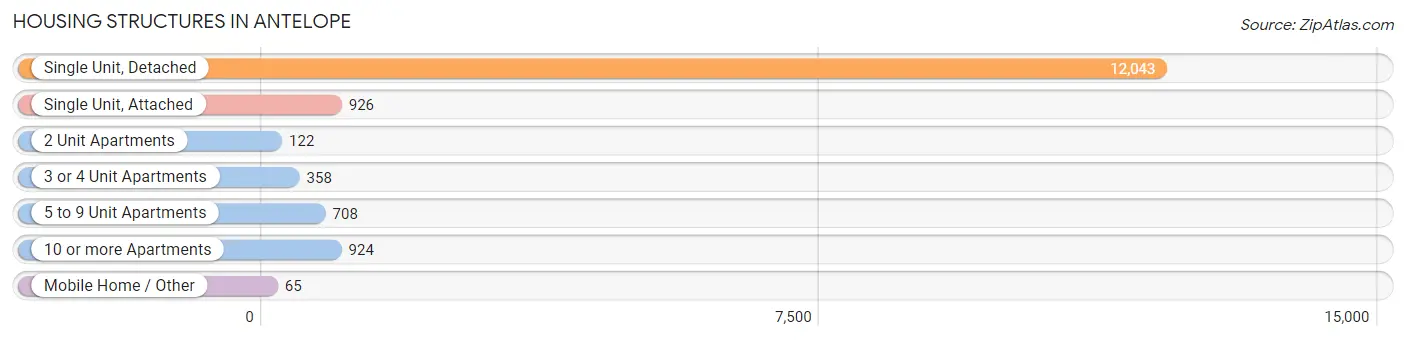
| Structure Type | # Housing Units | % Housing Units |
| Single Unit, Detached | 12,043 | 79.5% |
| Single Unit, Attached | 926 | 6.1% |
| 2 Unit Apartments | 122 | 0.8% |
| 3 or 4 Unit Apartments | 358 | 2.4% |
| 5 to 9 Unit Apartments | 708 | 4.7% |
| 10 or more Apartments | 924 | 6.1% |
| Mobile Home / Other | 65 | 0.4% |
| Total | 15,146 | 100.0% |
Housing Structures by Occupancy in Antelope
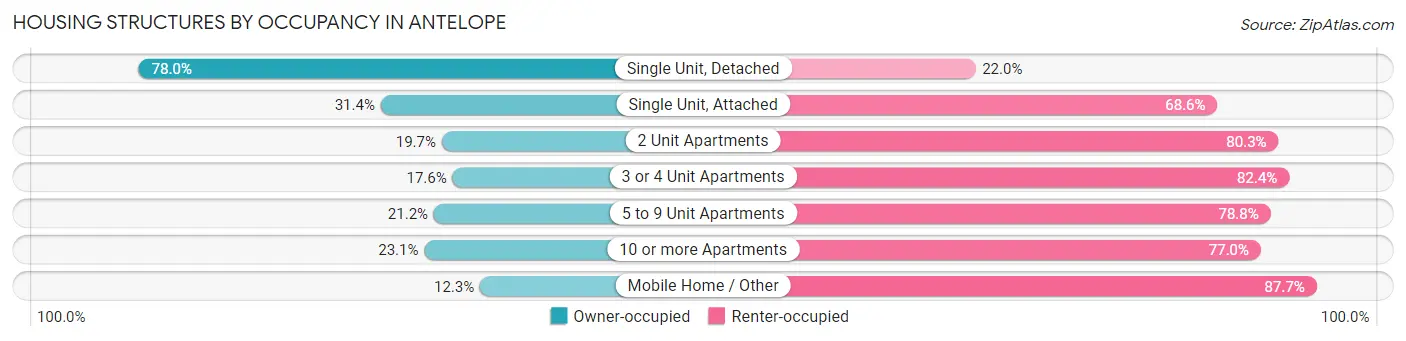
| Structure Type | Owner-occupied | Renter-occupied |
| Single Unit, Detached | 9,398 (78.0%) | 2,645 (22.0%) |
| Single Unit, Attached | 291 (31.4%) | 635 (68.6%) |
| 2 Unit Apartments | 24 (19.7%) | 98 (80.3%) |
| 3 or 4 Unit Apartments | 63 (17.6%) | 295 (82.4%) |
| 5 to 9 Unit Apartments | 150 (21.2%) | 558 (78.8%) |
| 10 or more Apartments | 213 (23.1%) | 711 (76.9%) |
| Mobile Home / Other | 8 (12.3%) | 57 (87.7%) |
| Total | 10,147 (67.0%) | 4,999 (33.0%) |
Housing Structures by Number of Rooms in Antelope
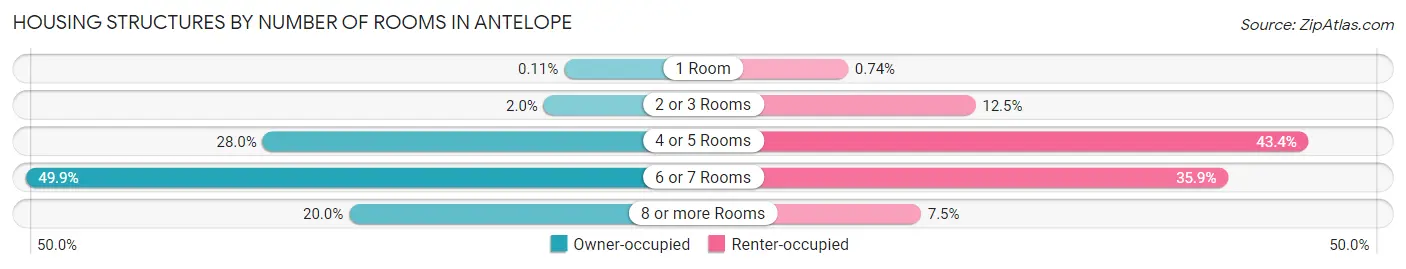
| Number of Rooms | Owner-occupied | Renter-occupied |
| 1 Room | 11 (0.1%) | 37 (0.7%) |
| 2 or 3 Rooms | 202 (2.0%) | 626 (12.5%) |
| 4 or 5 Rooms | 2,840 (28.0%) | 2,167 (43.3%) |
| 6 or 7 Rooms | 5,066 (49.9%) | 1,795 (35.9%) |
| 8 or more Rooms | 2,028 (20.0%) | 374 (7.5%) |
| Total | 10,147 (100.0%) | 4,999 (100.0%) |
Housing Structure by Heating Type in Antelope
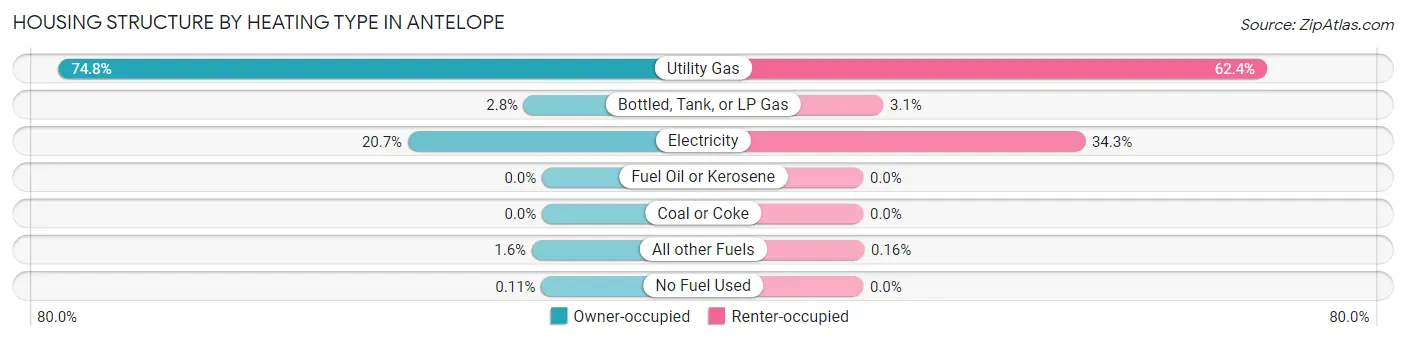
| Heating Type | Owner-occupied | Renter-occupied |
| Utility Gas | 7,588 (74.8%) | 3,121 (62.4%) |
| Bottled, Tank, or LP Gas | 285 (2.8%) | 155 (3.1%) |
| Electricity | 2,104 (20.7%) | 1,715 (34.3%) |
| Fuel Oil or Kerosene | 0 (0.0%) | 0 (0.0%) |
| Coal or Coke | 0 (0.0%) | 0 (0.0%) |
| All other Fuels | 159 (1.6%) | 8 (0.2%) |
| No Fuel Used | 11 (0.1%) | 0 (0.0%) |
| Total | 10,147 (100.0%) | 4,999 (100.0%) |
Household Vehicle Usage in Antelope
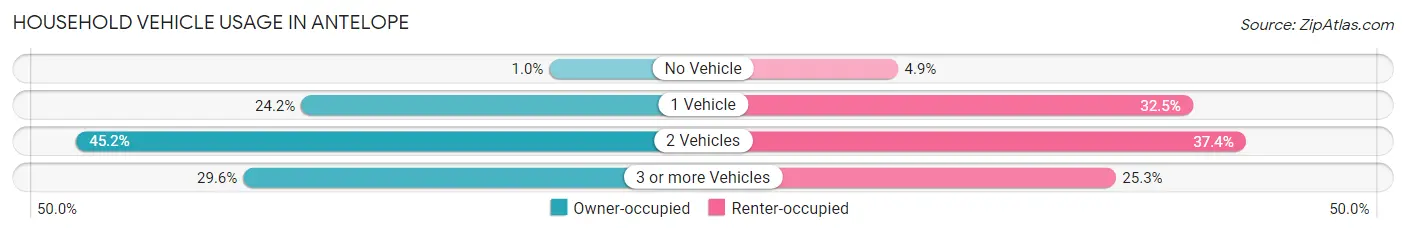
| Vehicles per Household | Owner-occupied | Renter-occupied |
| No Vehicle | 105 (1.0%) | 246 (4.9%) |
| 1 Vehicle | 2,455 (24.2%) | 1,622 (32.5%) |
| 2 Vehicles | 4,583 (45.2%) | 1,869 (37.4%) |
| 3 or more Vehicles | 3,004 (29.6%) | 1,262 (25.3%) |
| Total | 10,147 (100.0%) | 4,999 (100.0%) |
Real Estate & Mortgages in Antelope
Real Estate and Mortgage Overview in Antelope
| Characteristic | Without Mortgage | With Mortgage |
| Housing Units | 2,306 | 7,841 |
| Median Property Value | $401,600 | $440,600 |
| Median Household Income | $77,449 | $2,238 |
| Monthly Housing Costs | $638 | $809 |
| Real Estate Taxes | $3,045 | $15 |
Property Value by Mortgage Status in Antelope
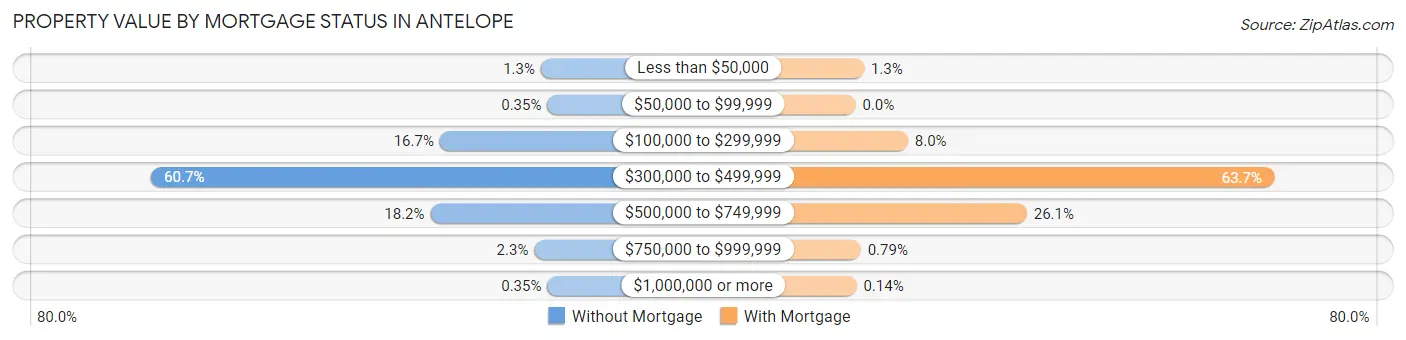
| Property Value | Without Mortgage | With Mortgage |
| Less than $50,000 | 31 (1.3%) | 100 (1.3%) |
| $50,000 to $99,999 | 8 (0.4%) | 0 (0.0%) |
| $100,000 to $299,999 | 386 (16.7%) | 625 (8.0%) |
| $300,000 to $499,999 | 1,400 (60.7%) | 4,997 (63.7%) |
| $500,000 to $749,999 | 419 (18.2%) | 2,046 (26.1%) |
| $750,000 to $999,999 | 54 (2.3%) | 62 (0.8%) |
| $1,000,000 or more | 8 (0.4%) | 11 (0.1%) |
| Total | 2,306 (100.0%) | 7,841 (100.0%) |
Household Income by Mortgage Status in Antelope
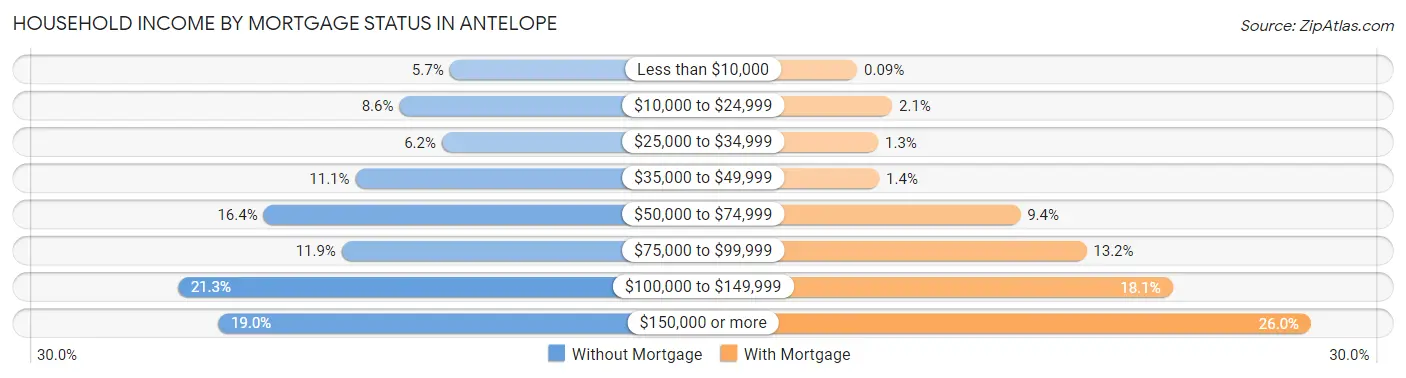
| Household Income | Without Mortgage | With Mortgage |
| Less than $10,000 | 132 (5.7%) | 7 (0.1%) |
| $10,000 to $24,999 | 198 (8.6%) | 164 (2.1%) |
| $25,000 to $34,999 | 142 (6.2%) | 101 (1.3%) |
| $35,000 to $49,999 | 256 (11.1%) | 106 (1.3%) |
| $50,000 to $74,999 | 377 (16.4%) | 738 (9.4%) |
| $75,000 to $99,999 | 274 (11.9%) | 1,034 (13.2%) |
| $100,000 to $149,999 | 490 (21.2%) | 1,420 (18.1%) |
| $150,000 or more | 437 (19.0%) | 2,040 (26.0%) |
| Total | 2,306 (100.0%) | 7,841 (100.0%) |
Property Value to Household Income Ratio in Antelope
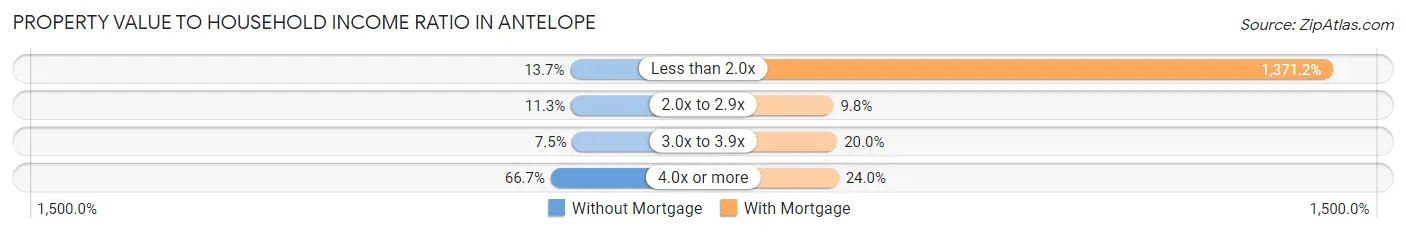
| Value-to-Income Ratio | Without Mortgage | With Mortgage |
| Less than 2.0x | 315 (13.7%) | 107,517 (1,371.2%) |
| 2.0x to 2.9x | 261 (11.3%) | 766 (9.8%) |
| 3.0x to 3.9x | 172 (7.5%) | 1,566 (20.0%) |
| 4.0x or more | 1,537 (66.6%) | 1,879 (24.0%) |
| Total | 2,306 (100.0%) | 7,841 (100.0%) |
Real Estate Taxes by Mortgage Status in Antelope
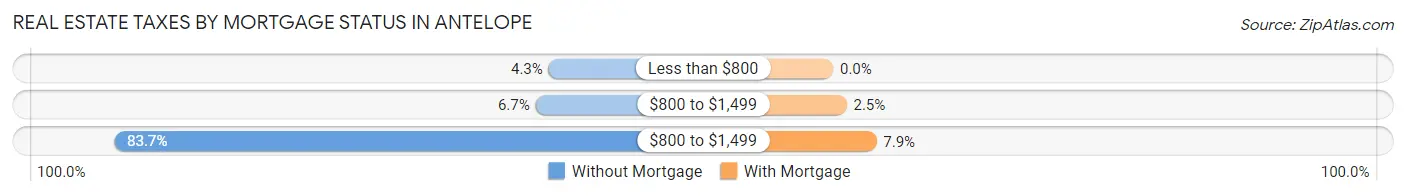
| Property Taxes | Without Mortgage | With Mortgage |
| Less than $800 | 99 (4.3%) | 0 (0.0%) |
| $800 to $1,499 | 154 (6.7%) | 193 (2.5%) |
| $800 to $1,499 | 1,929 (83.7%) | 620 (7.9%) |
| Total | 2,306 (100.0%) | 7,841 (100.0%) |
Health & Disability in Antelope
Health Insurance Coverage by Age in Antelope
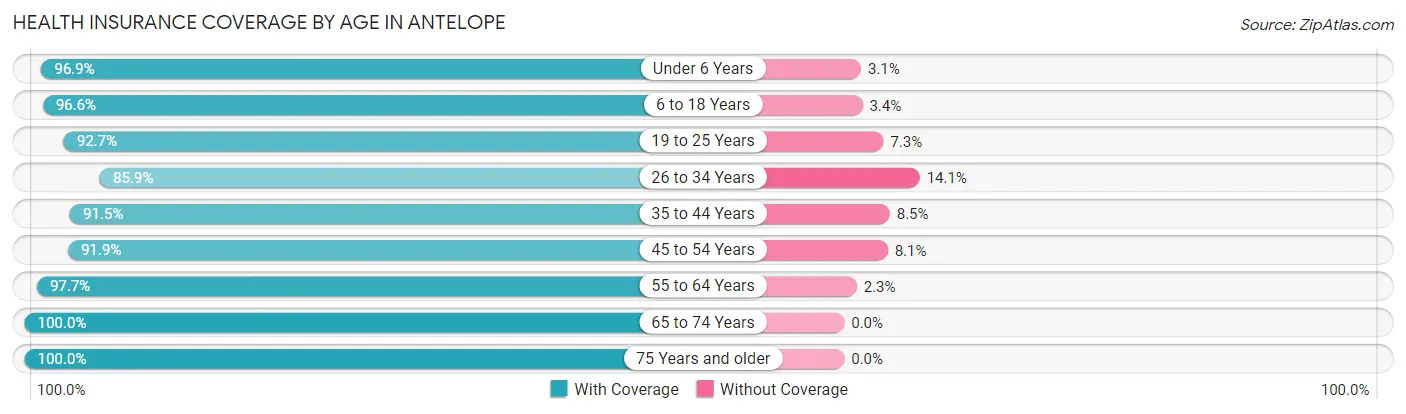
| Age Bracket | With Coverage | Without Coverage |
| Under 6 Years | 3,882 (96.9%) | 125 (3.1%) |
| 6 to 18 Years | 8,830 (96.6%) | 309 (3.4%) |
| 19 to 25 Years | 3,893 (92.7%) | 307 (7.3%) |
| 26 to 34 Years | 5,096 (85.9%) | 834 (14.1%) |
| 35 to 44 Years | 6,296 (91.5%) | 583 (8.5%) |
| 45 to 54 Years | 5,127 (91.9%) | 452 (8.1%) |
| 55 to 64 Years | 6,595 (97.7%) | 156 (2.3%) |
| 65 to 74 Years | 3,583 (100.0%) | 0 (0.0%) |
| 75 Years and older | 1,526 (100.0%) | 0 (0.0%) |
| Total | 44,828 (94.2%) | 2,766 (5.8%) |
Health Insurance Coverage by Citizenship Status in Antelope
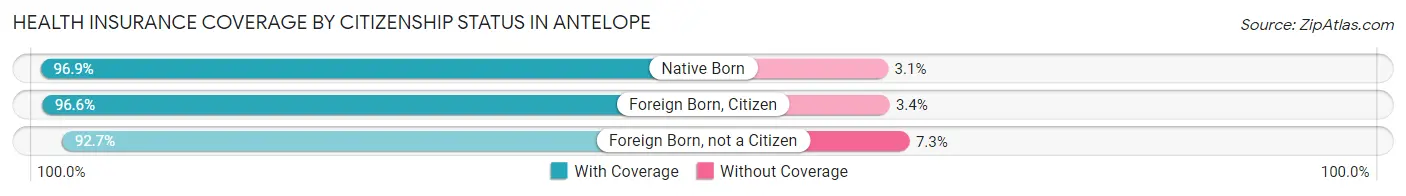
| Citizenship Status | With Coverage | Without Coverage |
| Native Born | 3,882 (96.9%) | 125 (3.1%) |
| Foreign Born, Citizen | 8,830 (96.6%) | 309 (3.4%) |
| Foreign Born, not a Citizen | 3,893 (92.7%) | 307 (7.3%) |
Health Insurance Coverage by Household Income in Antelope
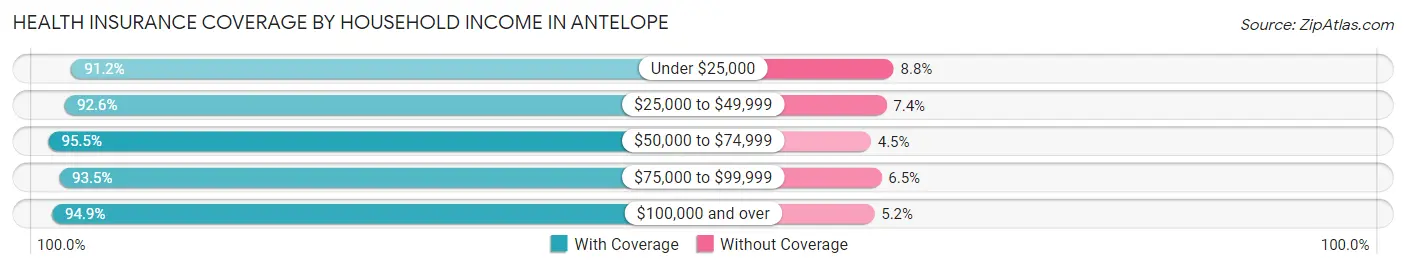
| Household Income | With Coverage | Without Coverage |
| Under $25,000 | 2,673 (91.2%) | 257 (8.8%) |
| $25,000 to $49,999 | 5,775 (92.6%) | 462 (7.4%) |
| $50,000 to $74,999 | 5,750 (95.5%) | 270 (4.5%) |
| $75,000 to $99,999 | 7,688 (93.5%) | 532 (6.5%) |
| $100,000 and over | 22,836 (94.9%) | 1,240 (5.1%) |
Public vs Private Health Insurance Coverage by Age in Antelope
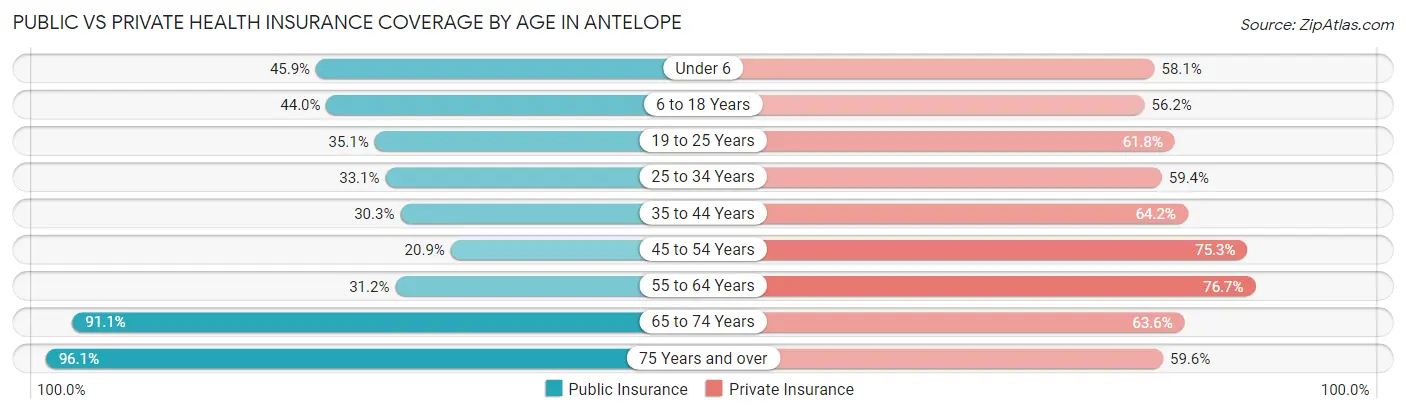
| Age Bracket | Public Insurance | Private Insurance |
| Under 6 | 1,840 (45.9%) | 2,326 (58.1%) |
| 6 to 18 Years | 4,020 (44.0%) | 5,138 (56.2%) |
| 19 to 25 Years | 1,472 (35.0%) | 2,595 (61.8%) |
| 25 to 34 Years | 1,960 (33.1%) | 3,523 (59.4%) |
| 35 to 44 Years | 2,083 (30.3%) | 4,416 (64.2%) |
| 45 to 54 Years | 1,167 (20.9%) | 4,199 (75.3%) |
| 55 to 64 Years | 2,107 (31.2%) | 5,181 (76.7%) |
| 65 to 74 Years | 3,265 (91.1%) | 2,279 (63.6%) |
| 75 Years and over | 1,466 (96.1%) | 910 (59.6%) |
| Total | 19,380 (40.7%) | 30,567 (64.2%) |
Disability Status by Sex by Age in Antelope
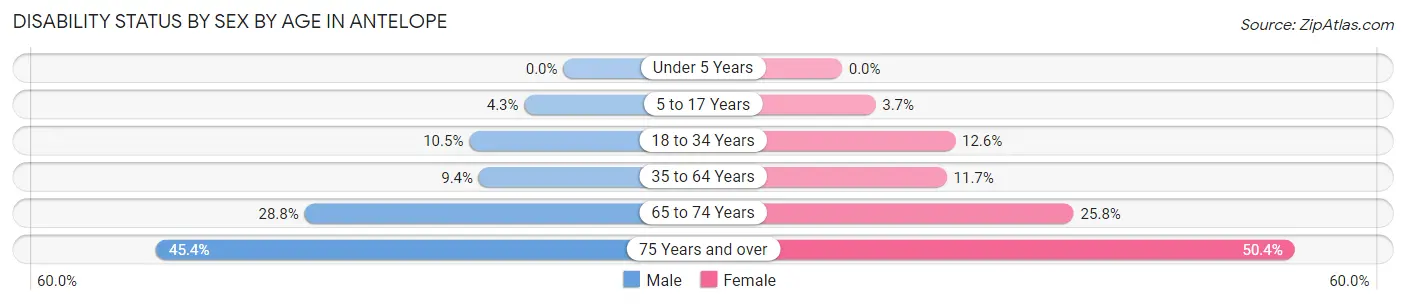
| Age Bracket | Male | Female |
| Under 5 Years | 0 (0.0%) | 0 (0.0%) |
| 5 to 17 Years | 209 (4.3%) | 159 (3.7%) |
| 18 to 34 Years | 529 (10.5%) | 714 (12.6%) |
| 35 to 64 Years | 864 (9.4%) | 1,170 (11.7%) |
| 65 to 74 Years | 470 (28.8%) | 504 (25.8%) |
| 75 Years and over | 317 (45.4%) | 417 (50.4%) |
Disability Class by Sex by Age in Antelope
Disability Class: Hearing Difficulty
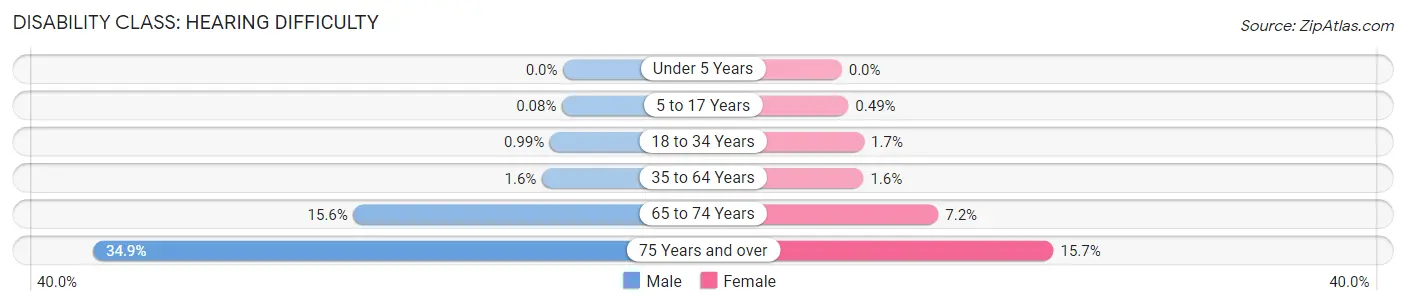
| Age Bracket | Male | Female |
| Under 5 Years | 0 (0.0%) | 0 (0.0%) |
| 5 to 17 Years | 4 (0.1%) | 21 (0.5%) |
| 18 to 34 Years | 50 (1.0%) | 94 (1.7%) |
| 35 to 64 Years | 144 (1.6%) | 161 (1.6%) |
| 65 to 74 Years | 254 (15.6%) | 140 (7.2%) |
| 75 Years and over | 244 (34.9%) | 130 (15.7%) |
Disability Class: Vision Difficulty
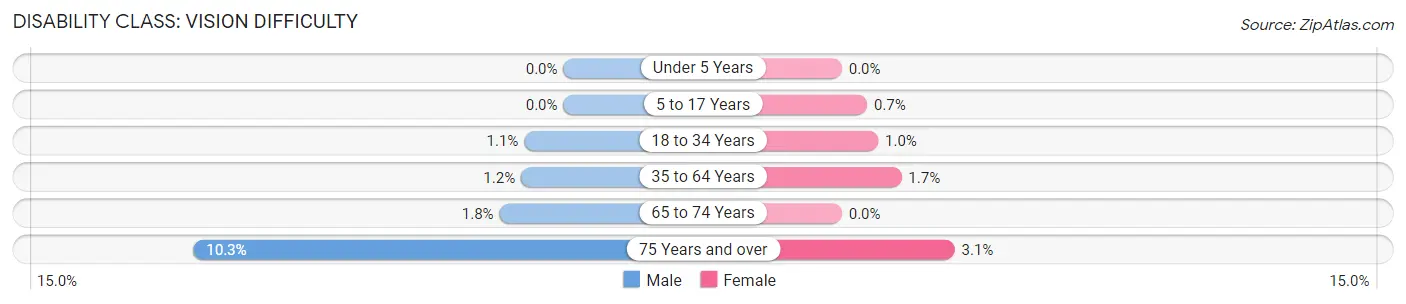
| Age Bracket | Male | Female |
| Under 5 Years | 0 (0.0%) | 0 (0.0%) |
| 5 to 17 Years | 0 (0.0%) | 30 (0.7%) |
| 18 to 34 Years | 55 (1.1%) | 57 (1.0%) |
| 35 to 64 Years | 108 (1.2%) | 166 (1.7%) |
| 65 to 74 Years | 29 (1.8%) | 0 (0.0%) |
| 75 Years and over | 72 (10.3%) | 26 (3.1%) |
Disability Class: Cognitive Difficulty
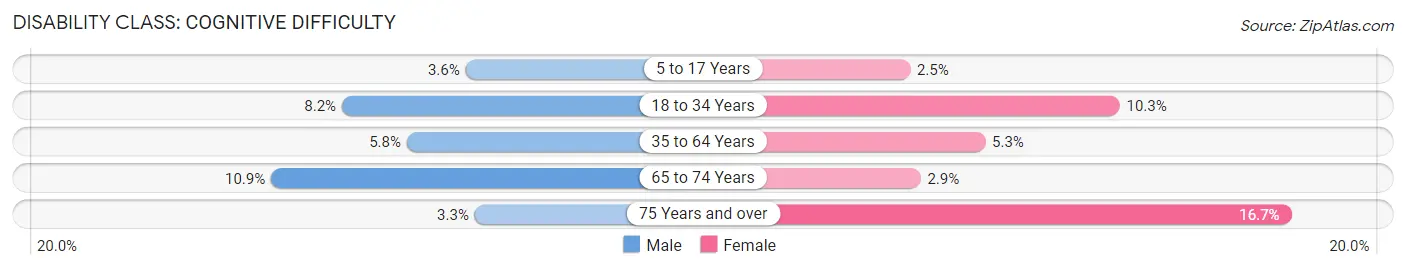
| Age Bracket | Male | Female |
| 5 to 17 Years | 175 (3.6%) | 108 (2.5%) |
| 18 to 34 Years | 415 (8.2%) | 584 (10.3%) |
| 35 to 64 Years | 533 (5.8%) | 533 (5.3%) |
| 65 to 74 Years | 177 (10.8%) | 57 (2.9%) |
| 75 Years and over | 23 (3.3%) | 138 (16.7%) |
Disability Class: Ambulatory Difficulty
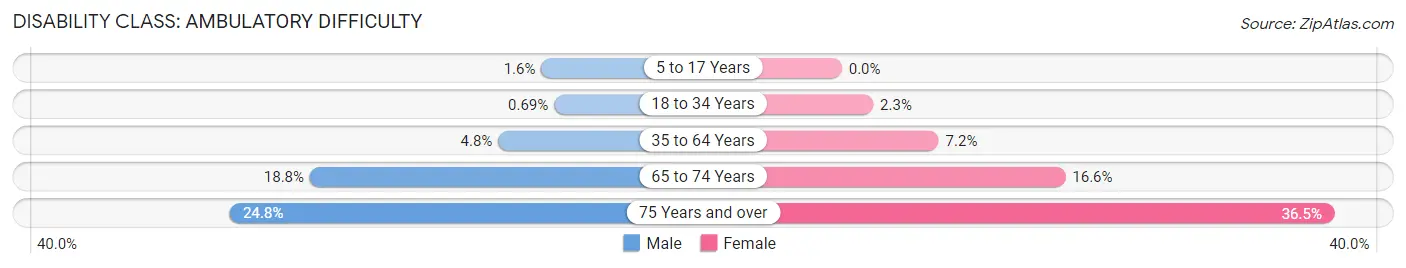
| Age Bracket | Male | Female |
| 5 to 17 Years | 79 (1.6%) | 0 (0.0%) |
| 18 to 34 Years | 35 (0.7%) | 132 (2.3%) |
| 35 to 64 Years | 444 (4.8%) | 721 (7.2%) |
| 65 to 74 Years | 307 (18.8%) | 324 (16.6%) |
| 75 Years and over | 173 (24.7%) | 302 (36.5%) |
Disability Class: Self-Care Difficulty
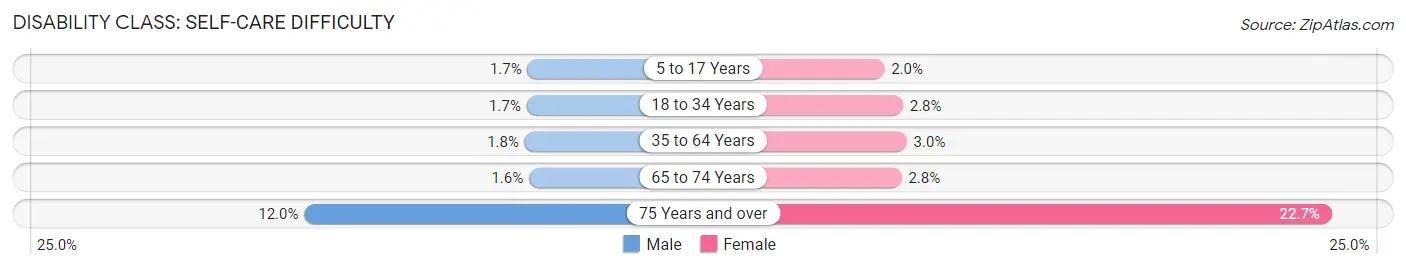
| Age Bracket | Male | Female |
| 5 to 17 Years | 80 (1.7%) | 84 (2.0%) |
| 18 to 34 Years | 86 (1.7%) | 160 (2.8%) |
| 35 to 64 Years | 164 (1.8%) | 302 (3.0%) |
| 65 to 74 Years | 26 (1.6%) | 54 (2.8%) |
| 75 Years and over | 84 (12.0%) | 188 (22.7%) |
Technology Access in Antelope
Computing Device Access in Antelope
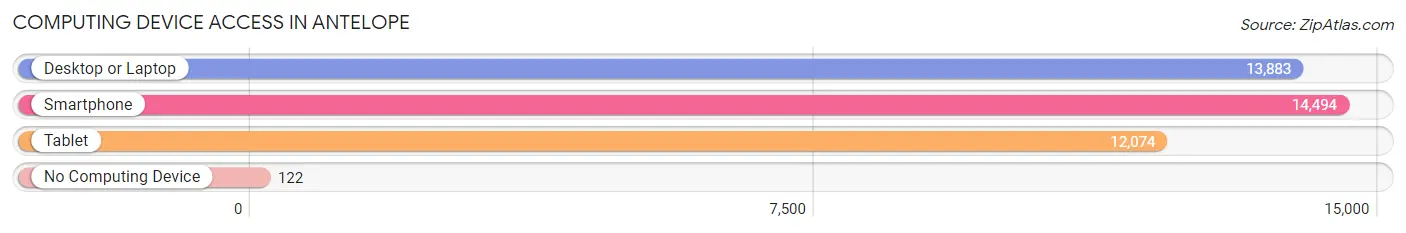
| Device Type | # Households | % Households |
| Desktop or Laptop | 13,883 | 91.7% |
| Smartphone | 14,494 | 95.7% |
| Tablet | 12,074 | 79.7% |
| No Computing Device | 122 | 0.8% |
| Total | 15,146 | 100.0% |
Internet Access in Antelope
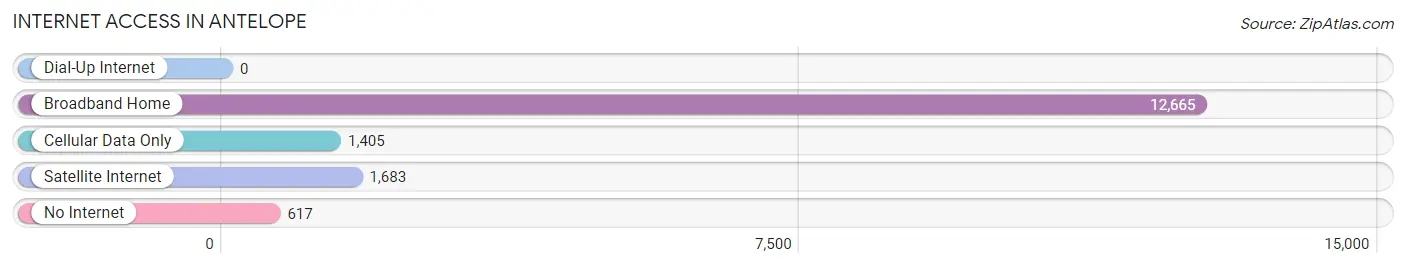
| Internet Type | # Households | % Households |
| Dial-Up Internet | 0 | 0.0% |
| Broadband Home | 12,665 | 83.6% |
| Cellular Data Only | 1,405 | 9.3% |
| Satellite Internet | 1,683 | 11.1% |
| No Internet | 617 | 4.1% |
| Total | 15,146 | 100.0% |
Antelope Summary
Antelope, California is a small, unincorporated community located in Sacramento County, California. It is situated in the foothills of the Sierra Nevada Mountains, approximately 25 miles northeast of Sacramento. The population of Antelope was estimated to be around 45,000 in 2020.
History
The area that is now Antelope was originally inhabited by the Maidu and Miwok Native American tribes. The first European settlers arrived in the area in the early 1850s, and the town of Antelope was officially established in 1856. The town was named after the pronghorn antelope that were common in the area at the time.
In the late 19th century, Antelope was a thriving agricultural community, with many farms and ranches in the area. The town was also home to several businesses, including a blacksmith, a general store, and a post office.
In the early 20th century, Antelope began to experience rapid growth due to the construction of the Sacramento Northern Railway. The railway connected Antelope to Sacramento and other nearby towns, making it easier for people to travel to and from the area.
Geography
Antelope is located in the foothills of the Sierra Nevada Mountains, approximately 25 miles northeast of Sacramento. The town is situated at an elevation of approximately 500 feet above sea level.
The climate in Antelope is classified as Mediterranean, with hot, dry summers and mild, wet winters. The average annual temperature is around 65 degrees Fahrenheit, and the average annual precipitation is around 20 inches.
The terrain in Antelope is mostly flat, with some rolling hills. The area is home to several creeks and rivers, including the American River, the Sacramento River, and the Feather River.
Economy
The economy of Antelope is largely based on agriculture and tourism. The area is home to several farms and ranches, and the town is a popular destination for outdoor activities such as camping, fishing, and hiking.
The town is also home to several businesses, including restaurants, retail stores, and auto repair shops. The town is served by several major highways, including Interstate 80 and Highway 99.
Demographics
As of 2020, the population of Antelope was estimated to be around 45,000. The racial makeup of the town is predominantly white (77.3%), followed by Hispanic or Latino (14.2%), Asian (3.7%), and African American (2.3%).
The median household income in Antelope is around $60,000, and the median home value is around $400,000. The town has a low unemployment rate of around 4.5%.
Conclusion
Antelope, California is a small, unincorporated community located in Sacramento County, California. It is situated in the foothills of the Sierra Nevada Mountains, approximately 25 miles northeast of Sacramento. The population of Antelope was estimated to be around 45,000 in 2020. The economy of Antelope is largely based on agriculture and tourism, and the town is a popular destination for outdoor activities such as camping, fishing, and hiking. The racial makeup of the town is predominantly white, followed by Hispanic or Latino, Asian, and African American. The median household income in Antelope is around $60,000, and the median home value is around $400,000.
Common Questions
What is Per Capita Income in Antelope?
Per Capita income in Antelope is $35,080.
What is the Median Family Income in Antelope?
Median Family Income in Antelope is $96,741.
What is the Median Household income in Antelope?
Median Household Income in Antelope is $92,117.
What is Income or Wage Gap in Antelope?
Income or Wage Gap in Antelope is 29.0%.
Women in Antelope earn 71.0 cents for every dollar earned by a man.
What is Family Income Deficit in Antelope?
Family Income Deficit in Antelope is $10,403.
Families that are below poverty line in Antelope earn $10,403 less on average than the poverty threshold level.
What is Inequality or Gini Index in Antelope?
Inequality or Gini Index in Antelope is 0.38.
What is the Total Population of Antelope?
Total Population of Antelope is 47,629.
What is the Total Male Population of Antelope?
Total Male Population of Antelope is 23,221.
What is the Total Female Population of Antelope?
Total Female Population of Antelope is 24,408.
What is the Ratio of Males per 100 Females in Antelope?
There are 95.14 Males per 100 Females in Antelope.
What is the Ratio of Females per 100 Males in Antelope?
There are 105.11 Females per 100 Males in Antelope.
What is the Median Population Age in Antelope?
Median Population Age in Antelope is 35.7 Years.
What is the Average Family Size in Antelope
Average Family Size in Antelope is 3.5 People.
What is the Average Household Size in Antelope
Average Household Size in Antelope is 3.1 People.
How Large is the Labor Force in Antelope?
There are 23,501 People in the Labor Forcein in Antelope.
What is the Percentage of People in the Labor Force in Antelope?
64.1% of People are in the Labor Force in Antelope.
What is the Unemployment Rate in Antelope?
Unemployment Rate in Antelope is 6.8%.