Parkway, CA Map & Demographics
Parkway Map
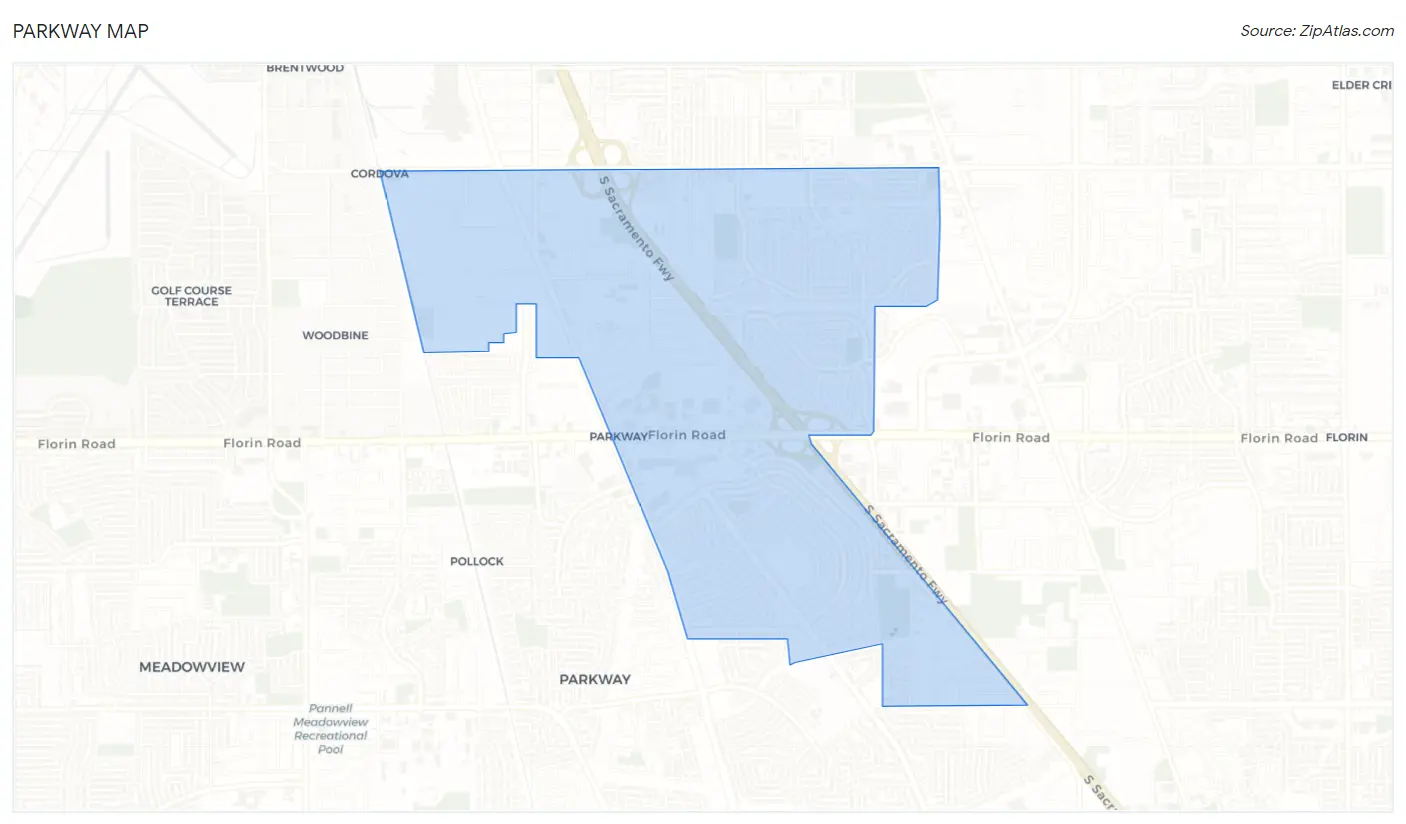
Parkway Overview
$22,611
PER CAPITA INCOME
$60,917
AVG FAMILY INCOME
$58,016
AVG HOUSEHOLD INCOME
17.2%
WAGE / INCOME GAP [ % ]
82.8¢/ $1
WAGE / INCOME GAP [ $ ]
$12,689
FAMILY INCOME DEFICIT
0.41
INEQUALITY / GINI INDEX
16,242
TOTAL POPULATION
7,813
MALE POPULATION
8,429
FEMALE POPULATION
92.69
MALES / 100 FEMALES
107.88
FEMALES / 100 MALES
32.3
MEDIAN AGE
4.0
AVG FAMILY SIZE
3.3
AVG HOUSEHOLD SIZE
7,223
LABOR FORCE [ PEOPLE ]
58.5%
PERCENT IN LABOR FORCE
11.5%
UNEMPLOYMENT RATE
Income in Parkway
Income Overview in Parkway
Per Capita Income in Parkway is $22,611, while median incomes of families and households are $60,917 and $58,016 respectively.
| Characteristic | Number | Measure |
| Per Capita Income | 16,242 | $22,611 |
| Median Family Income | 3,526 | $60,917 |
| Mean Family Income | 3,526 | $75,289 |
| Median Household Income | 4,884 | $58,016 |
| Mean Household Income | 4,884 | $71,433 |
| Income Deficit | 3,526 | $12,689 |
| Wage / Income Gap (%) | 16,242 | 17.22% |
| Wage / Income Gap ($) | 16,242 | 82.78¢ per $1 |
| Gini / Inequality Index | 16,242 | 0.41 |
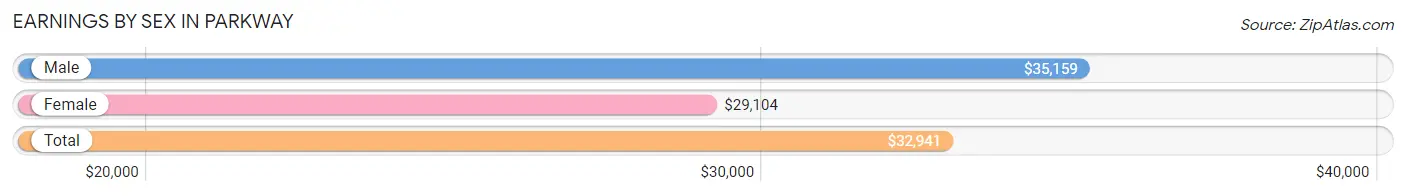
Earnings by Sex in Parkway
Average Earnings in Parkway are $32,941, $35,159 for men and $29,104 for women, a difference of 17.2%.
| Sex | Number | Average Earnings |
| Male | 3,679 (51.9%) | $35,159 |
| Female | 3,412 (48.1%) | $29,104 |
| Total | 7,091 (100.0%) | $32,941 |
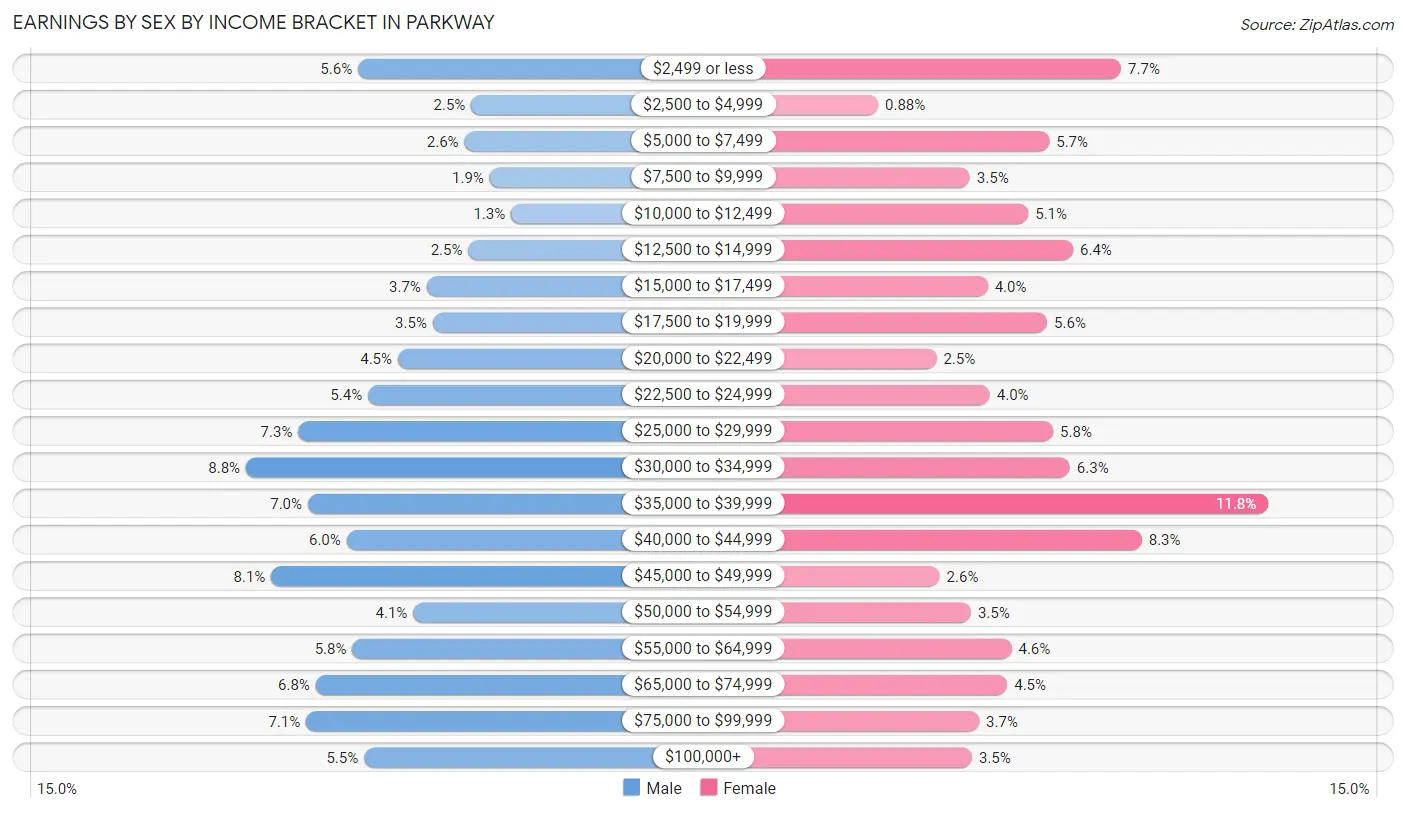
Earnings by Sex by Income Bracket in Parkway
The most common earnings brackets in Parkway are $30,000 to $34,999 for men (323 | 8.8%) and $35,000 to $39,999 for women (404 | 11.8%).
| Income | Male | Female |
| $2,499 or less | 207 (5.6%) | 263 (7.7%) |
| $2,500 to $4,999 | 90 (2.5%) | 30 (0.9%) |
| $5,000 to $7,499 | 97 (2.6%) | 194 (5.7%) |
| $7,500 to $9,999 | 71 (1.9%) | 118 (3.5%) |
| $10,000 to $12,499 | 49 (1.3%) | 174 (5.1%) |
| $12,500 to $14,999 | 93 (2.5%) | 217 (6.4%) |
| $15,000 to $17,499 | 136 (3.7%) | 135 (4.0%) |
| $17,500 to $19,999 | 130 (3.5%) | 192 (5.6%) |
| $20,000 to $22,499 | 166 (4.5%) | 86 (2.5%) |
| $22,500 to $24,999 | 197 (5.3%) | 137 (4.0%) |
| $25,000 to $29,999 | 269 (7.3%) | 198 (5.8%) |
| $30,000 to $34,999 | 323 (8.8%) | 214 (6.3%) |
| $35,000 to $39,999 | 259 (7.0%) | 404 (11.8%) |
| $40,000 to $44,999 | 219 (5.9%) | 283 (8.3%) |
| $45,000 to $49,999 | 297 (8.1%) | 89 (2.6%) |
| $50,000 to $54,999 | 150 (4.1%) | 119 (3.5%) |
| $55,000 to $64,999 | 213 (5.8%) | 158 (4.6%) |
| $65,000 to $74,999 | 251 (6.8%) | 154 (4.5%) |
| $75,000 to $99,999 | 261 (7.1%) | 127 (3.7%) |
| $100,000+ | 201 (5.5%) | 120 (3.5%) |
| Total | 3,679 (100.0%) | 3,412 (100.0%) |
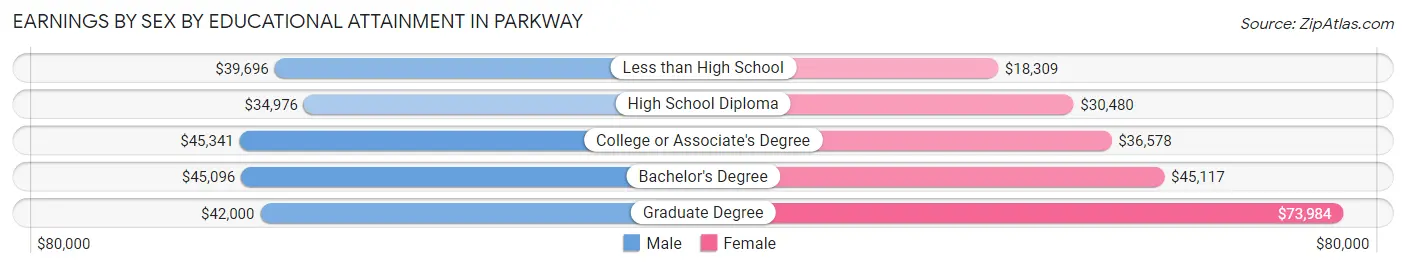
Earnings by Sex by Educational Attainment in Parkway
Average earnings in Parkway are $40,997 for men and $34,221 for women, a difference of 16.5%. Men with an educational attainment of college or associate's degree enjoy the highest average annual earnings of $45,341, while those with high school diploma education earn the least with $34,976. Women with an educational attainment of graduate degree earn the most with the average annual earnings of $73,984, while those with less than high school education have the smallest earnings of $18,309.
| Educational Attainment | Male Income | Female Income |
| Less than High School | $39,696 | $18,309 |
| High School Diploma | $34,976 | $30,480 |
| College or Associate's Degree | $45,341 | $36,578 |
| Bachelor's Degree | $45,096 | $45,117 |
| Graduate Degree | $42,000 | $73,984 |
| Total | $40,997 | $34,221 |
Family Income in Parkway
Family Income Brackets in Parkway
According to the Parkway family income data, there are 793 families falling into the $50,000 to $74,999 income range, which is the most common income bracket and makes up 22.5% of all families. Conversely, the $10,000 to $14,999 income bracket is the least frequent group with only 74 families (2.1%) belonging to this category.
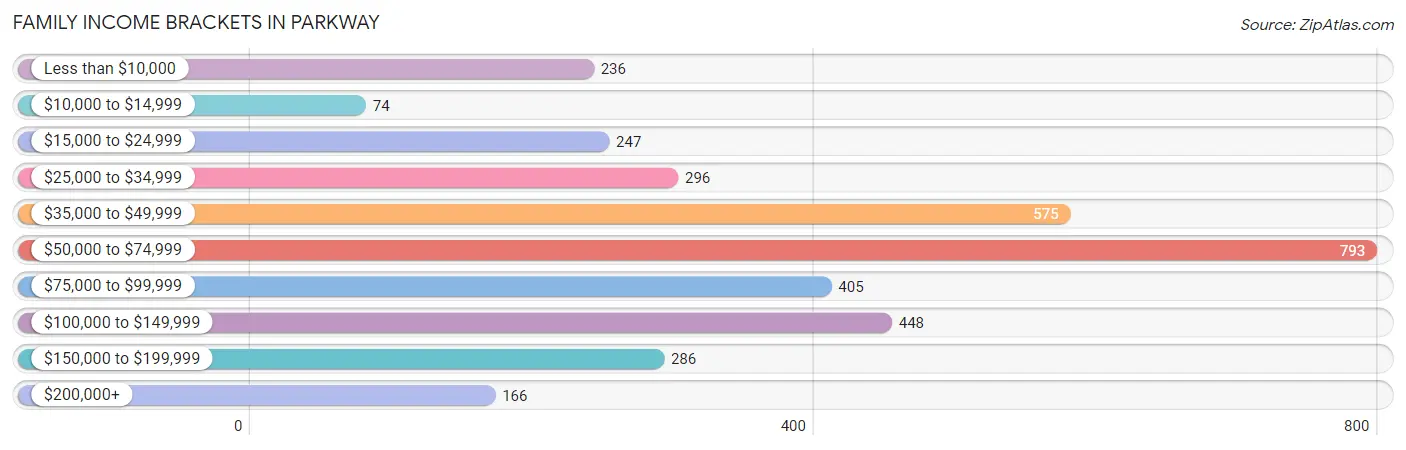
| Income Bracket | # Families | % Families |
| Less than $10,000 | 236 | 6.7% |
| $10,000 to $14,999 | 74 | 2.1% |
| $15,000 to $24,999 | 247 | 7.0% |
| $25,000 to $34,999 | 296 | 8.4% |
| $35,000 to $49,999 | 575 | 16.3% |
| $50,000 to $74,999 | 793 | 22.5% |
| $75,000 to $99,999 | 405 | 11.5% |
| $100,000 to $149,999 | 448 | 12.7% |
| $150,000 to $199,999 | 286 | 8.1% |
| $200,000+ | 166 | 4.7% |
Family Income by Famaliy Size in Parkway
7+ person families (260 | 7.4%) account for the highest median family income in Parkway with $108,125 per family, while 2-person families (1,072 | 30.4%) have the highest median income of $23,398 per family member.
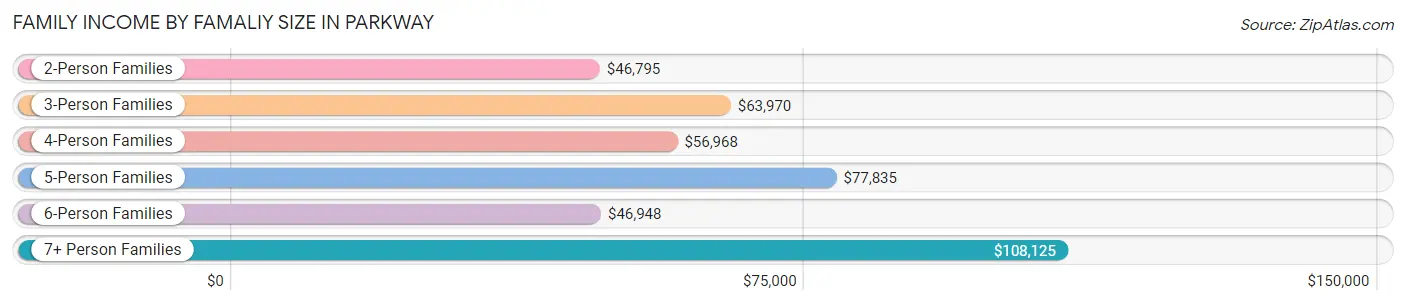
| Income Bracket | # Families | Median Income |
| 2-Person Families | 1,072 (30.4%) | $46,795 |
| 3-Person Families | 607 (17.2%) | $63,970 |
| 4-Person Families | 755 (21.4%) | $56,968 |
| 5-Person Families | 619 (17.6%) | $77,835 |
| 6-Person Families | 213 (6.0%) | $46,948 |
| 7+ Person Families | 260 (7.4%) | $108,125 |
| Total | 3,526 (100.0%) | $60,917 |
Family Income by Number of Earners in Parkway
The median family income in Parkway is $60,917, with families comprising 3+ earners (575) having the highest median family income of $104,688, while families with no earners (455) have the lowest median family income of $22,107, accounting for 16.3% and 12.9% of families, respectively.
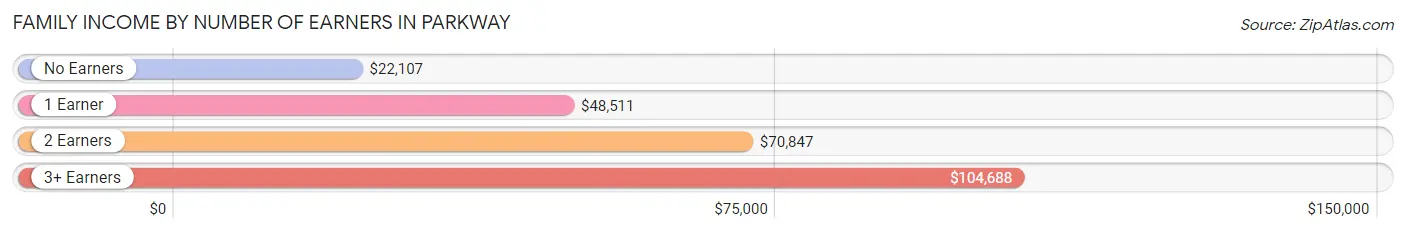
| Number of Earners | # Families | Median Income |
| No Earners | 455 (12.9%) | $22,107 |
| 1 Earner | 1,527 (43.3%) | $48,511 |
| 2 Earners | 969 (27.5%) | $70,847 |
| 3+ Earners | 575 (16.3%) | $104,688 |
| Total | 3,526 (100.0%) | $60,917 |
Household Income in Parkway
Household Income Brackets in Parkway
With 1,148 households falling in the category, the $50,000 to $74,999 income range is the most frequent in Parkway, accounting for 23.5% of all households. In contrast, only 176 households (3.6%) fall into the $200,000+ income bracket, making it the least populous group.
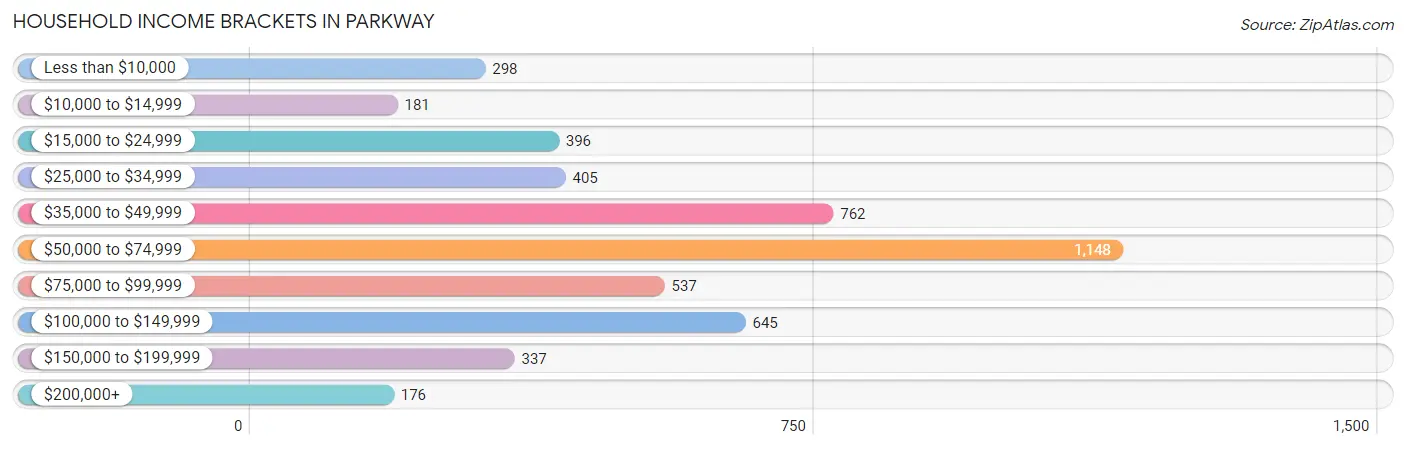
| Income Bracket | # Households | % Households |
| Less than $10,000 | 298 | 6.1% |
| $10,000 to $14,999 | 181 | 3.7% |
| $15,000 to $24,999 | 396 | 8.1% |
| $25,000 to $34,999 | 405 | 8.3% |
| $35,000 to $49,999 | 762 | 15.6% |
| $50,000 to $74,999 | 1,148 | 23.5% |
| $75,000 to $99,999 | 537 | 11.0% |
| $100,000 to $149,999 | 645 | 13.2% |
| $150,000 to $199,999 | 337 | 6.9% |
| $200,000+ | 176 | 3.6% |
Household Income by Householder Age in Parkway
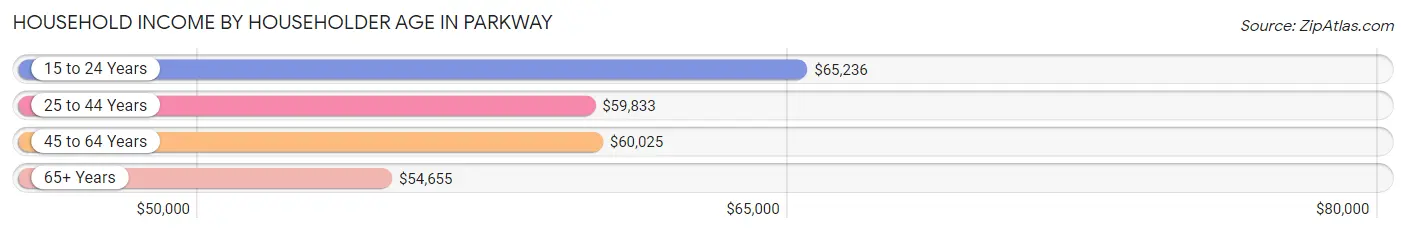
The median household income in Parkway is $58,016, with the highest median household income of $65,236 found in the 15 to 24 years age bracket for the primary householder. A total of 97 households (2.0%) fall into this category. Meanwhile, the 65+ years age bracket for the primary householder has the lowest median household income of $54,655, with 1,146 households (23.5%) in this group.
| Income Bracket | # Households | Median Income |
| 15 to 24 Years | 97 (2.0%) | $65,236 |
| 25 to 44 Years | 1,856 (38.0%) | $59,833 |
| 45 to 64 Years | 1,785 (36.5%) | $60,025 |
| 65+ Years | 1,146 (23.5%) | $54,655 |
| Total | 4,884 (100.0%) | $58,016 |
Poverty in Parkway
Income Below Poverty by Sex and Age in Parkway
With 19.8% poverty level for males and 21.8% for females among the residents of Parkway, 6 to 11 year old males and 15 year old females are the most vulnerable to poverty, with 242 males (37.9%) and 35 females (43.8%) in their respective age groups living below the poverty level.
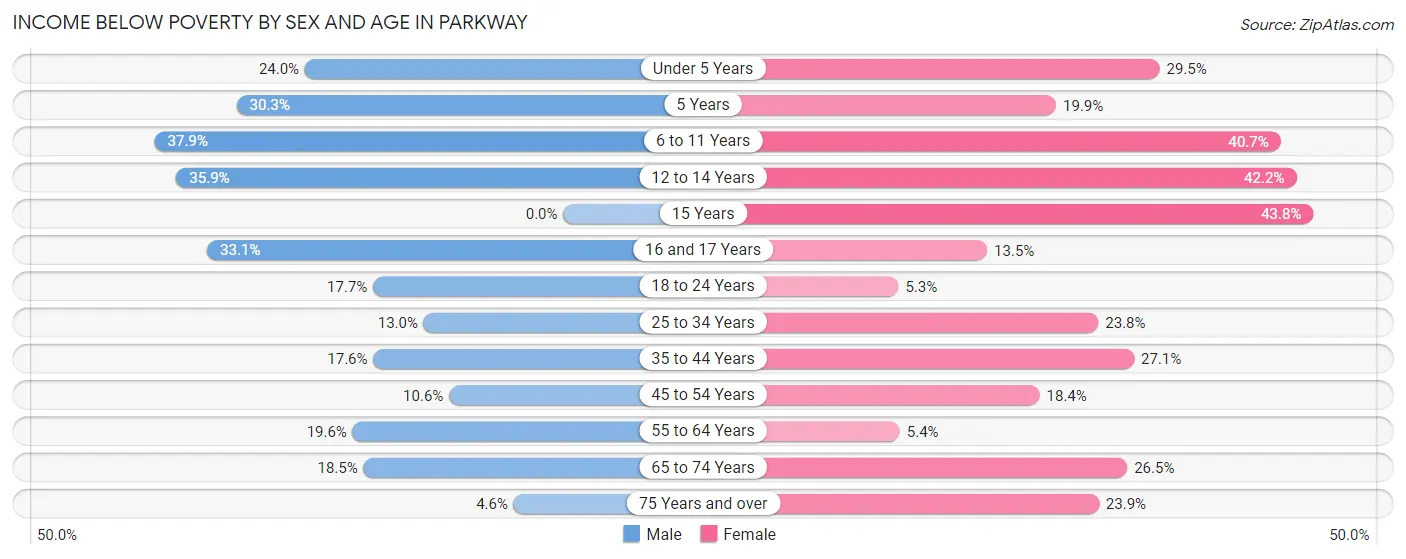
| Age Bracket | Male | Female |
| Under 5 Years | 135 (24.0%) | 156 (29.5%) |
| 5 Years | 47 (30.3%) | 37 (19.9%) |
| 6 to 11 Years | 242 (37.9%) | 283 (40.7%) |
| 12 to 14 Years | 195 (35.9%) | 148 (42.2%) |
| 15 Years | 0 (0.0%) | 35 (43.8%) |
| 16 and 17 Years | 121 (33.1%) | 34 (13.5%) |
| 18 to 24 Years | 131 (17.6%) | 51 (5.3%) |
| 25 to 34 Years | 148 (13.0%) | 330 (23.8%) |
| 35 to 44 Years | 168 (17.6%) | 291 (27.1%) |
| 45 to 54 Years | 83 (10.6%) | 175 (18.4%) |
| 55 to 64 Years | 156 (19.6%) | 52 (5.4%) |
| 65 to 74 Years | 104 (18.5%) | 111 (26.5%) |
| 75 Years and over | 19 (4.6%) | 136 (23.9%) |
| Total | 1,549 (19.8%) | 1,839 (21.8%) |
Income Above Poverty by Sex and Age in Parkway
According to the poverty statistics in Parkway, males aged 15 years and females aged 18 to 24 years are the age groups that are most secure financially, with 100.0% of males and 94.7% of females in these age groups living above the poverty line.
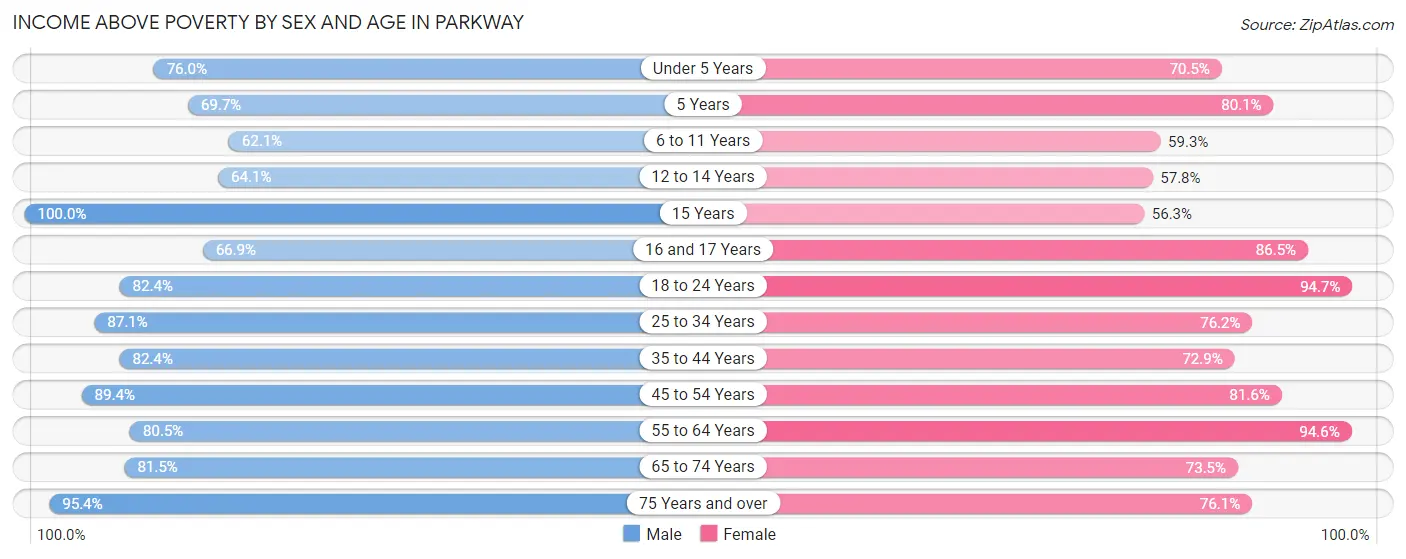
| Age Bracket | Male | Female |
| Under 5 Years | 428 (76.0%) | 373 (70.5%) |
| 5 Years | 108 (69.7%) | 149 (80.1%) |
| 6 to 11 Years | 396 (62.1%) | 412 (59.3%) |
| 12 to 14 Years | 348 (64.1%) | 203 (57.8%) |
| 15 Years | 155 (100.0%) | 45 (56.2%) |
| 16 and 17 Years | 245 (66.9%) | 218 (86.5%) |
| 18 to 24 Years | 611 (82.4%) | 918 (94.7%) |
| 25 to 34 Years | 995 (87.1%) | 1,056 (76.2%) |
| 35 to 44 Years | 785 (82.4%) | 782 (72.9%) |
| 45 to 54 Years | 700 (89.4%) | 778 (81.6%) |
| 55 to 64 Years | 642 (80.4%) | 912 (94.6%) |
| 65 to 74 Years | 457 (81.5%) | 308 (73.5%) |
| 75 Years and over | 394 (95.4%) | 434 (76.1%) |
| Total | 6,264 (80.2%) | 6,588 (78.2%) |
Income Below Poverty Among Married-Couple Families in Parkway
The poverty statistics for married-couple families in Parkway show that 13.5% or 274 of the total 2,036 families live below the poverty line. Families with 5 or more children have the highest poverty rate of 100.0%, comprising of 30 families. On the other hand, families with no children have the lowest poverty rate of 2.8%, which includes 24 families.
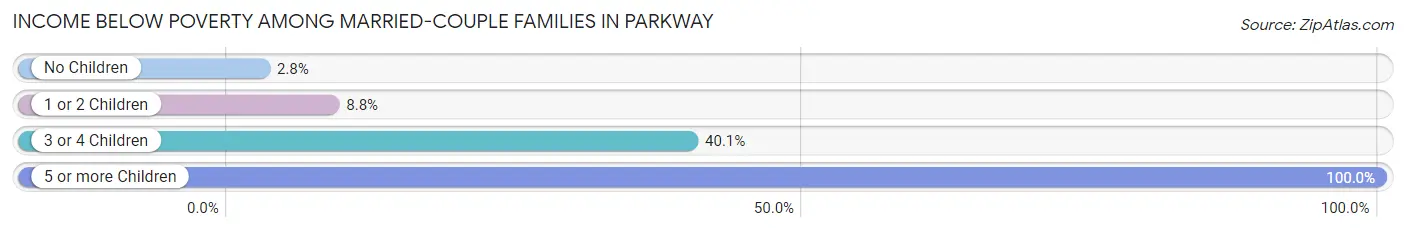
| Children | Above Poverty | Below Poverty |
| No Children | 840 (97.2%) | 24 (2.8%) |
| 1 or 2 Children | 693 (91.2%) | 67 (8.8%) |
| 3 or 4 Children | 229 (60.0%) | 153 (40.1%) |
| 5 or more Children | 0 (0.0%) | 30 (100.0%) |
| Total | 1,762 (86.5%) | 274 (13.5%) |
Income Below Poverty Among Single-Parent Households in Parkway
According to the poverty data in Parkway, 11.6% or 48 single-father households and 33.1% or 356 single-mother households are living below the poverty line. Among single-father households, those with 3 or 4 children have the highest poverty rate, with 29 households (43.3%) experiencing poverty. Likewise, among single-mother households, those with 3 or 4 children have the highest poverty rate, with 100 households (52.4%) falling below the poverty line.
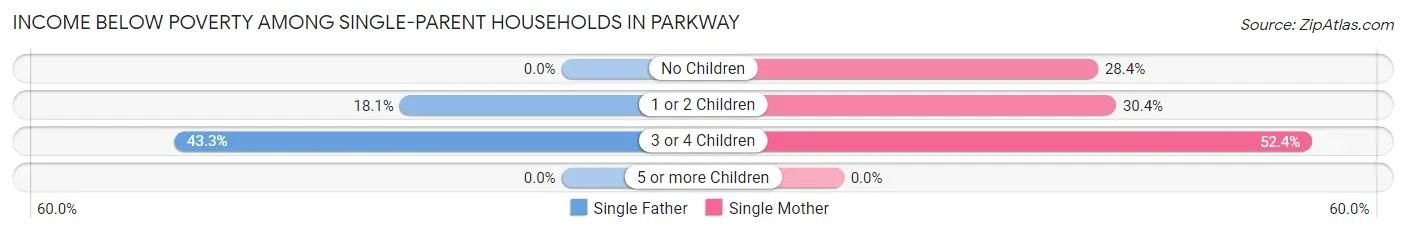
| Children | Single Father | Single Mother |
| No Children | 0 (0.0%) | 137 (28.4%) |
| 1 or 2 Children | 19 (18.1%) | 119 (30.4%) |
| 3 or 4 Children | 29 (43.3%) | 100 (52.4%) |
| 5 or more Children | 0 (0.0%) | 0 (0.0%) |
| Total | 48 (11.6%) | 356 (33.1%) |
Income Below Poverty Among Married-Couple vs Single-Parent Households in Parkway
The poverty data for Parkway shows that 274 of the married-couple family households (13.5%) and 404 of the single-parent households (27.1%) are living below the poverty level. Within the married-couple family households, those with 5 or more children have the highest poverty rate, with 30 households (100.0%) falling below the poverty line. Among the single-parent households, those with 3 or 4 children have the highest poverty rate, with 129 household (50.0%) living below poverty.
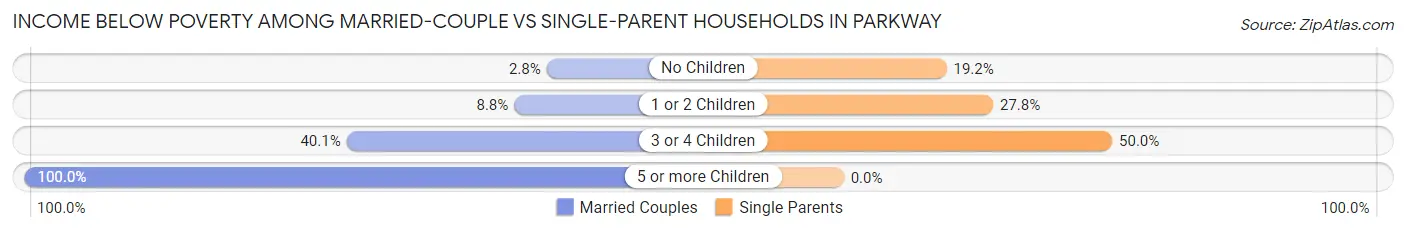
| Children | Married-Couple Families | Single-Parent Households |
| No Children | 24 (2.8%) | 137 (19.2%) |
| 1 or 2 Children | 67 (8.8%) | 138 (27.8%) |
| 3 or 4 Children | 153 (40.1%) | 129 (50.0%) |
| 5 or more Children | 30 (100.0%) | 0 (0.0%) |
| Total | 274 (13.5%) | 404 (27.1%) |
Race in Parkway
The most populous races in Parkway are Hispanic or Latino (7,214 | 44.4%), Some other Race (4,279 | 26.4%), and White / Caucasian (3,842 | 23.6%).
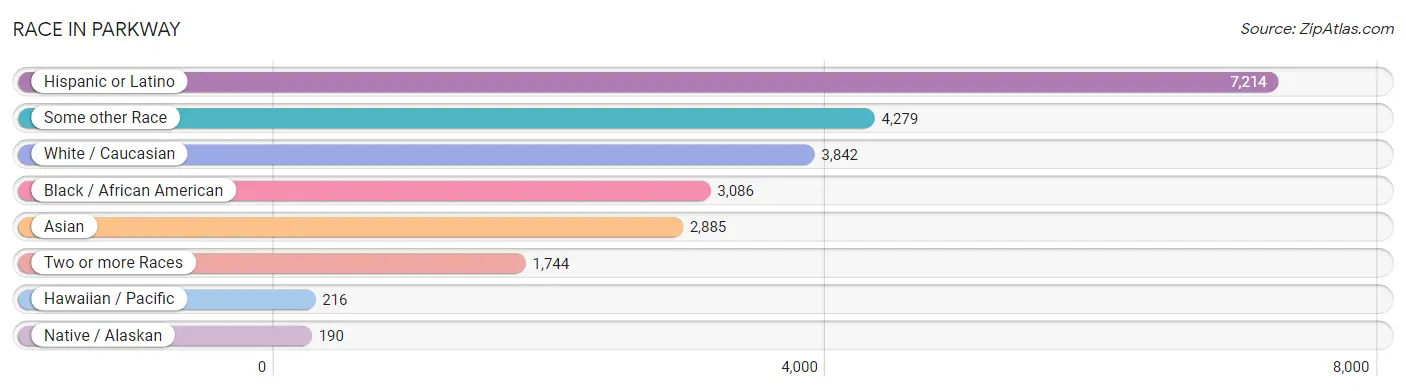
| Race | # Population | % Population |
| Asian | 2,885 | 17.8% |
| Black / African American | 3,086 | 19.0% |
| Hawaiian / Pacific | 216 | 1.3% |
| Hispanic or Latino | 7,214 | 44.4% |
| Native / Alaskan | 190 | 1.2% |
| White / Caucasian | 3,842 | 23.6% |
| Two or more Races | 1,744 | 10.7% |
| Some other Race | 4,279 | 26.4% |
| Total | 16,242 | 100.0% |
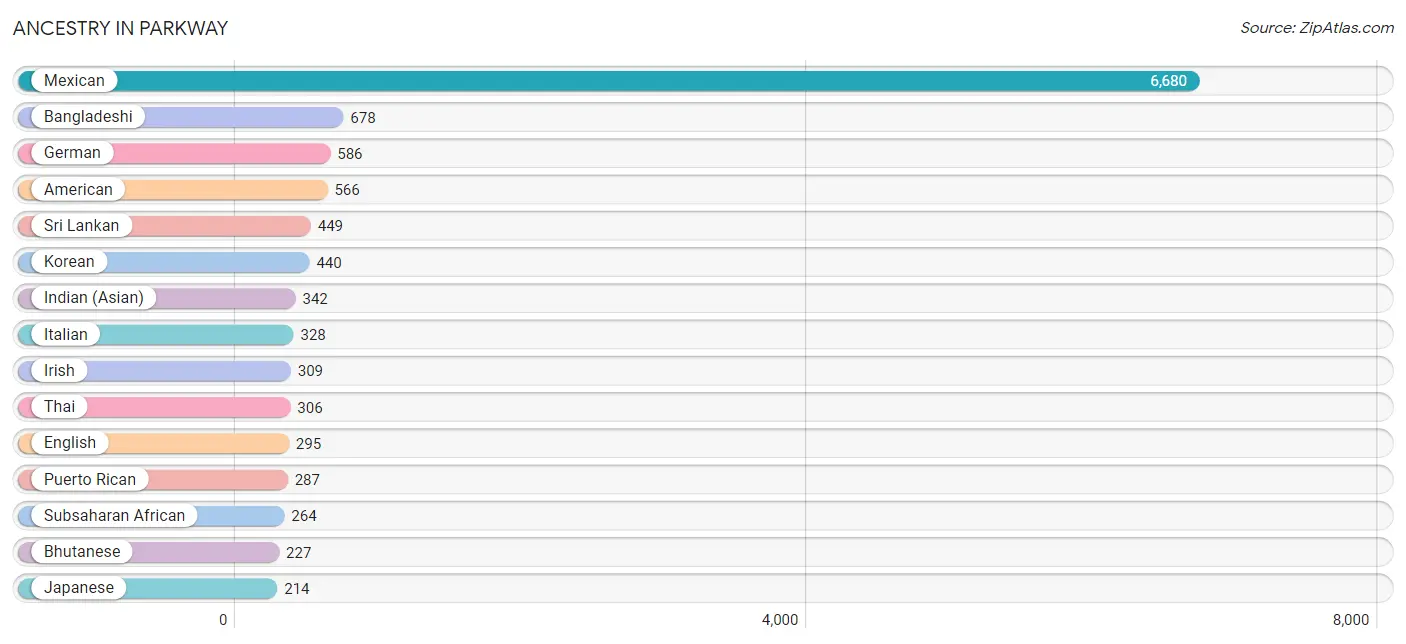
Ancestry in Parkway
The most populous ancestries reported in Parkway are Mexican (6,680 | 41.1%), Bangladeshi (678 | 4.2%), German (586 | 3.6%), American (566 | 3.5%), and Sri Lankan (449 | 2.8%), together accounting for 55.1% of all Parkway residents.
| Ancestry | # Population | % Population |
| Afghan | 119 | 0.7% |
| African | 80 | 0.5% |
| American | 566 | 3.5% |
| Arab | 23 | 0.1% |
| Australian | 25 | 0.2% |
| Austrian | 19 | 0.1% |
| Bangladeshi | 678 | 4.2% |
| Bhutanese | 227 | 1.4% |
| Blackfeet | 25 | 0.2% |
| British | 18 | 0.1% |
| Burmese | 44 | 0.3% |
| Central American | 180 | 1.1% |
| Cherokee | 185 | 1.1% |
| Danish | 36 | 0.2% |
| Dutch | 134 | 0.8% |
| Ecuadorian | 11 | 0.1% |
| Egyptian | 10 | 0.1% |
| English | 295 | 1.8% |
| Ethiopian | 184 | 1.1% |
| European | 79 | 0.5% |
| Finnish | 11 | 0.1% |
| French | 11 | 0.1% |
| French Canadian | 19 | 0.1% |
| German | 586 | 3.6% |
| Guamanian / Chamorro | 13 | 0.1% |
| Guatemalan | 18 | 0.1% |
| Hungarian | 17 | 0.1% |
| Indian (Asian) | 342 | 2.1% |
| Indonesian | 76 | 0.5% |
| Iranian | 54 | 0.3% |
| Irish | 309 | 1.9% |
| Italian | 328 | 2.0% |
| Jamaican | 44 | 0.3% |
| Japanese | 214 | 1.3% |
| Korean | 440 | 2.7% |
| Malaysian | 95 | 0.6% |
| Mexican | 6,680 | 41.1% |
| Mexican American Indian | 123 | 0.8% |
| Native Hawaiian | 57 | 0.4% |
| Navajo | 16 | 0.1% |
| Nepalese | 73 | 0.4% |
| Nicaraguan | 96 | 0.6% |
| Northern European | 44 | 0.3% |
| Norwegian | 81 | 0.5% |
| Panamanian | 50 | 0.3% |
| Portuguese | 61 | 0.4% |
| Puerto Rican | 287 | 1.8% |
| Russian | 8 | 0.1% |
| Salvadoran | 16 | 0.1% |
| Scottish | 58 | 0.4% |
| Seminole | 29 | 0.2% |
| Sioux | 7 | 0.0% |
| South American | 11 | 0.1% |
| Spaniard | 45 | 0.3% |
| Sri Lankan | 449 | 2.8% |
| Subsaharan African | 264 | 1.6% |
| Swedish | 78 | 0.5% |
| Swiss | 172 | 1.1% |
| Thai | 306 | 1.9% |
| Tongan | 61 | 0.4% |
| Ukrainian | 31 | 0.2% |
| Welsh | 64 | 0.4% | View All 62 Rows |
Immigrants in Parkway
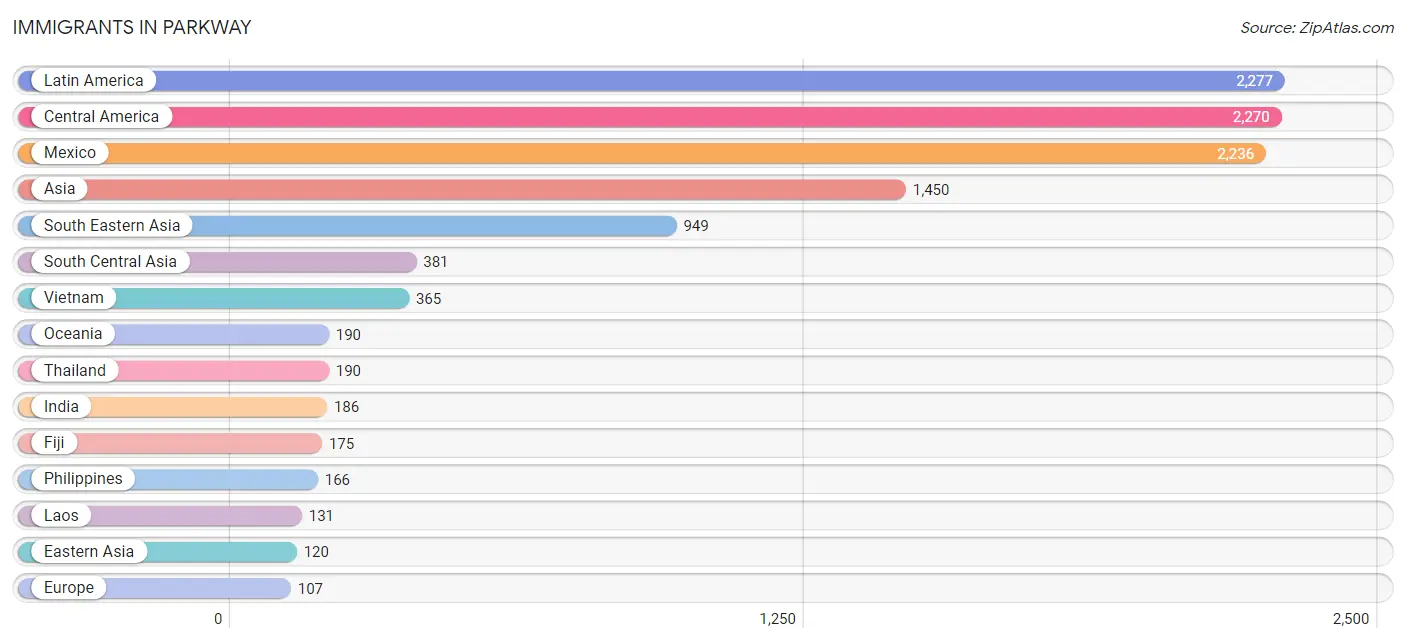
The most numerous immigrant groups reported in Parkway came from Latin America (2,277 | 14.0%), Central America (2,270 | 14.0%), Mexico (2,236 | 13.8%), Asia (1,450 | 8.9%), and South Eastern Asia (949 | 5.8%), together accounting for 56.5% of all Parkway residents.
| Immigration Origin | # Population | % Population |
| Afghanistan | 73 | 0.4% |
| Africa | 72 | 0.4% |
| Asia | 1,450 | 8.9% |
| Canada | 14 | 0.1% |
| Caribbean | 7 | 0.0% |
| Central America | 2,270 | 14.0% |
| China | 87 | 0.5% |
| Eastern Africa | 72 | 0.4% |
| Eastern Asia | 120 | 0.7% |
| Eastern Europe | 16 | 0.1% |
| El Salvador | 24 | 0.2% |
| England | 10 | 0.1% |
| Eritrea | 72 | 0.4% |
| Europe | 107 | 0.7% |
| Fiji | 175 | 1.1% |
| Germany | 8 | 0.1% |
| Greece | 8 | 0.1% |
| Guatemala | 10 | 0.1% |
| India | 186 | 1.1% |
| Iran | 19 | 0.1% |
| Jamaica | 7 | 0.0% |
| Japan | 33 | 0.2% |
| Laos | 131 | 0.8% |
| Latin America | 2,277 | 14.0% |
| Mexico | 2,236 | 13.8% |
| Moldova | 8 | 0.1% |
| Northern Europe | 25 | 0.2% |
| Oceania | 190 | 1.2% |
| Pakistan | 103 | 0.6% |
| Philippines | 166 | 1.0% |
| Russia | 8 | 0.1% |
| Scotland | 15 | 0.1% |
| South Central Asia | 381 | 2.4% |
| South Eastern Asia | 949 | 5.8% |
| Southern Europe | 8 | 0.1% |
| Switzerland | 50 | 0.3% |
| Thailand | 190 | 1.2% |
| Vietnam | 365 | 2.2% |
| Western Europe | 58 | 0.4% | View All 39 Rows |
Sex and Age in Parkway
Sex and Age in Parkway
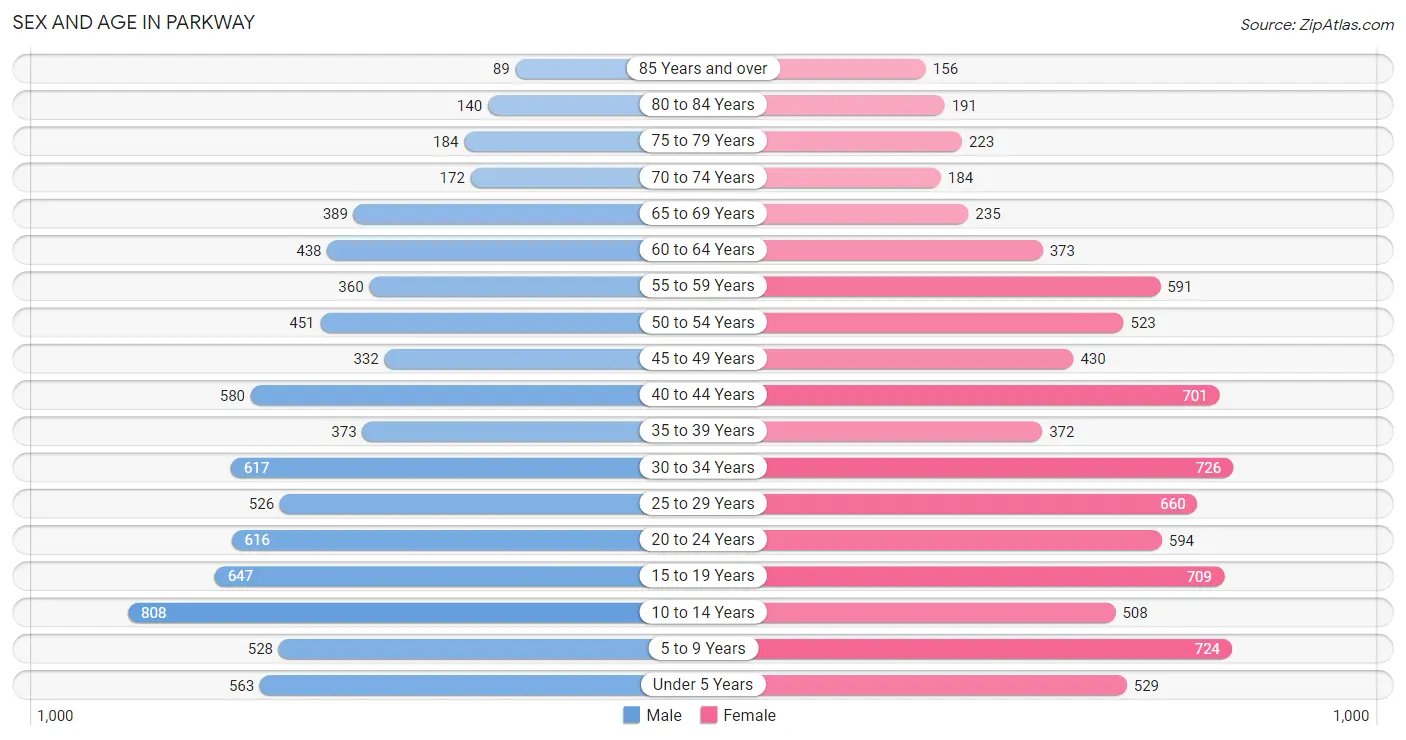
The most populous age groups in Parkway are 10 to 14 Years (808 | 10.3%) for men and 30 to 34 Years (726 | 8.6%) for women.
| Age Bracket | Male | Female |
| Under 5 Years | 563 (7.2%) | 529 (6.3%) |
| 5 to 9 Years | 528 (6.8%) | 724 (8.6%) |
| 10 to 14 Years | 808 (10.3%) | 508 (6.0%) |
| 15 to 19 Years | 647 (8.3%) | 709 (8.4%) |
| 20 to 24 Years | 616 (7.9%) | 594 (7.0%) |
| 25 to 29 Years | 526 (6.7%) | 660 (7.8%) |
| 30 to 34 Years | 617 (7.9%) | 726 (8.6%) |
| 35 to 39 Years | 373 (4.8%) | 372 (4.4%) |
| 40 to 44 Years | 580 (7.4%) | 701 (8.3%) |
| 45 to 49 Years | 332 (4.3%) | 430 (5.1%) |
| 50 to 54 Years | 451 (5.8%) | 523 (6.2%) |
| 55 to 59 Years | 360 (4.6%) | 591 (7.0%) |
| 60 to 64 Years | 438 (5.6%) | 373 (4.4%) |
| 65 to 69 Years | 389 (5.0%) | 235 (2.8%) |
| 70 to 74 Years | 172 (2.2%) | 184 (2.2%) |
| 75 to 79 Years | 184 (2.4%) | 223 (2.6%) |
| 80 to 84 Years | 140 (1.8%) | 191 (2.3%) |
| 85 Years and over | 89 (1.1%) | 156 (1.8%) |
| Total | 7,813 (100.0%) | 8,429 (100.0%) |
Families and Households in Parkway
Median Family Size in Parkway
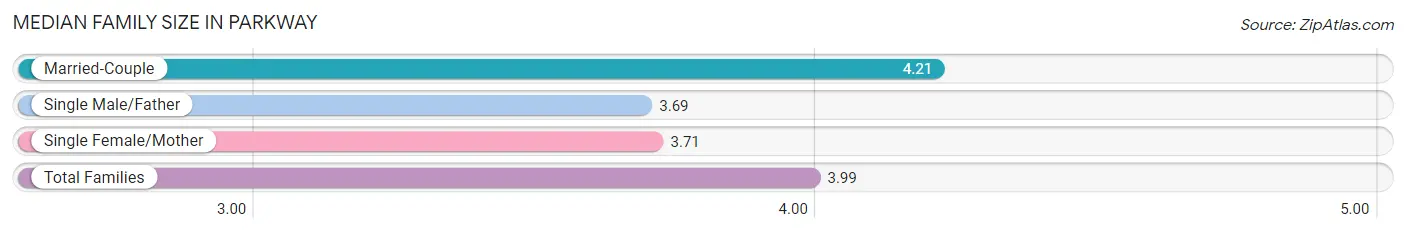
The median family size in Parkway is 3.99 persons per family, with married-couple families (2,036 | 57.7%) accounting for the largest median family size of 4.21 persons per family. On the other hand, single male/father families (413 | 11.7%) represent the smallest median family size with 3.69 persons per family.
| Family Type | # Families | Family Size |
| Married-Couple | 2,036 (57.7%) | 4.21 |
| Single Male/Father | 413 (11.7%) | 3.69 |
| Single Female/Mother | 1,077 (30.5%) | 3.71 |
| Total Families | 3,526 (100.0%) | 3.99 |
Median Household Size in Parkway
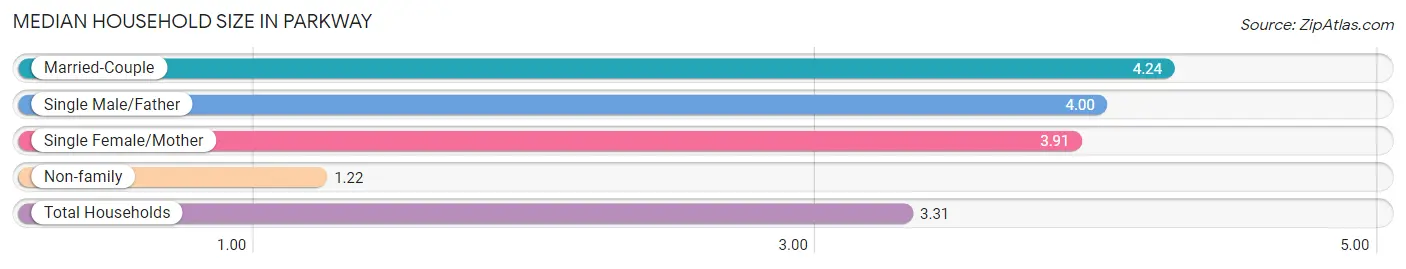
The median household size in Parkway is 3.31 persons per household, with married-couple households (2,036 | 41.7%) accounting for the largest median household size of 4.24 persons per household. non-family households (1,358 | 27.8%) represent the smallest median household size with 1.22 persons per household.
| Household Type | # Households | Household Size |
| Married-Couple | 2,036 (41.7%) | 4.24 |
| Single Male/Father | 413 (8.5%) | 4.00 |
| Single Female/Mother | 1,077 (22.1%) | 3.91 |
| Non-family | 1,358 (27.8%) | 1.22 |
| Total Households | 4,884 (100.0%) | 3.31 |
Household Size by Marriage Status in Parkway
Out of a total of 4,884 households in Parkway, 3,526 (72.2%) are family households, while 1,358 (27.8%) are nonfamily households. The most numerous type of family households are 2-person households, comprising 937, and the most common type of nonfamily households are 1-person households, comprising 1,117.
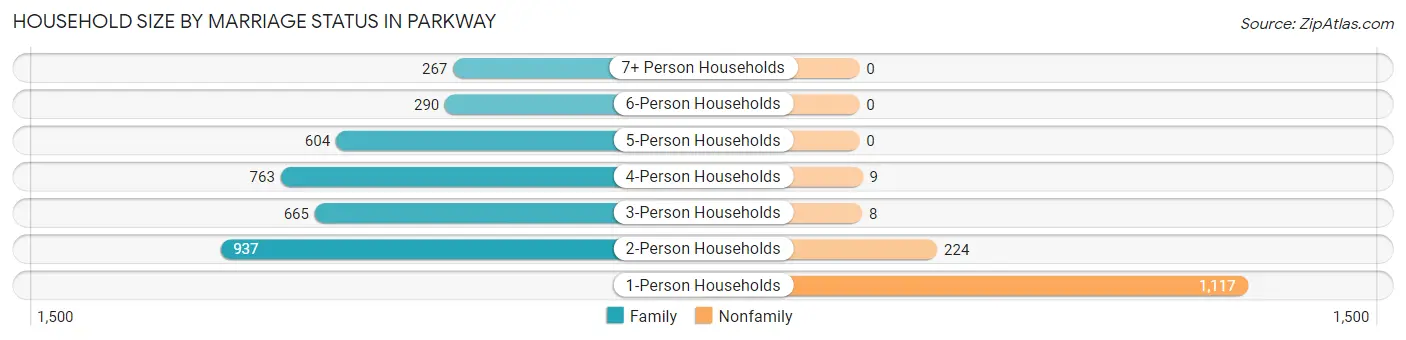
| Household Size | Family Households | Nonfamily Households |
| 1-Person Households | - | 1,117 (22.9%) |
| 2-Person Households | 937 (19.2%) | 224 (4.6%) |
| 3-Person Households | 665 (13.6%) | 8 (0.2%) |
| 4-Person Households | 763 (15.6%) | 9 (0.2%) |
| 5-Person Households | 604 (12.4%) | 0 (0.0%) |
| 6-Person Households | 290 (5.9%) | 0 (0.0%) |
| 7+ Person Households | 267 (5.5%) | 0 (0.0%) |
| Total | 3,526 (72.2%) | 1,358 (27.8%) |
Female Fertility in Parkway
Fertility by Age in Parkway
Average fertility rate in Parkway is 64.0 births per 1,000 women. Women in the age bracket of 20 to 34 years have the highest fertility rate with 126.0 births per 1,000 women. Women in the age bracket of 20 to 34 years acount for 91.9% of all women with births.
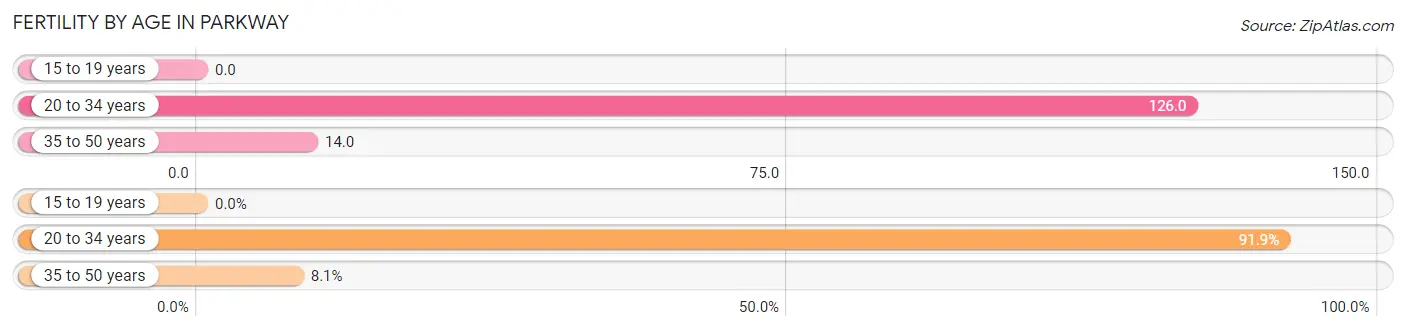
| Age Bracket | Women with Births | Births / 1,000 Women |
| 15 to 19 years | 0 (0.0%) | 0.0 |
| 20 to 34 years | 249 (91.9%) | 126.0 |
| 35 to 50 years | 22 (8.1%) | 14.0 |
| Total | 271 (100.0%) | 64.0 |
Fertility by Age by Marriage Status in Parkway
22.5% of women with births (271) in Parkway are married. The highest percentage of unmarried women with births falls into 20 to 34 years age bracket with 80.3% of them unmarried at the time of birth, while the lowest percentage of unmarried women with births belong to 35 to 50 years age bracket with 45.5% of them unmarried.
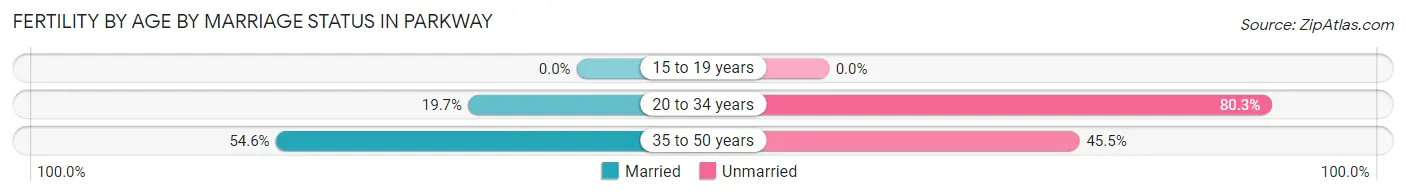
| Age Bracket | Married | Unmarried |
| 15 to 19 years | 0 (0.0%) | 0 (0.0%) |
| 20 to 34 years | 49 (19.7%) | 200 (80.3%) |
| 35 to 50 years | 12 (54.5%) | 10 (45.5%) |
| Total | 61 (22.5%) | 210 (77.5%) |
Fertility by Education in Parkway
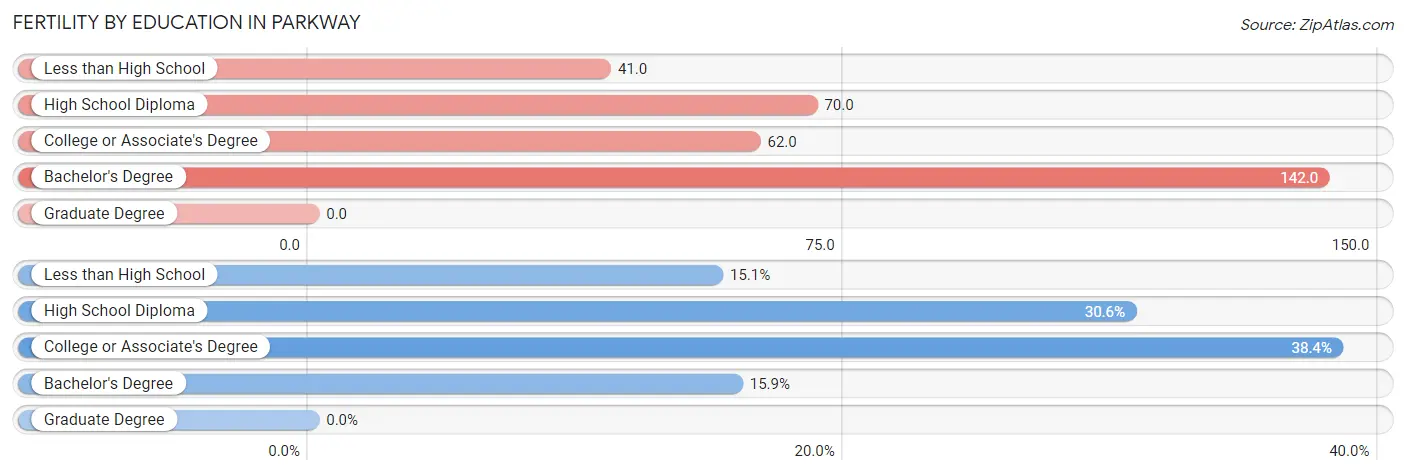
| Educational Attainment | Women with Births | Births / 1,000 Women |
| Less than High School | 41 (15.1%) | 41.0 |
| High School Diploma | 83 (30.6%) | 70.0 |
| College or Associate's Degree | 104 (38.4%) | 62.0 |
| Bachelor's Degree | 43 (15.9%) | 142.0 |
| Graduate Degree | 0 (0.0%) | 0.0 |
| Total | 271 (100.0%) | 64.0 |
Fertility by Education by Marriage Status in Parkway
77.5% of women with births in Parkway are unmarried. Women with the educational attainment of high school diploma are most likely to be married with 73.5% of them married at childbirth, while women with the educational attainment of less than high school are least likely to be married with 100.0% of them unmarried at childbirth.
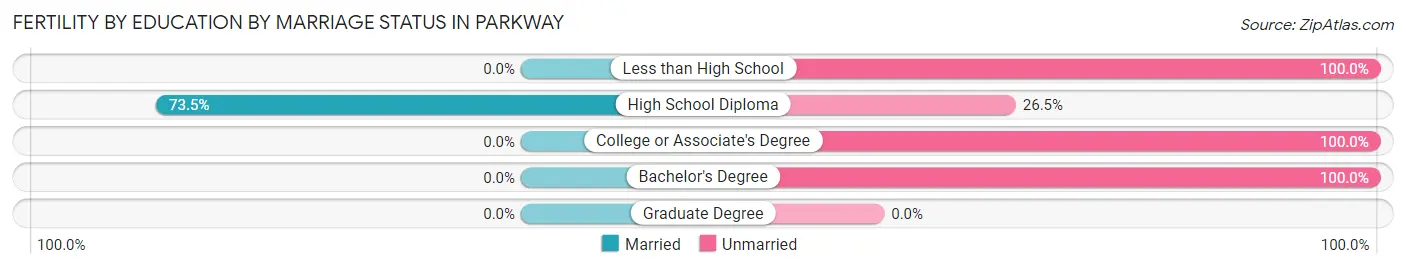
| Educational Attainment | Married | Unmarried |
| Less than High School | 0 (0.0%) | 41 (100.0%) |
| High School Diploma | 61 (73.5%) | 22 (26.5%) |
| College or Associate's Degree | 0 (0.0%) | 104 (100.0%) |
| Bachelor's Degree | 0 (0.0%) | 43 (100.0%) |
| Graduate Degree | 0 (0.0%) | 0 (0.0%) |
| Total | 61 (22.5%) | 210 (77.5%) |
Employment Characteristics in Parkway
Employment by Class of Employer in Parkway
Among the 6,186 employed individuals in Parkway, private company employees (4,291 | 69.4%), self-employed (not incorporated) (466 | 7.5%), and state government employees (369 | 6.0%) make up the most common classes of employment.
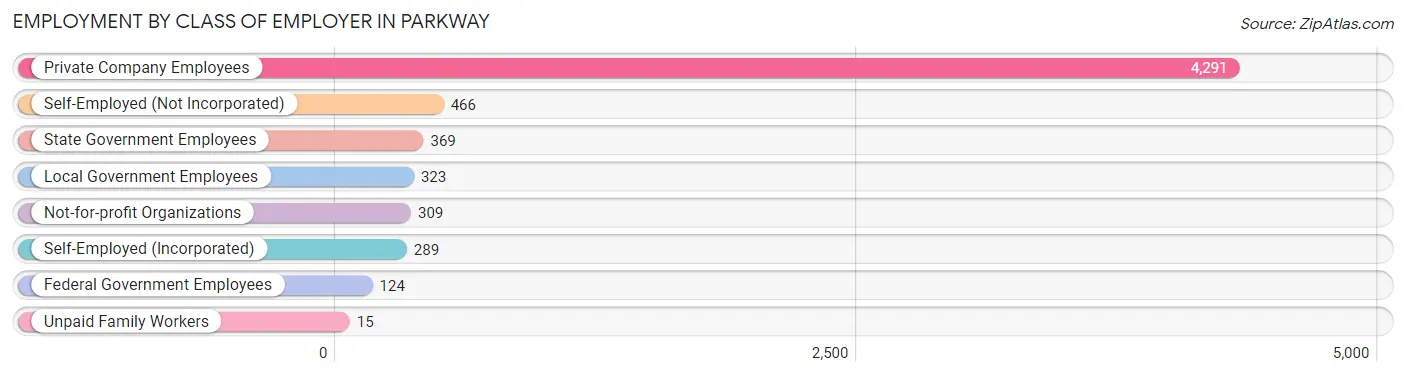
| Employer Class | # Employees | % Employees |
| Private Company Employees | 4,291 | 69.4% |
| Self-Employed (Incorporated) | 289 | 4.7% |
| Self-Employed (Not Incorporated) | 466 | 7.5% |
| Not-for-profit Organizations | 309 | 5.0% |
| Local Government Employees | 323 | 5.2% |
| State Government Employees | 369 | 6.0% |
| Federal Government Employees | 124 | 2.0% |
| Unpaid Family Workers | 15 | 0.2% |
| Total | 6,186 | 100.0% |
Employment Status by Age in Parkway
According to the labor force statistics for Parkway, out of the total population over 16 years of age (12,347), 58.5% or 7,223 individuals are in the labor force, with 11.5% or 831 of them unemployed. The age group with the highest labor force participation rate is 20 to 24 years, with 82.0% or 992 individuals in the labor force. Within the labor force, the 16 to 19 years age range has the highest percentage of unemployed individuals, with 35.2% or 112 of them being unemployed.
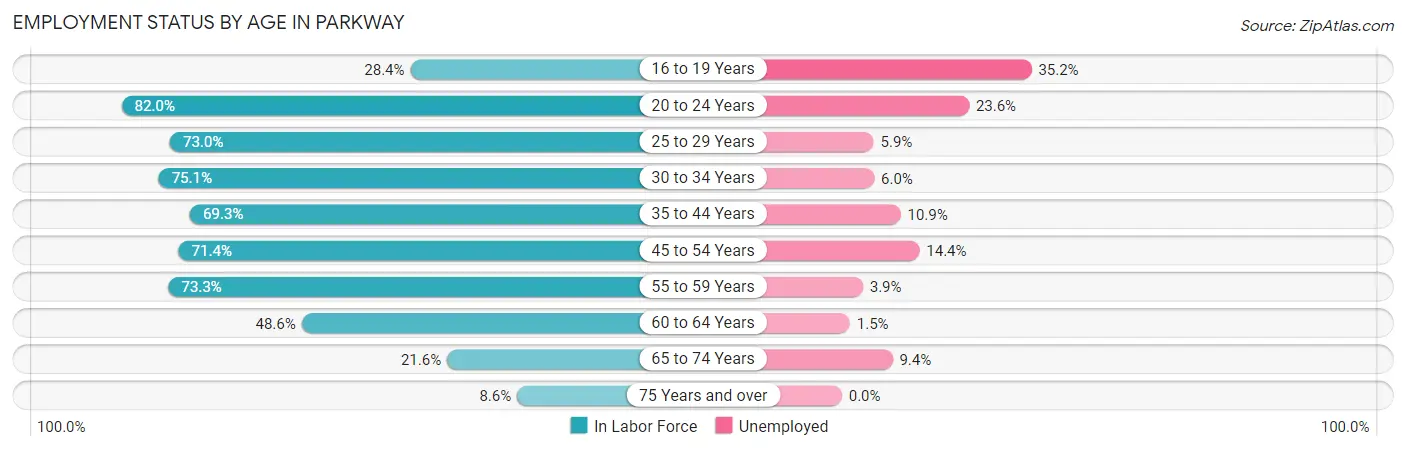
| Age Bracket | In Labor Force | Unemployed |
| 16 to 19 Years | 318 (28.4%) | 112 (35.2%) |
| 20 to 24 Years | 992 (82.0%) | 234 (23.6%) |
| 25 to 29 Years | 866 (73.0%) | 51 (5.9%) |
| 30 to 34 Years | 1,009 (75.1%) | 61 (6.0%) |
| 35 to 44 Years | 1,404 (69.3%) | 153 (10.9%) |
| 45 to 54 Years | 1,240 (71.4%) | 179 (14.4%) |
| 55 to 59 Years | 697 (73.3%) | 27 (3.9%) |
| 60 to 64 Years | 394 (48.6%) | 6 (1.5%) |
| 65 to 74 Years | 212 (21.6%) | 20 (9.4%) |
| 75 Years and over | 85 (8.6%) | 0 (0.0%) |
| Total | 7,223 (58.5%) | 831 (11.5%) |
Employment Status by Educational Attainment in Parkway
According to labor force statistics for Parkway, 69.7% of individuals (5,613) out of the total population between 25 and 64 years of age (8,053) are in the labor force, with 8.5% or 477 of them being unemployed. The group with the highest labor force participation rate are those with the educational attainment of bachelor's degree or higher, with 77.7% or 615 individuals in the labor force. Within the labor force, individuals with high school diploma education have the highest percentage of unemployment, with 11.5% or 200 of them being unemployed.
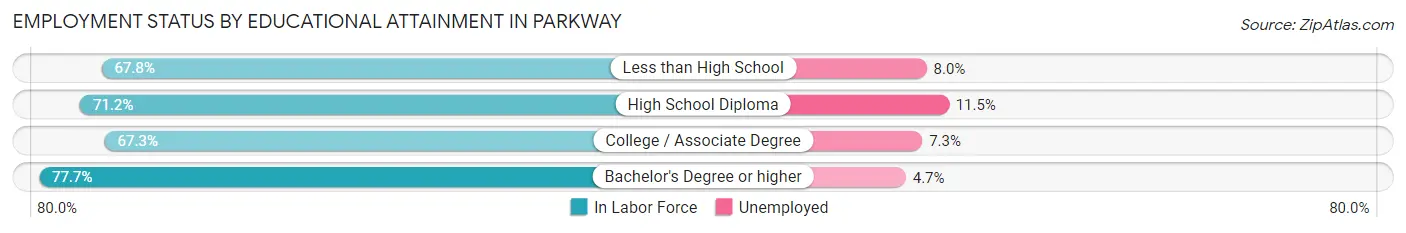
| Educational Attainment | In Labor Force | Unemployed |
| Less than High School | 1,445 (67.8%) | 170 (8.0%) |
| High School Diploma | 1,743 (71.2%) | 282 (11.5%) |
| College / Associate Degree | 1,806 (67.3%) | 196 (7.3%) |
| Bachelor's Degree or higher | 615 (77.7%) | 37 (4.7%) |
| Total | 5,613 (69.7%) | 685 (8.5%) |
Employment Occupations by Sex in Parkway
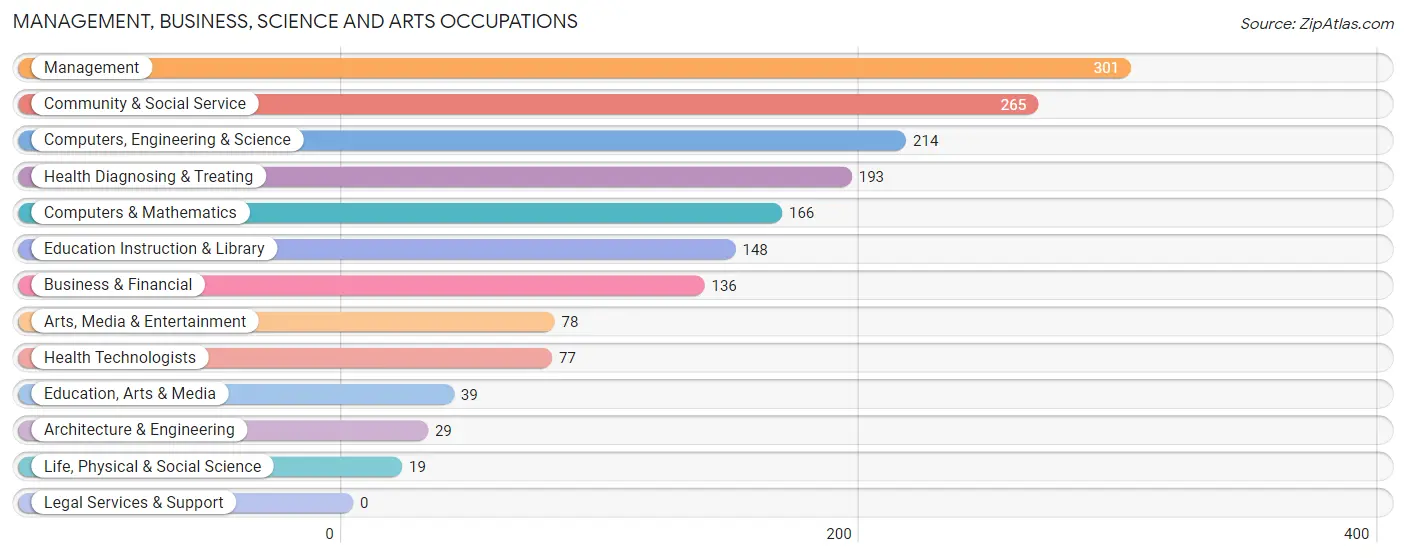
Management, Business, Science and Arts Occupations
The most common Management, Business, Science and Arts occupations in Parkway are Management (301 | 4.8%), Community & Social Service (265 | 4.2%), Computers, Engineering & Science (214 | 3.4%), Health Diagnosing & Treating (193 | 3.0%), and Computers & Mathematics (166 | 2.6%).
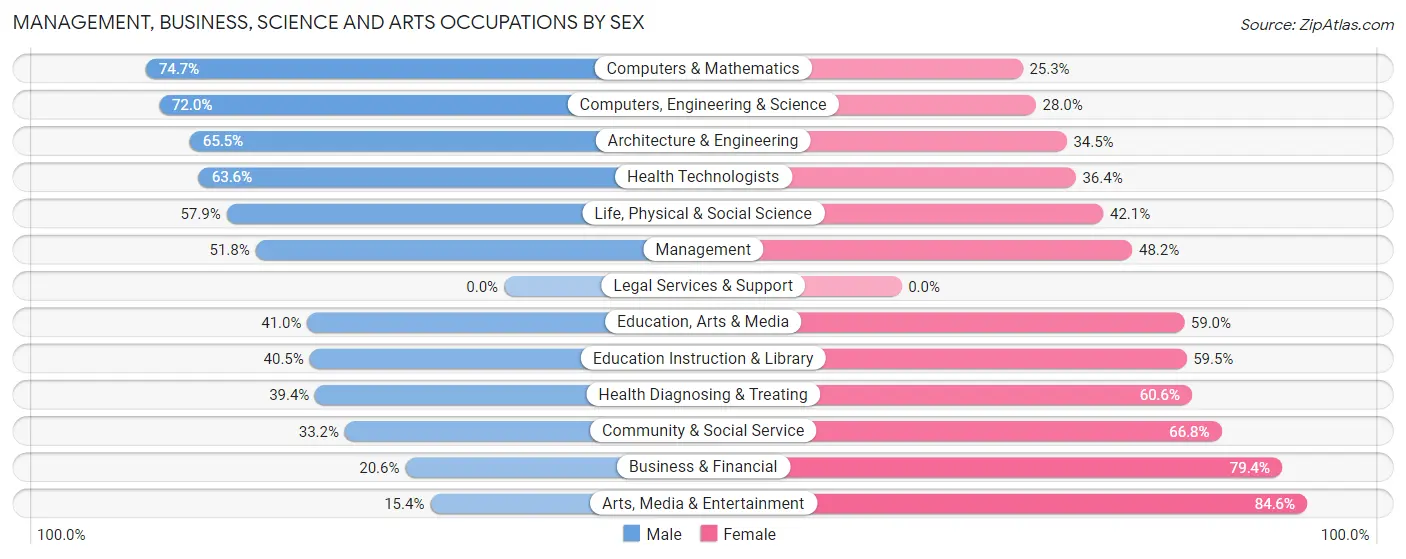
Management, Business, Science and Arts Occupations by Sex
Within the Management, Business, Science and Arts occupations in Parkway, the most male-oriented occupations are Computers & Mathematics (74.7%), Computers, Engineering & Science (72.0%), and Architecture & Engineering (65.5%), while the most female-oriented occupations are Arts, Media & Entertainment (84.6%), Business & Financial (79.4%), and Community & Social Service (66.8%).
| Occupation | Male | Female |
| Management | 156 (51.8%) | 145 (48.2%) |
| Business & Financial | 28 (20.6%) | 108 (79.4%) |
| Computers, Engineering & Science | 154 (72.0%) | 60 (28.0%) |
| Computers & Mathematics | 124 (74.7%) | 42 (25.3%) |
| Architecture & Engineering | 19 (65.5%) | 10 (34.5%) |
| Life, Physical & Social Science | 11 (57.9%) | 8 (42.1%) |
| Community & Social Service | 88 (33.2%) | 177 (66.8%) |
| Education, Arts & Media | 16 (41.0%) | 23 (59.0%) |
| Legal Services & Support | 0 (0.0%) | 0 (0.0%) |
| Education Instruction & Library | 60 (40.5%) | 88 (59.5%) |
| Arts, Media & Entertainment | 12 (15.4%) | 66 (84.6%) |
| Health Diagnosing & Treating | 76 (39.4%) | 117 (60.6%) |
| Health Technologists | 49 (63.6%) | 28 (36.4%) |
| Total (Category) | 502 (45.3%) | 607 (54.7%) |
| Total (Overall) | 3,374 (53.2%) | 2,963 (46.8%) |
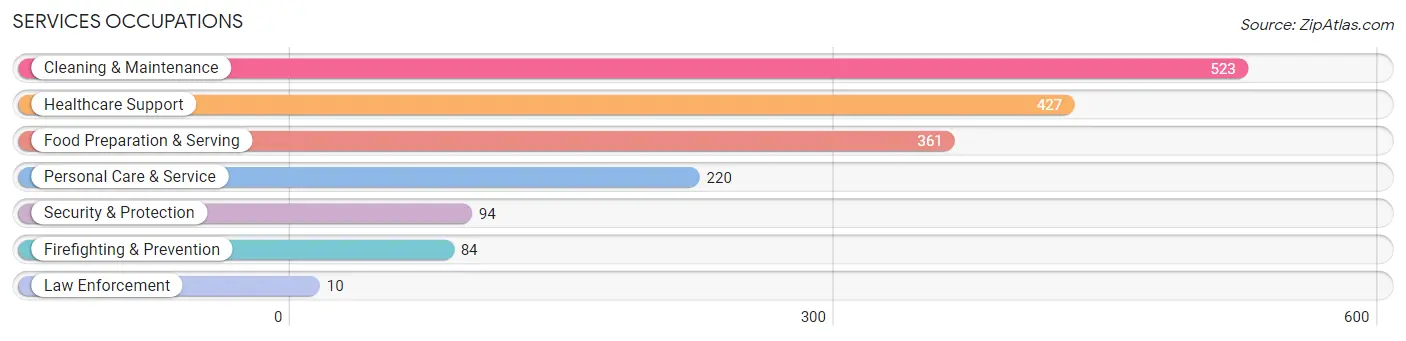
Services Occupations
The most common Services occupations in Parkway are Cleaning & Maintenance (523 | 8.3%), Healthcare Support (427 | 6.7%), Food Preparation & Serving (361 | 5.7%), Personal Care & Service (220 | 3.5%), and Security & Protection (94 | 1.5%).
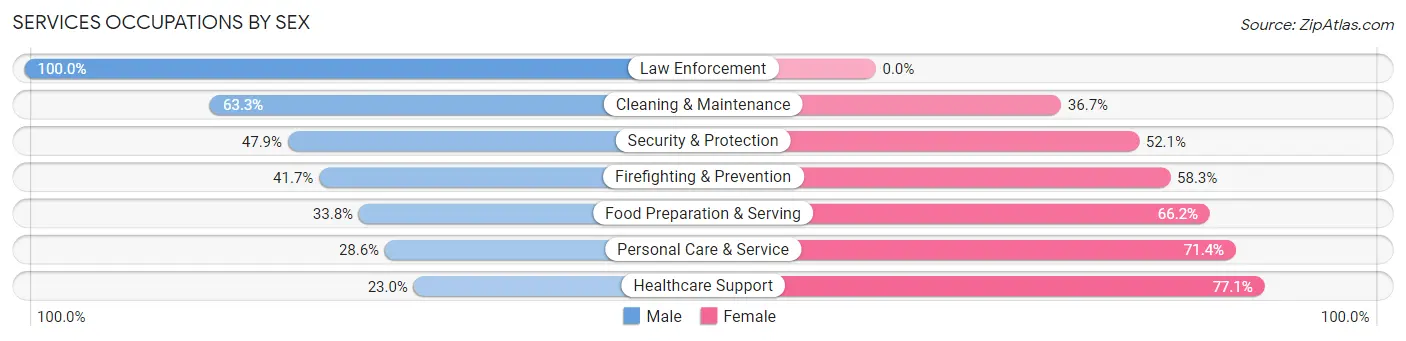
Services Occupations by Sex
Within the Services occupations in Parkway, the most male-oriented occupations are Law Enforcement (100.0%), Cleaning & Maintenance (63.3%), and Security & Protection (47.9%), while the most female-oriented occupations are Healthcare Support (77.0%), Personal Care & Service (71.4%), and Food Preparation & Serving (66.2%).
| Occupation | Male | Female |
| Healthcare Support | 98 (23.0%) | 329 (77.0%) |
| Security & Protection | 45 (47.9%) | 49 (52.1%) |
| Firefighting & Prevention | 35 (41.7%) | 49 (58.3%) |
| Law Enforcement | 10 (100.0%) | 0 (0.0%) |
| Food Preparation & Serving | 122 (33.8%) | 239 (66.2%) |
| Cleaning & Maintenance | 331 (63.3%) | 192 (36.7%) |
| Personal Care & Service | 63 (28.6%) | 157 (71.4%) |
| Total (Category) | 659 (40.6%) | 966 (59.5%) |
| Total (Overall) | 3,374 (53.2%) | 2,963 (46.8%) |
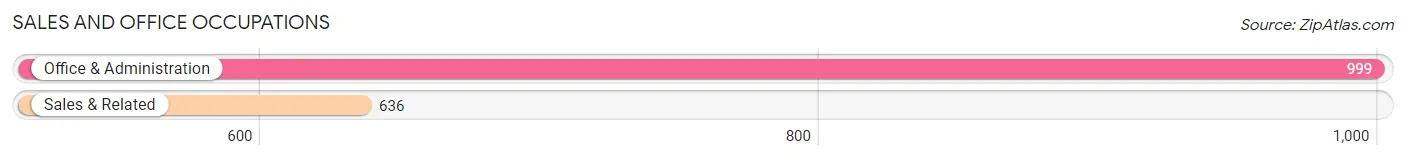
Sales and Office Occupations
The most common Sales and Office occupations in Parkway are Office & Administration (999 | 15.8%), and Sales & Related (636 | 10.0%).
Sales and Office Occupations by Sex
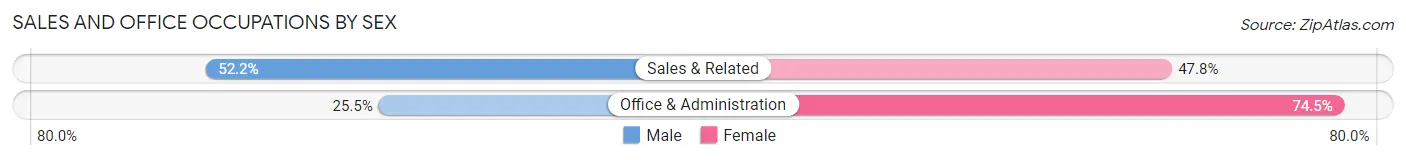
| Occupation | Male | Female |
| Sales & Related | 332 (52.2%) | 304 (47.8%) |
| Office & Administration | 255 (25.5%) | 744 (74.5%) |
| Total (Category) | 587 (35.9%) | 1,048 (64.1%) |
| Total (Overall) | 3,374 (53.2%) | 2,963 (46.8%) |
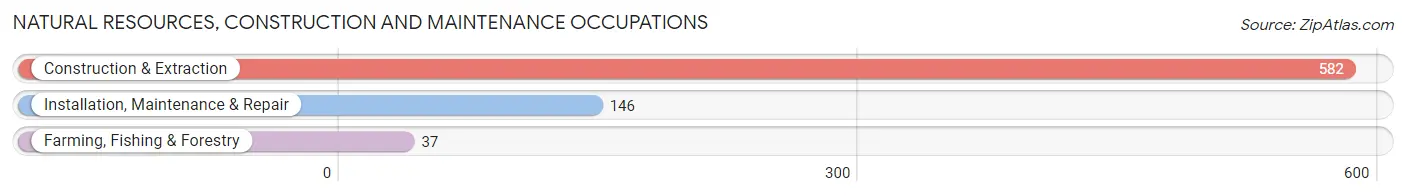
Natural Resources, Construction and Maintenance Occupations
The most common Natural Resources, Construction and Maintenance occupations in Parkway are Construction & Extraction (582 | 9.2%), Installation, Maintenance & Repair (146 | 2.3%), and Farming, Fishing & Forestry (37 | 0.6%).
Natural Resources, Construction and Maintenance Occupations by Sex
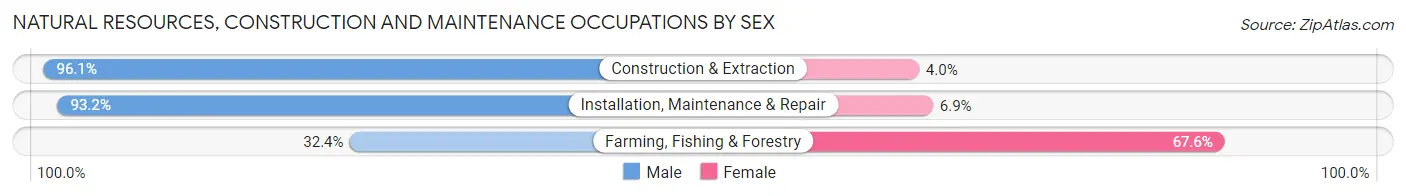
| Occupation | Male | Female |
| Farming, Fishing & Forestry | 12 (32.4%) | 25 (67.6%) |
| Construction & Extraction | 559 (96.1%) | 23 (4.0%) |
| Installation, Maintenance & Repair | 136 (93.1%) | 10 (6.9%) |
| Total (Category) | 707 (92.4%) | 58 (7.6%) |
| Total (Overall) | 3,374 (53.2%) | 2,963 (46.8%) |
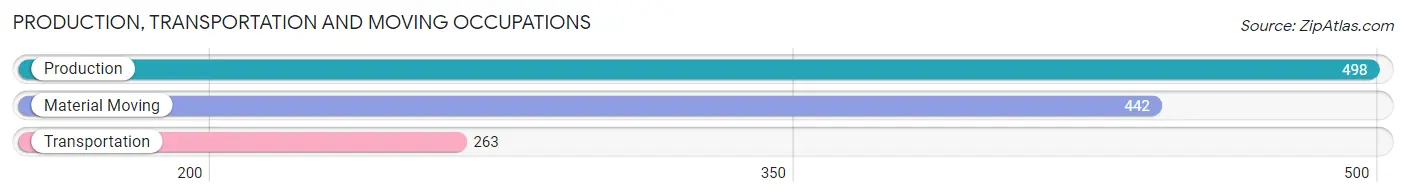
Production, Transportation and Moving Occupations
The most common Production, Transportation and Moving occupations in Parkway are Production (498 | 7.9%), Material Moving (442 | 7.0%), and Transportation (263 | 4.2%).
Production, Transportation and Moving Occupations by Sex
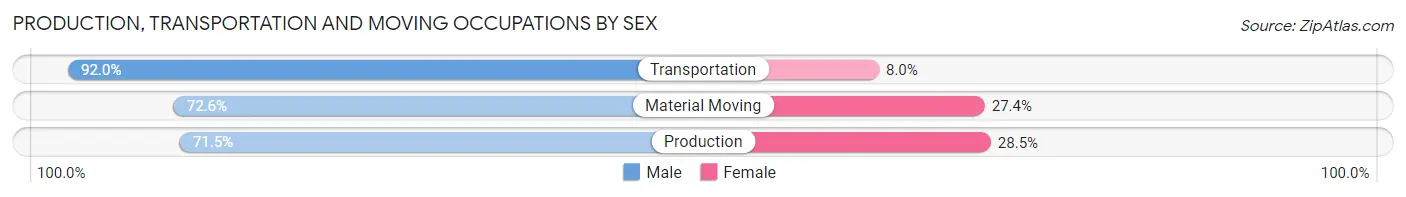
| Occupation | Male | Female |
| Production | 356 (71.5%) | 142 (28.5%) |
| Transportation | 242 (92.0%) | 21 (8.0%) |
| Material Moving | 321 (72.6%) | 121 (27.4%) |
| Total (Category) | 919 (76.4%) | 284 (23.6%) |
| Total (Overall) | 3,374 (53.2%) | 2,963 (46.8%) |
Employment Industries by Sex in Parkway
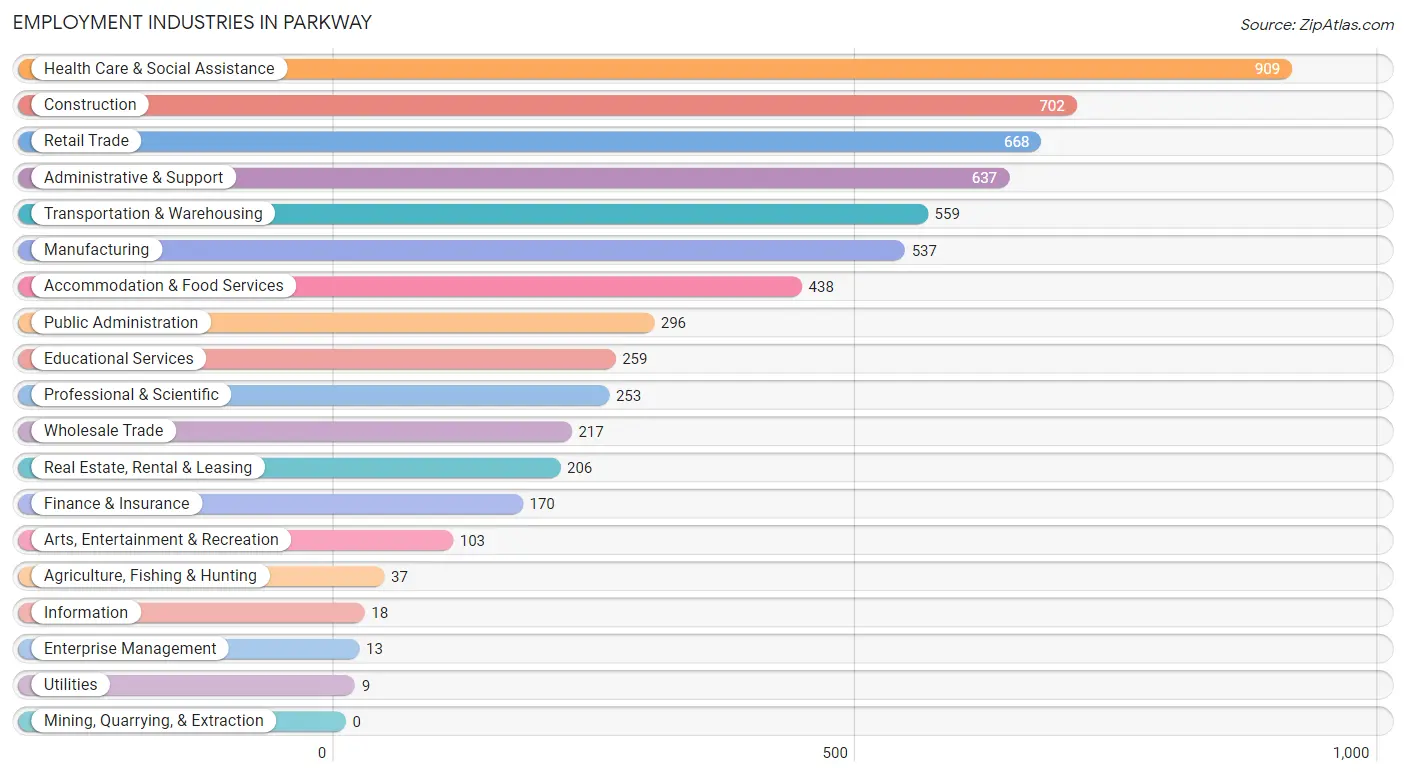
Employment Industries in Parkway
The major employment industries in Parkway include Health Care & Social Assistance (909 | 14.3%), Construction (702 | 11.1%), Retail Trade (668 | 10.5%), Administrative & Support (637 | 10.1%), and Transportation & Warehousing (559 | 8.8%).
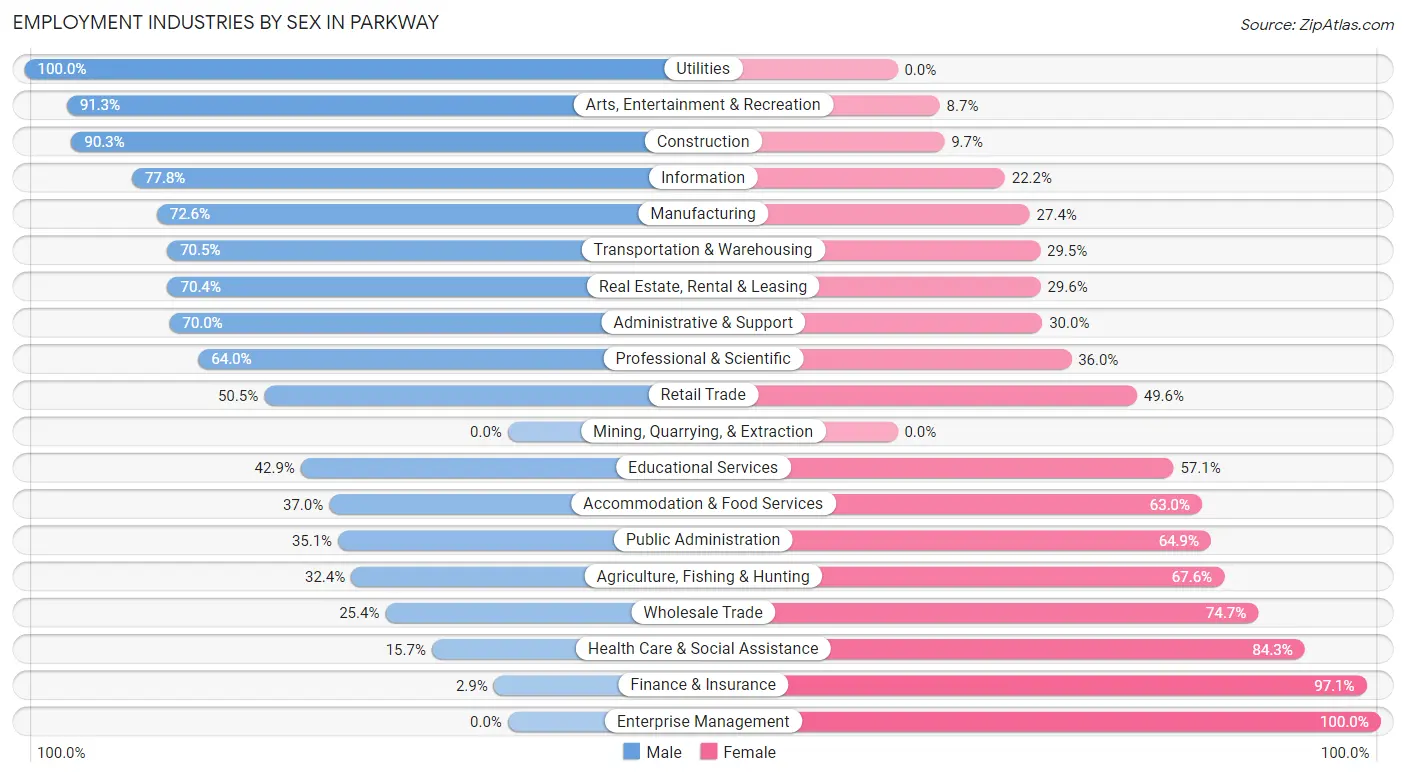
Employment Industries by Sex in Parkway
The Parkway industries that see more men than women are Utilities (100.0%), Arts, Entertainment & Recreation (91.3%), and Construction (90.3%), whereas the industries that tend to have a higher number of women are Enterprise Management (100.0%), Finance & Insurance (97.1%), and Health Care & Social Assistance (84.3%).
| Industry | Male | Female |
| Agriculture, Fishing & Hunting | 12 (32.4%) | 25 (67.6%) |
| Mining, Quarrying, & Extraction | 0 (0.0%) | 0 (0.0%) |
| Construction | 634 (90.3%) | 68 (9.7%) |
| Manufacturing | 390 (72.6%) | 147 (27.4%) |
| Wholesale Trade | 55 (25.4%) | 162 (74.7%) |
| Retail Trade | 337 (50.4%) | 331 (49.5%) |
| Transportation & Warehousing | 394 (70.5%) | 165 (29.5%) |
| Utilities | 9 (100.0%) | 0 (0.0%) |
| Information | 14 (77.8%) | 4 (22.2%) |
| Finance & Insurance | 5 (2.9%) | 165 (97.1%) |
| Real Estate, Rental & Leasing | 145 (70.4%) | 61 (29.6%) |
| Professional & Scientific | 162 (64.0%) | 91 (36.0%) |
| Enterprise Management | 0 (0.0%) | 13 (100.0%) |
| Administrative & Support | 446 (70.0%) | 191 (30.0%) |
| Educational Services | 111 (42.9%) | 148 (57.1%) |
| Health Care & Social Assistance | 143 (15.7%) | 766 (84.3%) |
| Arts, Entertainment & Recreation | 94 (91.3%) | 9 (8.7%) |
| Accommodation & Food Services | 162 (37.0%) | 276 (63.0%) |
| Public Administration | 104 (35.1%) | 192 (64.9%) |
| Total | 3,374 (53.2%) | 2,963 (46.8%) |
Education in Parkway
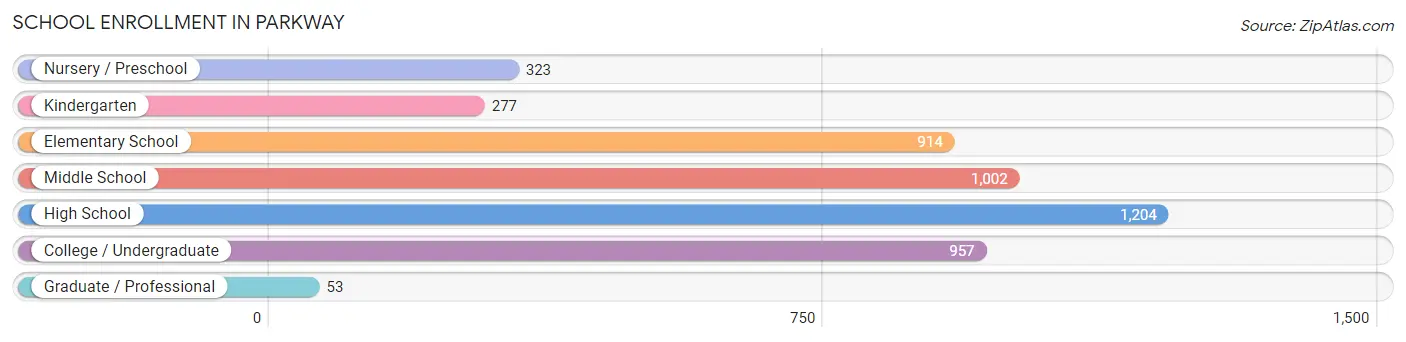
School Enrollment in Parkway
The most common levels of schooling among the 4,730 students in Parkway are high school (1,204 | 25.5%), middle school (1,002 | 21.2%), and college / undergraduate (957 | 20.2%).
| School Level | # Students | % Students |
| Nursery / Preschool | 323 | 6.8% |
| Kindergarten | 277 | 5.9% |
| Elementary School | 914 | 19.3% |
| Middle School | 1,002 | 21.2% |
| High School | 1,204 | 25.5% |
| College / Undergraduate | 957 | 20.2% |
| Graduate / Professional | 53 | 1.1% |
| Total | 4,730 | 100.0% |
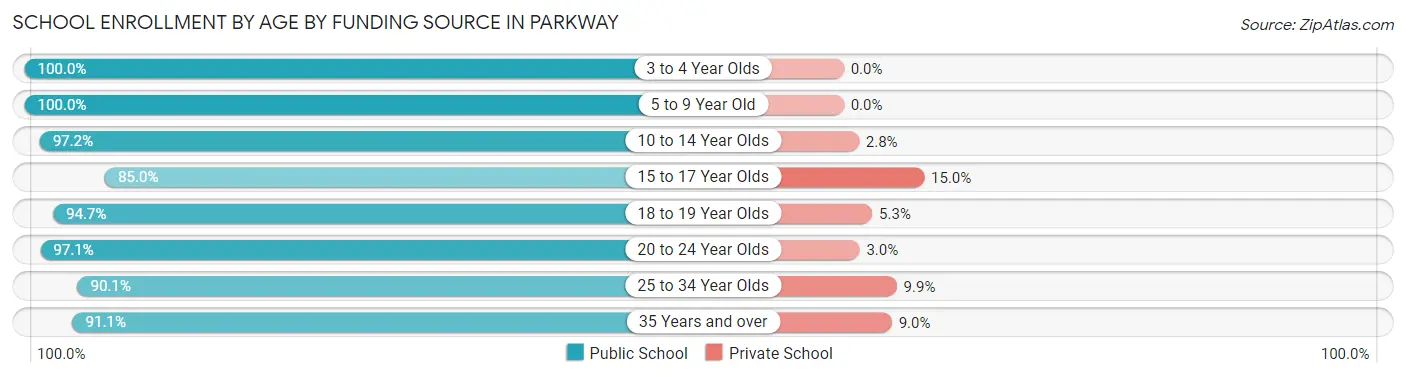
School Enrollment by Age by Funding Source in Parkway
Out of a total of 4,730 students who are enrolled in schools in Parkway, 222 (4.7%) attend a private institution, while the remaining 4,508 (95.3%) are enrolled in public schools. The age group of 15 to 17 year olds has the highest likelihood of being enrolled in private schools, with 120 (15.0% in the age bracket) enrolled. Conversely, the age group of 3 to 4 year olds has the lowest likelihood of being enrolled in a private school, with 224 (100.0% in the age bracket) attending a public institution.
| Age Bracket | Public School | Private School |
| 3 to 4 Year Olds | 224 (100.0%) | 0 (0.0%) |
| 5 to 9 Year Old | 1,175 (100.0%) | 0 (0.0%) |
| 10 to 14 Year Olds | 1,269 (97.2%) | 37 (2.8%) |
| 15 to 17 Year Olds | 681 (85.0%) | 120 (15.0%) |
| 18 to 19 Year Olds | 321 (94.7%) | 18 (5.3%) |
| 20 to 24 Year Olds | 527 (97.1%) | 16 (2.9%) |
| 25 to 34 Year Olds | 137 (90.1%) | 15 (9.9%) |
| 35 Years and over | 173 (91.0%) | 17 (8.9%) |
| Total | 4,508 (95.3%) | 222 (4.7%) |
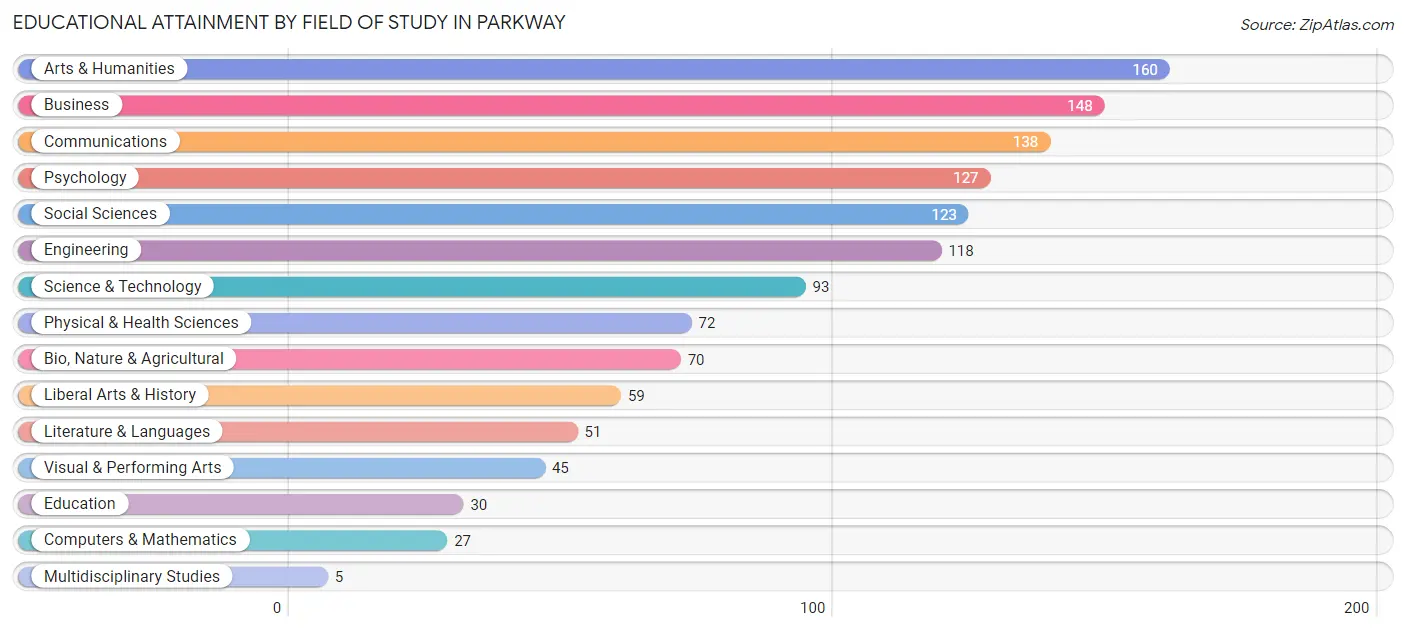
Educational Attainment by Field of Study in Parkway
Arts & humanities (160 | 12.6%), business (148 | 11.7%), communications (138 | 10.9%), psychology (127 | 10.0%), and social sciences (123 | 9.7%) are the most common fields of study among 1,266 individuals in Parkway who have obtained a bachelor's degree or higher.
| Field of Study | # Graduates | % Graduates |
| Computers & Mathematics | 27 | 2.1% |
| Bio, Nature & Agricultural | 70 | 5.5% |
| Physical & Health Sciences | 72 | 5.7% |
| Psychology | 127 | 10.0% |
| Social Sciences | 123 | 9.7% |
| Engineering | 118 | 9.3% |
| Multidisciplinary Studies | 5 | 0.4% |
| Science & Technology | 93 | 7.3% |
| Business | 148 | 11.7% |
| Education | 30 | 2.4% |
| Literature & Languages | 51 | 4.0% |
| Liberal Arts & History | 59 | 4.7% |
| Visual & Performing Arts | 45 | 3.5% |
| Communications | 138 | 10.9% |
| Arts & Humanities | 160 | 12.6% |
| Total | 1,266 | 100.0% |
Transportation & Commute in Parkway
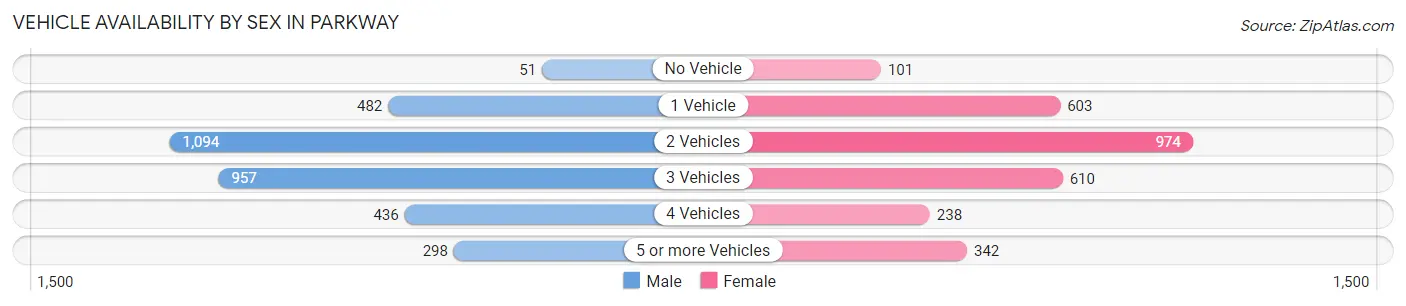
Vehicle Availability by Sex in Parkway
The most prevalent vehicle ownership categories in Parkway are males with 2 vehicles (1,094, accounting for 33.0%) and females with 2 vehicles (974, making up 38.2%).
| Vehicles Available | Male | Female |
| No Vehicle | 51 (1.5%) | 101 (3.5%) |
| 1 Vehicle | 482 (14.5%) | 603 (21.0%) |
| 2 Vehicles | 1,094 (33.0%) | 974 (34.0%) |
| 3 Vehicles | 957 (28.8%) | 610 (21.3%) |
| 4 Vehicles | 436 (13.1%) | 238 (8.3%) |
| 5 or more Vehicles | 298 (9.0%) | 342 (11.9%) |
| Total | 3,318 (100.0%) | 2,868 (100.0%) |
Commute Time in Parkway
The most frequently occuring commute durations in Parkway are 30 to 34 minutes (1,244 commuters, 21.6%), 15 to 19 minutes (1,214 commuters, 21.1%), and 20 to 24 minutes (999 commuters, 17.4%).
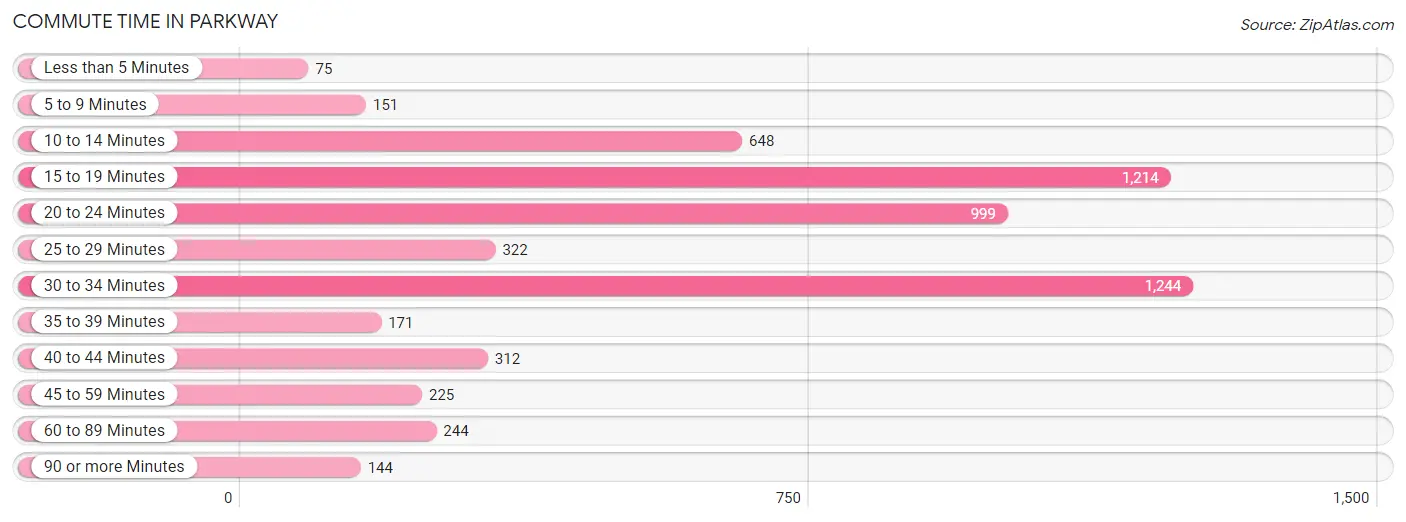
| Commute Time | # Commuters | % Commuters |
| Less than 5 Minutes | 75 | 1.3% |
| 5 to 9 Minutes | 151 | 2.6% |
| 10 to 14 Minutes | 648 | 11.3% |
| 15 to 19 Minutes | 1,214 | 21.1% |
| 20 to 24 Minutes | 999 | 17.4% |
| 25 to 29 Minutes | 322 | 5.6% |
| 30 to 34 Minutes | 1,244 | 21.6% |
| 35 to 39 Minutes | 171 | 3.0% |
| 40 to 44 Minutes | 312 | 5.4% |
| 45 to 59 Minutes | 225 | 3.9% |
| 60 to 89 Minutes | 244 | 4.2% |
| 90 or more Minutes | 144 | 2.5% |
Commute Time by Sex in Parkway
The most common commute times in Parkway are 30 to 34 minutes (619 commuters, 20.0%) for males and 15 to 19 minutes (684 commuters, 25.7%) for females.
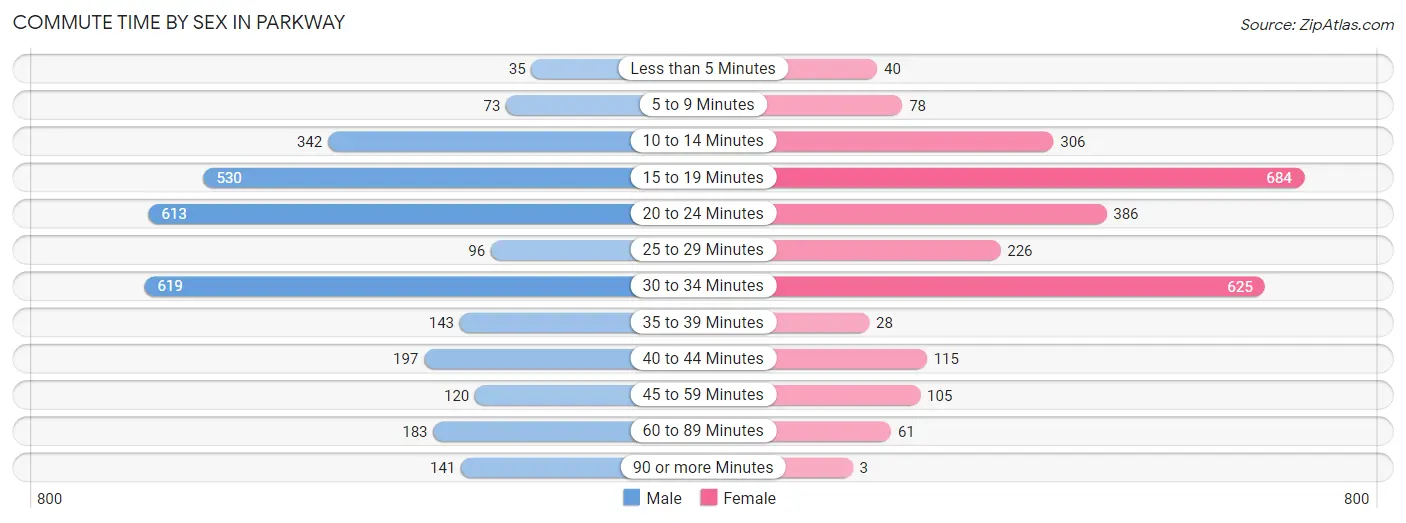
| Commute Time | Male | Female |
| Less than 5 Minutes | 35 (1.1%) | 40 (1.5%) |
| 5 to 9 Minutes | 73 (2.4%) | 78 (2.9%) |
| 10 to 14 Minutes | 342 (11.1%) | 306 (11.5%) |
| 15 to 19 Minutes | 530 (17.1%) | 684 (25.7%) |
| 20 to 24 Minutes | 613 (19.8%) | 386 (14.5%) |
| 25 to 29 Minutes | 96 (3.1%) | 226 (8.5%) |
| 30 to 34 Minutes | 619 (20.0%) | 625 (23.5%) |
| 35 to 39 Minutes | 143 (4.6%) | 28 (1.1%) |
| 40 to 44 Minutes | 197 (6.4%) | 115 (4.3%) |
| 45 to 59 Minutes | 120 (3.9%) | 105 (4.0%) |
| 60 to 89 Minutes | 183 (5.9%) | 61 (2.3%) |
| 90 or more Minutes | 141 (4.6%) | 3 (0.1%) |
Time of Departure to Work by Sex in Parkway
The most frequent times of departure to work in Parkway are 6:00 AM to 6:29 AM (425, 13.8%) for males and 7:00 AM to 7:29 AM (496, 18.7%) for females.
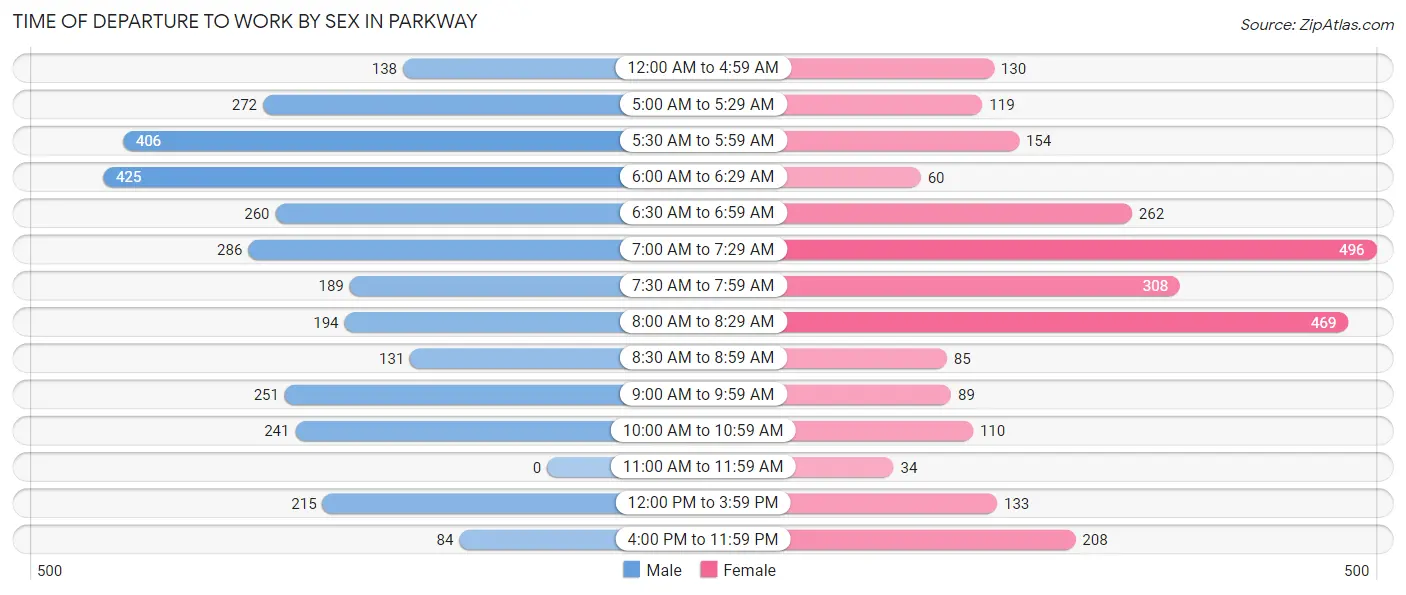
| Time of Departure | Male | Female |
| 12:00 AM to 4:59 AM | 138 (4.5%) | 130 (4.9%) |
| 5:00 AM to 5:29 AM | 272 (8.8%) | 119 (4.5%) |
| 5:30 AM to 5:59 AM | 406 (13.1%) | 154 (5.8%) |
| 6:00 AM to 6:29 AM | 425 (13.8%) | 60 (2.3%) |
| 6:30 AM to 6:59 AM | 260 (8.4%) | 262 (9.9%) |
| 7:00 AM to 7:29 AM | 286 (9.2%) | 496 (18.7%) |
| 7:30 AM to 7:59 AM | 189 (6.1%) | 308 (11.6%) |
| 8:00 AM to 8:29 AM | 194 (6.3%) | 469 (17.6%) |
| 8:30 AM to 8:59 AM | 131 (4.2%) | 85 (3.2%) |
| 9:00 AM to 9:59 AM | 251 (8.1%) | 89 (3.4%) |
| 10:00 AM to 10:59 AM | 241 (7.8%) | 110 (4.1%) |
| 11:00 AM to 11:59 AM | 0 (0.0%) | 34 (1.3%) |
| 12:00 PM to 3:59 PM | 215 (7.0%) | 133 (5.0%) |
| 4:00 PM to 11:59 PM | 84 (2.7%) | 208 (7.8%) |
| Total | 3,092 (100.0%) | 2,657 (100.0%) |
Housing Occupancy in Parkway
Occupancy by Ownership in Parkway
Of the total 4,884 dwellings in Parkway, owner-occupied units account for 2,299 (47.1%), while renter-occupied units make up 2,585 (52.9%).
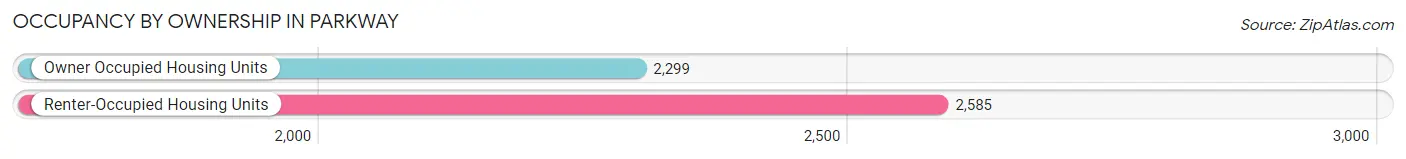
| Occupancy | # Housing Units | % Housing Units |
| Owner Occupied Housing Units | 2,299 | 47.1% |
| Renter-Occupied Housing Units | 2,585 | 52.9% |
| Total Occupied Housing Units | 4,884 | 100.0% |
Occupancy by Household Size in Parkway
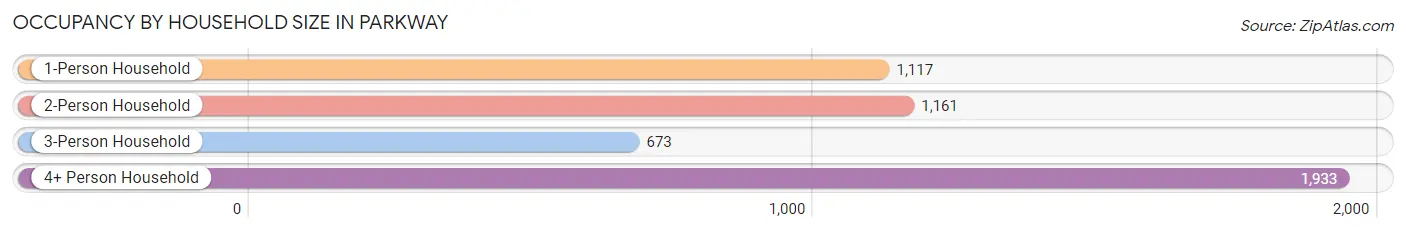
| Household Size | # Housing Units | % Housing Units |
| 1-Person Household | 1,117 | 22.9% |
| 2-Person Household | 1,161 | 23.8% |
| 3-Person Household | 673 | 13.8% |
| 4+ Person Household | 1,933 | 39.6% |
| Total Housing Units | 4,884 | 100.0% |
Occupancy by Ownership by Household Size in Parkway
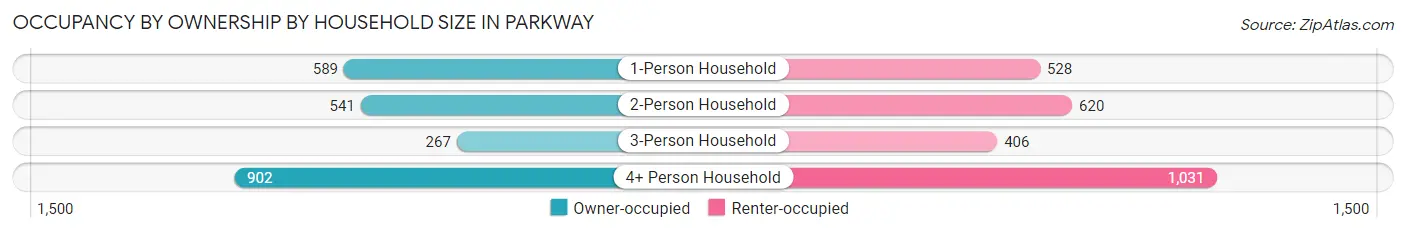
| Household Size | Owner-occupied | Renter-occupied |
| 1-Person Household | 589 (52.7%) | 528 (47.3%) |
| 2-Person Household | 541 (46.6%) | 620 (53.4%) |
| 3-Person Household | 267 (39.7%) | 406 (60.3%) |
| 4+ Person Household | 902 (46.7%) | 1,031 (53.3%) |
| Total Housing Units | 2,299 (47.1%) | 2,585 (52.9%) |
Occupancy by Educational Attainment in Parkway
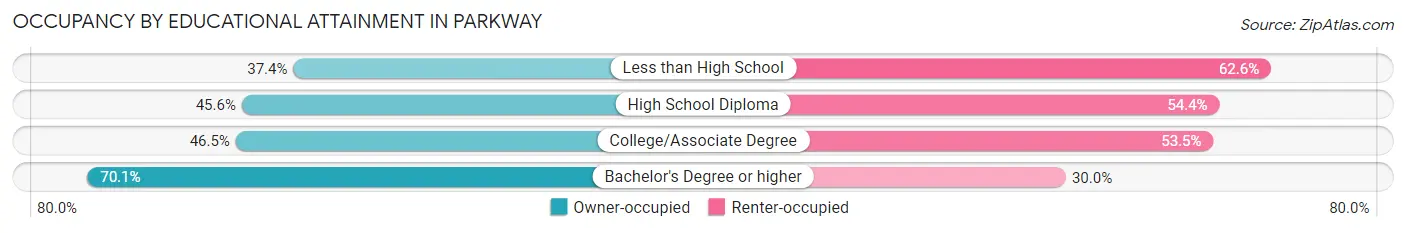
| Household Size | Owner-occupied | Renter-occupied |
| Less than High School | 416 (37.4%) | 697 (62.6%) |
| High School Diploma | 606 (45.6%) | 724 (54.4%) |
| College/Associate Degree | 856 (46.5%) | 984 (53.5%) |
| Bachelor's Degree or higher | 421 (70.1%) | 180 (29.9%) |
Occupancy by Age of Householder in Parkway
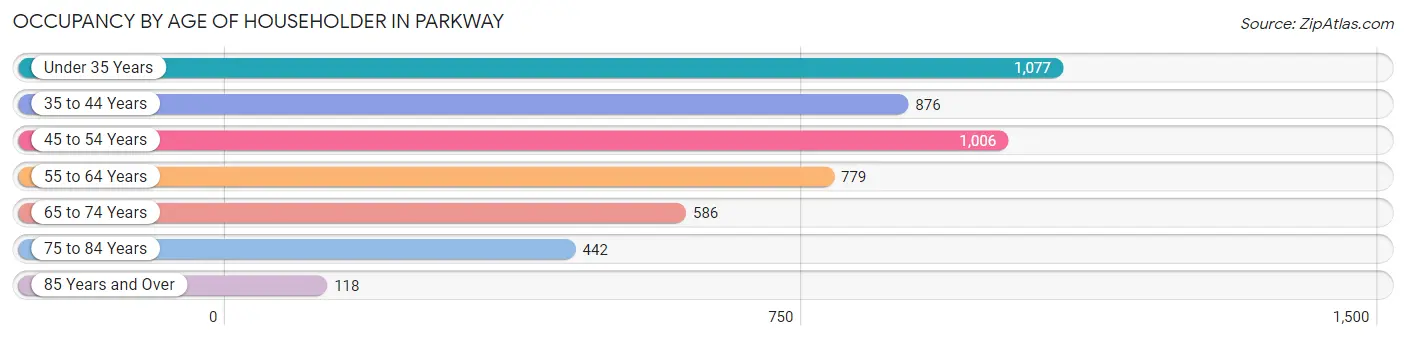
| Age Bracket | # Households | % Households |
| Under 35 Years | 1,077 | 22.1% |
| 35 to 44 Years | 876 | 17.9% |
| 45 to 54 Years | 1,006 | 20.6% |
| 55 to 64 Years | 779 | 16.0% |
| 65 to 74 Years | 586 | 12.0% |
| 75 to 84 Years | 442 | 9.0% |
| 85 Years and Over | 118 | 2.4% |
| Total | 4,884 | 100.0% |
Housing Finances in Parkway
Median Income by Occupancy in Parkway
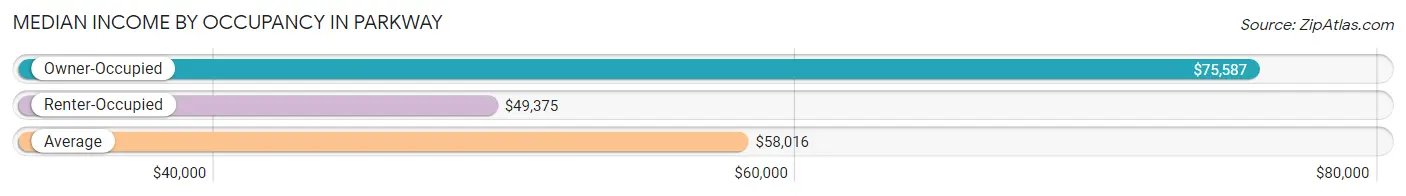
| Occupancy Type | # Households | Median Income |
| Owner-Occupied | 2,299 (47.1%) | $75,587 |
| Renter-Occupied | 2,585 (52.9%) | $49,375 |
| Average | 4,884 (100.0%) | $58,016 |
Occupancy by Householder Income Bracket in Parkway
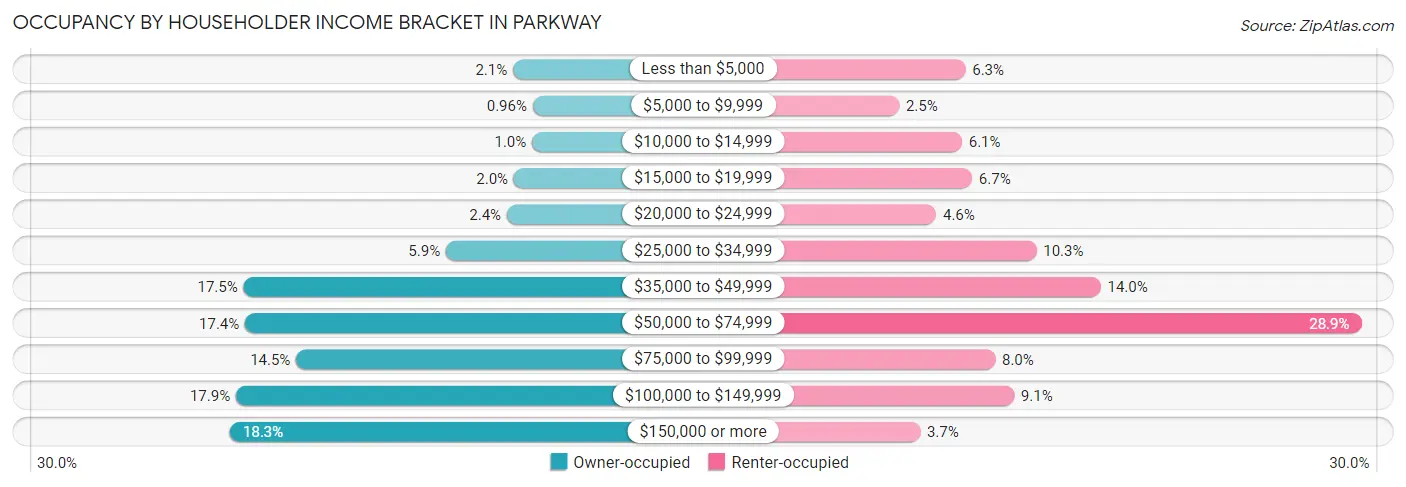
| Income Bracket | Owner-occupied | Renter-occupied |
| Less than $5,000 | 48 (2.1%) | 162 (6.3%) |
| $5,000 to $9,999 | 22 (1.0%) | 64 (2.5%) |
| $10,000 to $14,999 | 23 (1.0%) | 157 (6.1%) |
| $15,000 to $19,999 | 47 (2.0%) | 172 (6.7%) |
| $20,000 to $24,999 | 56 (2.4%) | 119 (4.6%) |
| $25,000 to $34,999 | 136 (5.9%) | 267 (10.3%) |
| $35,000 to $49,999 | 402 (17.5%) | 362 (14.0%) |
| $50,000 to $74,999 | 400 (17.4%) | 747 (28.9%) |
| $75,000 to $99,999 | 333 (14.5%) | 206 (8.0%) |
| $100,000 to $149,999 | 412 (17.9%) | 234 (9.0%) |
| $150,000 or more | 420 (18.3%) | 95 (3.7%) |
| Total | 2,299 (100.0%) | 2,585 (100.0%) |
Monthly Housing Cost Tiers in Parkway
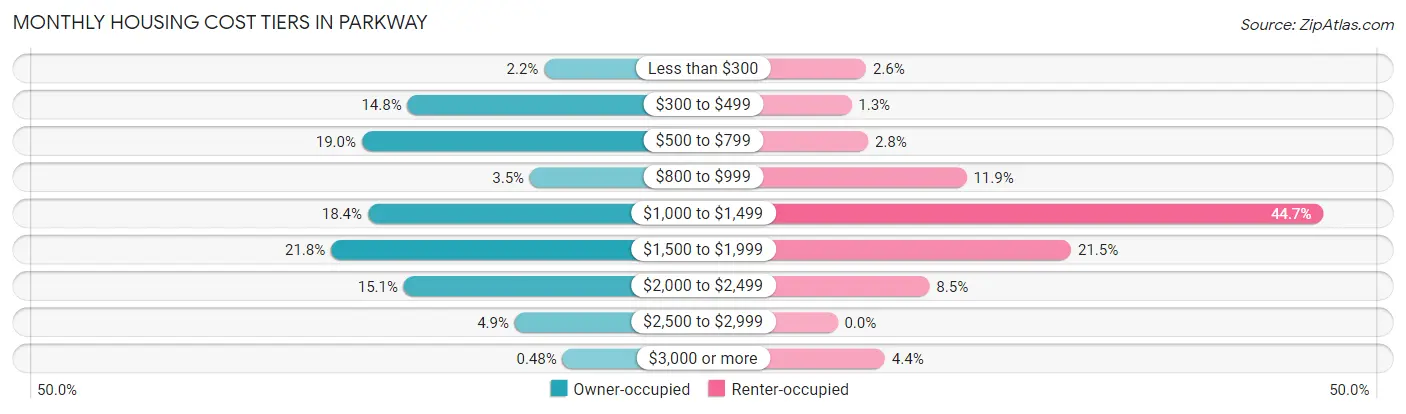
| Monthly Cost | Owner-occupied | Renter-occupied |
| Less than $300 | 50 (2.2%) | 68 (2.6%) |
| $300 to $499 | 339 (14.7%) | 33 (1.3%) |
| $500 to $799 | 436 (19.0%) | 73 (2.8%) |
| $800 to $999 | 80 (3.5%) | 307 (11.9%) |
| $1,000 to $1,499 | 423 (18.4%) | 1,156 (44.7%) |
| $1,500 to $1,999 | 501 (21.8%) | 556 (21.5%) |
| $2,000 to $2,499 | 347 (15.1%) | 219 (8.5%) |
| $2,500 to $2,999 | 112 (4.9%) | 0 (0.0%) |
| $3,000 or more | 11 (0.5%) | 113 (4.4%) |
| Total | 2,299 (100.0%) | 2,585 (100.0%) |
Physical Housing Characteristics in Parkway
Housing Structures in Parkway
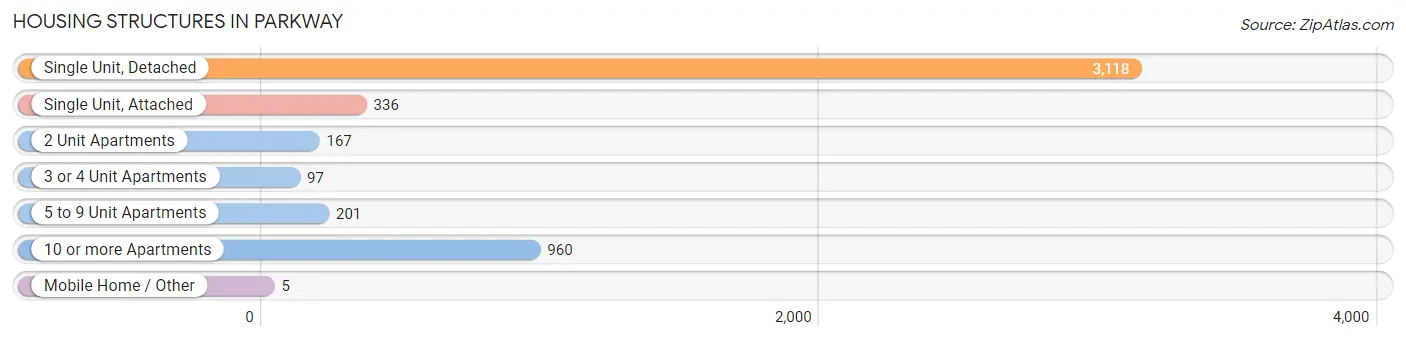
| Structure Type | # Housing Units | % Housing Units |
| Single Unit, Detached | 3,118 | 63.8% |
| Single Unit, Attached | 336 | 6.9% |
| 2 Unit Apartments | 167 | 3.4% |
| 3 or 4 Unit Apartments | 97 | 2.0% |
| 5 to 9 Unit Apartments | 201 | 4.1% |
| 10 or more Apartments | 960 | 19.7% |
| Mobile Home / Other | 5 | 0.1% |
| Total | 4,884 | 100.0% |
Housing Structures by Occupancy in Parkway
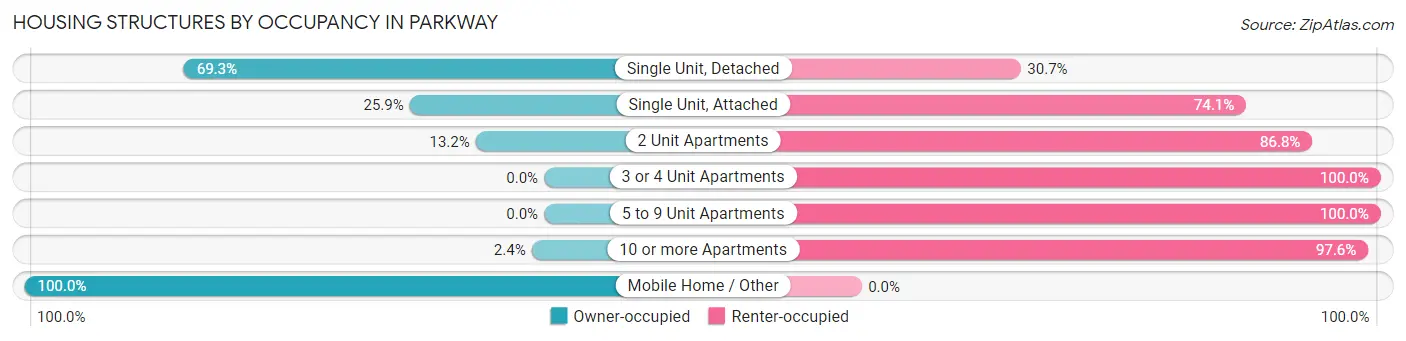
| Structure Type | Owner-occupied | Renter-occupied |
| Single Unit, Detached | 2,162 (69.3%) | 956 (30.7%) |
| Single Unit, Attached | 87 (25.9%) | 249 (74.1%) |
| 2 Unit Apartments | 22 (13.2%) | 145 (86.8%) |
| 3 or 4 Unit Apartments | 0 (0.0%) | 97 (100.0%) |
| 5 to 9 Unit Apartments | 0 (0.0%) | 201 (100.0%) |
| 10 or more Apartments | 23 (2.4%) | 937 (97.6%) |
| Mobile Home / Other | 5 (100.0%) | 0 (0.0%) |
| Total | 2,299 (47.1%) | 2,585 (52.9%) |
Housing Structures by Number of Rooms in Parkway
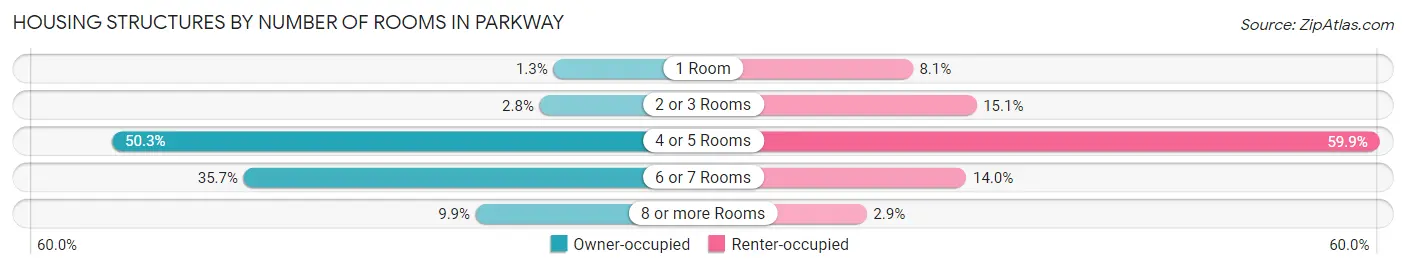
| Number of Rooms | Owner-occupied | Renter-occupied |
| 1 Room | 30 (1.3%) | 208 (8.1%) |
| 2 or 3 Rooms | 65 (2.8%) | 391 (15.1%) |
| 4 or 5 Rooms | 1,156 (50.3%) | 1,548 (59.9%) |
| 6 or 7 Rooms | 820 (35.7%) | 362 (14.0%) |
| 8 or more Rooms | 228 (9.9%) | 76 (2.9%) |
| Total | 2,299 (100.0%) | 2,585 (100.0%) |
Housing Structure by Heating Type in Parkway
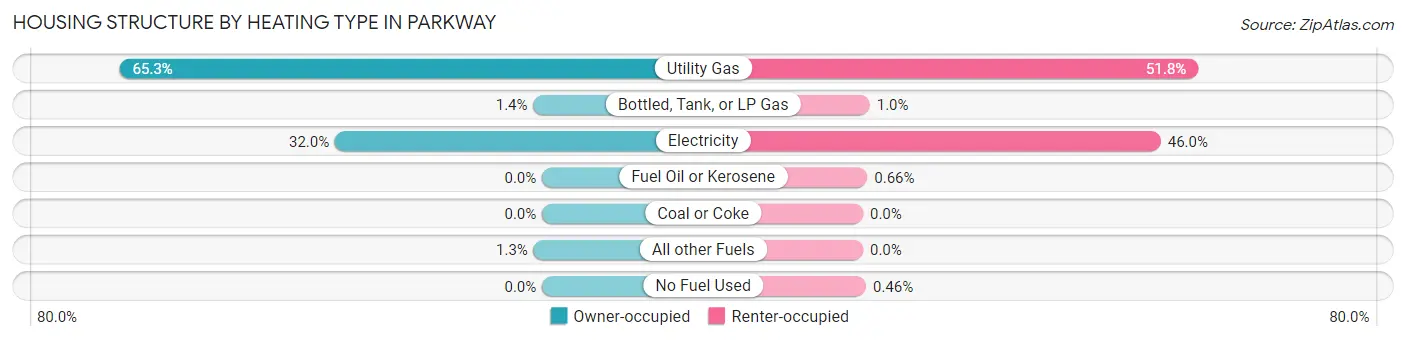
| Heating Type | Owner-occupied | Renter-occupied |
| Utility Gas | 1,502 (65.3%) | 1,339 (51.8%) |
| Bottled, Tank, or LP Gas | 31 (1.3%) | 27 (1.0%) |
| Electricity | 736 (32.0%) | 1,190 (46.0%) |
| Fuel Oil or Kerosene | 0 (0.0%) | 17 (0.7%) |
| Coal or Coke | 0 (0.0%) | 0 (0.0%) |
| All other Fuels | 30 (1.3%) | 0 (0.0%) |
| No Fuel Used | 0 (0.0%) | 12 (0.5%) |
| Total | 2,299 (100.0%) | 2,585 (100.0%) |
Household Vehicle Usage in Parkway
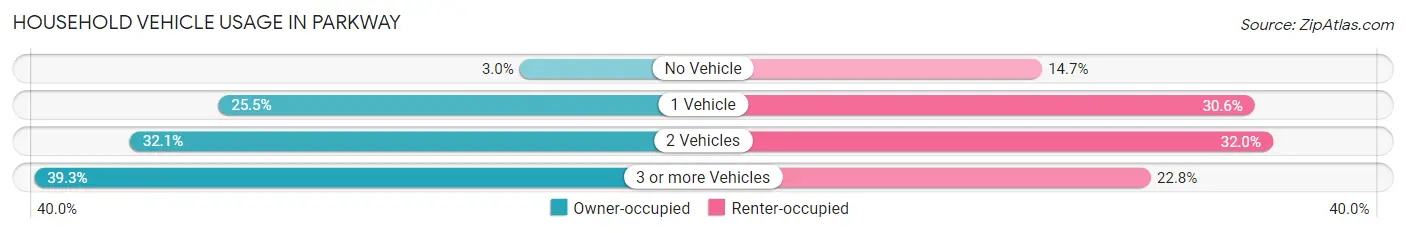
| Vehicles per Household | Owner-occupied | Renter-occupied |
| No Vehicle | 70 (3.0%) | 379 (14.7%) |
| 1 Vehicle | 587 (25.5%) | 791 (30.6%) |
| 2 Vehicles | 739 (32.1%) | 826 (32.0%) |
| 3 or more Vehicles | 903 (39.3%) | 589 (22.8%) |
| Total | 2,299 (100.0%) | 2,585 (100.0%) |
Real Estate & Mortgages in Parkway
Real Estate and Mortgage Overview in Parkway
| Characteristic | Without Mortgage | With Mortgage |
| Housing Units | 825 | 1,474 |
| Median Property Value | $315,600 | $341,200 |
| Median Household Income | $67,361 | $335 |
| Monthly Housing Costs | $531 | $11 |
| Real Estate Taxes | $1,645 | $35 |
Property Value by Mortgage Status in Parkway
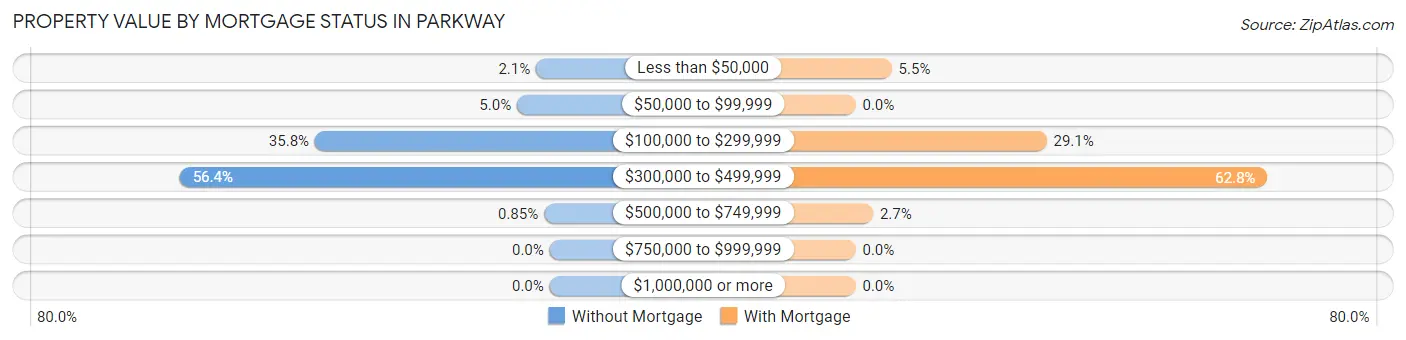
| Property Value | Without Mortgage | With Mortgage |
| Less than $50,000 | 17 (2.1%) | 81 (5.5%) |
| $50,000 to $99,999 | 41 (5.0%) | 0 (0.0%) |
| $100,000 to $299,999 | 295 (35.8%) | 429 (29.1%) |
| $300,000 to $499,999 | 465 (56.4%) | 925 (62.7%) |
| $500,000 to $749,999 | 7 (0.9%) | 39 (2.6%) |
| $750,000 to $999,999 | 0 (0.0%) | 0 (0.0%) |
| $1,000,000 or more | 0 (0.0%) | 0 (0.0%) |
| Total | 825 (100.0%) | 1,474 (100.0%) |
Household Income by Mortgage Status in Parkway
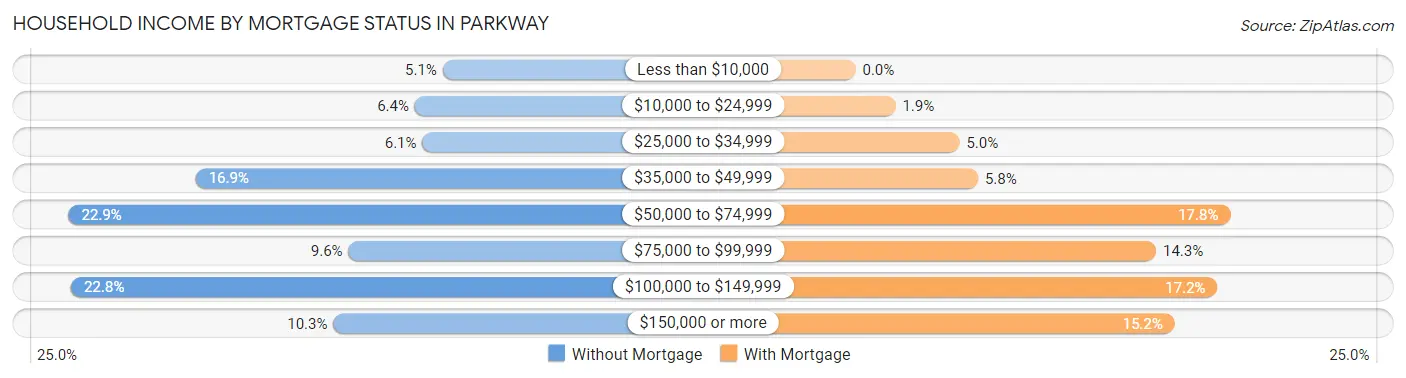
| Household Income | Without Mortgage | With Mortgage |
| Less than $10,000 | 42 (5.1%) | 0 (0.0%) |
| $10,000 to $24,999 | 53 (6.4%) | 28 (1.9%) |
| $25,000 to $34,999 | 50 (6.1%) | 73 (5.0%) |
| $35,000 to $49,999 | 139 (16.9%) | 86 (5.8%) |
| $50,000 to $74,999 | 189 (22.9%) | 263 (17.8%) |
| $75,000 to $99,999 | 79 (9.6%) | 211 (14.3%) |
| $100,000 to $149,999 | 188 (22.8%) | 254 (17.2%) |
| $150,000 or more | 85 (10.3%) | 224 (15.2%) |
| Total | 825 (100.0%) | 1,474 (100.0%) |
Property Value to Household Income Ratio in Parkway

| Value-to-Income Ratio | Without Mortgage | With Mortgage |
| Less than 2.0x | 162 (19.6%) | 79,032 (5,361.7%) |
| 2.0x to 2.9x | 158 (19.2%) | 330 (22.4%) |
| 3.0x to 3.9x | 94 (11.4%) | 257 (17.4%) |
| 4.0x or more | 403 (48.8%) | 224 (15.2%) |
| Total | 825 (100.0%) | 1,474 (100.0%) |
Real Estate Taxes by Mortgage Status in Parkway
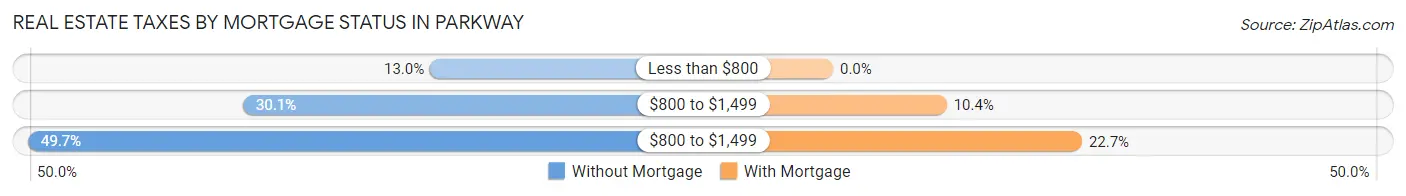
| Property Taxes | Without Mortgage | With Mortgage |
| Less than $800 | 107 (13.0%) | 0 (0.0%) |
| $800 to $1,499 | 248 (30.1%) | 153 (10.4%) |
| $800 to $1,499 | 410 (49.7%) | 335 (22.7%) |
| Total | 825 (100.0%) | 1,474 (100.0%) |
Health & Disability in Parkway
Health Insurance Coverage by Age in Parkway
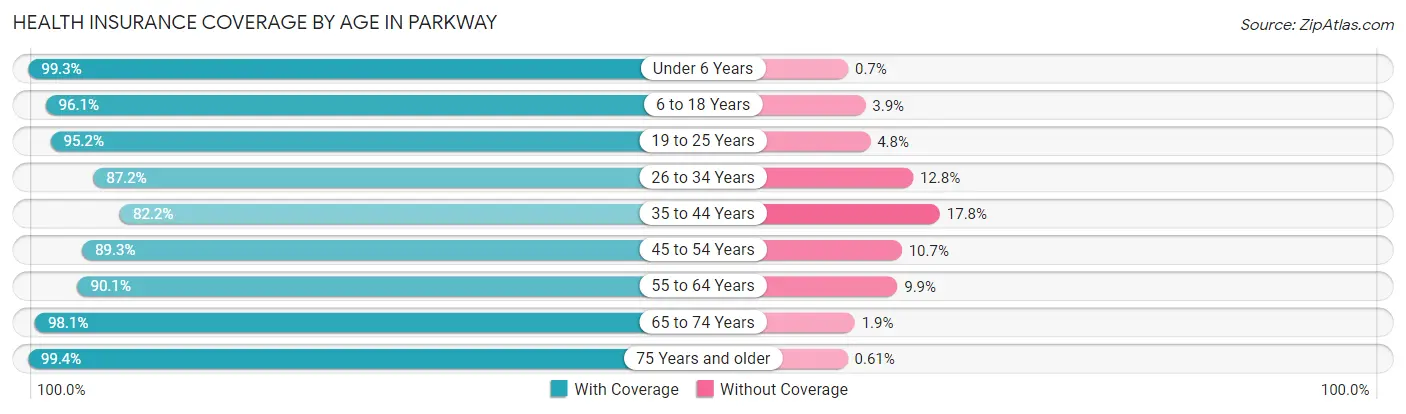
| Age Bracket | With Coverage | Without Coverage |
| Under 6 Years | 1,423 (99.3%) | 10 (0.7%) |
| 6 to 18 Years | 3,125 (96.1%) | 128 (3.9%) |
| 19 to 25 Years | 1,654 (95.2%) | 84 (4.8%) |
| 26 to 34 Years | 1,981 (87.2%) | 291 (12.8%) |
| 35 to 44 Years | 1,665 (82.2%) | 361 (17.8%) |
| 45 to 54 Years | 1,550 (89.3%) | 186 (10.7%) |
| 55 to 64 Years | 1,588 (90.1%) | 174 (9.9%) |
| 65 to 74 Years | 961 (98.1%) | 19 (1.9%) |
| 75 Years and older | 977 (99.4%) | 6 (0.6%) |
| Total | 14,924 (92.2%) | 1,259 (7.8%) |
Health Insurance Coverage by Citizenship Status in Parkway
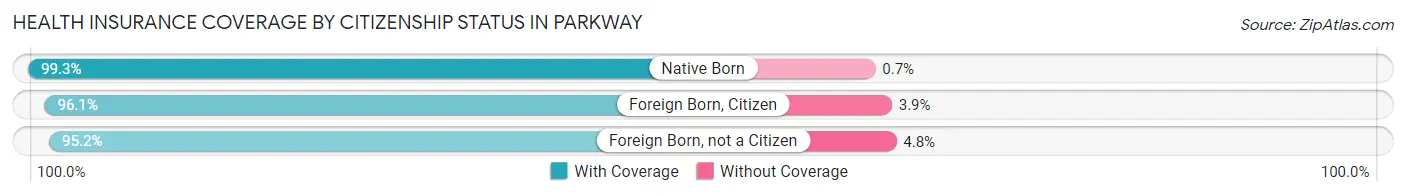
| Citizenship Status | With Coverage | Without Coverage |
| Native Born | 1,423 (99.3%) | 10 (0.7%) |
| Foreign Born, Citizen | 3,125 (96.1%) | 128 (3.9%) |
| Foreign Born, not a Citizen | 1,654 (95.2%) | 84 (4.8%) |
Health Insurance Coverage by Household Income in Parkway
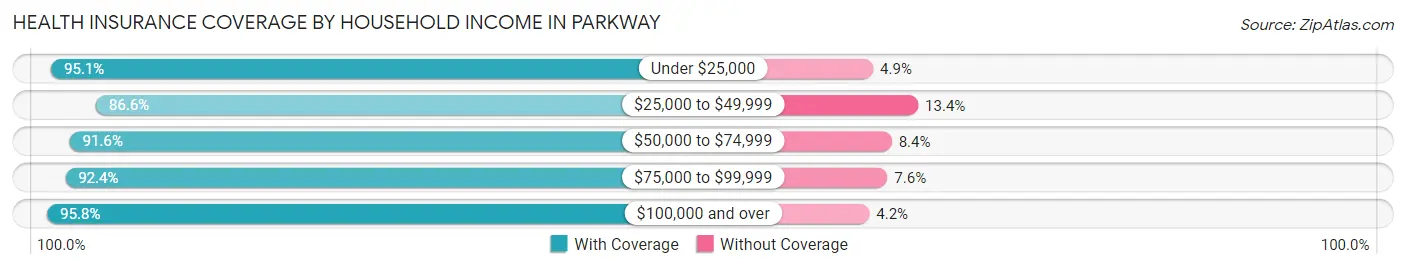
| Household Income | With Coverage | Without Coverage |
| Under $25,000 | 2,059 (95.1%) | 107 (4.9%) |
| $25,000 to $49,999 | 3,325 (86.6%) | 513 (13.4%) |
| $50,000 to $74,999 | 3,232 (91.6%) | 297 (8.4%) |
| $75,000 to $99,999 | 1,749 (92.4%) | 144 (7.6%) |
| $100,000 and over | 4,469 (95.8%) | 197 (4.2%) |
Public vs Private Health Insurance Coverage by Age in Parkway
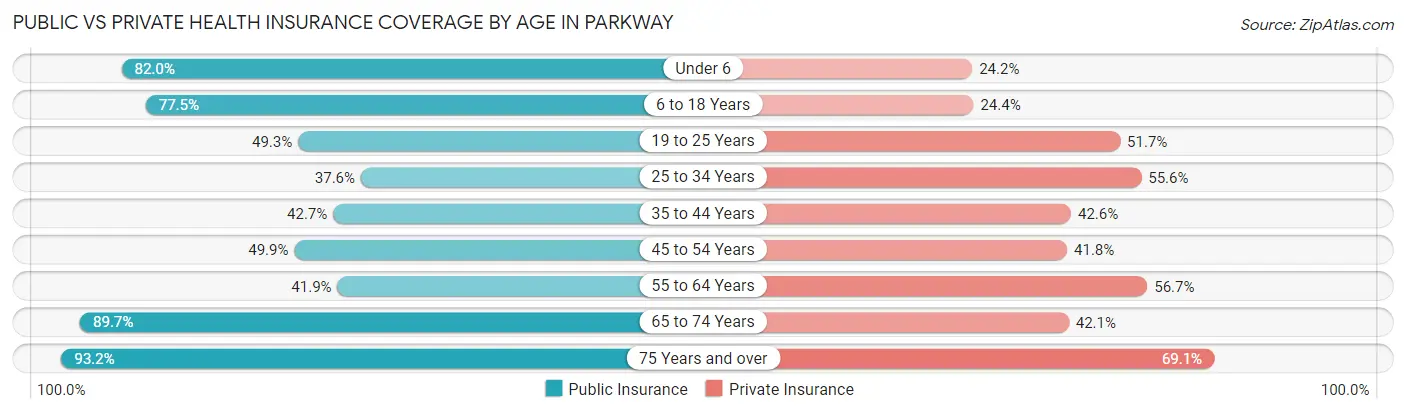
| Age Bracket | Public Insurance | Private Insurance |
| Under 6 | 1,175 (82.0%) | 347 (24.2%) |
| 6 to 18 Years | 2,521 (77.5%) | 795 (24.4%) |
| 19 to 25 Years | 856 (49.2%) | 898 (51.7%) |
| 25 to 34 Years | 854 (37.6%) | 1,263 (55.6%) |
| 35 to 44 Years | 866 (42.7%) | 862 (42.5%) |
| 45 to 54 Years | 867 (49.9%) | 726 (41.8%) |
| 55 to 64 Years | 739 (41.9%) | 999 (56.7%) |
| 65 to 74 Years | 879 (89.7%) | 413 (42.1%) |
| 75 Years and over | 916 (93.2%) | 679 (69.1%) |
| Total | 9,673 (59.8%) | 6,982 (43.1%) |
Disability Status by Sex by Age in Parkway
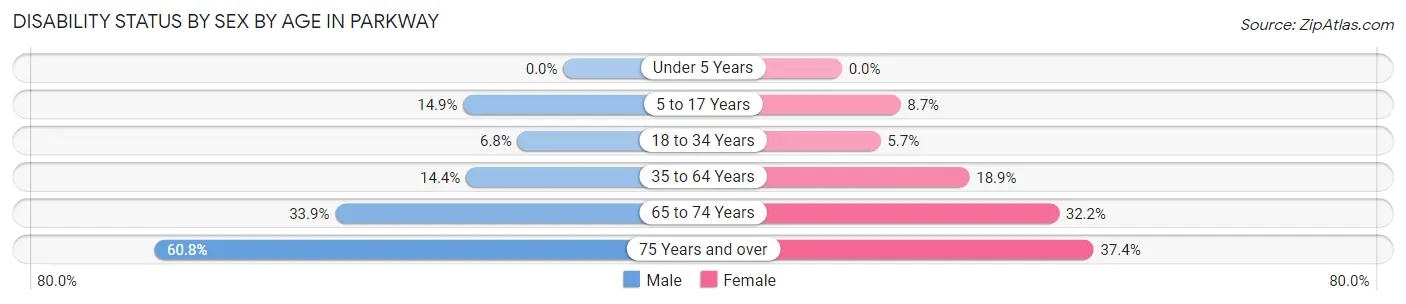
| Age Bracket | Male | Female |
| Under 5 Years | 0 (0.0%) | 0 (0.0%) |
| 5 to 17 Years | 276 (14.9%) | 136 (8.7%) |
| 18 to 34 Years | 128 (6.8%) | 132 (5.7%) |
| 35 to 64 Years | 366 (14.4%) | 566 (18.9%) |
| 65 to 74 Years | 190 (33.9%) | 135 (32.2%) |
| 75 Years and over | 251 (60.8%) | 213 (37.4%) |
Disability Class by Sex by Age in Parkway
Disability Class: Hearing Difficulty
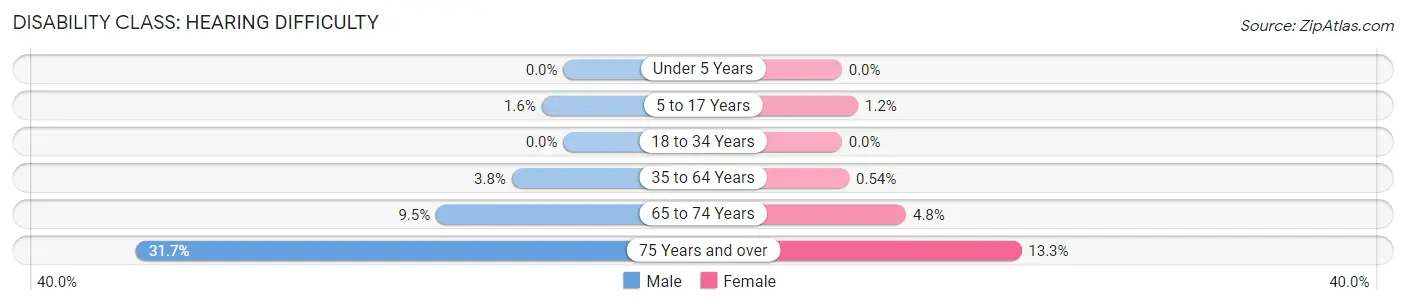
| Age Bracket | Male | Female |
| Under 5 Years | 0 (0.0%) | 0 (0.0%) |
| 5 to 17 Years | 30 (1.6%) | 19 (1.2%) |
| 18 to 34 Years | 0 (0.0%) | 0 (0.0%) |
| 35 to 64 Years | 97 (3.8%) | 16 (0.5%) |
| 65 to 74 Years | 53 (9.5%) | 20 (4.8%) |
| 75 Years and over | 131 (31.7%) | 76 (13.3%) |
Disability Class: Vision Difficulty
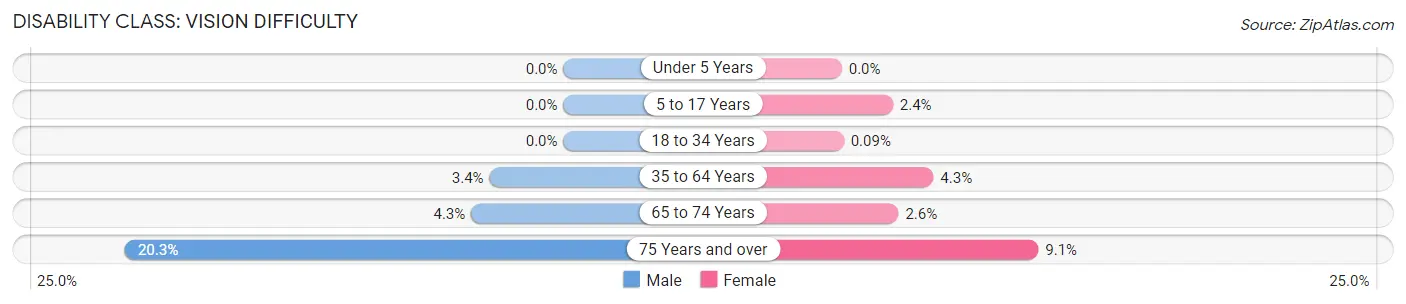
| Age Bracket | Male | Female |
| Under 5 Years | 0 (0.0%) | 0 (0.0%) |
| 5 to 17 Years | 0 (0.0%) | 37 (2.4%) |
| 18 to 34 Years | 0 (0.0%) | 2 (0.1%) |
| 35 to 64 Years | 87 (3.4%) | 127 (4.3%) |
| 65 to 74 Years | 24 (4.3%) | 11 (2.6%) |
| 75 Years and over | 84 (20.3%) | 52 (9.1%) |
Disability Class: Cognitive Difficulty
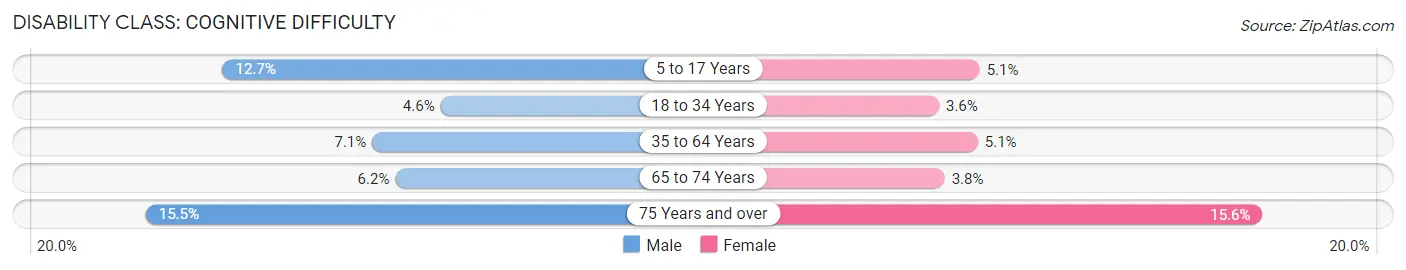
| Age Bracket | Male | Female |
| 5 to 17 Years | 235 (12.7%) | 80 (5.1%) |
| 18 to 34 Years | 86 (4.6%) | 83 (3.6%) |
| 35 to 64 Years | 180 (7.1%) | 151 (5.1%) |
| 65 to 74 Years | 35 (6.2%) | 16 (3.8%) |
| 75 Years and over | 64 (15.5%) | 89 (15.6%) |
Disability Class: Ambulatory Difficulty
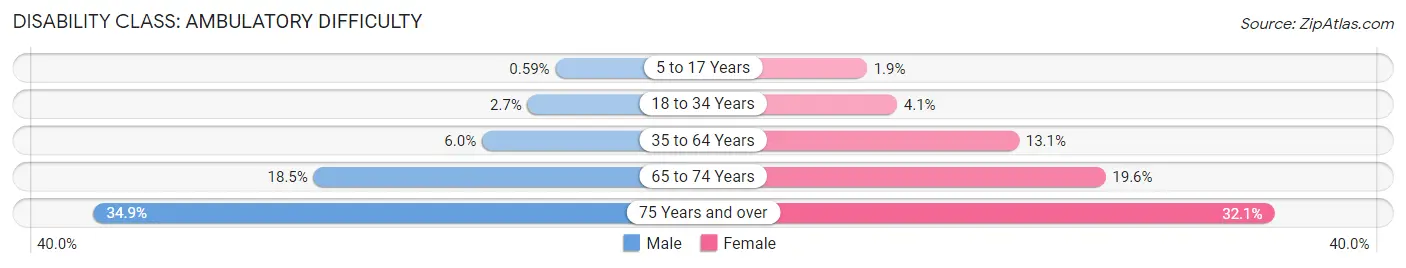
| Age Bracket | Male | Female |
| 5 to 17 Years | 11 (0.6%) | 29 (1.8%) |
| 18 to 34 Years | 50 (2.6%) | 94 (4.1%) |
| 35 to 64 Years | 153 (6.0%) | 393 (13.1%) |
| 65 to 74 Years | 104 (18.5%) | 82 (19.6%) |
| 75 Years and over | 144 (34.9%) | 183 (32.1%) |
Disability Class: Self-Care Difficulty
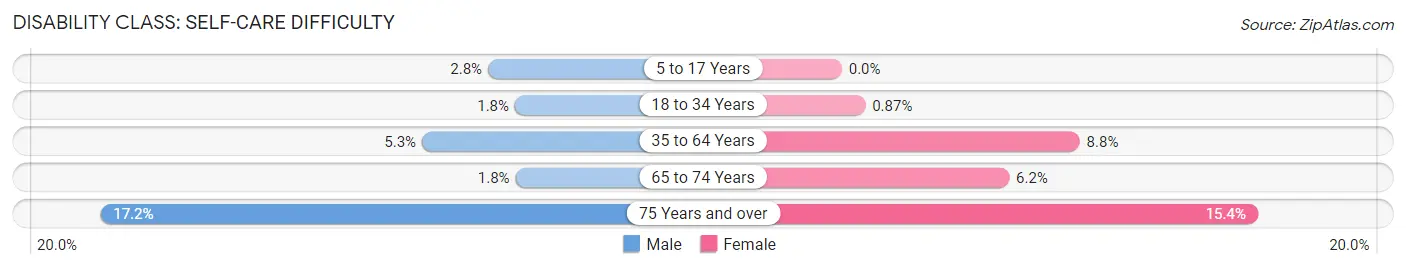
| Age Bracket | Male | Female |
| 5 to 17 Years | 52 (2.8%) | 0 (0.0%) |
| 18 to 34 Years | 34 (1.8%) | 20 (0.9%) |
| 35 to 64 Years | 133 (5.2%) | 264 (8.8%) |
| 65 to 74 Years | 10 (1.8%) | 26 (6.2%) |
| 75 Years and over | 71 (17.2%) | 88 (15.4%) |
Technology Access in Parkway
Computing Device Access in Parkway
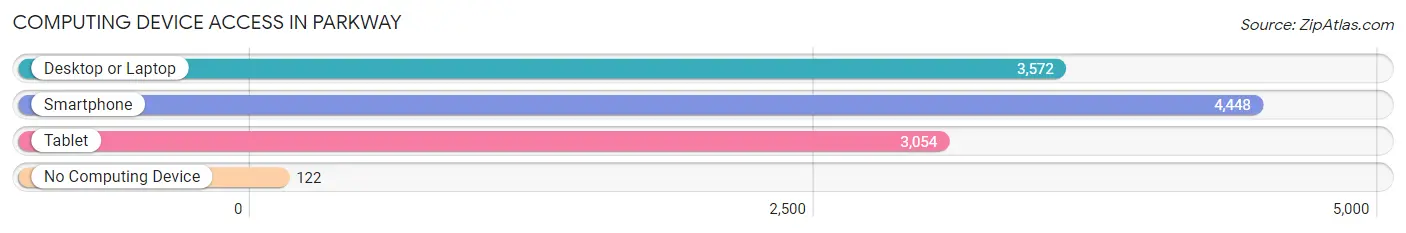
| Device Type | # Households | % Households |
| Desktop or Laptop | 3,572 | 73.1% |
| Smartphone | 4,448 | 91.1% |
| Tablet | 3,054 | 62.5% |
| No Computing Device | 122 | 2.5% |
| Total | 4,884 | 100.0% |
Internet Access in Parkway
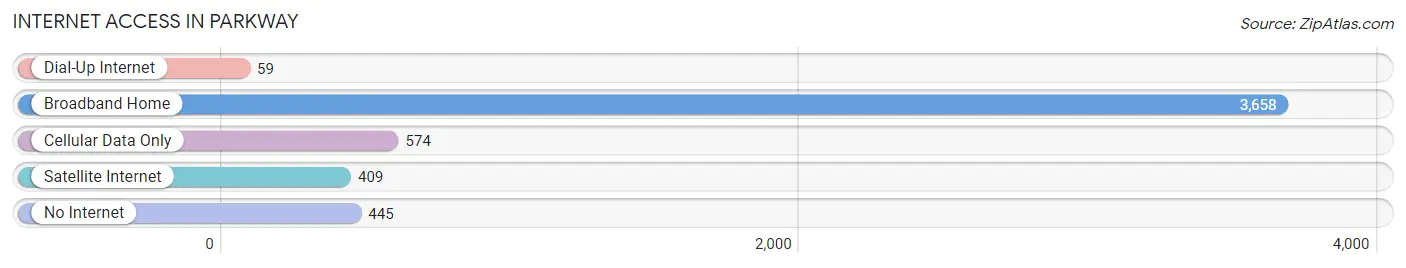
| Internet Type | # Households | % Households |
| Dial-Up Internet | 59 | 1.2% |
| Broadband Home | 3,658 | 74.9% |
| Cellular Data Only | 574 | 11.7% |
| Satellite Internet | 409 | 8.4% |
| No Internet | 445 | 9.1% |
| Total | 4,884 | 100.0% |
Parkway Summary
Parkway, California is a small town located in the San Joaquin Valley of California. It is situated in the foothills of the Sierra Nevada Mountains, about 30 miles east of Fresno. The town was founded in the late 1800s and has a population of about 1,500 people.
Geography
Parkway is located in the San Joaquin Valley of California, in the foothills of the Sierra Nevada Mountains. The town is situated at an elevation of about 1,000 feet above sea level. The climate in Parkway is semi-arid, with hot summers and mild winters. The average annual temperature is around 70 degrees Fahrenheit. The town is surrounded by rolling hills and is located near the Kings River.
Economy
The economy of Parkway is largely based on agriculture. The town is home to several farms and ranches, which produce a variety of crops, including grapes, almonds, and olives. The town also has a few small businesses, including a grocery store, a hardware store, and a few restaurants.
Demographics
As of the 2010 census, the population of Parkway was 1,500 people. The racial makeup of the town was 75.2% White, 0.7% African American, 0.7% Native American, 0.7% Asian, 0.7% Pacific Islander, and 21.3% from other races. The median household income in Parkway was $37,500, and the median age was 37.
History
Parkway was founded in the late 1800s by a group of settlers from the Midwest. The town was originally called “Parker’s Station” after the first settler, John Parker. The town was later renamed “Parkway” after the nearby Kings River.
In the early 1900s, Parkway was a thriving agricultural community. The town was home to several farms and ranches, which produced a variety of crops, including grapes, almonds, and olives. The town also had a few small businesses, including a grocery store, a hardware store, and a few restaurants.
In the 1950s, Parkway began to decline as many of the town’s residents moved away in search of better economic opportunities. The town’s population decreased from 1,500 in 1950 to just 500 in 1970.
In the late 1970s, Parkway began to experience a resurgence. The town’s population began to grow again, and several new businesses opened in the town. Today, Parkway is a small but thriving community. The town is home to several farms and ranches, as well as a few small businesses. The town also has a few restaurants and a grocery store.
Common Questions
What is Per Capita Income in Parkway?
Per Capita income in Parkway is $22,611.
What is the Median Family Income in Parkway?
Median Family Income in Parkway is $60,917.
What is the Median Household income in Parkway?
Median Household Income in Parkway is $58,016.
What is Income or Wage Gap in Parkway?
Income or Wage Gap in Parkway is 17.2%.
Women in Parkway earn 82.8 cents for every dollar earned by a man.
What is Family Income Deficit in Parkway?
Family Income Deficit in Parkway is $12,689.
Families that are below poverty line in Parkway earn $12,689 less on average than the poverty threshold level.
What is Inequality or Gini Index in Parkway?
Inequality or Gini Index in Parkway is 0.41.
What is the Total Population of Parkway?
Total Population of Parkway is 16,242.
What is the Total Male Population of Parkway?
Total Male Population of Parkway is 7,813.
What is the Total Female Population of Parkway?
Total Female Population of Parkway is 8,429.
What is the Ratio of Males per 100 Females in Parkway?
There are 92.69 Males per 100 Females in Parkway.
What is the Ratio of Females per 100 Males in Parkway?
There are 107.88 Females per 100 Males in Parkway.
What is the Median Population Age in Parkway?
Median Population Age in Parkway is 32.3 Years.
What is the Average Family Size in Parkway
Average Family Size in Parkway is 4.0 People.
What is the Average Household Size in Parkway
Average Household Size in Parkway is 3.3 People.
How Large is the Labor Force in Parkway?
There are 7,223 People in the Labor Forcein in Parkway.
What is the Percentage of People in the Labor Force in Parkway?
58.5% of People are in the Labor Force in Parkway.
What is the Unemployment Rate in Parkway?
Unemployment Rate in Parkway is 11.5%.