Cities with the Highest Percentage of Black / African American Population in Oklahoma
RELATED REPORTS & OPTIONS
Black / African American
Oklahoma
Compare Cities
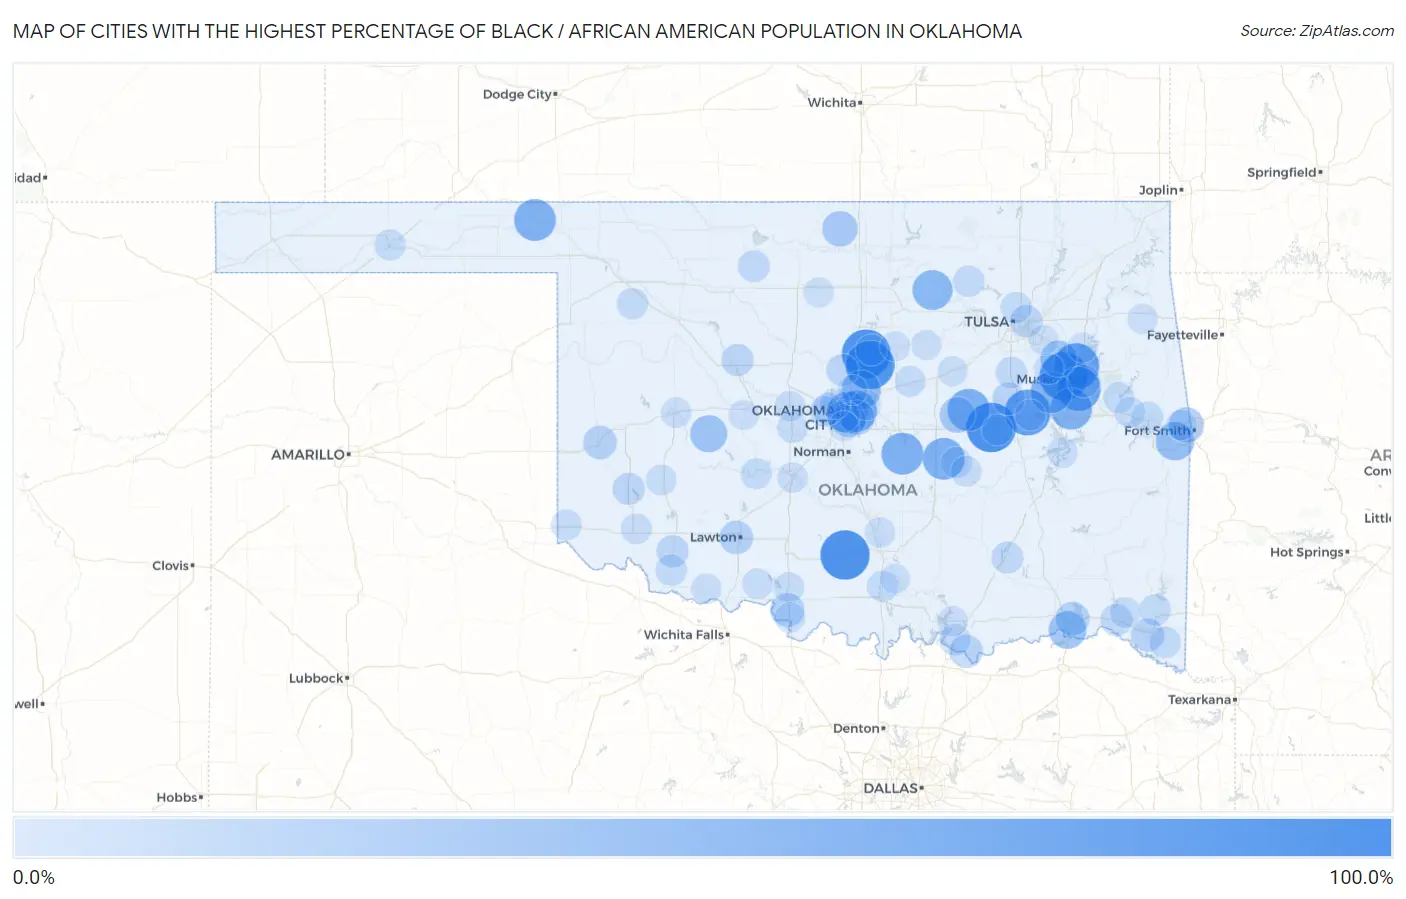
Map of Cities with the Highest Percentage of Black / African American Population in Oklahoma
0.0%
100.0%
Cities with the Highest Percentage of Black / African American Population in Oklahoma
| City | Black / African American | vs State | vs National | |
| 1. | Clearview | 88.6% | 7.2%(+81.5)#1 | 12.5%(+76.2)#211 |
| 2. | Tatums | 87.5% | 7.2%(+80.3)#2 | 12.5%(+75.0)#229 |
| 3. | Langston | 84.7% | 7.2%(+77.6)#3 | 12.5%(+72.3)#288 |
| 4. | Meridian | 84.6% | 7.2%(+77.5)#4 | 12.5%(+72.1)#291 |
| 5. | Taft | 83.5% | 7.2%(+76.3)#5 | 12.5%(+71.0)#315 |
| 6. | Grayson | 72.7% | 7.2%(+65.6)#6 | 12.5%(+60.3)#552 |
| 7. | Tullahassee | 72.7% | 7.2%(+65.6)#7 | 12.5%(+60.3)#553 |
| 8. | Summit | 65.1% | 7.2%(+57.9)#8 | 12.5%(+52.6)#740 |
| 9. | Ixl | 56.7% | 7.2%(+49.5)#9 | 12.5%(+44.2)#1,014 |
| 10. | Brooksville | 55.1% | 7.2%(+47.9)#10 | 12.5%(+42.6)#1,066 |
| 11. | Lima | 55.1% | 7.2%(+47.9)#11 | 12.5%(+42.6)#1,068 |
| 12. | Knowles | 54.5% | 7.2%(+47.4)#12 | 12.5%(+42.1)#1,084 |
| 13. | Rentiesville | 53.7% | 7.2%(+46.5)#13 | 12.5%(+41.2)#1,117 |
| 14. | Forest Park | 53.6% | 7.2%(+46.4)#14 | 12.5%(+41.1)#1,124 |
| 15. | Boynton | 53.1% | 7.2%(+45.9)#15 | 12.5%(+40.6)#1,140 |
| 16. | Spencer | 52.1% | 7.2%(+44.9)#16 | 12.5%(+39.6)#1,170 |
| 17. | Dixon | 50.6% | 7.2%(+43.4)#17 | 12.5%(+38.1)#1,225 |
| 18. | Skedee | 46.9% | 7.2%(+39.8)#18 | 12.5%(+34.5)#1,383 |
| 19. | Arcadia | 43.4% | 7.2%(+36.2)#19 | 12.5%(+30.9)#1,556 |
| 20. | Fort Coffee | 40.4% | 7.2%(+33.3)#20 | 12.5%(+27.9)#1,714 |
| 21. | Grant | 36.8% | 7.2%(+29.7)#21 | 12.5%(+24.4)#1,915 |
| 22. | Colony | 33.8% | 7.2%(+26.6)#22 | 12.5%(+21.3)#2,101 |
| 23. | Redbird | 31.7% | 7.2%(+24.6)#23 | 12.5%(+19.3)#2,224 |
| 24. | Boley | 28.1% | 7.2%(+20.9)#24 | 12.5%(+15.6)#2,502 |
| 25. | Deer Creek | 27.7% | 7.2%(+20.5)#25 | 12.5%(+15.2)#2,520 |
| 26. | Moffett | 26.8% | 7.2%(+19.6)#26 | 12.5%(+14.3)#2,589 |
| 27. | Preston | 24.9% | 7.2%(+17.7)#27 | 12.5%(+12.4)#2,775 |
| 28. | Midwest City | 22.5% | 7.2%(+15.4)#28 | 12.5%(+10.1)#3,015 |
| 29. | Del City | 22.1% | 7.2%(+14.9)#29 | 12.5%(+9.60)#3,067 |
| 30. | Sugden | 20.9% | 7.2%(+13.8)#30 | 12.5%(+8.46)#3,194 |
| 31. | Hugo | 20.7% | 7.2%(+13.6)#31 | 12.5%(+8.25)#3,219 |
| 32. | Sayre | 19.6% | 7.2%(+12.4)#32 | 12.5%(+7.11)#3,352 |
| 33. | Lawton | 19.4% | 7.2%(+12.2)#33 | 12.5%(+6.89)#3,380 |
| 34. | Hendrix | 18.3% | 7.2%(+11.2)#34 | 12.5%(+5.86)#3,528 |
| 35. | Idabel | 17.6% | 7.2%(+10.4)#35 | 12.5%(+5.10)#3,637 |
| 36. | Okmulgee | 15.9% | 7.2%(+8.69)#36 | 12.5%(+3.38)#3,935 |
| 37. | Muskogee | 15.1% | 7.2%(+7.90)#37 | 12.5%(+2.59)#4,086 |
| 38. | Tulsa | 14.6% | 7.2%(+7.46)#38 | 12.5%(+2.15)#4,180 |
| 39. | Watonga | 13.7% | 7.2%(+6.53)#39 | 12.5%(+1.22)#4,354 |
| 40. | Oklahoma City | 13.7% | 7.2%(+6.51)#40 | 12.5%(+1.21)#4,359 |
| 41. | Manitou | 13.5% | 7.2%(+6.37)#41 | 12.5%(+1.07)#4,383 |
| 42. | Guthrie | 13.3% | 7.2%(+6.15)#42 | 12.5%(+0.848)#4,442 |
| 43. | Granite | 12.9% | 7.2%(+5.73)#43 | 12.5%(+0.429)#4,535 |
| 44. | Warr Acres | 12.9% | 7.2%(+5.71)#44 | 12.5%(+0.404)#4,542 |
| 45. | Helena | 12.5% | 7.2%(+5.31)#45 | 12.5%(+0.004)#4,637 |
| 46. | Stringtown | 12.3% | 7.2%(+5.16)#46 | 12.5%(-0.141)#4,672 |
| 47. | Valliant | 12.2% | 7.2%(+5.06)#47 | 12.5%(-0.248)#4,702 |
| 48. | Badger Lee | 11.1% | 7.2%(+3.95)#48 | 12.5%(-1.36)#4,987 |
| 49. | Beggs | 11.1% | 7.2%(+3.94)#49 | 12.5%(-1.37)#4,990 |
| 50. | Haworth | 11.0% | 7.2%(+3.79)#50 | 12.5%(-1.52)#5,027 |
| 51. | Hominy | 10.7% | 7.2%(+3.57)#51 | 12.5%(-1.74)#5,096 |
| 52. | Broken Bow | 10.7% | 7.2%(+3.52)#52 | 12.5%(-1.79)#5,110 |
| 53. | Frederick | 10.3% | 7.2%(+3.11)#53 | 12.5%(-2.20)#5,235 |
| 54. | Sharon | 10.1% | 7.2%(+2.98)#54 | 12.5%(-2.33)#5,276 |
| 55. | Turley | 9.9% | 7.2%(+2.71)#55 | 12.5%(-2.60)#5,360 |
| 56. | Colbert | 9.7% | 7.2%(+2.57)#56 | 12.5%(-2.74)#5,412 |
| 57. | Paradise Hill | 9.6% | 7.2%(+2.47)#57 | 12.5%(-2.83)#5,433 |
| 58. | Guymon | 9.2% | 7.2%(+2.06)#58 | 12.5%(-3.24)#5,566 |
| 59. | Chandler | 9.0% | 7.2%(+1.88)#59 | 12.5%(-3.43)#5,632 |
| 60. | Wewoka | 9.0% | 7.2%(+1.80)#60 | 12.5%(-3.51)#5,659 |
| 61. | Ardmore | 8.9% | 7.2%(+1.73)#61 | 12.5%(-3.58)#5,682 |
| 62. | Anadarko | 8.9% | 7.2%(+1.71)#62 | 12.5%(-3.59)#5,692 |
| 63. | Washita | 8.6% | 7.2%(+1.48)#63 | 12.5%(-3.83)#5,786 |
| 64. | Hollis | 8.6% | 7.2%(+1.41)#64 | 12.5%(-3.90)#5,820 |
| 65. | Coyle | 8.5% | 7.2%(+1.34)#65 | 12.5%(-3.97)#5,838 |
| 66. | Hoffman | 8.4% | 7.2%(+1.26)#66 | 12.5%(-4.05)#5,876 |
| 67. | Union City | 8.4% | 7.2%(+1.21)#67 | 12.5%(-4.10)#5,900 |
| 68. | Weleetka | 8.1% | 7.2%(+0.967)#68 | 12.5%(-4.34)#5,988 |
| 69. | Temple | 8.0% | 7.2%(+0.793)#69 | 12.5%(-4.51)#6,071 |
| 70. | Altus | 7.8% | 7.2%(+0.676)#70 | 12.5%(-4.63)#6,123 |
| 71. | Bethany | 7.7% | 7.2%(+0.581)#71 | 12.5%(-4.73)#6,170 |
| 72. | Vian | 7.7% | 7.2%(+0.567)#72 | 12.5%(-4.74)#6,174 |
| 73. | Hobart | 7.6% | 7.2%(+0.455)#73 | 12.5%(-4.85)#6,224 |
| 74. | El Reno | 7.4% | 7.2%(+0.270)#74 | 12.5%(-5.04)#6,313 |
| 75. | Wright City | 7.4% | 7.2%(+0.262)#75 | 12.5%(-5.04)#6,316 |
| 76. | Holdenville | 7.4% | 7.2%(+0.226)#76 | 12.5%(-5.08)#6,332 |
| 77. | Addington | 7.4% | 7.2%(+0.204)#77 | 12.5%(-5.10)#6,339 |
| 78. | Mead | 7.2% | 7.2%(-0.002)#78 | 12.5%(-5.31)#6,432 |
| 79. | Ryan | 7.0% | 7.2%(-0.125)#79 | 12.5%(-5.43)#6,490 |
| 80. | Carlton Landing | 7.0% | 7.2%(-0.187)#80 | 12.5%(-5.49)#6,522 |
| 81. | Chickasha | 6.5% | 7.2%(-0.640)#81 | 12.5%(-5.95)#6,758 |
| 82. | The Village | 6.3% | 7.2%(-0.834)#82 | 12.5%(-6.14)#6,858 |
| 83. | Welty | 6.3% | 7.2%(-0.870)#83 | 12.5%(-6.18)#6,879 |
| 84. | Clinton | 6.2% | 7.2%(-0.963)#84 | 12.5%(-6.27)#6,935 |
| 85. | Wynnewood | 6.1% | 7.2%(-1.05)#85 | 12.5%(-6.36)#6,991 |
| 86. | Depew | 6.1% | 7.2%(-1.09)#86 | 12.5%(-6.39)#7,018 |
| 87. | Roland | 6.0% | 7.2%(-1.12)#87 | 12.5%(-6.43)#7,045 |
| 88. | Grandfield | 6.0% | 7.2%(-1.13)#88 | 12.5%(-6.44)#7,053 |
| 89. | Haskell | 5.9% | 7.2%(-1.24)#89 | 12.5%(-6.55)#7,102 |
| 90. | Oaks | 5.8% | 7.2%(-1.39)#90 | 12.5%(-6.69)#7,186 |
| 91. | Broken Arrow | 5.7% | 7.2%(-1.51)#91 | 12.5%(-6.82)#7,270 |
| 92. | Cushing | 5.7% | 7.2%(-1.51)#92 | 12.5%(-6.82)#7,272 |
| 93. | Fairmont | 5.6% | 7.2%(-1.52)#93 | 12.5%(-6.83)#7,276 |
| 94. | Wagoner | 5.6% | 7.2%(-1.53)#94 | 12.5%(-6.84)#7,286 |
| 95. | Valley Brook | 5.6% | 7.2%(-1.58)#95 | 12.5%(-6.89)#7,321 |
| 96. | Jones | 5.5% | 7.2%(-1.66)#96 | 12.5%(-6.97)#7,362 |
| 97. | Hinton | 5.4% | 7.2%(-1.80)#97 | 12.5%(-7.11)#7,463 |
| 98. | Edmond | 5.3% | 7.2%(-1.82)#98 | 12.5%(-7.13)#7,478 |
| 99. | Gene Autry | 5.3% | 7.2%(-1.88)#99 | 12.5%(-7.18)#7,514 |
| 100. | Perkins | 5.2% | 7.2%(-2.01)#100 | 12.5%(-7.31)#7,606 |
Common Questions
What are the Top 10 Cities with the Highest Percentage of Black / African American Population in Oklahoma?
Top 10 Cities with the Highest Percentage of Black / African American Population in Oklahoma are:
#1
88.6%
#2
87.5%
#3
84.7%
#4
84.6%
#5
83.5%
#6
72.7%
#7
72.7%
#8
65.1%
#9
56.7%
#10
55.1%
What city has the Highest Percentage of Black / African American Population in Oklahoma?
Clearview has the Highest Percentage of Black / African American Population in Oklahoma with 88.6%.
What is the Percentage of Black / African American Population in the State of Oklahoma?
Percentage of Black / African American Population in Oklahoma is 7.2%.
What is the Percentage of Black / African American Population in the United States?
Percentage of Black / African American Population in the United States is 12.5%.