North Highlands, CA Map & Demographics
North Highlands Map
North Highlands Overview
$26,051
PER CAPITA INCOME
$64,961
AVG FAMILY INCOME
$62,156
AVG HOUSEHOLD INCOME
24.4%
WAGE / INCOME GAP [ % ]
75.6¢/ $1
WAGE / INCOME GAP [ $ ]
$12,166
FAMILY INCOME DEFICIT
0.41
INEQUALITY / GINI INDEX
48,083
TOTAL POPULATION
24,364
MALE POPULATION
23,719
FEMALE POPULATION
102.72
MALES / 100 FEMALES
97.35
FEMALES / 100 MALES
34.0
MEDIAN AGE
3.6
AVG FAMILY SIZE
3.0
AVG HOUSEHOLD SIZE
23,119
LABOR FORCE [ PEOPLE ]
62.8%
PERCENT IN LABOR FORCE
5.8%
UNEMPLOYMENT RATE
North Highlands Zip Codes
North Highlands Area Codes
Income in North Highlands
Income Overview in North Highlands
Per Capita Income in North Highlands is $26,051, while median incomes of families and households are $64,961 and $62,156 respectively.
| Characteristic | Number | Measure |
| Per Capita Income | 48,083 | $26,051 |
| Median Family Income | 10,956 | $64,961 |
| Mean Family Income | 10,956 | $79,377 |
| Median Household Income | 15,910 | $62,156 |
| Mean Household Income | 15,910 | $75,466 |
| Income Deficit | 10,956 | $12,166 |
| Wage / Income Gap (%) | 48,083 | 24.37% |
| Wage / Income Gap ($) | 48,083 | 75.63¢ per $1 |
| Gini / Inequality Index | 48,083 | 0.41 |
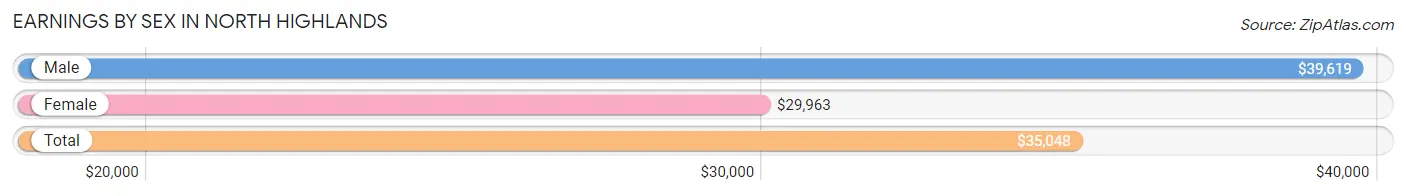
Earnings by Sex in North Highlands
Average Earnings in North Highlands are $35,048, $39,619 for men and $29,963 for women, a difference of 24.4%.
| Sex | Number | Average Earnings |
| Male | 12,797 (54.6%) | $39,619 |
| Female | 10,625 (45.4%) | $29,963 |
| Total | 23,422 (100.0%) | $35,048 |
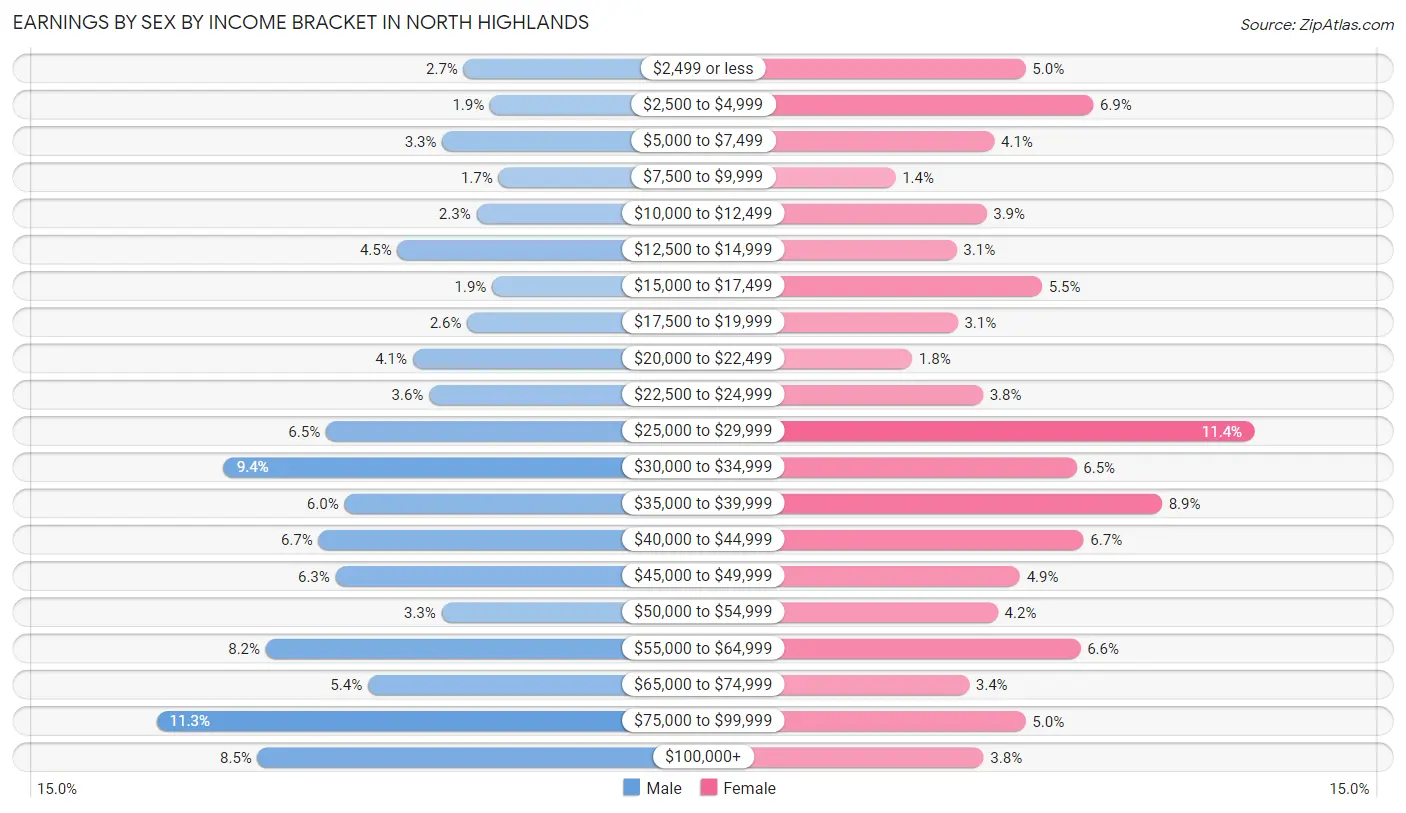
Earnings by Sex by Income Bracket in North Highlands
The most common earnings brackets in North Highlands are $75,000 to $99,999 for men (1,445 | 11.3%) and $25,000 to $29,999 for women (1,216 | 11.4%).
| Income | Male | Female |
| $2,499 or less | 340 (2.7%) | 533 (5.0%) |
| $2,500 to $4,999 | 246 (1.9%) | 735 (6.9%) |
| $5,000 to $7,499 | 417 (3.3%) | 440 (4.1%) |
| $7,500 to $9,999 | 215 (1.7%) | 145 (1.4%) |
| $10,000 to $12,499 | 294 (2.3%) | 416 (3.9%) |
| $12,500 to $14,999 | 579 (4.5%) | 327 (3.1%) |
| $15,000 to $17,499 | 238 (1.9%) | 582 (5.5%) |
| $17,500 to $19,999 | 327 (2.6%) | 330 (3.1%) |
| $20,000 to $22,499 | 524 (4.1%) | 194 (1.8%) |
| $22,500 to $24,999 | 464 (3.6%) | 406 (3.8%) |
| $25,000 to $29,999 | 836 (6.5%) | 1,216 (11.4%) |
| $30,000 to $34,999 | 1,203 (9.4%) | 685 (6.5%) |
| $35,000 to $39,999 | 769 (6.0%) | 940 (8.8%) |
| $40,000 to $44,999 | 862 (6.7%) | 707 (6.7%) |
| $45,000 to $49,999 | 801 (6.3%) | 516 (4.9%) |
| $50,000 to $54,999 | 420 (3.3%) | 451 (4.2%) |
| $55,000 to $64,999 | 1,052 (8.2%) | 697 (6.6%) |
| $65,000 to $74,999 | 684 (5.3%) | 364 (3.4%) |
| $75,000 to $99,999 | 1,445 (11.3%) | 533 (5.0%) |
| $100,000+ | 1,081 (8.5%) | 408 (3.8%) |
| Total | 12,797 (100.0%) | 10,625 (100.0%) |
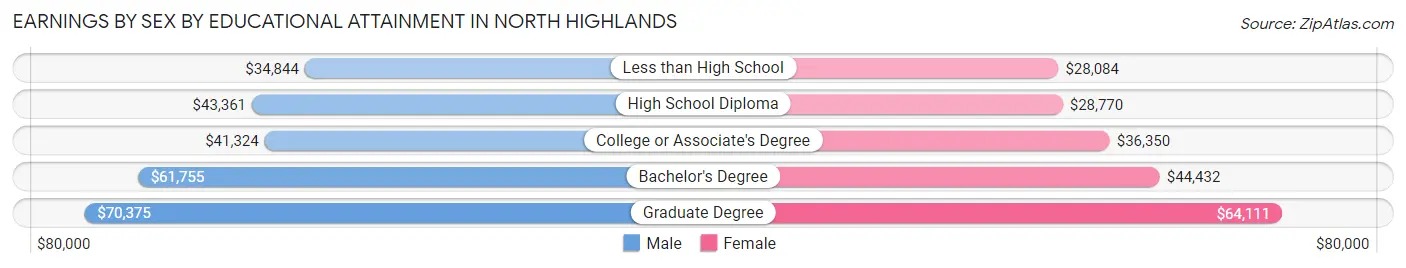
Earnings by Sex by Educational Attainment in North Highlands
Average earnings in North Highlands are $42,717 for men and $35,603 for women, a difference of 16.7%. Men with an educational attainment of graduate degree enjoy the highest average annual earnings of $70,375, while those with less than high school education earn the least with $34,844. Women with an educational attainment of graduate degree earn the most with the average annual earnings of $64,111, while those with less than high school education have the smallest earnings of $28,084.
| Educational Attainment | Male Income | Female Income |
| Less than High School | $34,844 | $28,084 |
| High School Diploma | $43,361 | $28,770 |
| College or Associate's Degree | $41,324 | $36,350 |
| Bachelor's Degree | $61,755 | $44,432 |
| Graduate Degree | $70,375 | $64,111 |
| Total | $42,717 | $35,603 |
Family Income in North Highlands
Family Income Brackets in North Highlands
According to the North Highlands family income data, there are 2,049 families falling into the $50,000 to $74,999 income range, which is the most common income bracket and makes up 18.7% of all families. Conversely, the $10,000 to $14,999 income bracket is the least frequent group with only 362 families (3.3%) belonging to this category.
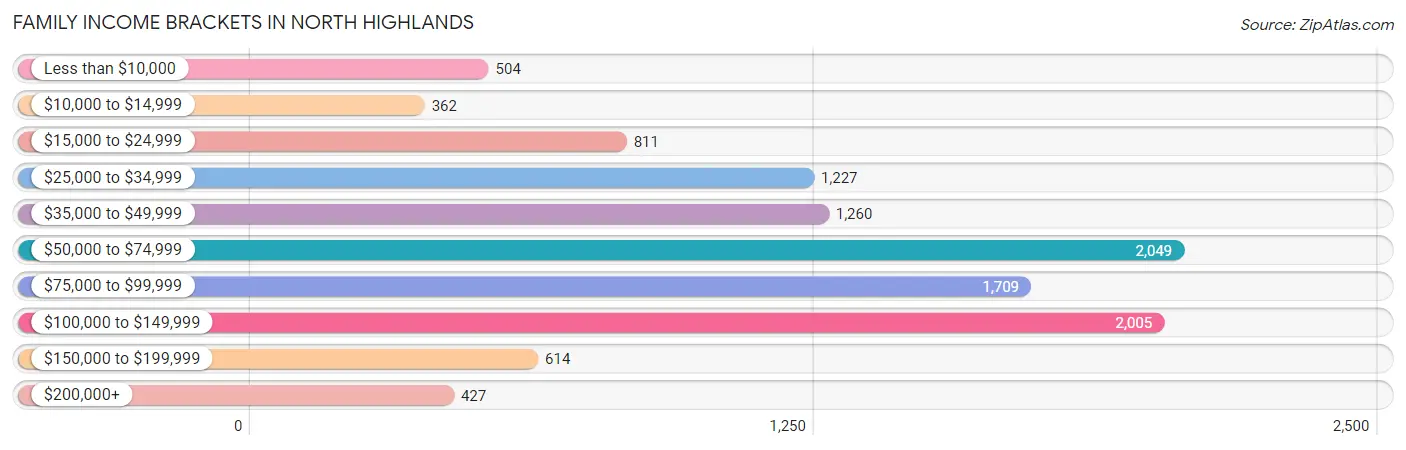
| Income Bracket | # Families | % Families |
| Less than $10,000 | 504 | 4.6% |
| $10,000 to $14,999 | 362 | 3.3% |
| $15,000 to $24,999 | 811 | 7.4% |
| $25,000 to $34,999 | 1,227 | 11.2% |
| $35,000 to $49,999 | 1,260 | 11.5% |
| $50,000 to $74,999 | 2,049 | 18.7% |
| $75,000 to $99,999 | 1,709 | 15.6% |
| $100,000 to $149,999 | 2,005 | 18.3% |
| $150,000 to $199,999 | 614 | 5.6% |
| $200,000+ | 427 | 3.9% |
Family Income by Famaliy Size in North Highlands
6-person families (638 | 5.8%) account for the highest median family income in North Highlands with $72,083 per family, while 2-person families (4,110 | 37.5%) have the highest median income of $31,320 per family member.
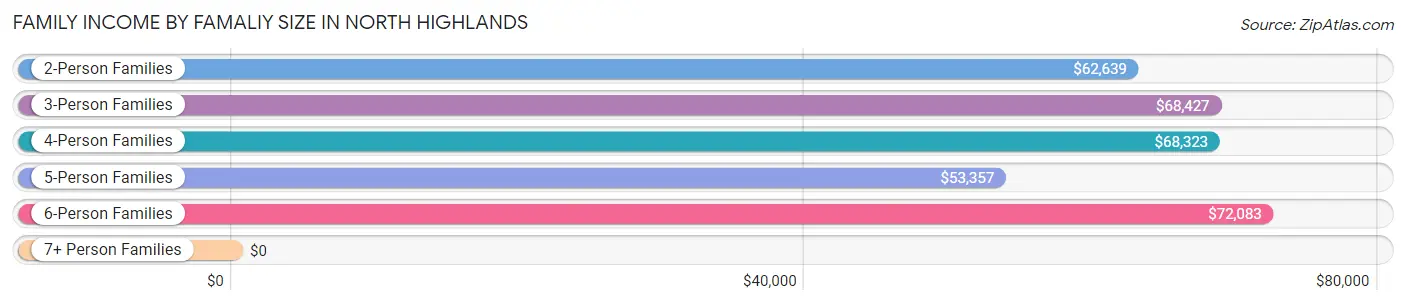
| Income Bracket | # Families | Median Income |
| 2-Person Families | 4,110 (37.5%) | $62,639 |
| 3-Person Families | 2,632 (24.0%) | $68,427 |
| 4-Person Families | 1,887 (17.2%) | $68,323 |
| 5-Person Families | 1,158 (10.6%) | $53,357 |
| 6-Person Families | 638 (5.8%) | $72,083 |
| 7+ Person Families | 531 (4.9%) | $0 |
| Total | 10,956 (100.0%) | $64,961 |
Family Income by Number of Earners in North Highlands
The median family income in North Highlands is $64,961, with families comprising 3+ earners (1,469) having the highest median family income of $120,674, while families with no earners (1,348) have the lowest median family income of $29,870, accounting for 13.4% and 12.3% of families, respectively.
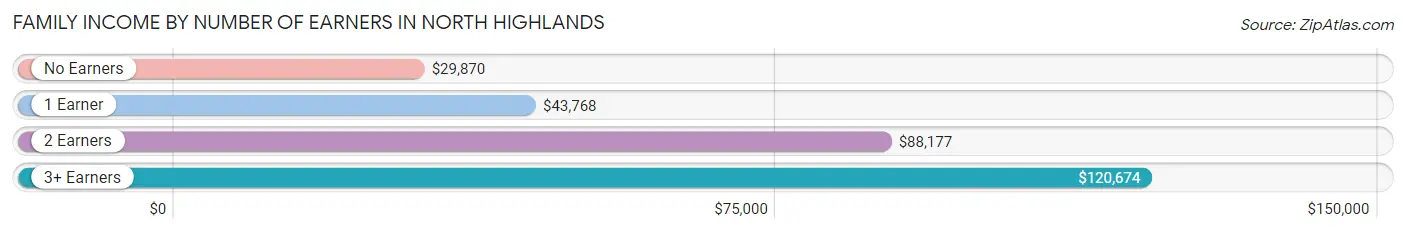
| Number of Earners | # Families | Median Income |
| No Earners | 1,348 (12.3%) | $29,870 |
| 1 Earner | 4,266 (38.9%) | $43,768 |
| 2 Earners | 3,873 (35.3%) | $88,177 |
| 3+ Earners | 1,469 (13.4%) | $120,674 |
| Total | 10,956 (100.0%) | $64,961 |
Household Income in North Highlands
Household Income Brackets in North Highlands
With 3,246 households falling in the category, the $50,000 to $74,999 income range is the most frequent in North Highlands, accounting for 20.4% of all households. In contrast, only 573 households (3.6%) fall into the $10,000 to $14,999 income bracket, making it the least populous group.
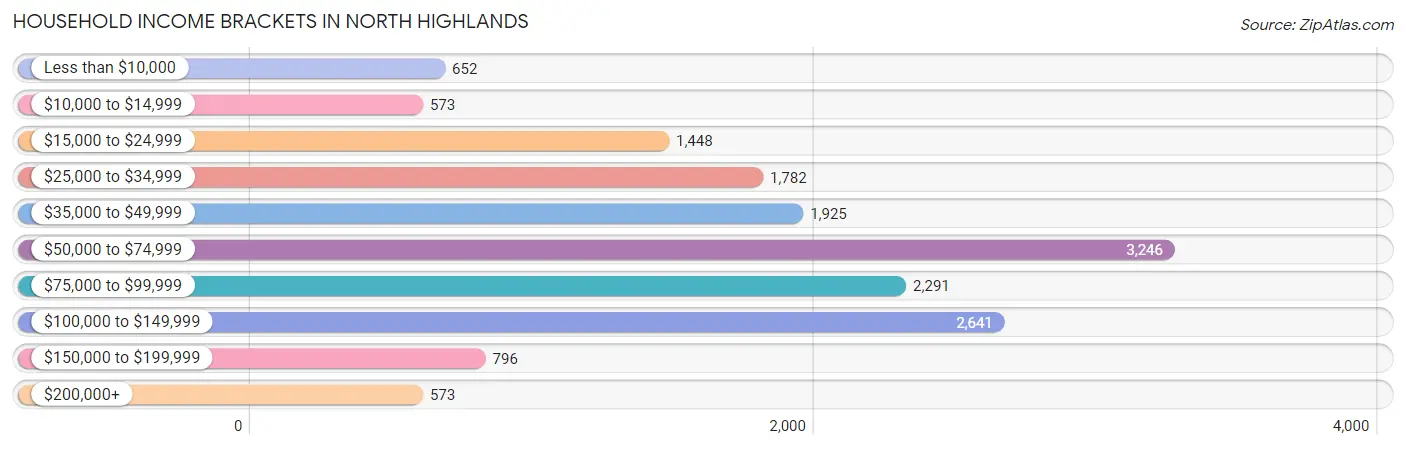
| Income Bracket | # Households | % Households |
| Less than $10,000 | 652 | 4.1% |
| $10,000 to $14,999 | 573 | 3.6% |
| $15,000 to $24,999 | 1,448 | 9.1% |
| $25,000 to $34,999 | 1,782 | 11.2% |
| $35,000 to $49,999 | 1,925 | 12.1% |
| $50,000 to $74,999 | 3,246 | 20.4% |
| $75,000 to $99,999 | 2,291 | 14.4% |
| $100,000 to $149,999 | 2,641 | 16.6% |
| $150,000 to $199,999 | 796 | 5.0% |
| $200,000+ | 573 | 3.6% |
Household Income by Householder Age in North Highlands
The median household income in North Highlands is $62,156, with the highest median household income of $70,739 found in the 45 to 64 years age bracket for the primary householder. A total of 5,505 households (34.6%) fall into this category. Meanwhile, the 15 to 24 years age bracket for the primary householder has the lowest median household income of $0, with 673 households (4.2%) in this group.
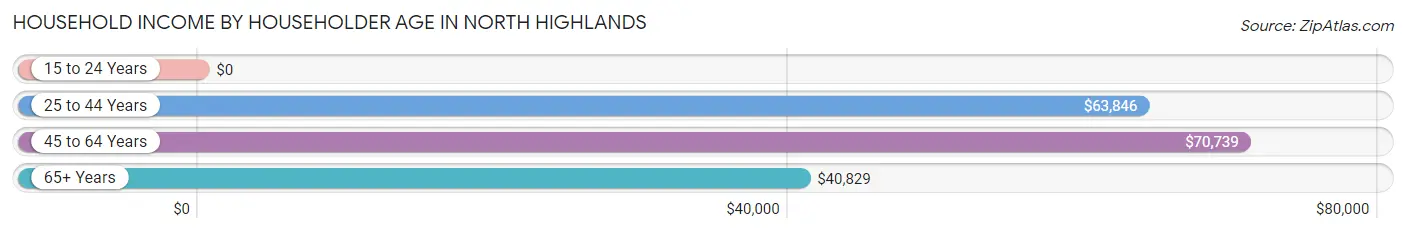
| Income Bracket | # Households | Median Income |
| 15 to 24 Years | 673 (4.2%) | $0 |
| 25 to 44 Years | 6,391 (40.2%) | $63,846 |
| 45 to 64 Years | 5,505 (34.6%) | $70,739 |
| 65+ Years | 3,341 (21.0%) | $40,829 |
| Total | 15,910 (100.0%) | $62,156 |
Poverty in North Highlands
Income Below Poverty by Sex and Age in North Highlands
With 19.6% poverty level for males and 21.4% for females among the residents of North Highlands, under 5 year old males and 5 year old females are the most vulnerable to poverty, with 904 males (42.2%) and 198 females (58.8%) in their respective age groups living below the poverty level.
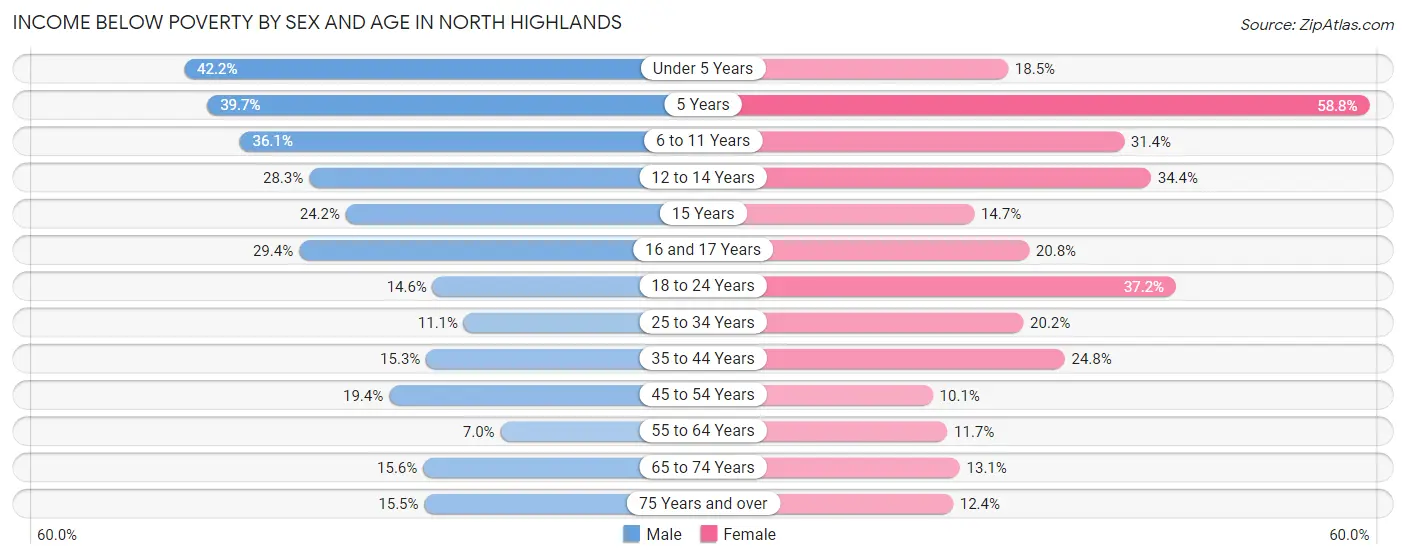
| Age Bracket | Male | Female |
| Under 5 Years | 904 (42.2%) | 321 (18.5%) |
| 5 Years | 115 (39.7%) | 198 (58.8%) |
| 6 to 11 Years | 728 (36.1%) | 576 (31.4%) |
| 12 to 14 Years | 305 (28.3%) | 353 (34.4%) |
| 15 Years | 86 (24.2%) | 34 (14.7%) |
| 16 and 17 Years | 184 (29.4%) | 129 (20.8%) |
| 18 to 24 Years | 344 (14.5%) | 975 (37.2%) |
| 25 to 34 Years | 438 (11.1%) | 704 (20.2%) |
| 35 to 44 Years | 523 (15.3%) | 754 (24.8%) |
| 45 to 54 Years | 508 (19.4%) | 255 (10.1%) |
| 55 to 64 Years | 186 (7.0%) | 383 (11.7%) |
| 65 to 74 Years | 269 (15.6%) | 212 (13.1%) |
| 75 Years and over | 143 (15.5%) | 148 (12.4%) |
| Total | 4,733 (19.6%) | 5,042 (21.4%) |
Income Above Poverty by Sex and Age in North Highlands
According to the poverty statistics in North Highlands, males aged 55 to 64 years and females aged 45 to 54 years are the age groups that are most secure financially, with 93.0% of males and 89.9% of females in these age groups living above the poverty line.
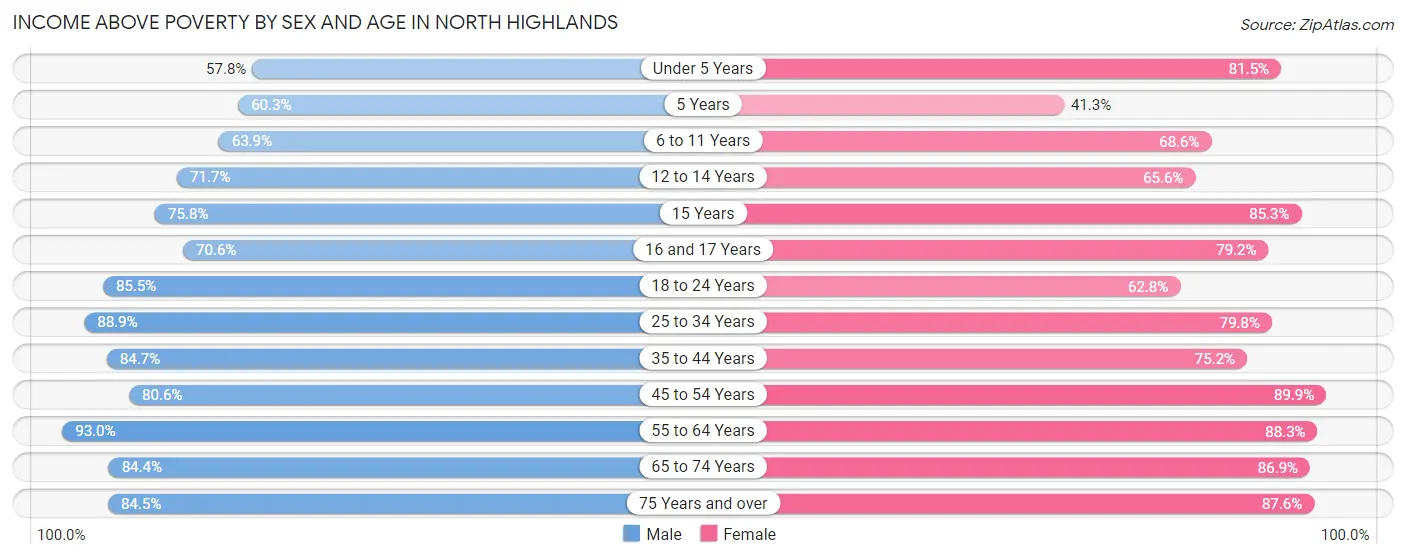
| Age Bracket | Male | Female |
| Under 5 Years | 1,236 (57.8%) | 1,414 (81.5%) |
| 5 Years | 175 (60.3%) | 139 (41.2%) |
| 6 to 11 Years | 1,291 (63.9%) | 1,258 (68.6%) |
| 12 to 14 Years | 772 (71.7%) | 673 (65.6%) |
| 15 Years | 269 (75.8%) | 197 (85.3%) |
| 16 and 17 Years | 441 (70.6%) | 490 (79.2%) |
| 18 to 24 Years | 2,020 (85.5%) | 1,645 (62.8%) |
| 25 to 34 Years | 3,514 (88.9%) | 2,783 (79.8%) |
| 35 to 44 Years | 2,899 (84.7%) | 2,285 (75.2%) |
| 45 to 54 Years | 2,109 (80.6%) | 2,265 (89.9%) |
| 55 to 64 Years | 2,466 (93.0%) | 2,882 (88.3%) |
| 65 to 74 Years | 1,453 (84.4%) | 1,404 (86.9%) |
| 75 Years and over | 781 (84.5%) | 1,049 (87.6%) |
| Total | 19,426 (80.4%) | 18,484 (78.6%) |
Income Below Poverty Among Married-Couple Families in North Highlands
The poverty statistics for married-couple families in North Highlands show that 12.0% or 834 of the total 6,958 families live below the poverty line. Families with 5 or more children have the highest poverty rate of 39.1%, comprising of 79 families. On the other hand, families with no children have the lowest poverty rate of 6.2%, which includes 208 families.
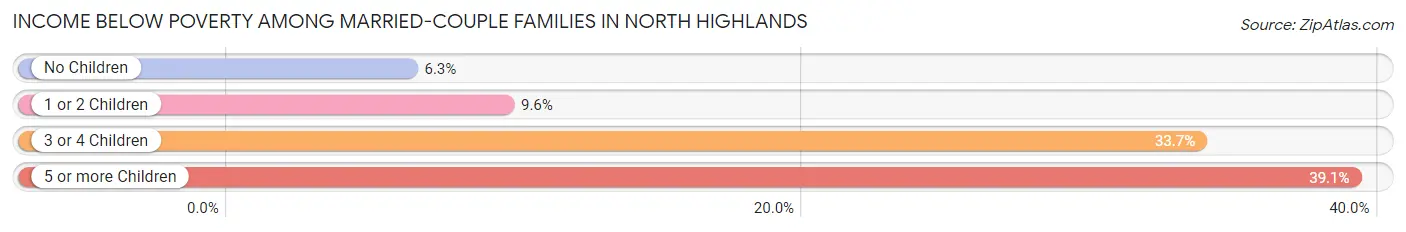
| Children | Above Poverty | Below Poverty |
| No Children | 3,119 (93.8%) | 208 (6.2%) |
| 1 or 2 Children | 2,285 (90.4%) | 243 (9.6%) |
| 3 or 4 Children | 597 (66.3%) | 304 (33.7%) |
| 5 or more Children | 123 (60.9%) | 79 (39.1%) |
| Total | 6,124 (88.0%) | 834 (12.0%) |
Income Below Poverty Among Single-Parent Households in North Highlands
According to the poverty data in North Highlands, 20.1% or 237 single-father households and 28.0% or 789 single-mother households are living below the poverty line. Among single-father households, those with 1 or 2 children have the highest poverty rate, with 193 households (44.5%) experiencing poverty. Likewise, among single-mother households, those with 5 or more children have the highest poverty rate, with 78 households (88.6%) falling below the poverty line.
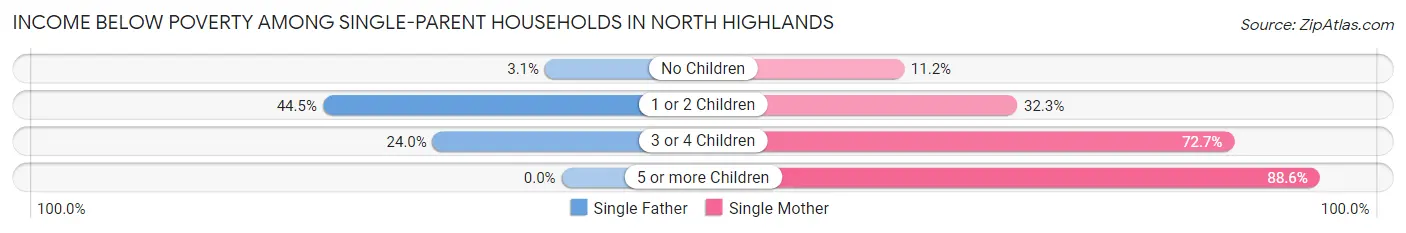
| Children | Single Father | Single Mother |
| No Children | 20 (3.1%) | 145 (11.2%) |
| 1 or 2 Children | 193 (44.5%) | 382 (32.3%) |
| 3 or 4 Children | 24 (24.0%) | 184 (72.7%) |
| 5 or more Children | 0 (0.0%) | 78 (88.6%) |
| Total | 237 (20.1%) | 789 (28.0%) |
Income Below Poverty Among Married-Couple vs Single-Parent Households in North Highlands
The poverty data for North Highlands shows that 834 of the married-couple family households (12.0%) and 1,026 of the single-parent households (25.7%) are living below the poverty level. Within the married-couple family households, those with 5 or more children have the highest poverty rate, with 79 households (39.1%) falling below the poverty line. Among the single-parent households, those with 5 or more children have the highest poverty rate, with 78 household (88.6%) living below poverty.
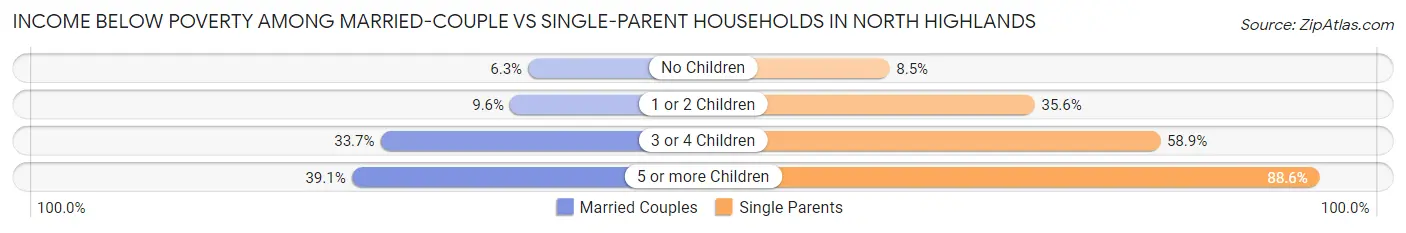
| Children | Married-Couple Families | Single-Parent Households |
| No Children | 208 (6.2%) | 165 (8.5%) |
| 1 or 2 Children | 243 (9.6%) | 575 (35.6%) |
| 3 or 4 Children | 304 (33.7%) | 208 (58.9%) |
| 5 or more Children | 79 (39.1%) | 78 (88.6%) |
| Total | 834 (12.0%) | 1,026 (25.7%) |
Race in North Highlands
The most populous races in North Highlands are White / Caucasian (27,712 | 57.6%), Hispanic or Latino (14,685 | 30.5%), and Two or more Races (6,544 | 13.6%).
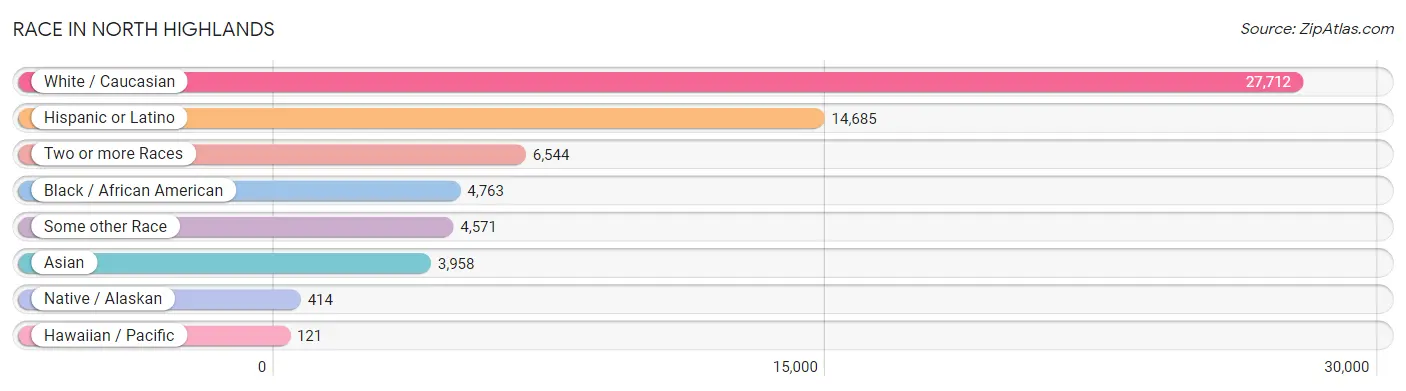
| Race | # Population | % Population |
| Asian | 3,958 | 8.2% |
| Black / African American | 4,763 | 9.9% |
| Hawaiian / Pacific | 121 | 0.3% |
| Hispanic or Latino | 14,685 | 30.5% |
| Native / Alaskan | 414 | 0.9% |
| White / Caucasian | 27,712 | 57.6% |
| Two or more Races | 6,544 | 13.6% |
| Some other Race | 4,571 | 9.5% |
| Total | 48,083 | 100.0% |
Ancestry in North Highlands
The most populous ancestries reported in North Highlands are Mexican (11,776 | 24.5%), Ukrainian (2,746 | 5.7%), German (2,647 | 5.5%), Irish (2,095 | 4.4%), and English (1,806 | 3.8%), together accounting for 43.8% of all North Highlands residents.
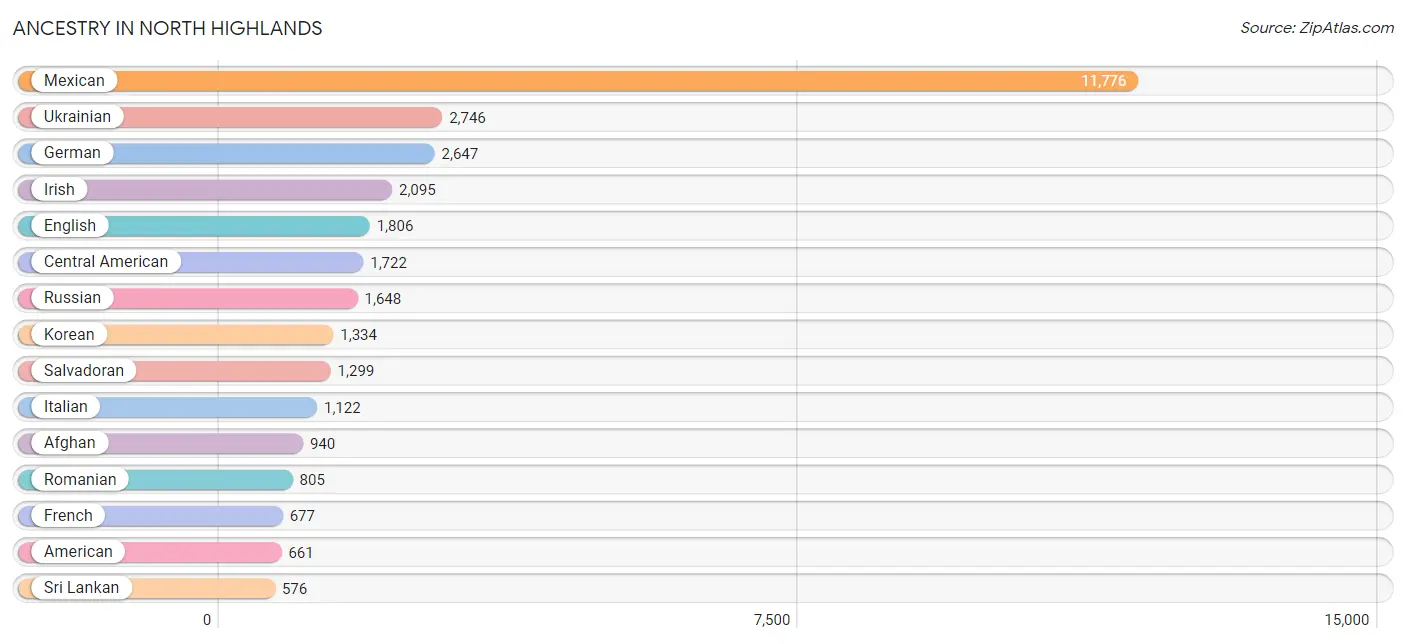
| Ancestry | # Population | % Population |
| Afghan | 940 | 1.9% |
| African | 77 | 0.2% |
| American | 661 | 1.4% |
| Apache | 9 | 0.0% |
| Arab | 102 | 0.2% |
| Argentinean | 72 | 0.2% |
| Armenian | 30 | 0.1% |
| Bangladeshi | 452 | 0.9% |
| Belgian | 7 | 0.0% |
| Bhutanese | 251 | 0.5% |
| Blackfeet | 147 | 0.3% |
| Brazilian | 13 | 0.0% |
| British | 69 | 0.1% |
| Burmese | 161 | 0.3% |
| Cajun | 9 | 0.0% |
| Canadian | 77 | 0.2% |
| Central American | 1,722 | 3.6% |
| Cherokee | 519 | 1.1% |
| Chippewa | 31 | 0.1% |
| Choctaw | 69 | 0.1% |
| Colombian | 12 | 0.0% |
| Croatian | 47 | 0.1% |
| Cuban | 23 | 0.1% |
| Czech | 39 | 0.1% |
| Czechoslovakian | 9 | 0.0% |
| Danish | 27 | 0.1% |
| Dominican | 17 | 0.0% |
| Dutch | 285 | 0.6% |
| Eastern European | 49 | 0.1% |
| Ecuadorian | 28 | 0.1% |
| English | 1,806 | 3.8% |
| Ethiopian | 22 | 0.1% |
| European | 420 | 0.9% |
| Finnish | 97 | 0.2% |
| French | 677 | 1.4% |
| French Canadian | 44 | 0.1% |
| German | 2,647 | 5.5% |
| Greek | 24 | 0.1% |
| Guamanian / Chamorro | 158 | 0.3% |
| Guatemalan | 369 | 0.8% |
| Hungarian | 105 | 0.2% |
| Indian (Asian) | 184 | 0.4% |
| Iranian | 108 | 0.2% |
| Iraqi | 23 | 0.1% |
| Irish | 2,095 | 4.4% |
| Italian | 1,122 | 2.3% |
| Jamaican | 209 | 0.4% |
| Japanese | 6 | 0.0% |
| Kenyan | 24 | 0.1% |
| Korean | 1,334 | 2.8% |
| Laotian | 1 | 0.0% |
| Liberian | 70 | 0.2% |
| Luxembourger | 7 | 0.0% |
| Malaysian | 123 | 0.3% |
| Mexican | 11,776 | 24.5% |
| Mexican American Indian | 167 | 0.4% |
| Native Hawaiian | 81 | 0.2% |
| Navajo | 50 | 0.1% |
| Nepalese | 75 | 0.2% |
| Nicaraguan | 54 | 0.1% |
| Nigerian | 62 | 0.1% |
| Northern European | 45 | 0.1% |
| Norwegian | 279 | 0.6% |
| Pakistani | 26 | 0.1% |
| Peruvian | 19 | 0.0% |
| Polish | 335 | 0.7% |
| Portuguese | 176 | 0.4% |
| Puerto Rican | 215 | 0.4% |
| Romanian | 805 | 1.7% |
| Russian | 1,648 | 3.4% |
| Salvadoran | 1,299 | 2.7% |
| Samoan | 106 | 0.2% |
| Scandinavian | 20 | 0.0% |
| Scotch-Irish | 262 | 0.5% |
| Scottish | 474 | 1.0% |
| Sioux | 10 | 0.0% |
| Slavic | 279 | 0.6% |
| South American | 230 | 0.5% |
| Spaniard | 156 | 0.3% |
| Spanish | 174 | 0.4% |
| Sri Lankan | 576 | 1.2% |
| Subsaharan African | 275 | 0.6% |
| Swedish | 225 | 0.5% |
| Swiss | 17 | 0.0% |
| Thai | 44 | 0.1% |
| Tongan | 10 | 0.0% |
| Turkish | 37 | 0.1% |
| Ukrainian | 2,746 | 5.7% |
| Venezuelan | 99 | 0.2% |
| Welsh | 190 | 0.4% |
| Yaqui | 45 | 0.1% | View All 91 Rows |
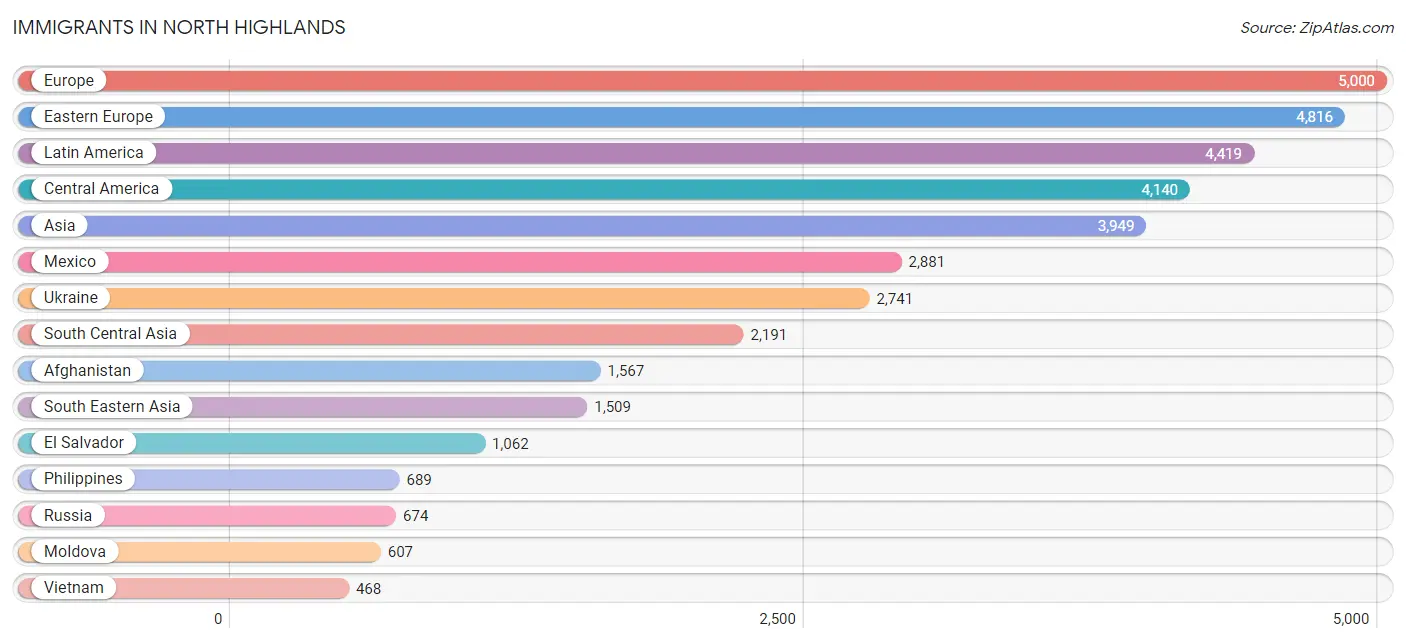
Immigrants in North Highlands
The most numerous immigrant groups reported in North Highlands came from Europe (5,000 | 10.4%), Eastern Europe (4,816 | 10.0%), Latin America (4,419 | 9.2%), Central America (4,140 | 8.6%), and Asia (3,949 | 8.2%), together accounting for 46.4% of all North Highlands residents.
| Immigration Origin | # Population | % Population |
| Afghanistan | 1,567 | 3.3% |
| Africa | 323 | 0.7% |
| Argentina | 29 | 0.1% |
| Asia | 3,949 | 8.2% |
| Belarus | 290 | 0.6% |
| Brazil | 8 | 0.0% |
| Cambodia | 6 | 0.0% |
| Cameroon | 13 | 0.0% |
| Canada | 108 | 0.2% |
| Caribbean | 10 | 0.0% |
| Central America | 4,140 | 8.6% |
| China | 8 | 0.0% |
| Croatia | 21 | 0.0% |
| Cuba | 10 | 0.0% |
| Denmark | 7 | 0.0% |
| Eastern Africa | 165 | 0.3% |
| Eastern Asia | 149 | 0.3% |
| Eastern Europe | 4,816 | 10.0% |
| Ecuador | 28 | 0.1% |
| Egypt | 43 | 0.1% |
| El Salvador | 1,062 | 2.2% |
| England | 22 | 0.1% |
| Ethiopia | 37 | 0.1% |
| Europe | 5,000 | 10.4% |
| France | 16 | 0.0% |
| Germany | 115 | 0.2% |
| Guatemala | 154 | 0.3% |
| Hong Kong | 2 | 0.0% |
| Indonesia | 70 | 0.2% |
| Iran | 104 | 0.2% |
| Iraq | 96 | 0.2% |
| Italy | 10 | 0.0% |
| Japan | 33 | 0.1% |
| Kazakhstan | 194 | 0.4% |
| Kenya | 128 | 0.3% |
| Korea | 108 | 0.2% |
| Laos | 170 | 0.4% |
| Latin America | 4,419 | 9.2% |
| Liberia | 40 | 0.1% |
| Mexico | 2,881 | 6.0% |
| Middle Africa | 13 | 0.0% |
| Moldova | 607 | 1.3% |
| Nicaragua | 43 | 0.1% |
| Nigeria | 62 | 0.1% |
| Northern Africa | 43 | 0.1% |
| Northern Europe | 43 | 0.1% |
| Pakistan | 6 | 0.0% |
| Peru | 105 | 0.2% |
| Philippines | 689 | 1.4% |
| Romania | 366 | 0.8% |
| Russia | 674 | 1.4% |
| Serbia | 37 | 0.1% |
| South America | 269 | 0.6% |
| South Central Asia | 2,191 | 4.6% |
| South Eastern Asia | 1,509 | 3.1% |
| Southern Europe | 10 | 0.0% |
| Syria | 4 | 0.0% |
| Thailand | 106 | 0.2% |
| Ukraine | 2,741 | 5.7% |
| Uzbekistan | 320 | 0.7% |
| Venezuela | 99 | 0.2% |
| Vietnam | 468 | 1.0% |
| Western Africa | 102 | 0.2% |
| Western Asia | 100 | 0.2% |
| Western Europe | 131 | 0.3% | View All 65 Rows |
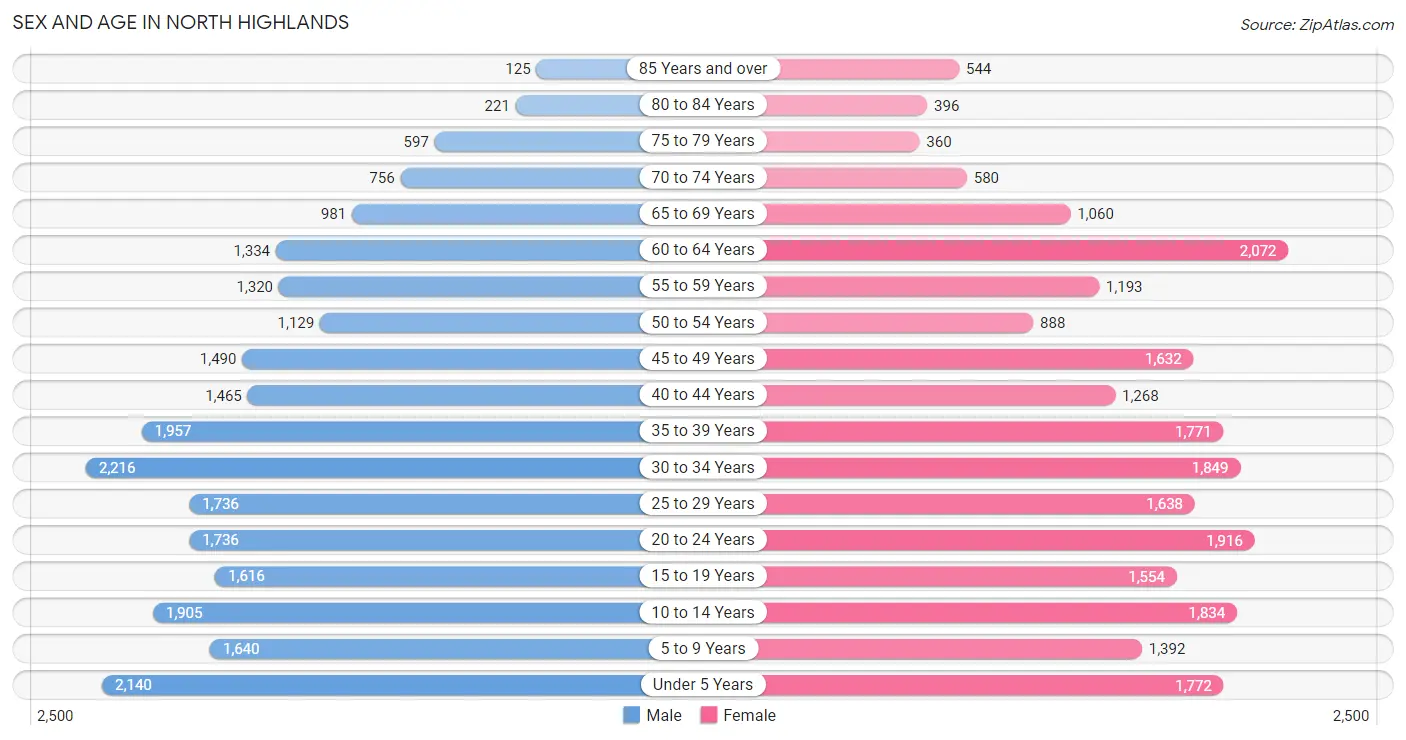
Sex and Age in North Highlands
Sex and Age in North Highlands
The most populous age groups in North Highlands are 30 to 34 Years (2,216 | 9.1%) for men and 60 to 64 Years (2,072 | 8.7%) for women.
| Age Bracket | Male | Female |
| Under 5 Years | 2,140 (8.8%) | 1,772 (7.5%) |
| 5 to 9 Years | 1,640 (6.7%) | 1,392 (5.9%) |
| 10 to 14 Years | 1,905 (7.8%) | 1,834 (7.7%) |
| 15 to 19 Years | 1,616 (6.6%) | 1,554 (6.6%) |
| 20 to 24 Years | 1,736 (7.1%) | 1,916 (8.1%) |
| 25 to 29 Years | 1,736 (7.1%) | 1,638 (6.9%) |
| 30 to 34 Years | 2,216 (9.1%) | 1,849 (7.8%) |
| 35 to 39 Years | 1,957 (8.0%) | 1,771 (7.5%) |
| 40 to 44 Years | 1,465 (6.0%) | 1,268 (5.3%) |
| 45 to 49 Years | 1,490 (6.1%) | 1,632 (6.9%) |
| 50 to 54 Years | 1,129 (4.6%) | 888 (3.7%) |
| 55 to 59 Years | 1,320 (5.4%) | 1,193 (5.0%) |
| 60 to 64 Years | 1,334 (5.5%) | 2,072 (8.7%) |
| 65 to 69 Years | 981 (4.0%) | 1,060 (4.5%) |
| 70 to 74 Years | 756 (3.1%) | 580 (2.5%) |
| 75 to 79 Years | 597 (2.5%) | 360 (1.5%) |
| 80 to 84 Years | 221 (0.9%) | 396 (1.7%) |
| 85 Years and over | 125 (0.5%) | 544 (2.3%) |
| Total | 24,364 (100.0%) | 23,719 (100.0%) |
Families and Households in North Highlands
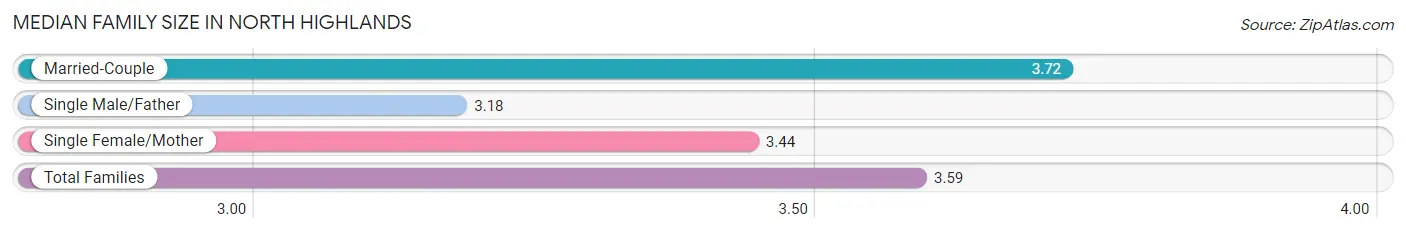
Median Family Size in North Highlands
The median family size in North Highlands is 3.59 persons per family, with married-couple families (6,958 | 63.5%) accounting for the largest median family size of 3.72 persons per family. On the other hand, single male/father families (1,182 | 10.8%) represent the smallest median family size with 3.18 persons per family.
| Family Type | # Families | Family Size |
| Married-Couple | 6,958 (63.5%) | 3.72 |
| Single Male/Father | 1,182 (10.8%) | 3.18 |
| Single Female/Mother | 2,816 (25.7%) | 3.44 |
| Total Families | 10,956 (100.0%) | 3.59 |
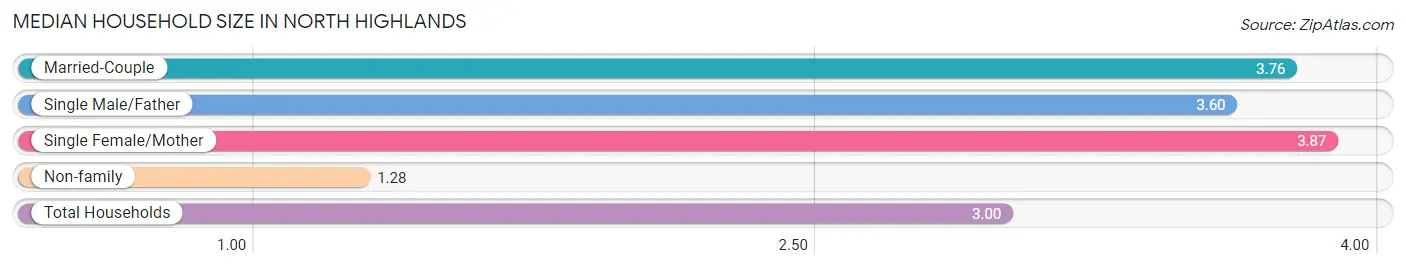
Median Household Size in North Highlands
The median household size in North Highlands is 3.00 persons per household, with single female/mother households (2,816 | 17.7%) accounting for the largest median household size of 3.87 persons per household. non-family households (4,954 | 31.1%) represent the smallest median household size with 1.28 persons per household.
| Household Type | # Households | Household Size |
| Married-Couple | 6,958 (43.7%) | 3.76 |
| Single Male/Father | 1,182 (7.4%) | 3.60 |
| Single Female/Mother | 2,816 (17.7%) | 3.87 |
| Non-family | 4,954 (31.1%) | 1.28 |
| Total Households | 15,910 (100.0%) | 3.00 |
Household Size by Marriage Status in North Highlands
Out of a total of 15,910 households in North Highlands, 10,956 (68.9%) are family households, while 4,954 (31.1%) are nonfamily households. The most numerous type of family households are 2-person households, comprising 3,432, and the most common type of nonfamily households are 1-person households, comprising 3,899.
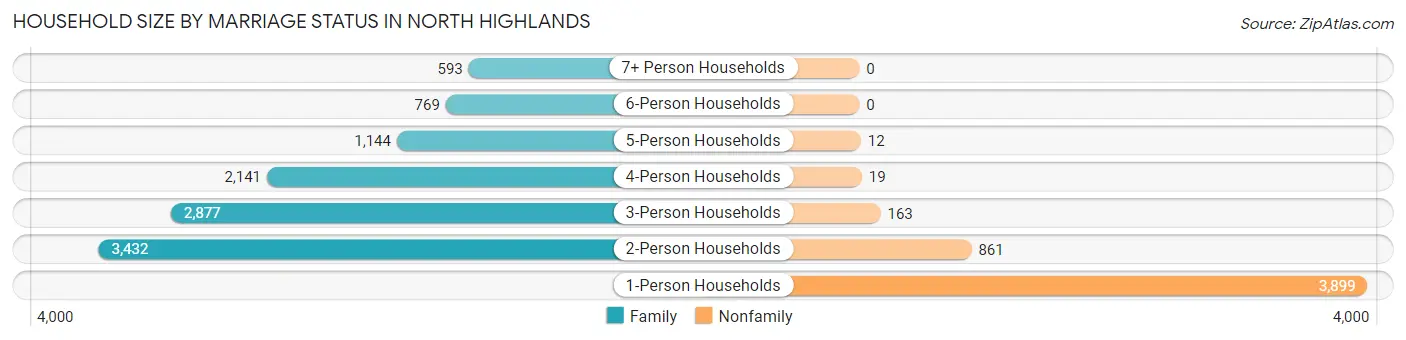
| Household Size | Family Households | Nonfamily Households |
| 1-Person Households | - | 3,899 (24.5%) |
| 2-Person Households | 3,432 (21.6%) | 861 (5.4%) |
| 3-Person Households | 2,877 (18.1%) | 163 (1.0%) |
| 4-Person Households | 2,141 (13.5%) | 19 (0.1%) |
| 5-Person Households | 1,144 (7.2%) | 12 (0.1%) |
| 6-Person Households | 769 (4.8%) | 0 (0.0%) |
| 7+ Person Households | 593 (3.7%) | 0 (0.0%) |
| Total | 10,956 (68.9%) | 4,954 (31.1%) |
Female Fertility in North Highlands
Fertility by Age in North Highlands
Average fertility rate in North Highlands is 59.0 births per 1,000 women. Women in the age bracket of 20 to 34 years have the highest fertility rate with 82.0 births per 1,000 women. Women in the age bracket of 20 to 34 years acount for 64.2% of all women with births.
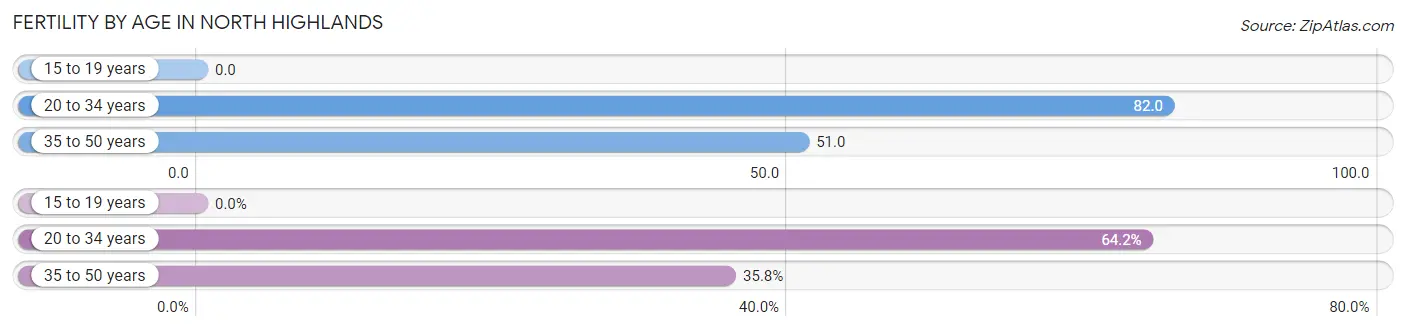
| Age Bracket | Women with Births | Births / 1,000 Women |
| 15 to 19 years | 0 (0.0%) | 0.0 |
| 20 to 34 years | 444 (64.2%) | 82.0 |
| 35 to 50 years | 248 (35.8%) | 51.0 |
| Total | 692 (100.0%) | 59.0 |
Fertility by Age by Marriage Status in North Highlands
51.0% of women with births (692) in North Highlands are married. The highest percentage of unmarried women with births falls into 20 to 34 years age bracket with 49.5% of them unmarried at the time of birth, while the lowest percentage of unmarried women with births belong to 35 to 50 years age bracket with 48.0% of them unmarried.
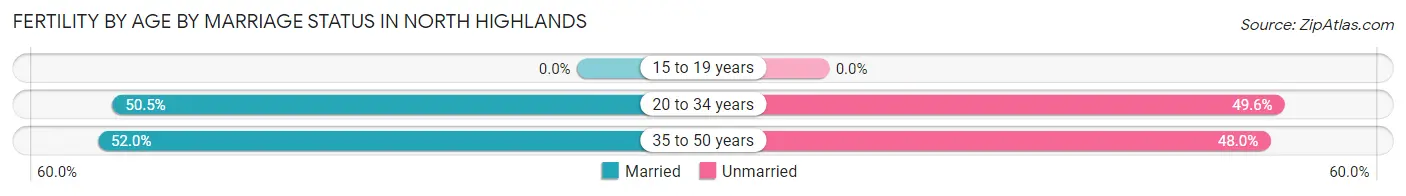
| Age Bracket | Married | Unmarried |
| 15 to 19 years | 0 (0.0%) | 0 (0.0%) |
| 20 to 34 years | 224 (50.4%) | 220 (49.5%) |
| 35 to 50 years | 129 (52.0%) | 119 (48.0%) |
| Total | 353 (51.0%) | 339 (49.0%) |
Fertility by Education in North Highlands
Average fertility rate in North Highlands is 59.0 births per 1,000 women. Women with the education attainment of graduate degree have the highest fertility rate of 114.0 births per 1,000 women, while women with the education attainment of college or associate's degree have the lowest fertility at 53.0 births per 1,000 women. Women with the education attainment of college or associate's degree represent 32.8% of all women with births.
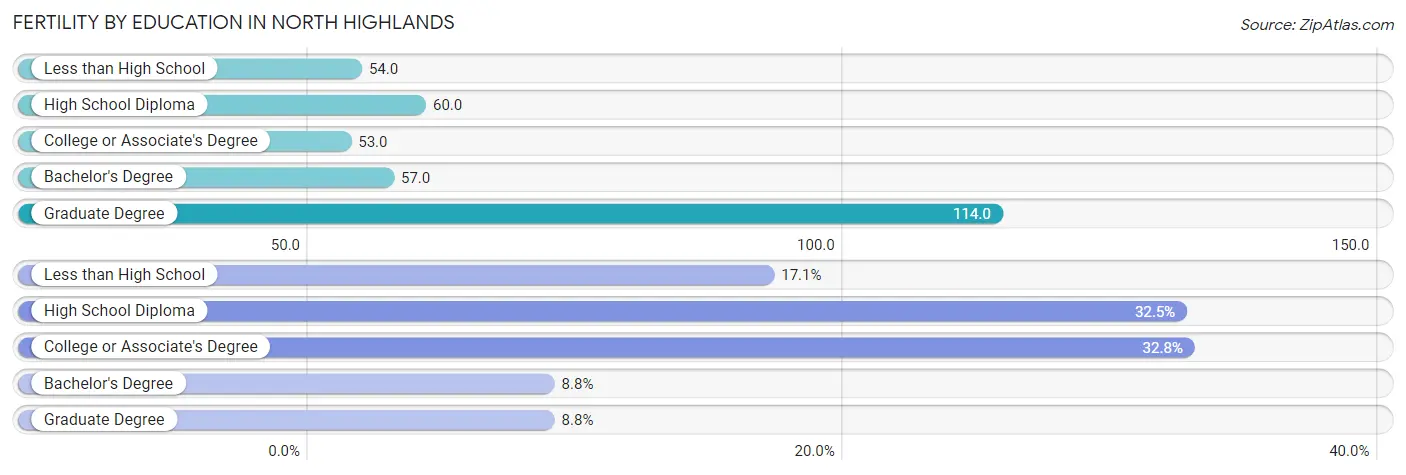
| Educational Attainment | Women with Births | Births / 1,000 Women |
| Less than High School | 118 (17.1%) | 54.0 |
| High School Diploma | 225 (32.5%) | 60.0 |
| College or Associate's Degree | 227 (32.8%) | 53.0 |
| Bachelor's Degree | 61 (8.8%) | 57.0 |
| Graduate Degree | 61 (8.8%) | 114.0 |
| Total | 692 (100.0%) | 59.0 |
Fertility by Education by Marriage Status in North Highlands
49.0% of women with births in North Highlands are unmarried. Women with the educational attainment of college or associate's degree are most likely to be married with 70.9% of them married at childbirth, while women with the educational attainment of graduate degree are least likely to be married with 70.5% of them unmarried at childbirth.
| Educational Attainment | Married | Unmarried |
| Less than High School | 40 (33.9%) | 78 (66.1%) |
| High School Diploma | 92 (40.9%) | 133 (59.1%) |
| College or Associate's Degree | 161 (70.9%) | 66 (29.1%) |
| Bachelor's Degree | 42 (68.9%) | 19 (31.1%) |
| Graduate Degree | 18 (29.5%) | 43 (70.5%) |
| Total | 353 (51.0%) | 339 (49.0%) |
Employment Characteristics in North Highlands
Employment by Class of Employer in North Highlands
Among the 21,234 employed individuals in North Highlands, private company employees (14,748 | 69.5%), self-employed (not incorporated) (1,518 | 7.1%), and local government employees (1,330 | 6.3%) make up the most common classes of employment.
| Employer Class | # Employees | % Employees |
| Private Company Employees | 14,748 | 69.5% |
| Self-Employed (Incorporated) | 529 | 2.5% |
| Self-Employed (Not Incorporated) | 1,518 | 7.1% |
| Not-for-profit Organizations | 1,178 | 5.6% |
| Local Government Employees | 1,330 | 6.3% |
| State Government Employees | 1,179 | 5.6% |
| Federal Government Employees | 752 | 3.5% |
| Unpaid Family Workers | 0 | 0.0% |
| Total | 21,234 | 100.0% |
Employment Status by Age in North Highlands
According to the labor force statistics for North Highlands, out of the total population over 16 years of age (36,814), 62.8% or 23,119 individuals are in the labor force, with 5.8% or 1,341 of them unemployed. The age group with the highest labor force participation rate is 30 to 34 years, with 79.9% or 3,248 individuals in the labor force. Within the labor force, the 20 to 24 years age range has the highest percentage of unemployed individuals, with 9.3% or 271 of them being unemployed.
| Age Bracket | In Labor Force | Unemployed |
| 16 to 19 Years | 933 (36.1%) | 50 (5.4%) |
| 20 to 24 Years | 2,914 (79.8%) | 271 (9.3%) |
| 25 to 29 Years | 2,625 (77.8%) | 81 (3.1%) |
| 30 to 34 Years | 3,248 (79.9%) | 185 (5.7%) |
| 35 to 44 Years | 4,897 (75.8%) | 367 (7.5%) |
| 45 to 54 Years | 3,901 (75.9%) | 94 (2.4%) |
| 55 to 59 Years | 1,686 (67.1%) | 116 (6.9%) |
| 60 to 64 Years | 1,843 (54.1%) | 85 (4.6%) |
| 65 to 74 Years | 986 (29.2%) | 88 (8.9%) |
| 75 Years and over | 85 (3.8%) | 0 (0.0%) |
| Total | 23,119 (62.8%) | 1,341 (5.8%) |
Employment Status by Educational Attainment in North Highlands
According to labor force statistics for North Highlands, 72.9% of individuals (18,194) out of the total population between 25 and 64 years of age (24,958) are in the labor force, with 5.1% or 928 of them being unemployed. The group with the highest labor force participation rate are those with the educational attainment of bachelor's degree or higher, with 88.5% or 2,931 individuals in the labor force. Within the labor force, individuals with less than high school education have the highest percentage of unemployment, with 6.6% or 135 of them being unemployed.
| Educational Attainment | In Labor Force | Unemployed |
| Less than High School | 2,046 (53.7%) | 251 (6.6%) |
| High School Diploma | 6,173 (72.3%) | 478 (5.6%) |
| College / Associate Degree | 7,048 (75.8%) | 539 (5.8%) |
| Bachelor's Degree or higher | 2,931 (88.5%) | 46 (1.4%) |
| Total | 18,194 (72.9%) | 1,273 (5.1%) |
Employment Occupations by Sex in North Highlands
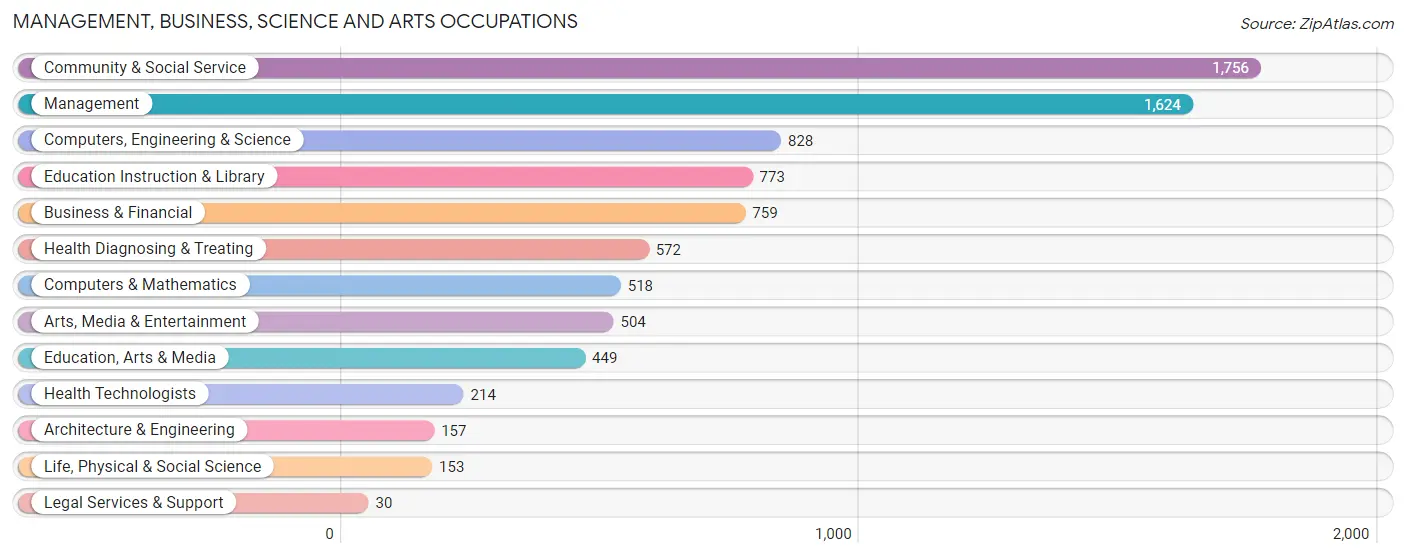
Management, Business, Science and Arts Occupations
The most common Management, Business, Science and Arts occupations in North Highlands are Community & Social Service (1,756 | 8.1%), Management (1,624 | 7.5%), Computers, Engineering & Science (828 | 3.8%), Education Instruction & Library (773 | 3.6%), and Business & Financial (759 | 3.5%).
Management, Business, Science and Arts Occupations by Sex
Within the Management, Business, Science and Arts occupations in North Highlands, the most male-oriented occupations are Life, Physical & Social Science (79.1%), Arts, Media & Entertainment (77.0%), and Computers & Mathematics (72.6%), while the most female-oriented occupations are Education Instruction & Library (87.3%), Legal Services & Support (86.7%), and Health Diagnosing & Treating (73.3%).
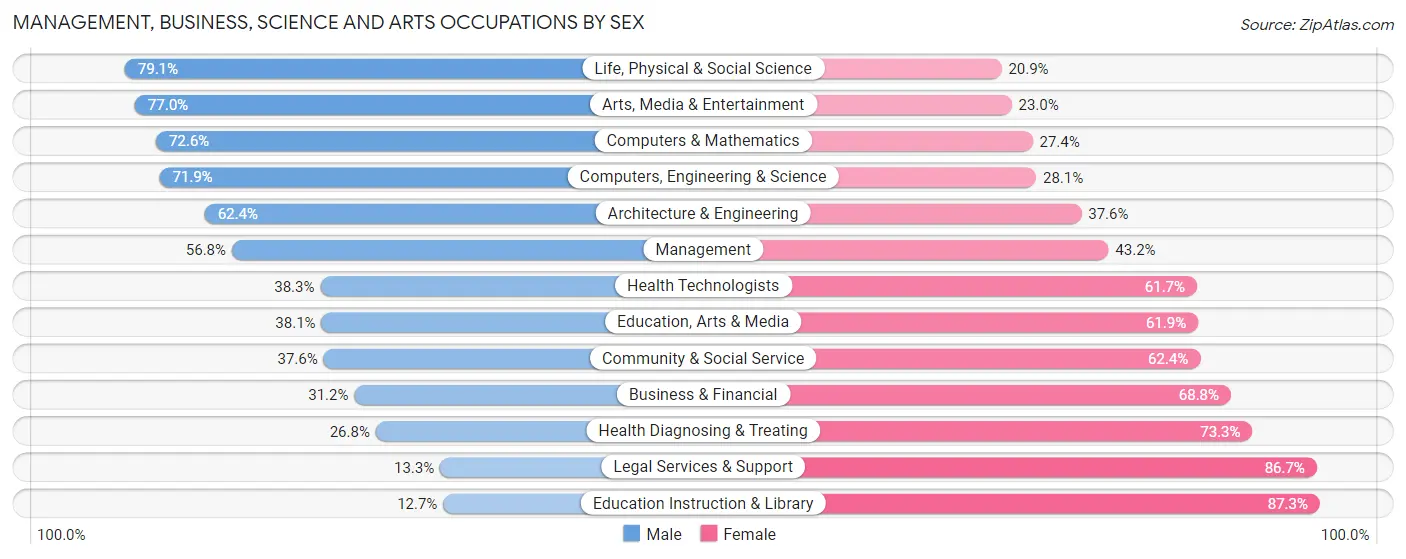
| Occupation | Male | Female |
| Management | 922 (56.8%) | 702 (43.2%) |
| Business & Financial | 237 (31.2%) | 522 (68.8%) |
| Computers, Engineering & Science | 595 (71.9%) | 233 (28.1%) |
| Computers & Mathematics | 376 (72.6%) | 142 (27.4%) |
| Architecture & Engineering | 98 (62.4%) | 59 (37.6%) |
| Life, Physical & Social Science | 121 (79.1%) | 32 (20.9%) |
| Community & Social Service | 661 (37.6%) | 1,095 (62.4%) |
| Education, Arts & Media | 171 (38.1%) | 278 (61.9%) |
| Legal Services & Support | 4 (13.3%) | 26 (86.7%) |
| Education Instruction & Library | 98 (12.7%) | 675 (87.3%) |
| Arts, Media & Entertainment | 388 (77.0%) | 116 (23.0%) |
| Health Diagnosing & Treating | 153 (26.8%) | 419 (73.3%) |
| Health Technologists | 82 (38.3%) | 132 (61.7%) |
| Total (Category) | 2,568 (46.4%) | 2,971 (53.6%) |
| Total (Overall) | 12,080 (55.6%) | 9,643 (44.4%) |
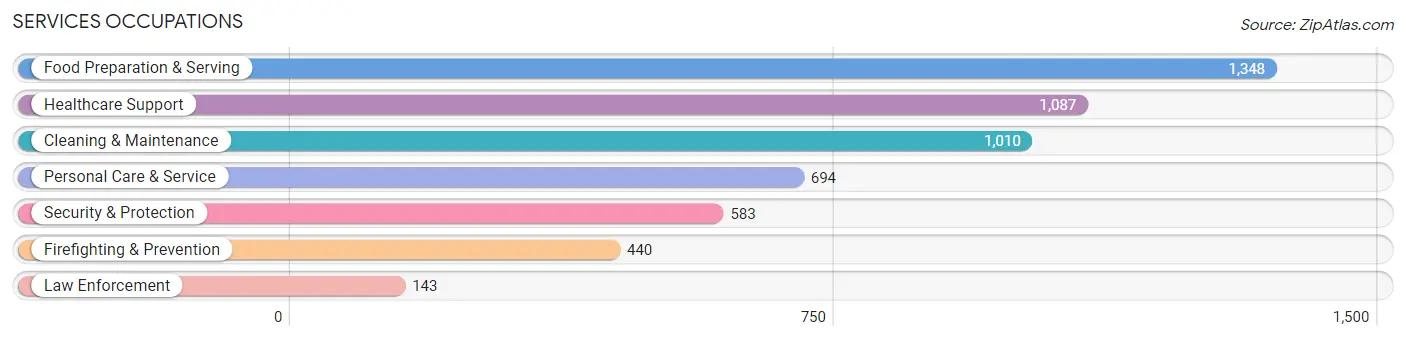
Services Occupations
The most common Services occupations in North Highlands are Food Preparation & Serving (1,348 | 6.2%), Healthcare Support (1,087 | 5.0%), Cleaning & Maintenance (1,010 | 4.6%), Personal Care & Service (694 | 3.2%), and Security & Protection (583 | 2.7%).
Services Occupations by Sex
Within the Services occupations in North Highlands, the most male-oriented occupations are Firefighting & Prevention (87.9%), Security & Protection (84.2%), and Law Enforcement (72.7%), while the most female-oriented occupations are Personal Care & Service (82.3%), Healthcare Support (79.7%), and Food Preparation & Serving (56.5%).
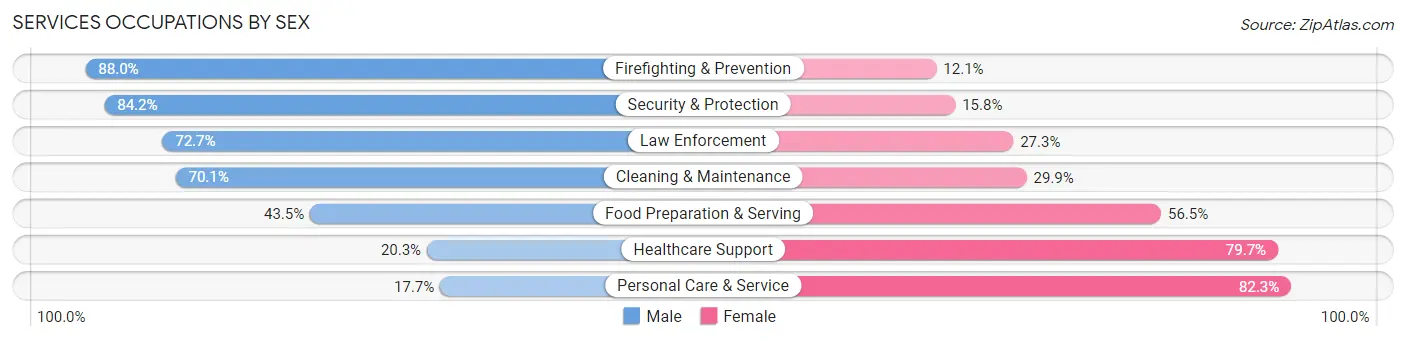
| Occupation | Male | Female |
| Healthcare Support | 221 (20.3%) | 866 (79.7%) |
| Security & Protection | 491 (84.2%) | 92 (15.8%) |
| Firefighting & Prevention | 387 (87.9%) | 53 (12.0%) |
| Law Enforcement | 104 (72.7%) | 39 (27.3%) |
| Food Preparation & Serving | 586 (43.5%) | 762 (56.5%) |
| Cleaning & Maintenance | 708 (70.1%) | 302 (29.9%) |
| Personal Care & Service | 123 (17.7%) | 571 (82.3%) |
| Total (Category) | 2,129 (45.1%) | 2,593 (54.9%) |
| Total (Overall) | 12,080 (55.6%) | 9,643 (44.4%) |
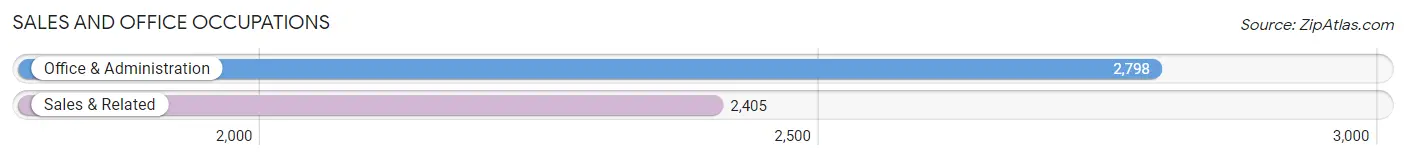
Sales and Office Occupations
The most common Sales and Office occupations in North Highlands are Office & Administration (2,798 | 12.9%), and Sales & Related (2,405 | 11.1%).
Sales and Office Occupations by Sex
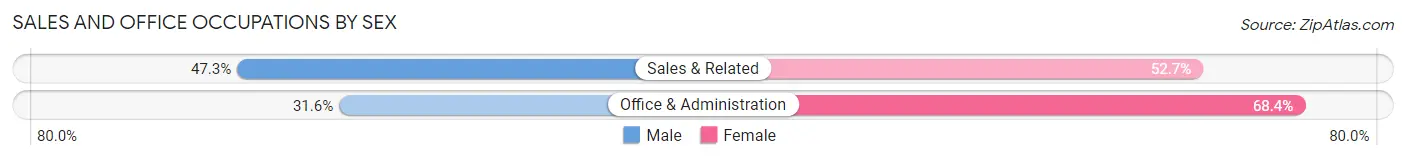
| Occupation | Male | Female |
| Sales & Related | 1,138 (47.3%) | 1,267 (52.7%) |
| Office & Administration | 885 (31.6%) | 1,913 (68.4%) |
| Total (Category) | 2,023 (38.9%) | 3,180 (61.1%) |
| Total (Overall) | 12,080 (55.6%) | 9,643 (44.4%) |
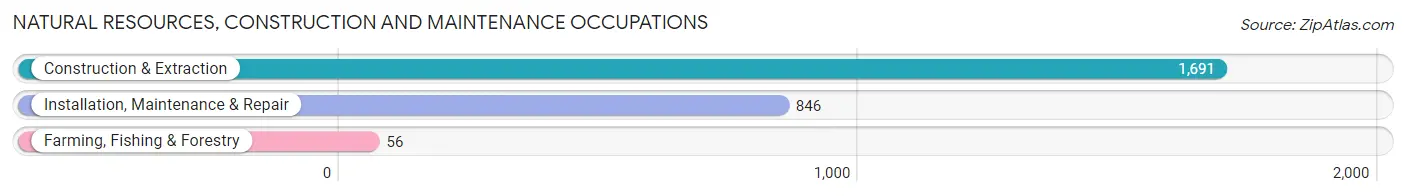
Natural Resources, Construction and Maintenance Occupations
The most common Natural Resources, Construction and Maintenance occupations in North Highlands are Construction & Extraction (1,691 | 7.8%), Installation, Maintenance & Repair (846 | 3.9%), and Farming, Fishing & Forestry (56 | 0.3%).
Natural Resources, Construction and Maintenance Occupations by Sex
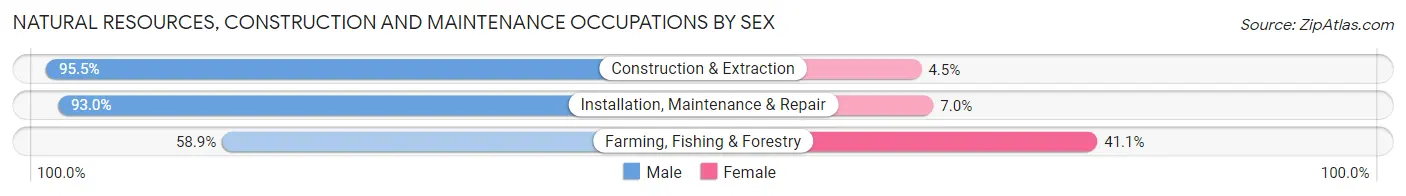
| Occupation | Male | Female |
| Farming, Fishing & Forestry | 33 (58.9%) | 23 (41.1%) |
| Construction & Extraction | 1,615 (95.5%) | 76 (4.5%) |
| Installation, Maintenance & Repair | 787 (93.0%) | 59 (7.0%) |
| Total (Category) | 2,435 (93.9%) | 158 (6.1%) |
| Total (Overall) | 12,080 (55.6%) | 9,643 (44.4%) |
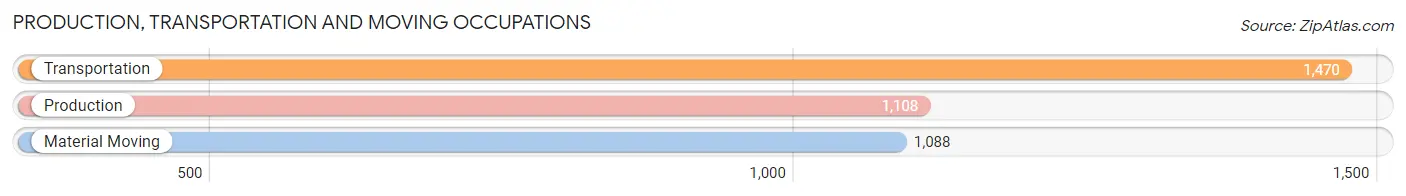
Production, Transportation and Moving Occupations
The most common Production, Transportation and Moving occupations in North Highlands are Transportation (1,470 | 6.8%), Production (1,108 | 5.1%), and Material Moving (1,088 | 5.0%).
Production, Transportation and Moving Occupations by Sex
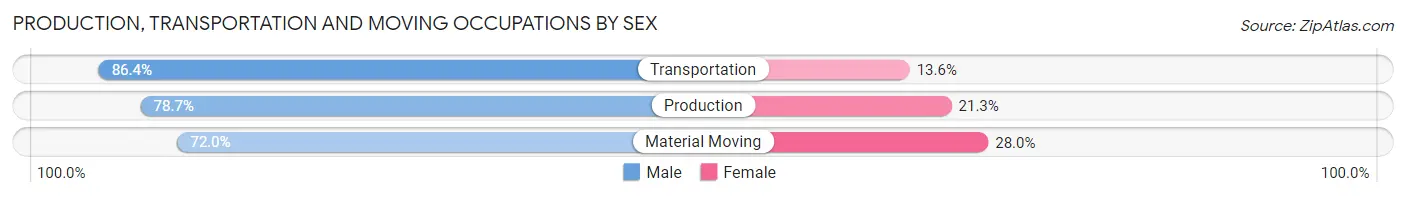
| Occupation | Male | Female |
| Production | 872 (78.7%) | 236 (21.3%) |
| Transportation | 1,270 (86.4%) | 200 (13.6%) |
| Material Moving | 783 (72.0%) | 305 (28.0%) |
| Total (Category) | 2,925 (79.8%) | 741 (20.2%) |
| Total (Overall) | 12,080 (55.6%) | 9,643 (44.4%) |
Employment Industries by Sex in North Highlands
Employment Industries in North Highlands
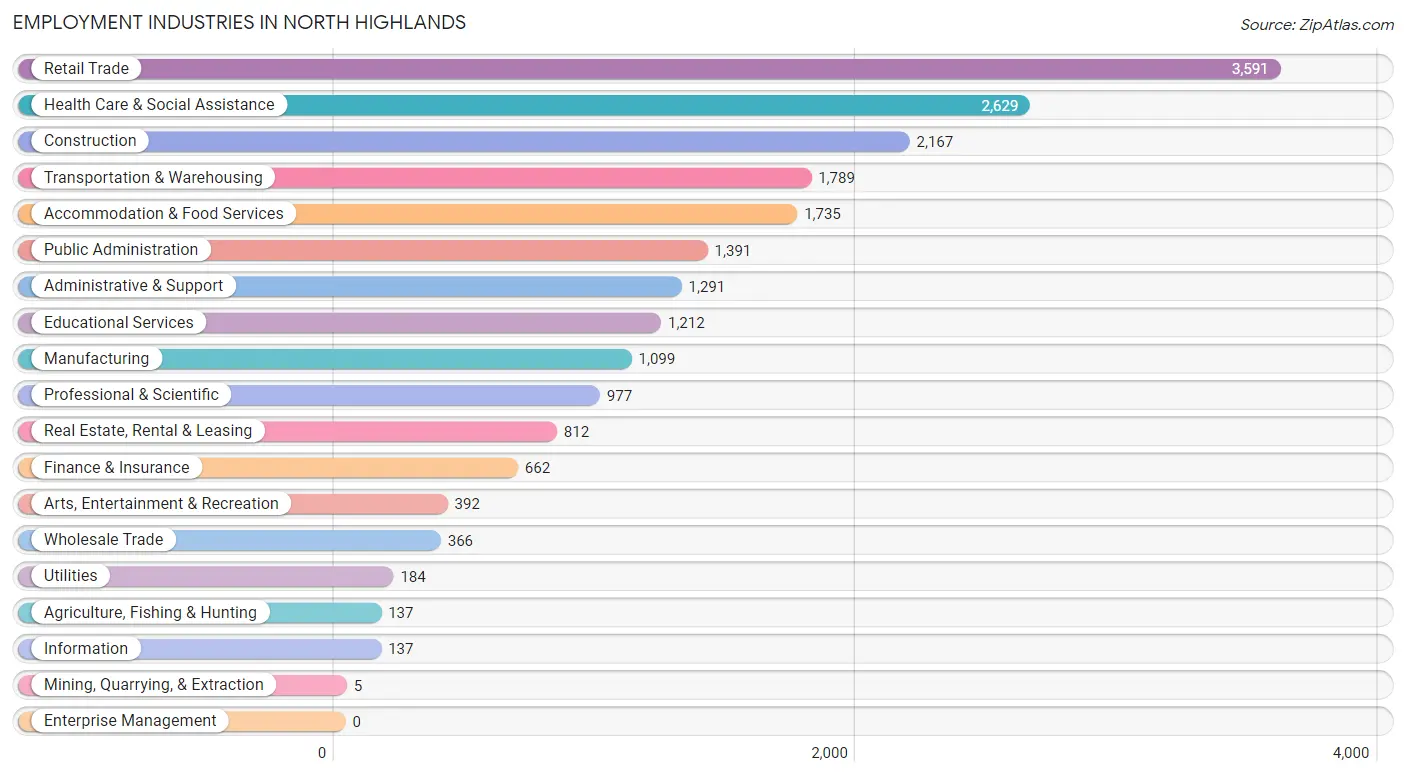
The major employment industries in North Highlands include Retail Trade (3,591 | 16.5%), Health Care & Social Assistance (2,629 | 12.1%), Construction (2,167 | 10.0%), Transportation & Warehousing (1,789 | 8.2%), and Accommodation & Food Services (1,735 | 8.0%).
Employment Industries by Sex in North Highlands
The North Highlands industries that see more men than women are Mining, Quarrying, & Extraction (100.0%), Construction (94.1%), and Utilities (90.8%), whereas the industries that tend to have a higher number of women are Finance & Insurance (75.8%), Educational Services (73.4%), and Health Care & Social Assistance (71.5%).
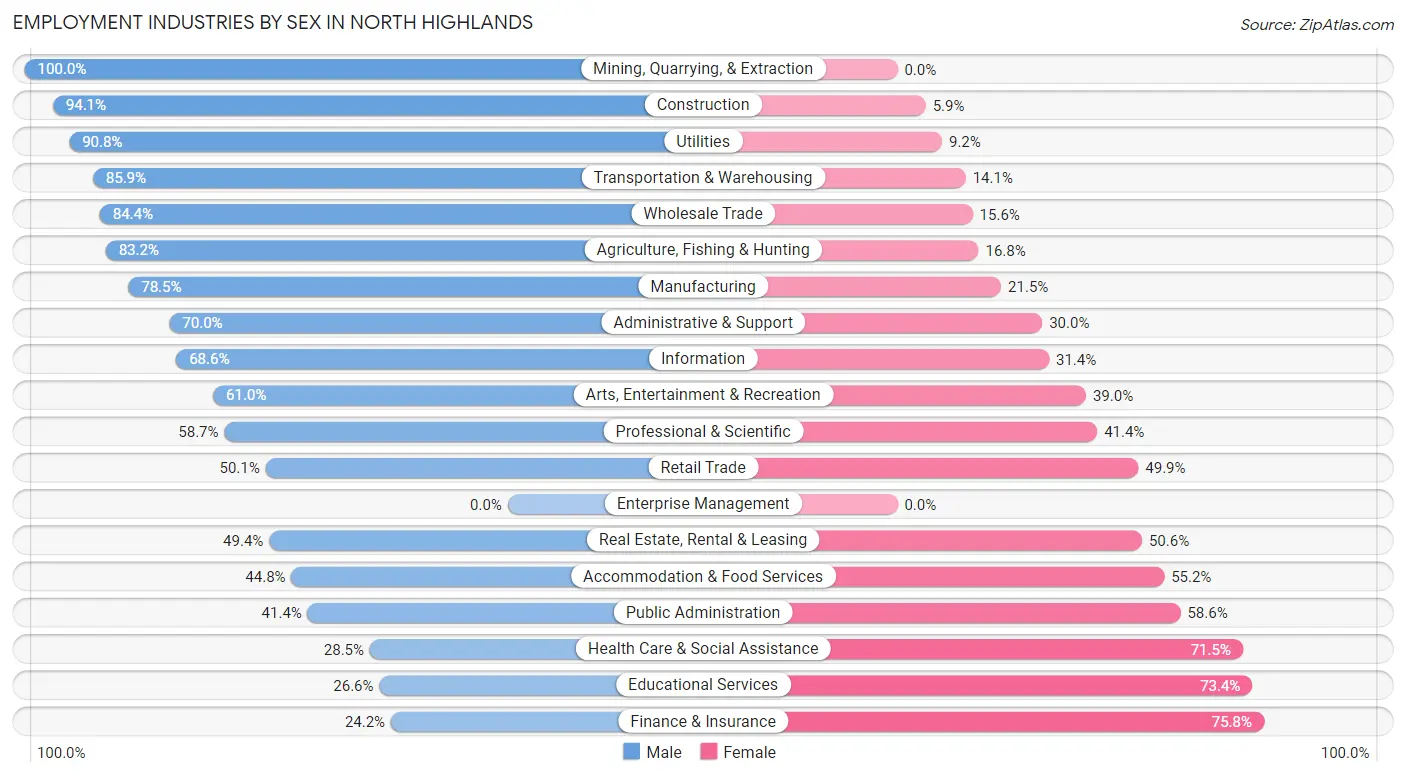
| Industry | Male | Female |
| Agriculture, Fishing & Hunting | 114 (83.2%) | 23 (16.8%) |
| Mining, Quarrying, & Extraction | 5 (100.0%) | 0 (0.0%) |
| Construction | 2,040 (94.1%) | 127 (5.9%) |
| Manufacturing | 863 (78.5%) | 236 (21.5%) |
| Wholesale Trade | 309 (84.4%) | 57 (15.6%) |
| Retail Trade | 1,800 (50.1%) | 1,791 (49.9%) |
| Transportation & Warehousing | 1,536 (85.9%) | 253 (14.1%) |
| Utilities | 167 (90.8%) | 17 (9.2%) |
| Information | 94 (68.6%) | 43 (31.4%) |
| Finance & Insurance | 160 (24.2%) | 502 (75.8%) |
| Real Estate, Rental & Leasing | 401 (49.4%) | 411 (50.6%) |
| Professional & Scientific | 573 (58.7%) | 404 (41.3%) |
| Enterprise Management | 0 (0.0%) | 0 (0.0%) |
| Administrative & Support | 904 (70.0%) | 387 (30.0%) |
| Educational Services | 322 (26.6%) | 890 (73.4%) |
| Health Care & Social Assistance | 750 (28.5%) | 1,879 (71.5%) |
| Arts, Entertainment & Recreation | 239 (61.0%) | 153 (39.0%) |
| Accommodation & Food Services | 777 (44.8%) | 958 (55.2%) |
| Public Administration | 576 (41.4%) | 815 (58.6%) |
| Total | 12,080 (55.6%) | 9,643 (44.4%) |
Education in North Highlands
School Enrollment in North Highlands
The most common levels of schooling among the 12,368 students in North Highlands are middle school (3,054 | 24.7%), college / undergraduate (2,589 | 20.9%), and high school (2,444 | 19.8%).
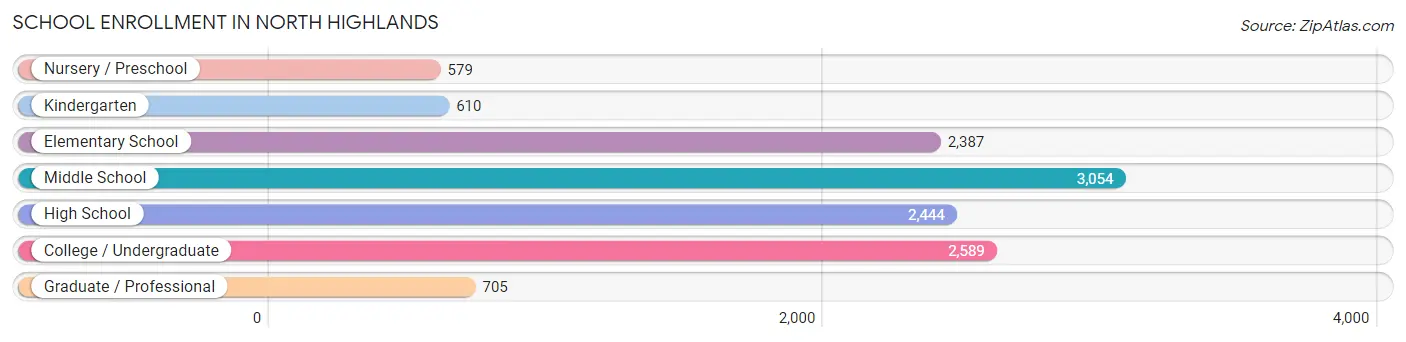
| School Level | # Students | % Students |
| Nursery / Preschool | 579 | 4.7% |
| Kindergarten | 610 | 4.9% |
| Elementary School | 2,387 | 19.3% |
| Middle School | 3,054 | 24.7% |
| High School | 2,444 | 19.8% |
| College / Undergraduate | 2,589 | 20.9% |
| Graduate / Professional | 705 | 5.7% |
| Total | 12,368 | 100.0% |
School Enrollment by Age by Funding Source in North Highlands
Out of a total of 12,368 students who are enrolled in schools in North Highlands, 928 (7.5%) attend a private institution, while the remaining 11,440 (92.5%) are enrolled in public schools. The age group of 35 years and over has the highest likelihood of being enrolled in private schools, with 308 (44.9% in the age bracket) enrolled. Conversely, the age group of 10 to 14 year olds has the lowest likelihood of being enrolled in a private school, with 3,505 (96.3% in the age bracket) attending a public institution.
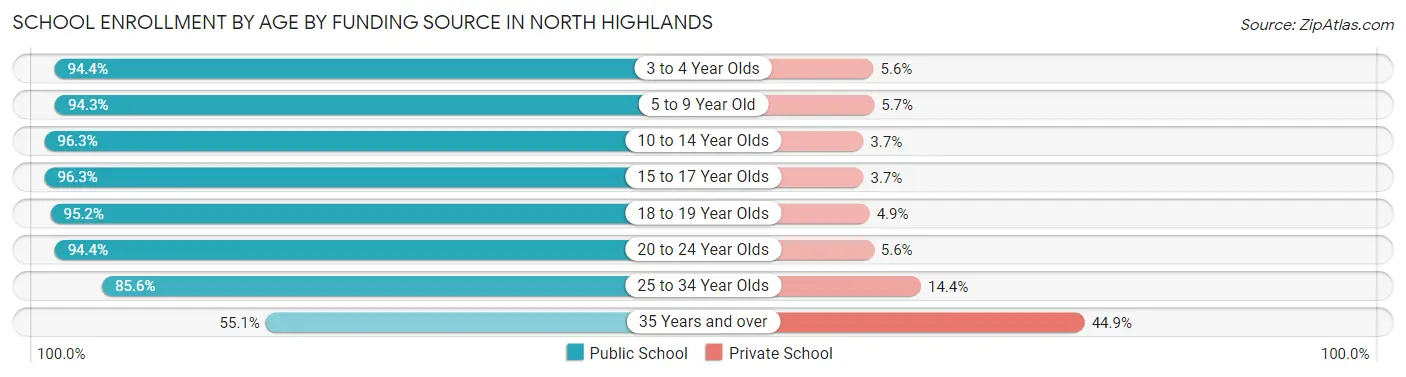
| Age Bracket | Public School | Private School |
| 3 to 4 Year Olds | 457 (94.4%) | 27 (5.6%) |
| 5 to 9 Year Old | 2,697 (94.3%) | 163 (5.7%) |
| 10 to 14 Year Olds | 3,505 (96.3%) | 134 (3.7%) |
| 15 to 17 Year Olds | 1,716 (96.3%) | 66 (3.7%) |
| 18 to 19 Year Olds | 824 (95.2%) | 42 (4.9%) |
| 20 to 24 Year Olds | 1,209 (94.4%) | 72 (5.6%) |
| 25 to 34 Year Olds | 659 (85.6%) | 111 (14.4%) |
| 35 Years and over | 378 (55.1%) | 308 (44.9%) |
| Total | 11,440 (92.5%) | 928 (7.5%) |
Educational Attainment by Field of Study in North Highlands
Business (778 | 16.9%), arts & humanities (487 | 10.6%), social sciences (473 | 10.3%), psychology (451 | 9.8%), and engineering (420 | 9.1%) are the most common fields of study among 4,592 individuals in North Highlands who have obtained a bachelor's degree or higher.
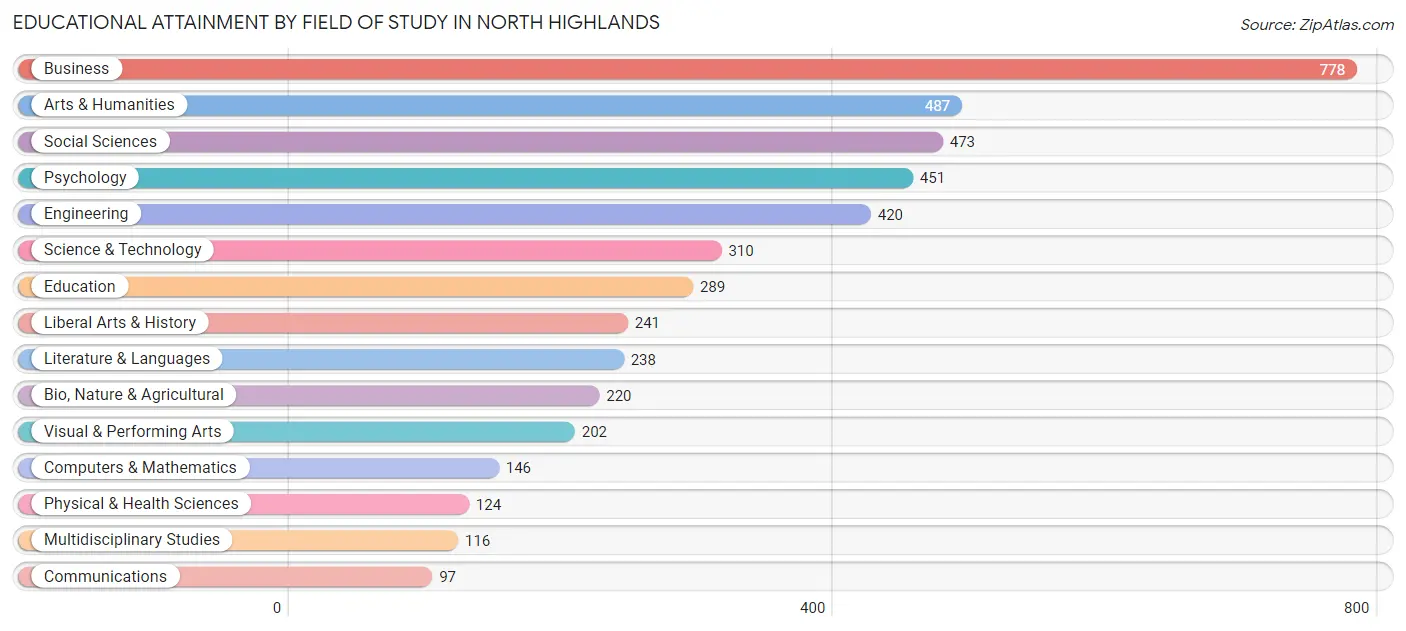
| Field of Study | # Graduates | % Graduates |
| Computers & Mathematics | 146 | 3.2% |
| Bio, Nature & Agricultural | 220 | 4.8% |
| Physical & Health Sciences | 124 | 2.7% |
| Psychology | 451 | 9.8% |
| Social Sciences | 473 | 10.3% |
| Engineering | 420 | 9.1% |
| Multidisciplinary Studies | 116 | 2.5% |
| Science & Technology | 310 | 6.8% |
| Business | 778 | 16.9% |
| Education | 289 | 6.3% |
| Literature & Languages | 238 | 5.2% |
| Liberal Arts & History | 241 | 5.2% |
| Visual & Performing Arts | 202 | 4.4% |
| Communications | 97 | 2.1% |
| Arts & Humanities | 487 | 10.6% |
| Total | 4,592 | 100.0% |
Transportation & Commute in North Highlands
Vehicle Availability by Sex in North Highlands
The most prevalent vehicle ownership categories in North Highlands are males with 2 vehicles (4,583, accounting for 38.8%) and females with 2 vehicles (3,265, making up 48.6%).
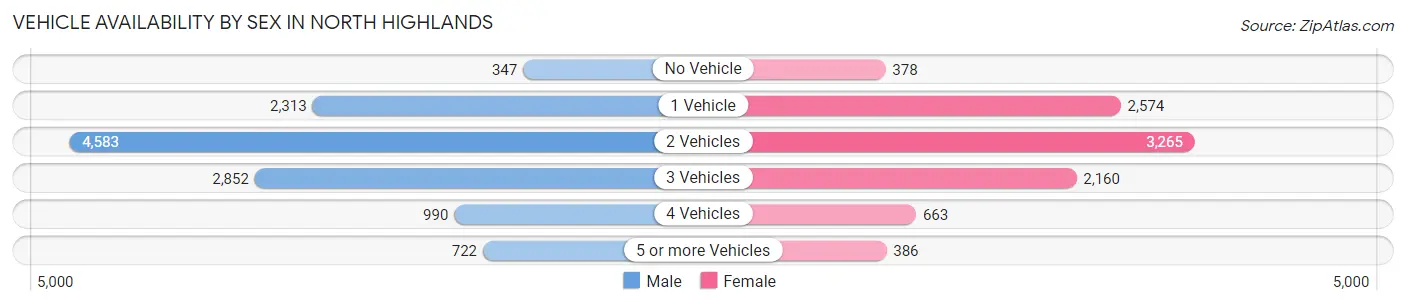
| Vehicles Available | Male | Female |
| No Vehicle | 347 (2.9%) | 378 (4.0%) |
| 1 Vehicle | 2,313 (19.6%) | 2,574 (27.3%) |
| 2 Vehicles | 4,583 (38.8%) | 3,265 (34.6%) |
| 3 Vehicles | 2,852 (24.2%) | 2,160 (22.9%) |
| 4 Vehicles | 990 (8.4%) | 663 (7.0%) |
| 5 or more Vehicles | 722 (6.1%) | 386 (4.1%) |
| Total | 11,807 (100.0%) | 9,426 (100.0%) |
Commute Time in North Highlands
The most frequently occuring commute durations in North Highlands are 30 to 34 minutes (3,422 commuters, 18.0%), 20 to 24 minutes (3,046 commuters, 16.0%), and 15 to 19 minutes (3,013 commuters, 15.8%).
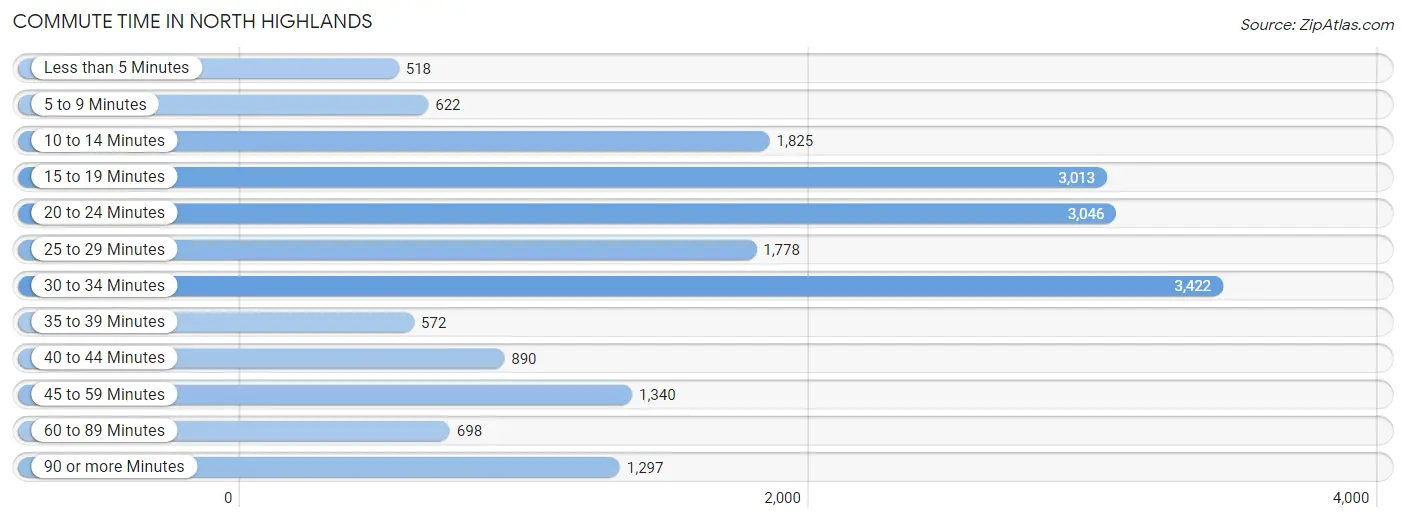
| Commute Time | # Commuters | % Commuters |
| Less than 5 Minutes | 518 | 2.7% |
| 5 to 9 Minutes | 622 | 3.3% |
| 10 to 14 Minutes | 1,825 | 9.6% |
| 15 to 19 Minutes | 3,013 | 15.8% |
| 20 to 24 Minutes | 3,046 | 16.0% |
| 25 to 29 Minutes | 1,778 | 9.3% |
| 30 to 34 Minutes | 3,422 | 18.0% |
| 35 to 39 Minutes | 572 | 3.0% |
| 40 to 44 Minutes | 890 | 4.7% |
| 45 to 59 Minutes | 1,340 | 7.0% |
| 60 to 89 Minutes | 698 | 3.7% |
| 90 or more Minutes | 1,297 | 6.8% |
Commute Time by Sex in North Highlands
The most common commute times in North Highlands are 30 to 34 minutes (2,097 commuters, 19.5%) for males and 15 to 19 minutes (1,494 commuters, 18.0%) for females.
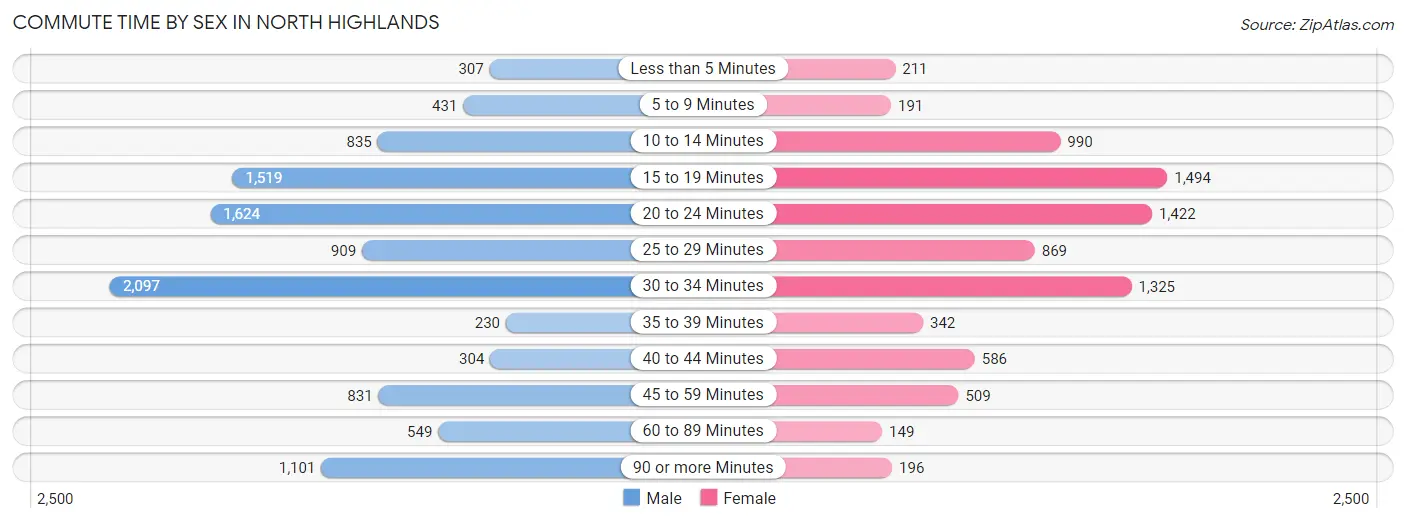
| Commute Time | Male | Female |
| Less than 5 Minutes | 307 (2.9%) | 211 (2.5%) |
| 5 to 9 Minutes | 431 (4.0%) | 191 (2.3%) |
| 10 to 14 Minutes | 835 (7.8%) | 990 (11.9%) |
| 15 to 19 Minutes | 1,519 (14.1%) | 1,494 (18.0%) |
| 20 to 24 Minutes | 1,624 (15.1%) | 1,422 (17.2%) |
| 25 to 29 Minutes | 909 (8.5%) | 869 (10.5%) |
| 30 to 34 Minutes | 2,097 (19.5%) | 1,325 (16.0%) |
| 35 to 39 Minutes | 230 (2.1%) | 342 (4.1%) |
| 40 to 44 Minutes | 304 (2.8%) | 586 (7.1%) |
| 45 to 59 Minutes | 831 (7.7%) | 509 (6.1%) |
| 60 to 89 Minutes | 549 (5.1%) | 149 (1.8%) |
| 90 or more Minutes | 1,101 (10.2%) | 196 (2.4%) |
Time of Departure to Work by Sex in North Highlands
The most frequent times of departure to work in North Highlands are 6:00 AM to 6:29 AM (1,630, 15.2%) for males and 8:00 AM to 8:29 AM (1,189, 14.3%) for females.
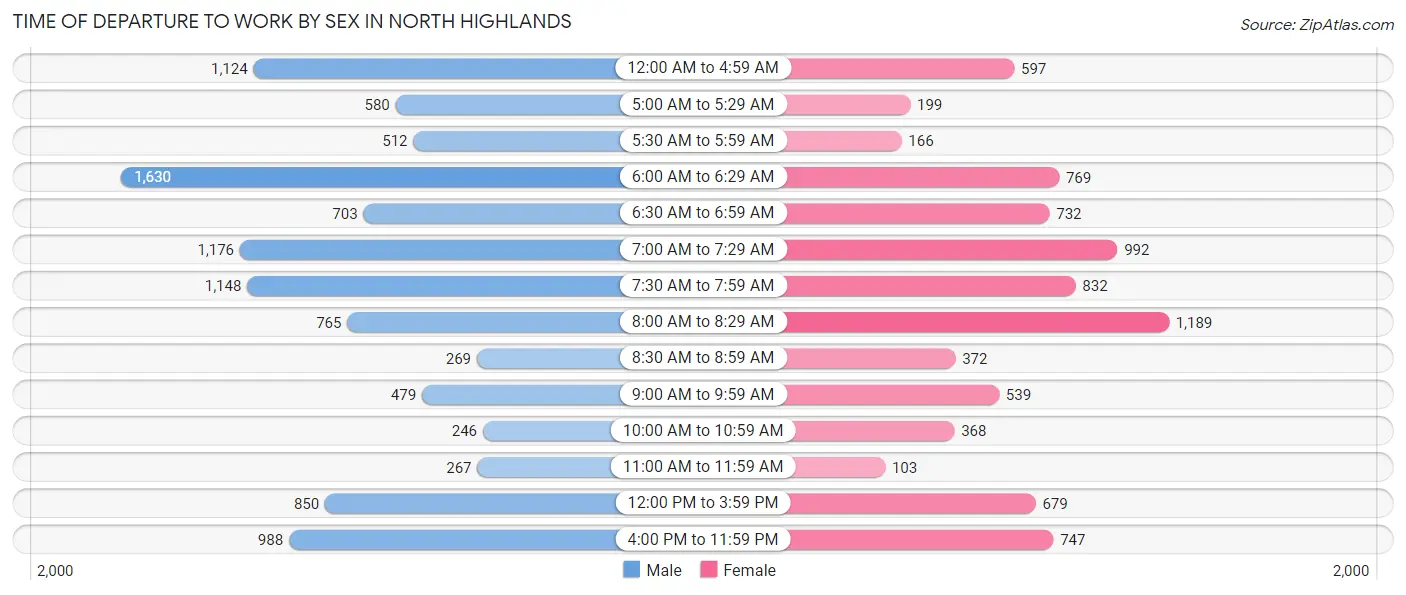
| Time of Departure | Male | Female |
| 12:00 AM to 4:59 AM | 1,124 (10.5%) | 597 (7.2%) |
| 5:00 AM to 5:29 AM | 580 (5.4%) | 199 (2.4%) |
| 5:30 AM to 5:59 AM | 512 (4.8%) | 166 (2.0%) |
| 6:00 AM to 6:29 AM | 1,630 (15.2%) | 769 (9.3%) |
| 6:30 AM to 6:59 AM | 703 (6.6%) | 732 (8.8%) |
| 7:00 AM to 7:29 AM | 1,176 (11.0%) | 992 (12.0%) |
| 7:30 AM to 7:59 AM | 1,148 (10.7%) | 832 (10.0%) |
| 8:00 AM to 8:29 AM | 765 (7.1%) | 1,189 (14.3%) |
| 8:30 AM to 8:59 AM | 269 (2.5%) | 372 (4.5%) |
| 9:00 AM to 9:59 AM | 479 (4.5%) | 539 (6.5%) |
| 10:00 AM to 10:59 AM | 246 (2.3%) | 368 (4.4%) |
| 11:00 AM to 11:59 AM | 267 (2.5%) | 103 (1.2%) |
| 12:00 PM to 3:59 PM | 850 (7.9%) | 679 (8.2%) |
| 4:00 PM to 11:59 PM | 988 (9.2%) | 747 (9.0%) |
| Total | 10,737 (100.0%) | 8,284 (100.0%) |
Housing Occupancy in North Highlands
Occupancy by Ownership in North Highlands
Of the total 15,910 dwellings in North Highlands, owner-occupied units account for 8,179 (51.4%), while renter-occupied units make up 7,731 (48.6%).
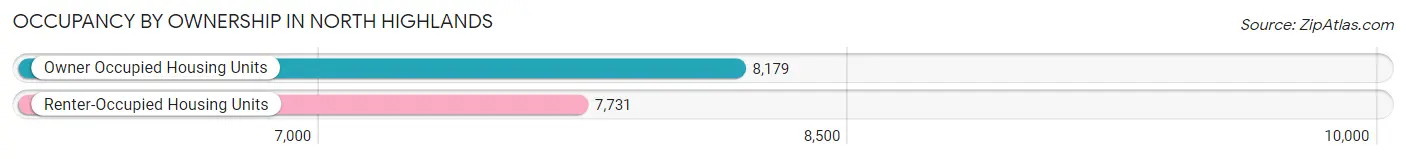
| Occupancy | # Housing Units | % Housing Units |
| Owner Occupied Housing Units | 8,179 | 51.4% |
| Renter-Occupied Housing Units | 7,731 | 48.6% |
| Total Occupied Housing Units | 15,910 | 100.0% |
Occupancy by Household Size in North Highlands
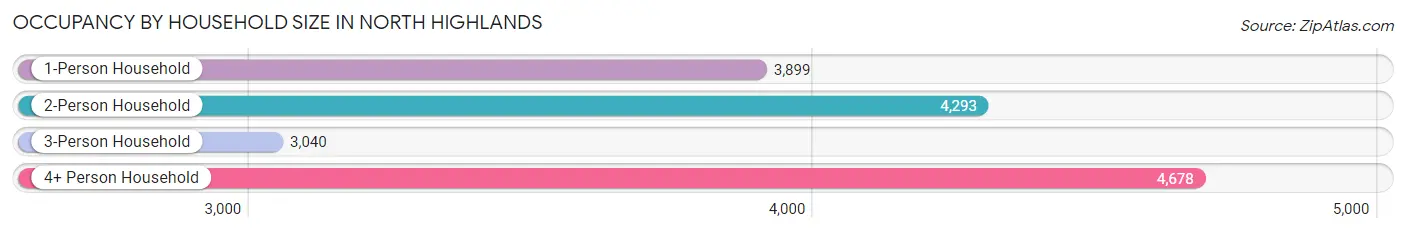
| Household Size | # Housing Units | % Housing Units |
| 1-Person Household | 3,899 | 24.5% |
| 2-Person Household | 4,293 | 27.0% |
| 3-Person Household | 3,040 | 19.1% |
| 4+ Person Household | 4,678 | 29.4% |
| Total Housing Units | 15,910 | 100.0% |
Occupancy by Ownership by Household Size in North Highlands
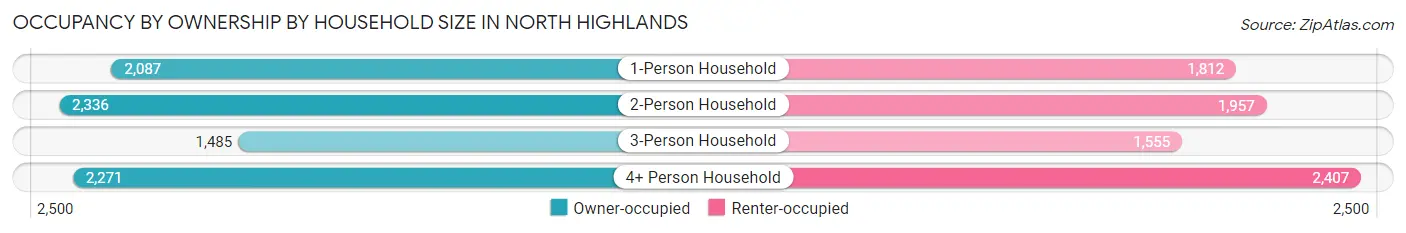
| Household Size | Owner-occupied | Renter-occupied |
| 1-Person Household | 2,087 (53.5%) | 1,812 (46.5%) |
| 2-Person Household | 2,336 (54.4%) | 1,957 (45.6%) |
| 3-Person Household | 1,485 (48.8%) | 1,555 (51.1%) |
| 4+ Person Household | 2,271 (48.5%) | 2,407 (51.4%) |
| Total Housing Units | 8,179 (51.4%) | 7,731 (48.6%) |
Occupancy by Educational Attainment in North Highlands
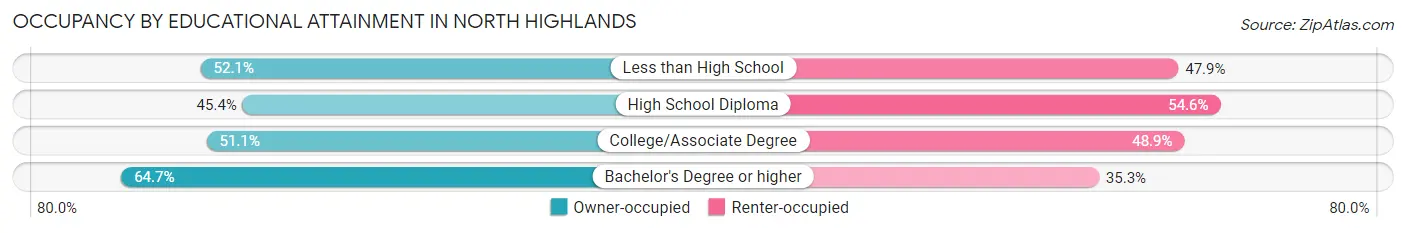
| Household Size | Owner-occupied | Renter-occupied |
| Less than High School | 988 (52.1%) | 909 (47.9%) |
| High School Diploma | 2,177 (45.4%) | 2,617 (54.6%) |
| College/Associate Degree | 3,581 (51.1%) | 3,422 (48.9%) |
| Bachelor's Degree or higher | 1,433 (64.7%) | 783 (35.3%) |
Occupancy by Age of Householder in North Highlands
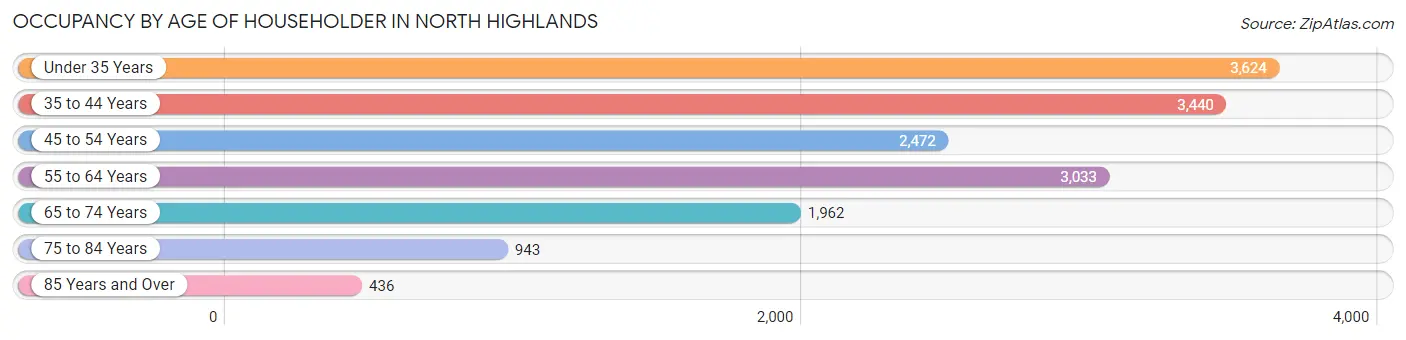
| Age Bracket | # Households | % Households |
| Under 35 Years | 3,624 | 22.8% |
| 35 to 44 Years | 3,440 | 21.6% |
| 45 to 54 Years | 2,472 | 15.5% |
| 55 to 64 Years | 3,033 | 19.1% |
| 65 to 74 Years | 1,962 | 12.3% |
| 75 to 84 Years | 943 | 5.9% |
| 85 Years and Over | 436 | 2.7% |
| Total | 15,910 | 100.0% |
Housing Finances in North Highlands
Median Income by Occupancy in North Highlands
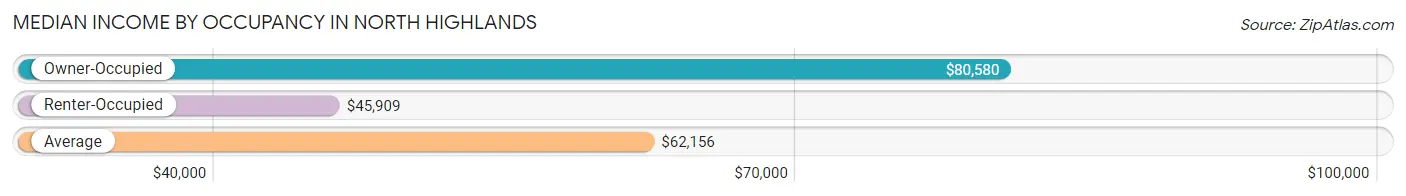
| Occupancy Type | # Households | Median Income |
| Owner-Occupied | 8,179 (51.4%) | $80,580 |
| Renter-Occupied | 7,731 (48.6%) | $45,909 |
| Average | 15,910 (100.0%) | $62,156 |
Occupancy by Householder Income Bracket in North Highlands
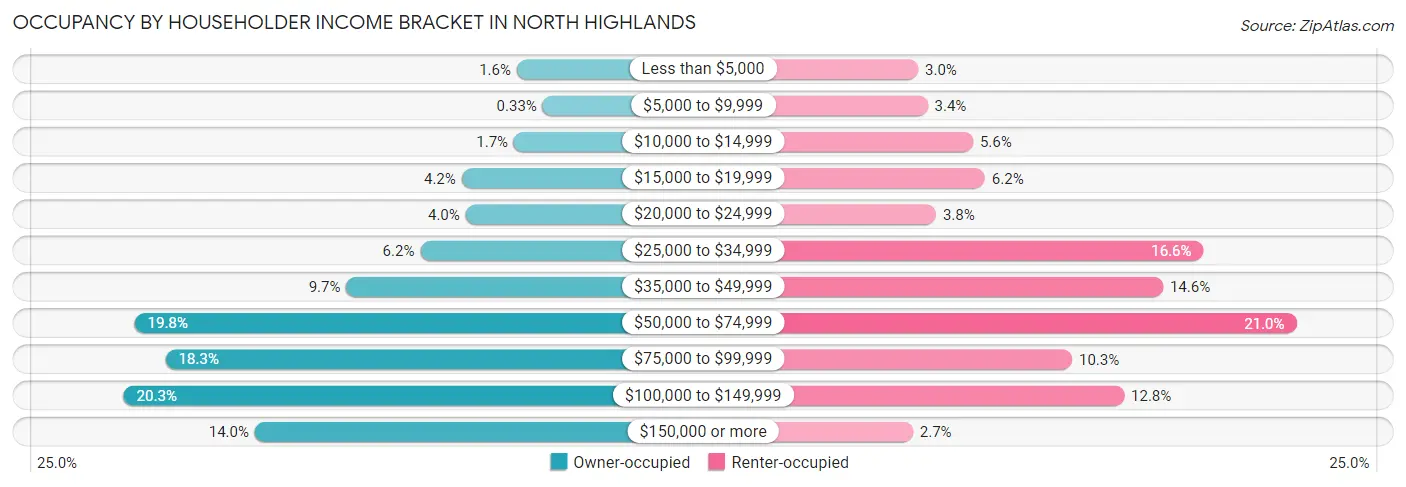
| Income Bracket | Owner-occupied | Renter-occupied |
| Less than $5,000 | 128 (1.6%) | 230 (3.0%) |
| $5,000 to $9,999 | 27 (0.3%) | 265 (3.4%) |
| $10,000 to $14,999 | 139 (1.7%) | 432 (5.6%) |
| $15,000 to $19,999 | 343 (4.2%) | 476 (6.2%) |
| $20,000 to $24,999 | 327 (4.0%) | 296 (3.8%) |
| $25,000 to $34,999 | 504 (6.2%) | 1,280 (16.6%) |
| $35,000 to $49,999 | 792 (9.7%) | 1,132 (14.6%) |
| $50,000 to $74,999 | 1,616 (19.8%) | 1,623 (21.0%) |
| $75,000 to $99,999 | 1,496 (18.3%) | 797 (10.3%) |
| $100,000 to $149,999 | 1,659 (20.3%) | 989 (12.8%) |
| $150,000 or more | 1,148 (14.0%) | 211 (2.7%) |
| Total | 8,179 (100.0%) | 7,731 (100.0%) |
Monthly Housing Cost Tiers in North Highlands
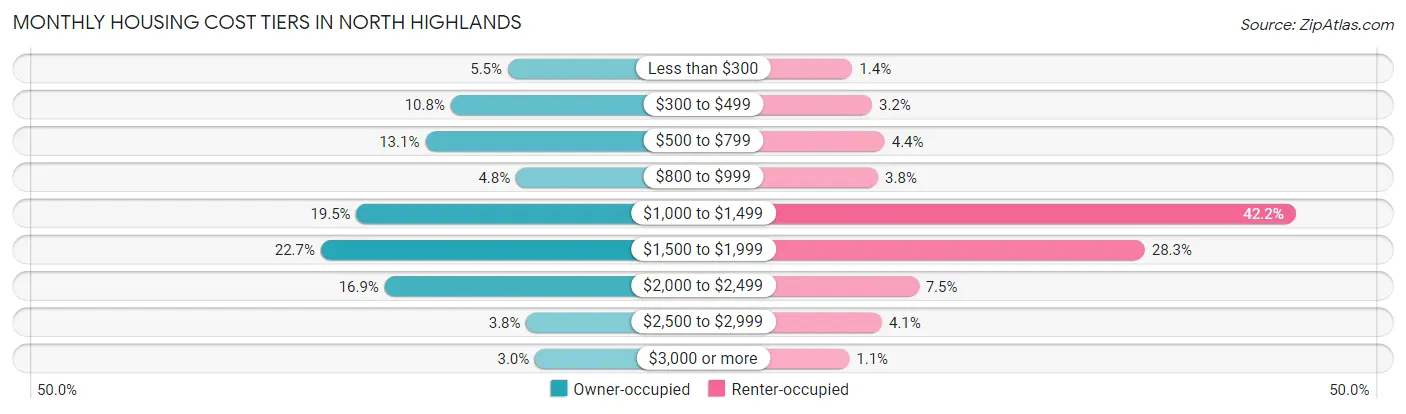
| Monthly Cost | Owner-occupied | Renter-occupied |
| Less than $300 | 451 (5.5%) | 107 (1.4%) |
| $300 to $499 | 881 (10.8%) | 247 (3.2%) |
| $500 to $799 | 1,073 (13.1%) | 337 (4.4%) |
| $800 to $999 | 389 (4.8%) | 290 (3.7%) |
| $1,000 to $1,499 | 1,591 (19.5%) | 3,260 (42.2%) |
| $1,500 to $1,999 | 1,859 (22.7%) | 2,188 (28.3%) |
| $2,000 to $2,499 | 1,378 (16.9%) | 578 (7.5%) |
| $2,500 to $2,999 | 312 (3.8%) | 318 (4.1%) |
| $3,000 or more | 245 (3.0%) | 85 (1.1%) |
| Total | 8,179 (100.0%) | 7,731 (100.0%) |
Physical Housing Characteristics in North Highlands
Housing Structures in North Highlands
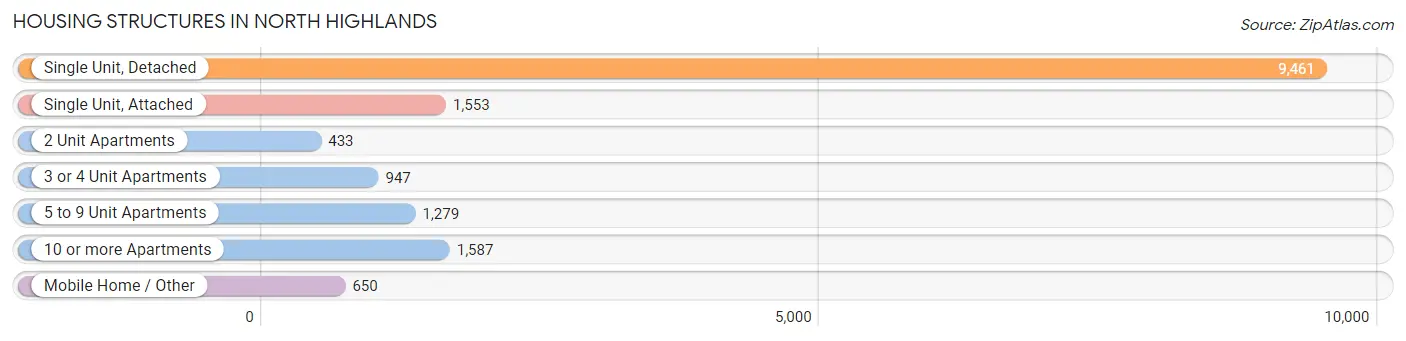
| Structure Type | # Housing Units | % Housing Units |
| Single Unit, Detached | 9,461 | 59.5% |
| Single Unit, Attached | 1,553 | 9.8% |
| 2 Unit Apartments | 433 | 2.7% |
| 3 or 4 Unit Apartments | 947 | 5.9% |
| 5 to 9 Unit Apartments | 1,279 | 8.0% |
| 10 or more Apartments | 1,587 | 10.0% |
| Mobile Home / Other | 650 | 4.1% |
| Total | 15,910 | 100.0% |
Housing Structures by Occupancy in North Highlands
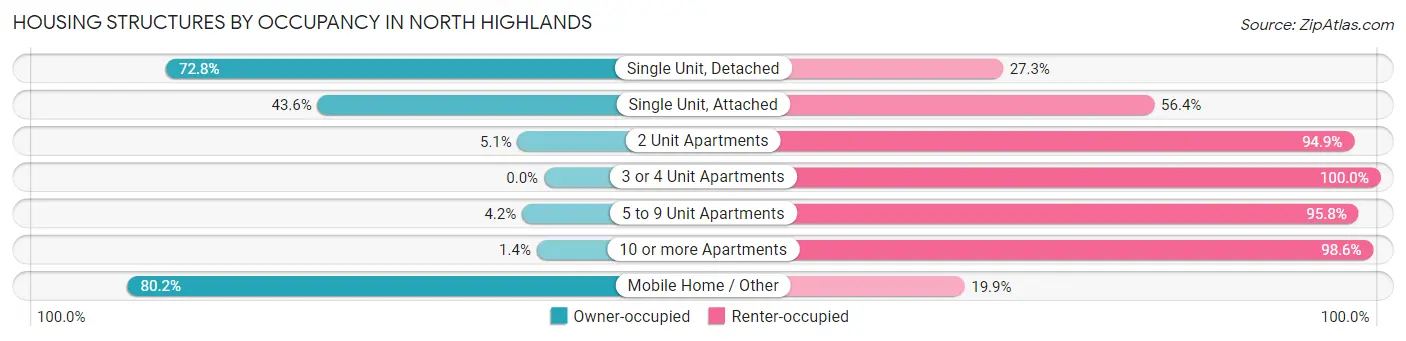
| Structure Type | Owner-occupied | Renter-occupied |
| Single Unit, Detached | 6,883 (72.8%) | 2,578 (27.3%) |
| Single Unit, Attached | 677 (43.6%) | 876 (56.4%) |
| 2 Unit Apartments | 22 (5.1%) | 411 (94.9%) |
| 3 or 4 Unit Apartments | 0 (0.0%) | 947 (100.0%) |
| 5 to 9 Unit Apartments | 54 (4.2%) | 1,225 (95.8%) |
| 10 or more Apartments | 22 (1.4%) | 1,565 (98.6%) |
| Mobile Home / Other | 521 (80.1%) | 129 (19.9%) |
| Total | 8,179 (51.4%) | 7,731 (48.6%) |
Housing Structures by Number of Rooms in North Highlands
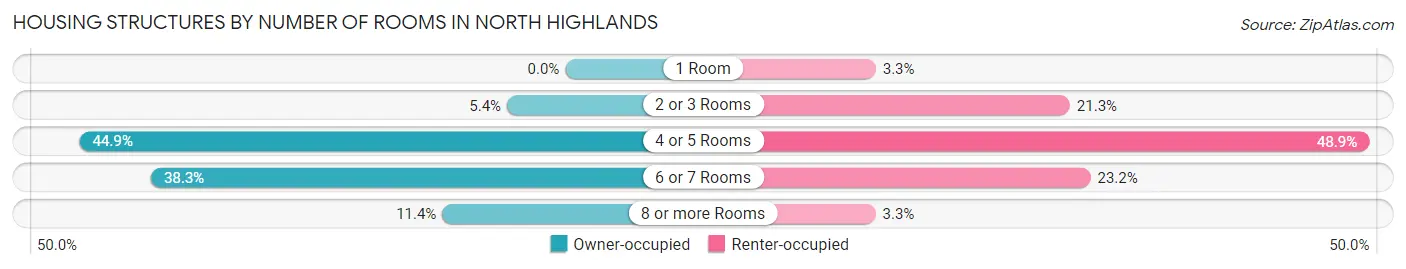
| Number of Rooms | Owner-occupied | Renter-occupied |
| 1 Room | 0 (0.0%) | 257 (3.3%) |
| 2 or 3 Rooms | 441 (5.4%) | 1,644 (21.3%) |
| 4 or 5 Rooms | 3,674 (44.9%) | 3,783 (48.9%) |
| 6 or 7 Rooms | 3,133 (38.3%) | 1,792 (23.2%) |
| 8 or more Rooms | 931 (11.4%) | 255 (3.3%) |
| Total | 8,179 (100.0%) | 7,731 (100.0%) |
Housing Structure by Heating Type in North Highlands
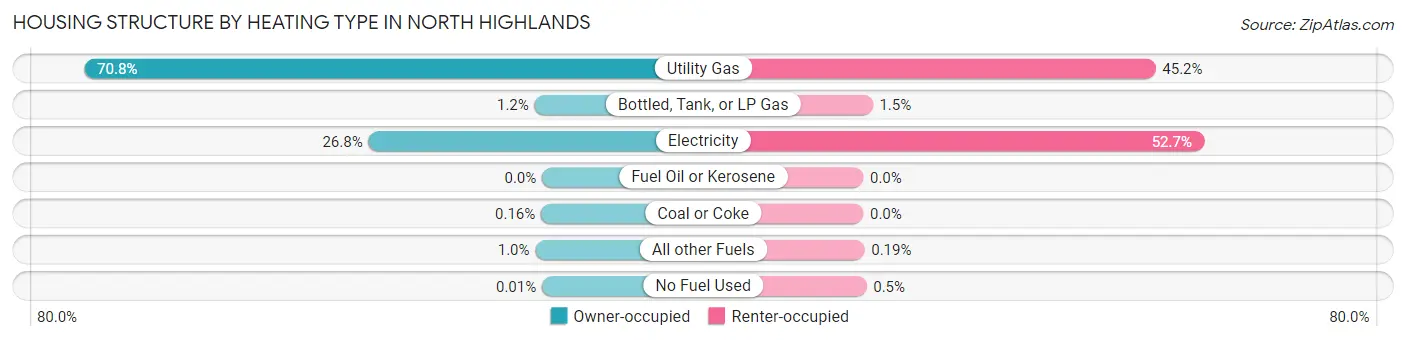
| Heating Type | Owner-occupied | Renter-occupied |
| Utility Gas | 5,790 (70.8%) | 3,494 (45.2%) |
| Bottled, Tank, or LP Gas | 95 (1.2%) | 112 (1.5%) |
| Electricity | 2,195 (26.8%) | 4,071 (52.7%) |
| Fuel Oil or Kerosene | 0 (0.0%) | 0 (0.0%) |
| Coal or Coke | 13 (0.2%) | 0 (0.0%) |
| All other Fuels | 85 (1.0%) | 15 (0.2%) |
| No Fuel Used | 1 (0.0%) | 39 (0.5%) |
| Total | 8,179 (100.0%) | 7,731 (100.0%) |
Household Vehicle Usage in North Highlands
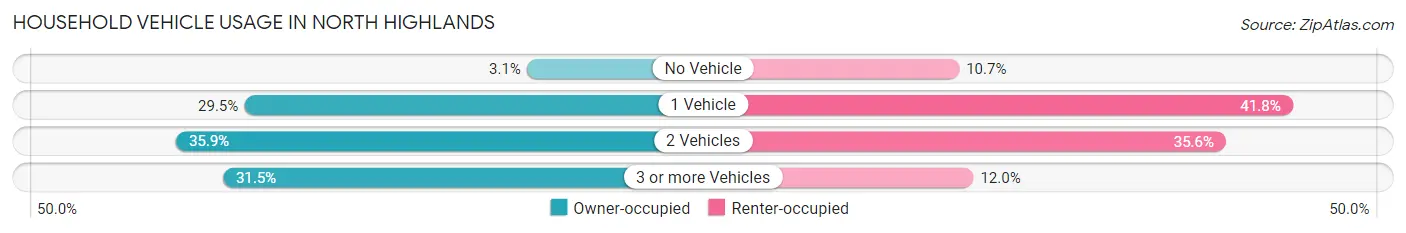
| Vehicles per Household | Owner-occupied | Renter-occupied |
| No Vehicle | 256 (3.1%) | 825 (10.7%) |
| 1 Vehicle | 2,414 (29.5%) | 3,230 (41.8%) |
| 2 Vehicles | 2,934 (35.9%) | 2,748 (35.5%) |
| 3 or more Vehicles | 2,575 (31.5%) | 928 (12.0%) |
| Total | 8,179 (100.0%) | 7,731 (100.0%) |
Real Estate & Mortgages in North Highlands
Real Estate and Mortgage Overview in North Highlands
| Characteristic | Without Mortgage | With Mortgage |
| Housing Units | 2,455 | 5,724 |
| Median Property Value | $270,500 | $333,100 |
| Median Household Income | $51,934 | $935 |
| Monthly Housing Costs | $500 | $245 |
| Real Estate Taxes | $1,398 | $251 |
Property Value by Mortgage Status in North Highlands
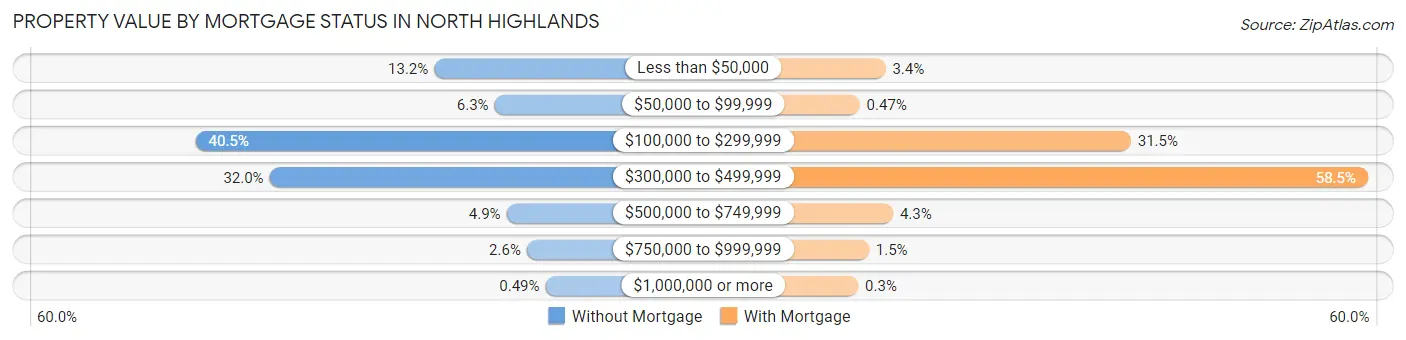
| Property Value | Without Mortgage | With Mortgage |
| Less than $50,000 | 324 (13.2%) | 196 (3.4%) |
| $50,000 to $99,999 | 155 (6.3%) | 27 (0.5%) |
| $100,000 to $299,999 | 993 (40.5%) | 1,801 (31.5%) |
| $300,000 to $499,999 | 786 (32.0%) | 3,351 (58.5%) |
| $500,000 to $749,999 | 121 (4.9%) | 245 (4.3%) |
| $750,000 to $999,999 | 64 (2.6%) | 87 (1.5%) |
| $1,000,000 or more | 12 (0.5%) | 17 (0.3%) |
| Total | 2,455 (100.0%) | 5,724 (100.0%) |
Household Income by Mortgage Status in North Highlands
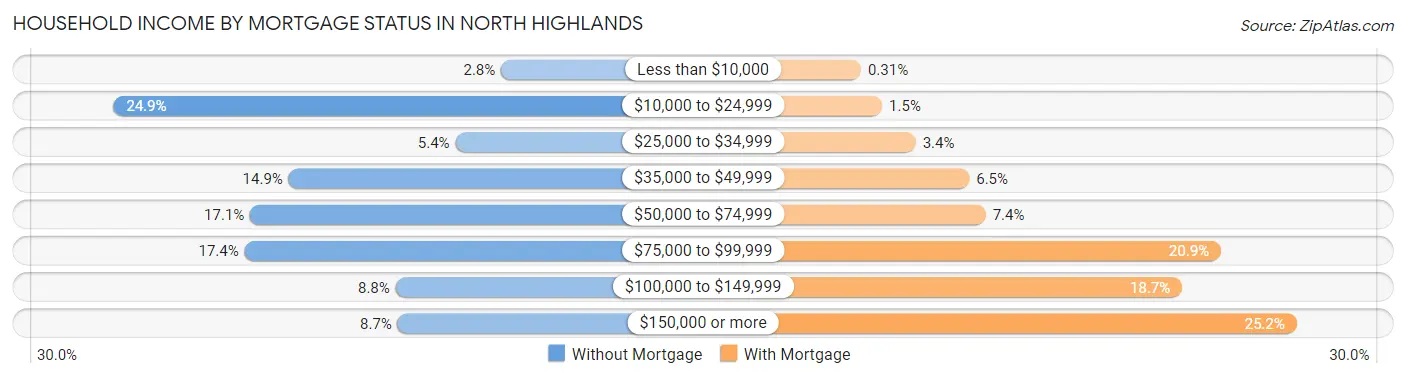
| Household Income | Without Mortgage | With Mortgage |
| Less than $10,000 | 68 (2.8%) | 18 (0.3%) |
| $10,000 to $24,999 | 612 (24.9%) | 87 (1.5%) |
| $25,000 to $34,999 | 132 (5.4%) | 197 (3.4%) |
| $35,000 to $49,999 | 366 (14.9%) | 372 (6.5%) |
| $50,000 to $74,999 | 420 (17.1%) | 426 (7.4%) |
| $75,000 to $99,999 | 428 (17.4%) | 1,196 (20.9%) |
| $100,000 to $149,999 | 216 (8.8%) | 1,068 (18.7%) |
| $150,000 or more | 213 (8.7%) | 1,443 (25.2%) |
| Total | 2,455 (100.0%) | 5,724 (100.0%) |
Property Value to Household Income Ratio in North Highlands
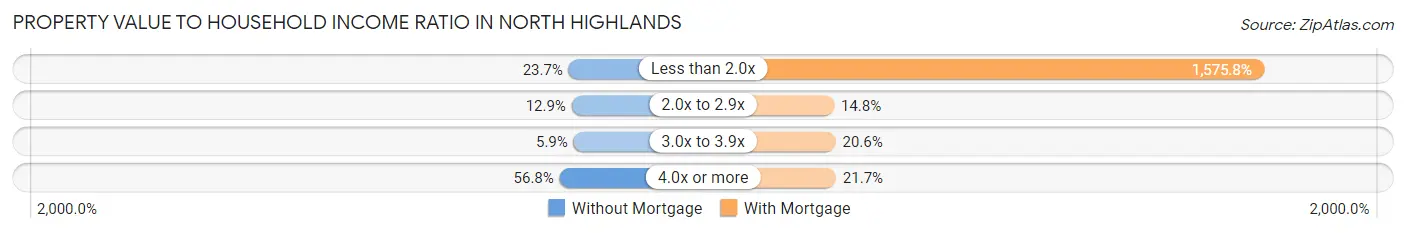
| Value-to-Income Ratio | Without Mortgage | With Mortgage |
| Less than 2.0x | 581 (23.7%) | 90,197 (1,575.8%) |
| 2.0x to 2.9x | 316 (12.9%) | 845 (14.8%) |
| 3.0x to 3.9x | 144 (5.9%) | 1,177 (20.6%) |
| 4.0x or more | 1,394 (56.8%) | 1,244 (21.7%) |
| Total | 2,455 (100.0%) | 5,724 (100.0%) |
Real Estate Taxes by Mortgage Status in North Highlands
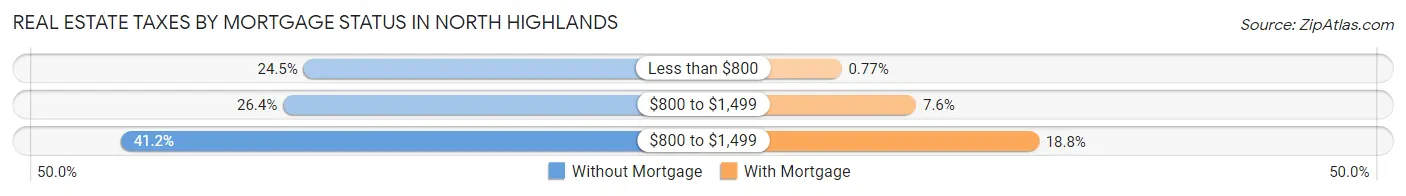
| Property Taxes | Without Mortgage | With Mortgage |
| Less than $800 | 602 (24.5%) | 44 (0.8%) |
| $800 to $1,499 | 648 (26.4%) | 434 (7.6%) |
| $800 to $1,499 | 1,012 (41.2%) | 1,075 (18.8%) |
| Total | 2,455 (100.0%) | 5,724 (100.0%) |
Health & Disability in North Highlands
Health Insurance Coverage by Age in North Highlands
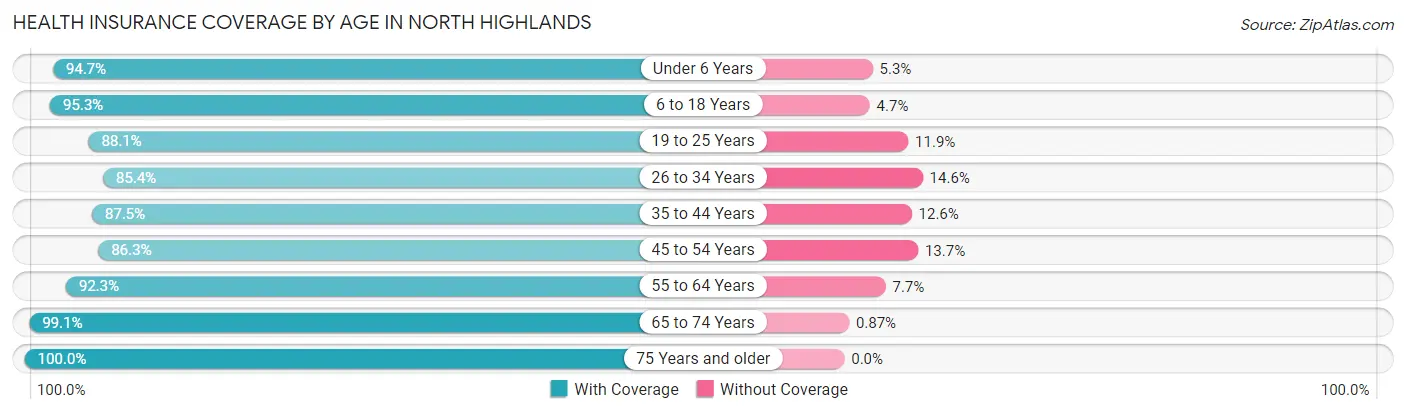
| Age Bracket | With Coverage | Without Coverage |
| Under 6 Years | 4,344 (94.7%) | 242 (5.3%) |
| 6 to 18 Years | 7,980 (95.3%) | 396 (4.7%) |
| 19 to 25 Years | 4,668 (88.1%) | 631 (11.9%) |
| 26 to 34 Years | 5,648 (85.4%) | 966 (14.6%) |
| 35 to 44 Years | 5,649 (87.5%) | 811 (12.6%) |
| 45 to 54 Years | 4,431 (86.3%) | 706 (13.7%) |
| 55 to 64 Years | 5,462 (92.3%) | 455 (7.7%) |
| 65 to 74 Years | 3,309 (99.1%) | 29 (0.9%) |
| 75 Years and older | 2,121 (100.0%) | 0 (0.0%) |
| Total | 43,612 (91.1%) | 4,236 (8.8%) |
Health Insurance Coverage by Citizenship Status in North Highlands
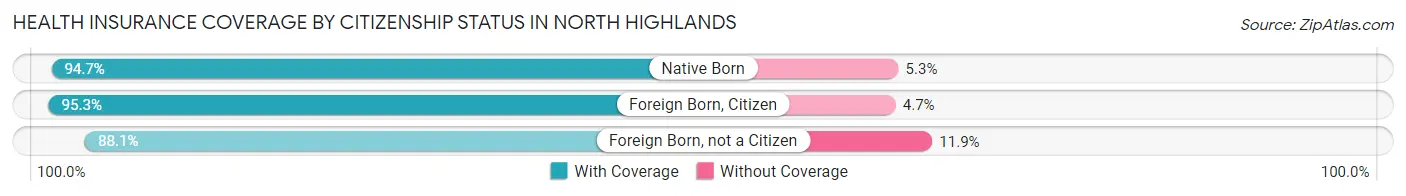
| Citizenship Status | With Coverage | Without Coverage |
| Native Born | 4,344 (94.7%) | 242 (5.3%) |
| Foreign Born, Citizen | 7,980 (95.3%) | 396 (4.7%) |
| Foreign Born, not a Citizen | 4,668 (88.1%) | 631 (11.9%) |
Health Insurance Coverage by Household Income in North Highlands
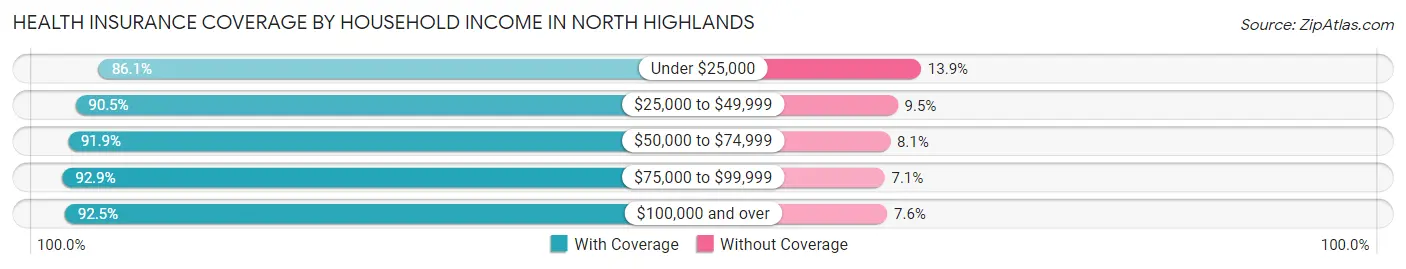
| Household Income | With Coverage | Without Coverage |
| Under $25,000 | 5,811 (86.1%) | 937 (13.9%) |
| $25,000 to $49,999 | 8,646 (90.5%) | 910 (9.5%) |
| $50,000 to $74,999 | 9,179 (91.9%) | 807 (8.1%) |
| $75,000 to $99,999 | 5,950 (92.9%) | 453 (7.1%) |
| $100,000 and over | 13,827 (92.4%) | 1,129 (7.5%) |
Public vs Private Health Insurance Coverage by Age in North Highlands
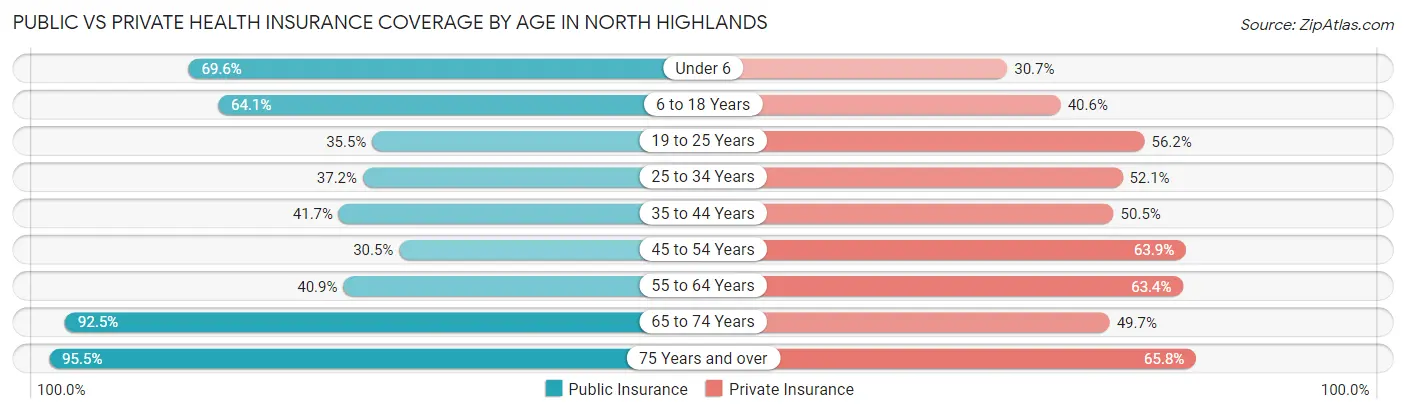
| Age Bracket | Public Insurance | Private Insurance |
| Under 6 | 3,191 (69.6%) | 1,409 (30.7%) |
| 6 to 18 Years | 5,368 (64.1%) | 3,404 (40.6%) |
| 19 to 25 Years | 1,880 (35.5%) | 2,978 (56.2%) |
| 25 to 34 Years | 2,461 (37.2%) | 3,445 (52.1%) |
| 35 to 44 Years | 2,692 (41.7%) | 3,260 (50.5%) |
| 45 to 54 Years | 1,565 (30.5%) | 3,282 (63.9%) |
| 55 to 64 Years | 2,417 (40.8%) | 3,750 (63.4%) |
| 65 to 74 Years | 3,088 (92.5%) | 1,660 (49.7%) |
| 75 Years and over | 2,025 (95.5%) | 1,395 (65.8%) |
| Total | 24,687 (51.6%) | 24,583 (51.4%) |
Disability Status by Sex by Age in North Highlands
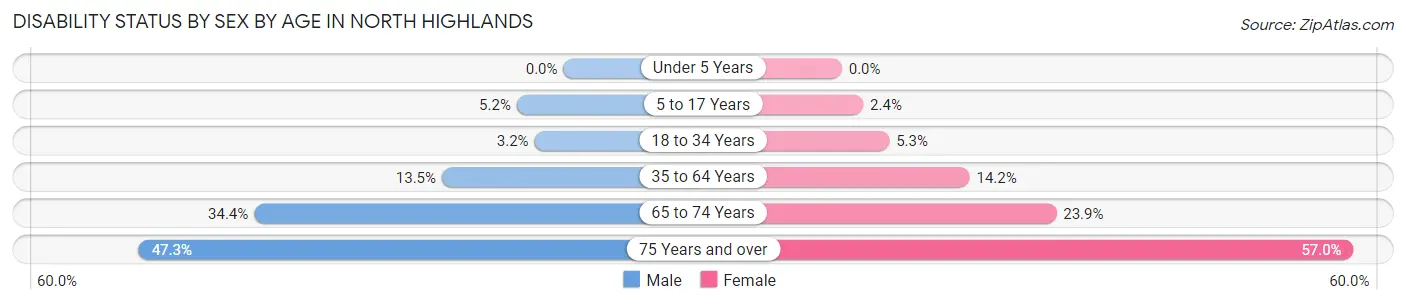
| Age Bracket | Male | Female |
| Under 5 Years | 0 (0.0%) | 0 (0.0%) |
| 5 to 17 Years | 235 (5.2%) | 97 (2.4%) |
| 18 to 34 Years | 202 (3.2%) | 321 (5.3%) |
| 35 to 64 Years | 1,176 (13.5%) | 1,256 (14.2%) |
| 65 to 74 Years | 593 (34.4%) | 386 (23.9%) |
| 75 Years and over | 437 (47.3%) | 682 (57.0%) |
Disability Class by Sex by Age in North Highlands
Disability Class: Hearing Difficulty
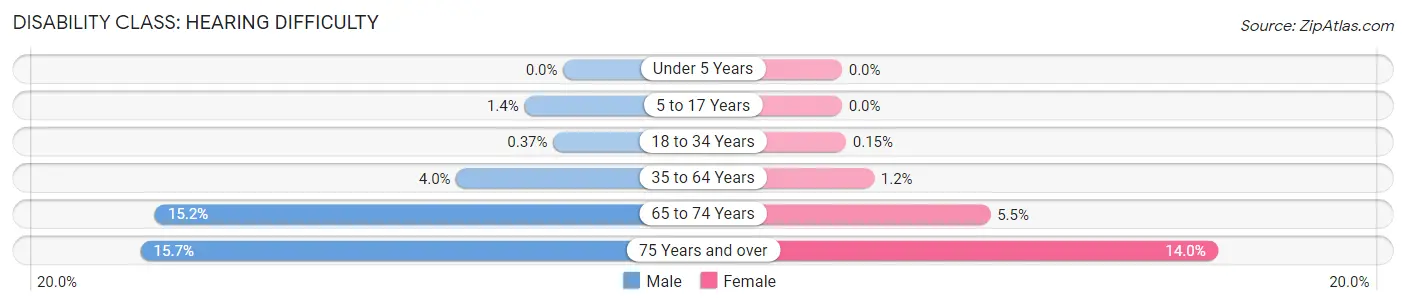
| Age Bracket | Male | Female |
| Under 5 Years | 0 (0.0%) | 0 (0.0%) |
| 5 to 17 Years | 65 (1.4%) | 0 (0.0%) |
| 18 to 34 Years | 23 (0.4%) | 9 (0.2%) |
| 35 to 64 Years | 345 (4.0%) | 105 (1.2%) |
| 65 to 74 Years | 261 (15.2%) | 89 (5.5%) |
| 75 Years and over | 145 (15.7%) | 167 (14.0%) |
Disability Class: Vision Difficulty
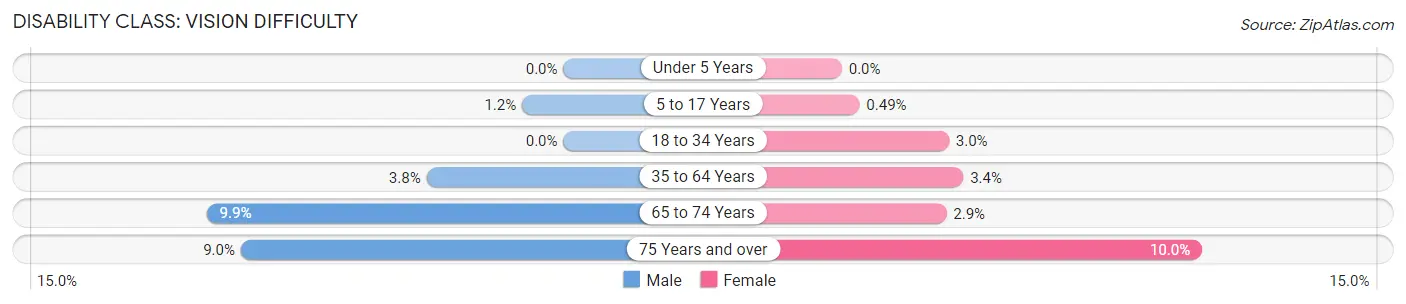
| Age Bracket | Male | Female |
| Under 5 Years | 0 (0.0%) | 0 (0.0%) |
| 5 to 17 Years | 52 (1.1%) | 20 (0.5%) |
| 18 to 34 Years | 0 (0.0%) | 181 (3.0%) |
| 35 to 64 Years | 331 (3.8%) | 298 (3.4%) |
| 65 to 74 Years | 171 (9.9%) | 47 (2.9%) |
| 75 Years and over | 83 (9.0%) | 120 (10.0%) |
Disability Class: Cognitive Difficulty
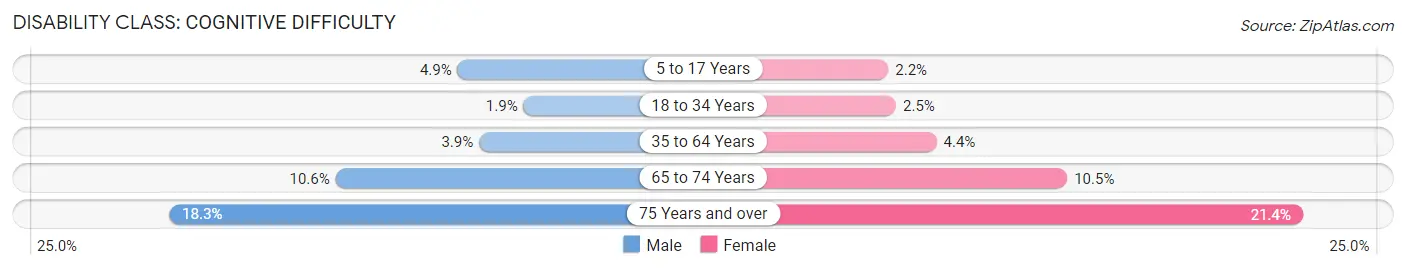
| Age Bracket | Male | Female |
| 5 to 17 Years | 222 (4.9%) | 88 (2.2%) |
| 18 to 34 Years | 116 (1.8%) | 153 (2.5%) |
| 35 to 64 Years | 340 (3.9%) | 388 (4.4%) |
| 65 to 74 Years | 182 (10.6%) | 169 (10.5%) |
| 75 Years and over | 169 (18.3%) | 256 (21.4%) |
Disability Class: Ambulatory Difficulty
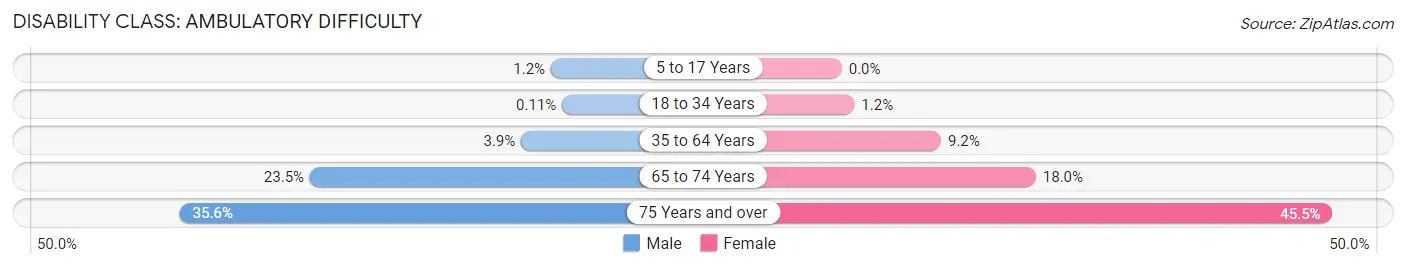
| Age Bracket | Male | Female |
| 5 to 17 Years | 52 (1.1%) | 0 (0.0%) |
| 18 to 34 Years | 7 (0.1%) | 71 (1.2%) |
| 35 to 64 Years | 341 (3.9%) | 813 (9.2%) |
| 65 to 74 Years | 405 (23.5%) | 291 (18.0%) |
| 75 Years and over | 329 (35.6%) | 545 (45.5%) |
Disability Class: Self-Care Difficulty
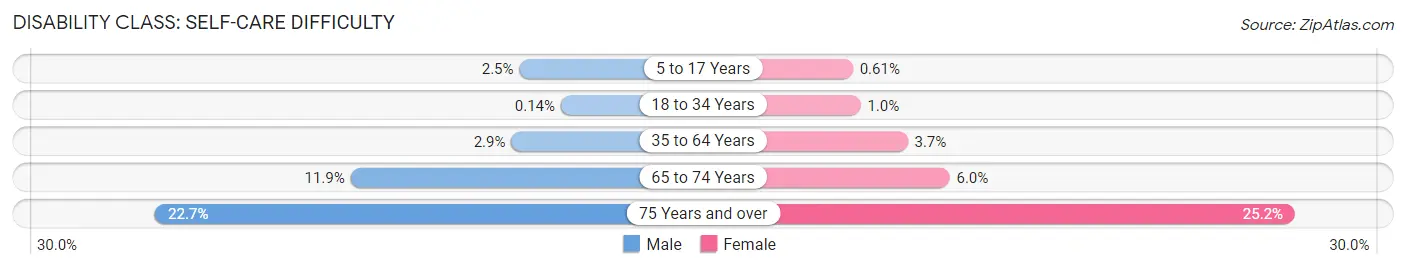
| Age Bracket | Male | Female |
| 5 to 17 Years | 111 (2.5%) | 25 (0.6%) |
| 18 to 34 Years | 9 (0.1%) | 63 (1.0%) |
| 35 to 64 Years | 252 (2.9%) | 323 (3.7%) |
| 65 to 74 Years | 204 (11.8%) | 97 (6.0%) |
| 75 Years and over | 210 (22.7%) | 302 (25.2%) |
Technology Access in North Highlands
Computing Device Access in North Highlands
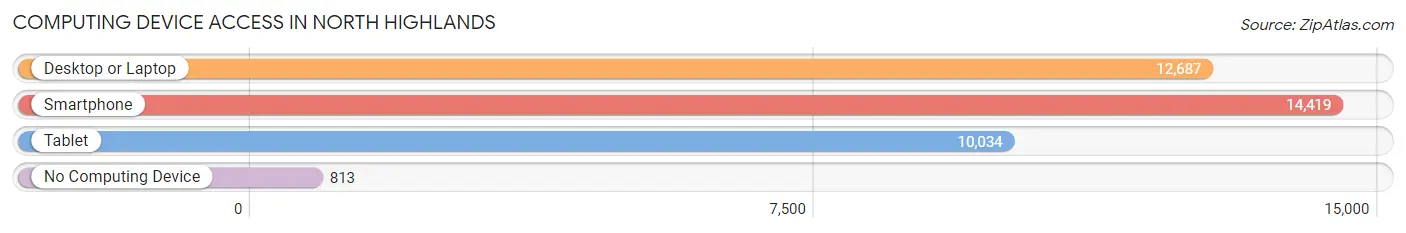
| Device Type | # Households | % Households |
| Desktop or Laptop | 12,687 | 79.7% |
| Smartphone | 14,419 | 90.6% |
| Tablet | 10,034 | 63.1% |
| No Computing Device | 813 | 5.1% |
| Total | 15,910 | 100.0% |
Internet Access in North Highlands
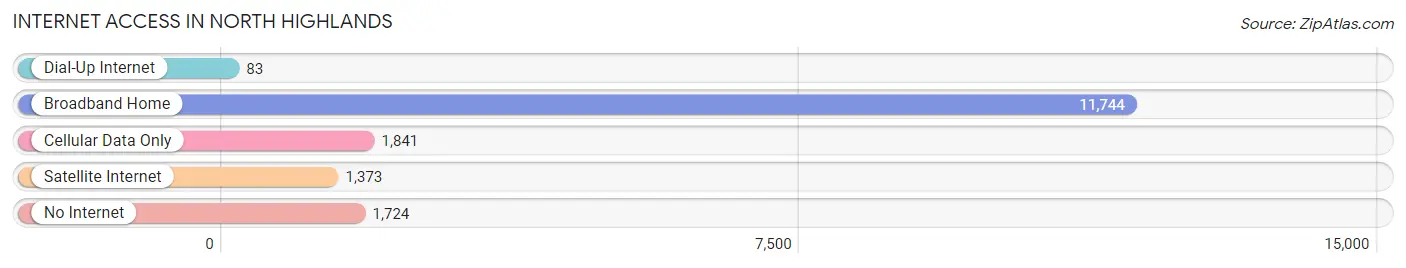
| Internet Type | # Households | % Households |
| Dial-Up Internet | 83 | 0.5% |
| Broadband Home | 11,744 | 73.8% |
| Cellular Data Only | 1,841 | 11.6% |
| Satellite Internet | 1,373 | 8.6% |
| No Internet | 1,724 | 10.8% |
| Total | 15,910 | 100.0% |
North Highlands Summary
Highlands, California is a census-designated place located in Sacramento County, California. It is part of the Sacramento–Arden-Arcade–Roseville Metropolitan Statistical Area. The population was 42,694 at the 2010 census.
History
Highlands, California was originally inhabited by the Maidu Indians. The area was first settled by Europeans in the mid-1800s. The first post office was established in 1876. The town was named after the high elevation of the area.
Geography
Highlands, California is located at 38°40'25"N 121°20'17"W (38.673611, -121.338333). It is situated at an elevation of approximately 200 feet (61 m). The area is located in the Sacramento Valley, and is bordered by the cities of Citrus Heights, Roseville, and Antelope.
Climate
Highlands, California has a Mediterranean climate, with hot, dry summers and mild, wet winters. The average high temperature in the summer is around 90°F (32°C), and the average low temperature in the winter is around 40°F (4°C).
Demographics
As of the 2010 census, there were 42,694 people, 15,845 households, and 10,845 families residing in Highlands, California. The population density was 3,845.3 people per square mile (1,484.2/km2). The racial makeup of the CDP was 57.2% White, 16.2% African American, 1.2% Native American, 11.2% Asian, 0.5% Pacific Islander, 9.7% from other races, and 4.2% from two or more races. Hispanic or Latino of any race were 22.2% of the population.
Economy
Highlands, California is home to a variety of businesses, including retail stores, restaurants, and professional services. The area is also home to a number of industrial and manufacturing companies. The largest employers in the area are the State of California, the County of Sacramento, and the City of Citrus Heights.
Education
Highlands, California is served by the San Juan Unified School District. The area is home to several elementary schools, middle schools, and high schools. The area is also home to a number of private schools.
Transportation
Highlands, California is served by a number of public transportation options, including bus and light rail. The area is also served by a number of major highways, including Interstate 80, Interstate 5, and Highway 99.
Common Questions
What is Per Capita Income in North Highlands?
Per Capita income in North Highlands is $26,051.
What is the Median Family Income in North Highlands?
Median Family Income in North Highlands is $64,961.
What is the Median Household income in North Highlands?
Median Household Income in North Highlands is $62,156.
What is Income or Wage Gap in North Highlands?
Income or Wage Gap in North Highlands is 24.4%.
Women in North Highlands earn 75.6 cents for every dollar earned by a man.
What is Family Income Deficit in North Highlands?
Family Income Deficit in North Highlands is $12,166.
Families that are below poverty line in North Highlands earn $12,166 less on average than the poverty threshold level.
What is Inequality or Gini Index in North Highlands?
Inequality or Gini Index in North Highlands is 0.41.
What is the Total Population of North Highlands?
Total Population of North Highlands is 48,083.
What is the Total Male Population of North Highlands?
Total Male Population of North Highlands is 24,364.
What is the Total Female Population of North Highlands?
Total Female Population of North Highlands is 23,719.
What is the Ratio of Males per 100 Females in North Highlands?
There are 102.72 Males per 100 Females in North Highlands.
What is the Ratio of Females per 100 Males in North Highlands?
There are 97.35 Females per 100 Males in North Highlands.
What is the Median Population Age in North Highlands?
Median Population Age in North Highlands is 34.0 Years.
What is the Average Family Size in North Highlands
Average Family Size in North Highlands is 3.6 People.
What is the Average Household Size in North Highlands
Average Household Size in North Highlands is 3.0 People.
How Large is the Labor Force in North Highlands?
There are 23,119 People in the Labor Forcein in North Highlands.
What is the Percentage of People in the Labor Force in North Highlands?
62.8% of People are in the Labor Force in North Highlands.
What is the Unemployment Rate in North Highlands?
Unemployment Rate in North Highlands is 5.8%.