Cities with the Highest Percentage of Black / African American Population in Montana
RELATED REPORTS & OPTIONS
Black / African American
Montana
Compare Cities
Map of Cities with the Highest Percentage of Black / African American Population in Montana
0.0%
20.0%
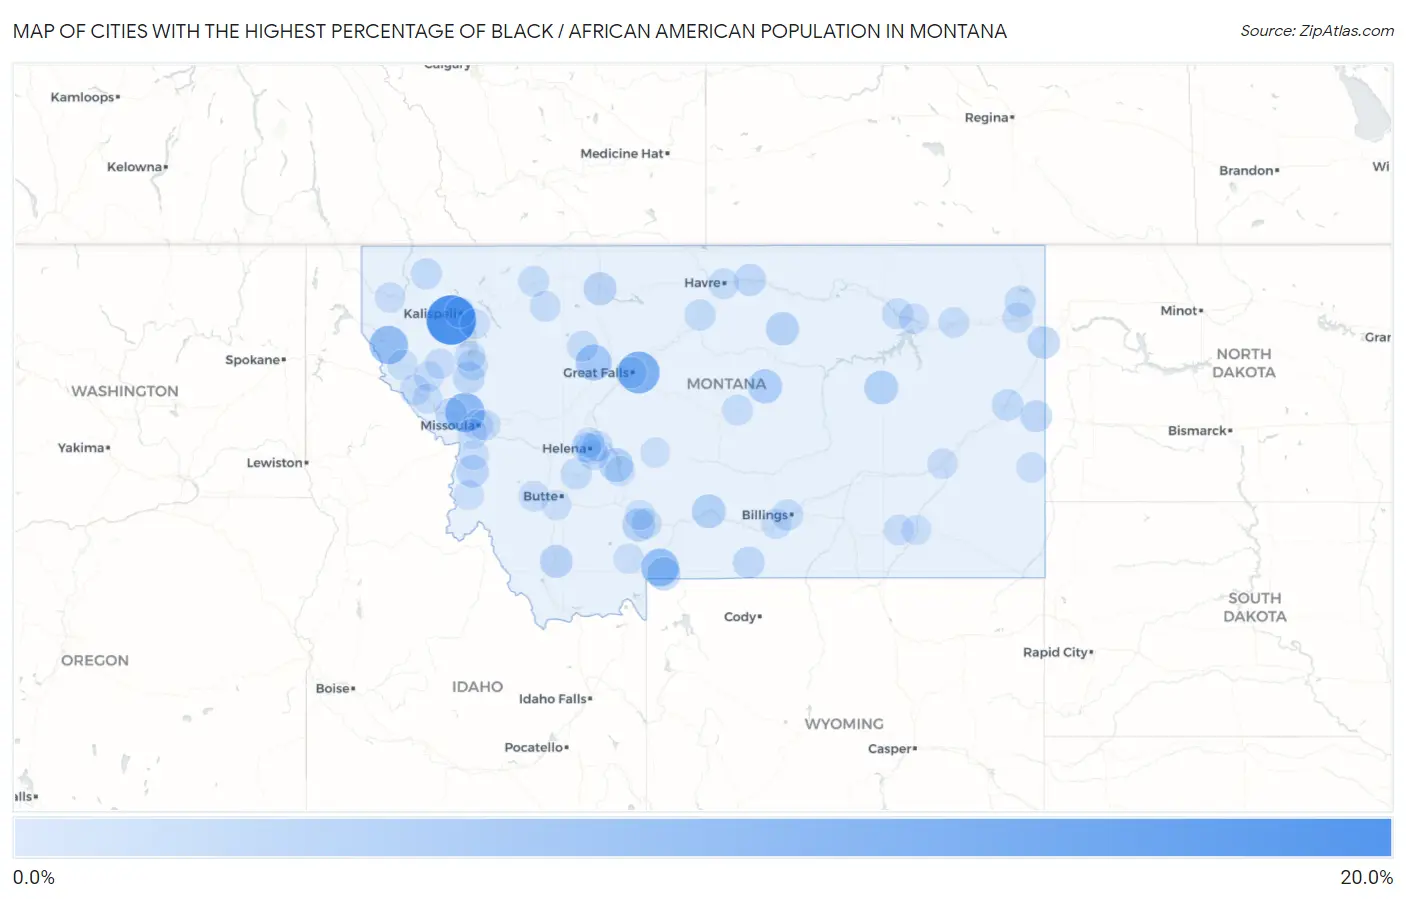
Cities with the Highest Percentage of Black / African American Population in Montana
| City | Black / African American | vs State | vs National | |
| 1. | Kila | 18.6% | 0.55% (+18.1)#1 | 12.5% (+6.17)#3,478 |
| 2. | Malmstrom Afb | 11.0% | 0.55% (+10.5)#2 | 12.5% (-1.44)#5,011 |
| 3. | Frenchtown | 8.7% | 0.55% (+8.17)#3 | 12.5% (-3.74)#5,744 |
| 4. | Trout Creek | 7.7% | 0.55% (+7.17)#4 | 12.5% (-4.75)#6,177 |
| 5. | Corwin Springs | 7.1% | 0.55% (+6.54)#5 | 12.5% (-5.37)#6,457 |
| 6. | Fairfield | 5.5% | 0.55% (+4.98)#6 | 12.5% (-6.94)#7,352 |
| 7. | York | 4.3% | 0.55% (+3.72)#7 | 12.5% (-8.20)#8,314 |
| 8. | Roy | 3.7% | 0.55% (+3.13)#8 | 12.5% (-8.79)#8,879 |
| 9. | The Silos | 3.4% | 0.55% (+2.82)#9 | 12.5% (-9.09)#9,215 |
| 10. | Jordan | 3.4% | 0.55% (+2.81)#10 | 12.5% (-9.11)#9,225 |
| 11. | Big Timber | 3.3% | 0.55% (+2.80)#11 | 12.5% (-9.12)#9,247 |
| 12. | Gardiner | 3.0% | 0.55% (+2.41)#12 | 12.5% (-9.51)#9,745 |
| 13. | Hays | 2.8% | 0.55% (+2.28)#13 | 12.5% (-9.64)#9,908 |
| 14. | Shelby | 2.6% | 0.55% (+2.00)#14 | 12.5% (-9.92)#10,321 |
| 15. | Four Corners | 2.5% | 0.55% (+1.95)#15 | 12.5% (-9.97)#10,385 |
| 16. | Dillon | 2.5% | 0.55% (+1.92)#16 | 12.5% (-9.99)#10,432 |
| 17. | Fairview | 2.2% | 0.55% (+1.70)#17 | 12.5% (-10.2)#10,823 |
| 18. | Corvallis | 2.1% | 0.55% (+1.60)#18 | 12.5% (-10.3)#10,983 |
| 19. | Charlo | 1.7% | 0.55% (+1.13)#19 | 12.5% (-10.8)#11,933 |
| 20. | Chinook | 1.7% | 0.55% (+1.13)#20 | 12.5% (-10.8)#11,953 |
| 21. | Red Lodge | 1.6% | 0.55% (+1.04)#21 | 12.5% (-10.9)#12,179 |
| 22. | Wibaux | 1.6% | 0.55% (+1.01)#22 | 12.5% (-10.9)#12,250 |
| 23. | Alberton | 1.5% | 0.55% (+0.949)#23 | 12.5% (-11.0)#12,416 |
| 24. | Glendive | 1.4% | 0.55% (+0.847)#24 | 12.5% (-11.1)#12,659 |
| 25. | Basin | 1.1% | 0.55% (+0.547)#25 | 12.5% (-11.4)#13,536 |
| 26. | Great Falls | 1.1% | 0.55% (+0.503)#26 | 12.5% (-11.4)#13,687 |
| 27. | Billings | 1.0% | 0.55% (+0.483)#27 | 12.5% (-11.4)#13,766 |
| 28. | Big Sandy | 1.0% | 0.55% (+0.451)#28 | 12.5% (-11.5)#13,877 |
| 29. | Froid | 0.99% | 0.55% (+0.435)#29 | 12.5% (-11.5)#13,927 |
| 30. | Helena | 0.92% | 0.55% (+0.367)#30 | 12.5% (-11.6)#14,159 |
| 31. | Trego | 0.91% | 0.55% (+0.362)#31 | 12.5% (-11.6)#14,179 |
| 32. | Pablo | 0.83% | 0.55% (+0.282)#32 | 12.5% (-11.6)#14,482 |
| 33. | Glasgow | 0.81% | 0.55% (+0.259)#33 | 12.5% (-11.7)#14,555 |
| 34. | North Browning | 0.77% | 0.55% (+0.214)#34 | 12.5% (-11.7)#14,733 |
| 35. | Choteau | 0.76% | 0.55% (+0.207)#35 | 12.5% (-11.7)#14,765 |
| 36. | Missoula | 0.72% | 0.55% (+0.164)#36 | 12.5% (-11.8)#14,924 |
| 37. | Lewistown | 0.70% | 0.55% (+0.149)#37 | 12.5% (-11.8)#14,988 |
| 38. | Wolf Point | 0.65% | 0.55% (+0.093)#38 | 12.5% (-11.8)#15,228 |
| 39. | Bozeman | 0.64% | 0.55% (+0.087)#39 | 12.5% (-11.8)#15,254 |
| 40. | St Regis | 0.64% | 0.55% (+0.085)#40 | 12.5% (-11.8)#15,263 |
| 41. | Havre | 0.61% | 0.55% (+0.059)#41 | 12.5% (-11.9)#15,381 |
| 42. | Polson | 0.57% | 0.55% (+0.023)#42 | 12.5% (-11.9)#15,543 |
| 43. | Helena Valley Southeast | 0.57% | 0.55% (+0.013)#43 | 12.5% (-11.9)#15,588 |
| 44. | Bonner West Riverside | 0.55% | 0.55% (-0.005)#44 | 12.5% (-11.9)#15,671 |
| 45. | Heart Butte | 0.54% | 0.55% (-0.010)#45 | 12.5% (-11.9)#15,694 |
| 46. | Anaconda Deer Lodge County | 0.54% | 0.55% (-0.011)#46 | 12.5% (-11.9)#15,699 |
| 47. | Laurel | 0.49% | 0.55% (-0.065)#47 | 12.5% (-12.0)#15,941 |
| 48. | Kalispell | 0.47% | 0.55% (-0.081)#48 | 12.5% (-12.0)#16,005 |
| 49. | Lame Deer | 0.44% | 0.55% (-0.116)#49 | 12.5% (-12.0)#16,166 |
| 50. | Thompson Falls | 0.42% | 0.55% (-0.130)#50 | 12.5% (-12.0)#16,235 |
| 51. | Plains | 0.34% | 0.55% (-0.213)#51 | 12.5% (-12.1)#16,650 |
| 52. | Miles City | 0.33% | 0.55% (-0.220)#52 | 12.5% (-12.1)#16,684 |
| 53. | Montana City | 0.33% | 0.55% (-0.221)#53 | 12.5% (-12.1)#16,688 |
| 54. | Helena Valley West Central | 0.33% | 0.55% (-0.223)#54 | 12.5% (-12.1)#16,699 |
| 55. | Hot Springs | 0.33% | 0.55% (-0.226)#55 | 12.5% (-12.1)#16,714 |
| 56. | Nashua | 0.32% | 0.55% (-0.233)#56 | 12.5% (-12.2)#16,745 |
| 57. | Culbertson | 0.30% | 0.55% (-0.254)#57 | 12.5% (-12.2)#16,857 |
| 58. | Lolo | 0.28% | 0.55% (-0.268)#58 | 12.5% (-12.2)#16,921 |
| 59. | Libby | 0.25% | 0.55% (-0.307)#59 | 12.5% (-12.2)#17,110 |
| 60. | Superior | 0.23% | 0.55% (-0.323)#60 | 12.5% (-12.2)#17,167 |
| 61. | Big Sky | 0.18% | 0.55% (-0.375)#61 | 12.5% (-12.3)#17,440 |
| 62. | Darby | 0.16% | 0.55% (-0.388)#62 | 12.5% (-12.3)#17,500 |
| 63. | Belgrade | 0.16% | 0.55% (-0.397)#63 | 12.5% (-12.3)#17,556 |
| 64. | Butte Silver Bow Balance | 0.15% | 0.55% (-0.399)#64 | 12.5% (-12.3)#17,564 |
| 65. | Stevensville | 0.15% | 0.55% (-0.405)#65 | 12.5% (-12.3)#17,594 |
| 66. | Townsend | 0.14% | 0.55% (-0.414)#66 | 12.5% (-12.3)#17,641 |
| 67. | Ashland | 0.13% | 0.55% (-0.424)#67 | 12.5% (-12.3)#17,691 |
| 68. | Helena West Side | 0.13% | 0.55% (-0.426)#68 | 12.5% (-12.3)#17,699 |
| 69. | Bigfork | 0.10% | 0.55% (-0.451)#69 | 12.5% (-12.4)#17,797 |
| 70. | White Sulphur Springs | 0.090% | 0.55% (-0.462)#70 | 12.5% (-12.4)#17,859 |
| 71. | Baker | 0.067% | 0.55% (-0.485)#71 | 12.5% (-12.4)#17,952 |
Common Questions
What are the Top 10 Cities with the Highest Percentage of Black / African American Population in Montana?
Top 10 Cities with the Highest Percentage of Black / African American Population in Montana are:
#1
18.6%
#2
11.0%
#3
8.7%
#4
7.7%
#5
7.1%
#6
5.5%
#7
3.7%
#8
3.4%
#9
3.4%
#10
3.3%
What city has the Highest Percentage of Black / African American Population in Montana?
Kila has the Highest Percentage of Black / African American Population in Montana with 18.6%.
What is the Percentage of Black / African American Population in the State of Montana?
Percentage of Black / African American Population in Montana is 0.55%.
What is the Percentage of Black / African American Population in the United States?
Percentage of Black / African American Population in the United States is 12.5%.