Lemon Hill, CA Map & Demographics
Lemon Hill Map
Lemon Hill Overview
$21,278
PER CAPITA INCOME
$47,952
AVG FAMILY INCOME
$47,080
AVG HOUSEHOLD INCOME
29.6%
WAGE / INCOME GAP [ % ]
70.4¢/ $1
WAGE / INCOME GAP [ $ ]
$11,984
FAMILY INCOME DEFICIT
0.47
INEQUALITY / GINI INDEX
14,824
TOTAL POPULATION
7,719
MALE POPULATION
7,105
FEMALE POPULATION
108.64
MALES / 100 FEMALES
92.05
FEMALES / 100 MALES
30.2
MEDIAN AGE
3.9
AVG FAMILY SIZE
3.3
AVG HOUSEHOLD SIZE
6,240
LABOR FORCE [ PEOPLE ]
59.6%
PERCENT IN LABOR FORCE
9.0%
UNEMPLOYMENT RATE
Income in Lemon Hill
Income Overview in Lemon Hill
Per Capita Income in Lemon Hill is $21,278, while median incomes of families and households are $47,952 and $47,080 respectively.
| Characteristic | Number | Measure |
| Per Capita Income | 14,824 | $21,278 |
| Median Family Income | 3,263 | $47,952 |
| Mean Family Income | 3,263 | $71,838 |
| Median Household Income | 4,517 | $47,080 |
| Mean Household Income | 4,517 | $66,120 |
| Income Deficit | 3,263 | $11,984 |
| Wage / Income Gap (%) | 14,824 | 29.57% |
| Wage / Income Gap ($) | 14,824 | 70.43¢ per $1 |
| Gini / Inequality Index | 14,824 | 0.47 |
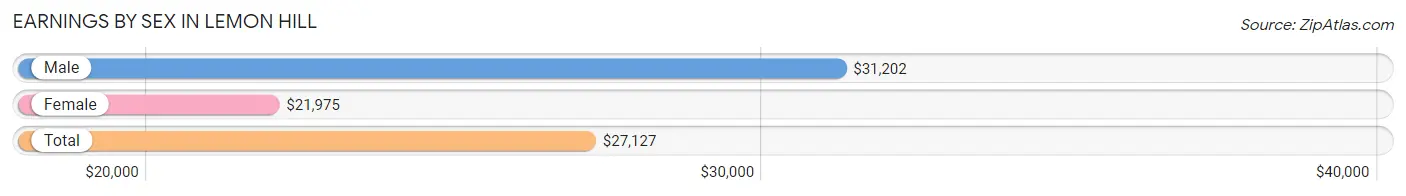
Earnings by Sex in Lemon Hill
Average Earnings in Lemon Hill are $27,127, $31,202 for men and $21,975 for women, a difference of 29.6%.
| Sex | Number | Average Earnings |
| Male | 3,451 (56.9%) | $31,202 |
| Female | 2,613 (43.1%) | $21,975 |
| Total | 6,064 (100.0%) | $27,127 |
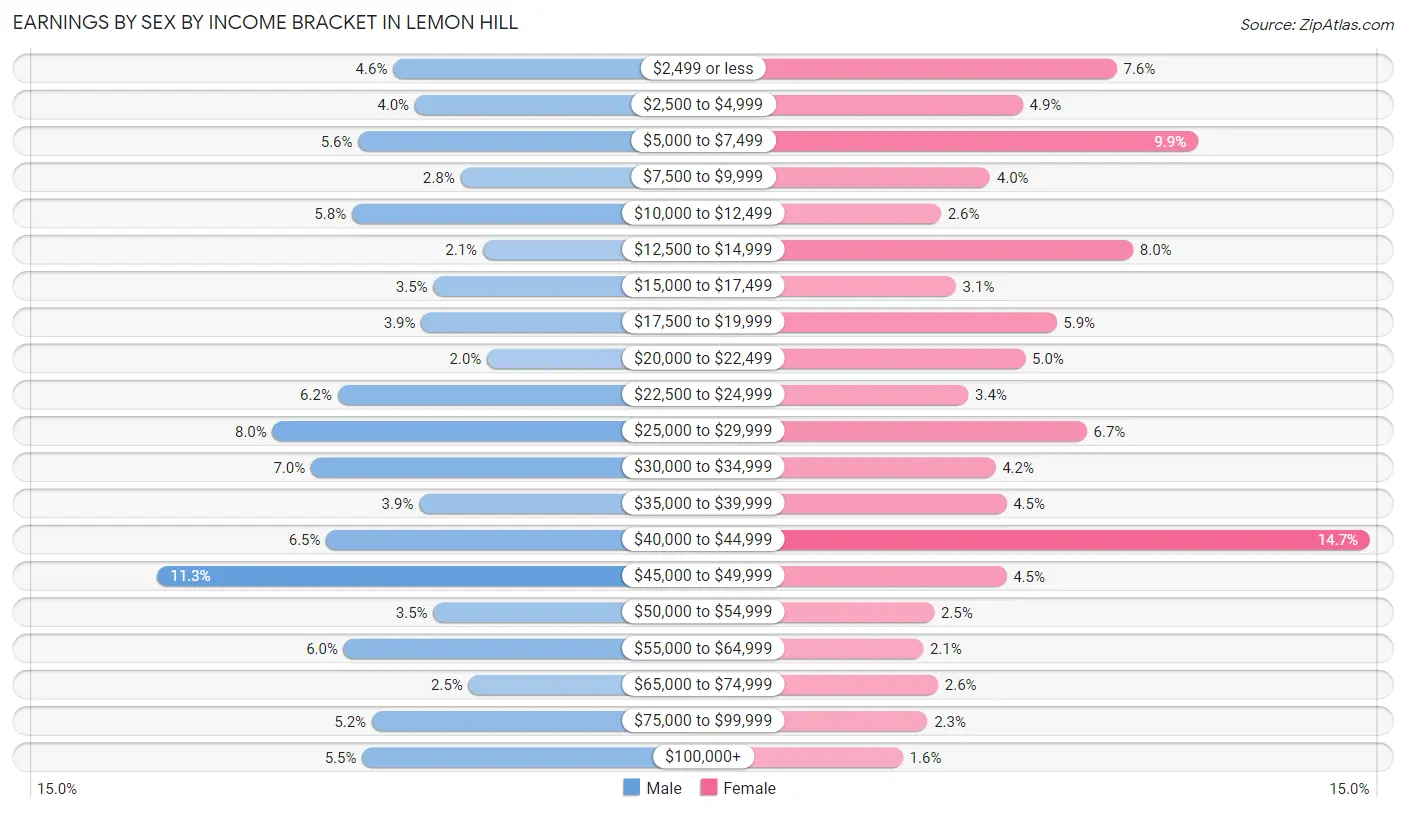
Earnings by Sex by Income Bracket in Lemon Hill
The most common earnings brackets in Lemon Hill are $45,000 to $49,999 for men (389 | 11.3%) and $40,000 to $44,999 for women (384 | 14.7%).
| Income | Male | Female |
| $2,499 or less | 160 (4.6%) | 198 (7.6%) |
| $2,500 to $4,999 | 139 (4.0%) | 129 (4.9%) |
| $5,000 to $7,499 | 194 (5.6%) | 258 (9.9%) |
| $7,500 to $9,999 | 95 (2.8%) | 105 (4.0%) |
| $10,000 to $12,499 | 200 (5.8%) | 69 (2.6%) |
| $12,500 to $14,999 | 73 (2.1%) | 210 (8.0%) |
| $15,000 to $17,499 | 121 (3.5%) | 80 (3.1%) |
| $17,500 to $19,999 | 133 (3.8%) | 154 (5.9%) |
| $20,000 to $22,499 | 69 (2.0%) | 131 (5.0%) |
| $22,500 to $24,999 | 214 (6.2%) | 89 (3.4%) |
| $25,000 to $29,999 | 277 (8.0%) | 176 (6.7%) |
| $30,000 to $34,999 | 240 (7.0%) | 109 (4.2%) |
| $35,000 to $39,999 | 135 (3.9%) | 117 (4.5%) |
| $40,000 to $44,999 | 225 (6.5%) | 384 (14.7%) |
| $45,000 to $49,999 | 389 (11.3%) | 117 (4.5%) |
| $50,000 to $54,999 | 121 (3.5%) | 64 (2.5%) |
| $55,000 to $64,999 | 208 (6.0%) | 56 (2.1%) |
| $65,000 to $74,999 | 87 (2.5%) | 67 (2.6%) |
| $75,000 to $99,999 | 181 (5.2%) | 59 (2.3%) |
| $100,000+ | 190 (5.5%) | 41 (1.6%) |
| Total | 3,451 (100.0%) | 2,613 (100.0%) |
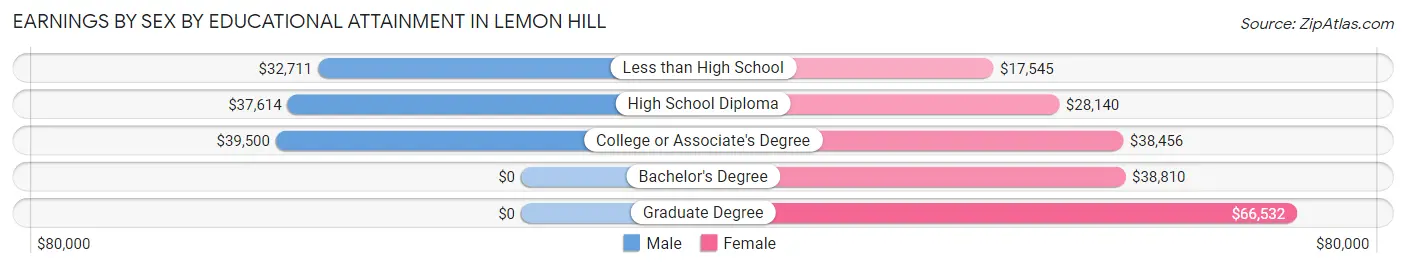
Earnings by Sex by Educational Attainment in Lemon Hill
Average earnings in Lemon Hill are $36,161 for men and $29,167 for women, a difference of 19.3%. Men with an educational attainment of college or associate's degree enjoy the highest average annual earnings of $39,500, while those with less than high school education earn the least with $32,711. Women with an educational attainment of graduate degree earn the most with the average annual earnings of $66,532, while those with less than high school education have the smallest earnings of $17,545.
| Educational Attainment | Male Income | Female Income |
| Less than High School | $32,711 | $17,545 |
| High School Diploma | $37,614 | $28,140 |
| College or Associate's Degree | $39,500 | $38,456 |
| Bachelor's Degree | - | - |
| Graduate Degree | - | - |
| Total | $36,161 | $29,167 |
Family Income in Lemon Hill
Family Income Brackets in Lemon Hill
According to the Lemon Hill family income data, there are 780 families falling into the $35,000 to $49,999 income range, which is the most common income bracket and makes up 23.9% of all families. Conversely, the $10,000 to $14,999 income bracket is the least frequent group with only 52 families (1.6%) belonging to this category.
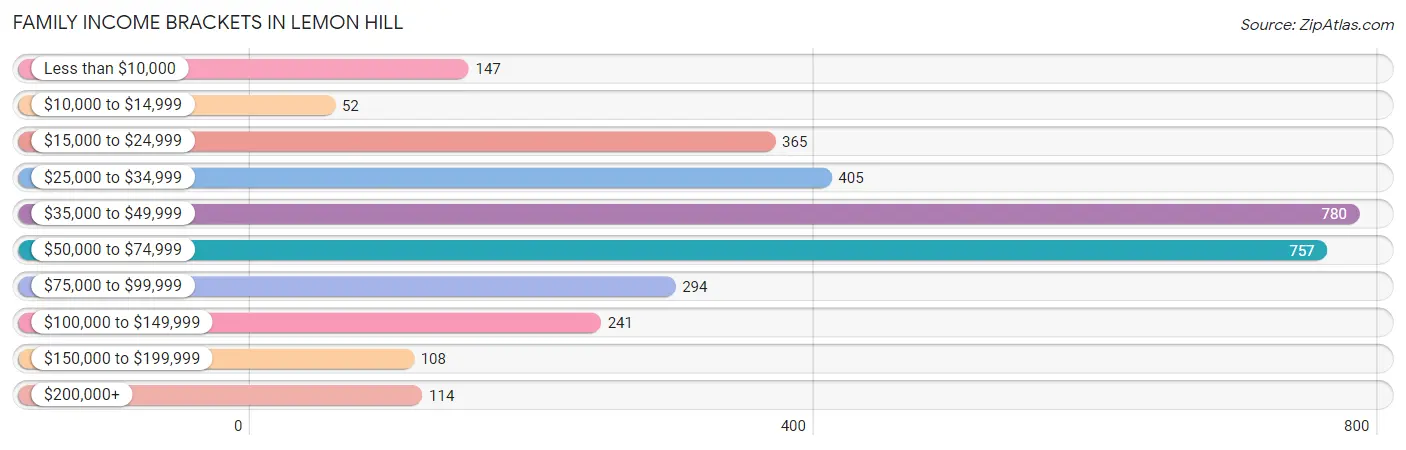
| Income Bracket | # Families | % Families |
| Less than $10,000 | 147 | 4.5% |
| $10,000 to $14,999 | 52 | 1.6% |
| $15,000 to $24,999 | 365 | 11.2% |
| $25,000 to $34,999 | 405 | 12.4% |
| $35,000 to $49,999 | 780 | 23.9% |
| $50,000 to $74,999 | 757 | 23.2% |
| $75,000 to $99,999 | 294 | 9.0% |
| $100,000 to $149,999 | 241 | 7.4% |
| $150,000 to $199,999 | 108 | 3.3% |
| $200,000+ | 114 | 3.5% |
Family Income by Famaliy Size in Lemon Hill
3-person families (442 | 13.6%) account for the highest median family income in Lemon Hill with $56,375 per family, while 2-person families (1,105 | 33.9%) have the highest median income of $24,412 per family member.
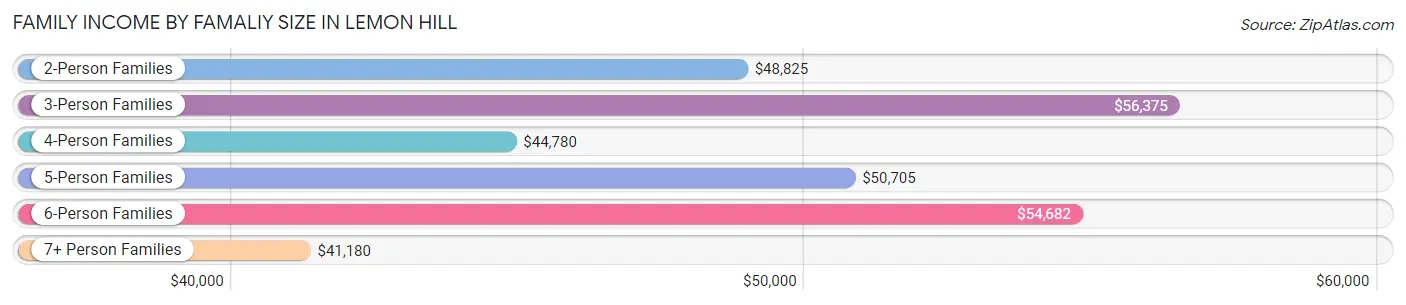
| Income Bracket | # Families | Median Income |
| 2-Person Families | 1,105 (33.9%) | $48,825 |
| 3-Person Families | 442 (13.6%) | $56,375 |
| 4-Person Families | 629 (19.3%) | $44,780 |
| 5-Person Families | 568 (17.4%) | $50,705 |
| 6-Person Families | 354 (10.8%) | $54,682 |
| 7+ Person Families | 165 (5.1%) | $41,180 |
| Total | 3,263 (100.0%) | $47,952 |
Family Income by Number of Earners in Lemon Hill
The median family income in Lemon Hill is $47,952, with families comprising 3+ earners (441) having the highest median family income of $73,070, while families with no earners (526) have the lowest median family income of $21,154, accounting for 13.5% and 16.1% of families, respectively.
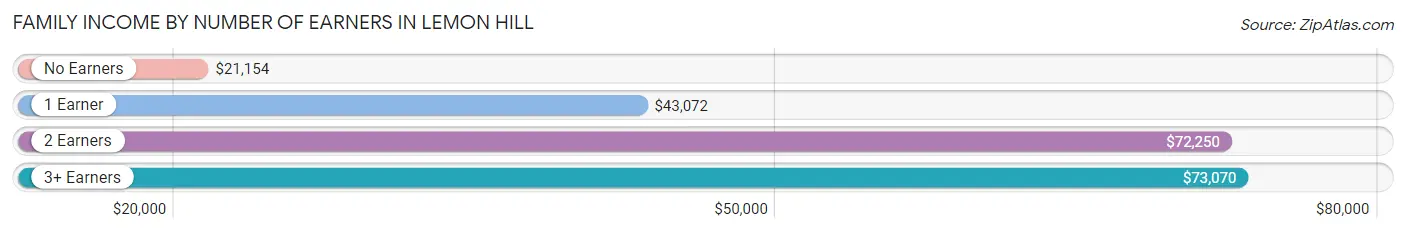
| Number of Earners | # Families | Median Income |
| No Earners | 526 (16.1%) | $21,154 |
| 1 Earner | 1,300 (39.8%) | $43,072 |
| 2 Earners | 996 (30.5%) | $72,250 |
| 3+ Earners | 441 (13.5%) | $73,070 |
| Total | 3,263 (100.0%) | $47,952 |
Household Income in Lemon Hill
Household Income Brackets in Lemon Hill
With 1,007 households falling in the category, the $35,000 to $49,999 income range is the most frequent in Lemon Hill, accounting for 22.3% of all households. In contrast, only 122 households (2.7%) fall into the $150,000 to $199,999 income bracket, making it the least populous group.
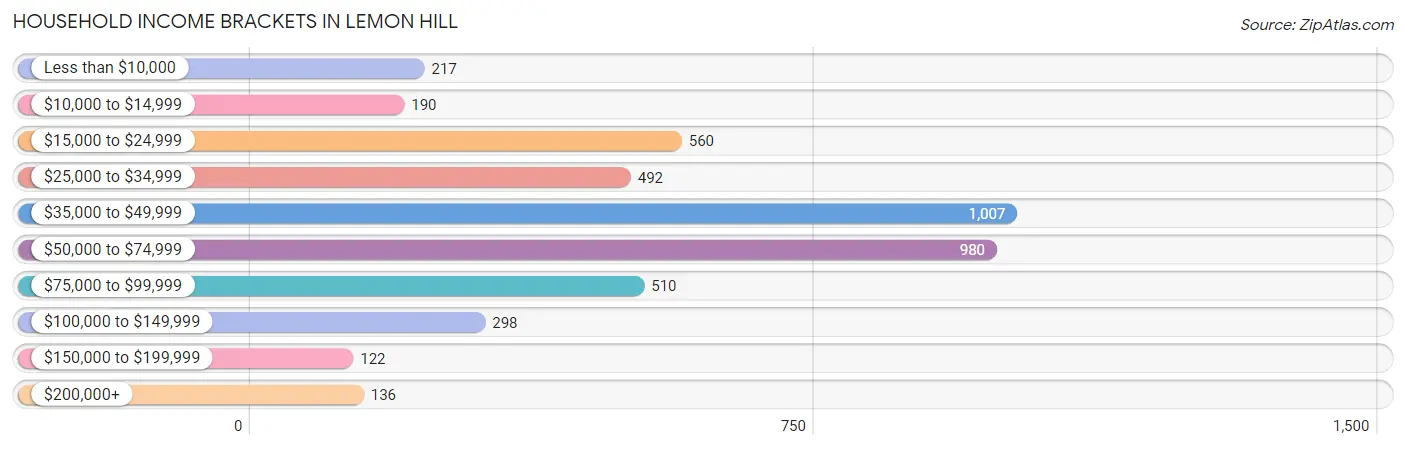
| Income Bracket | # Households | % Households |
| Less than $10,000 | 217 | 4.8% |
| $10,000 to $14,999 | 190 | 4.2% |
| $15,000 to $24,999 | 560 | 12.4% |
| $25,000 to $34,999 | 492 | 10.9% |
| $35,000 to $49,999 | 1,007 | 22.3% |
| $50,000 to $74,999 | 980 | 21.7% |
| $75,000 to $99,999 | 510 | 11.3% |
| $100,000 to $149,999 | 298 | 6.6% |
| $150,000 to $199,999 | 122 | 2.7% |
| $200,000+ | 136 | 3.0% |
Household Income by Householder Age in Lemon Hill
The median household income in Lemon Hill is $47,080, with the highest median household income of $70,724 found in the 15 to 24 years age bracket for the primary householder. A total of 97 households (2.1%) fall into this category. Meanwhile, the 45 to 64 years age bracket for the primary householder has the lowest median household income of $45,360, with 1,718 households (38.0%) in this group.
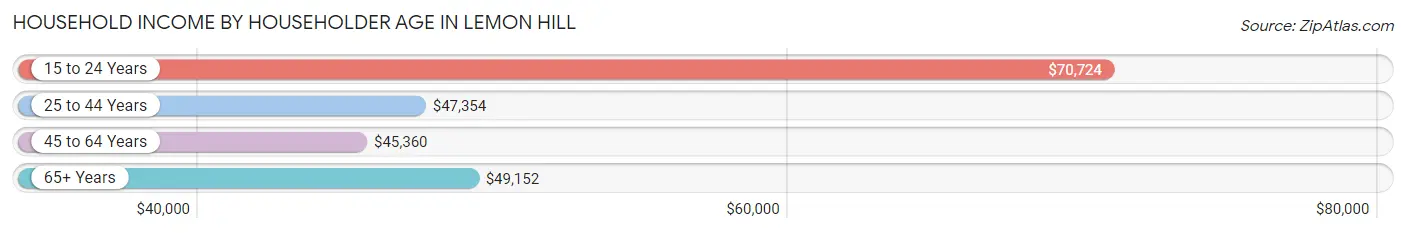
| Income Bracket | # Households | Median Income |
| 15 to 24 Years | 97 (2.1%) | $70,724 |
| 25 to 44 Years | 1,826 (40.4%) | $47,354 |
| 45 to 64 Years | 1,718 (38.0%) | $45,360 |
| 65+ Years | 876 (19.4%) | $49,152 |
| Total | 4,517 (100.0%) | $47,080 |
Poverty in Lemon Hill
Income Below Poverty by Sex and Age in Lemon Hill
With 27.2% poverty level for males and 31.6% for females among the residents of Lemon Hill, 16 and 17 year old males and 6 to 11 year old females are the most vulnerable to poverty, with 96 males (71.6%) and 443 females (49.8%) in their respective age groups living below the poverty level.
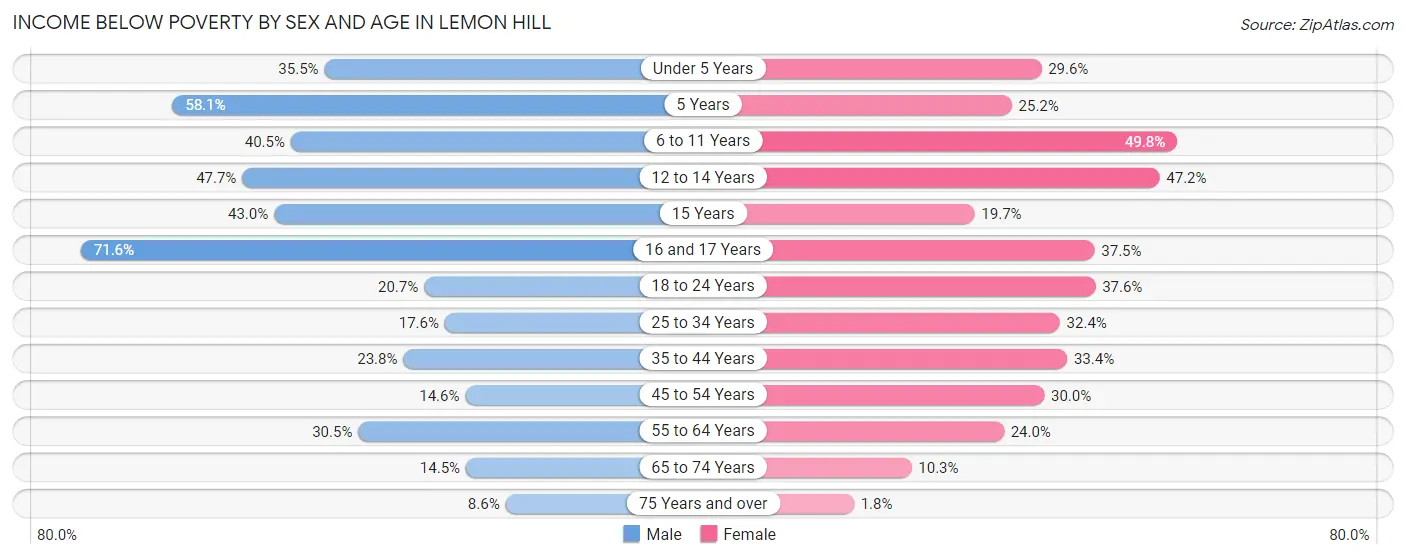
| Age Bracket | Male | Female |
| Under 5 Years | 220 (35.5%) | 106 (29.6%) |
| 5 Years | 18 (58.1%) | 29 (25.2%) |
| 6 to 11 Years | 499 (40.5%) | 443 (49.8%) |
| 12 to 14 Years | 186 (47.7%) | 191 (47.2%) |
| 15 Years | 61 (43.0%) | 25 (19.7%) |
| 16 and 17 Years | 96 (71.6%) | 81 (37.5%) |
| 18 to 24 Years | 183 (20.7%) | 292 (37.6%) |
| 25 to 34 Years | 187 (17.6%) | 295 (32.4%) |
| 35 to 44 Years | 203 (23.8%) | 313 (33.4%) |
| 45 to 54 Years | 123 (14.6%) | 239 (30.0%) |
| 55 to 64 Years | 223 (30.5%) | 163 (24.0%) |
| 65 to 74 Years | 68 (14.5%) | 56 (10.3%) |
| 75 Years and over | 25 (8.6%) | 6 (1.8%) |
| Total | 2,092 (27.2%) | 2,239 (31.6%) |
Income Above Poverty by Sex and Age in Lemon Hill
According to the poverty statistics in Lemon Hill, males aged 75 years and over and females aged 75 years and over are the age groups that are most secure financially, with 91.4% of males and 98.2% of females in these age groups living above the poverty line.
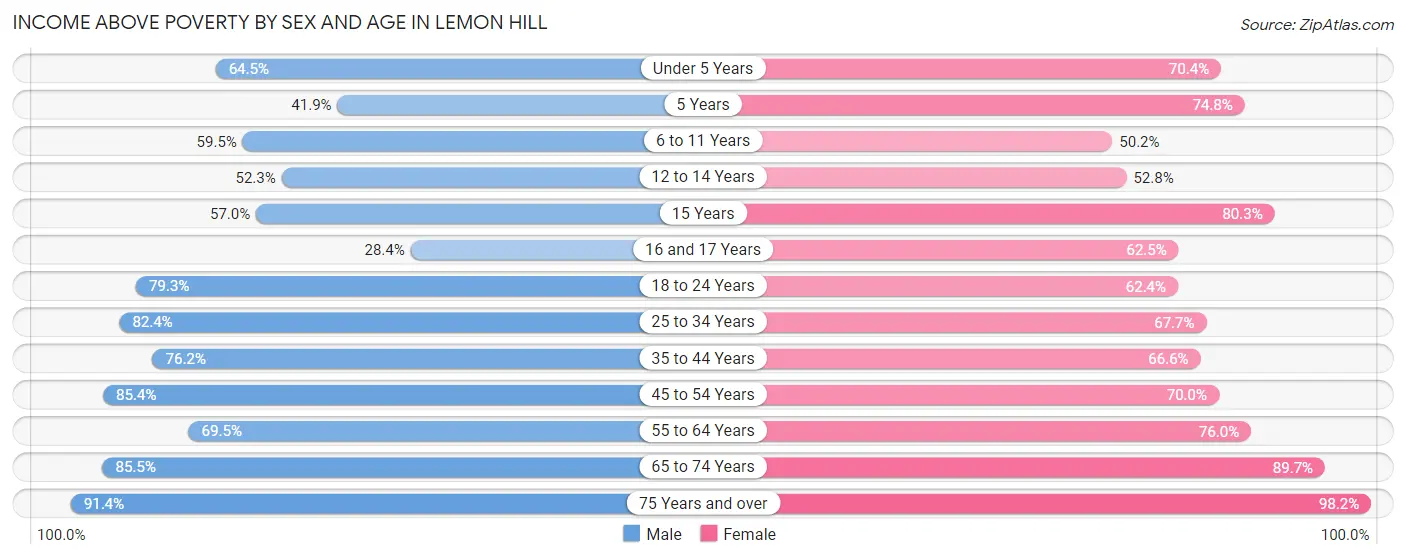
| Age Bracket | Male | Female |
| Under 5 Years | 400 (64.5%) | 252 (70.4%) |
| 5 Years | 13 (41.9%) | 86 (74.8%) |
| 6 to 11 Years | 734 (59.5%) | 447 (50.2%) |
| 12 to 14 Years | 204 (52.3%) | 214 (52.8%) |
| 15 Years | 81 (57.0%) | 102 (80.3%) |
| 16 and 17 Years | 38 (28.4%) | 135 (62.5%) |
| 18 to 24 Years | 702 (79.3%) | 484 (62.4%) |
| 25 to 34 Years | 875 (82.4%) | 617 (67.6%) |
| 35 to 44 Years | 651 (76.2%) | 623 (66.6%) |
| 45 to 54 Years | 722 (85.4%) | 557 (70.0%) |
| 55 to 64 Years | 509 (69.5%) | 515 (76.0%) |
| 65 to 74 Years | 402 (85.5%) | 486 (89.7%) |
| 75 Years and over | 266 (91.4%) | 333 (98.2%) |
| Total | 5,597 (72.8%) | 4,851 (68.4%) |
Income Below Poverty Among Married-Couple Families in Lemon Hill
The poverty statistics for married-couple families in Lemon Hill show that 19.9% or 361 of the total 1,816 families live below the poverty line. Families with 5 or more children have the highest poverty rate of 100.0%, comprising of 44 families. On the other hand, families with no children have the lowest poverty rate of 6.3%, which includes 56 families.
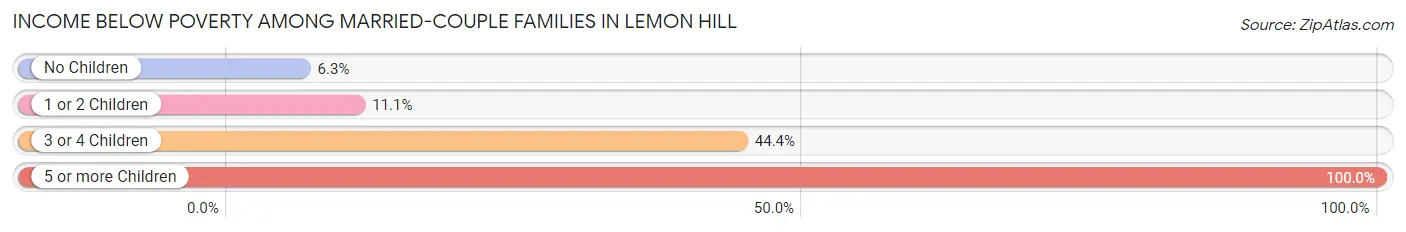
| Children | Above Poverty | Below Poverty |
| No Children | 830 (93.7%) | 56 (6.3%) |
| 1 or 2 Children | 353 (88.9%) | 44 (11.1%) |
| 3 or 4 Children | 272 (55.6%) | 217 (44.4%) |
| 5 or more Children | 0 (0.0%) | 44 (100.0%) |
| Total | 1,455 (80.1%) | 361 (19.9%) |
Income Below Poverty Among Single-Parent Households in Lemon Hill
According to the poverty data in Lemon Hill, 7.0% or 26 single-father households and 37.2% or 399 single-mother households are living below the poverty line. Among single-father households, those with 3 or 4 children have the highest poverty rate, with 8 households (11.3%) experiencing poverty. Likewise, among single-mother households, those with 3 or 4 children have the highest poverty rate, with 189 households (60.6%) falling below the poverty line.
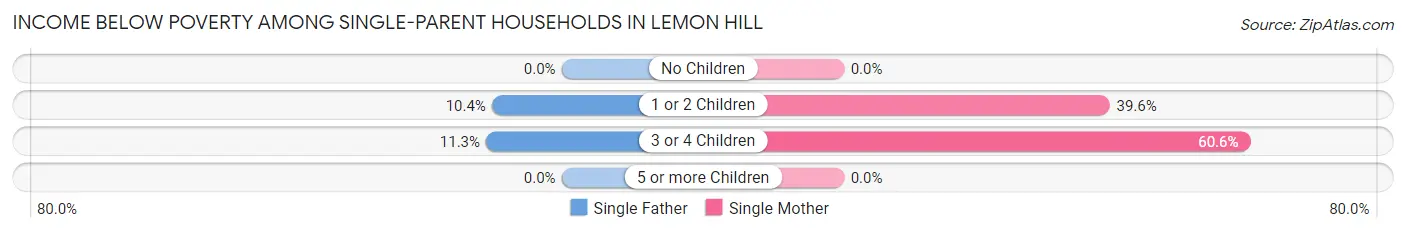
| Children | Single Father | Single Mother |
| No Children | 0 (0.0%) | 0 (0.0%) |
| 1 or 2 Children | 18 (10.4%) | 210 (39.6%) |
| 3 or 4 Children | 8 (11.3%) | 189 (60.6%) |
| 5 or more Children | 0 (0.0%) | 0 (0.0%) |
| Total | 26 (7.0%) | 399 (37.2%) |
Income Below Poverty Among Married-Couple vs Single-Parent Households in Lemon Hill
The poverty data for Lemon Hill shows that 361 of the married-couple family households (19.9%) and 425 of the single-parent households (29.4%) are living below the poverty level. Within the married-couple family households, those with 5 or more children have the highest poverty rate, with 44 households (100.0%) falling below the poverty line. Among the single-parent households, those with 3 or 4 children have the highest poverty rate, with 197 household (51.4%) living below poverty.
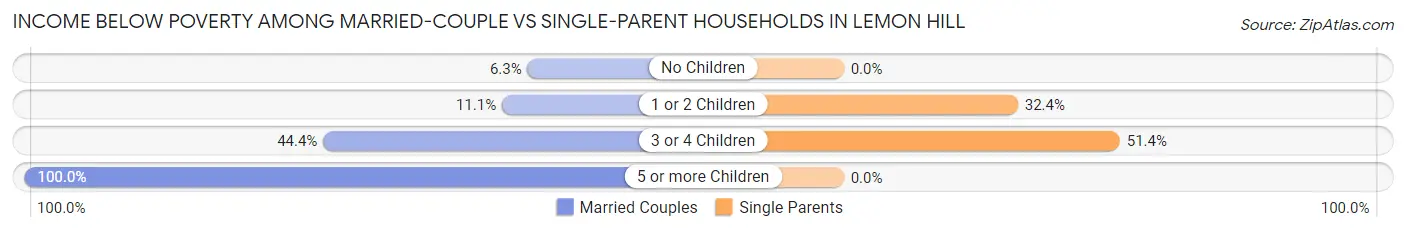
| Children | Married-Couple Families | Single-Parent Households |
| No Children | 56 (6.3%) | 0 (0.0%) |
| 1 or 2 Children | 44 (11.1%) | 228 (32.4%) |
| 3 or 4 Children | 217 (44.4%) | 197 (51.4%) |
| 5 or more Children | 44 (100.0%) | 0 (0.0%) |
| Total | 361 (19.9%) | 425 (29.4%) |
Race in Lemon Hill
The most populous races in Lemon Hill are Hispanic or Latino (6,420 | 43.3%), White / Caucasian (3,766 | 25.4%), and Some other Race (3,346 | 22.6%).
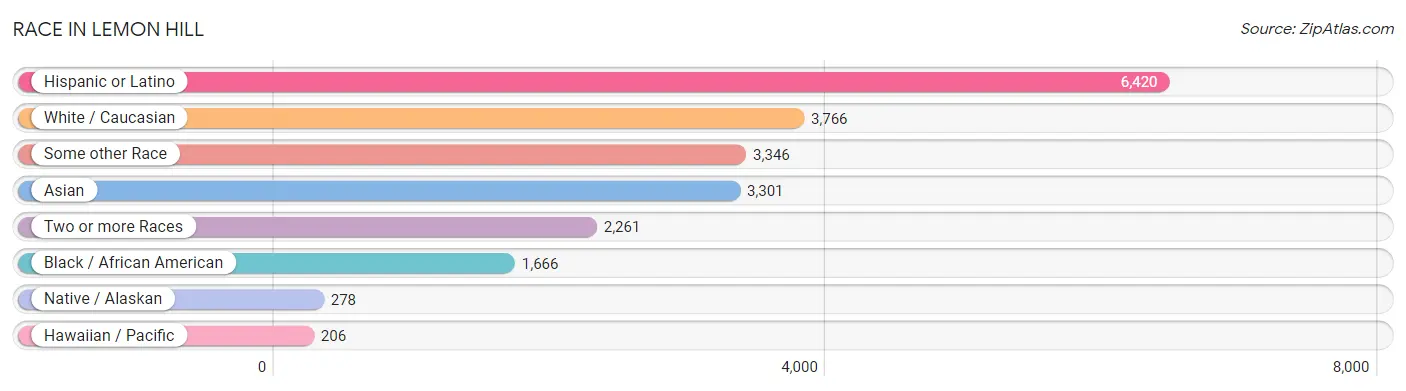
| Race | # Population | % Population |
| Asian | 3,301 | 22.3% |
| Black / African American | 1,666 | 11.2% |
| Hawaiian / Pacific | 206 | 1.4% |
| Hispanic or Latino | 6,420 | 43.3% |
| Native / Alaskan | 278 | 1.9% |
| White / Caucasian | 3,766 | 25.4% |
| Two or more Races | 2,261 | 15.2% |
| Some other Race | 3,346 | 22.6% |
| Total | 14,824 | 100.0% |
Ancestry in Lemon Hill
The most populous ancestries reported in Lemon Hill are Mexican (5,661 | 38.2%), Bangladeshi (1,521 | 10.3%), Irish (776 | 5.2%), English (627 | 4.2%), and German (624 | 4.2%), together accounting for 62.1% of all Lemon Hill residents.
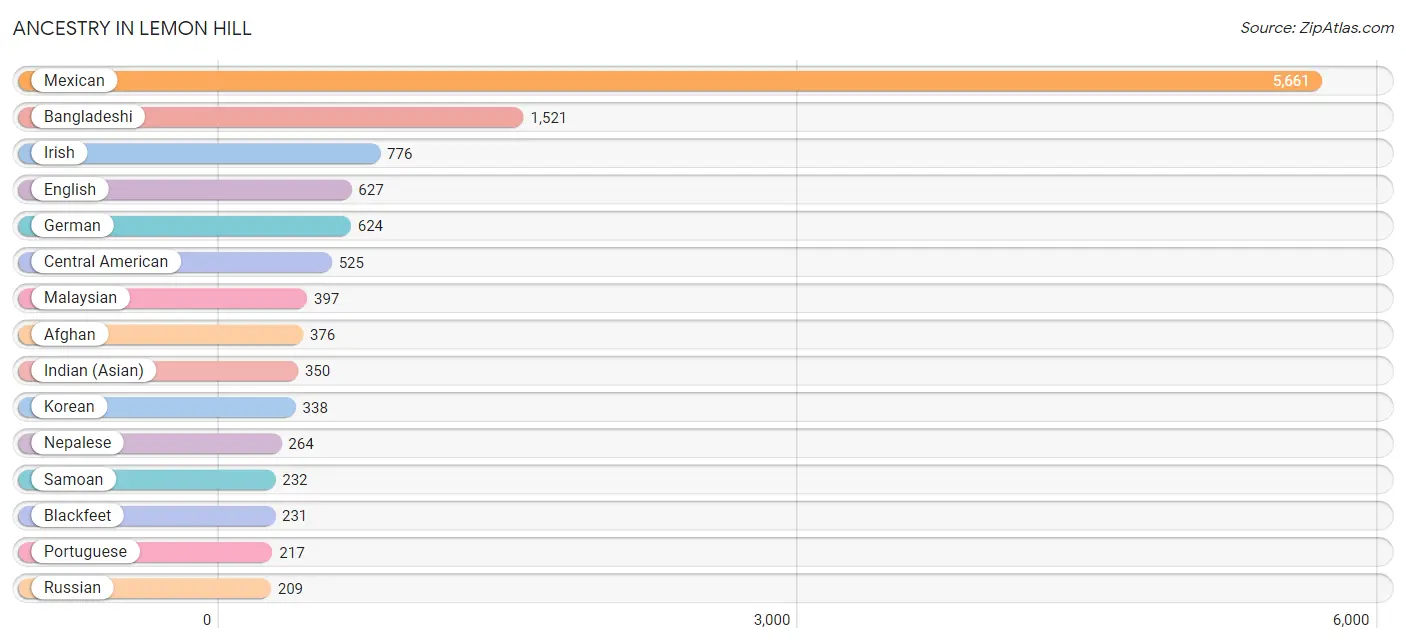
| Ancestry | # Population | % Population |
| Afghan | 376 | 2.5% |
| African | 34 | 0.2% |
| Albanian | 14 | 0.1% |
| American | 61 | 0.4% |
| Apache | 8 | 0.1% |
| Arab | 56 | 0.4% |
| Austrian | 24 | 0.2% |
| Bangladeshi | 1,521 | 10.3% |
| Bhutanese | 22 | 0.2% |
| Blackfeet | 231 | 1.6% |
| Bolivian | 18 | 0.1% |
| Central American | 525 | 3.5% |
| Central American Indian | 57 | 0.4% |
| Cherokee | 18 | 0.1% |
| Chilean | 19 | 0.1% |
| Choctaw | 7 | 0.1% |
| Creek | 13 | 0.1% |
| Croatian | 26 | 0.2% |
| Cuban | 51 | 0.3% |
| Czech | 17 | 0.1% |
| Danish | 17 | 0.1% |
| Dutch | 53 | 0.4% |
| English | 627 | 4.2% |
| Estonian | 17 | 0.1% |
| European | 66 | 0.4% |
| Finnish | 35 | 0.2% |
| French | 192 | 1.3% |
| French American Indian | 34 | 0.2% |
| German | 624 | 4.2% |
| Guamanian / Chamorro | 60 | 0.4% |
| Guatemalan | 146 | 1.0% |
| Honduran | 180 | 1.2% |
| Hopi | 21 | 0.1% |
| Icelander | 18 | 0.1% |
| Indian (Asian) | 350 | 2.4% |
| Inupiat | 9 | 0.1% |
| Iranian | 3 | 0.0% |
| Irish | 776 | 5.2% |
| Italian | 135 | 0.9% |
| Korean | 338 | 2.3% |
| Lebanese | 47 | 0.3% |
| Malaysian | 397 | 2.7% |
| Mexican | 5,661 | 38.2% |
| Mexican American Indian | 153 | 1.0% |
| Native Hawaiian | 92 | 0.6% |
| Navajo | 37 | 0.3% |
| Nepalese | 264 | 1.8% |
| Nicaraguan | 27 | 0.2% |
| Northern European | 13 | 0.1% |
| Norwegian | 72 | 0.5% |
| Palestinian | 9 | 0.1% |
| Panamanian | 24 | 0.2% |
| Peruvian | 21 | 0.1% |
| Polish | 33 | 0.2% |
| Portuguese | 217 | 1.5% |
| Potawatomi | 10 | 0.1% |
| Puerto Rican | 35 | 0.2% |
| Russian | 209 | 1.4% |
| Salvadoran | 148 | 1.0% |
| Samoan | 232 | 1.6% |
| Scottish | 105 | 0.7% |
| Serbian | 18 | 0.1% |
| Sioux | 118 | 0.8% |
| South American | 58 | 0.4% |
| Spaniard | 17 | 0.1% |
| Spanish | 28 | 0.2% |
| Sri Lankan | 140 | 0.9% |
| Subsaharan African | 34 | 0.2% |
| Swedish | 89 | 0.6% |
| Thai | 141 | 0.9% |
| Ukrainian | 112 | 0.8% |
| Welsh | 53 | 0.4% |
| Yugoslavian | 117 | 0.8% | View All 73 Rows |
Immigrants in Lemon Hill
The most numerous immigrant groups reported in Lemon Hill came from Latin America (2,402 | 16.2%), Central America (2,367 | 16.0%), Mexico (2,054 | 13.9%), Asia (1,618 | 10.9%), and South Eastern Asia (1,141 | 7.7%), together accounting for 64.6% of all Lemon Hill residents.
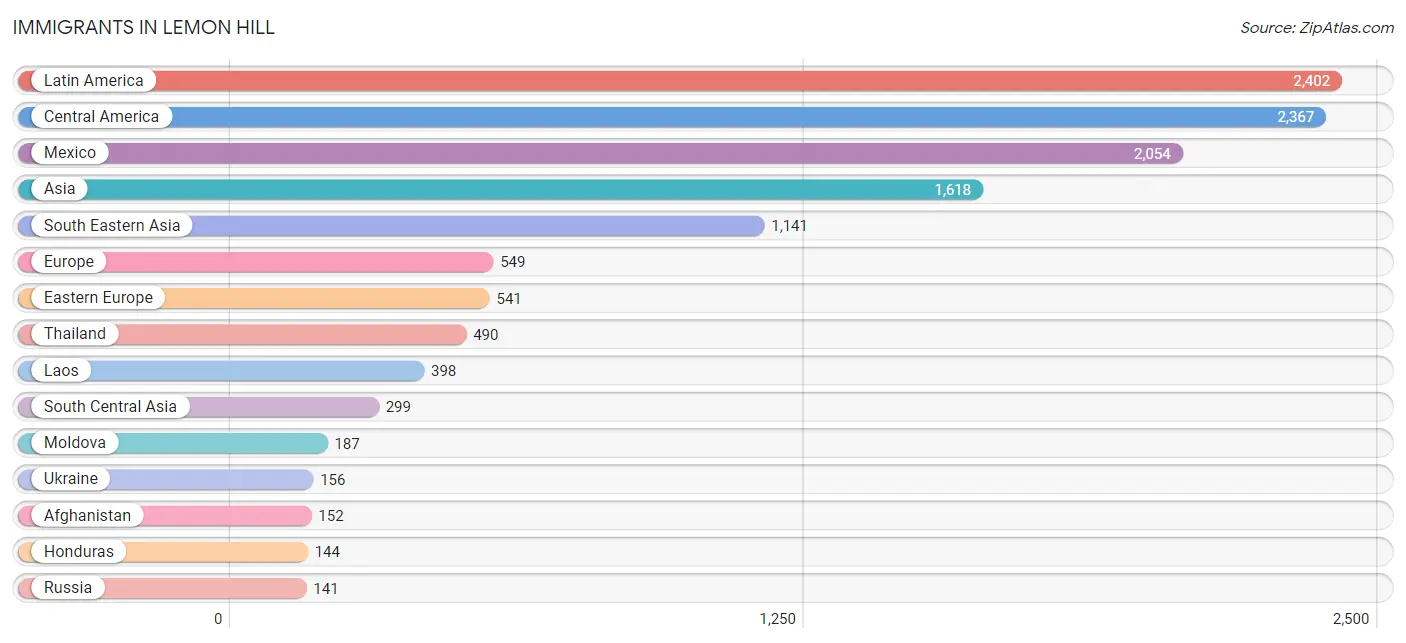
| Immigration Origin | # Population | % Population |
| Afghanistan | 152 | 1.0% |
| Africa | 69 | 0.5% |
| Asia | 1,618 | 10.9% |
| Bolivia | 18 | 0.1% |
| Bosnia and Herzegovina | 39 | 0.3% |
| Cabo Verde | 54 | 0.4% |
| Cameroon | 15 | 0.1% |
| Canada | 1 | 0.0% |
| Caribbean | 17 | 0.1% |
| Central America | 2,367 | 16.0% |
| China | 131 | 0.9% |
| Croatia | 9 | 0.1% |
| Cuba | 17 | 0.1% |
| Eastern Asia | 131 | 0.9% |
| Eastern Europe | 541 | 3.6% |
| El Salvador | 105 | 0.7% |
| Europe | 549 | 3.7% |
| Fiji | 25 | 0.2% |
| Germany | 8 | 0.1% |
| Guatemala | 40 | 0.3% |
| Honduras | 144 | 1.0% |
| Hong Kong | 17 | 0.1% |
| India | 75 | 0.5% |
| Iran | 3 | 0.0% |
| Laos | 398 | 2.7% |
| Latin America | 2,402 | 16.2% |
| Lebanon | 47 | 0.3% |
| Mexico | 2,054 | 13.9% |
| Middle Africa | 15 | 0.1% |
| Moldova | 187 | 1.3% |
| North Macedonia | 9 | 0.1% |
| Oceania | 49 | 0.3% |
| Pakistan | 69 | 0.5% |
| Panama | 24 | 0.2% |
| Philippines | 113 | 0.8% |
| Russia | 141 | 0.9% |
| South America | 18 | 0.1% |
| South Central Asia | 299 | 2.0% |
| South Eastern Asia | 1,141 | 7.7% |
| Thailand | 490 | 3.3% |
| Ukraine | 156 | 1.1% |
| Vietnam | 140 | 0.9% |
| Western Africa | 54 | 0.4% |
| Western Asia | 47 | 0.3% |
| Western Europe | 8 | 0.1% | View All 45 Rows |
Sex and Age in Lemon Hill
Sex and Age in Lemon Hill
The most populous age groups in Lemon Hill are 5 to 9 Years (1,047 | 13.6%) for men and 10 to 14 Years (758 | 10.7%) for women.
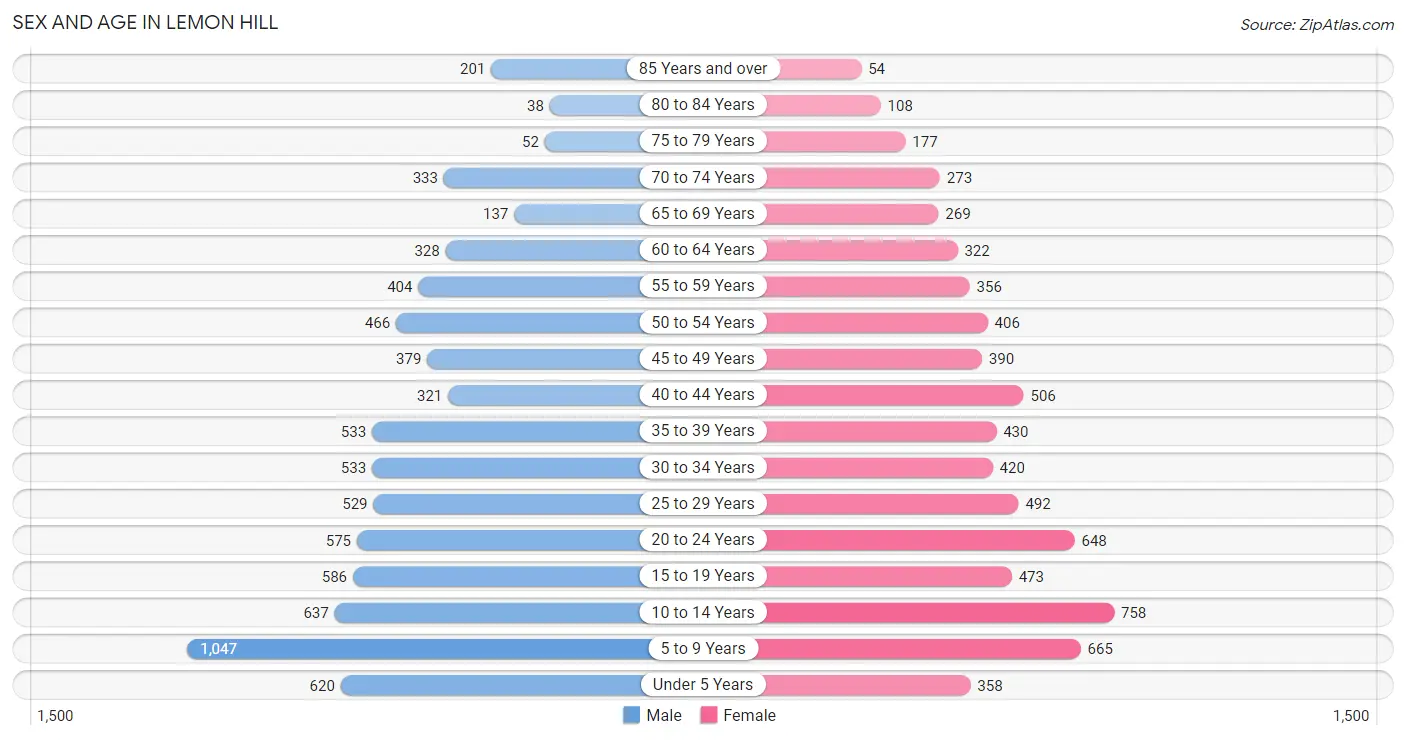
| Age Bracket | Male | Female |
| Under 5 Years | 620 (8.0%) | 358 (5.0%) |
| 5 to 9 Years | 1,047 (13.6%) | 665 (9.4%) |
| 10 to 14 Years | 637 (8.3%) | 758 (10.7%) |
| 15 to 19 Years | 586 (7.6%) | 473 (6.7%) |
| 20 to 24 Years | 575 (7.4%) | 648 (9.1%) |
| 25 to 29 Years | 529 (6.9%) | 492 (6.9%) |
| 30 to 34 Years | 533 (6.9%) | 420 (5.9%) |
| 35 to 39 Years | 533 (6.9%) | 430 (6.0%) |
| 40 to 44 Years | 321 (4.2%) | 506 (7.1%) |
| 45 to 49 Years | 379 (4.9%) | 390 (5.5%) |
| 50 to 54 Years | 466 (6.0%) | 406 (5.7%) |
| 55 to 59 Years | 404 (5.2%) | 356 (5.0%) |
| 60 to 64 Years | 328 (4.3%) | 322 (4.5%) |
| 65 to 69 Years | 137 (1.8%) | 269 (3.8%) |
| 70 to 74 Years | 333 (4.3%) | 273 (3.8%) |
| 75 to 79 Years | 52 (0.7%) | 177 (2.5%) |
| 80 to 84 Years | 38 (0.5%) | 108 (1.5%) |
| 85 Years and over | 201 (2.6%) | 54 (0.8%) |
| Total | 7,719 (100.0%) | 7,105 (100.0%) |
Families and Households in Lemon Hill
Median Family Size in Lemon Hill
The median family size in Lemon Hill is 3.87 persons per family, with married-couple families (1,816 | 55.6%) accounting for the largest median family size of 4.07 persons per family. On the other hand, single female/mother families (1,073 | 32.9%) represent the smallest median family size with 3.50 persons per family.
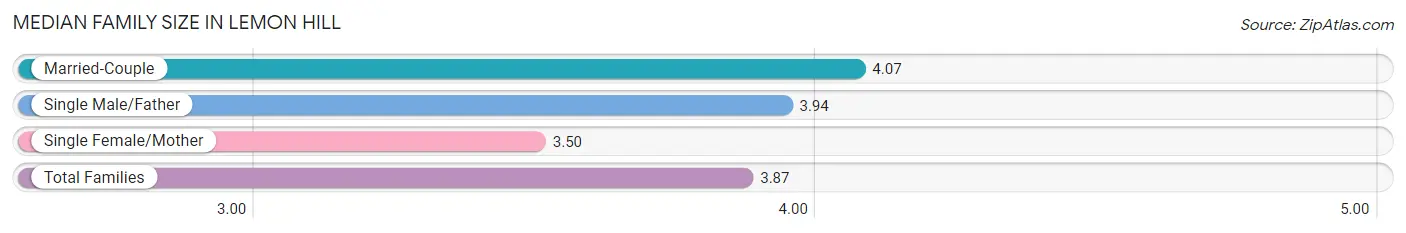
| Family Type | # Families | Family Size |
| Married-Couple | 1,816 (55.6%) | 4.07 |
| Single Male/Father | 374 (11.5%) | 3.94 |
| Single Female/Mother | 1,073 (32.9%) | 3.50 |
| Total Families | 3,263 (100.0%) | 3.87 |
Median Household Size in Lemon Hill
The median household size in Lemon Hill is 3.27 persons per household, with single male/father households (374 | 8.3%) accounting for the largest median household size of 4.12 persons per household. non-family households (1,254 | 27.8%) represent the smallest median household size with 1.31 persons per household.
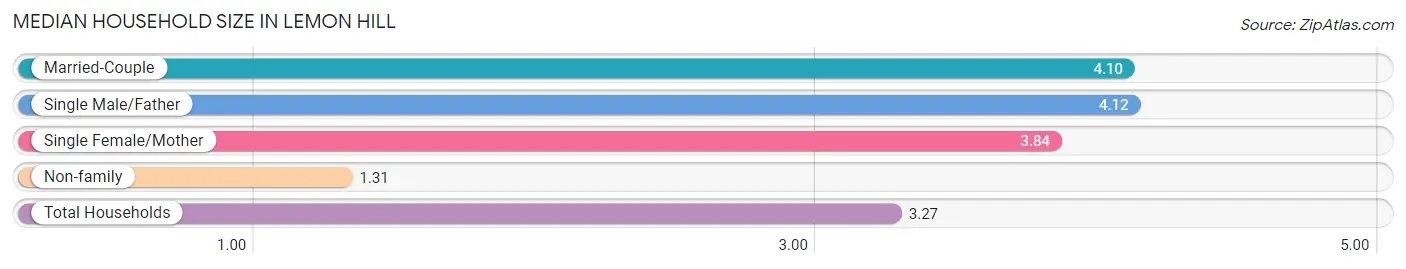
| Household Type | # Households | Household Size |
| Married-Couple | 1,816 (40.2%) | 4.10 |
| Single Male/Father | 374 (8.3%) | 4.12 |
| Single Female/Mother | 1,073 (23.7%) | 3.84 |
| Non-family | 1,254 (27.8%) | 1.31 |
| Total Households | 4,517 (100.0%) | 3.27 |
Household Size by Marriage Status in Lemon Hill
Out of a total of 4,517 households in Lemon Hill, 3,263 (72.2%) are family households, while 1,254 (27.8%) are nonfamily households. The most numerous type of family households are 2-person households, comprising 978, and the most common type of nonfamily households are 1-person households, comprising 991.
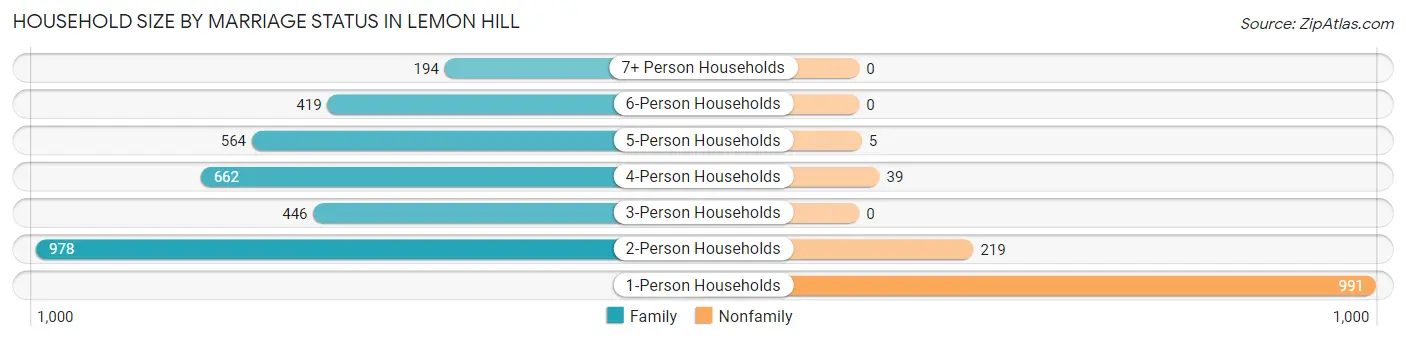
| Household Size | Family Households | Nonfamily Households |
| 1-Person Households | - | 991 (21.9%) |
| 2-Person Households | 978 (21.6%) | 219 (4.9%) |
| 3-Person Households | 446 (9.9%) | 0 (0.0%) |
| 4-Person Households | 662 (14.7%) | 39 (0.9%) |
| 5-Person Households | 564 (12.5%) | 5 (0.1%) |
| 6-Person Households | 419 (9.3%) | 0 (0.0%) |
| 7+ Person Households | 194 (4.3%) | 0 (0.0%) |
| Total | 3,263 (72.2%) | 1,254 (27.8%) |
Female Fertility in Lemon Hill
Fertility by Age in Lemon Hill
Average fertility rate in Lemon Hill is 78.0 births per 1,000 women. Women in the age bracket of 20 to 34 years have the highest fertility rate with 140.0 births per 1,000 women. Women in the age bracket of 20 to 34 years acount for 81.4% of all women with births.
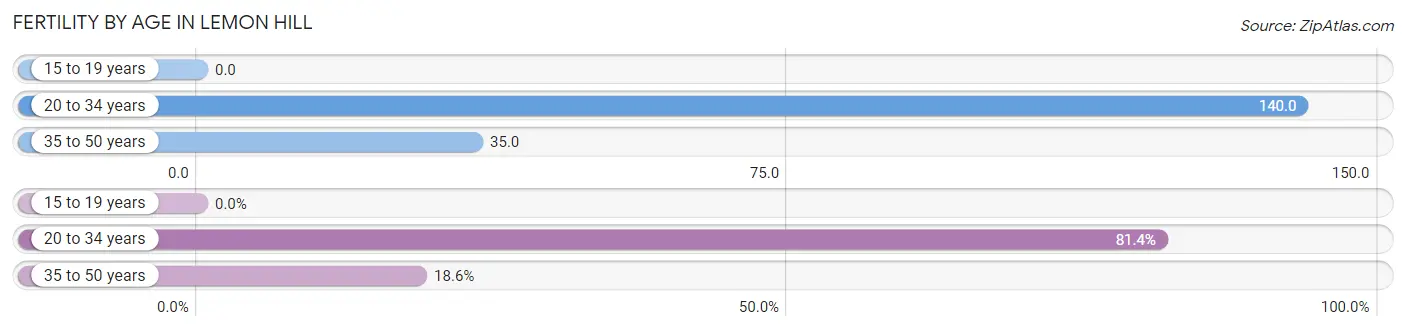
| Age Bracket | Women with Births | Births / 1,000 Women |
| 15 to 19 years | 0 (0.0%) | 0.0 |
| 20 to 34 years | 219 (81.4%) | 140.0 |
| 35 to 50 years | 50 (18.6%) | 35.0 |
| Total | 269 (100.0%) | 78.0 |
Fertility by Age by Marriage Status in Lemon Hill
49.1% of women with births (269) in Lemon Hill are married. The highest percentage of unmarried women with births falls into 20 to 34 years age bracket with 55.7% of them unmarried at the time of birth, while the lowest percentage of unmarried women with births belong to 35 to 50 years age bracket with 30.0% of them unmarried.
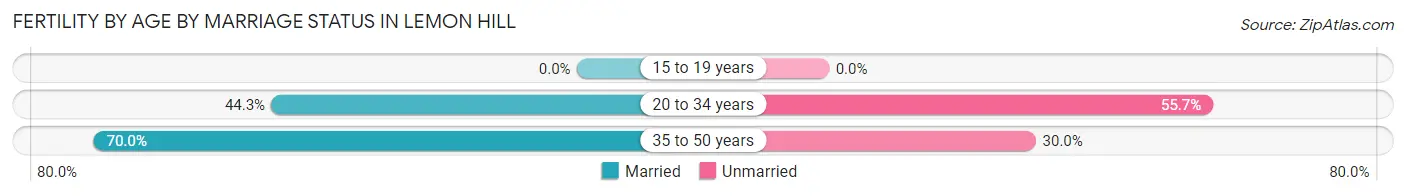
| Age Bracket | Married | Unmarried |
| 15 to 19 years | 0 (0.0%) | 0 (0.0%) |
| 20 to 34 years | 97 (44.3%) | 122 (55.7%) |
| 35 to 50 years | 35 (70.0%) | 15 (30.0%) |
| Total | 132 (49.1%) | 137 (50.9%) |
Fertility by Education in Lemon Hill
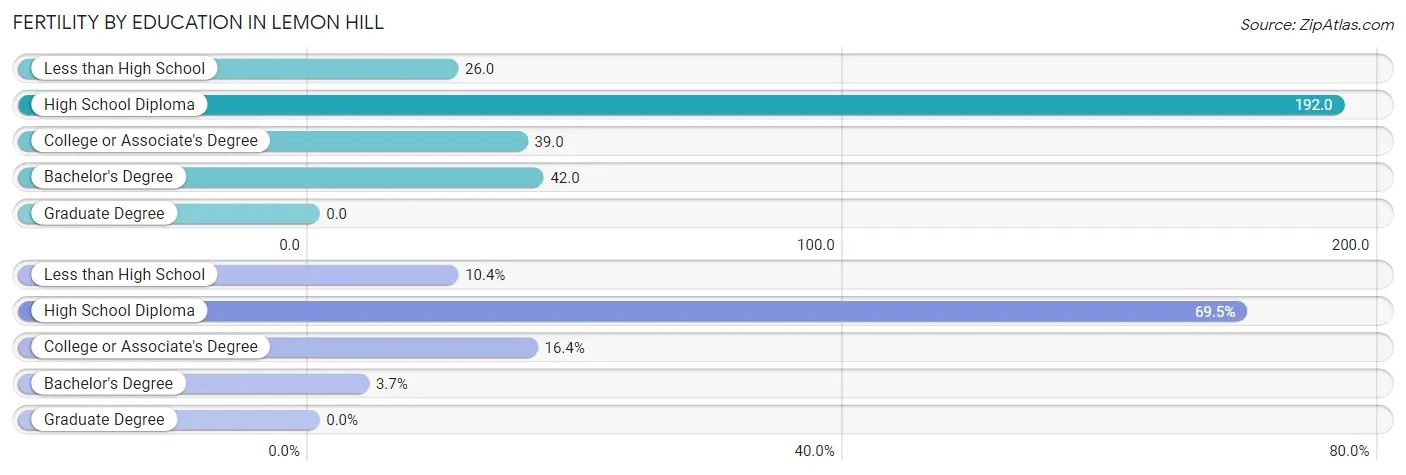
| Educational Attainment | Women with Births | Births / 1,000 Women |
| Less than High School | 28 (10.4%) | 26.0 |
| High School Diploma | 187 (69.5%) | 192.0 |
| College or Associate's Degree | 44 (16.4%) | 39.0 |
| Bachelor's Degree | 10 (3.7%) | 42.0 |
| Graduate Degree | 0 (0.0%) | 0.0 |
| Total | 269 (100.0%) | 78.0 |
Fertility by Education by Marriage Status in Lemon Hill
50.9% of women with births in Lemon Hill are unmarried. Women with the educational attainment of less than high school are most likely to be married with 100.0% of them married at childbirth, while women with the educational attainment of high school diploma are least likely to be married with 61.0% of them unmarried at childbirth.
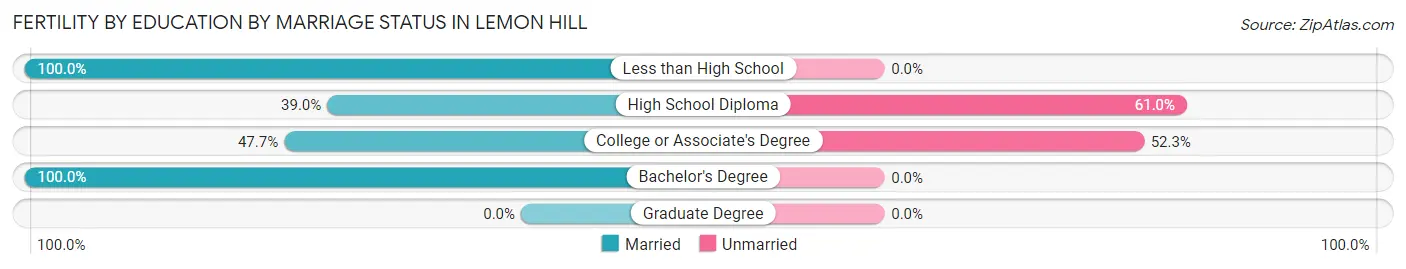
| Educational Attainment | Married | Unmarried |
| Less than High School | 28 (100.0%) | 0 (0.0%) |
| High School Diploma | 73 (39.0%) | 114 (61.0%) |
| College or Associate's Degree | 21 (47.7%) | 23 (52.3%) |
| Bachelor's Degree | 10 (100.0%) | 0 (0.0%) |
| Graduate Degree | 0 (0.0%) | 0 (0.0%) |
| Total | 132 (49.1%) | 137 (50.9%) |
Employment Characteristics in Lemon Hill
Employment by Class of Employer in Lemon Hill
Among the 5,595 employed individuals in Lemon Hill, private company employees (3,471 | 62.0%), local government employees (612 | 10.9%), and self-employed (not incorporated) (563 | 10.1%) make up the most common classes of employment.
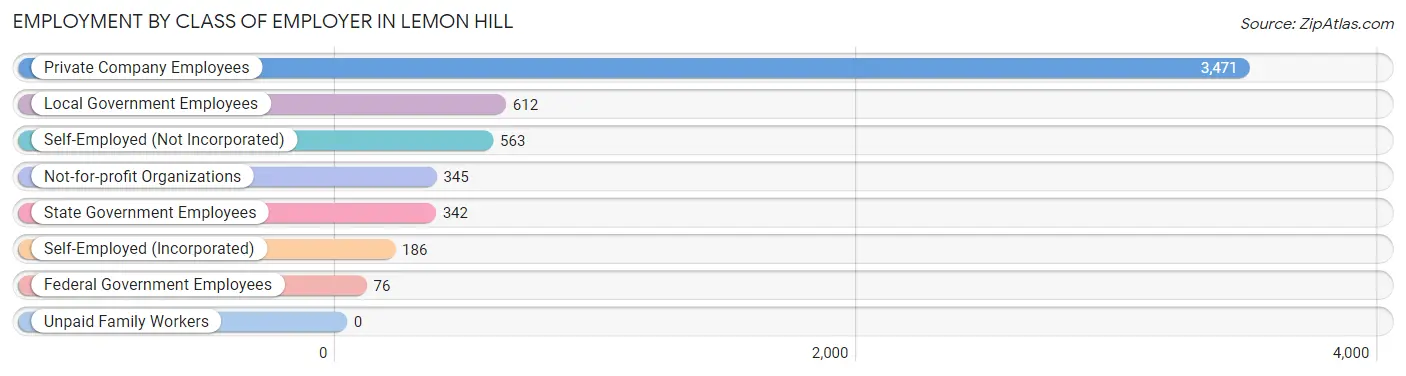
| Employer Class | # Employees | % Employees |
| Private Company Employees | 3,471 | 62.0% |
| Self-Employed (Incorporated) | 186 | 3.3% |
| Self-Employed (Not Incorporated) | 563 | 10.1% |
| Not-for-profit Organizations | 345 | 6.2% |
| Local Government Employees | 612 | 10.9% |
| State Government Employees | 342 | 6.1% |
| Federal Government Employees | 76 | 1.4% |
| Unpaid Family Workers | 0 | 0.0% |
| Total | 5,595 | 100.0% |
Employment Status by Age in Lemon Hill
According to the labor force statistics for Lemon Hill, out of the total population over 16 years of age (10,470), 59.6% or 6,240 individuals are in the labor force, with 9.0% or 562 of them unemployed. The age group with the highest labor force participation rate is 25 to 29 years, with 83.8% or 856 individuals in the labor force. Within the labor force, the 16 to 19 years age range has the highest percentage of unemployed individuals, with 30.5% or 113 of them being unemployed.
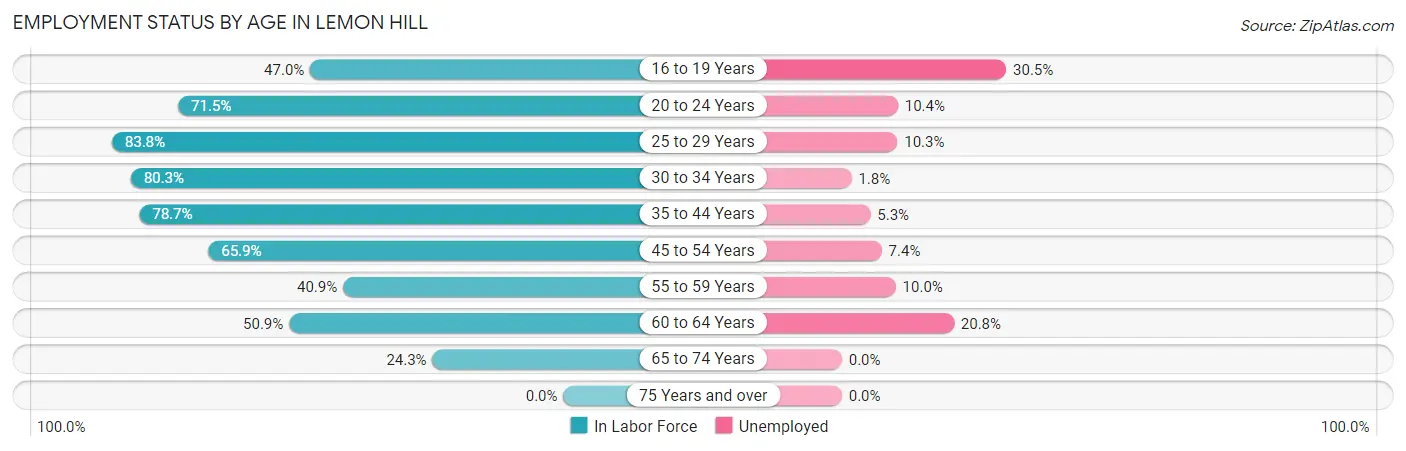
| Age Bracket | In Labor Force | Unemployed |
| 16 to 19 Years | 371 (47.0%) | 113 (30.5%) |
| 20 to 24 Years | 874 (71.5%) | 91 (10.4%) |
| 25 to 29 Years | 856 (83.8%) | 88 (10.3%) |
| 30 to 34 Years | 765 (80.3%) | 14 (1.8%) |
| 35 to 44 Years | 1,409 (78.7%) | 75 (5.3%) |
| 45 to 54 Years | 1,081 (65.9%) | 80 (7.4%) |
| 55 to 59 Years | 311 (40.9%) | 31 (10.0%) |
| 60 to 64 Years | 331 (50.9%) | 69 (20.8%) |
| 65 to 74 Years | 246 (24.3%) | 0 (0.0%) |
| 75 Years and over | 0 (0.0%) | 0 (0.0%) |
| Total | 6,240 (59.6%) | 562 (9.0%) |
Employment Status by Educational Attainment in Lemon Hill
According to labor force statistics for Lemon Hill, 69.7% of individuals (4,750) out of the total population between 25 and 64 years of age (6,815) are in the labor force, with 7.5% or 356 of them being unemployed. The group with the highest labor force participation rate are those with the educational attainment of bachelor's degree or higher, with 89.8% or 473 individuals in the labor force. Within the labor force, individuals with college / associate degree education have the highest percentage of unemployment, with 11.5% or 201 of them being unemployed.
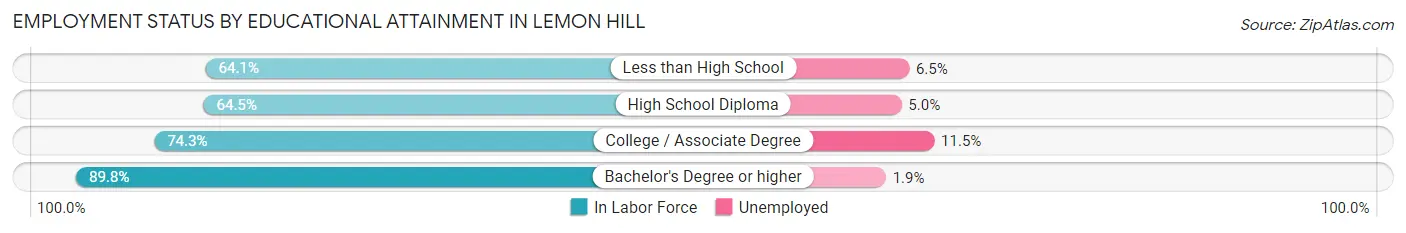
| Educational Attainment | In Labor Force | Unemployed |
| Less than High School | 1,301 (64.1%) | 132 (6.5%) |
| High School Diploma | 1,229 (64.5%) | 95 (5.0%) |
| College / Associate Degree | 1,748 (74.3%) | 271 (11.5%) |
| Bachelor's Degree or higher | 473 (89.8%) | 10 (1.9%) |
| Total | 4,750 (69.7%) | 511 (7.5%) |
Employment Occupations by Sex in Lemon Hill
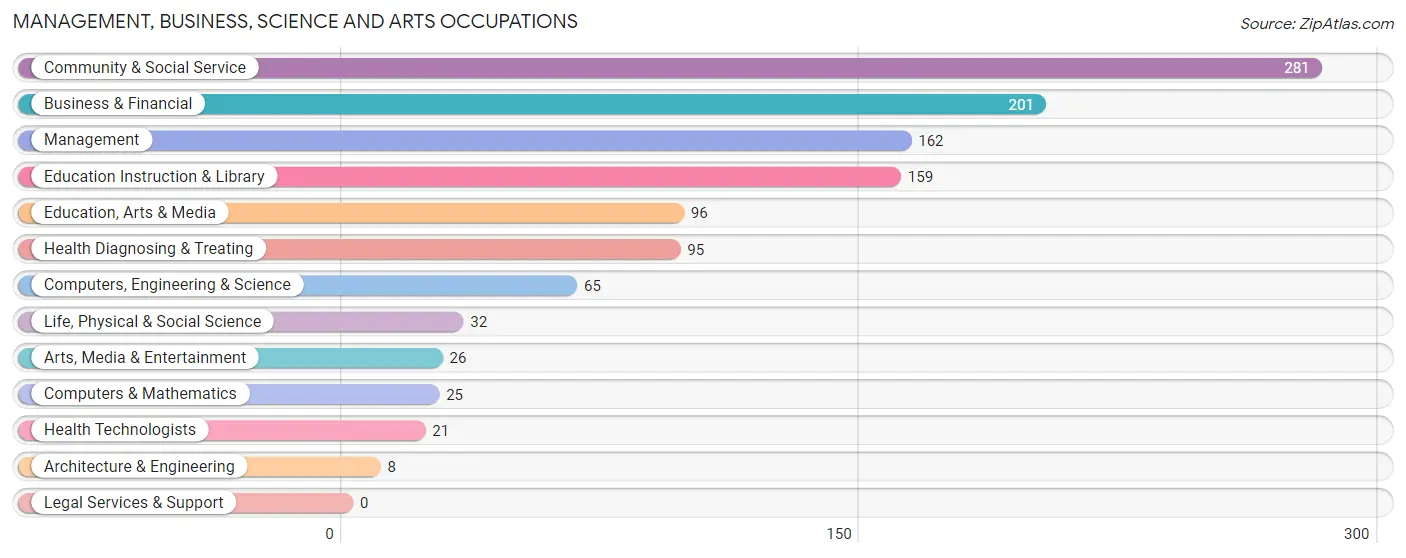
Management, Business, Science and Arts Occupations
The most common Management, Business, Science and Arts occupations in Lemon Hill are Community & Social Service (281 | 4.9%), Business & Financial (201 | 3.5%), Management (162 | 2.9%), Education Instruction & Library (159 | 2.8%), and Education, Arts & Media (96 | 1.7%).
Management, Business, Science and Arts Occupations by Sex
Within the Management, Business, Science and Arts occupations in Lemon Hill, the most male-oriented occupations are Computers & Mathematics (100.0%), Arts, Media & Entertainment (100.0%), and Health Technologists (100.0%), while the most female-oriented occupations are Architecture & Engineering (100.0%), Education, Arts & Media (80.2%), and Education Instruction & Library (73.0%).
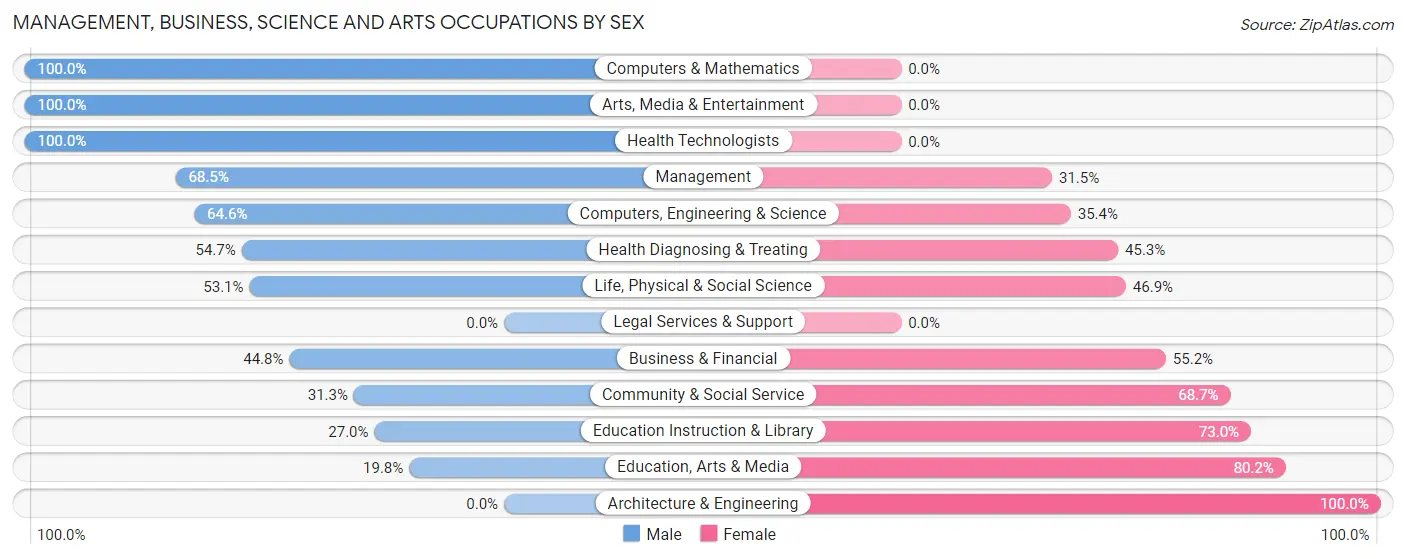
| Occupation | Male | Female |
| Management | 111 (68.5%) | 51 (31.5%) |
| Business & Financial | 90 (44.8%) | 111 (55.2%) |
| Computers, Engineering & Science | 42 (64.6%) | 23 (35.4%) |
| Computers & Mathematics | 25 (100.0%) | 0 (0.0%) |
| Architecture & Engineering | 0 (0.0%) | 8 (100.0%) |
| Life, Physical & Social Science | 17 (53.1%) | 15 (46.9%) |
| Community & Social Service | 88 (31.3%) | 193 (68.7%) |
| Education, Arts & Media | 19 (19.8%) | 77 (80.2%) |
| Legal Services & Support | 0 (0.0%) | 0 (0.0%) |
| Education Instruction & Library | 43 (27.0%) | 116 (73.0%) |
| Arts, Media & Entertainment | 26 (100.0%) | 0 (0.0%) |
| Health Diagnosing & Treating | 52 (54.7%) | 43 (45.3%) |
| Health Technologists | 21 (100.0%) | 0 (0.0%) |
| Total (Category) | 383 (47.6%) | 421 (52.4%) |
| Total (Overall) | 3,183 (56.0%) | 2,501 (44.0%) |
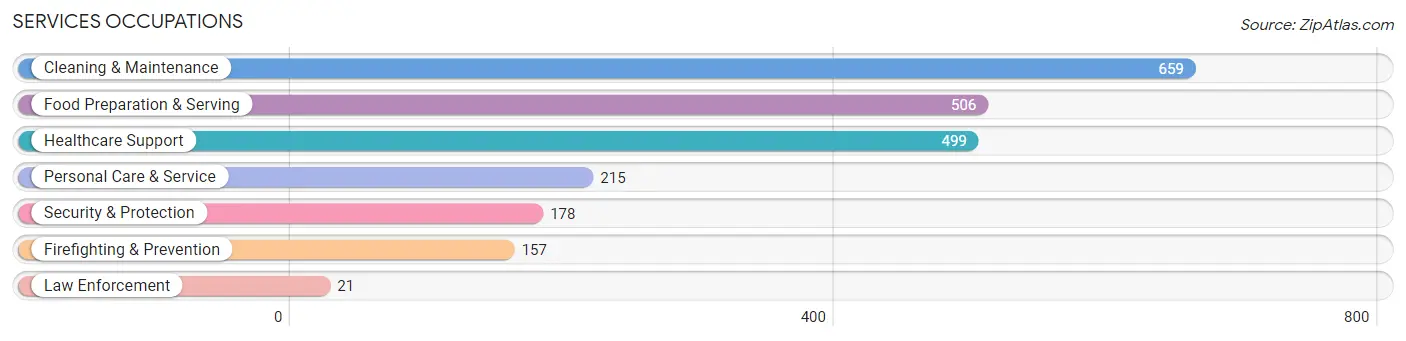
Services Occupations
The most common Services occupations in Lemon Hill are Cleaning & Maintenance (659 | 11.6%), Food Preparation & Serving (506 | 8.9%), Healthcare Support (499 | 8.8%), Personal Care & Service (215 | 3.8%), and Security & Protection (178 | 3.1%).
Services Occupations by Sex
Within the Services occupations in Lemon Hill, the most male-oriented occupations are Law Enforcement (100.0%), Security & Protection (79.8%), and Firefighting & Prevention (77.1%), while the most female-oriented occupations are Personal Care & Service (73.0%), Healthcare Support (69.3%), and Cleaning & Maintenance (46.4%).
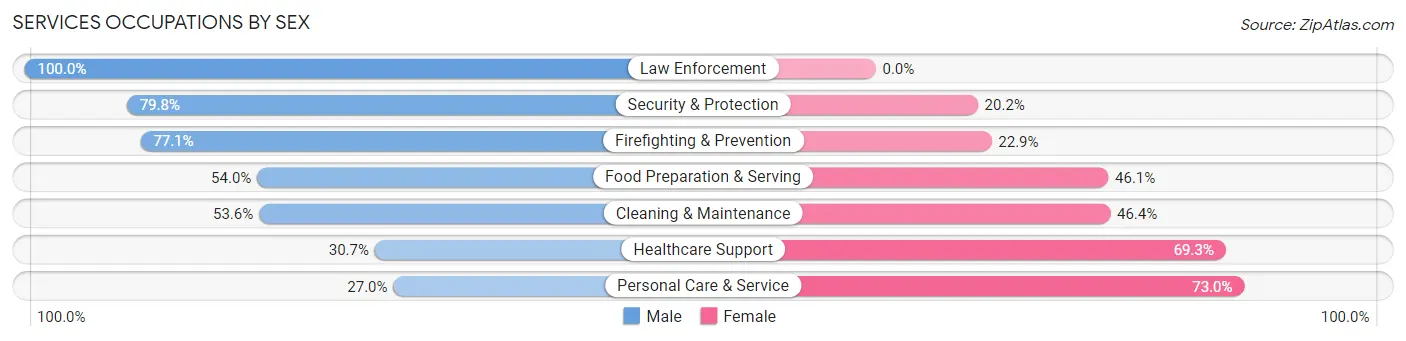
| Occupation | Male | Female |
| Healthcare Support | 153 (30.7%) | 346 (69.3%) |
| Security & Protection | 142 (79.8%) | 36 (20.2%) |
| Firefighting & Prevention | 121 (77.1%) | 36 (22.9%) |
| Law Enforcement | 21 (100.0%) | 0 (0.0%) |
| Food Preparation & Serving | 273 (53.9%) | 233 (46.1%) |
| Cleaning & Maintenance | 353 (53.6%) | 306 (46.4%) |
| Personal Care & Service | 58 (27.0%) | 157 (73.0%) |
| Total (Category) | 979 (47.6%) | 1,078 (52.4%) |
| Total (Overall) | 3,183 (56.0%) | 2,501 (44.0%) |
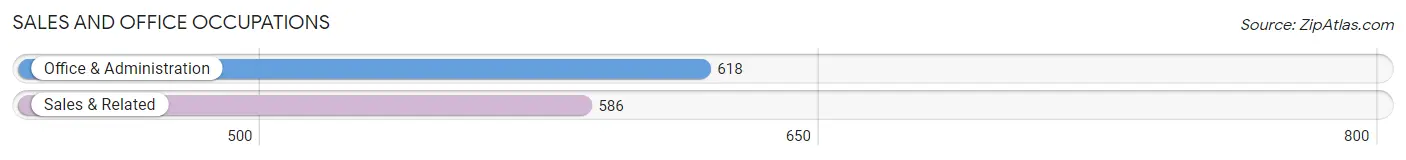
Sales and Office Occupations
The most common Sales and Office occupations in Lemon Hill are Office & Administration (618 | 10.9%), and Sales & Related (586 | 10.3%).
Sales and Office Occupations by Sex
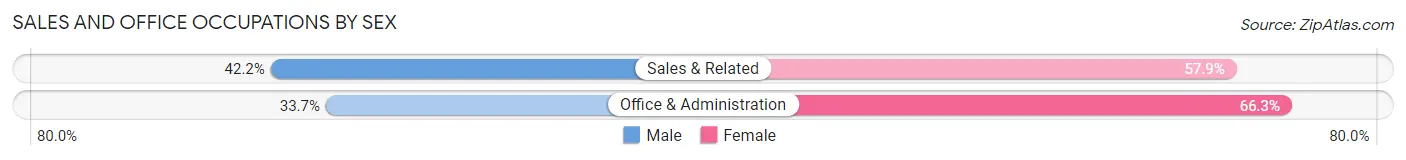
| Occupation | Male | Female |
| Sales & Related | 247 (42.1%) | 339 (57.9%) |
| Office & Administration | 208 (33.7%) | 410 (66.3%) |
| Total (Category) | 455 (37.8%) | 749 (62.2%) |
| Total (Overall) | 3,183 (56.0%) | 2,501 (44.0%) |
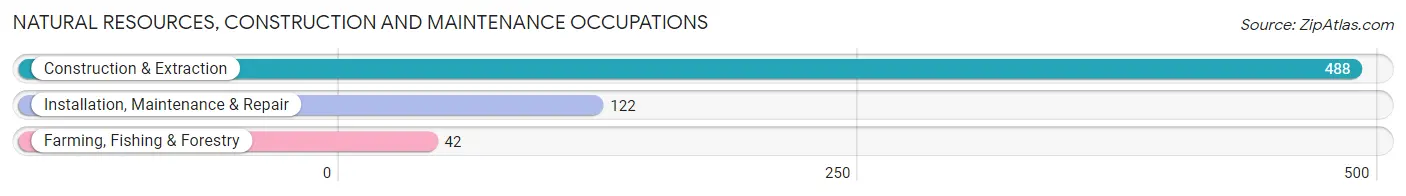
Natural Resources, Construction and Maintenance Occupations
The most common Natural Resources, Construction and Maintenance occupations in Lemon Hill are Construction & Extraction (488 | 8.6%), Installation, Maintenance & Repair (122 | 2.1%), and Farming, Fishing & Forestry (42 | 0.7%).
Natural Resources, Construction and Maintenance Occupations by Sex
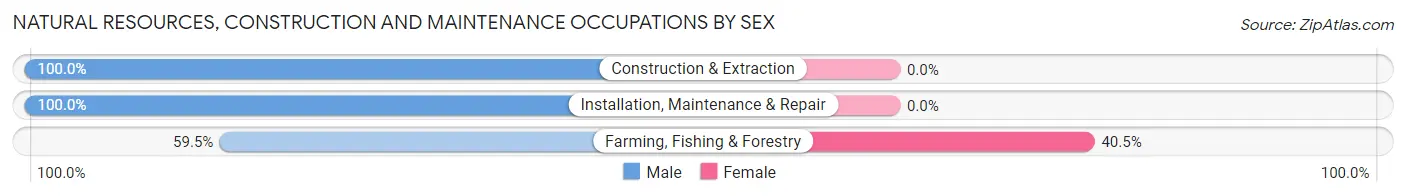
| Occupation | Male | Female |
| Farming, Fishing & Forestry | 25 (59.5%) | 17 (40.5%) |
| Construction & Extraction | 488 (100.0%) | 0 (0.0%) |
| Installation, Maintenance & Repair | 122 (100.0%) | 0 (0.0%) |
| Total (Category) | 635 (97.4%) | 17 (2.6%) |
| Total (Overall) | 3,183 (56.0%) | 2,501 (44.0%) |
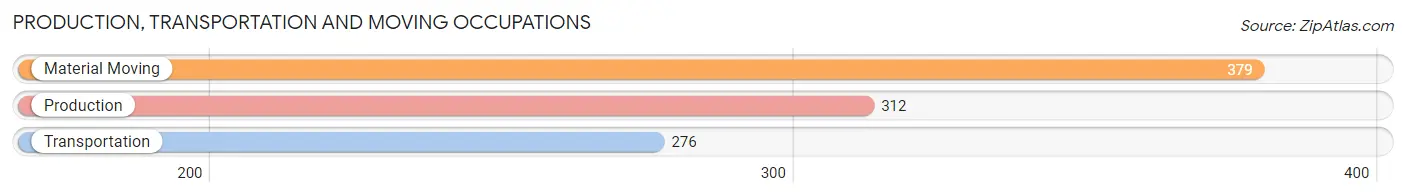
Production, Transportation and Moving Occupations
The most common Production, Transportation and Moving occupations in Lemon Hill are Material Moving (379 | 6.7%), Production (312 | 5.5%), and Transportation (276 | 4.9%).
Production, Transportation and Moving Occupations by Sex
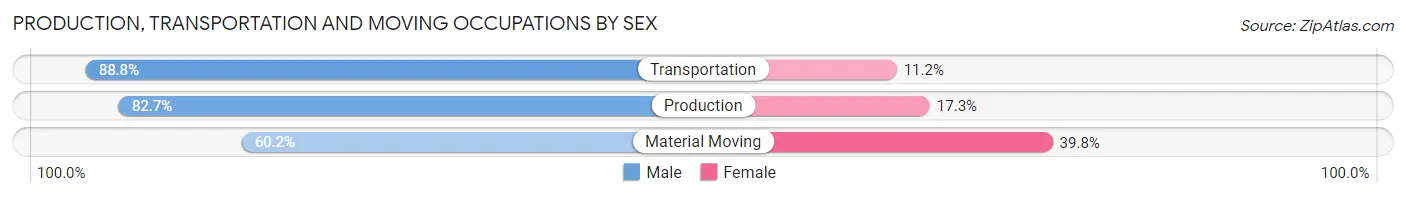
| Occupation | Male | Female |
| Production | 258 (82.7%) | 54 (17.3%) |
| Transportation | 245 (88.8%) | 31 (11.2%) |
| Material Moving | 228 (60.2%) | 151 (39.8%) |
| Total (Category) | 731 (75.6%) | 236 (24.4%) |
| Total (Overall) | 3,183 (56.0%) | 2,501 (44.0%) |
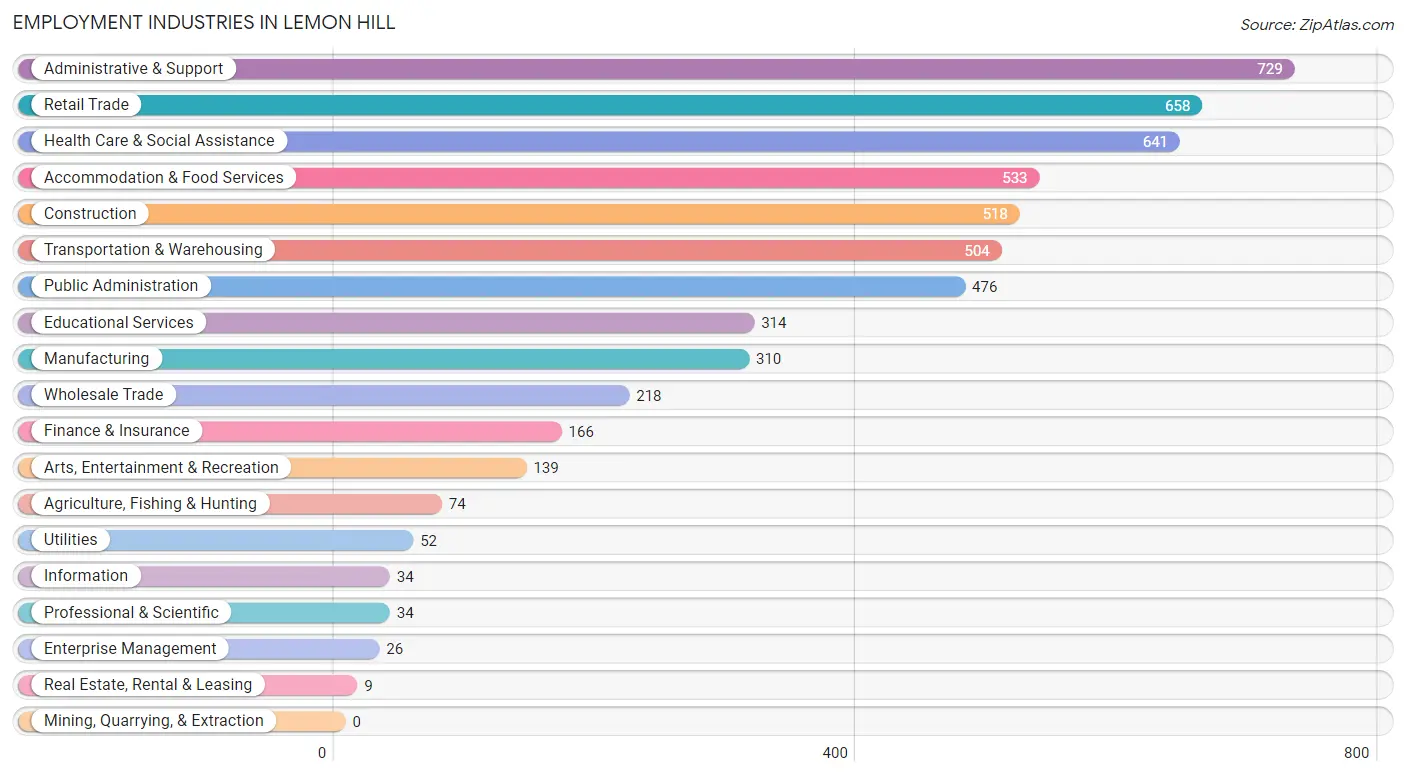
Employment Industries by Sex in Lemon Hill
Employment Industries in Lemon Hill
The major employment industries in Lemon Hill include Administrative & Support (729 | 12.8%), Retail Trade (658 | 11.6%), Health Care & Social Assistance (641 | 11.3%), Accommodation & Food Services (533 | 9.4%), and Construction (518 | 9.1%).
Employment Industries by Sex in Lemon Hill
The Lemon Hill industries that see more men than women are Construction (100.0%), Wholesale Trade (94.0%), and Professional & Scientific (79.4%), whereas the industries that tend to have a higher number of women are Real Estate, Rental & Leasing (100.0%), Enterprise Management (100.0%), and Finance & Insurance (77.7%).
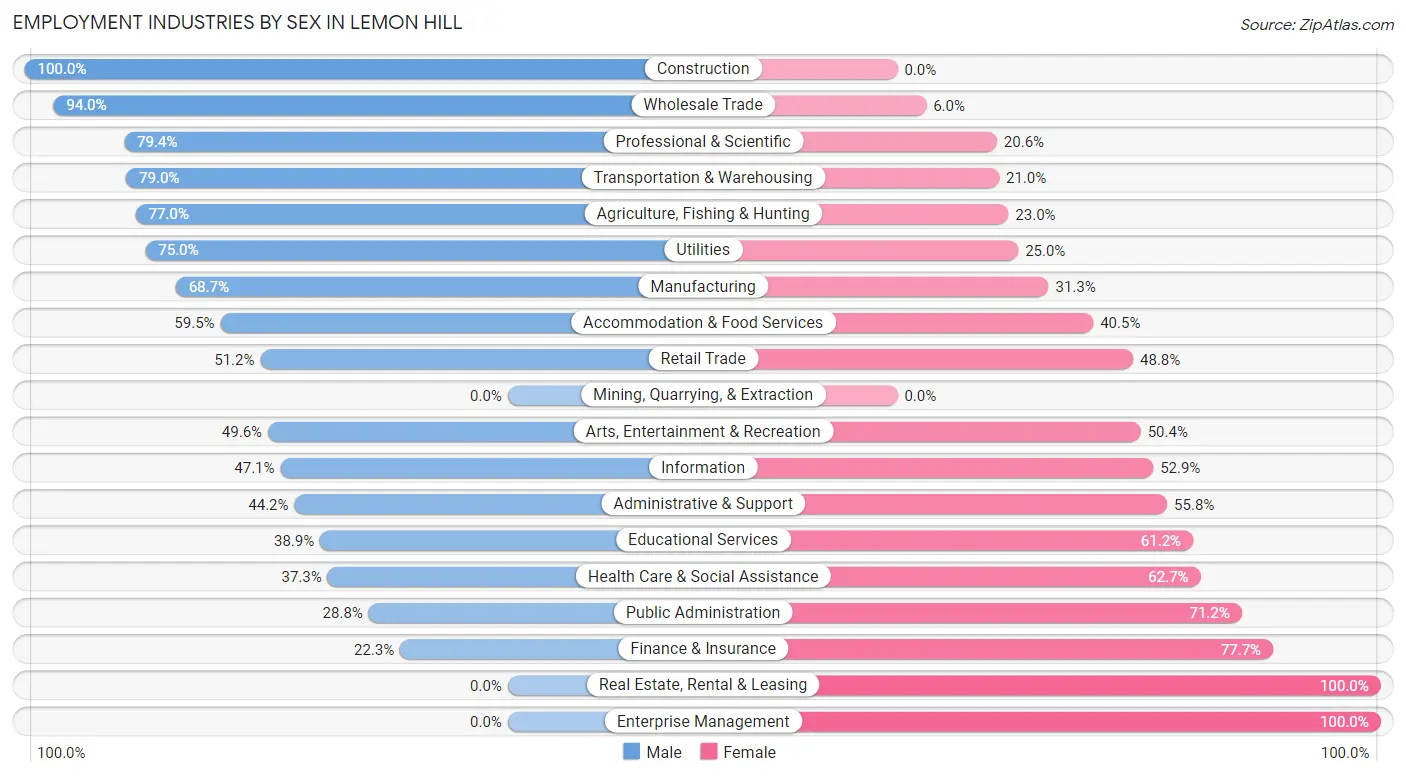
| Industry | Male | Female |
| Agriculture, Fishing & Hunting | 57 (77.0%) | 17 (23.0%) |
| Mining, Quarrying, & Extraction | 0 (0.0%) | 0 (0.0%) |
| Construction | 518 (100.0%) | 0 (0.0%) |
| Manufacturing | 213 (68.7%) | 97 (31.3%) |
| Wholesale Trade | 205 (94.0%) | 13 (6.0%) |
| Retail Trade | 337 (51.2%) | 321 (48.8%) |
| Transportation & Warehousing | 398 (79.0%) | 106 (21.0%) |
| Utilities | 39 (75.0%) | 13 (25.0%) |
| Information | 16 (47.1%) | 18 (52.9%) |
| Finance & Insurance | 37 (22.3%) | 129 (77.7%) |
| Real Estate, Rental & Leasing | 0 (0.0%) | 9 (100.0%) |
| Professional & Scientific | 27 (79.4%) | 7 (20.6%) |
| Enterprise Management | 0 (0.0%) | 26 (100.0%) |
| Administrative & Support | 322 (44.2%) | 407 (55.8%) |
| Educational Services | 122 (38.9%) | 192 (61.2%) |
| Health Care & Social Assistance | 239 (37.3%) | 402 (62.7%) |
| Arts, Entertainment & Recreation | 69 (49.6%) | 70 (50.4%) |
| Accommodation & Food Services | 317 (59.5%) | 216 (40.5%) |
| Public Administration | 137 (28.8%) | 339 (71.2%) |
| Total | 3,183 (56.0%) | 2,501 (44.0%) |
Education in Lemon Hill
School Enrollment in Lemon Hill
The most common levels of schooling among the 4,912 students in Lemon Hill are elementary school (1,261 | 25.7%), middle school (1,171 | 23.8%), and college / undergraduate (932 | 19.0%).
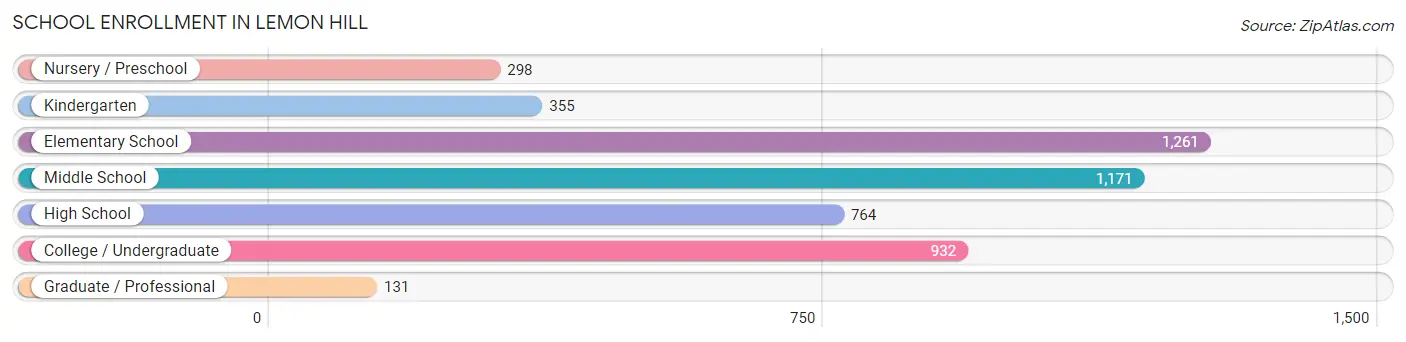
| School Level | # Students | % Students |
| Nursery / Preschool | 298 | 6.1% |
| Kindergarten | 355 | 7.2% |
| Elementary School | 1,261 | 25.7% |
| Middle School | 1,171 | 23.8% |
| High School | 764 | 15.5% |
| College / Undergraduate | 932 | 19.0% |
| Graduate / Professional | 131 | 2.7% |
| Total | 4,912 | 100.0% |
School Enrollment by Age by Funding Source in Lemon Hill
Out of a total of 4,912 students who are enrolled in schools in Lemon Hill, 329 (6.7%) attend a private institution, while the remaining 4,583 (93.3%) are enrolled in public schools. The age group of 3 to 4 year olds has the highest likelihood of being enrolled in private schools, with 25 (12.1% in the age bracket) enrolled. Conversely, the age group of 18 to 19 year olds has the lowest likelihood of being enrolled in a private school, with 271 (100.0% in the age bracket) attending a public institution.
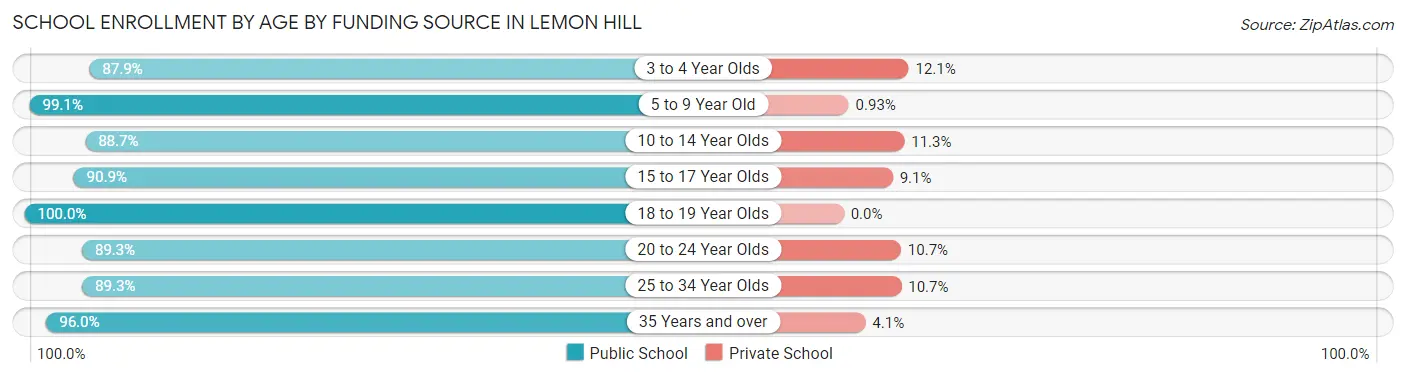
| Age Bracket | Public School | Private School |
| 3 to 4 Year Olds | 182 (87.9%) | 25 (12.1%) |
| 5 to 9 Year Old | 1,606 (99.1%) | 15 (0.9%) |
| 10 to 14 Year Olds | 1,202 (88.7%) | 153 (11.3%) |
| 15 to 17 Year Olds | 547 (90.9%) | 55 (9.1%) |
| 18 to 19 Year Olds | 271 (100.0%) | 0 (0.0%) |
| 20 to 24 Year Olds | 352 (89.3%) | 42 (10.7%) |
| 25 to 34 Year Olds | 258 (89.3%) | 31 (10.7%) |
| 35 Years and over | 166 (96.0%) | 7 (4.1%) |
| Total | 4,583 (93.3%) | 329 (6.7%) |
Educational Attainment by Field of Study in Lemon Hill
Business (168 | 22.1%), liberal arts & history (83 | 10.9%), bio, nature & agricultural (80 | 10.5%), science & technology (72 | 9.5%), and education (69 | 9.1%) are the most common fields of study among 760 individuals in Lemon Hill who have obtained a bachelor's degree or higher.
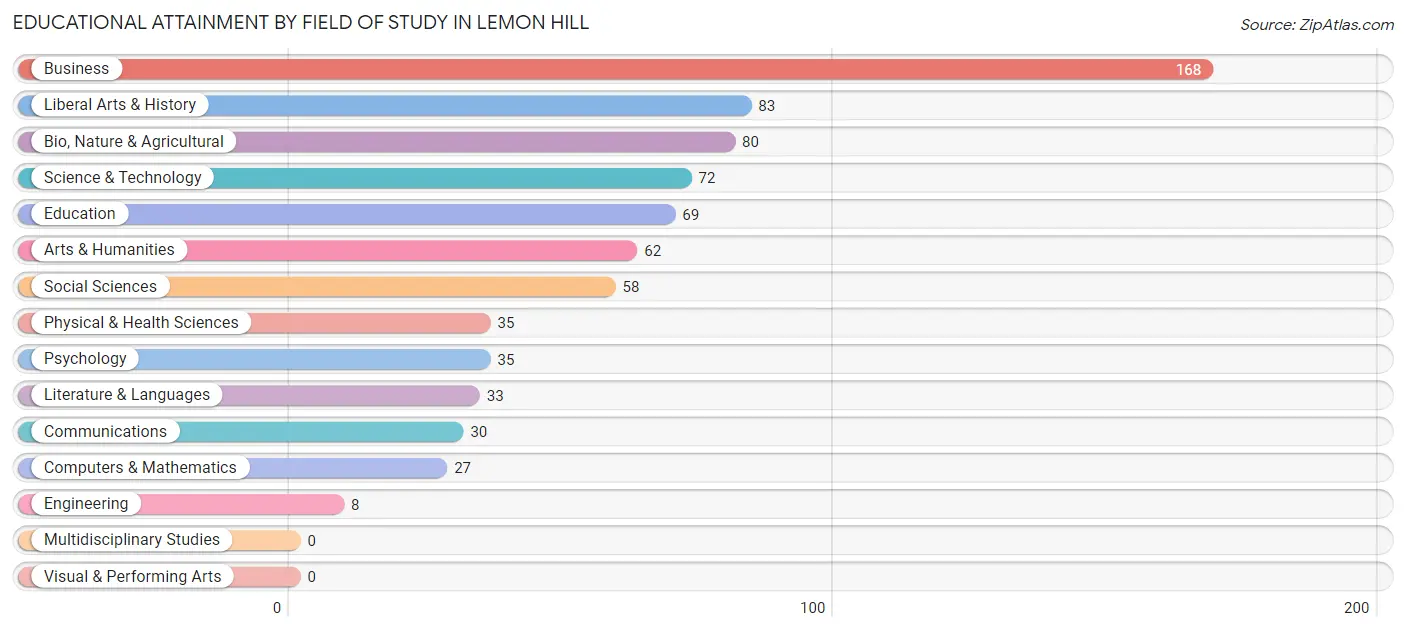
| Field of Study | # Graduates | % Graduates |
| Computers & Mathematics | 27 | 3.5% |
| Bio, Nature & Agricultural | 80 | 10.5% |
| Physical & Health Sciences | 35 | 4.6% |
| Psychology | 35 | 4.6% |
| Social Sciences | 58 | 7.6% |
| Engineering | 8 | 1.1% |
| Multidisciplinary Studies | 0 | 0.0% |
| Science & Technology | 72 | 9.5% |
| Business | 168 | 22.1% |
| Education | 69 | 9.1% |
| Literature & Languages | 33 | 4.3% |
| Liberal Arts & History | 83 | 10.9% |
| Visual & Performing Arts | 0 | 0.0% |
| Communications | 30 | 4.0% |
| Arts & Humanities | 62 | 8.2% |
| Total | 760 | 100.0% |
Transportation & Commute in Lemon Hill
Vehicle Availability by Sex in Lemon Hill
The most prevalent vehicle ownership categories in Lemon Hill are males with 2 vehicles (1,586, accounting for 50.4%) and females with 2 vehicles (1,156, making up 65.0%).
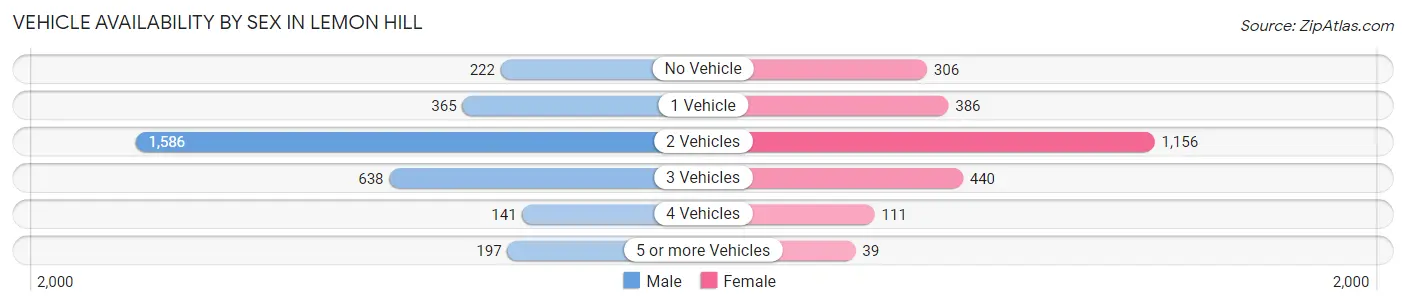
| Vehicles Available | Male | Female |
| No Vehicle | 222 (7.0%) | 306 (12.6%) |
| 1 Vehicle | 365 (11.6%) | 386 (15.8%) |
| 2 Vehicles | 1,586 (50.4%) | 1,156 (47.4%) |
| 3 Vehicles | 638 (20.3%) | 440 (18.0%) |
| 4 Vehicles | 141 (4.5%) | 111 (4.5%) |
| 5 or more Vehicles | 197 (6.3%) | 39 (1.6%) |
| Total | 3,149 (100.0%) | 2,438 (100.0%) |
Commute Time in Lemon Hill
The most frequently occuring commute durations in Lemon Hill are 15 to 19 minutes (1,206 commuters, 23.6%), 20 to 24 minutes (936 commuters, 18.3%), and 30 to 34 minutes (681 commuters, 13.3%).
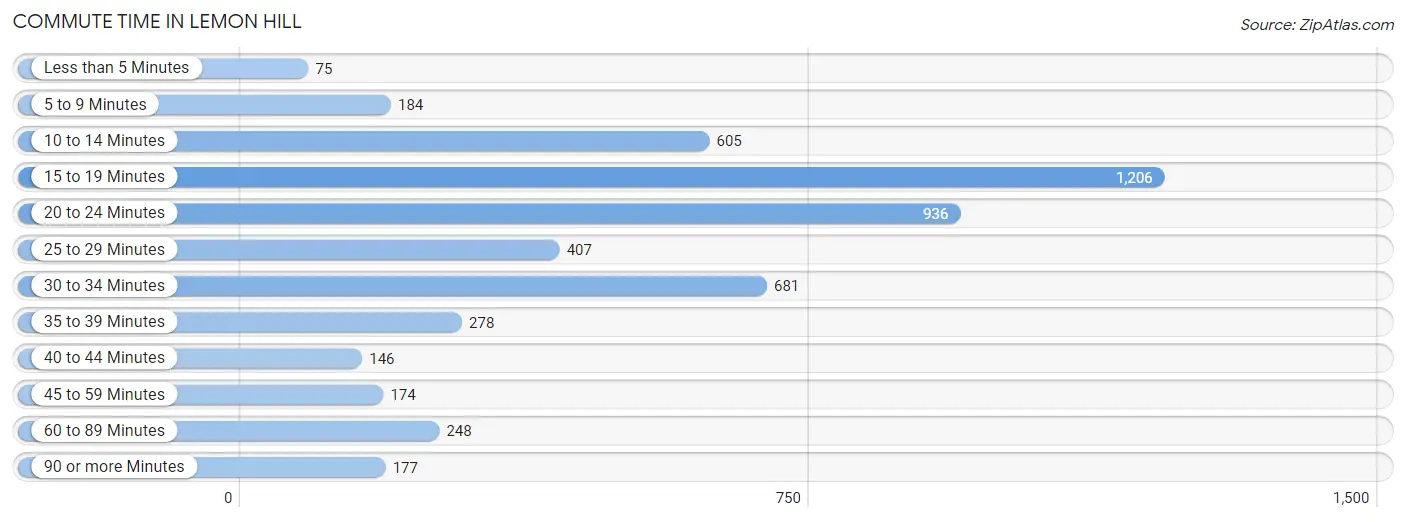
| Commute Time | # Commuters | % Commuters |
| Less than 5 Minutes | 75 | 1.5% |
| 5 to 9 Minutes | 184 | 3.6% |
| 10 to 14 Minutes | 605 | 11.8% |
| 15 to 19 Minutes | 1,206 | 23.6% |
| 20 to 24 Minutes | 936 | 18.3% |
| 25 to 29 Minutes | 407 | 8.0% |
| 30 to 34 Minutes | 681 | 13.3% |
| 35 to 39 Minutes | 278 | 5.4% |
| 40 to 44 Minutes | 146 | 2.9% |
| 45 to 59 Minutes | 174 | 3.4% |
| 60 to 89 Minutes | 248 | 4.9% |
| 90 or more Minutes | 177 | 3.5% |
Commute Time by Sex in Lemon Hill
The most common commute times in Lemon Hill are 15 to 19 minutes (730 commuters, 25.3%) for males and 15 to 19 minutes (476 commuters, 21.3%) for females.
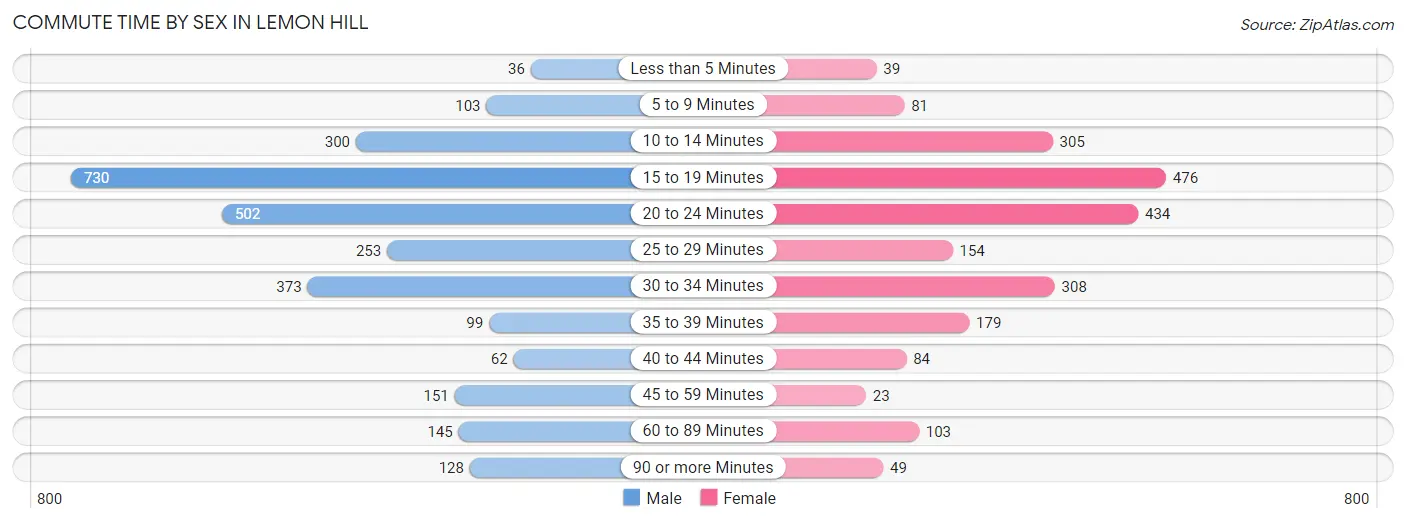
| Commute Time | Male | Female |
| Less than 5 Minutes | 36 (1.3%) | 39 (1.7%) |
| 5 to 9 Minutes | 103 (3.6%) | 81 (3.6%) |
| 10 to 14 Minutes | 300 (10.4%) | 305 (13.7%) |
| 15 to 19 Minutes | 730 (25.3%) | 476 (21.3%) |
| 20 to 24 Minutes | 502 (17.4%) | 434 (19.4%) |
| 25 to 29 Minutes | 253 (8.8%) | 154 (6.9%) |
| 30 to 34 Minutes | 373 (12.9%) | 308 (13.8%) |
| 35 to 39 Minutes | 99 (3.4%) | 179 (8.0%) |
| 40 to 44 Minutes | 62 (2.1%) | 84 (3.8%) |
| 45 to 59 Minutes | 151 (5.2%) | 23 (1.0%) |
| 60 to 89 Minutes | 145 (5.0%) | 103 (4.6%) |
| 90 or more Minutes | 128 (4.4%) | 49 (2.2%) |
Time of Departure to Work by Sex in Lemon Hill
The most frequent times of departure to work in Lemon Hill are 7:00 AM to 7:29 AM (356, 12.3%) for males and 7:00 AM to 7:29 AM (383, 17.1%) for females.
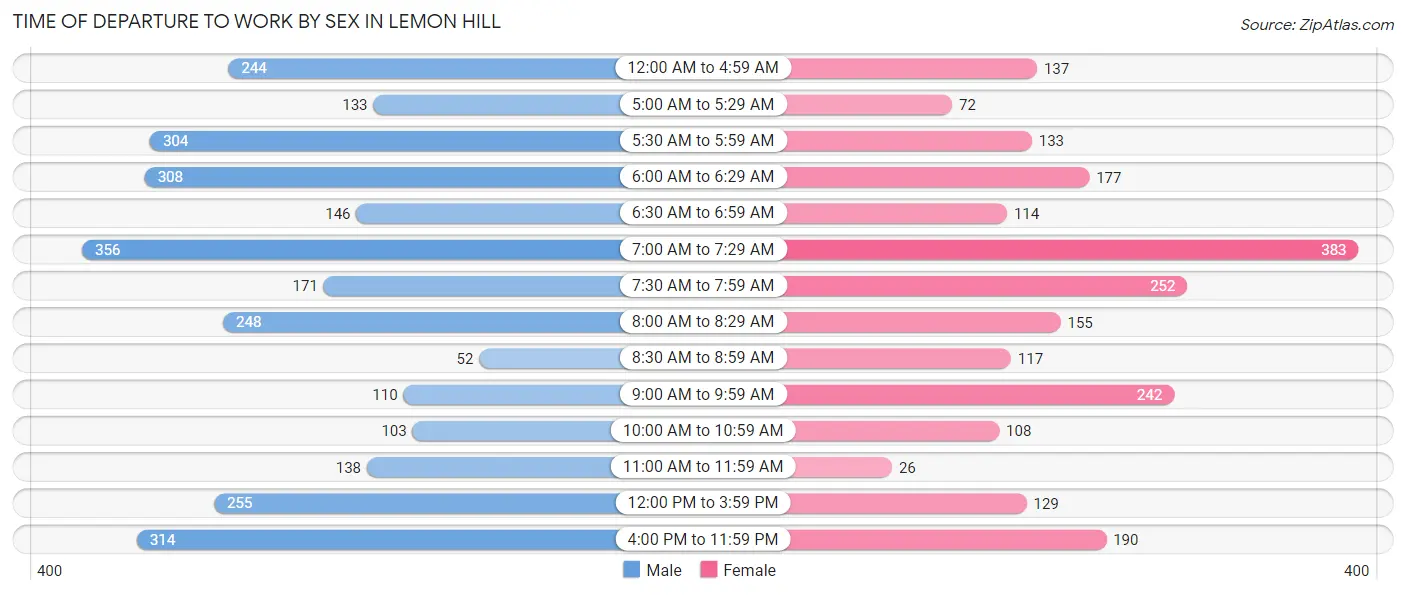
| Time of Departure | Male | Female |
| 12:00 AM to 4:59 AM | 244 (8.5%) | 137 (6.1%) |
| 5:00 AM to 5:29 AM | 133 (4.6%) | 72 (3.2%) |
| 5:30 AM to 5:59 AM | 304 (10.5%) | 133 (5.9%) |
| 6:00 AM to 6:29 AM | 308 (10.7%) | 177 (7.9%) |
| 6:30 AM to 6:59 AM | 146 (5.1%) | 114 (5.1%) |
| 7:00 AM to 7:29 AM | 356 (12.3%) | 383 (17.1%) |
| 7:30 AM to 7:59 AM | 171 (5.9%) | 252 (11.3%) |
| 8:00 AM to 8:29 AM | 248 (8.6%) | 155 (6.9%) |
| 8:30 AM to 8:59 AM | 52 (1.8%) | 117 (5.2%) |
| 9:00 AM to 9:59 AM | 110 (3.8%) | 242 (10.8%) |
| 10:00 AM to 10:59 AM | 103 (3.6%) | 108 (4.8%) |
| 11:00 AM to 11:59 AM | 138 (4.8%) | 26 (1.2%) |
| 12:00 PM to 3:59 PM | 255 (8.8%) | 129 (5.8%) |
| 4:00 PM to 11:59 PM | 314 (10.9%) | 190 (8.5%) |
| Total | 2,882 (100.0%) | 2,235 (100.0%) |
Housing Occupancy in Lemon Hill
Occupancy by Ownership in Lemon Hill
Of the total 4,517 dwellings in Lemon Hill, owner-occupied units account for 1,754 (38.8%), while renter-occupied units make up 2,763 (61.2%).
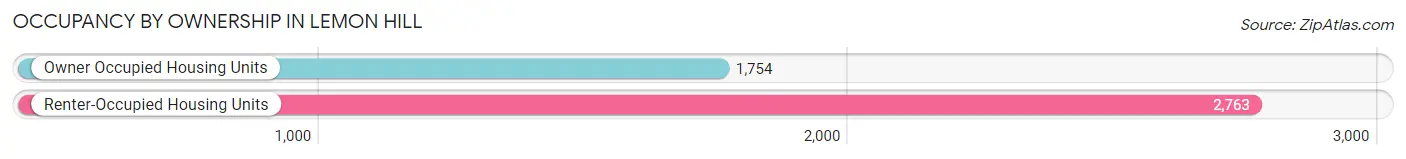
| Occupancy | # Housing Units | % Housing Units |
| Owner Occupied Housing Units | 1,754 | 38.8% |
| Renter-Occupied Housing Units | 2,763 | 61.2% |
| Total Occupied Housing Units | 4,517 | 100.0% |
Occupancy by Household Size in Lemon Hill
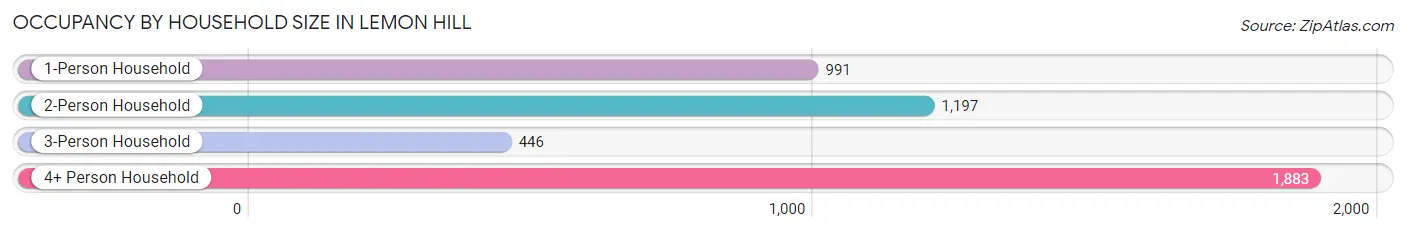
| Household Size | # Housing Units | % Housing Units |
| 1-Person Household | 991 | 21.9% |
| 2-Person Household | 1,197 | 26.5% |
| 3-Person Household | 446 | 9.9% |
| 4+ Person Household | 1,883 | 41.7% |
| Total Housing Units | 4,517 | 100.0% |
Occupancy by Ownership by Household Size in Lemon Hill
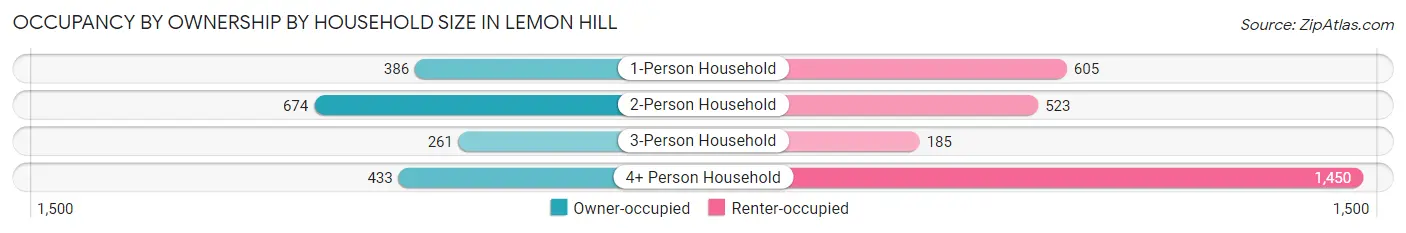
| Household Size | Owner-occupied | Renter-occupied |
| 1-Person Household | 386 (39.0%) | 605 (61.1%) |
| 2-Person Household | 674 (56.3%) | 523 (43.7%) |
| 3-Person Household | 261 (58.5%) | 185 (41.5%) |
| 4+ Person Household | 433 (23.0%) | 1,450 (77.0%) |
| Total Housing Units | 1,754 (38.8%) | 2,763 (61.2%) |
Occupancy by Educational Attainment in Lemon Hill
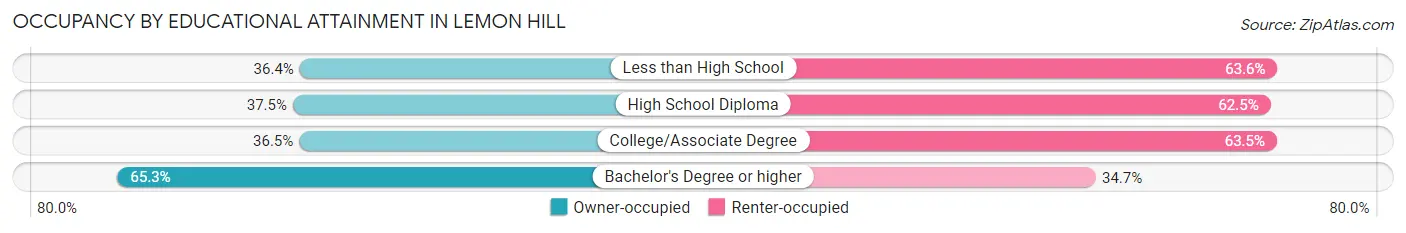
| Household Size | Owner-occupied | Renter-occupied |
| Less than High School | 491 (36.4%) | 859 (63.6%) |
| High School Diploma | 418 (37.5%) | 698 (62.5%) |
| College/Associate Degree | 625 (36.5%) | 1,089 (63.5%) |
| Bachelor's Degree or higher | 220 (65.3%) | 117 (34.7%) |
Occupancy by Age of Householder in Lemon Hill
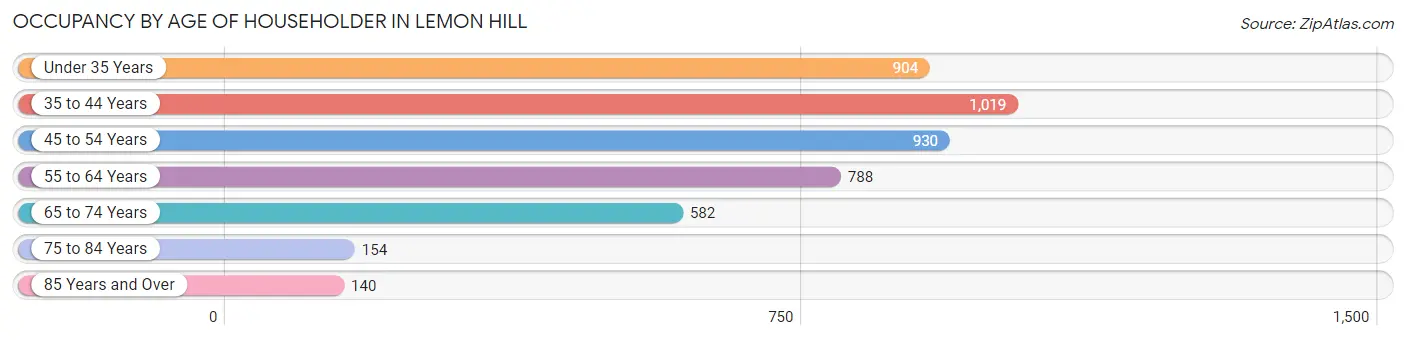
| Age Bracket | # Households | % Households |
| Under 35 Years | 904 | 20.0% |
| 35 to 44 Years | 1,019 | 22.6% |
| 45 to 54 Years | 930 | 20.6% |
| 55 to 64 Years | 788 | 17.4% |
| 65 to 74 Years | 582 | 12.9% |
| 75 to 84 Years | 154 | 3.4% |
| 85 Years and Over | 140 | 3.1% |
| Total | 4,517 | 100.0% |
Housing Finances in Lemon Hill
Median Income by Occupancy in Lemon Hill
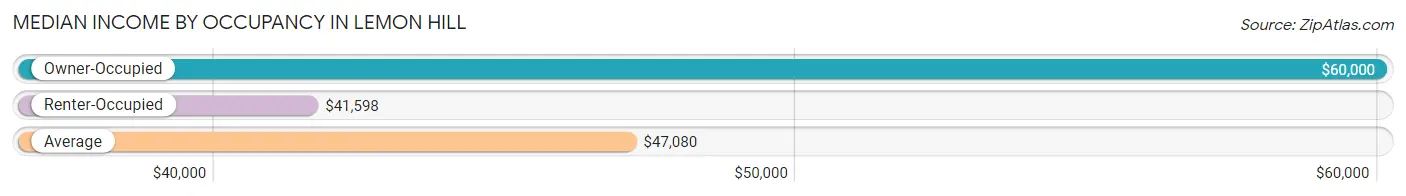
| Occupancy Type | # Households | Median Income |
| Owner-Occupied | 1,754 (38.8%) | $60,000 |
| Renter-Occupied | 2,763 (61.2%) | $41,598 |
| Average | 4,517 (100.0%) | $47,080 |
Occupancy by Householder Income Bracket in Lemon Hill
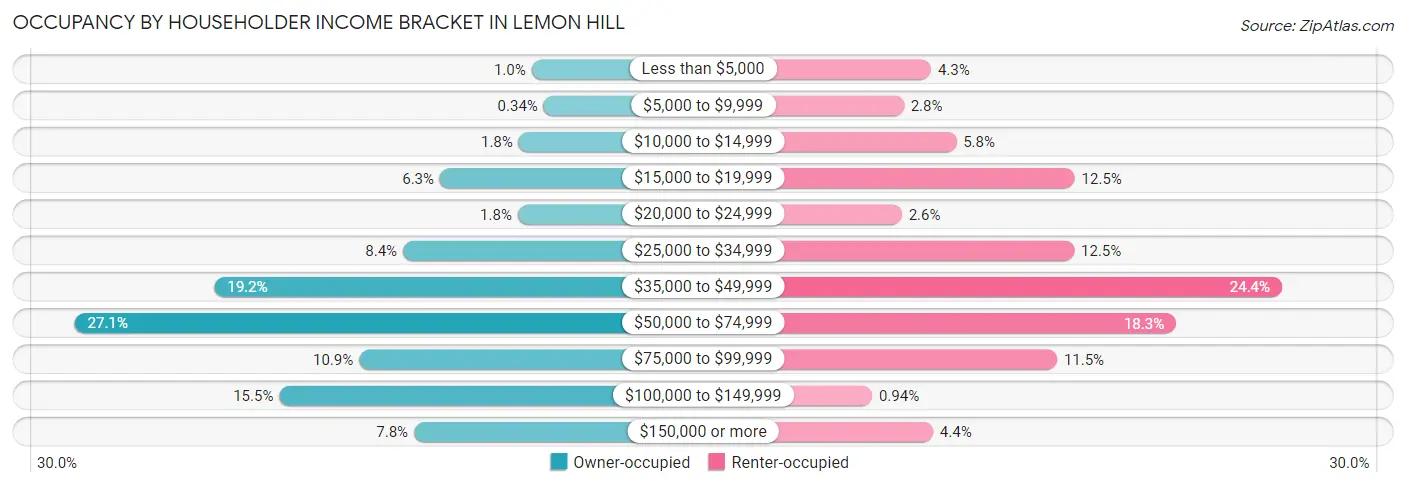
| Income Bracket | Owner-occupied | Renter-occupied |
| Less than $5,000 | 18 (1.0%) | 119 (4.3%) |
| $5,000 to $9,999 | 6 (0.3%) | 76 (2.8%) |
| $10,000 to $14,999 | 31 (1.8%) | 159 (5.8%) |
| $15,000 to $19,999 | 110 (6.3%) | 346 (12.5%) |
| $20,000 to $24,999 | 32 (1.8%) | 73 (2.6%) |
| $25,000 to $34,999 | 147 (8.4%) | 345 (12.5%) |
| $35,000 to $49,999 | 336 (19.2%) | 673 (24.4%) |
| $50,000 to $74,999 | 476 (27.1%) | 506 (18.3%) |
| $75,000 to $99,999 | 191 (10.9%) | 318 (11.5%) |
| $100,000 to $149,999 | 271 (15.4%) | 26 (0.9%) |
| $150,000 or more | 136 (7.7%) | 122 (4.4%) |
| Total | 1,754 (100.0%) | 2,763 (100.0%) |
Monthly Housing Cost Tiers in Lemon Hill
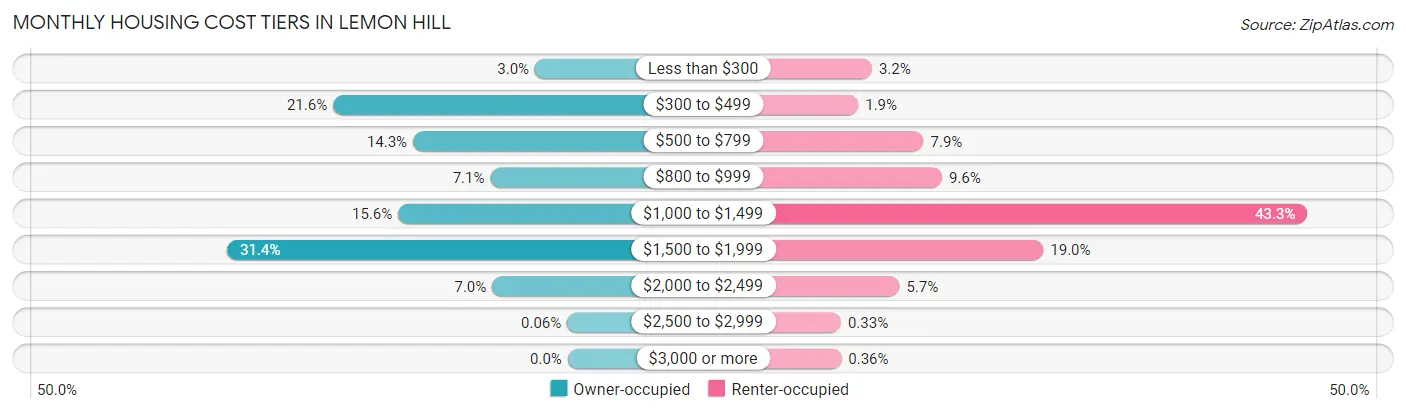
| Monthly Cost | Owner-occupied | Renter-occupied |
| Less than $300 | 53 (3.0%) | 88 (3.2%) |
| $300 to $499 | 379 (21.6%) | 53 (1.9%) |
| $500 to $799 | 250 (14.2%) | 219 (7.9%) |
| $800 to $999 | 125 (7.1%) | 266 (9.6%) |
| $1,000 to $1,499 | 274 (15.6%) | 1,195 (43.2%) |
| $1,500 to $1,999 | 550 (31.4%) | 524 (19.0%) |
| $2,000 to $2,499 | 122 (7.0%) | 158 (5.7%) |
| $2,500 to $2,999 | 1 (0.1%) | 9 (0.3%) |
| $3,000 or more | 0 (0.0%) | 10 (0.4%) |
| Total | 1,754 (100.0%) | 2,763 (100.0%) |
Physical Housing Characteristics in Lemon Hill
Housing Structures in Lemon Hill
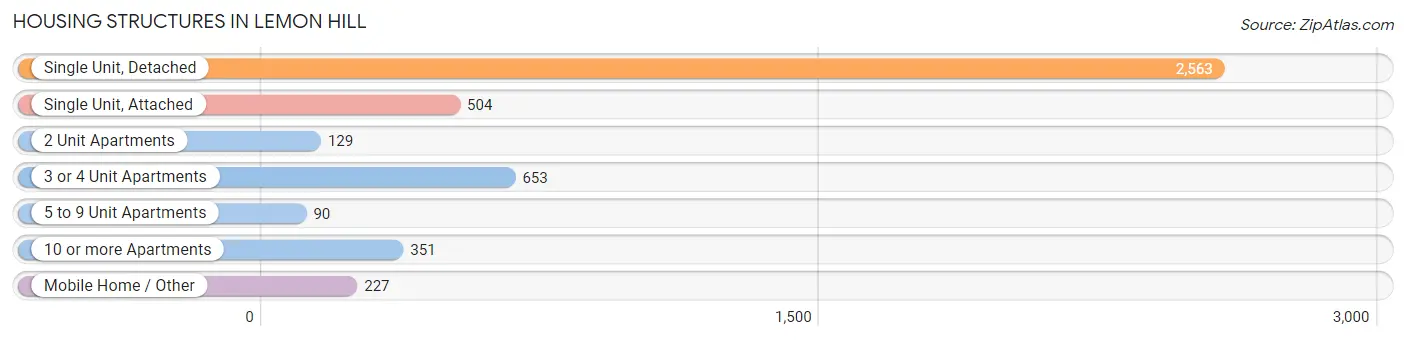
| Structure Type | # Housing Units | % Housing Units |
| Single Unit, Detached | 2,563 | 56.7% |
| Single Unit, Attached | 504 | 11.2% |
| 2 Unit Apartments | 129 | 2.9% |
| 3 or 4 Unit Apartments | 653 | 14.5% |
| 5 to 9 Unit Apartments | 90 | 2.0% |
| 10 or more Apartments | 351 | 7.8% |
| Mobile Home / Other | 227 | 5.0% |
| Total | 4,517 | 100.0% |
Housing Structures by Occupancy in Lemon Hill
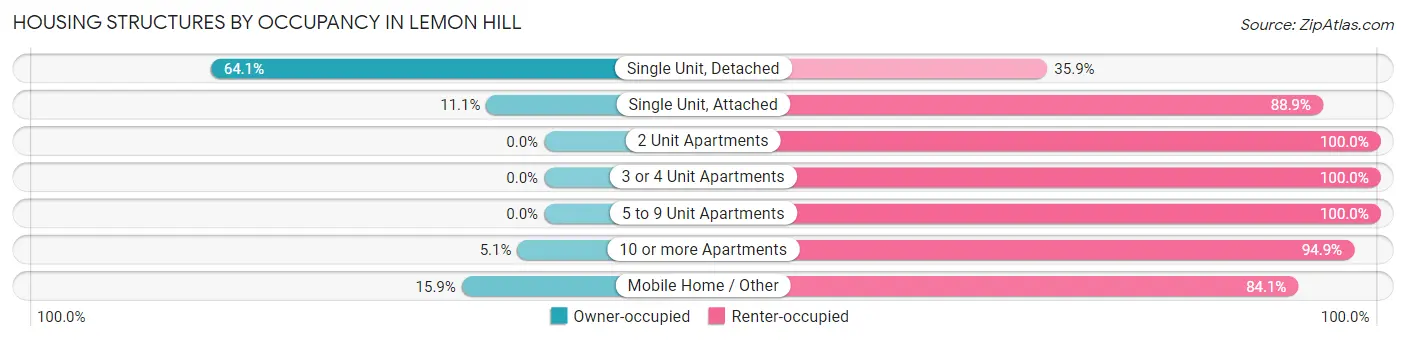
| Structure Type | Owner-occupied | Renter-occupied |
| Single Unit, Detached | 1,644 (64.1%) | 919 (35.9%) |
| Single Unit, Attached | 56 (11.1%) | 448 (88.9%) |
| 2 Unit Apartments | 0 (0.0%) | 129 (100.0%) |
| 3 or 4 Unit Apartments | 0 (0.0%) | 653 (100.0%) |
| 5 to 9 Unit Apartments | 0 (0.0%) | 90 (100.0%) |
| 10 or more Apartments | 18 (5.1%) | 333 (94.9%) |
| Mobile Home / Other | 36 (15.9%) | 191 (84.1%) |
| Total | 1,754 (38.8%) | 2,763 (61.2%) |
Housing Structures by Number of Rooms in Lemon Hill
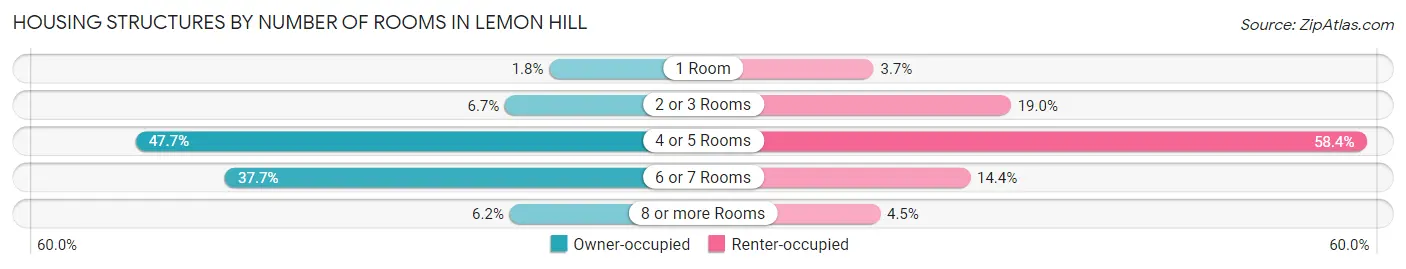
| Number of Rooms | Owner-occupied | Renter-occupied |
| 1 Room | 31 (1.8%) | 103 (3.7%) |
| 2 or 3 Rooms | 117 (6.7%) | 524 (19.0%) |
| 4 or 5 Rooms | 836 (47.7%) | 1,614 (58.4%) |
| 6 or 7 Rooms | 662 (37.7%) | 399 (14.4%) |
| 8 or more Rooms | 108 (6.2%) | 123 (4.4%) |
| Total | 1,754 (100.0%) | 2,763 (100.0%) |
Housing Structure by Heating Type in Lemon Hill
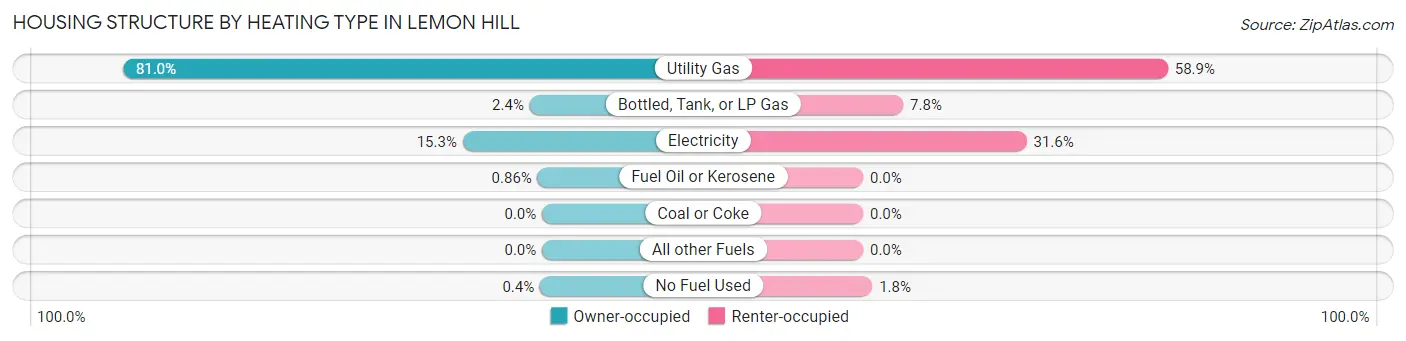
| Heating Type | Owner-occupied | Renter-occupied |
| Utility Gas | 1,421 (81.0%) | 1,627 (58.9%) |
| Bottled, Tank, or LP Gas | 42 (2.4%) | 214 (7.7%) |
| Electricity | 269 (15.3%) | 873 (31.6%) |
| Fuel Oil or Kerosene | 15 (0.9%) | 0 (0.0%) |
| Coal or Coke | 0 (0.0%) | 0 (0.0%) |
| All other Fuels | 0 (0.0%) | 0 (0.0%) |
| No Fuel Used | 7 (0.4%) | 49 (1.8%) |
| Total | 1,754 (100.0%) | 2,763 (100.0%) |
Household Vehicle Usage in Lemon Hill
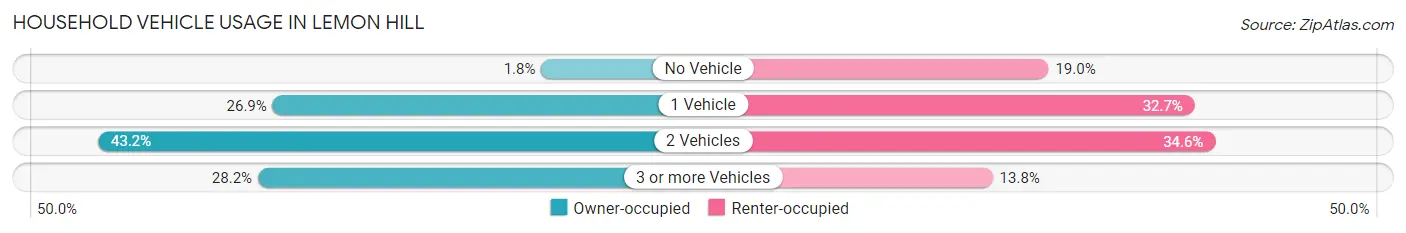
| Vehicles per Household | Owner-occupied | Renter-occupied |
| No Vehicle | 31 (1.8%) | 525 (19.0%) |
| 1 Vehicle | 471 (26.9%) | 902 (32.7%) |
| 2 Vehicles | 757 (43.2%) | 955 (34.6%) |
| 3 or more Vehicles | 495 (28.2%) | 381 (13.8%) |
| Total | 1,754 (100.0%) | 2,763 (100.0%) |
Real Estate & Mortgages in Lemon Hill
Real Estate and Mortgage Overview in Lemon Hill
| Characteristic | Without Mortgage | With Mortgage |
| Housing Units | 677 | 1,077 |
| Median Property Value | $251,900 | $317,400 |
| Median Household Income | $53,036 | $86 |
| Monthly Housing Costs | $447 | $0 |
| Real Estate Taxes | $1,342 | $31 |
Property Value by Mortgage Status in Lemon Hill
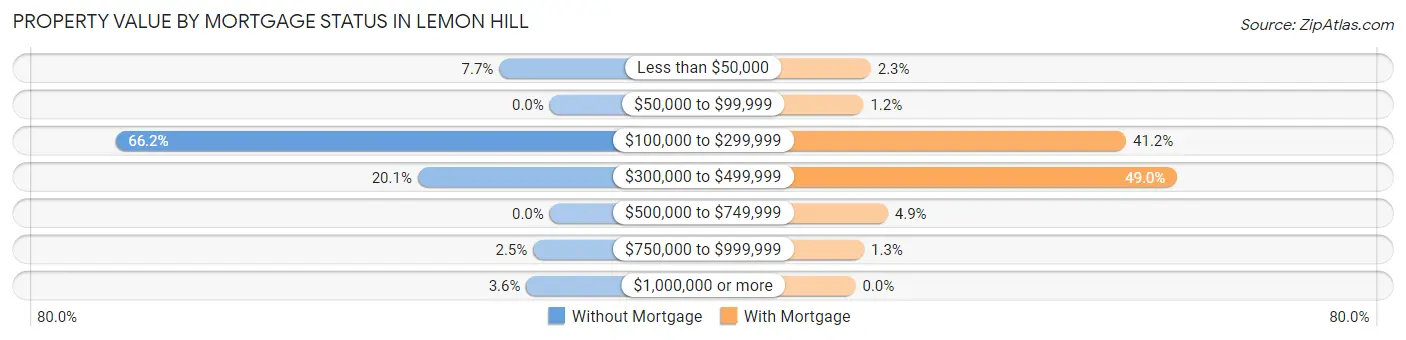
| Property Value | Without Mortgage | With Mortgage |
| Less than $50,000 | 52 (7.7%) | 25 (2.3%) |
| $50,000 to $99,999 | 0 (0.0%) | 13 (1.2%) |
| $100,000 to $299,999 | 448 (66.2%) | 444 (41.2%) |
| $300,000 to $499,999 | 136 (20.1%) | 528 (49.0%) |
| $500,000 to $749,999 | 0 (0.0%) | 53 (4.9%) |
| $750,000 to $999,999 | 17 (2.5%) | 14 (1.3%) |
| $1,000,000 or more | 24 (3.5%) | 0 (0.0%) |
| Total | 677 (100.0%) | 1,077 (100.0%) |
Household Income by Mortgage Status in Lemon Hill
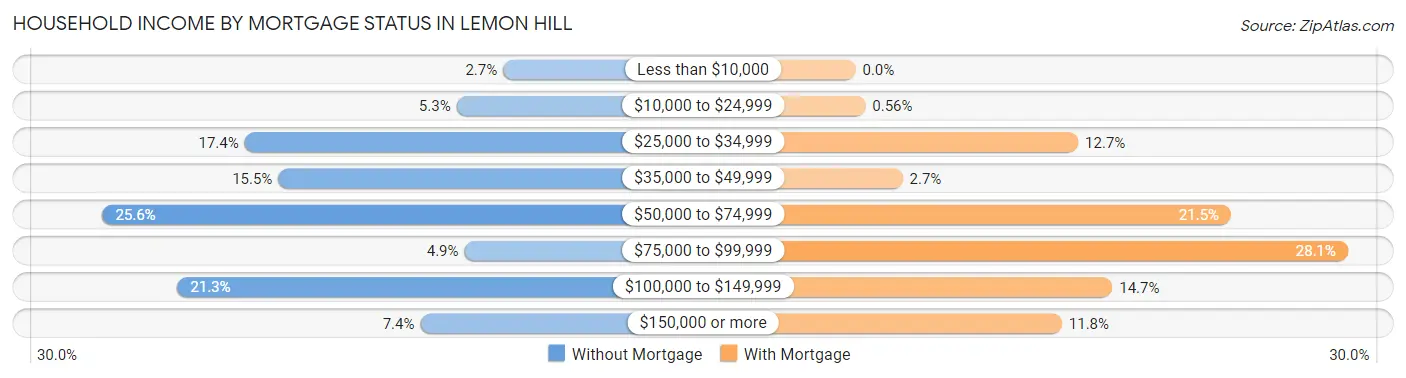
| Household Income | Without Mortgage | With Mortgage |
| Less than $10,000 | 18 (2.7%) | 0 (0.0%) |
| $10,000 to $24,999 | 36 (5.3%) | 6 (0.6%) |
| $25,000 to $34,999 | 118 (17.4%) | 137 (12.7%) |
| $35,000 to $49,999 | 105 (15.5%) | 29 (2.7%) |
| $50,000 to $74,999 | 173 (25.6%) | 231 (21.4%) |
| $75,000 to $99,999 | 33 (4.9%) | 303 (28.1%) |
| $100,000 to $149,999 | 144 (21.3%) | 158 (14.7%) |
| $150,000 or more | 50 (7.4%) | 127 (11.8%) |
| Total | 677 (100.0%) | 1,077 (100.0%) |
Property Value to Household Income Ratio in Lemon Hill
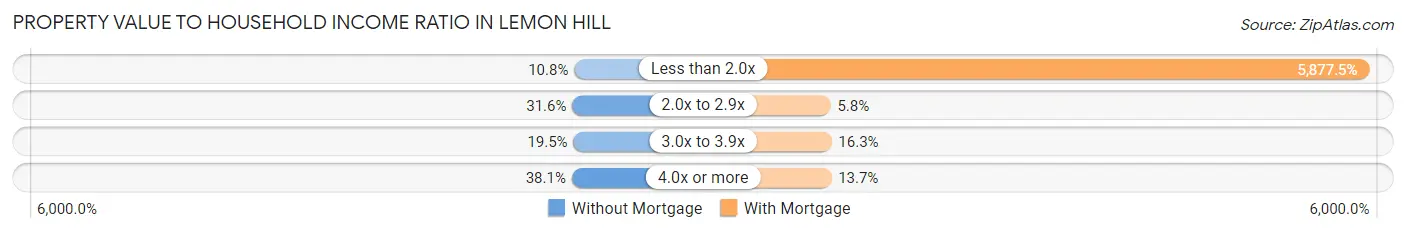
| Value-to-Income Ratio | Without Mortgage | With Mortgage |
| Less than 2.0x | 73 (10.8%) | 63,301 (5,877.5%) |
| 2.0x to 2.9x | 214 (31.6%) | 62 (5.8%) |
| 3.0x to 3.9x | 132 (19.5%) | 175 (16.3%) |
| 4.0x or more | 258 (38.1%) | 148 (13.7%) |
| Total | 677 (100.0%) | 1,077 (100.0%) |
Real Estate Taxes by Mortgage Status in Lemon Hill
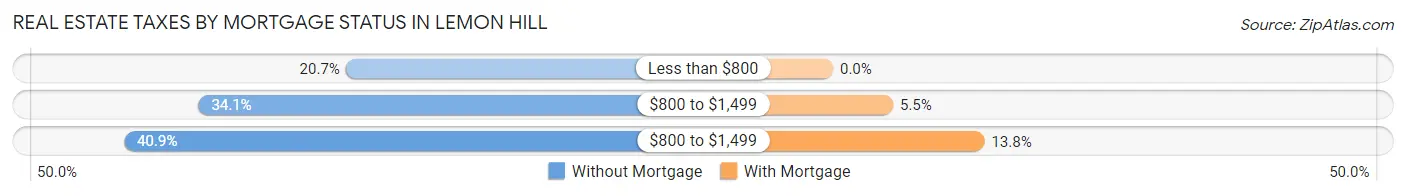
| Property Taxes | Without Mortgage | With Mortgage |
| Less than $800 | 140 (20.7%) | 0 (0.0%) |
| $800 to $1,499 | 231 (34.1%) | 59 (5.5%) |
| $800 to $1,499 | 277 (40.9%) | 149 (13.8%) |
| Total | 677 (100.0%) | 1,077 (100.0%) |
Health & Disability in Lemon Hill
Health Insurance Coverage by Age in Lemon Hill
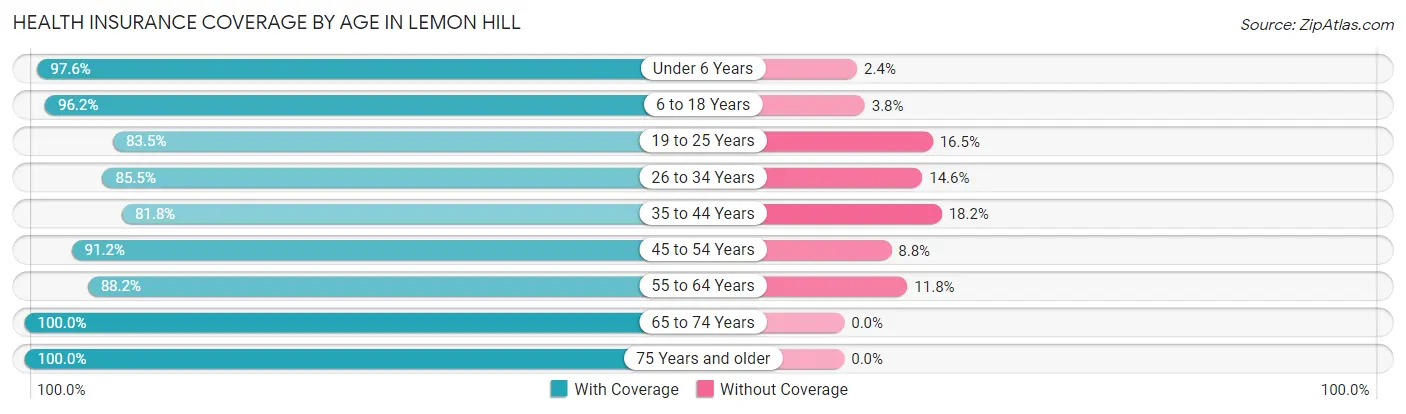
| Age Bracket | With Coverage | Without Coverage |
| Under 6 Years | 1,097 (97.6%) | 27 (2.4%) |
| 6 to 18 Years | 3,652 (96.2%) | 145 (3.8%) |
| 19 to 25 Years | 1,413 (83.5%) | 279 (16.5%) |
| 26 to 34 Years | 1,474 (85.5%) | 251 (14.5%) |
| 35 to 44 Years | 1,465 (81.8%) | 325 (18.2%) |
| 45 to 54 Years | 1,497 (91.2%) | 144 (8.8%) |
| 55 to 64 Years | 1,244 (88.2%) | 166 (11.8%) |
| 65 to 74 Years | 1,012 (100.0%) | 0 (0.0%) |
| 75 Years and older | 630 (100.0%) | 0 (0.0%) |
| Total | 13,484 (91.0%) | 1,337 (9.0%) |
Health Insurance Coverage by Citizenship Status in Lemon Hill
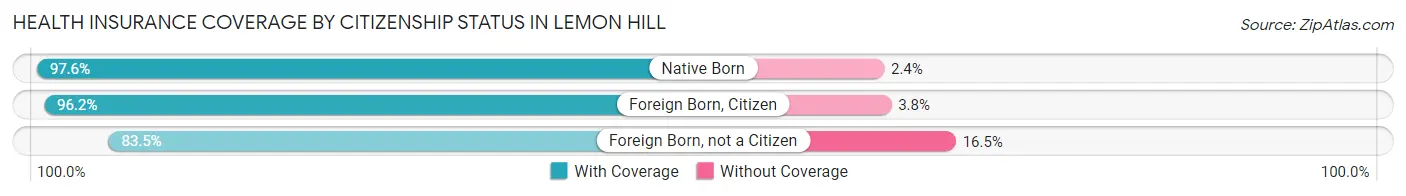
| Citizenship Status | With Coverage | Without Coverage |
| Native Born | 1,097 (97.6%) | 27 (2.4%) |
| Foreign Born, Citizen | 3,652 (96.2%) | 145 (3.8%) |
| Foreign Born, not a Citizen | 1,413 (83.5%) | 279 (16.5%) |
Health Insurance Coverage by Household Income in Lemon Hill
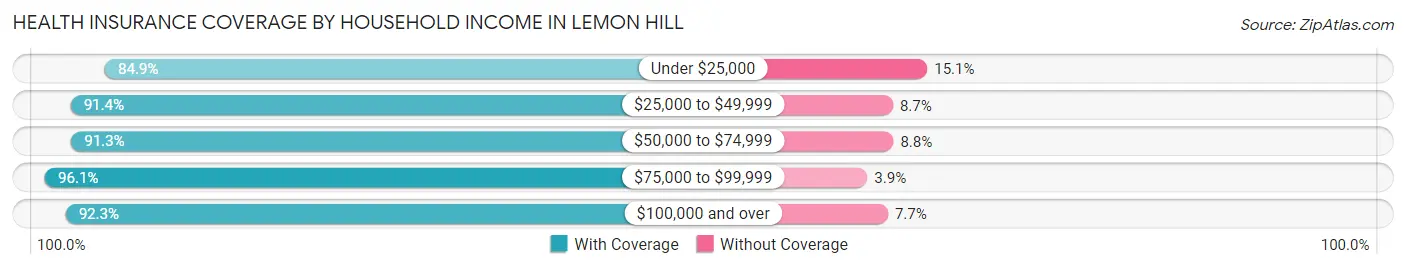
| Household Income | With Coverage | Without Coverage |
| Under $25,000 | 2,178 (84.9%) | 387 (15.1%) |
| $25,000 to $49,999 | 4,520 (91.3%) | 428 (8.6%) |
| $50,000 to $74,999 | 3,119 (91.2%) | 299 (8.7%) |
| $75,000 to $99,999 | 1,792 (96.1%) | 72 (3.9%) |
| $100,000 and over | 1,808 (92.3%) | 151 (7.7%) |
Public vs Private Health Insurance Coverage by Age in Lemon Hill
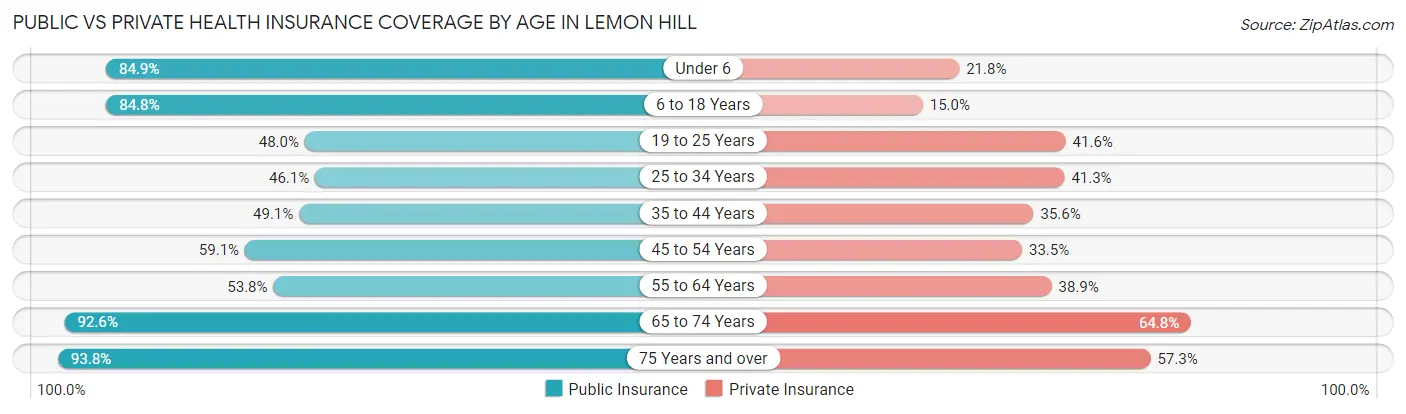
| Age Bracket | Public Insurance | Private Insurance |
| Under 6 | 954 (84.9%) | 245 (21.8%) |
| 6 to 18 Years | 3,221 (84.8%) | 571 (15.0%) |
| 19 to 25 Years | 812 (48.0%) | 703 (41.5%) |
| 25 to 34 Years | 795 (46.1%) | 713 (41.3%) |
| 35 to 44 Years | 878 (49.0%) | 637 (35.6%) |
| 45 to 54 Years | 970 (59.1%) | 549 (33.5%) |
| 55 to 64 Years | 759 (53.8%) | 549 (38.9%) |
| 65 to 74 Years | 937 (92.6%) | 656 (64.8%) |
| 75 Years and over | 591 (93.8%) | 361 (57.3%) |
| Total | 9,917 (66.9%) | 4,984 (33.6%) |
Disability Status by Sex by Age in Lemon Hill
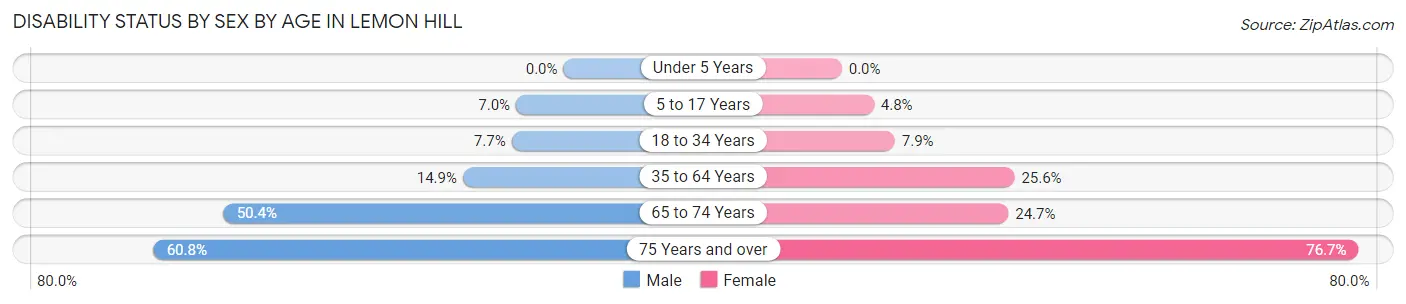
| Age Bracket | Male | Female |
| Under 5 Years | 0 (0.0%) | 0 (0.0%) |
| 5 to 17 Years | 138 (7.0%) | 84 (4.8%) |
| 18 to 34 Years | 150 (7.7%) | 133 (7.9%) |
| 35 to 64 Years | 363 (14.9%) | 618 (25.6%) |
| 65 to 74 Years | 237 (50.4%) | 134 (24.7%) |
| 75 Years and over | 177 (60.8%) | 260 (76.7%) |
Disability Class by Sex by Age in Lemon Hill
Disability Class: Hearing Difficulty
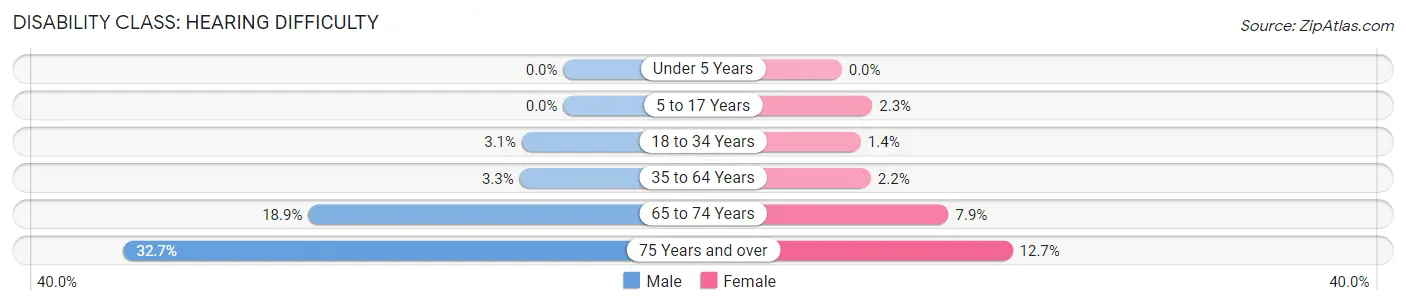
| Age Bracket | Male | Female |
| Under 5 Years | 0 (0.0%) | 0 (0.0%) |
| 5 to 17 Years | 0 (0.0%) | 40 (2.3%) |
| 18 to 34 Years | 60 (3.1%) | 24 (1.4%) |
| 35 to 64 Years | 79 (3.3%) | 52 (2.2%) |
| 65 to 74 Years | 89 (18.9%) | 43 (7.9%) |
| 75 Years and over | 95 (32.7%) | 43 (12.7%) |
Disability Class: Vision Difficulty
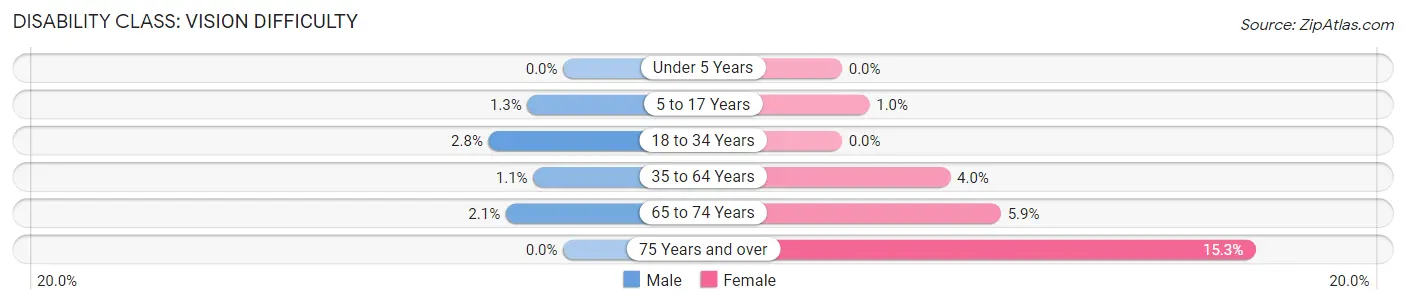
| Age Bracket | Male | Female |
| Under 5 Years | 0 (0.0%) | 0 (0.0%) |
| 5 to 17 Years | 26 (1.3%) | 18 (1.0%) |
| 18 to 34 Years | 54 (2.8%) | 0 (0.0%) |
| 35 to 64 Years | 27 (1.1%) | 97 (4.0%) |
| 65 to 74 Years | 10 (2.1%) | 32 (5.9%) |
| 75 Years and over | 0 (0.0%) | 52 (15.3%) |
Disability Class: Cognitive Difficulty
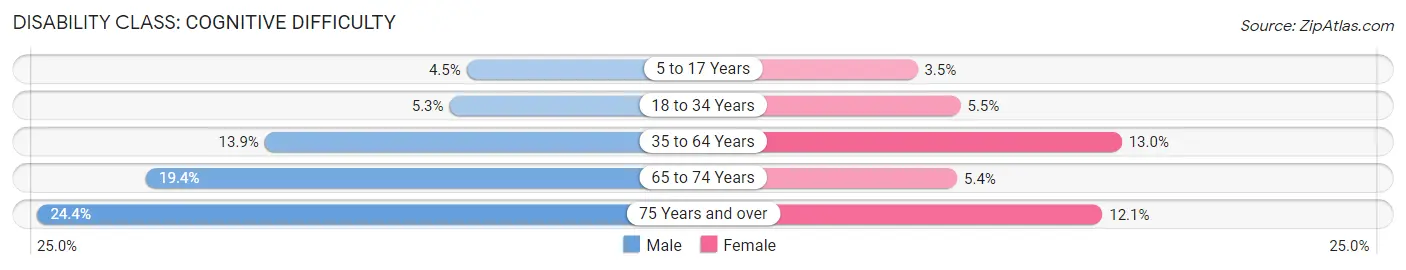
| Age Bracket | Male | Female |
| 5 to 17 Years | 88 (4.5%) | 62 (3.5%) |
| 18 to 34 Years | 103 (5.3%) | 93 (5.5%) |
| 35 to 64 Years | 337 (13.9%) | 313 (13.0%) |
| 65 to 74 Years | 91 (19.4%) | 29 (5.3%) |
| 75 Years and over | 71 (24.4%) | 41 (12.1%) |
Disability Class: Ambulatory Difficulty
| Age Bracket | Male | Female |
| 5 to 17 Years | 24 (1.2%) | 18 (1.0%) |
| 18 to 34 Years | 24 (1.2%) | 55 (3.3%) |
| 35 to 64 Years | 233 (9.6%) | 226 (9.4%) |
| 65 to 74 Years | 85 (18.1%) | 51 (9.4%) |
| 75 Years and over | 77 (26.5%) | 164 (48.4%) |
Disability Class: Self-Care Difficulty
| Age Bracket | Male | Female |
| 5 to 17 Years | 24 (1.2%) | 41 (2.3%) |
| 18 to 34 Years | 62 (3.2%) | 41 (2.4%) |
| 35 to 64 Years | 184 (7.6%) | 186 (7.7%) |
| 65 to 74 Years | 45 (9.6%) | 9 (1.7%) |
| 75 Years and over | 23 (7.9%) | 167 (49.3%) |
Technology Access in Lemon Hill
Computing Device Access in Lemon Hill
| Device Type | # Households | % Households |
| Desktop or Laptop | 3,146 | 69.7% |
| Smartphone | 3,887 | 86.1% |
| Tablet | 2,771 | 61.4% |
| No Computing Device | 456 | 10.1% |
| Total | 4,517 | 100.0% |
Internet Access in Lemon Hill
| Internet Type | # Households | % Households |
| Dial-Up Internet | 54 | 1.2% |
| Broadband Home | 3,025 | 67.0% |
| Cellular Data Only | 726 | 16.1% |
| Satellite Internet | 457 | 10.1% |
| No Internet | 494 | 10.9% |
| Total | 4,517 | 100.0% |
Lemon Hill Summary
Lemon Hill is a small unincorporated community located in Sacramento County, California. It is situated in the foothills of the Sierra Nevada Mountains, approximately 20 miles east of downtown Sacramento. The community is bordered by the cities of Folsom and Rancho Cordova, and is part of the Sacramento–Arden-Arcade–Roseville Metropolitan Statistical Area.
History
The area now known as Lemon Hill was originally inhabited by the Nisenan Native Americans. The first European settlers arrived in the area in the mid-1800s, and the community was officially established in 1854. The community was named after the abundance of lemon trees that grew in the area.
In the early 1900s, the area was primarily used for agricultural purposes, with many of the local farmers growing citrus fruits, such as lemons, oranges, and grapefruits. The area also became known for its production of walnuts, almonds, and other nuts.
In the 1950s, the area began to experience rapid growth as the population of Sacramento began to expand. This growth was fueled by the construction of Interstate 80, which connected the city of Sacramento to the Bay Area. As a result, many of the local farms were replaced by residential developments.
Geography
Lemon Hill is located in the foothills of the Sierra Nevada Mountains, approximately 20 miles east of downtown Sacramento. The community is bordered by the cities of Folsom and Rancho Cordova, and is part of the Sacramento–Arden-Arcade–Roseville Metropolitan Statistical Area.
The area is characterized by rolling hills and valleys, with elevations ranging from 200 to 500 feet above sea level. The climate is mild, with hot summers and cool winters. The average annual precipitation is approximately 20 inches.
Economy
The economy of Lemon Hill is primarily driven by the service sector, with many of the local residents employed in retail, healthcare, and education. The area is also home to several small businesses, including restaurants, grocery stores, and auto repair shops.
The area is also home to several large employers, including Intel, Kaiser Permanente, and Sutter Health. These employers provide employment opportunities for many of the local residents.
Demographics
As of the 2010 census, the population of Lemon Hill was 8,845. The racial makeup of the community was 57.3% White, 24.2% Hispanic or Latino, 11.2% Asian, 8.2% African American, and 0.3% Native American.
The median household income in Lemon Hill was $63,945, and the median family income was $71,945. The per capita income was $27,945. The unemployment rate was 5.2%.
Conclusion
Lemon Hill is a small unincorporated community located in Sacramento County, California. It is situated in the foothills of the Sierra Nevada Mountains, approximately 20 miles east of downtown Sacramento. The community is bordered by the cities of Folsom and Rancho Cordova, and is part of the Sacramento–Arden-Arcade–Roseville Metropolitan Statistical Area. The area was originally inhabited by the Nisenan Native Americans, and was officially established in 1854. The economy of Lemon Hill is primarily driven by the service sector, with many of the local residents employed in retail, healthcare, and education. As of the 2010 census, the population of Lemon Hill was 8,845. The racial makeup of the community was 57.3% White, 24.2% Hispanic or Latino, 11.2% Asian, 8.2% African American, and 0.3% Native American. The median household income in Lemon Hill was $63,945, and the median family income was $71,945. The per capita income was $27,945. The unemployment rate was 5.2%.
Common Questions
What is Per Capita Income in Lemon Hill?
Per Capita income in Lemon Hill is $21,278.
What is the Median Family Income in Lemon Hill?
Median Family Income in Lemon Hill is $47,952.
What is the Median Household income in Lemon Hill?
Median Household Income in Lemon Hill is $47,080.
What is Income or Wage Gap in Lemon Hill?
Income or Wage Gap in Lemon Hill is 29.6%.
Women in Lemon Hill earn 70.4 cents for every dollar earned by a man.
What is Family Income Deficit in Lemon Hill?
Family Income Deficit in Lemon Hill is $11,984.
Families that are below poverty line in Lemon Hill earn $11,984 less on average than the poverty threshold level.
What is Inequality or Gini Index in Lemon Hill?
Inequality or Gini Index in Lemon Hill is 0.47.
What is the Total Population of Lemon Hill?
Total Population of Lemon Hill is 14,824.
What is the Total Male Population of Lemon Hill?
Total Male Population of Lemon Hill is 7,719.
What is the Total Female Population of Lemon Hill?
Total Female Population of Lemon Hill is 7,105.
What is the Ratio of Males per 100 Females in Lemon Hill?
There are 108.64 Males per 100 Females in Lemon Hill.
What is the Ratio of Females per 100 Males in Lemon Hill?
There are 92.05 Females per 100 Males in Lemon Hill.
What is the Median Population Age in Lemon Hill?
Median Population Age in Lemon Hill is 30.2 Years.
What is the Average Family Size in Lemon Hill
Average Family Size in Lemon Hill is 3.9 People.
What is the Average Household Size in Lemon Hill
Average Household Size in Lemon Hill is 3.3 People.
How Large is the Labor Force in Lemon Hill?
There are 6,240 People in the Labor Forcein in Lemon Hill.
What is the Percentage of People in the Labor Force in Lemon Hill?
59.6% of People are in the Labor Force in Lemon Hill.
What is the Unemployment Rate in Lemon Hill?
Unemployment Rate in Lemon Hill is 9.0%.