Vallejo, CA Map & Demographics
Vallejo Map
Vallejo Overview
$39,843
PER CAPITA INCOME
$99,678
AVG FAMILY INCOME
$86,112
AVG HOUSEHOLD INCOME
13.3%
WAGE / INCOME GAP [ % ]
86.7¢/ $1
WAGE / INCOME GAP [ $ ]
$9,956
FAMILY INCOME DEFICIT
0.44
INEQUALITY / GINI INDEX
125,132
TOTAL POPULATION
61,275
MALE POPULATION
63,857
FEMALE POPULATION
95.96
MALES / 100 FEMALES
104.21
FEMALES / 100 MALES
40.4
MEDIAN AGE
3.4
AVG FAMILY SIZE
2.8
AVG HOUSEHOLD SIZE
65,258
LABOR FORCE [ PEOPLE ]
63.5%
PERCENT IN LABOR FORCE
7.0%
UNEMPLOYMENT RATE
Vallejo Area Codes
Income in Vallejo
Income Overview in Vallejo
Per Capita Income in Vallejo is $39,843, while median incomes of families and households are $99,678 and $86,112 respectively.
| Characteristic | Number | Measure |
| Per Capita Income | 125,132 | $39,843 |
| Median Family Income | 29,753 | $99,678 |
| Mean Family Income | 29,753 | $119,881 |
| Median Household Income | 44,107 | $86,112 |
| Mean Household Income | 44,107 | $109,350 |
| Income Deficit | 29,753 | $9,956 |
| Wage / Income Gap (%) | 125,132 | 13.32% |
| Wage / Income Gap ($) | 125,132 | 86.68¢ per $1 |
| Gini / Inequality Index | 125,132 | 0.44 |
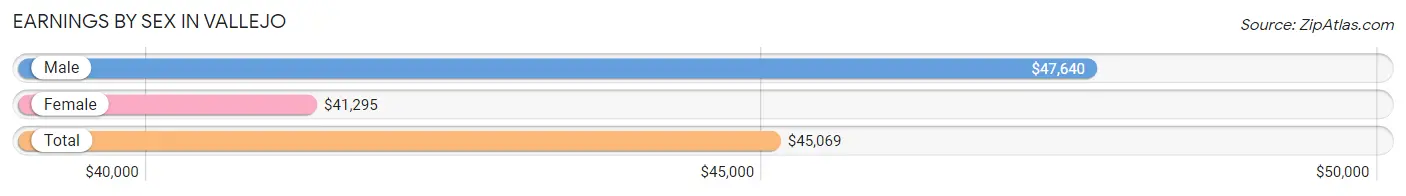
Earnings by Sex in Vallejo
Average Earnings in Vallejo are $45,069, $47,640 for men and $41,295 for women, a difference of 13.3%.
| Sex | Number | Average Earnings |
| Male | 34,844 (52.1%) | $47,640 |
| Female | 31,969 (47.8%) | $41,295 |
| Total | 66,813 (100.0%) | $45,069 |
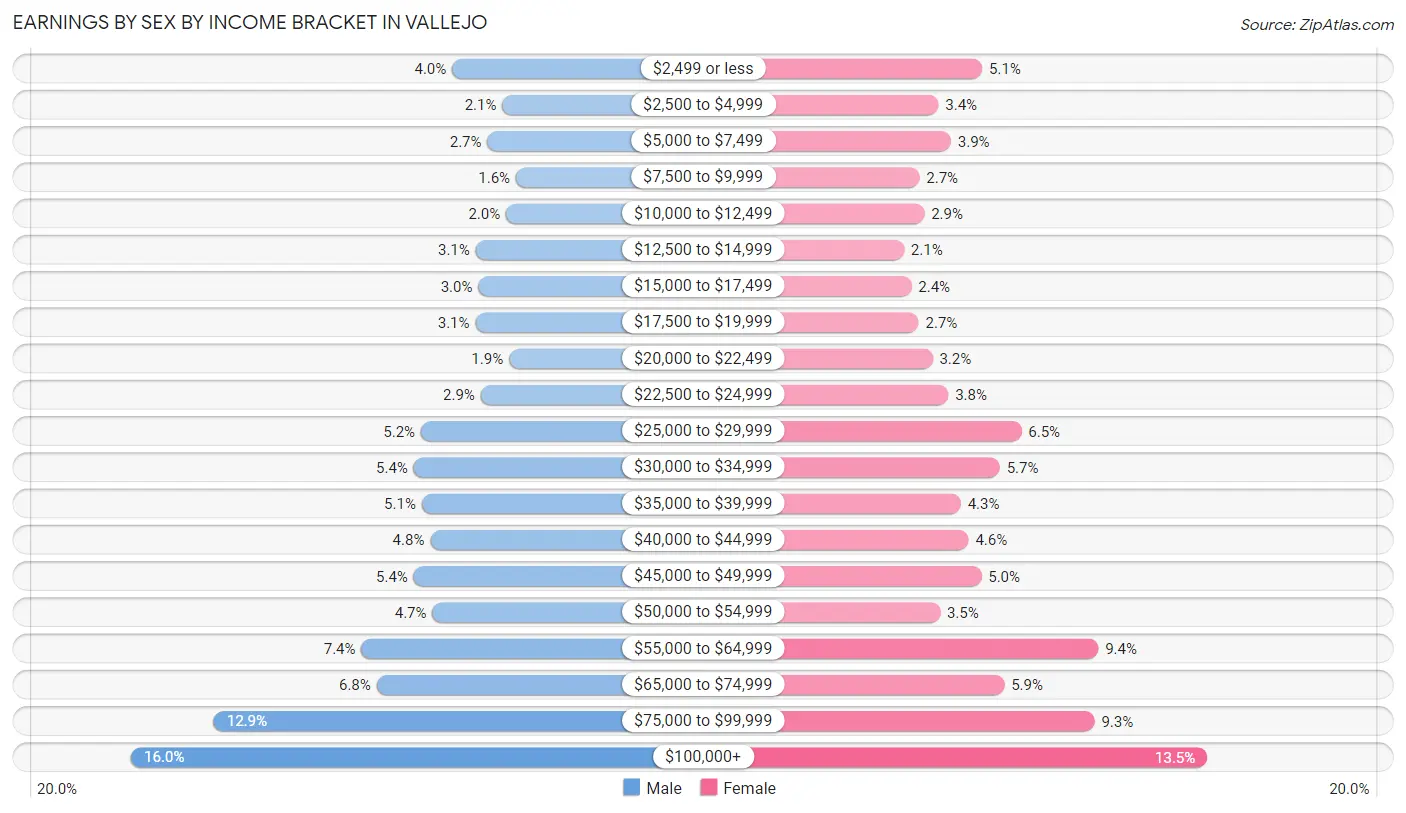
Earnings by Sex by Income Bracket in Vallejo
The most common earnings brackets in Vallejo are $100,000+ for men (5,580 | 16.0%) and $100,000+ for women (4,317 | 13.5%).
| Income | Male | Female |
| $2,499 or less | 1,388 (4.0%) | 1,620 (5.1%) |
| $2,500 to $4,999 | 731 (2.1%) | 1,095 (3.4%) |
| $5,000 to $7,499 | 926 (2.7%) | 1,246 (3.9%) |
| $7,500 to $9,999 | 555 (1.6%) | 870 (2.7%) |
| $10,000 to $12,499 | 684 (2.0%) | 926 (2.9%) |
| $12,500 to $14,999 | 1,079 (3.1%) | 684 (2.1%) |
| $15,000 to $17,499 | 1,046 (3.0%) | 774 (2.4%) |
| $17,500 to $19,999 | 1,085 (3.1%) | 859 (2.7%) |
| $20,000 to $22,499 | 645 (1.8%) | 1,026 (3.2%) |
| $22,500 to $24,999 | 1,013 (2.9%) | 1,214 (3.8%) |
| $25,000 to $29,999 | 1,794 (5.1%) | 2,090 (6.5%) |
| $30,000 to $34,999 | 1,888 (5.4%) | 1,831 (5.7%) |
| $35,000 to $39,999 | 1,783 (5.1%) | 1,364 (4.3%) |
| $40,000 to $44,999 | 1,672 (4.8%) | 1,459 (4.6%) |
| $45,000 to $49,999 | 1,890 (5.4%) | 1,612 (5.0%) |
| $50,000 to $54,999 | 1,643 (4.7%) | 1,117 (3.5%) |
| $55,000 to $64,999 | 2,570 (7.4%) | 3,012 (9.4%) |
| $65,000 to $74,999 | 2,373 (6.8%) | 1,886 (5.9%) |
| $75,000 to $99,999 | 4,499 (12.9%) | 2,967 (9.3%) |
| $100,000+ | 5,580 (16.0%) | 4,317 (13.5%) |
| Total | 34,844 (100.0%) | 31,969 (100.0%) |
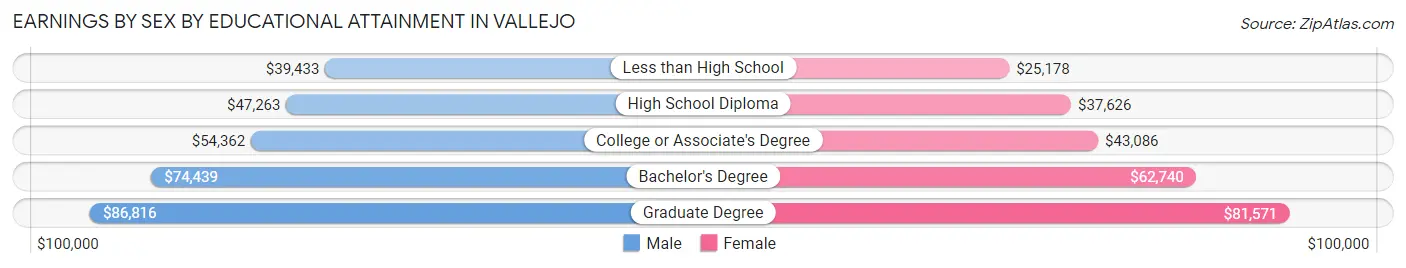
Earnings by Sex by Educational Attainment in Vallejo
Average earnings in Vallejo are $54,160 for men and $46,121 for women, a difference of 14.8%. Men with an educational attainment of graduate degree enjoy the highest average annual earnings of $86,816, while those with less than high school education earn the least with $39,433. Women with an educational attainment of graduate degree earn the most with the average annual earnings of $81,571, while those with less than high school education have the smallest earnings of $25,178.
| Educational Attainment | Male Income | Female Income |
| Less than High School | $39,433 | $25,178 |
| High School Diploma | $47,263 | $37,626 |
| College or Associate's Degree | $54,362 | $43,086 |
| Bachelor's Degree | $74,439 | $62,740 |
| Graduate Degree | $86,816 | $81,571 |
| Total | $54,160 | $46,121 |
Family Income in Vallejo
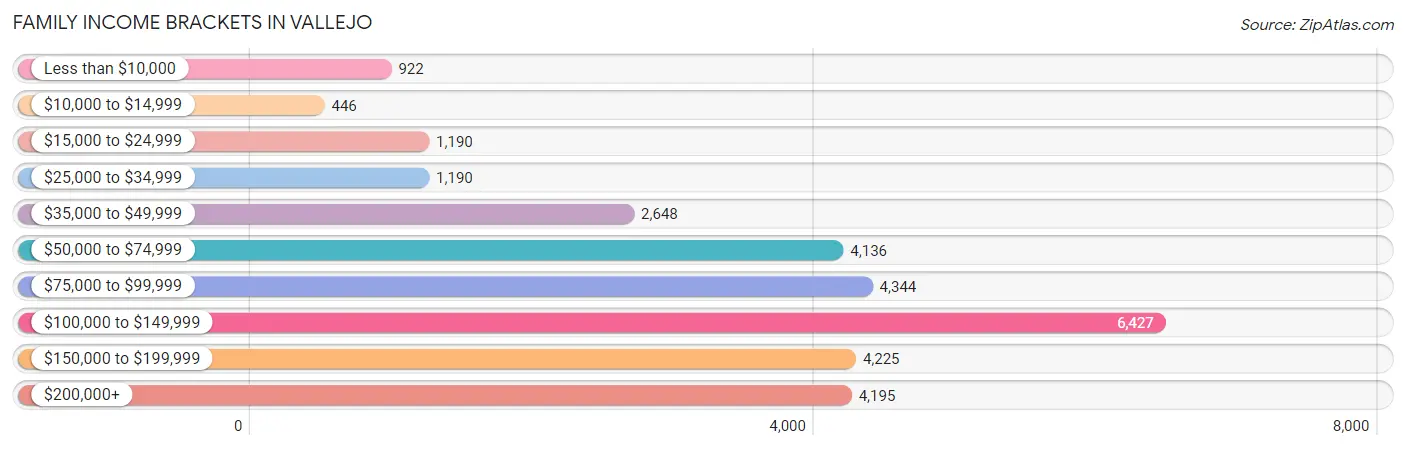
Family Income Brackets in Vallejo
According to the Vallejo family income data, there are 6,427 families falling into the $100,000 to $149,999 income range, which is the most common income bracket and makes up 21.6% of all families. Conversely, the $10,000 to $14,999 income bracket is the least frequent group with only 446 families (1.5%) belonging to this category.
| Income Bracket | # Families | % Families |
| Less than $10,000 | 922 | 3.1% |
| $10,000 to $14,999 | 446 | 1.5% |
| $15,000 to $24,999 | 1,190 | 4.0% |
| $25,000 to $34,999 | 1,190 | 4.0% |
| $35,000 to $49,999 | 2,648 | 8.9% |
| $50,000 to $74,999 | 4,136 | 13.9% |
| $75,000 to $99,999 | 4,344 | 14.6% |
| $100,000 to $149,999 | 6,427 | 21.6% |
| $150,000 to $199,999 | 4,225 | 14.2% |
| $200,000+ | 4,195 | 14.1% |
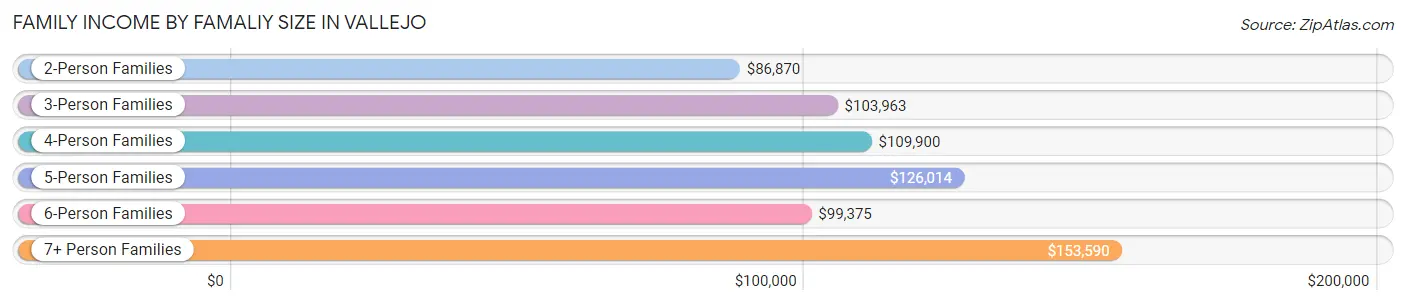
Family Income by Famaliy Size in Vallejo
7+ person families (814 | 2.7%) account for the highest median family income in Vallejo with $153,590 per family, while 2-person families (12,414 | 41.7%) have the highest median income of $43,435 per family member.
| Income Bracket | # Families | Median Income |
| 2-Person Families | 12,414 (41.7%) | $86,870 |
| 3-Person Families | 7,477 (25.1%) | $103,963 |
| 4-Person Families | 4,959 (16.7%) | $109,900 |
| 5-Person Families | 2,762 (9.3%) | $126,014 |
| 6-Person Families | 1,327 (4.5%) | $99,375 |
| 7+ Person Families | 814 (2.7%) | $153,590 |
| Total | 29,753 (100.0%) | $99,678 |
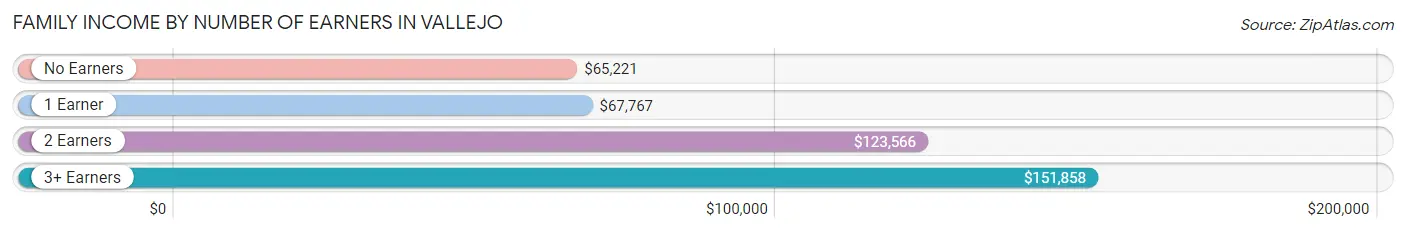
Family Income by Number of Earners in Vallejo
The median family income in Vallejo is $99,678, with families comprising 3+ earners (4,802) having the highest median family income of $151,858, while families with no earners (3,406) have the lowest median family income of $65,221, accounting for 16.1% and 11.5% of families, respectively.
| Number of Earners | # Families | Median Income |
| No Earners | 3,406 (11.5%) | $65,221 |
| 1 Earner | 9,987 (33.6%) | $67,767 |
| 2 Earners | 11,558 (38.9%) | $123,566 |
| 3+ Earners | 4,802 (16.1%) | $151,858 |
| Total | 29,753 (100.0%) | $99,678 |
Household Income in Vallejo
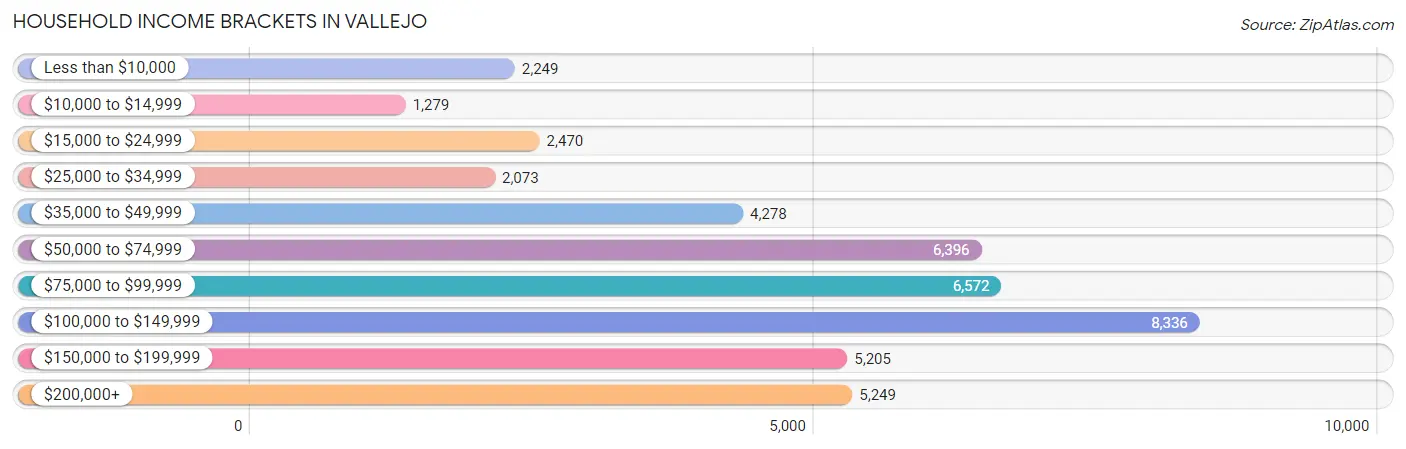
Household Income Brackets in Vallejo
With 8,336 households falling in the category, the $100,000 to $149,999 income range is the most frequent in Vallejo, accounting for 18.9% of all households. In contrast, only 1,279 households (2.9%) fall into the $10,000 to $14,999 income bracket, making it the least populous group.
| Income Bracket | # Households | % Households |
| Less than $10,000 | 2,249 | 5.1% |
| $10,000 to $14,999 | 1,279 | 2.9% |
| $15,000 to $24,999 | 2,470 | 5.6% |
| $25,000 to $34,999 | 2,073 | 4.7% |
| $35,000 to $49,999 | 4,278 | 9.7% |
| $50,000 to $74,999 | 6,396 | 14.5% |
| $75,000 to $99,999 | 6,572 | 14.9% |
| $100,000 to $149,999 | 8,336 | 18.9% |
| $150,000 to $199,999 | 5,205 | 11.8% |
| $200,000+ | 5,249 | 11.9% |
Household Income by Householder Age in Vallejo
The median household income in Vallejo is $86,112, with the highest median household income of $98,532 found in the 45 to 64 years age bracket for the primary householder. A total of 17,040 households (38.6%) fall into this category. Meanwhile, the 15 to 24 years age bracket for the primary householder has the lowest median household income of $56,912, with 1,080 households (2.5%) in this group.
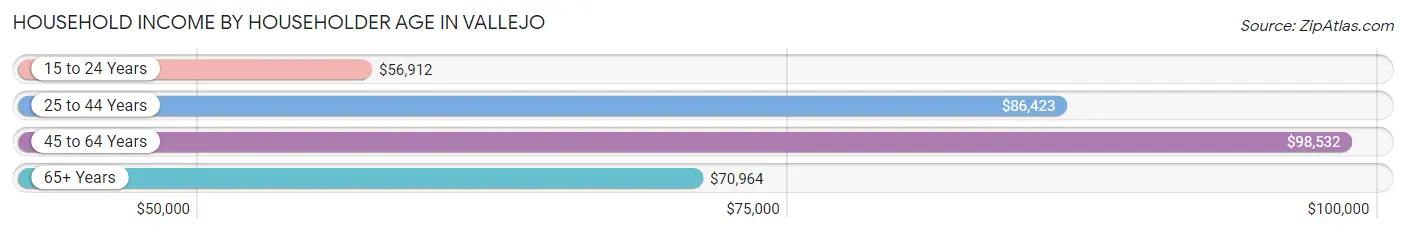
| Income Bracket | # Households | Median Income |
| 15 to 24 Years | 1,080 (2.5%) | $56,912 |
| 25 to 44 Years | 14,178 (32.1%) | $86,423 |
| 45 to 64 Years | 17,040 (38.6%) | $98,532 |
| 65+ Years | 11,809 (26.8%) | $70,964 |
| Total | 44,107 (100.0%) | $86,112 |
Poverty in Vallejo
Income Below Poverty by Sex and Age in Vallejo
With 10.1% poverty level for males and 12.9% for females among the residents of Vallejo, 15 year old males and 15 year old females are the most vulnerable to poverty, with 97 males (17.5%) and 233 females (28.6%) in their respective age groups living below the poverty level.
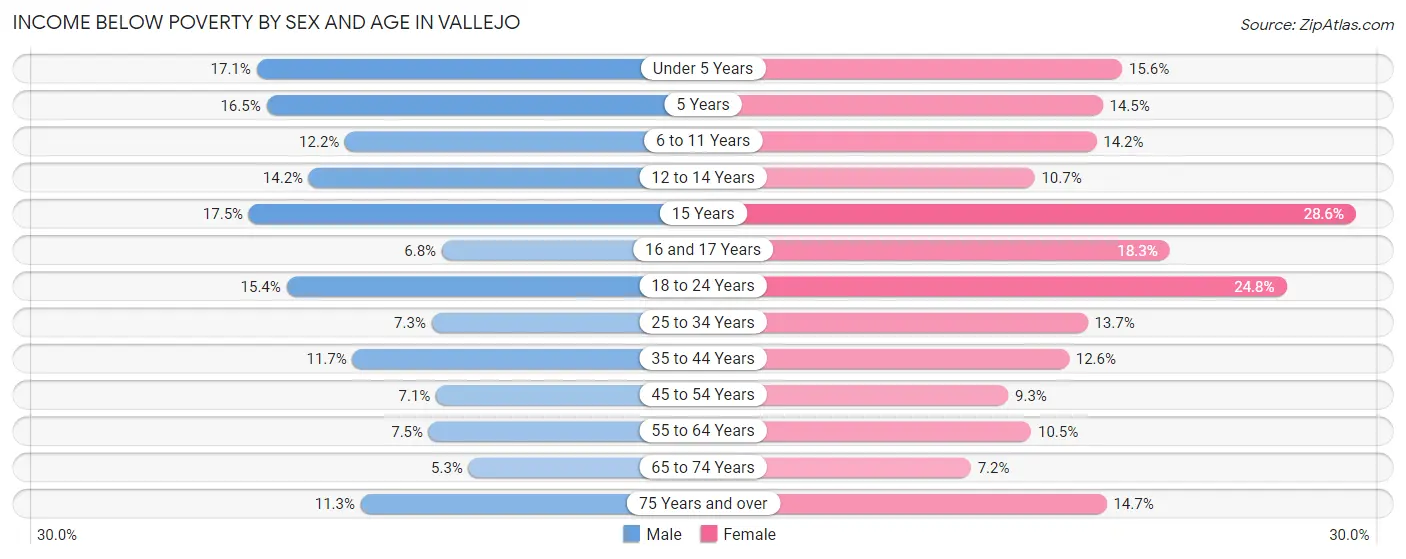
| Age Bracket | Male | Female |
| Under 5 Years | 550 (17.1%) | 469 (15.6%) |
| 5 Years | 124 (16.5%) | 114 (14.5%) |
| 6 to 11 Years | 528 (12.1%) | 567 (14.2%) |
| 12 to 14 Years | 304 (14.2%) | 227 (10.7%) |
| 15 Years | 97 (17.5%) | 233 (28.6%) |
| 16 and 17 Years | 102 (6.8%) | 271 (18.2%) |
| 18 to 24 Years | 921 (15.4%) | 1,135 (24.7%) |
| 25 to 34 Years | 632 (7.3%) | 1,143 (13.7%) |
| 35 to 44 Years | 1,045 (11.7%) | 1,074 (12.6%) |
| 45 to 54 Years | 552 (7.1%) | 697 (9.3%) |
| 55 to 64 Years | 591 (7.5%) | 1,030 (10.5%) |
| 65 to 74 Years | 303 (5.3%) | 552 (7.2%) |
| 75 Years and over | 353 (11.3%) | 634 (14.7%) |
| Total | 6,102 (10.1%) | 8,146 (12.9%) |
Income Above Poverty by Sex and Age in Vallejo
According to the poverty statistics in Vallejo, males aged 65 to 74 years and females aged 65 to 74 years are the age groups that are most secure financially, with 94.7% of males and 92.8% of females in these age groups living above the poverty line.
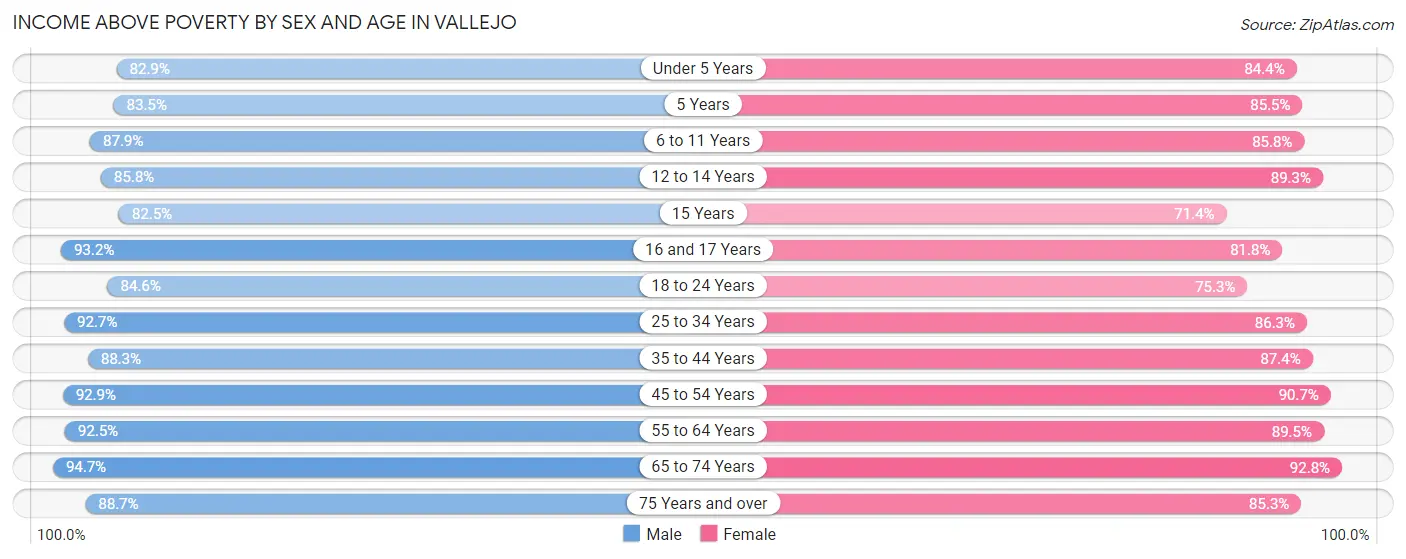
| Age Bracket | Male | Female |
| Under 5 Years | 2,670 (82.9%) | 2,535 (84.4%) |
| 5 Years | 626 (83.5%) | 671 (85.5%) |
| 6 to 11 Years | 3,817 (87.8%) | 3,433 (85.8%) |
| 12 to 14 Years | 1,842 (85.8%) | 1,888 (89.3%) |
| 15 Years | 457 (82.5%) | 581 (71.4%) |
| 16 and 17 Years | 1,407 (93.2%) | 1,214 (81.8%) |
| 18 to 24 Years | 5,054 (84.6%) | 3,450 (75.2%) |
| 25 to 34 Years | 7,993 (92.7%) | 7,211 (86.3%) |
| 35 to 44 Years | 7,859 (88.3%) | 7,423 (87.4%) |
| 45 to 54 Years | 7,245 (92.9%) | 6,832 (90.7%) |
| 55 to 64 Years | 7,300 (92.5%) | 8,742 (89.5%) |
| 65 to 74 Years | 5,442 (94.7%) | 7,139 (92.8%) |
| 75 Years and over | 2,776 (88.7%) | 3,666 (85.3%) |
| Total | 54,488 (89.9%) | 54,785 (87.1%) |
Income Below Poverty Among Married-Couple Families in Vallejo
The poverty statistics for married-couple families in Vallejo show that 3.7% or 724 of the total 19,375 families live below the poverty line. Families with 3 or 4 children have the highest poverty rate of 3.9%, comprising of 51 families. On the other hand, families with 5 or more children have the lowest poverty rate of 0.0%, which includes 0 families.
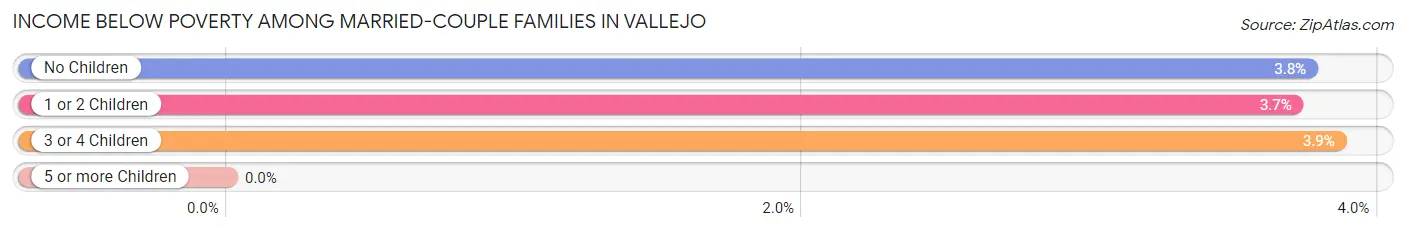
| Children | Above Poverty | Below Poverty |
| No Children | 11,352 (96.2%) | 444 (3.8%) |
| 1 or 2 Children | 5,940 (96.3%) | 229 (3.7%) |
| 3 or 4 Children | 1,271 (96.1%) | 51 (3.9%) |
| 5 or more Children | 88 (100.0%) | 0 (0.0%) |
| Total | 18,651 (96.3%) | 724 (3.7%) |
Income Below Poverty Among Single-Parent Households in Vallejo
According to the poverty data in Vallejo, 8.9% or 282 single-father households and 20.0% or 1,442 single-mother households are living below the poverty line. Among single-father households, those with 1 or 2 children have the highest poverty rate, with 202 households (14.7%) experiencing poverty. Likewise, among single-mother households, those with 5 or more children have the highest poverty rate, with 93 households (76.2%) falling below the poverty line.
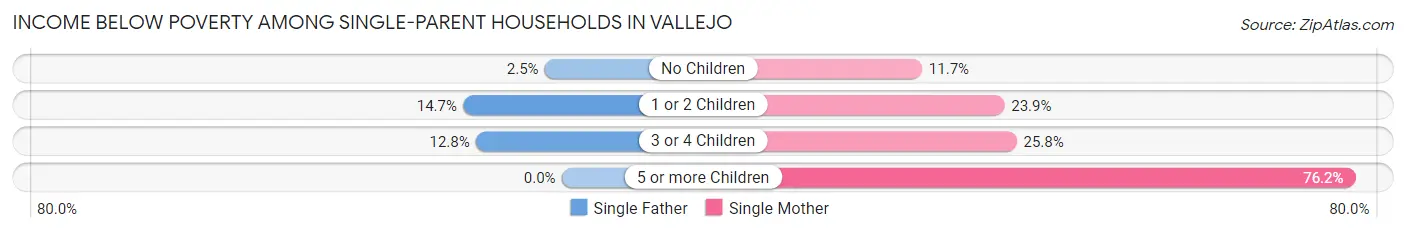
| Children | Single Father | Single Mother |
| No Children | 37 (2.5%) | 340 (11.7%) |
| 1 or 2 Children | 202 (14.7%) | 865 (23.9%) |
| 3 or 4 Children | 43 (12.8%) | 144 (25.8%) |
| 5 or more Children | 0 (0.0%) | 93 (76.2%) |
| Total | 282 (8.9%) | 1,442 (20.0%) |
Income Below Poverty Among Married-Couple vs Single-Parent Households in Vallejo
The poverty data for Vallejo shows that 724 of the married-couple family households (3.7%) and 1,724 of the single-parent households (16.6%) are living below the poverty level. Within the married-couple family households, those with 3 or 4 children have the highest poverty rate, with 51 households (3.9%) falling below the poverty line. Among the single-parent households, those with 5 or more children have the highest poverty rate, with 93 household (76.2%) living below poverty.
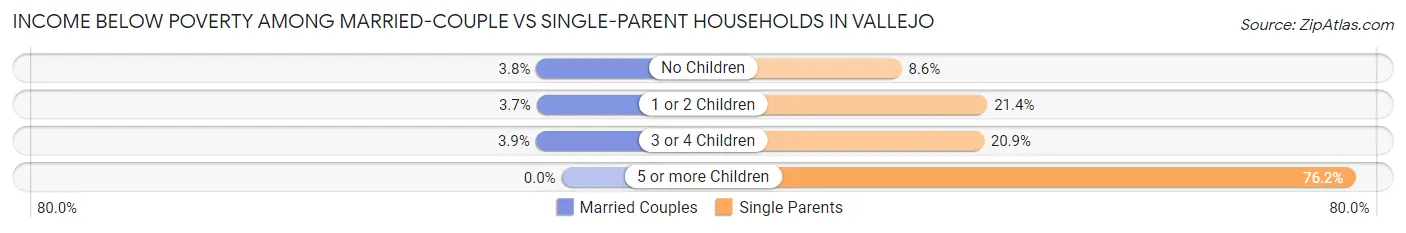
| Children | Married-Couple Families | Single-Parent Households |
| No Children | 444 (3.8%) | 377 (8.6%) |
| 1 or 2 Children | 229 (3.7%) | 1,067 (21.4%) |
| 3 or 4 Children | 51 (3.9%) | 187 (20.9%) |
| 5 or more Children | 0 (0.0%) | 93 (76.2%) |
| Total | 724 (3.7%) | 1,724 (16.6%) |
Race in Vallejo
The most populous races in Vallejo are White / Caucasian (37,457 | 29.9%), Hispanic or Latino (36,612 | 29.3%), and Asian (28,828 | 23.0%).
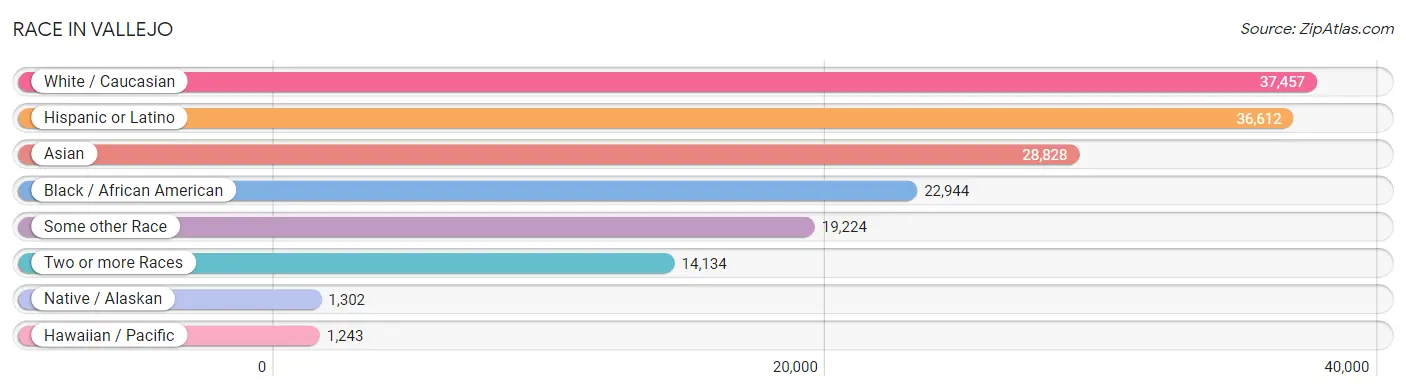
| Race | # Population | % Population |
| Asian | 28,828 | 23.0% |
| Black / African American | 22,944 | 18.3% |
| Hawaiian / Pacific | 1,243 | 1.0% |
| Hispanic or Latino | 36,612 | 29.3% |
| Native / Alaskan | 1,302 | 1.0% |
| White / Caucasian | 37,457 | 29.9% |
| Two or more Races | 14,134 | 11.3% |
| Some other Race | 19,224 | 15.4% |
| Total | 125,132 | 100.0% |
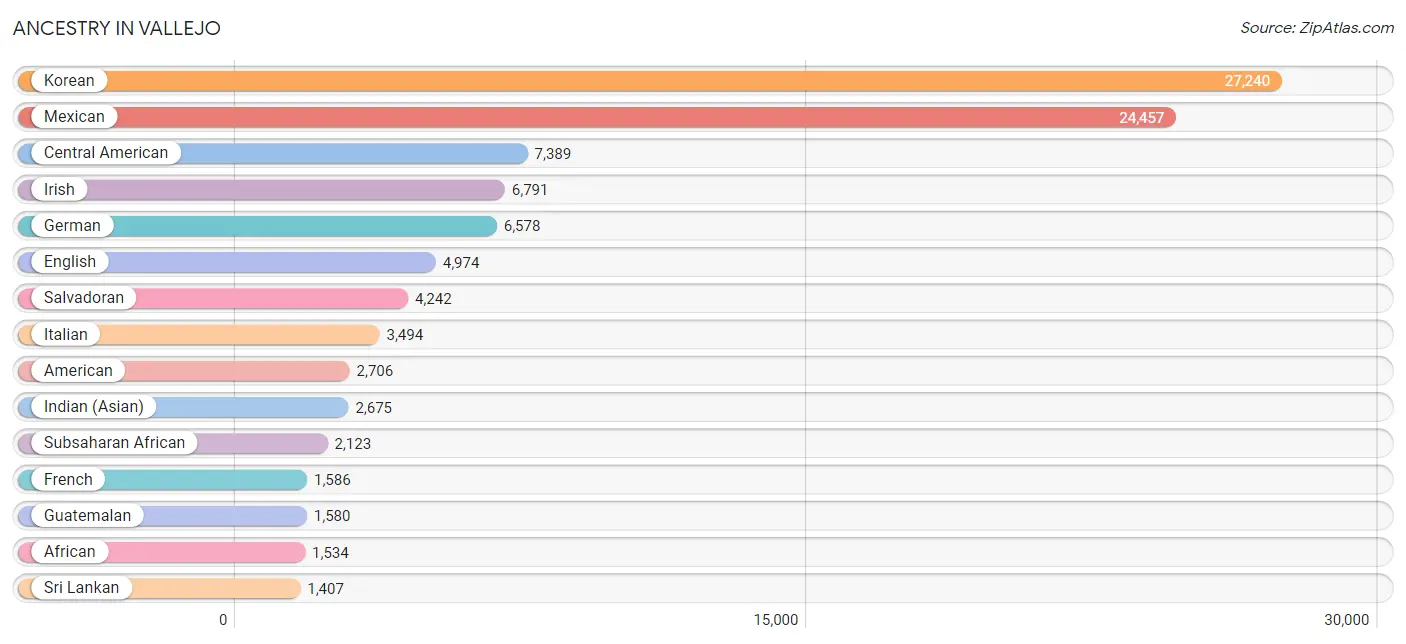
Ancestry in Vallejo
The most populous ancestries reported in Vallejo are Korean (27,240 | 21.8%), Mexican (24,457 | 19.5%), Central American (7,389 | 5.9%), Irish (6,791 | 5.4%), and German (6,578 | 5.3%), together accounting for 57.9% of all Vallejo residents.
| Ancestry | # Population | % Population |
| Afghan | 10 | 0.0% |
| African | 1,534 | 1.2% |
| Aleut | 7 | 0.0% |
| American | 2,706 | 2.2% |
| Apache | 35 | 0.0% |
| Arab | 426 | 0.3% |
| Argentinean | 15 | 0.0% |
| Armenian | 45 | 0.0% |
| Assyrian / Chaldean / Syriac | 61 | 0.1% |
| Australian | 13 | 0.0% |
| Austrian | 126 | 0.1% |
| Bangladeshi | 167 | 0.1% |
| Basque | 55 | 0.0% |
| Belgian | 248 | 0.2% |
| Belizean | 6 | 0.0% |
| Bhutanese | 1,227 | 1.0% |
| Blackfeet | 154 | 0.1% |
| Brazilian | 59 | 0.1% |
| British | 548 | 0.4% |
| British West Indian | 34 | 0.0% |
| Bulgarian | 70 | 0.1% |
| Burmese | 586 | 0.5% |
| Cajun | 24 | 0.0% |
| Canadian | 134 | 0.1% |
| Cape Verdean | 16 | 0.0% |
| Central American | 7,389 | 5.9% |
| Central American Indian | 210 | 0.2% |
| Cherokee | 530 | 0.4% |
| Chilean | 42 | 0.0% |
| Chinese | 10 | 0.0% |
| Chippewa | 10 | 0.0% |
| Choctaw | 167 | 0.1% |
| Colombian | 244 | 0.2% |
| Comanche | 28 | 0.0% |
| Costa Rican | 22 | 0.0% |
| Cree | 15 | 0.0% |
| Creek | 120 | 0.1% |
| Croatian | 32 | 0.0% |
| Cuban | 132 | 0.1% |
| Czech | 40 | 0.0% |
| Czechoslovakian | 35 | 0.0% |
| Danish | 617 | 0.5% |
| Dominican | 259 | 0.2% |
| Dutch | 458 | 0.4% |
| Eastern European | 153 | 0.1% |
| Ecuadorian | 123 | 0.1% |
| Egyptian | 135 | 0.1% |
| English | 4,974 | 4.0% |
| Ethiopian | 152 | 0.1% |
| European | 928 | 0.7% |
| Fijian | 21 | 0.0% |
| Filipino | 33 | 0.0% |
| Finnish | 128 | 0.1% |
| French | 1,586 | 1.3% |
| French Canadian | 372 | 0.3% |
| German | 6,578 | 5.3% |
| Greek | 292 | 0.2% |
| Guamanian / Chamorro | 467 | 0.4% |
| Guatemalan | 1,580 | 1.3% |
| Haitian | 106 | 0.1% |
| Honduran | 199 | 0.2% |
| Hungarian | 118 | 0.1% |
| Icelander | 16 | 0.0% |
| Indian (Asian) | 2,675 | 2.1% |
| Indonesian | 20 | 0.0% |
| Iranian | 37 | 0.0% |
| Iraqi | 7 | 0.0% |
| Irish | 6,791 | 5.4% |
| Israeli | 112 | 0.1% |
| Italian | 3,494 | 2.8% |
| Jamaican | 111 | 0.1% |
| Japanese | 76 | 0.1% |
| Jordanian | 42 | 0.0% |
| Kenyan | 12 | 0.0% |
| Korean | 27,240 | 21.8% |
| Laotian | 73 | 0.1% |
| Lebanese | 53 | 0.0% |
| Lithuanian | 137 | 0.1% |
| Luxembourger | 7 | 0.0% |
| Malaysian | 135 | 0.1% |
| Maltese | 51 | 0.0% |
| Mexican | 24,457 | 19.5% |
| Mexican American Indian | 598 | 0.5% |
| Mongolian | 50 | 0.0% |
| Moroccan | 10 | 0.0% |
| Native Hawaiian | 633 | 0.5% |
| Navajo | 130 | 0.1% |
| Nepalese | 77 | 0.1% |
| Nicaraguan | 1,129 | 0.9% |
| Nigerian | 156 | 0.1% |
| Northern European | 145 | 0.1% |
| Norwegian | 904 | 0.7% |
| Osage | 10 | 0.0% |
| Pakistani | 71 | 0.1% |
| Palestinian | 22 | 0.0% |
| Panamanian | 211 | 0.2% |
| Pennsylvania German | 5 | 0.0% |
| Peruvian | 185 | 0.2% |
| Polish | 951 | 0.8% |
| Portuguese | 1,144 | 0.9% |
| Pueblo | 103 | 0.1% |
| Puerto Rican | 1,350 | 1.1% |
| Romanian | 12 | 0.0% |
| Russian | 506 | 0.4% |
| Salvadoran | 4,242 | 3.4% |
| Samoan | 563 | 0.4% |
| Scandinavian | 132 | 0.1% |
| Scotch-Irish | 559 | 0.4% |
| Scottish | 764 | 0.6% |
| Seminole | 6 | 0.0% |
| Serbian | 38 | 0.0% |
| Sioux | 41 | 0.0% |
| Slavic | 93 | 0.1% |
| Slovak | 64 | 0.1% |
| Slovene | 6 | 0.0% |
| Somali | 17 | 0.0% |
| South African | 20 | 0.0% |
| South American | 715 | 0.6% |
| South American Indian | 41 | 0.0% |
| Spaniard | 906 | 0.7% |
| Spanish | 622 | 0.5% |
| Spanish American | 12 | 0.0% |
| Sri Lankan | 1,407 | 1.1% |
| Subsaharan African | 2,123 | 1.7% |
| Swedish | 859 | 0.7% |
| Swiss | 137 | 0.1% |
| Thai | 1,349 | 1.1% |
| Tohono O'Odham | 8 | 0.0% |
| Tongan | 171 | 0.1% |
| Turkish | 54 | 0.0% |
| Ukrainian | 174 | 0.1% |
| Venezuelan | 97 | 0.1% |
| Welsh | 279 | 0.2% |
| Yaqui | 10 | 0.0% |
| Yugoslavian | 6 | 0.0% |
| Yuman | 12 | 0.0% | View All 136 Rows |
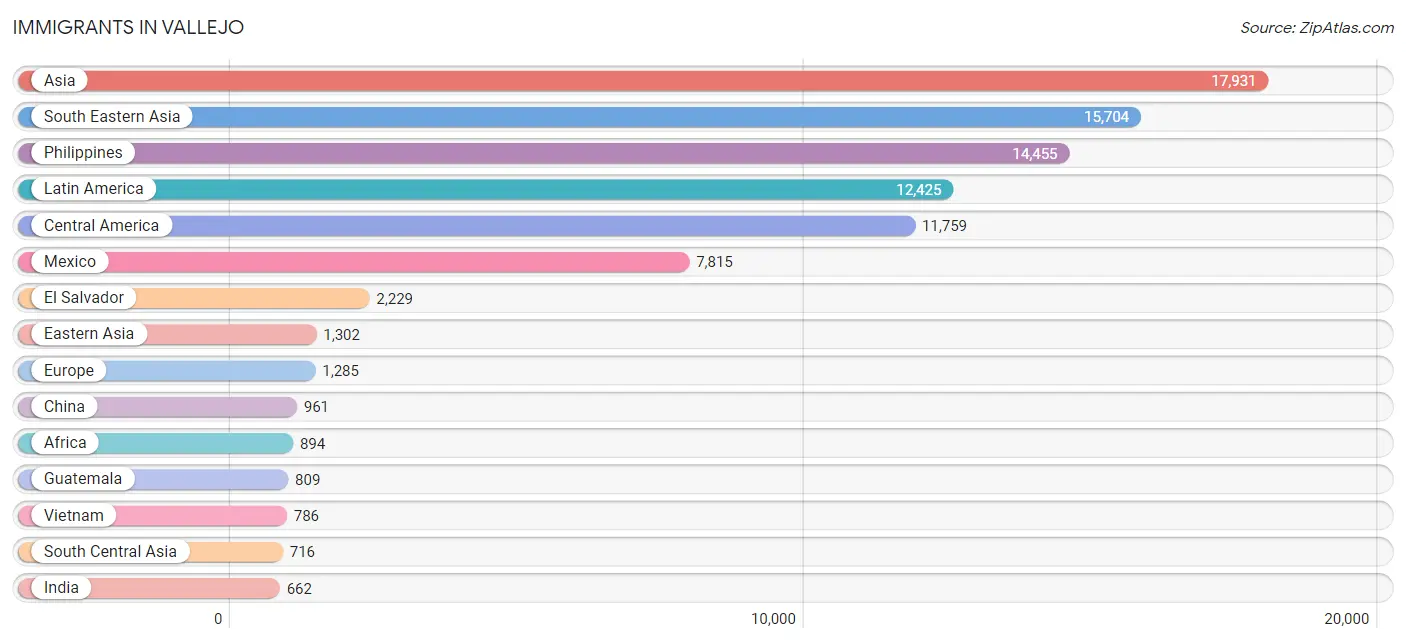
Immigrants in Vallejo
The most numerous immigrant groups reported in Vallejo came from Asia (17,931 | 14.3%), South Eastern Asia (15,704 | 12.6%), Philippines (14,455 | 11.6%), Latin America (12,425 | 9.9%), and Central America (11,759 | 9.4%), together accounting for 57.8% of all Vallejo residents.
| Immigration Origin | # Population | % Population |
| Afghanistan | 12 | 0.0% |
| Africa | 894 | 0.7% |
| Armenia | 11 | 0.0% |
| Asia | 17,931 | 14.3% |
| Australia | 16 | 0.0% |
| Austria | 29 | 0.0% |
| Azores | 24 | 0.0% |
| Belize | 9 | 0.0% |
| Bosnia and Herzegovina | 6 | 0.0% |
| Brazil | 122 | 0.1% |
| Bulgaria | 70 | 0.1% |
| Cambodia | 29 | 0.0% |
| Canada | 151 | 0.1% |
| Caribbean | 162 | 0.1% |
| Central America | 11,759 | 9.4% |
| Chile | 10 | 0.0% |
| China | 961 | 0.8% |
| Colombia | 240 | 0.2% |
| Costa Rica | 24 | 0.0% |
| Cuba | 32 | 0.0% |
| Czechoslovakia | 27 | 0.0% |
| Dominican Republic | 10 | 0.0% |
| Eastern Africa | 232 | 0.2% |
| Eastern Asia | 1,302 | 1.0% |
| Eastern Europe | 471 | 0.4% |
| Ecuador | 15 | 0.0% |
| Egypt | 117 | 0.1% |
| El Salvador | 2,229 | 1.8% |
| England | 83 | 0.1% |
| Eritrea | 14 | 0.0% |
| Ethiopia | 83 | 0.1% |
| Europe | 1,285 | 1.0% |
| Fiji | 179 | 0.1% |
| France | 76 | 0.1% |
| Germany | 216 | 0.2% |
| Ghana | 24 | 0.0% |
| Greece | 11 | 0.0% |
| Guatemala | 809 | 0.6% |
| Haiti | 84 | 0.1% |
| Honduras | 147 | 0.1% |
| Hong Kong | 200 | 0.2% |
| Hungary | 15 | 0.0% |
| India | 662 | 0.5% |
| Indonesia | 31 | 0.0% |
| Iran | 25 | 0.0% |
| Ireland | 7 | 0.0% |
| Israel | 7 | 0.0% |
| Italy | 89 | 0.1% |
| Jamaica | 36 | 0.0% |
| Japan | 76 | 0.1% |
| Jordan | 37 | 0.0% |
| Kenya | 12 | 0.0% |
| Korea | 265 | 0.2% |
| Laos | 106 | 0.1% |
| Latin America | 12,425 | 9.9% |
| Lebanon | 7 | 0.0% |
| Liberia | 23 | 0.0% |
| Malaysia | 21 | 0.0% |
| Mexico | 7,815 | 6.2% |
| Micronesia | 52 | 0.0% |
| Morocco | 10 | 0.0% |
| Nepal | 14 | 0.0% |
| Netherlands | 26 | 0.0% |
| Nicaragua | 648 | 0.5% |
| Nigeria | 179 | 0.1% |
| Northern Africa | 188 | 0.2% |
| Northern Europe | 225 | 0.2% |
| Norway | 5 | 0.0% |
| Oceania | 479 | 0.4% |
| Pakistan | 3 | 0.0% |
| Panama | 78 | 0.1% |
| Peru | 89 | 0.1% |
| Philippines | 14,455 | 11.6% |
| Poland | 20 | 0.0% |
| Portugal | 108 | 0.1% |
| Russia | 157 | 0.1% |
| Saudi Arabia | 19 | 0.0% |
| Scotland | 10 | 0.0% |
| Sierra Leone | 114 | 0.1% |
| Singapore | 17 | 0.0% |
| South Africa | 8 | 0.0% |
| South America | 504 | 0.4% |
| South Central Asia | 716 | 0.6% |
| South Eastern Asia | 15,704 | 12.6% |
| Southern Europe | 225 | 0.2% |
| Spain | 17 | 0.0% |
| Sudan | 1 | 0.0% |
| Sweden | 12 | 0.0% |
| Switzerland | 17 | 0.0% |
| Syria | 13 | 0.0% |
| Taiwan | 74 | 0.1% |
| Thailand | 239 | 0.2% |
| Turkey | 29 | 0.0% |
| Ukraine | 176 | 0.1% |
| Venezuela | 28 | 0.0% |
| Vietnam | 786 | 0.6% |
| Western Africa | 340 | 0.3% |
| Western Asia | 188 | 0.2% |
| Western Europe | 364 | 0.3% |
| Yemen | 52 | 0.0% | View All 100 Rows |
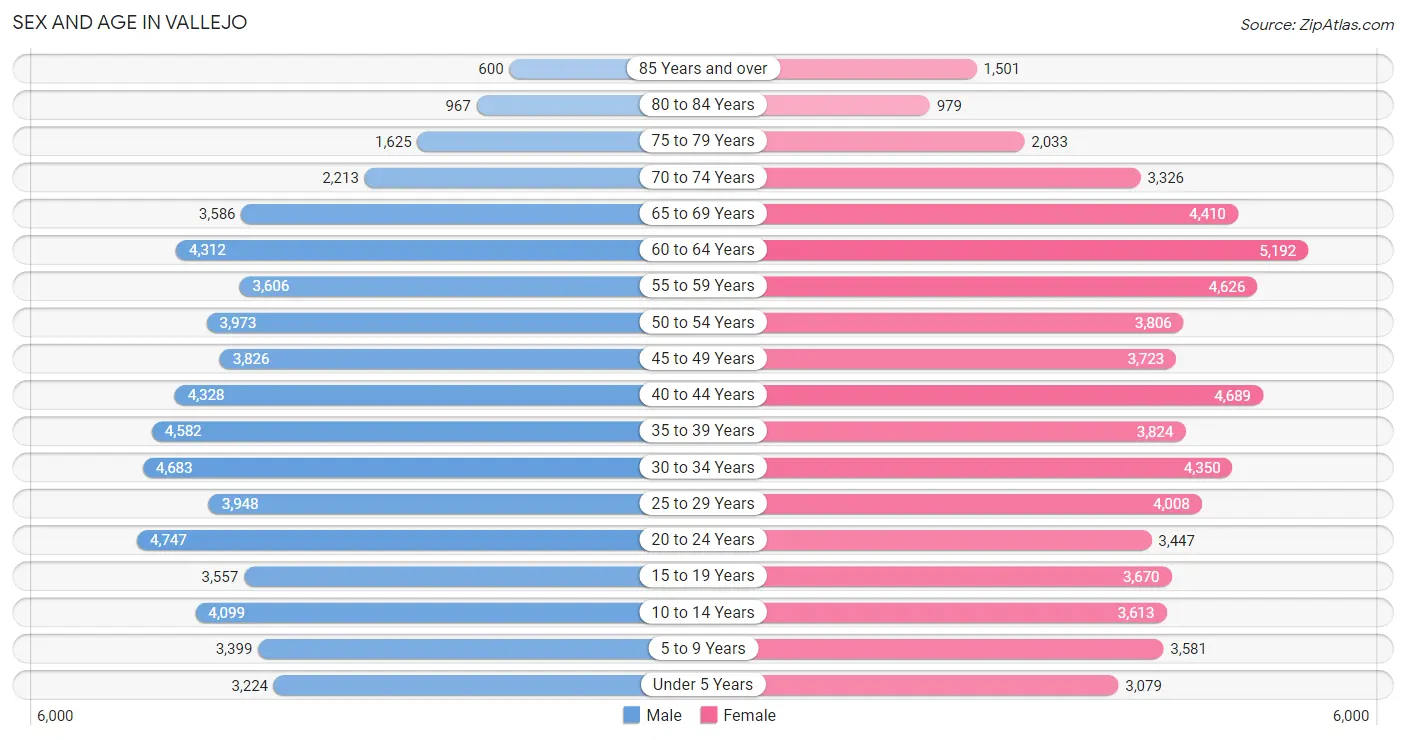
Sex and Age in Vallejo
Sex and Age in Vallejo
The most populous age groups in Vallejo are 20 to 24 Years (4,747 | 7.7%) for men and 60 to 64 Years (5,192 | 8.1%) for women.
| Age Bracket | Male | Female |
| Under 5 Years | 3,224 (5.3%) | 3,079 (4.8%) |
| 5 to 9 Years | 3,399 (5.6%) | 3,581 (5.6%) |
| 10 to 14 Years | 4,099 (6.7%) | 3,613 (5.7%) |
| 15 to 19 Years | 3,557 (5.8%) | 3,670 (5.8%) |
| 20 to 24 Years | 4,747 (7.7%) | 3,447 (5.4%) |
| 25 to 29 Years | 3,948 (6.4%) | 4,008 (6.3%) |
| 30 to 34 Years | 4,683 (7.6%) | 4,350 (6.8%) |
| 35 to 39 Years | 4,582 (7.5%) | 3,824 (6.0%) |
| 40 to 44 Years | 4,328 (7.1%) | 4,689 (7.3%) |
| 45 to 49 Years | 3,826 (6.2%) | 3,723 (5.8%) |
| 50 to 54 Years | 3,973 (6.5%) | 3,806 (6.0%) |
| 55 to 59 Years | 3,606 (5.9%) | 4,626 (7.2%) |
| 60 to 64 Years | 4,312 (7.0%) | 5,192 (8.1%) |
| 65 to 69 Years | 3,586 (5.9%) | 4,410 (6.9%) |
| 70 to 74 Years | 2,213 (3.6%) | 3,326 (5.2%) |
| 75 to 79 Years | 1,625 (2.6%) | 2,033 (3.2%) |
| 80 to 84 Years | 967 (1.6%) | 979 (1.5%) |
| 85 Years and over | 600 (1.0%) | 1,501 (2.4%) |
| Total | 61,275 (100.0%) | 63,857 (100.0%) |
Families and Households in Vallejo
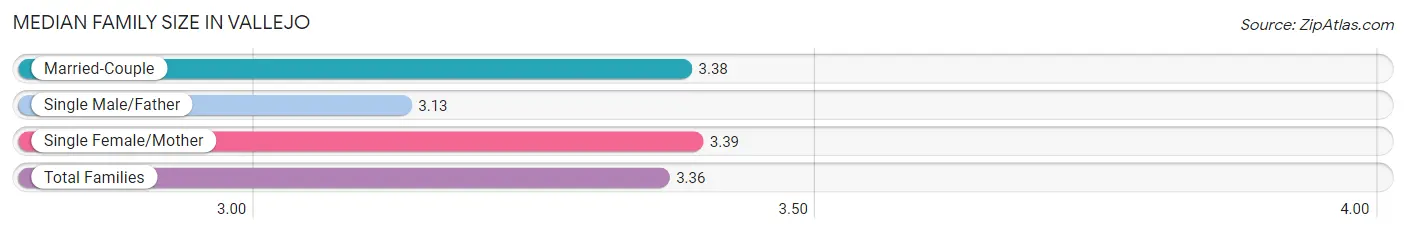
Median Family Size in Vallejo
The median family size in Vallejo is 3.36 persons per family, with single female/mother families (7,212 | 24.2%) accounting for the largest median family size of 3.39 persons per family. On the other hand, single male/father families (3,166 | 10.6%) represent the smallest median family size with 3.13 persons per family.
| Family Type | # Families | Family Size |
| Married-Couple | 19,375 (65.1%) | 3.38 |
| Single Male/Father | 3,166 (10.6%) | 3.13 |
| Single Female/Mother | 7,212 (24.2%) | 3.39 |
| Total Families | 29,753 (100.0%) | 3.36 |
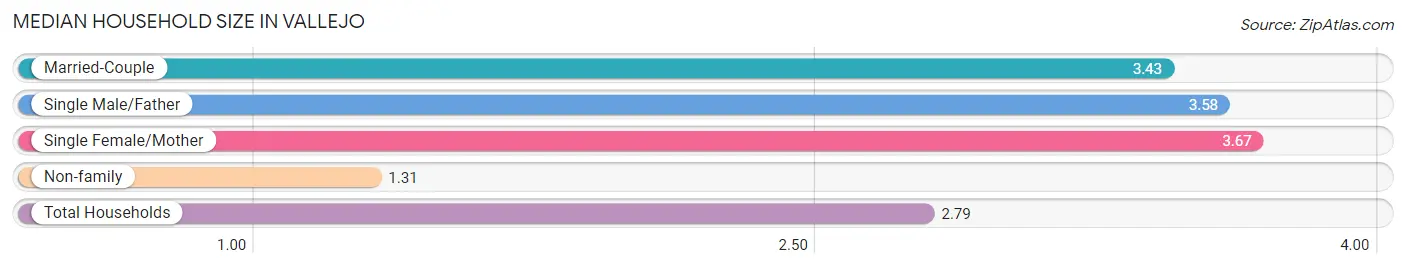
Median Household Size in Vallejo
The median household size in Vallejo is 2.79 persons per household, with single female/mother households (7,212 | 16.4%) accounting for the largest median household size of 3.67 persons per household. non-family households (14,354 | 32.5%) represent the smallest median household size with 1.31 persons per household.
| Household Type | # Households | Household Size |
| Married-Couple | 19,375 (43.9%) | 3.43 |
| Single Male/Father | 3,166 (7.2%) | 3.58 |
| Single Female/Mother | 7,212 (16.4%) | 3.67 |
| Non-family | 14,354 (32.5%) | 1.31 |
| Total Households | 44,107 (100.0%) | 2.79 |
Household Size by Marriage Status in Vallejo
Out of a total of 44,107 households in Vallejo, 29,753 (67.5%) are family households, while 14,354 (32.5%) are nonfamily households. The most numerous type of family households are 2-person households, comprising 11,231, and the most common type of nonfamily households are 1-person households, comprising 11,453.
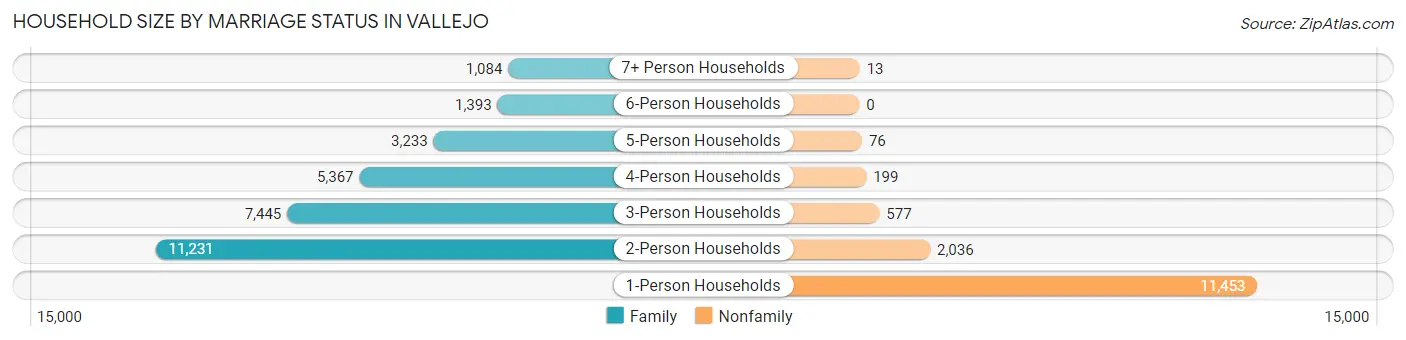
| Household Size | Family Households | Nonfamily Households |
| 1-Person Households | - | 11,453 (26.0%) |
| 2-Person Households | 11,231 (25.5%) | 2,036 (4.6%) |
| 3-Person Households | 7,445 (16.9%) | 577 (1.3%) |
| 4-Person Households | 5,367 (12.2%) | 199 (0.4%) |
| 5-Person Households | 3,233 (7.3%) | 76 (0.2%) |
| 6-Person Households | 1,393 (3.2%) | 0 (0.0%) |
| 7+ Person Households | 1,084 (2.5%) | 13 (0.0%) |
| Total | 29,753 (67.5%) | 14,354 (32.5%) |
Female Fertility in Vallejo
Fertility by Age in Vallejo
Average fertility rate in Vallejo is 56.0 births per 1,000 women. Women in the age bracket of 20 to 34 years have the highest fertility rate with 82.0 births per 1,000 women. Women in the age bracket of 20 to 34 years acount for 59.9% of all women with births.
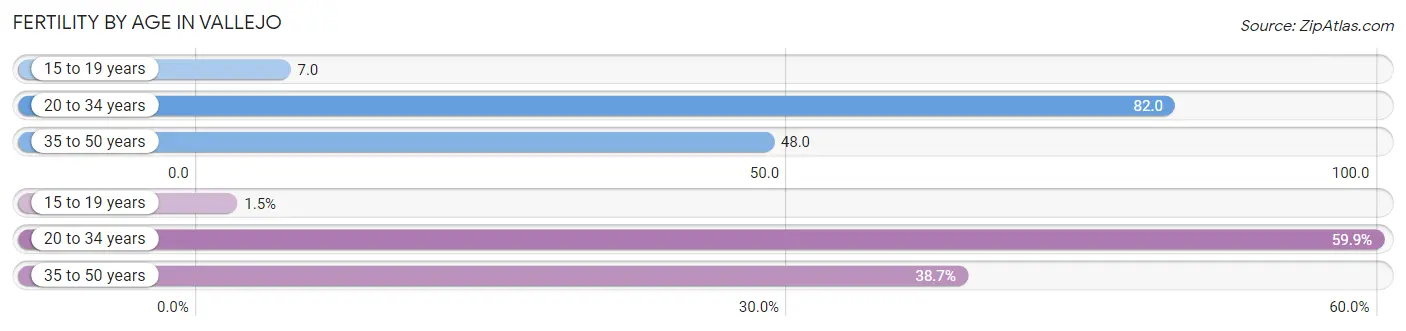
| Age Bracket | Women with Births | Births / 1,000 Women |
| 15 to 19 years | 24 (1.5%) | 7.0 |
| 20 to 34 years | 966 (59.9%) | 82.0 |
| 35 to 50 years | 624 (38.7%) | 48.0 |
| Total | 1,614 (100.0%) | 56.0 |
Fertility by Age by Marriage Status in Vallejo
63.3% of women with births (1,614) in Vallejo are married. The highest percentage of unmarried women with births falls into 15 to 19 years age bracket with 100.0% of them unmarried at the time of birth, while the lowest percentage of unmarried women with births belong to 35 to 50 years age bracket with 22.0% of them unmarried.
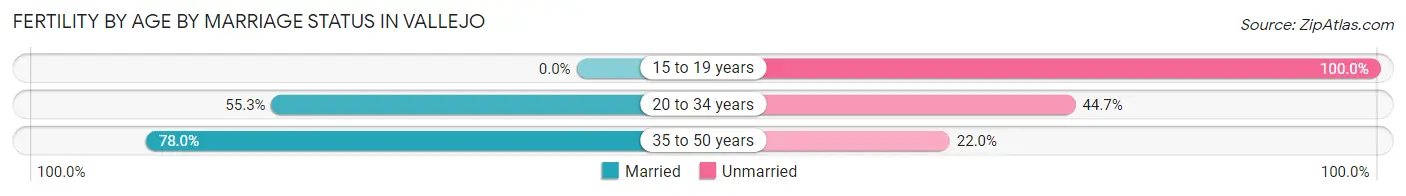
| Age Bracket | Married | Unmarried |
| 15 to 19 years | 0 (0.0%) | 24 (100.0%) |
| 20 to 34 years | 534 (55.3%) | 432 (44.7%) |
| 35 to 50 years | 487 (78.0%) | 137 (22.0%) |
| Total | 1,022 (63.3%) | 592 (36.7%) |
Fertility by Education in Vallejo
Average fertility rate in Vallejo is 56.0 births per 1,000 women. Women with the education attainment of college or associate's degree have the highest fertility rate of 71.0 births per 1,000 women, while women with the education attainment of graduate degree have the lowest fertility at 23.0 births per 1,000 women. Women with the education attainment of college or associate's degree represent 43.2% of all women with births.
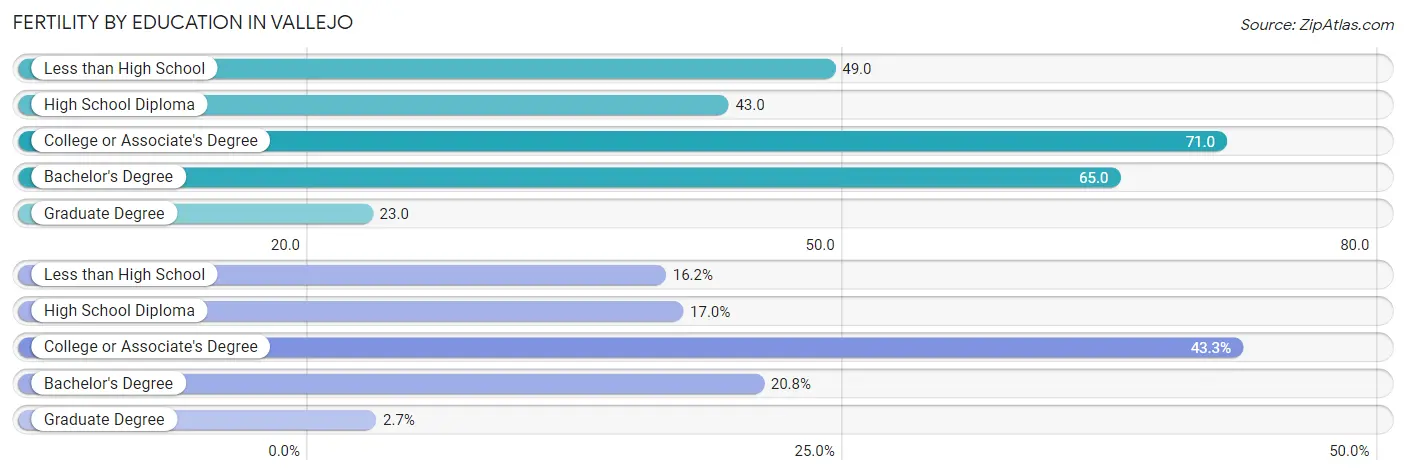
| Educational Attainment | Women with Births | Births / 1,000 Women |
| Less than High School | 262 (16.2%) | 49.0 |
| High School Diploma | 275 (17.0%) | 43.0 |
| College or Associate's Degree | 698 (43.2%) | 71.0 |
| Bachelor's Degree | 336 (20.8%) | 65.0 |
| Graduate Degree | 43 (2.7%) | 23.0 |
| Total | 1,614 (100.0%) | 56.0 |
Fertility by Education by Marriage Status in Vallejo
36.7% of women with births in Vallejo are unmarried. Women with the educational attainment of graduate degree are most likely to be married with 100.0% of them married at childbirth, while women with the educational attainment of high school diploma are least likely to be married with 49.1% of them unmarried at childbirth.
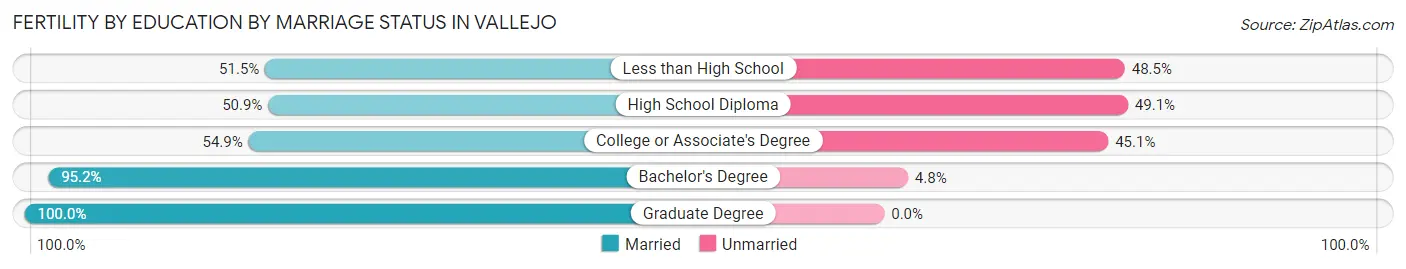
| Educational Attainment | Married | Unmarried |
| Less than High School | 135 (51.5%) | 127 (48.5%) |
| High School Diploma | 140 (50.9%) | 135 (49.1%) |
| College or Associate's Degree | 383 (54.9%) | 315 (45.1%) |
| Bachelor's Degree | 320 (95.2%) | 16 (4.8%) |
| Graduate Degree | 43 (100.0%) | 0 (0.0%) |
| Total | 1,022 (63.3%) | 592 (36.7%) |
Employment Characteristics in Vallejo
Employment by Class of Employer in Vallejo
Among the 58,219 employed individuals in Vallejo, private company employees (38,713 | 66.5%), not-for-profit organizations (5,316 | 9.1%), and local government employees (4,593 | 7.9%) make up the most common classes of employment.
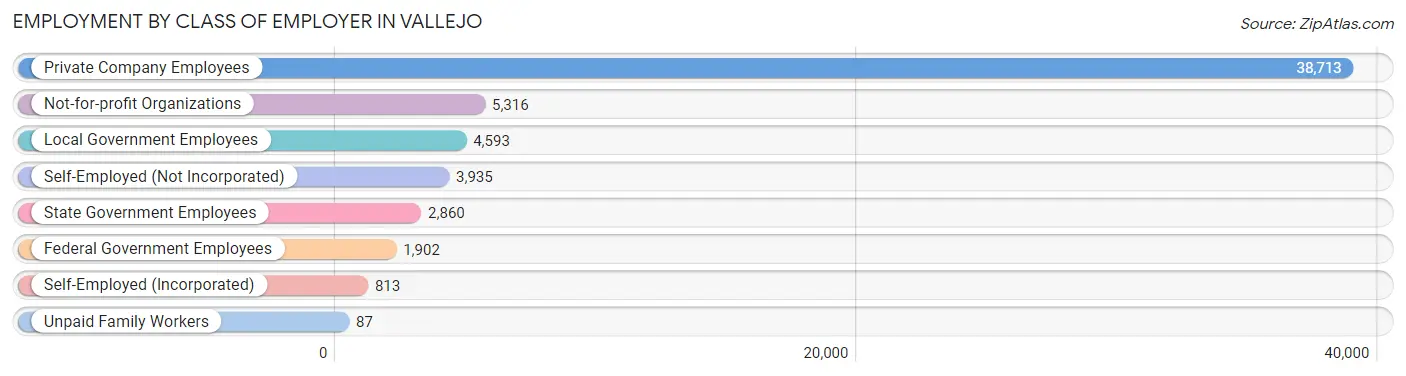
| Employer Class | # Employees | % Employees |
| Private Company Employees | 38,713 | 66.5% |
| Self-Employed (Incorporated) | 813 | 1.4% |
| Self-Employed (Not Incorporated) | 3,935 | 6.8% |
| Not-for-profit Organizations | 5,316 | 9.1% |
| Local Government Employees | 4,593 | 7.9% |
| State Government Employees | 2,860 | 4.9% |
| Federal Government Employees | 1,902 | 3.3% |
| Unpaid Family Workers | 87 | 0.2% |
| Total | 58,219 | 100.0% |
Employment Status by Age in Vallejo
According to the labor force statistics for Vallejo, out of the total population over 16 years of age (102,768), 63.5% or 65,258 individuals are in the labor force, with 7.0% or 4,568 of them unemployed. The age group with the highest labor force participation rate is 30 to 34 years, with 84.3% or 7,615 individuals in the labor force. Within the labor force, the 16 to 19 years age range has the highest percentage of unemployed individuals, with 23.8% or 528 of them being unemployed.
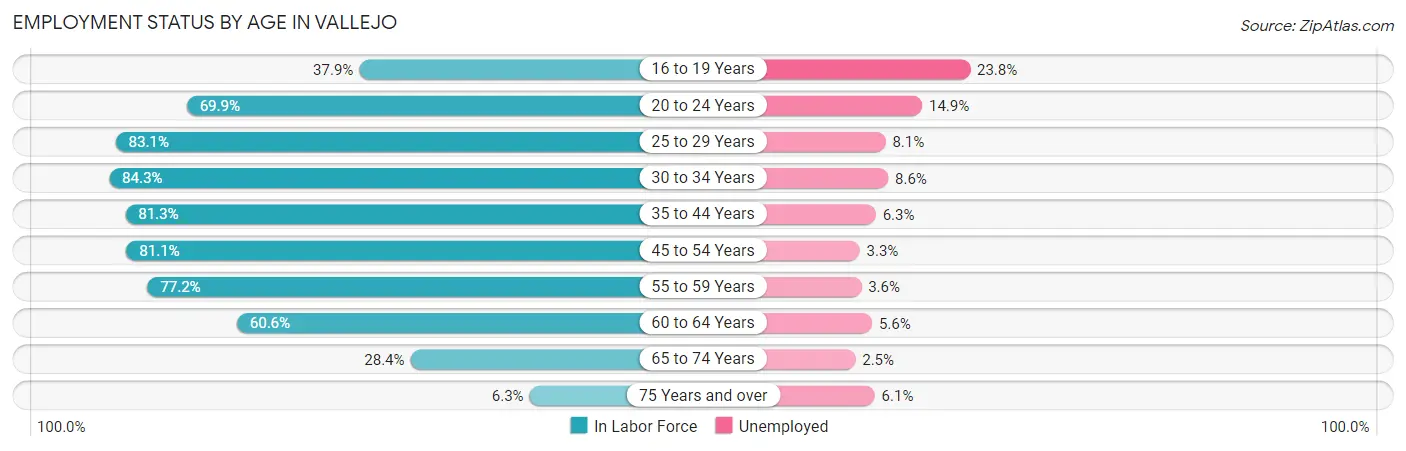
| Age Bracket | In Labor Force | Unemployed |
| 16 to 19 Years | 2,220 (37.9%) | 528 (23.8%) |
| 20 to 24 Years | 5,728 (69.9%) | 853 (14.9%) |
| 25 to 29 Years | 6,611 (83.1%) | 535 (8.1%) |
| 30 to 34 Years | 7,615 (84.3%) | 655 (8.6%) |
| 35 to 44 Years | 14,165 (81.3%) | 892 (6.3%) |
| 45 to 54 Years | 12,431 (81.1%) | 410 (3.3%) |
| 55 to 59 Years | 6,355 (77.2%) | 229 (3.6%) |
| 60 to 64 Years | 5,759 (60.6%) | 323 (5.6%) |
| 65 to 74 Years | 3,844 (28.4%) | 96 (2.5%) |
| 75 Years and over | 485 (6.3%) | 30 (6.1%) |
| Total | 65,258 (63.5%) | 4,568 (7.0%) |
Employment Status by Educational Attainment in Vallejo
According to labor force statistics for Vallejo, 78.5% of individuals (52,969) out of the total population between 25 and 64 years of age (67,476) are in the labor force, with 5.8% or 3,072 of them being unemployed. The group with the highest labor force participation rate are those with the educational attainment of bachelor's degree or higher, with 85.7% or 15,241 individuals in the labor force. Within the labor force, individuals with less than high school education have the highest percentage of unemployment, with 10.5% or 642 of them being unemployed.
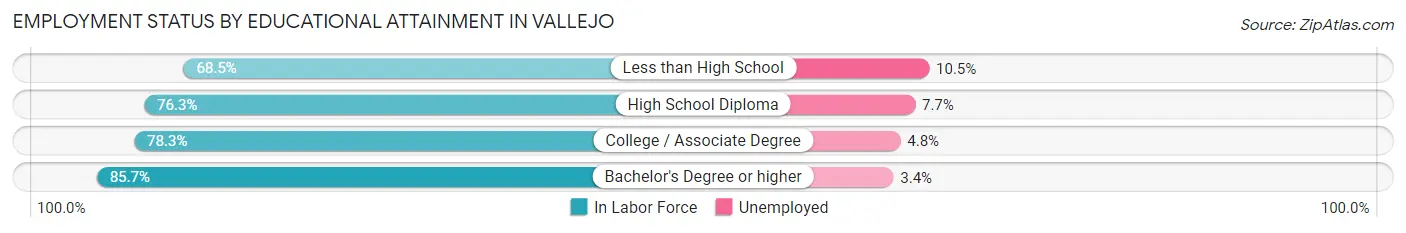
| Educational Attainment | In Labor Force | Unemployed |
| Less than High School | 6,114 (68.5%) | 937 (10.5%) |
| High School Diploma | 12,747 (76.3%) | 1,286 (7.7%) |
| College / Associate Degree | 18,840 (78.3%) | 1,155 (4.8%) |
| Bachelor's Degree or higher | 15,241 (85.7%) | 605 (3.4%) |
| Total | 52,969 (78.5%) | 3,914 (5.8%) |
Employment Occupations by Sex in Vallejo
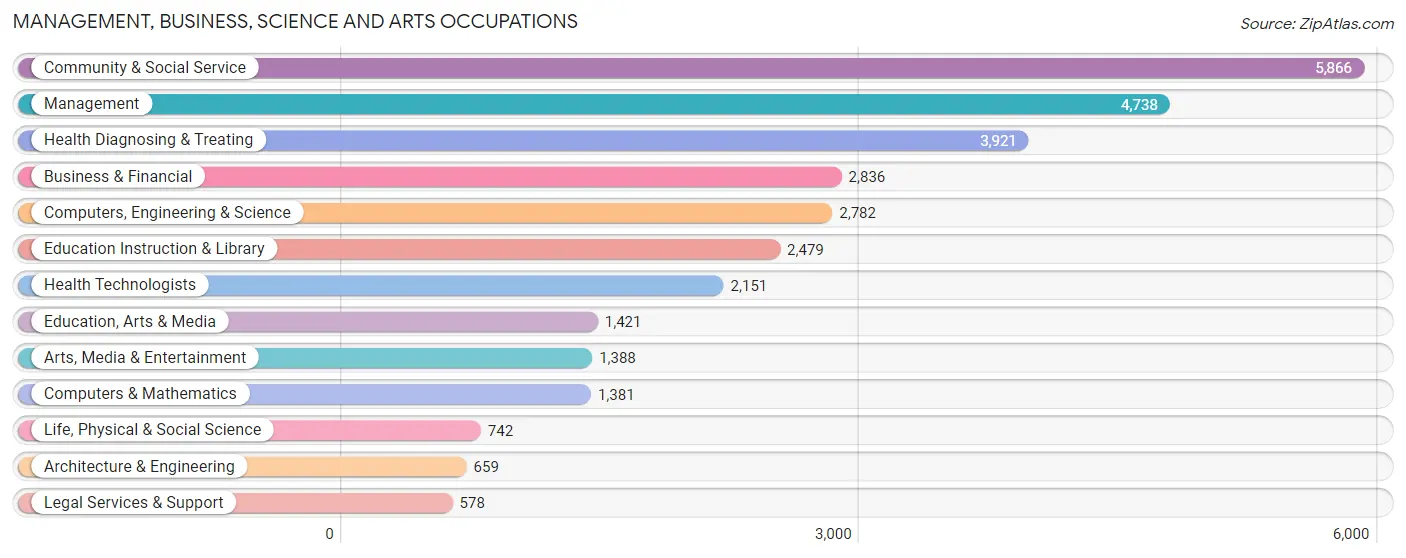
Management, Business, Science and Arts Occupations
The most common Management, Business, Science and Arts occupations in Vallejo are Community & Social Service (5,866 | 9.7%), Management (4,738 | 7.8%), Health Diagnosing & Treating (3,921 | 6.5%), Business & Financial (2,836 | 4.7%), and Computers, Engineering & Science (2,782 | 4.6%).
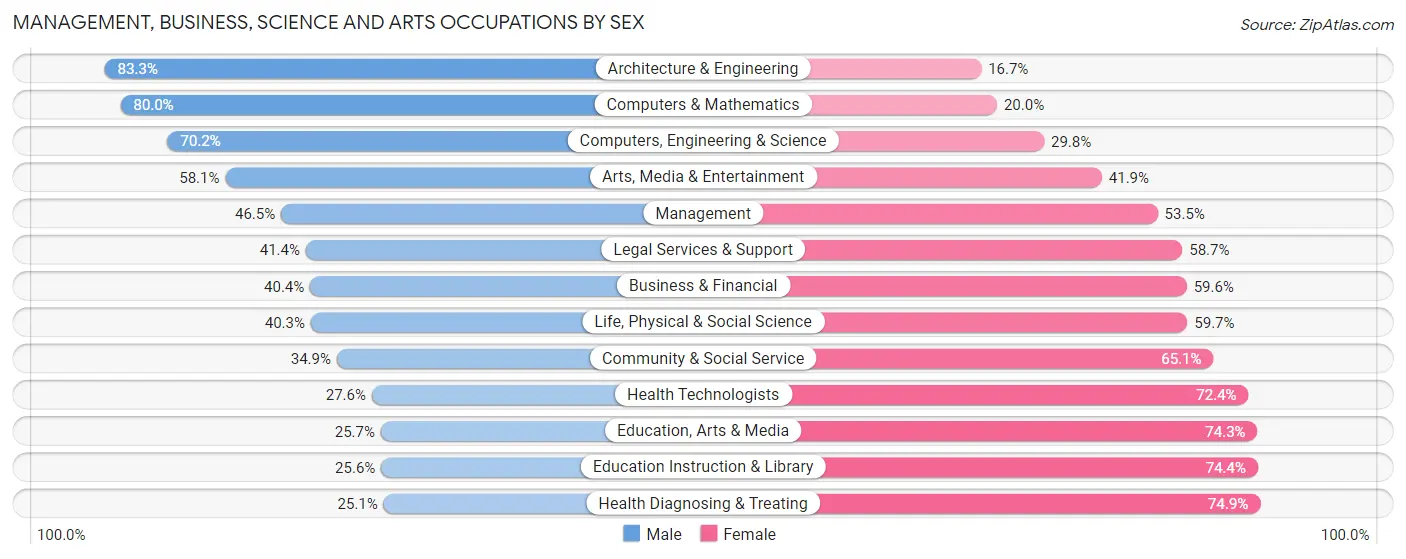
Management, Business, Science and Arts Occupations by Sex
Within the Management, Business, Science and Arts occupations in Vallejo, the most male-oriented occupations are Architecture & Engineering (83.3%), Computers & Mathematics (80.0%), and Computers, Engineering & Science (70.2%), while the most female-oriented occupations are Health Diagnosing & Treating (74.9%), Education Instruction & Library (74.4%), and Education, Arts & Media (74.3%).
| Occupation | Male | Female |
| Management | 2,203 (46.5%) | 2,535 (53.5%) |
| Business & Financial | 1,147 (40.4%) | 1,689 (59.6%) |
| Computers, Engineering & Science | 1,953 (70.2%) | 829 (29.8%) |
| Computers & Mathematics | 1,105 (80.0%) | 276 (20.0%) |
| Architecture & Engineering | 549 (83.3%) | 110 (16.7%) |
| Life, Physical & Social Science | 299 (40.3%) | 443 (59.7%) |
| Community & Social Service | 2,046 (34.9%) | 3,820 (65.1%) |
| Education, Arts & Media | 365 (25.7%) | 1,056 (74.3%) |
| Legal Services & Support | 239 (41.3%) | 339 (58.7%) |
| Education Instruction & Library | 635 (25.6%) | 1,844 (74.4%) |
| Arts, Media & Entertainment | 807 (58.1%) | 581 (41.9%) |
| Health Diagnosing & Treating | 985 (25.1%) | 2,936 (74.9%) |
| Health Technologists | 593 (27.6%) | 1,558 (72.4%) |
| Total (Category) | 8,334 (41.4%) | 11,809 (58.6%) |
| Total (Overall) | 31,508 (52.1%) | 28,913 (47.8%) |
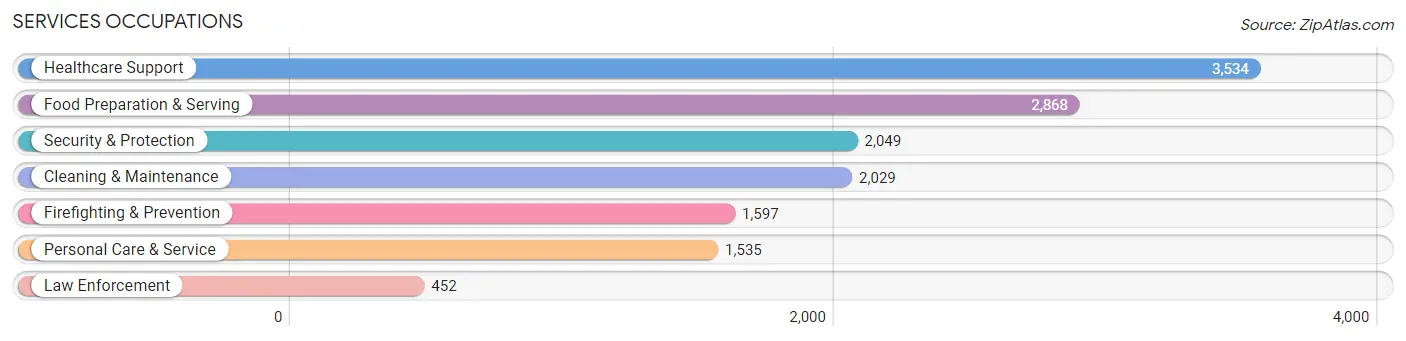
Services Occupations
The most common Services occupations in Vallejo are Healthcare Support (3,534 | 5.9%), Food Preparation & Serving (2,868 | 4.8%), Security & Protection (2,049 | 3.4%), Cleaning & Maintenance (2,029 | 3.4%), and Firefighting & Prevention (1,597 | 2.6%).
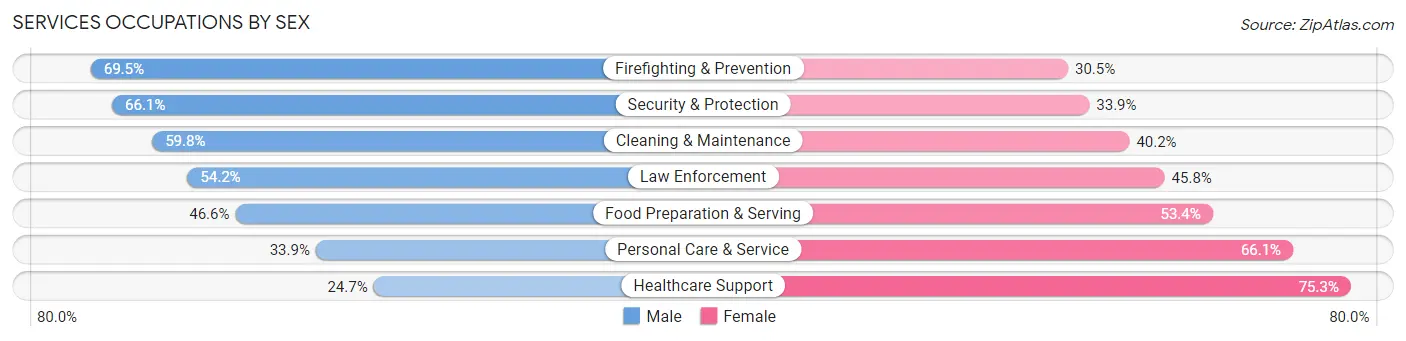
Services Occupations by Sex
Within the Services occupations in Vallejo, the most male-oriented occupations are Firefighting & Prevention (69.5%), Security & Protection (66.1%), and Cleaning & Maintenance (59.8%), while the most female-oriented occupations are Healthcare Support (75.3%), Personal Care & Service (66.1%), and Food Preparation & Serving (53.4%).
| Occupation | Male | Female |
| Healthcare Support | 874 (24.7%) | 2,660 (75.3%) |
| Security & Protection | 1,355 (66.1%) | 694 (33.9%) |
| Firefighting & Prevention | 1,110 (69.5%) | 487 (30.5%) |
| Law Enforcement | 245 (54.2%) | 207 (45.8%) |
| Food Preparation & Serving | 1,337 (46.6%) | 1,531 (53.4%) |
| Cleaning & Maintenance | 1,213 (59.8%) | 816 (40.2%) |
| Personal Care & Service | 520 (33.9%) | 1,015 (66.1%) |
| Total (Category) | 5,299 (44.1%) | 6,716 (55.9%) |
| Total (Overall) | 31,508 (52.1%) | 28,913 (47.8%) |
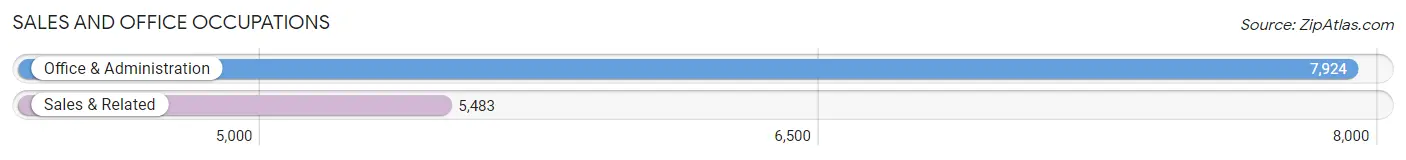
Sales and Office Occupations
The most common Sales and Office occupations in Vallejo are Office & Administration (7,924 | 13.1%), and Sales & Related (5,483 | 9.1%).
Sales and Office Occupations by Sex
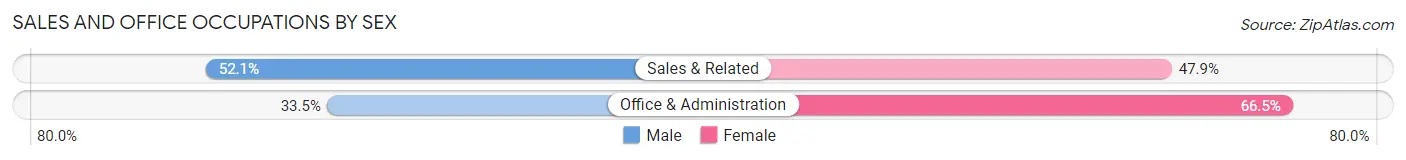
| Occupation | Male | Female |
| Sales & Related | 2,858 (52.1%) | 2,625 (47.9%) |
| Office & Administration | 2,656 (33.5%) | 5,268 (66.5%) |
| Total (Category) | 5,514 (41.1%) | 7,893 (58.9%) |
| Total (Overall) | 31,508 (52.1%) | 28,913 (47.8%) |
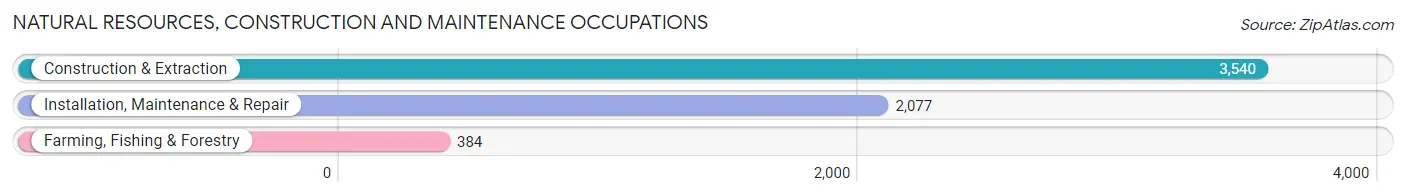
Natural Resources, Construction and Maintenance Occupations
The most common Natural Resources, Construction and Maintenance occupations in Vallejo are Construction & Extraction (3,540 | 5.9%), Installation, Maintenance & Repair (2,077 | 3.4%), and Farming, Fishing & Forestry (384 | 0.6%).
Natural Resources, Construction and Maintenance Occupations by Sex
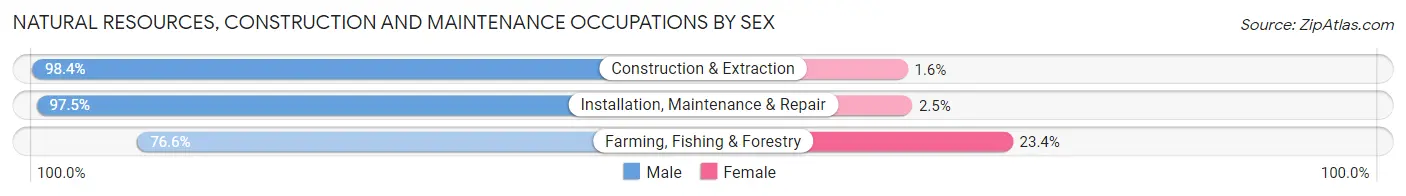
| Occupation | Male | Female |
| Farming, Fishing & Forestry | 294 (76.6%) | 90 (23.4%) |
| Construction & Extraction | 3,484 (98.4%) | 56 (1.6%) |
| Installation, Maintenance & Repair | 2,025 (97.5%) | 52 (2.5%) |
| Total (Category) | 5,803 (96.7%) | 198 (3.3%) |
| Total (Overall) | 31,508 (52.1%) | 28,913 (47.8%) |
Production, Transportation and Moving Occupations
The most common Production, Transportation and Moving occupations in Vallejo are Production (3,298 | 5.5%), Transportation (2,809 | 4.6%), and Material Moving (2,748 | 4.5%).
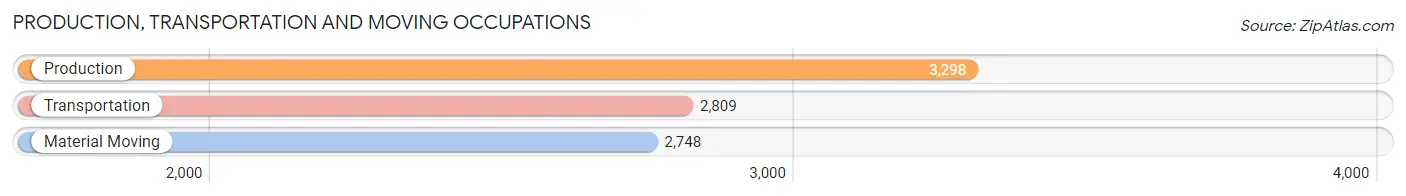
Production, Transportation and Moving Occupations by Sex
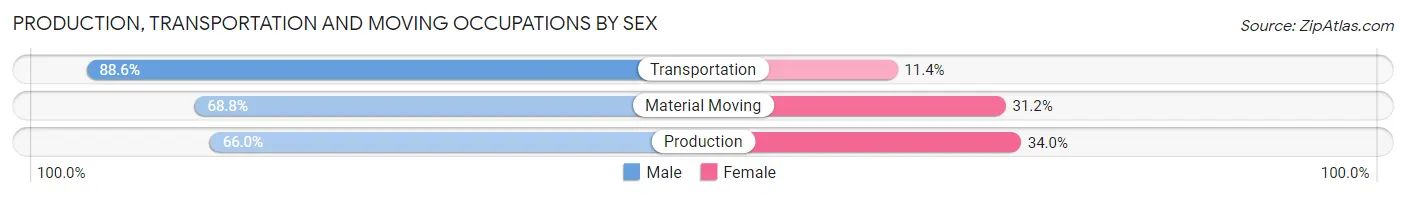
| Occupation | Male | Female |
| Production | 2,177 (66.0%) | 1,121 (34.0%) |
| Transportation | 2,490 (88.6%) | 319 (11.4%) |
| Material Moving | 1,891 (68.8%) | 857 (31.2%) |
| Total (Category) | 6,558 (74.1%) | 2,297 (25.9%) |
| Total (Overall) | 31,508 (52.1%) | 28,913 (47.8%) |
Employment Industries by Sex in Vallejo
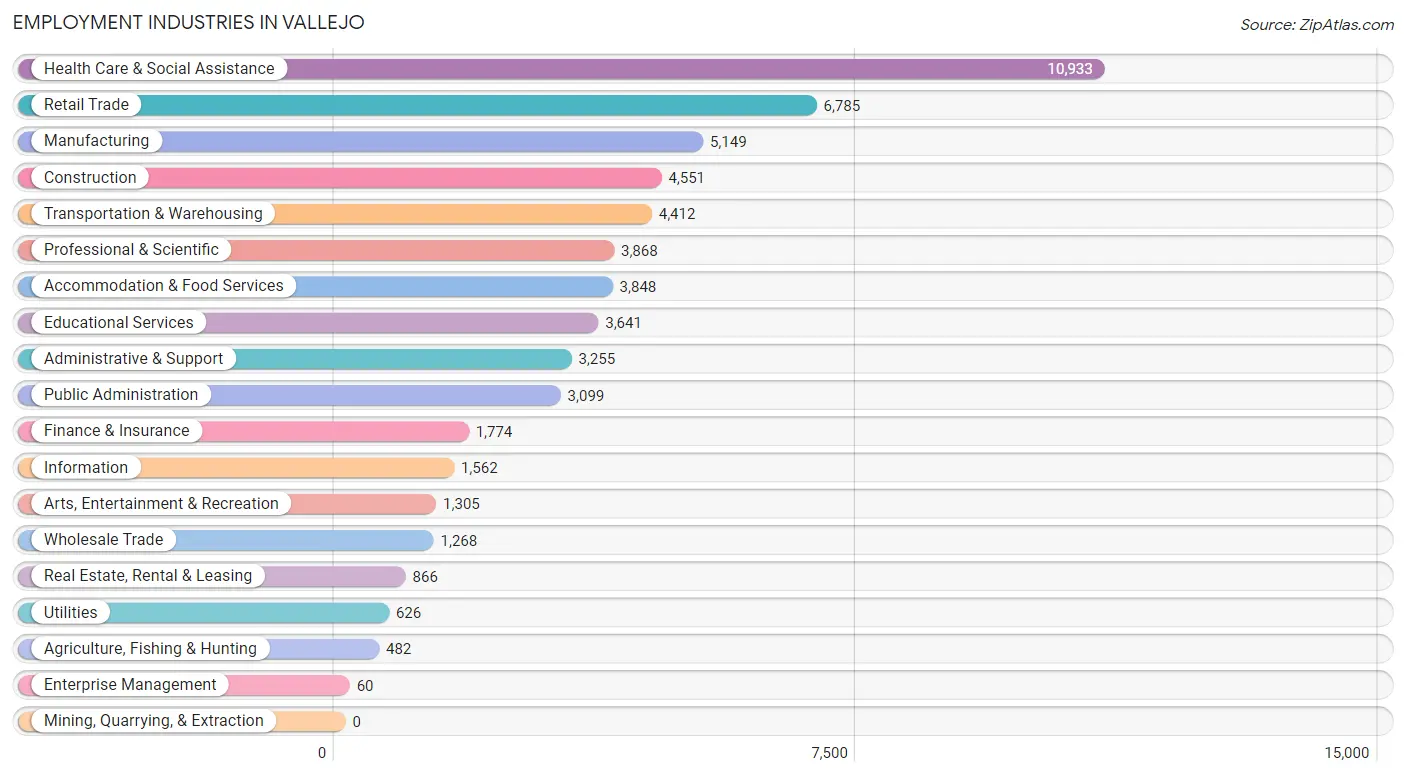
Employment Industries in Vallejo
The major employment industries in Vallejo include Health Care & Social Assistance (10,933 | 18.1%), Retail Trade (6,785 | 11.2%), Manufacturing (5,149 | 8.5%), Construction (4,551 | 7.5%), and Transportation & Warehousing (4,412 | 7.3%).
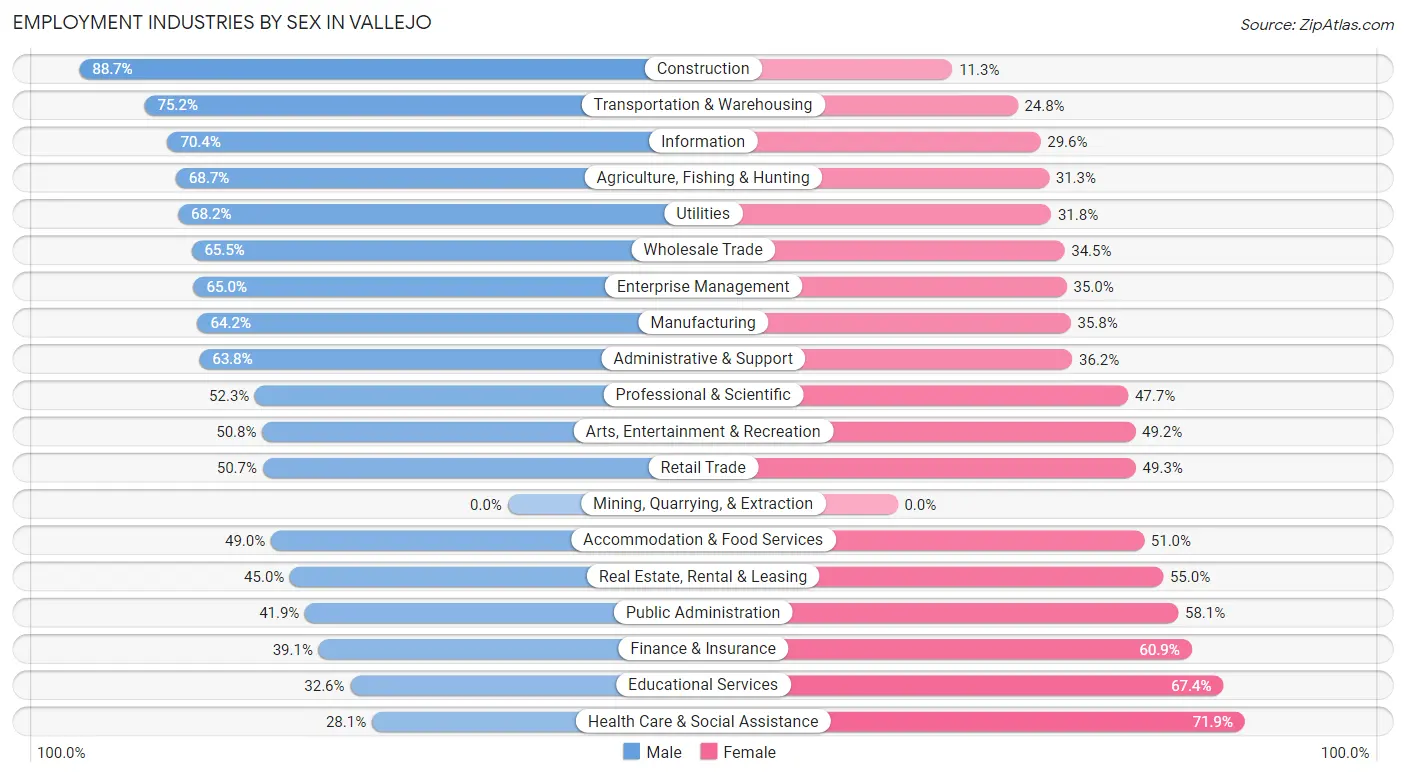
Employment Industries by Sex in Vallejo
The Vallejo industries that see more men than women are Construction (88.7%), Transportation & Warehousing (75.2%), and Information (70.4%), whereas the industries that tend to have a higher number of women are Health Care & Social Assistance (71.9%), Educational Services (67.4%), and Finance & Insurance (60.9%).
| Industry | Male | Female |
| Agriculture, Fishing & Hunting | 331 (68.7%) | 151 (31.3%) |
| Mining, Quarrying, & Extraction | 0 (0.0%) | 0 (0.0%) |
| Construction | 4,035 (88.7%) | 516 (11.3%) |
| Manufacturing | 3,304 (64.2%) | 1,845 (35.8%) |
| Wholesale Trade | 830 (65.5%) | 438 (34.5%) |
| Retail Trade | 3,439 (50.7%) | 3,346 (49.3%) |
| Transportation & Warehousing | 3,316 (75.2%) | 1,096 (24.8%) |
| Utilities | 427 (68.2%) | 199 (31.8%) |
| Information | 1,100 (70.4%) | 462 (29.6%) |
| Finance & Insurance | 694 (39.1%) | 1,080 (60.9%) |
| Real Estate, Rental & Leasing | 390 (45.0%) | 476 (55.0%) |
| Professional & Scientific | 2,022 (52.3%) | 1,846 (47.7%) |
| Enterprise Management | 39 (65.0%) | 21 (35.0%) |
| Administrative & Support | 2,078 (63.8%) | 1,177 (36.2%) |
| Educational Services | 1,186 (32.6%) | 2,455 (67.4%) |
| Health Care & Social Assistance | 3,072 (28.1%) | 7,861 (71.9%) |
| Arts, Entertainment & Recreation | 663 (50.8%) | 642 (49.2%) |
| Accommodation & Food Services | 1,885 (49.0%) | 1,963 (51.0%) |
| Public Administration | 1,299 (41.9%) | 1,800 (58.1%) |
| Total | 31,508 (52.1%) | 28,913 (47.8%) |
Education in Vallejo
School Enrollment in Vallejo
The most common levels of schooling among the 28,109 students in Vallejo are college / undergraduate (6,870 | 24.4%), middle school (6,014 | 21.4%), and high school (5,913 | 21.0%).
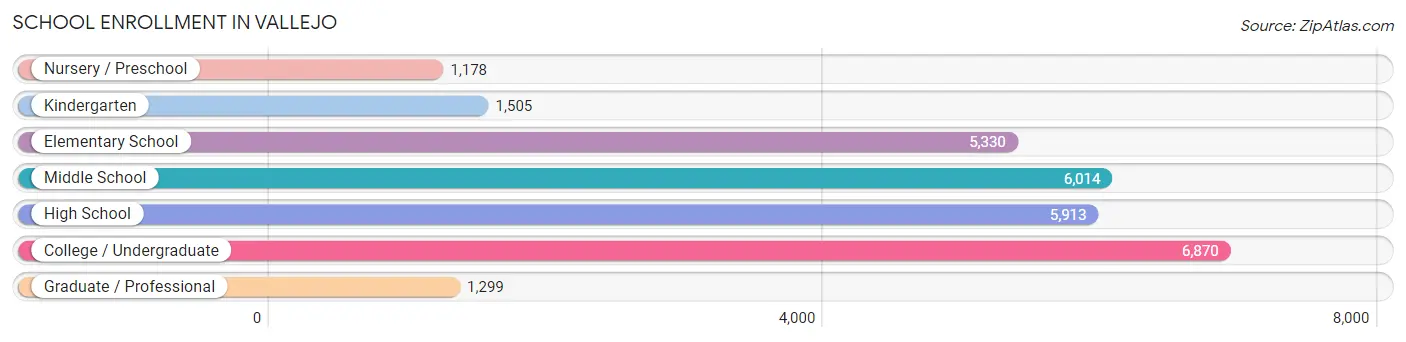
| School Level | # Students | % Students |
| Nursery / Preschool | 1,178 | 4.2% |
| Kindergarten | 1,505 | 5.3% |
| Elementary School | 5,330 | 19.0% |
| Middle School | 6,014 | 21.4% |
| High School | 5,913 | 21.0% |
| College / Undergraduate | 6,870 | 24.4% |
| Graduate / Professional | 1,299 | 4.6% |
| Total | 28,109 | 100.0% |
School Enrollment by Age by Funding Source in Vallejo
Out of a total of 28,109 students who are enrolled in schools in Vallejo, 4,947 (17.6%) attend a private institution, while the remaining 23,162 (82.4%) are enrolled in public schools. The age group of 3 to 4 year olds has the highest likelihood of being enrolled in private schools, with 407 (39.8% in the age bracket) enrolled. Conversely, the age group of 15 to 17 year olds has the lowest likelihood of being enrolled in a private school, with 3,736 (90.4% in the age bracket) attending a public institution.
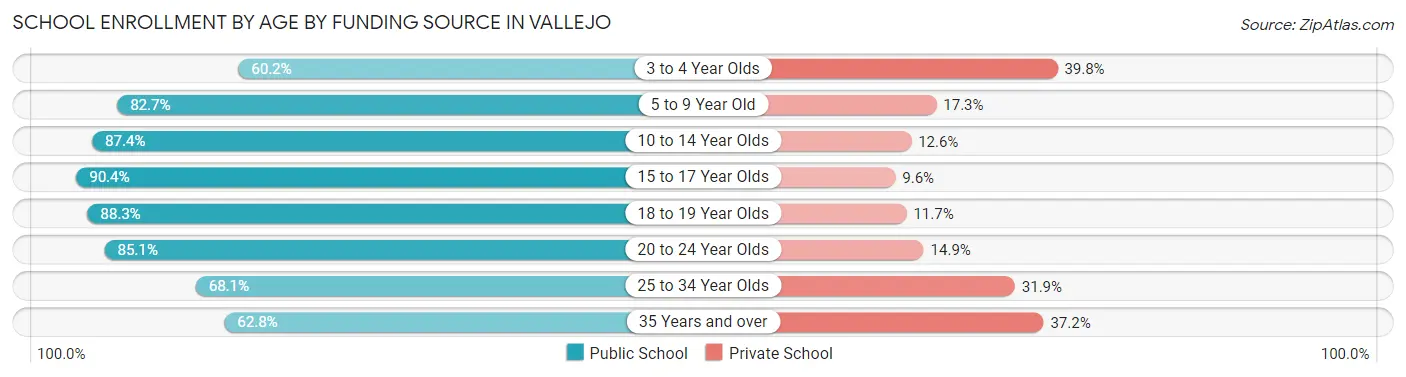
| Age Bracket | Public School | Private School |
| 3 to 4 Year Olds | 615 (60.2%) | 407 (39.8%) |
| 5 to 9 Year Old | 5,217 (82.7%) | 1,088 (17.3%) |
| 10 to 14 Year Olds | 6,533 (87.4%) | 940 (12.6%) |
| 15 to 17 Year Olds | 3,736 (90.4%) | 398 (9.6%) |
| 18 to 19 Year Olds | 1,721 (88.3%) | 228 (11.7%) |
| 20 to 24 Year Olds | 2,632 (85.1%) | 461 (14.9%) |
| 25 to 34 Year Olds | 1,512 (68.1%) | 708 (31.9%) |
| 35 Years and over | 1,201 (62.8%) | 712 (37.2%) |
| Total | 23,162 (82.4%) | 4,947 (17.6%) |
Educational Attainment by Field of Study in Vallejo
Business (5,281 | 20.4%), science & technology (3,507 | 13.6%), social sciences (2,577 | 10.0%), arts & humanities (1,844 | 7.1%), and bio, nature & agricultural (1,754 | 6.8%) are the most common fields of study among 25,857 individuals in Vallejo who have obtained a bachelor's degree or higher.
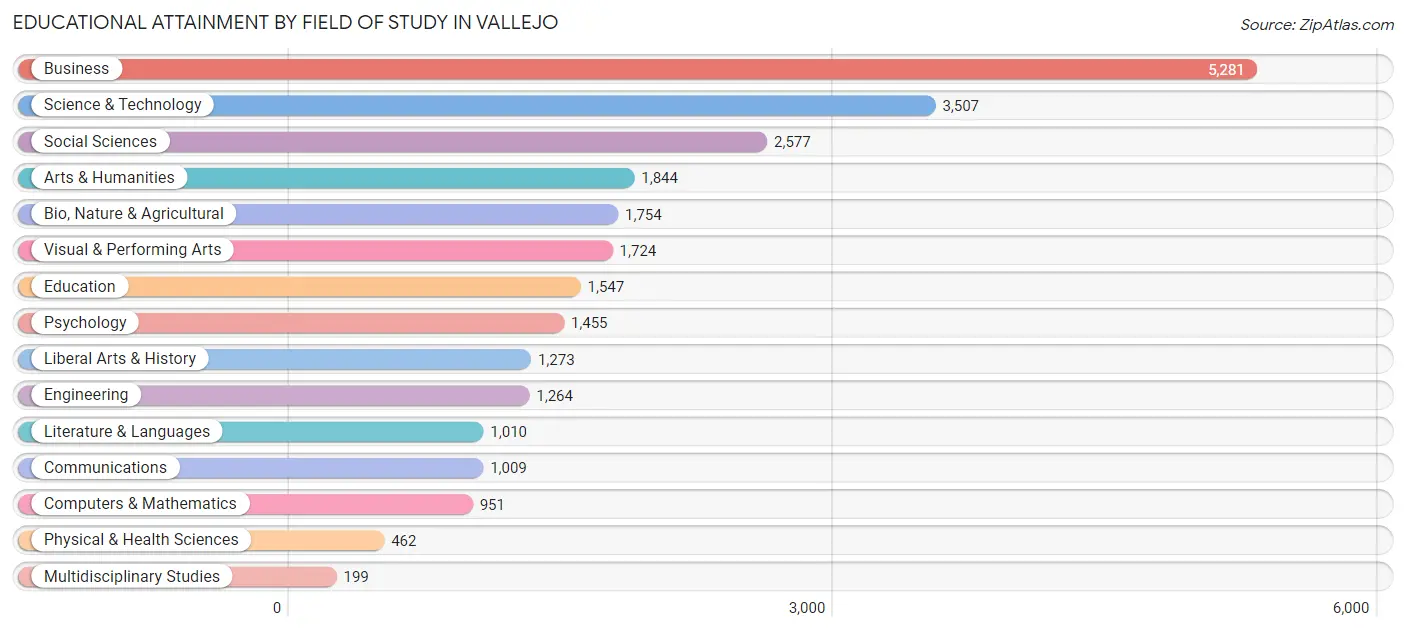
| Field of Study | # Graduates | % Graduates |
| Computers & Mathematics | 951 | 3.7% |
| Bio, Nature & Agricultural | 1,754 | 6.8% |
| Physical & Health Sciences | 462 | 1.8% |
| Psychology | 1,455 | 5.6% |
| Social Sciences | 2,577 | 10.0% |
| Engineering | 1,264 | 4.9% |
| Multidisciplinary Studies | 199 | 0.8% |
| Science & Technology | 3,507 | 13.6% |
| Business | 5,281 | 20.4% |
| Education | 1,547 | 6.0% |
| Literature & Languages | 1,010 | 3.9% |
| Liberal Arts & History | 1,273 | 4.9% |
| Visual & Performing Arts | 1,724 | 6.7% |
| Communications | 1,009 | 3.9% |
| Arts & Humanities | 1,844 | 7.1% |
| Total | 25,857 | 100.0% |
Transportation & Commute in Vallejo
Vehicle Availability by Sex in Vallejo
The most prevalent vehicle ownership categories in Vallejo are males with 2 vehicles (10,404, accounting for 34.1%) and females with 2 vehicles (8,733, making up 37.9%).
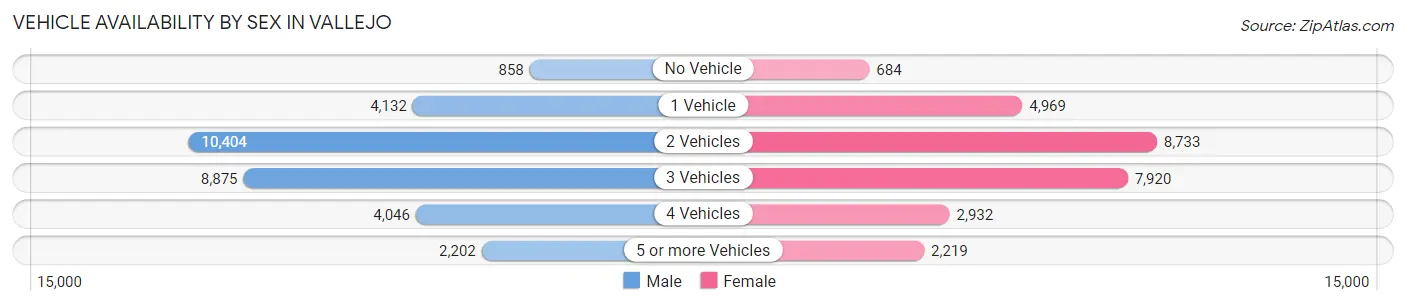
| Vehicles Available | Male | Female |
| No Vehicle | 858 (2.8%) | 684 (2.5%) |
| 1 Vehicle | 4,132 (13.5%) | 4,969 (18.1%) |
| 2 Vehicles | 10,404 (34.1%) | 8,733 (31.8%) |
| 3 Vehicles | 8,875 (29.1%) | 7,920 (28.8%) |
| 4 Vehicles | 4,046 (13.3%) | 2,932 (10.7%) |
| 5 or more Vehicles | 2,202 (7.2%) | 2,219 (8.1%) |
| Total | 30,517 (100.0%) | 27,457 (100.0%) |
Commute Time in Vallejo
The most frequently occuring commute durations in Vallejo are 60 to 89 minutes (7,818 commuters, 14.6%), 30 to 34 minutes (7,338 commuters, 13.7%), and 45 to 59 minutes (6,839 commuters, 12.8%).
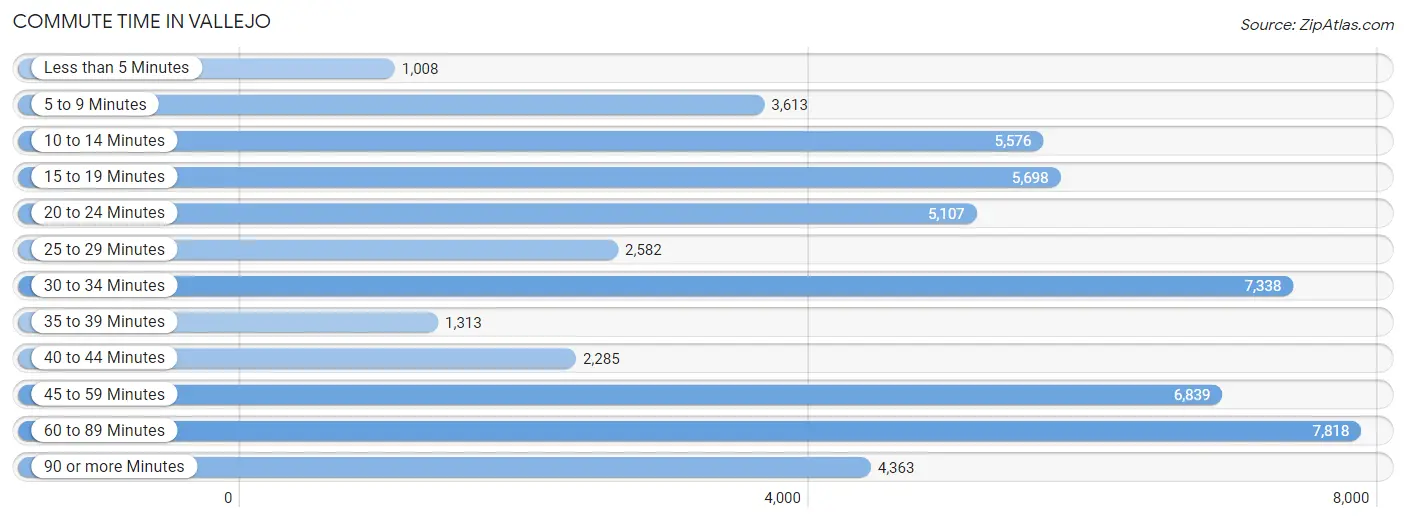
| Commute Time | # Commuters | % Commuters |
| Less than 5 Minutes | 1,008 | 1.9% |
| 5 to 9 Minutes | 3,613 | 6.8% |
| 10 to 14 Minutes | 5,576 | 10.4% |
| 15 to 19 Minutes | 5,698 | 10.6% |
| 20 to 24 Minutes | 5,107 | 9.5% |
| 25 to 29 Minutes | 2,582 | 4.8% |
| 30 to 34 Minutes | 7,338 | 13.7% |
| 35 to 39 Minutes | 1,313 | 2.5% |
| 40 to 44 Minutes | 2,285 | 4.3% |
| 45 to 59 Minutes | 6,839 | 12.8% |
| 60 to 89 Minutes | 7,818 | 14.6% |
| 90 or more Minutes | 4,363 | 8.2% |
Commute Time by Sex in Vallejo
The most common commute times in Vallejo are 60 to 89 minutes (4,642 commuters, 16.2%) for males and 30 to 34 minutes (3,414 commuters, 13.7%) for females.
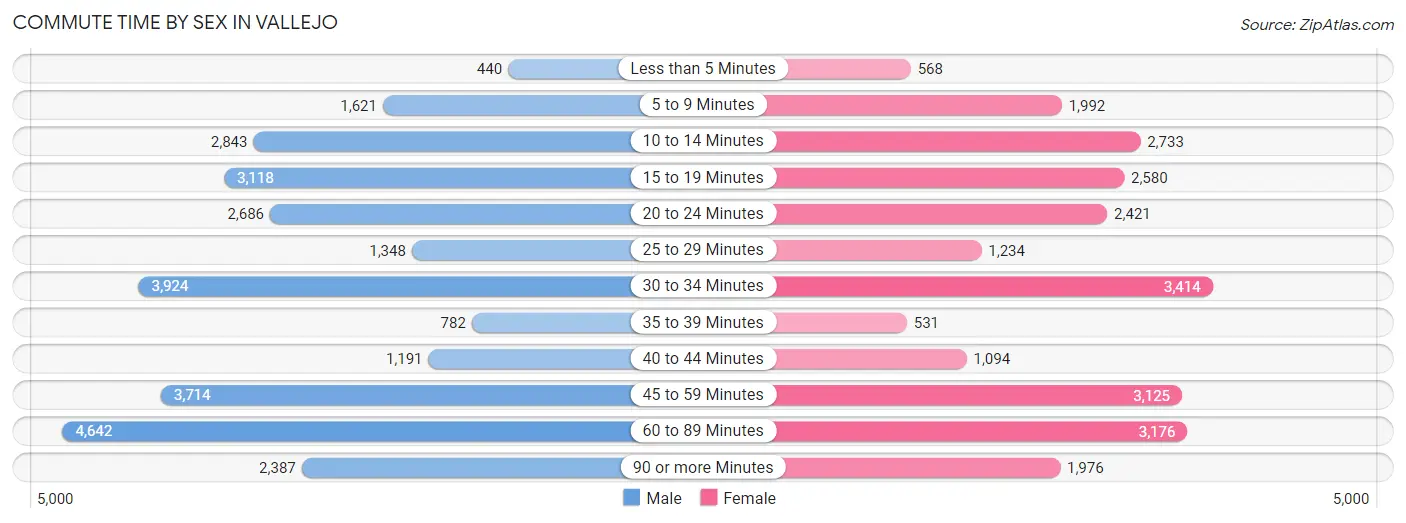
| Commute Time | Male | Female |
| Less than 5 Minutes | 440 (1.5%) | 568 (2.3%) |
| 5 to 9 Minutes | 1,621 (5.7%) | 1,992 (8.0%) |
| 10 to 14 Minutes | 2,843 (9.9%) | 2,733 (11.0%) |
| 15 to 19 Minutes | 3,118 (10.9%) | 2,580 (10.4%) |
| 20 to 24 Minutes | 2,686 (9.4%) | 2,421 (9.7%) |
| 25 to 29 Minutes | 1,348 (4.7%) | 1,234 (5.0%) |
| 30 to 34 Minutes | 3,924 (13.7%) | 3,414 (13.7%) |
| 35 to 39 Minutes | 782 (2.7%) | 531 (2.1%) |
| 40 to 44 Minutes | 1,191 (4.2%) | 1,094 (4.4%) |
| 45 to 59 Minutes | 3,714 (12.9%) | 3,125 (12.6%) |
| 60 to 89 Minutes | 4,642 (16.2%) | 3,176 (12.8%) |
| 90 or more Minutes | 2,387 (8.3%) | 1,976 (8.0%) |
Time of Departure to Work by Sex in Vallejo
The most frequent times of departure to work in Vallejo are 12:00 AM to 4:59 AM (3,166, 11.0%) for males and 8:00 AM to 8:29 AM (2,944, 11.8%) for females.
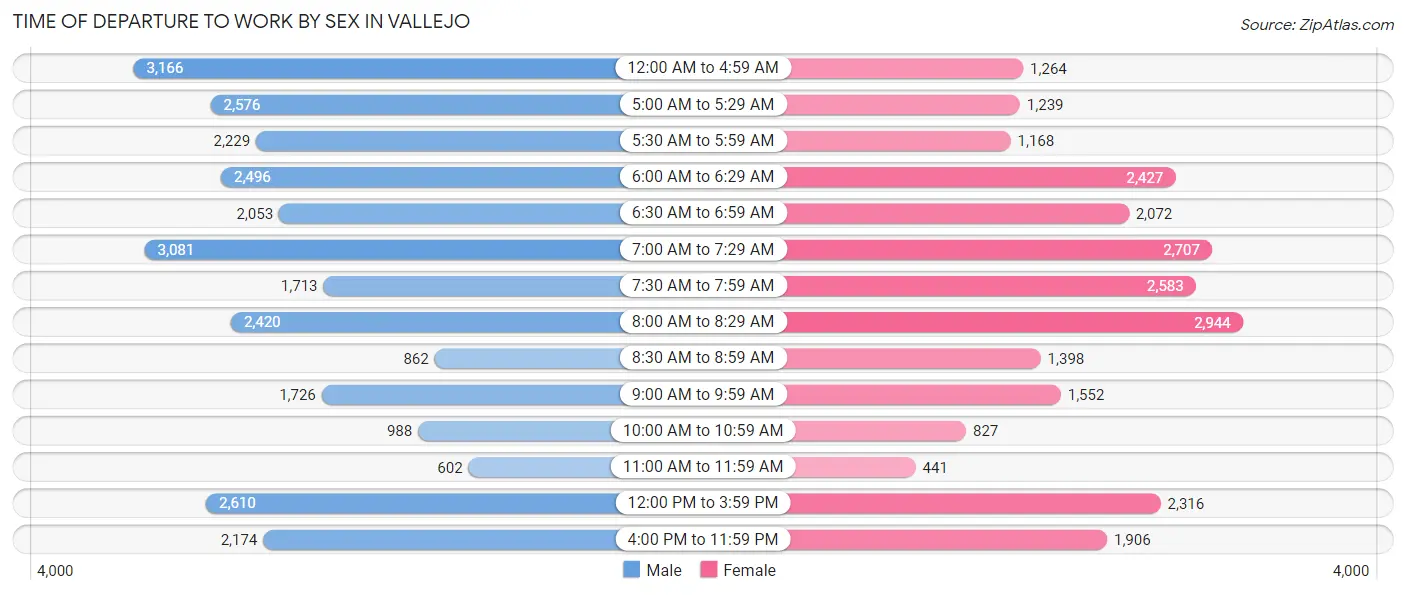
| Time of Departure | Male | Female |
| 12:00 AM to 4:59 AM | 3,166 (11.0%) | 1,264 (5.1%) |
| 5:00 AM to 5:29 AM | 2,576 (9.0%) | 1,239 (5.0%) |
| 5:30 AM to 5:59 AM | 2,229 (7.8%) | 1,168 (4.7%) |
| 6:00 AM to 6:29 AM | 2,496 (8.7%) | 2,427 (9.8%) |
| 6:30 AM to 6:59 AM | 2,053 (7.1%) | 2,072 (8.3%) |
| 7:00 AM to 7:29 AM | 3,081 (10.7%) | 2,707 (10.9%) |
| 7:30 AM to 7:59 AM | 1,713 (6.0%) | 2,583 (10.4%) |
| 8:00 AM to 8:29 AM | 2,420 (8.4%) | 2,944 (11.8%) |
| 8:30 AM to 8:59 AM | 862 (3.0%) | 1,398 (5.6%) |
| 9:00 AM to 9:59 AM | 1,726 (6.0%) | 1,552 (6.2%) |
| 10:00 AM to 10:59 AM | 988 (3.4%) | 827 (3.3%) |
| 11:00 AM to 11:59 AM | 602 (2.1%) | 441 (1.8%) |
| 12:00 PM to 3:59 PM | 2,610 (9.1%) | 2,316 (9.3%) |
| 4:00 PM to 11:59 PM | 2,174 (7.6%) | 1,906 (7.7%) |
| Total | 28,696 (100.0%) | 24,844 (100.0%) |
Housing Occupancy in Vallejo
Occupancy by Ownership in Vallejo
Of the total 44,107 dwellings in Vallejo, owner-occupied units account for 25,908 (58.7%), while renter-occupied units make up 18,199 (41.3%).
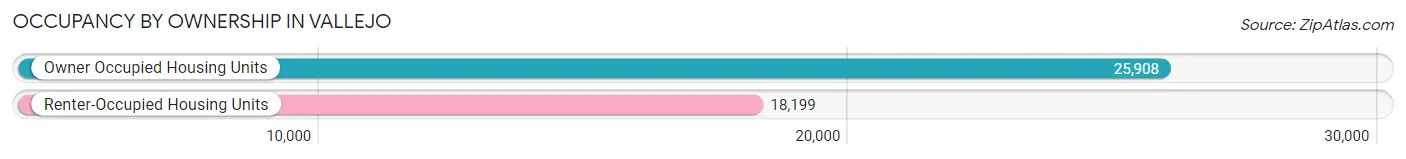
| Occupancy | # Housing Units | % Housing Units |
| Owner Occupied Housing Units | 25,908 | 58.7% |
| Renter-Occupied Housing Units | 18,199 | 41.3% |
| Total Occupied Housing Units | 44,107 | 100.0% |
Occupancy by Household Size in Vallejo
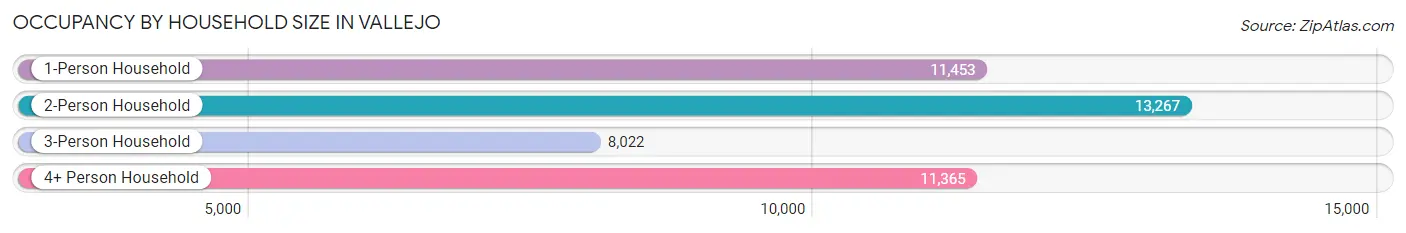
| Household Size | # Housing Units | % Housing Units |
| 1-Person Household | 11,453 | 26.0% |
| 2-Person Household | 13,267 | 30.1% |
| 3-Person Household | 8,022 | 18.2% |
| 4+ Person Household | 11,365 | 25.8% |
| Total Housing Units | 44,107 | 100.0% |
Occupancy by Ownership by Household Size in Vallejo
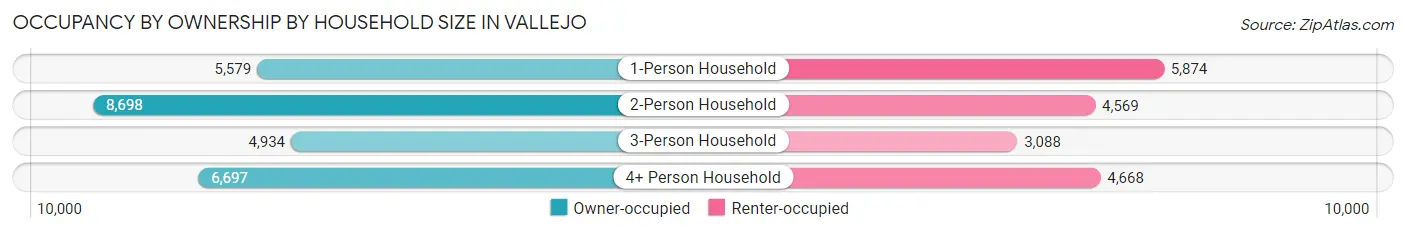
| Household Size | Owner-occupied | Renter-occupied |
| 1-Person Household | 5,579 (48.7%) | 5,874 (51.3%) |
| 2-Person Household | 8,698 (65.6%) | 4,569 (34.4%) |
| 3-Person Household | 4,934 (61.5%) | 3,088 (38.5%) |
| 4+ Person Household | 6,697 (58.9%) | 4,668 (41.1%) |
| Total Housing Units | 25,908 (58.7%) | 18,199 (41.3%) |
Occupancy by Educational Attainment in Vallejo
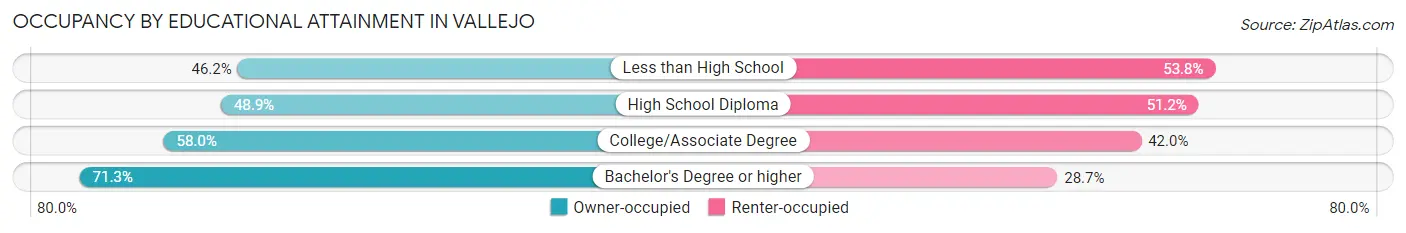
| Household Size | Owner-occupied | Renter-occupied |
| Less than High School | 2,052 (46.2%) | 2,388 (53.8%) |
| High School Diploma | 4,635 (48.8%) | 4,853 (51.1%) |
| College/Associate Degree | 9,959 (58.0%) | 7,225 (42.0%) |
| Bachelor's Degree or higher | 9,262 (71.3%) | 3,733 (28.7%) |
Occupancy by Age of Householder in Vallejo
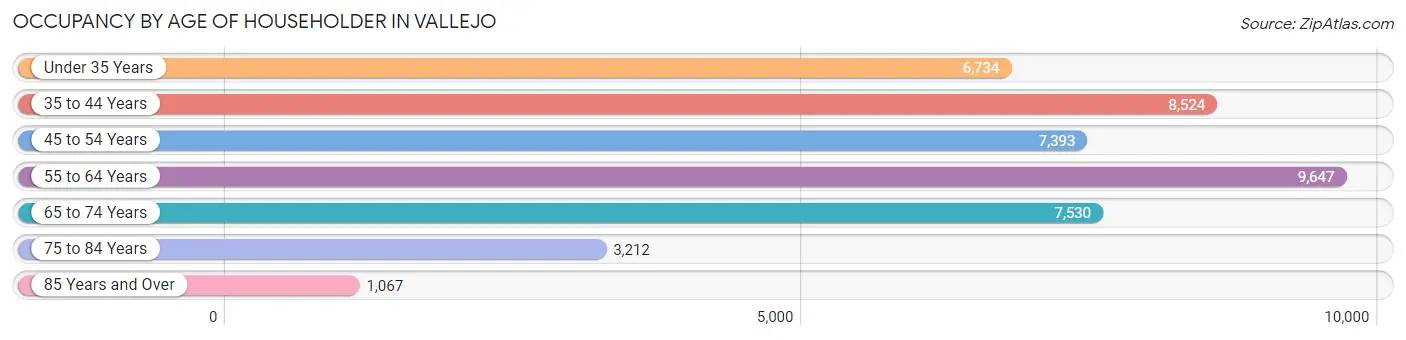
| Age Bracket | # Households | % Households |
| Under 35 Years | 6,734 | 15.3% |
| 35 to 44 Years | 8,524 | 19.3% |
| 45 to 54 Years | 7,393 | 16.8% |
| 55 to 64 Years | 9,647 | 21.9% |
| 65 to 74 Years | 7,530 | 17.1% |
| 75 to 84 Years | 3,212 | 7.3% |
| 85 Years and Over | 1,067 | 2.4% |
| Total | 44,107 | 100.0% |
Housing Finances in Vallejo
Median Income by Occupancy in Vallejo
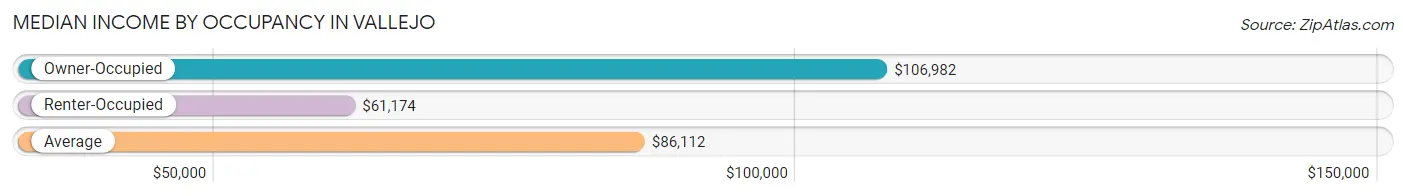
| Occupancy Type | # Households | Median Income |
| Owner-Occupied | 25,908 (58.7%) | $106,982 |
| Renter-Occupied | 18,199 (41.3%) | $61,174 |
| Average | 44,107 (100.0%) | $86,112 |
Occupancy by Householder Income Bracket in Vallejo
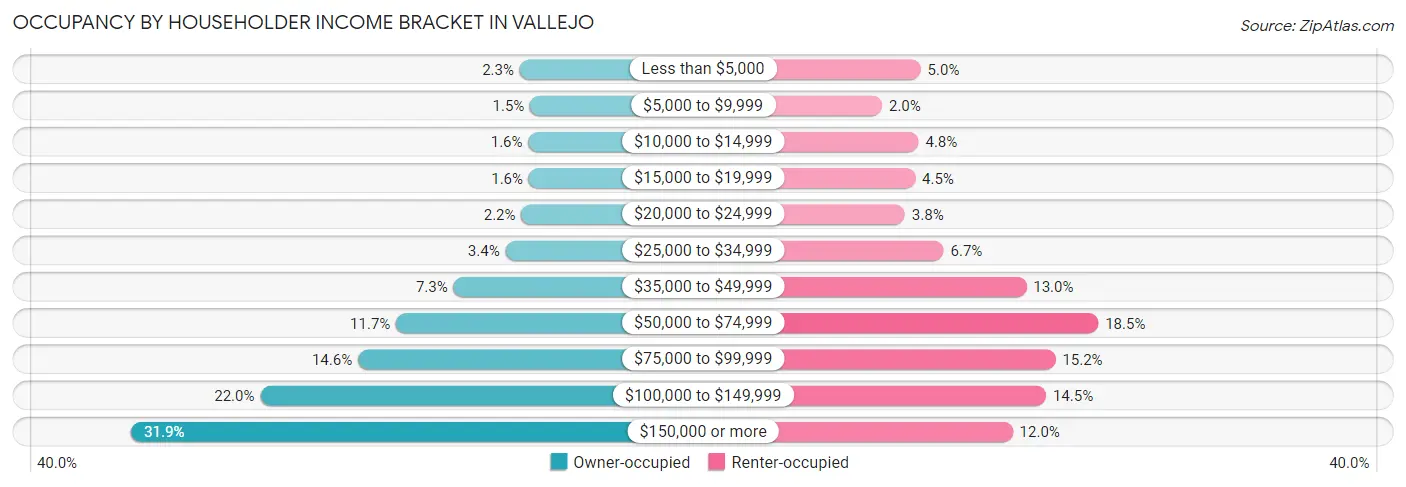
| Income Bracket | Owner-occupied | Renter-occupied |
| Less than $5,000 | 588 (2.3%) | 903 (5.0%) |
| $5,000 to $9,999 | 384 (1.5%) | 367 (2.0%) |
| $10,000 to $14,999 | 420 (1.6%) | 874 (4.8%) |
| $15,000 to $19,999 | 409 (1.6%) | 826 (4.5%) |
| $20,000 to $24,999 | 557 (2.1%) | 685 (3.8%) |
| $25,000 to $34,999 | 871 (3.4%) | 1,222 (6.7%) |
| $35,000 to $49,999 | 1,897 (7.3%) | 2,368 (13.0%) |
| $50,000 to $74,999 | 3,028 (11.7%) | 3,365 (18.5%) |
| $75,000 to $99,999 | 3,783 (14.6%) | 2,771 (15.2%) |
| $100,000 to $149,999 | 5,711 (22.0%) | 2,640 (14.5%) |
| $150,000 or more | 8,260 (31.9%) | 2,178 (12.0%) |
| Total | 25,908 (100.0%) | 18,199 (100.0%) |
Monthly Housing Cost Tiers in Vallejo
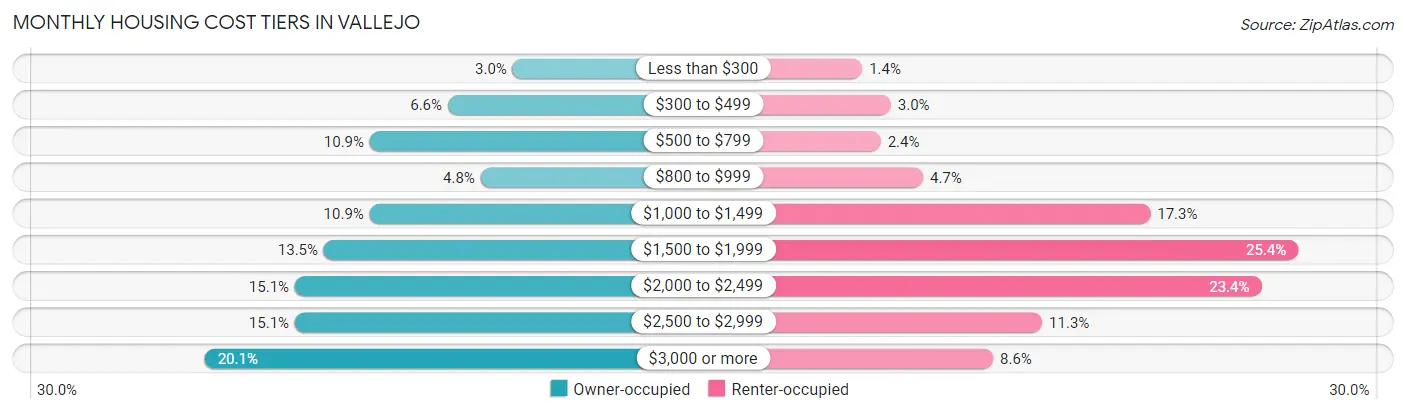
| Monthly Cost | Owner-occupied | Renter-occupied |
| Less than $300 | 788 (3.0%) | 250 (1.4%) |
| $300 to $499 | 1,716 (6.6%) | 536 (2.9%) |
| $500 to $799 | 2,831 (10.9%) | 435 (2.4%) |
| $800 to $999 | 1,246 (4.8%) | 860 (4.7%) |
| $1,000 to $1,499 | 2,835 (10.9%) | 3,145 (17.3%) |
| $1,500 to $1,999 | 3,489 (13.5%) | 4,630 (25.4%) |
| $2,000 to $2,499 | 3,904 (15.1%) | 4,261 (23.4%) |
| $2,500 to $2,999 | 3,904 (15.1%) | 2,059 (11.3%) |
| $3,000 or more | 5,195 (20.1%) | 1,566 (8.6%) |
| Total | 25,908 (100.0%) | 18,199 (100.0%) |
Physical Housing Characteristics in Vallejo
Housing Structures in Vallejo
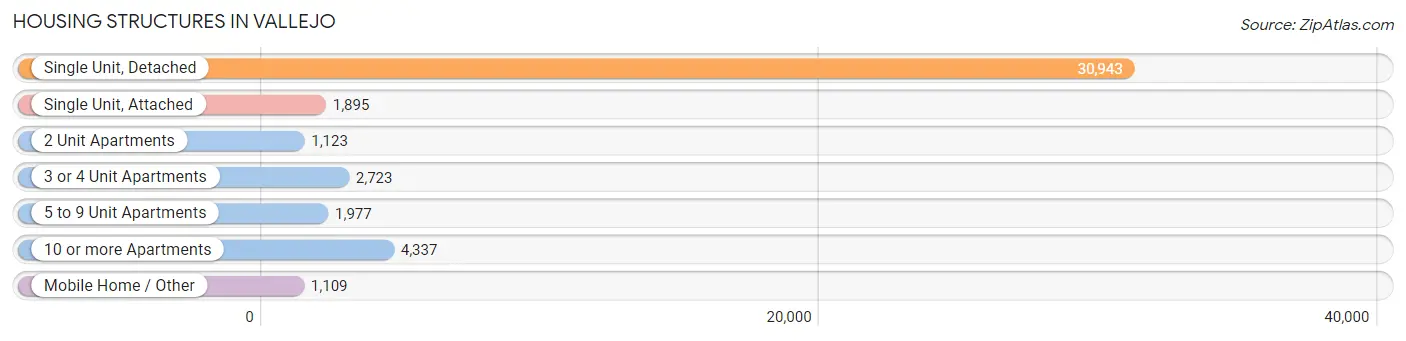
| Structure Type | # Housing Units | % Housing Units |
| Single Unit, Detached | 30,943 | 70.2% |
| Single Unit, Attached | 1,895 | 4.3% |
| 2 Unit Apartments | 1,123 | 2.5% |
| 3 or 4 Unit Apartments | 2,723 | 6.2% |
| 5 to 9 Unit Apartments | 1,977 | 4.5% |
| 10 or more Apartments | 4,337 | 9.8% |
| Mobile Home / Other | 1,109 | 2.5% |
| Total | 44,107 | 100.0% |
Housing Structures by Occupancy in Vallejo
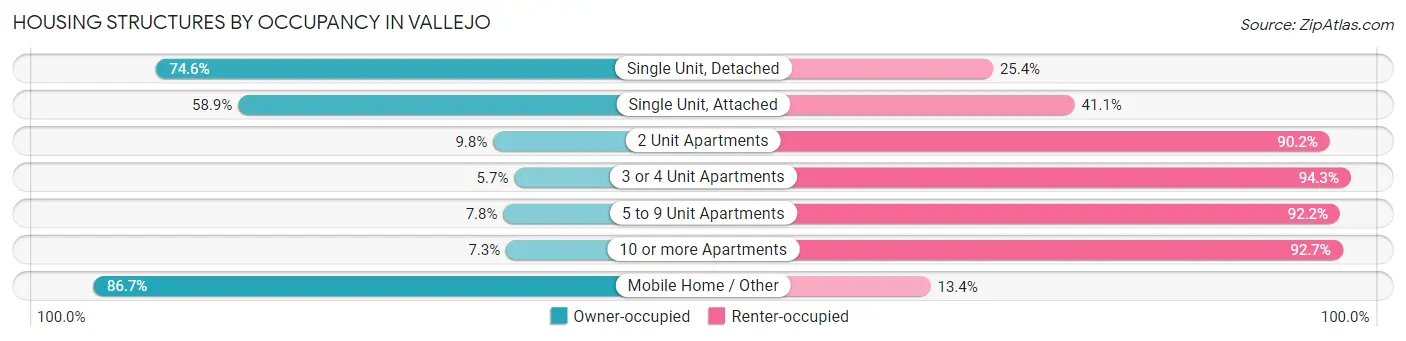
| Structure Type | Owner-occupied | Renter-occupied |
| Single Unit, Detached | 23,093 (74.6%) | 7,850 (25.4%) |
| Single Unit, Attached | 1,116 (58.9%) | 779 (41.1%) |
| 2 Unit Apartments | 110 (9.8%) | 1,013 (90.2%) |
| 3 or 4 Unit Apartments | 156 (5.7%) | 2,567 (94.3%) |
| 5 to 9 Unit Apartments | 155 (7.8%) | 1,822 (92.2%) |
| 10 or more Apartments | 317 (7.3%) | 4,020 (92.7%) |
| Mobile Home / Other | 961 (86.7%) | 148 (13.4%) |
| Total | 25,908 (58.7%) | 18,199 (41.3%) |
Housing Structures by Number of Rooms in Vallejo
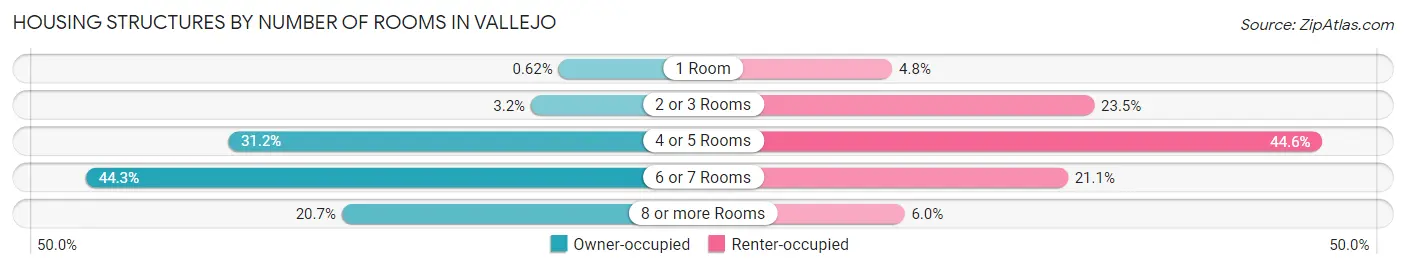
| Number of Rooms | Owner-occupied | Renter-occupied |
| 1 Room | 161 (0.6%) | 879 (4.8%) |
| 2 or 3 Rooms | 822 (3.2%) | 4,278 (23.5%) |
| 4 or 5 Rooms | 8,082 (31.2%) | 8,120 (44.6%) |
| 6 or 7 Rooms | 11,488 (44.3%) | 3,835 (21.1%) |
| 8 or more Rooms | 5,355 (20.7%) | 1,087 (6.0%) |
| Total | 25,908 (100.0%) | 18,199 (100.0%) |
Housing Structure by Heating Type in Vallejo
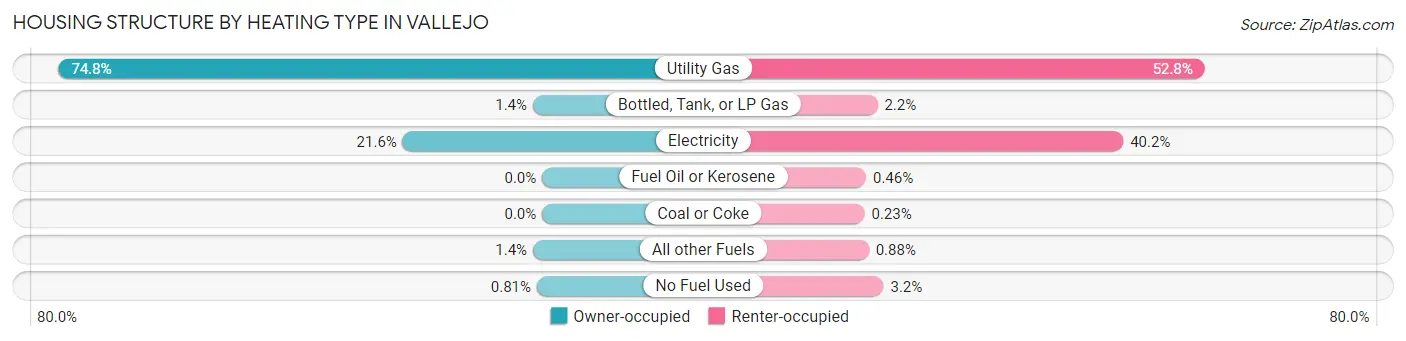
| Heating Type | Owner-occupied | Renter-occupied |
| Utility Gas | 19,373 (74.8%) | 9,612 (52.8%) |
| Bottled, Tank, or LP Gas | 370 (1.4%) | 406 (2.2%) |
| Electricity | 5,587 (21.6%) | 7,319 (40.2%) |
| Fuel Oil or Kerosene | 0 (0.0%) | 83 (0.5%) |
| Coal or Coke | 0 (0.0%) | 41 (0.2%) |
| All other Fuels | 368 (1.4%) | 161 (0.9%) |
| No Fuel Used | 210 (0.8%) | 577 (3.2%) |
| Total | 25,908 (100.0%) | 18,199 (100.0%) |
Household Vehicle Usage in Vallejo
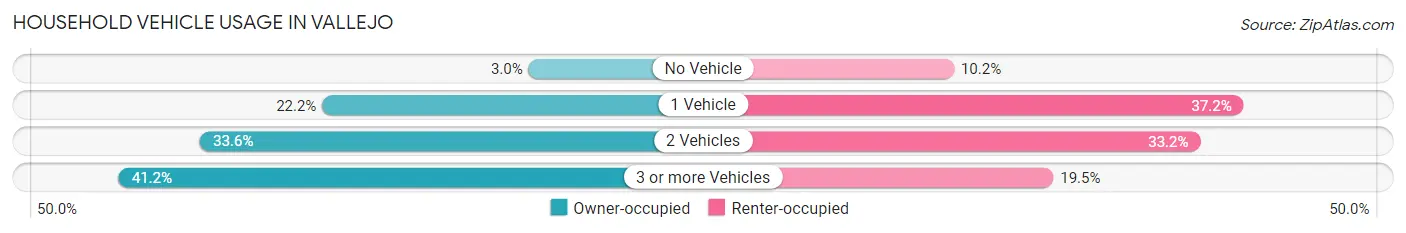
| Vehicles per Household | Owner-occupied | Renter-occupied |
| No Vehicle | 768 (3.0%) | 1,852 (10.2%) |
| 1 Vehicle | 5,757 (22.2%) | 6,771 (37.2%) |
| 2 Vehicles | 8,709 (33.6%) | 6,037 (33.2%) |
| 3 or more Vehicles | 10,674 (41.2%) | 3,539 (19.5%) |
| Total | 25,908 (100.0%) | 18,199 (100.0%) |
Real Estate & Mortgages in Vallejo
Real Estate and Mortgage Overview in Vallejo
| Characteristic | Without Mortgage | With Mortgage |
| Housing Units | 7,223 | 18,685 |
| Median Property Value | $450,500 | $542,700 |
| Median Household Income | $72,625 | $7,122 |
| Monthly Housing Costs | $626 | $5,195 |
| Real Estate Taxes | $2,921 | $322 |
Property Value by Mortgage Status in Vallejo
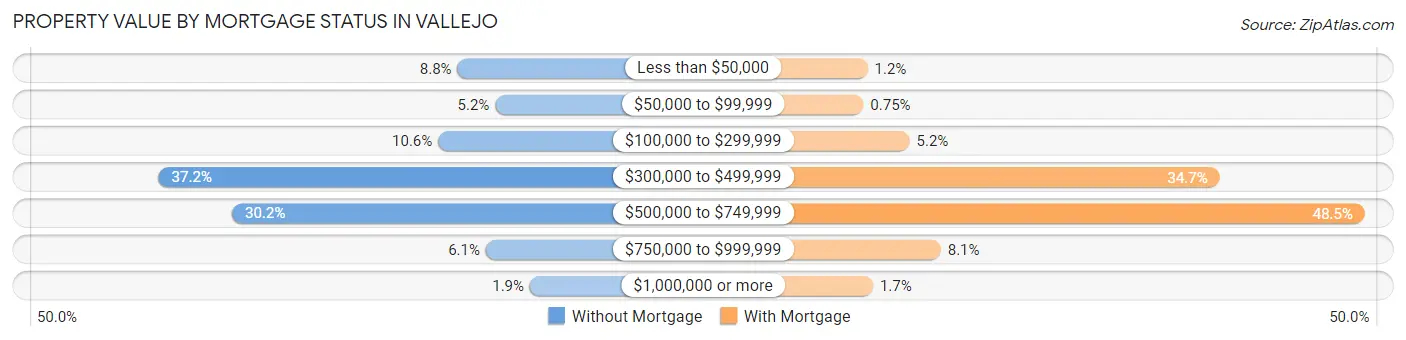
| Property Value | Without Mortgage | With Mortgage |
| Less than $50,000 | 634 (8.8%) | 215 (1.1%) |
| $50,000 to $99,999 | 374 (5.2%) | 141 (0.7%) |
| $100,000 to $299,999 | 767 (10.6%) | 962 (5.1%) |
| $300,000 to $499,999 | 2,689 (37.2%) | 6,477 (34.7%) |
| $500,000 to $749,999 | 2,184 (30.2%) | 9,062 (48.5%) |
| $750,000 to $999,999 | 439 (6.1%) | 1,518 (8.1%) |
| $1,000,000 or more | 136 (1.9%) | 310 (1.7%) |
| Total | 7,223 (100.0%) | 18,685 (100.0%) |
Household Income by Mortgage Status in Vallejo
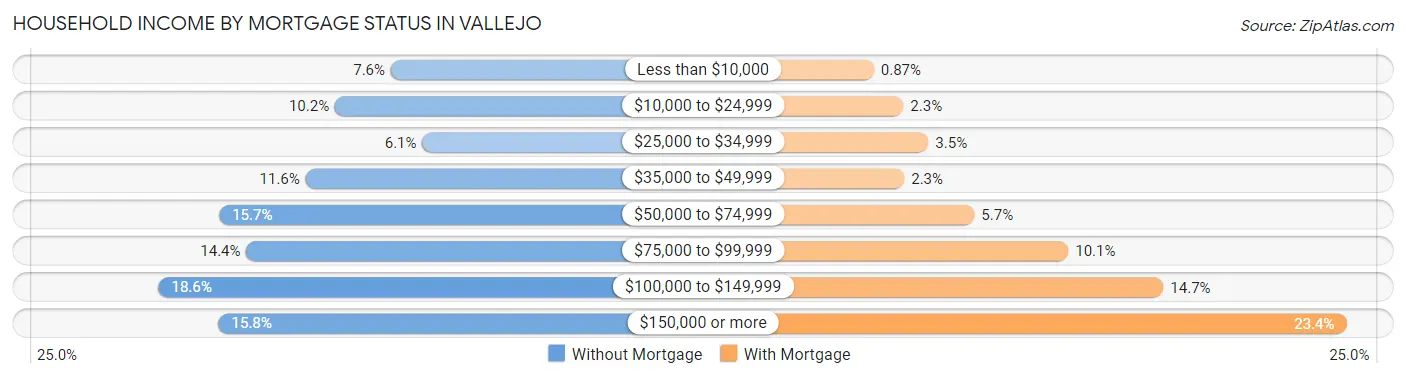
| Household Income | Without Mortgage | With Mortgage |
| Less than $10,000 | 546 (7.6%) | 162 (0.9%) |
| $10,000 to $24,999 | 738 (10.2%) | 426 (2.3%) |
| $25,000 to $34,999 | 438 (6.1%) | 648 (3.5%) |
| $35,000 to $49,999 | 839 (11.6%) | 433 (2.3%) |
| $50,000 to $74,999 | 1,136 (15.7%) | 1,058 (5.7%) |
| $75,000 to $99,999 | 1,043 (14.4%) | 1,892 (10.1%) |
| $100,000 to $149,999 | 1,345 (18.6%) | 2,740 (14.7%) |
| $150,000 or more | 1,138 (15.8%) | 4,366 (23.4%) |
| Total | 7,223 (100.0%) | 18,685 (100.0%) |
Property Value to Household Income Ratio in Vallejo
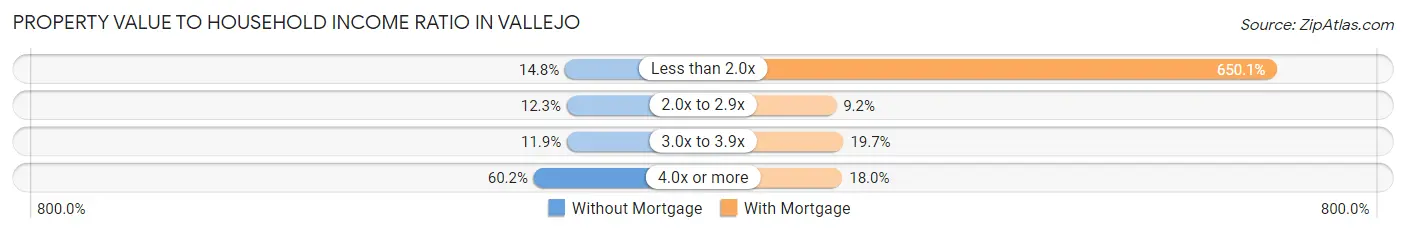
| Value-to-Income Ratio | Without Mortgage | With Mortgage |
| Less than 2.0x | 1,070 (14.8%) | 121,474 (650.1%) |
| 2.0x to 2.9x | 889 (12.3%) | 1,709 (9.1%) |
| 3.0x to 3.9x | 861 (11.9%) | 3,674 (19.7%) |
| 4.0x or more | 4,345 (60.2%) | 3,355 (18.0%) |
| Total | 7,223 (100.0%) | 18,685 (100.0%) |
Real Estate Taxes by Mortgage Status in Vallejo
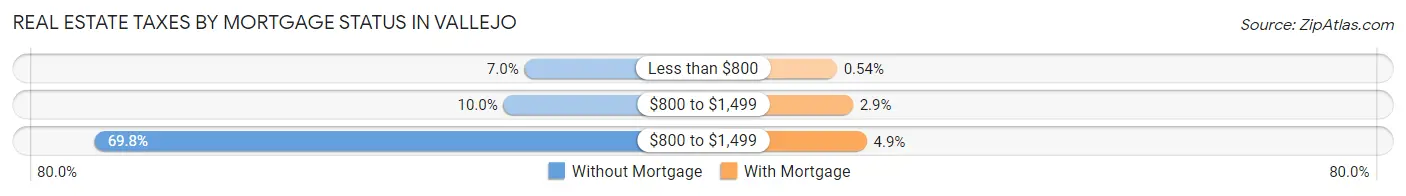
| Property Taxes | Without Mortgage | With Mortgage |
| Less than $800 | 503 (7.0%) | 100 (0.5%) |
| $800 to $1,499 | 724 (10.0%) | 537 (2.9%) |
| $800 to $1,499 | 5,038 (69.8%) | 916 (4.9%) |
| Total | 7,223 (100.0%) | 18,685 (100.0%) |
Health & Disability in Vallejo
Health Insurance Coverage by Age in Vallejo
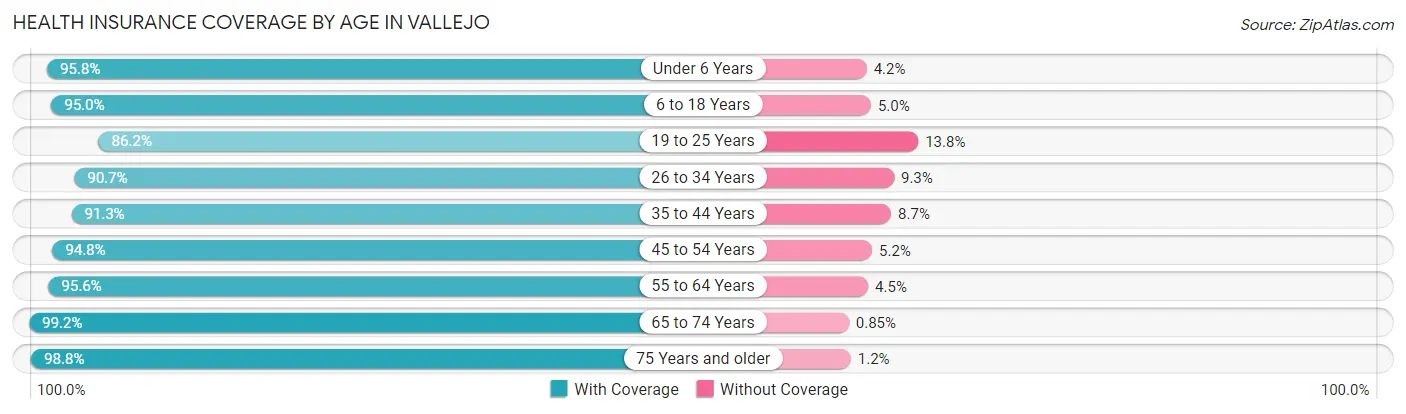
| Age Bracket | With Coverage | Without Coverage |
| Under 6 Years | 7,569 (95.8%) | 330 (4.2%) |
| 6 to 18 Years | 17,953 (95.0%) | 941 (5.0%) |
| 19 to 25 Years | 9,166 (86.2%) | 1,466 (13.8%) |
| 26 to 34 Years | 14,197 (90.7%) | 1,452 (9.3%) |
| 35 to 44 Years | 15,865 (91.3%) | 1,519 (8.7%) |
| 45 to 54 Years | 14,532 (94.8%) | 794 (5.2%) |
| 55 to 64 Years | 16,877 (95.6%) | 786 (4.4%) |
| 65 to 74 Years | 13,322 (99.2%) | 114 (0.9%) |
| 75 Years and older | 7,338 (98.8%) | 91 (1.2%) |
| Total | 116,819 (94.0%) | 7,493 (6.0%) |
Health Insurance Coverage by Citizenship Status in Vallejo
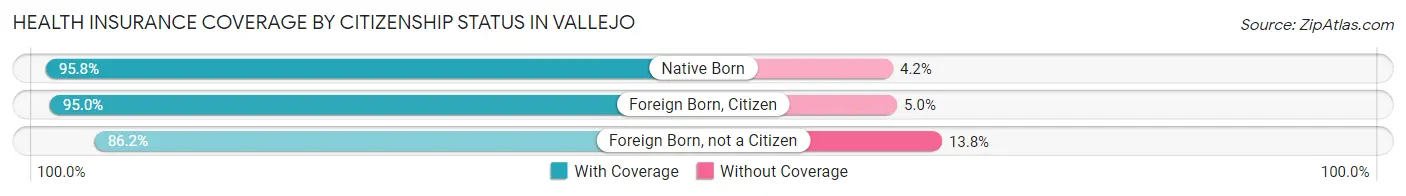
| Citizenship Status | With Coverage | Without Coverage |
| Native Born | 7,569 (95.8%) | 330 (4.2%) |
| Foreign Born, Citizen | 17,953 (95.0%) | 941 (5.0%) |
| Foreign Born, not a Citizen | 9,166 (86.2%) | 1,466 (13.8%) |
Health Insurance Coverage by Household Income in Vallejo
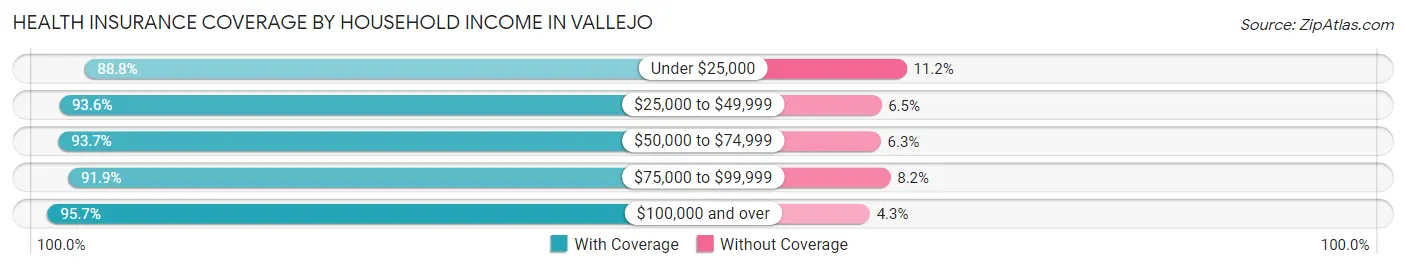
| Household Income | With Coverage | Without Coverage |
| Under $25,000 | 8,979 (88.8%) | 1,133 (11.2%) |
| $25,000 to $49,999 | 14,200 (93.5%) | 979 (6.5%) |
| $50,000 to $74,999 | 15,376 (93.7%) | 1,040 (6.3%) |
| $75,000 to $99,999 | 16,682 (91.8%) | 1,480 (8.2%) |
| $100,000 and over | 60,107 (95.7%) | 2,691 (4.3%) |
Public vs Private Health Insurance Coverage by Age in Vallejo
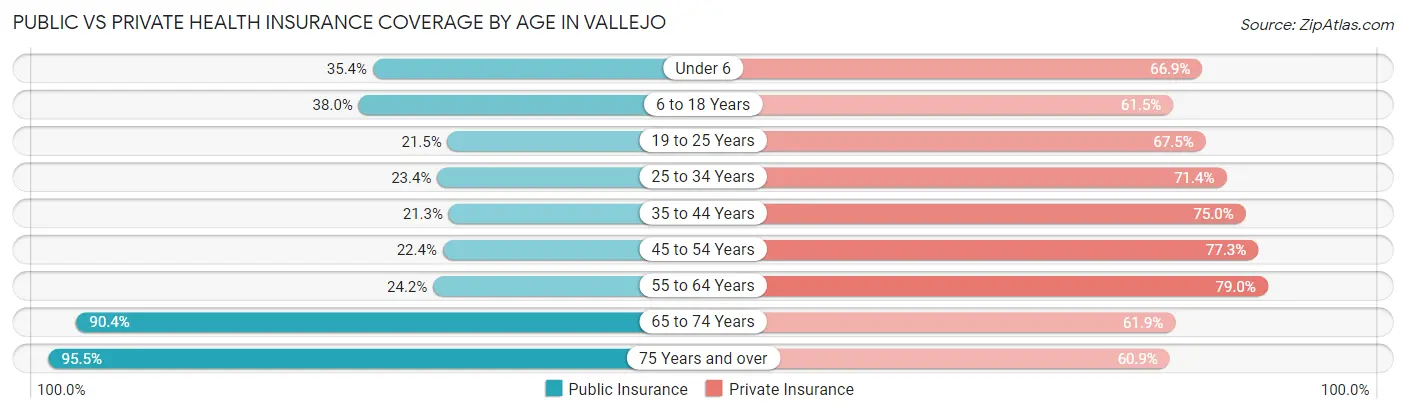
| Age Bracket | Public Insurance | Private Insurance |
| Under 6 | 2,793 (35.4%) | 5,285 (66.9%) |
| 6 to 18 Years | 7,178 (38.0%) | 11,619 (61.5%) |
| 19 to 25 Years | 2,285 (21.5%) | 7,178 (67.5%) |
| 25 to 34 Years | 3,664 (23.4%) | 11,166 (71.4%) |
| 35 to 44 Years | 3,696 (21.3%) | 13,029 (75.0%) |
| 45 to 54 Years | 3,432 (22.4%) | 11,839 (77.2%) |
| 55 to 64 Years | 4,270 (24.2%) | 13,961 (79.0%) |
| 65 to 74 Years | 12,144 (90.4%) | 8,313 (61.9%) |
| 75 Years and over | 7,097 (95.5%) | 4,521 (60.9%) |
| Total | 46,559 (37.4%) | 86,911 (69.9%) |
Disability Status by Sex by Age in Vallejo
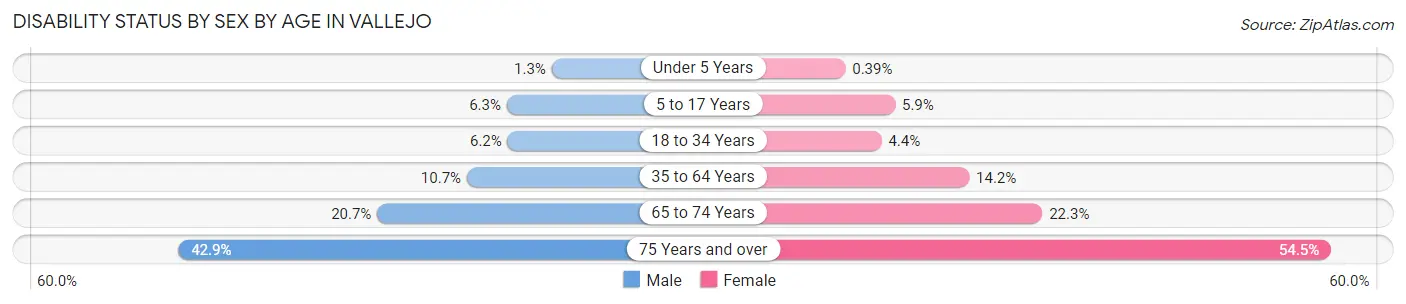
| Age Bracket | Male | Female |
| Under 5 Years | 42 (1.3%) | 12 (0.4%) |
| 5 to 17 Years | 602 (6.3%) | 563 (5.9%) |
| 18 to 34 Years | 904 (6.2%) | 582 (4.4%) |
| 35 to 64 Years | 2,640 (10.7%) | 3,658 (14.2%) |
| 65 to 74 Years | 1,191 (20.7%) | 1,717 (22.3%) |
| 75 Years and over | 1,342 (42.9%) | 2,343 (54.5%) |
Disability Class by Sex by Age in Vallejo
Disability Class: Hearing Difficulty
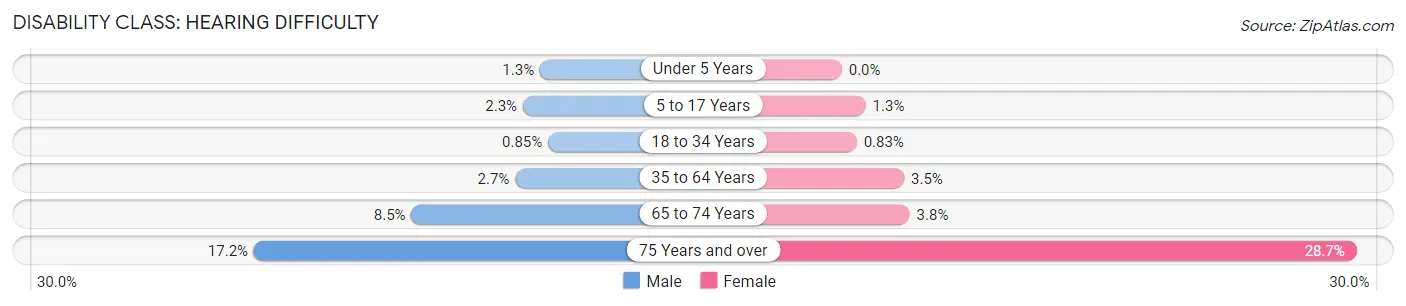
| Age Bracket | Male | Female |
| Under 5 Years | 42 (1.3%) | 0 (0.0%) |
| 5 to 17 Years | 215 (2.2%) | 126 (1.3%) |
| 18 to 34 Years | 124 (0.9%) | 109 (0.8%) |
| 35 to 64 Years | 659 (2.7%) | 895 (3.5%) |
| 65 to 74 Years | 486 (8.5%) | 291 (3.8%) |
| 75 Years and over | 539 (17.2%) | 1,233 (28.7%) |
Disability Class: Vision Difficulty
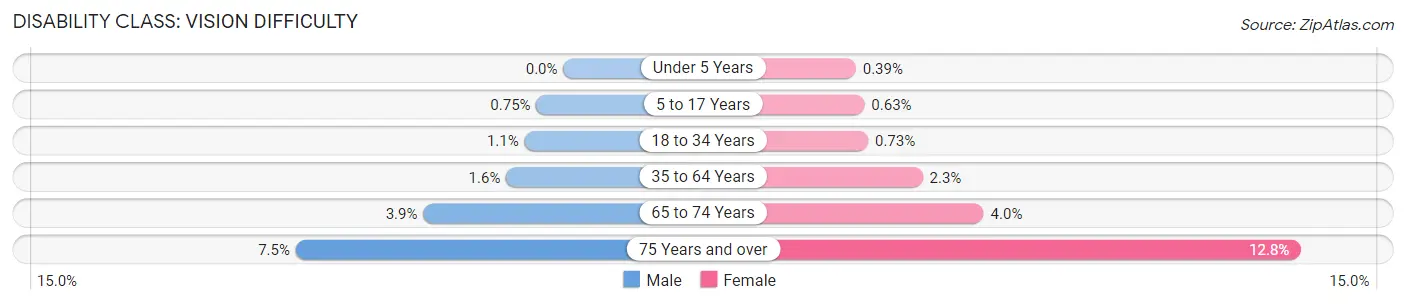
| Age Bracket | Male | Female |
| Under 5 Years | 0 (0.0%) | 12 (0.4%) |
| 5 to 17 Years | 72 (0.7%) | 60 (0.6%) |
| 18 to 34 Years | 157 (1.1%) | 96 (0.7%) |
| 35 to 64 Years | 392 (1.6%) | 579 (2.2%) |
| 65 to 74 Years | 224 (3.9%) | 304 (4.0%) |
| 75 Years and over | 233 (7.4%) | 550 (12.8%) |
Disability Class: Cognitive Difficulty
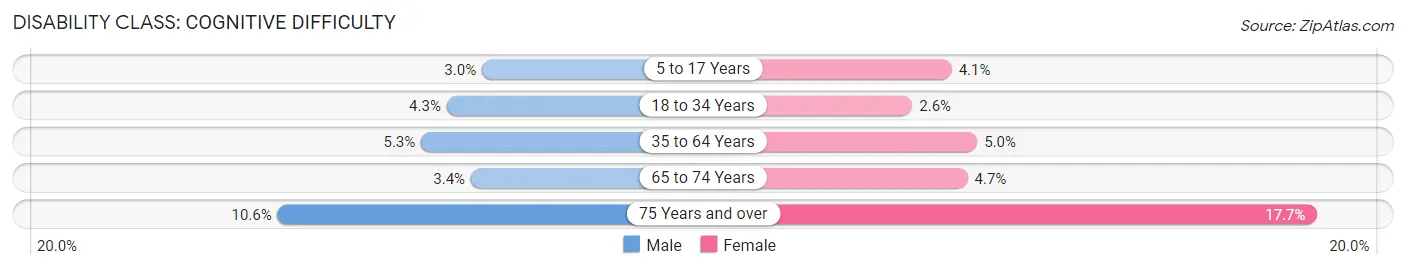
| Age Bracket | Male | Female |
| 5 to 17 Years | 289 (3.0%) | 387 (4.1%) |
| 18 to 34 Years | 630 (4.3%) | 345 (2.6%) |
| 35 to 64 Years | 1,298 (5.3%) | 1,296 (5.0%) |
| 65 to 74 Years | 197 (3.4%) | 359 (4.7%) |
| 75 Years and over | 332 (10.6%) | 759 (17.6%) |
Disability Class: Ambulatory Difficulty
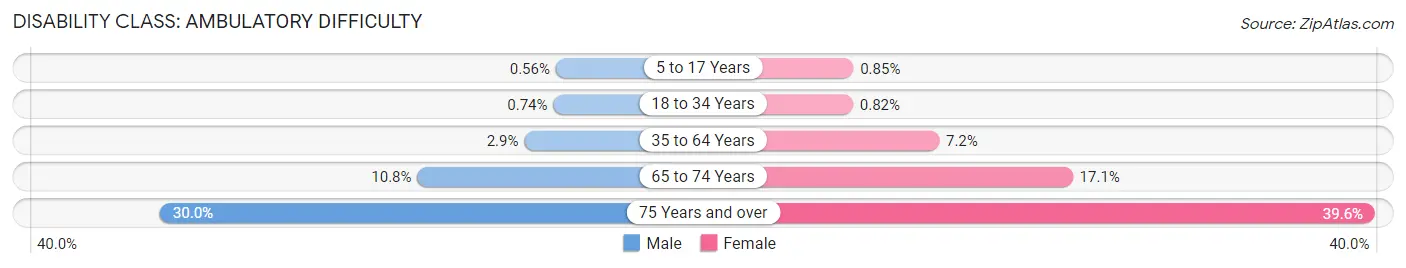
| Age Bracket | Male | Female |
| 5 to 17 Years | 54 (0.6%) | 81 (0.9%) |
| 18 to 34 Years | 108 (0.7%) | 108 (0.8%) |
| 35 to 64 Years | 713 (2.9%) | 1,861 (7.2%) |
| 65 to 74 Years | 623 (10.8%) | 1,318 (17.1%) |
| 75 Years and over | 937 (29.9%) | 1,702 (39.6%) |
Disability Class: Self-Care Difficulty
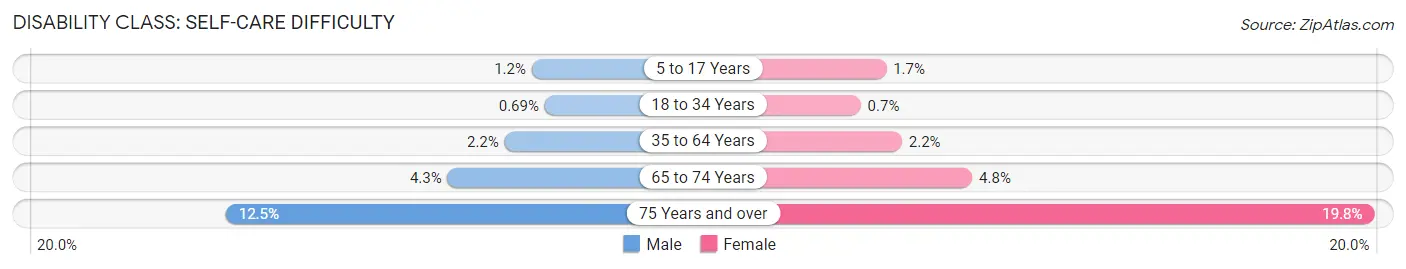
| Age Bracket | Male | Female |
| 5 to 17 Years | 112 (1.2%) | 157 (1.7%) |
| 18 to 34 Years | 101 (0.7%) | 92 (0.7%) |
| 35 to 64 Years | 535 (2.2%) | 576 (2.2%) |
| 65 to 74 Years | 247 (4.3%) | 372 (4.8%) |
| 75 Years and over | 392 (12.5%) | 850 (19.8%) |
Technology Access in Vallejo
Computing Device Access in Vallejo
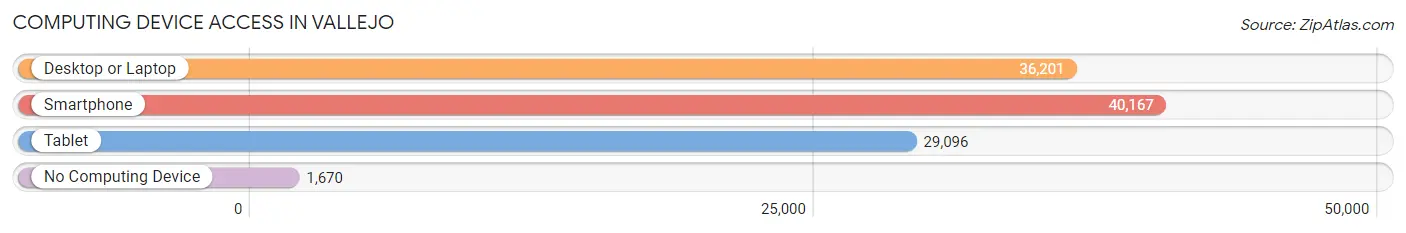
| Device Type | # Households | % Households |
| Desktop or Laptop | 36,201 | 82.1% |
| Smartphone | 40,167 | 91.1% |
| Tablet | 29,096 | 66.0% |
| No Computing Device | 1,670 | 3.8% |
| Total | 44,107 | 100.0% |
Internet Access in Vallejo
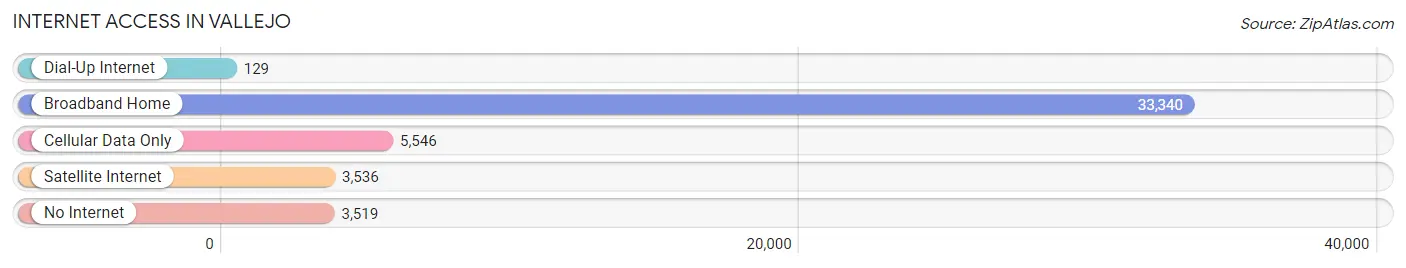
| Internet Type | # Households | % Households |
| Dial-Up Internet | 129 | 0.3% |
| Broadband Home | 33,340 | 75.6% |
| Cellular Data Only | 5,546 | 12.6% |
| Satellite Internet | 3,536 | 8.0% |
| No Internet | 3,519 | 8.0% |
| Total | 44,107 | 100.0% |
Vallejo Summary
Vallejo, California is a city located in the San Francisco Bay Area in Solano County. It is the tenth most populous city in the state of California, with a population of 121,680 as of the 2010 census. Vallejo is located on the northeastern shore of San Pablo Bay, 30 miles northeast of San Francisco, and is part of the larger San Francisco Bay Area metropolitan area.
History
Vallejo was founded in 1851 by General Mariano Guadalupe Vallejo, a Mexican military officer and early California pioneer. Vallejo was the founder of the city of Sonoma and served as the commander of the Presidio of San Francisco. Vallejo was also a major landowner in the area, and his rancho, Rancho Suscol, encompassed much of what is now Vallejo.
In 1868, Vallejo was incorporated as a city, and it quickly became a major port and shipbuilding center. Vallejo was the site of the Mare Island Naval Shipyard, the first U.S. Navy shipyard on the Pacific Coast. The shipyard was in operation from 1854 to 1996, and it was the largest employer in the city for much of its history.
Vallejo was also the site of the first transcontinental railroad in the United States. The Central Pacific Railroad, which was later part of the Southern Pacific Railroad, was completed in 1869, connecting Vallejo to Sacramento and the rest of the country.
Geography
Vallejo is located on the northeastern shore of San Pablo Bay, 30 miles northeast of San Francisco. The city is bordered by the cities of Benicia to the east, American Canyon to the south, and Crockett to the west. Vallejo is located in the northern part of the San Francisco Bay Area, and it is part of the larger San Francisco Bay Area metropolitan area.
The city has a total area of 37.2 square miles, of which 35.4 square miles is land and 1.8 square miles is water. Vallejo is located at an elevation of 33 feet above sea level.
Economy
Vallejo is a major port city and has a diverse economy. The city is home to a number of major employers, including the Mare Island Naval Shipyard, Six Flags Discovery Kingdom, and the Vallejo City Unified School District.
The city is also home to a number of major industries, including shipbuilding, oil refining, and manufacturing. Vallejo is also a major tourist destination, with attractions such as the Six Flags Discovery Kingdom, the Vallejo Naval and Historical Museum, and the Mare Island Naval Shipyard.
Demographics
As of the 2010 census, Vallejo had a population of 121,680. The racial makeup of the city was 57.2% White, 24.3% African American, 1.3% Native American, 8.2% Asian, 0.3% Pacific Islander, 6.2% from other races, and 2.5% from two or more races. Hispanic or Latino of any race were 16.7% of the population.
The median income for a household in Vallejo was $50,945, and the median income for a family was $60,945. The per capita income for the city was $25,945. About 17.2% of families and 20.7% of the population were below the poverty line, including 28.2% of those under age 18 and 8.7% of those age 65 or over.
Common Questions
What is Per Capita Income in Vallejo?
Per Capita income in Vallejo is $39,843.
What is the Median Family Income in Vallejo?
Median Family Income in Vallejo is $99,678.
What is the Median Household income in Vallejo?
Median Household Income in Vallejo is $86,112.
What is Income or Wage Gap in Vallejo?
Income or Wage Gap in Vallejo is 13.3%.
Women in Vallejo earn 86.7 cents for every dollar earned by a man.
What is Family Income Deficit in Vallejo?
Family Income Deficit in Vallejo is $9,956.
Families that are below poverty line in Vallejo earn $9,956 less on average than the poverty threshold level.
What is Inequality or Gini Index in Vallejo?
Inequality or Gini Index in Vallejo is 0.44.
What is the Total Population of Vallejo?
Total Population of Vallejo is 125,132.
What is the Total Male Population of Vallejo?
Total Male Population of Vallejo is 61,275.
What is the Total Female Population of Vallejo?
Total Female Population of Vallejo is 63,857.
What is the Ratio of Males per 100 Females in Vallejo?
There are 95.96 Males per 100 Females in Vallejo.
What is the Ratio of Females per 100 Males in Vallejo?
There are 104.21 Females per 100 Males in Vallejo.
What is the Median Population Age in Vallejo?
Median Population Age in Vallejo is 40.4 Years.
What is the Average Family Size in Vallejo
Average Family Size in Vallejo is 3.4 People.
What is the Average Household Size in Vallejo
Average Household Size in Vallejo is 2.8 People.
How Large is the Labor Force in Vallejo?
There are 65,258 People in the Labor Forcein in Vallejo.
What is the Percentage of People in the Labor Force in Vallejo?
63.5% of People are in the Labor Force in Vallejo.
What is the Unemployment Rate in Vallejo?
Unemployment Rate in Vallejo is 7.0%.