Florin, CA Map & Demographics
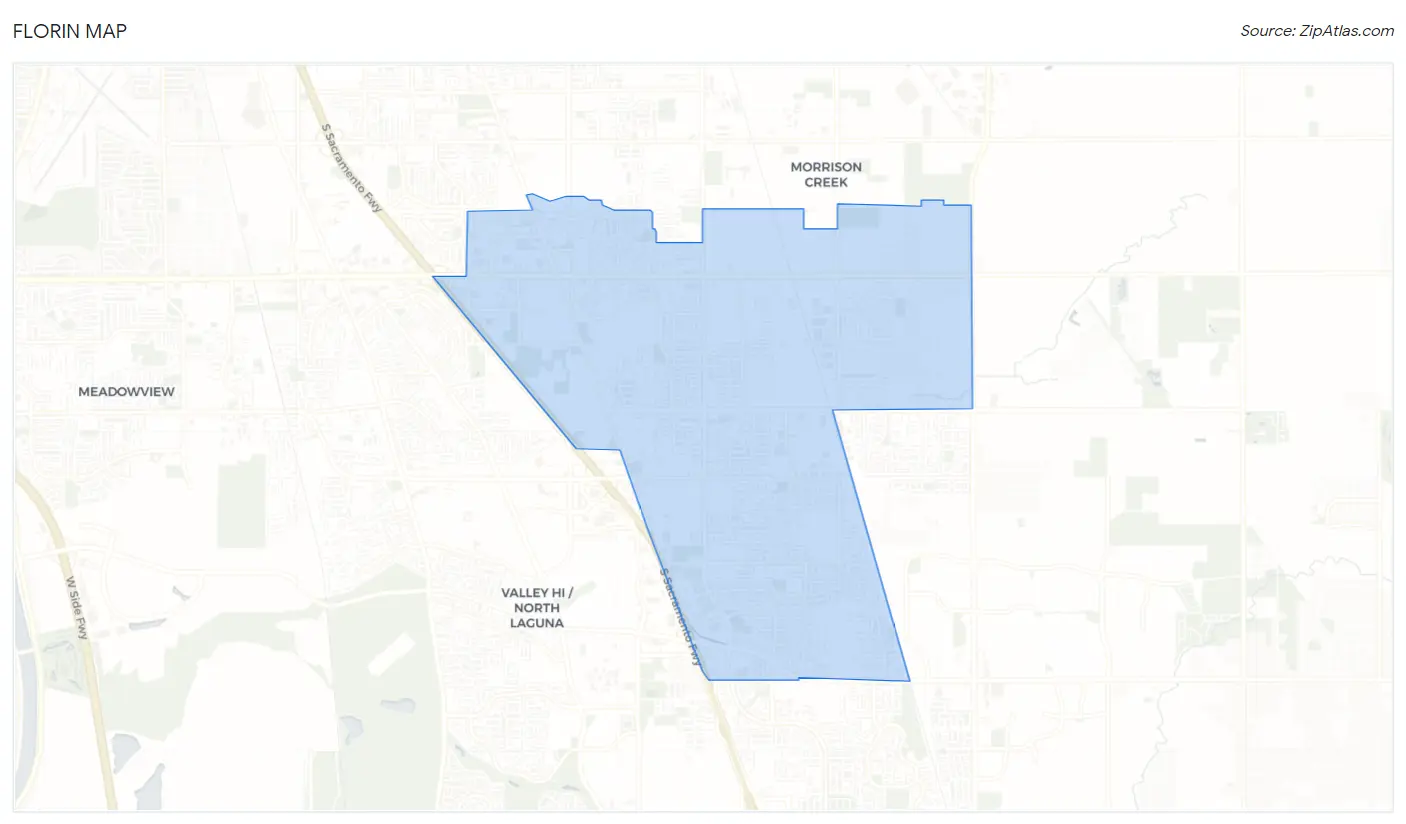
Florin Map
Florin Overview
$25,577
PER CAPITA INCOME
$68,161
AVG FAMILY INCOME
$62,677
AVG HOUSEHOLD INCOME
10.1%
WAGE / INCOME GAP [ % ]
89.9¢/ $1
WAGE / INCOME GAP [ $ ]
$10,807
FAMILY INCOME DEFICIT
0.44
INEQUALITY / GINI INDEX
49,992
TOTAL POPULATION
25,604
MALE POPULATION
24,388
FEMALE POPULATION
104.99
MALES / 100 FEMALES
95.25
FEMALES / 100 MALES
35.0
MEDIAN AGE
3.8
AVG FAMILY SIZE
3.2
AVG HOUSEHOLD SIZE
23,526
LABOR FORCE [ PEOPLE ]
60.4%
PERCENT IN LABOR FORCE
9.1%
UNEMPLOYMENT RATE
Income in Florin
Income Overview in Florin
Per Capita Income in Florin is $25,577, while median incomes of families and households are $68,161 and $62,677 respectively.
| Characteristic | Number | Measure |
| Per Capita Income | 49,992 | $25,577 |
| Median Family Income | 10,937 | $68,161 |
| Mean Family Income | 10,937 | $83,334 |
| Median Household Income | 15,168 | $62,677 |
| Mean Household Income | 15,168 | $79,920 |
| Income Deficit | 10,937 | $10,807 |
| Wage / Income Gap (%) | 49,992 | 10.08% |
| Wage / Income Gap ($) | 49,992 | 89.92¢ per $1 |
| Gini / Inequality Index | 49,992 | 0.44 |
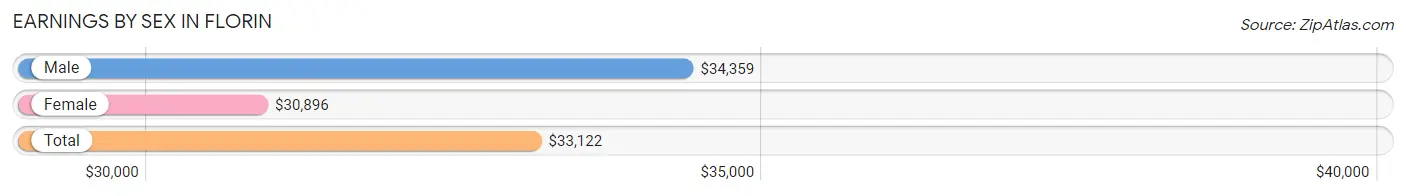
Earnings by Sex in Florin
Average Earnings in Florin are $33,122, $34,359 for men and $30,896 for women, a difference of 10.1%.
| Sex | Number | Average Earnings |
| Male | 12,887 (54.9%) | $34,359 |
| Female | 10,584 (45.1%) | $30,896 |
| Total | 23,471 (100.0%) | $33,122 |
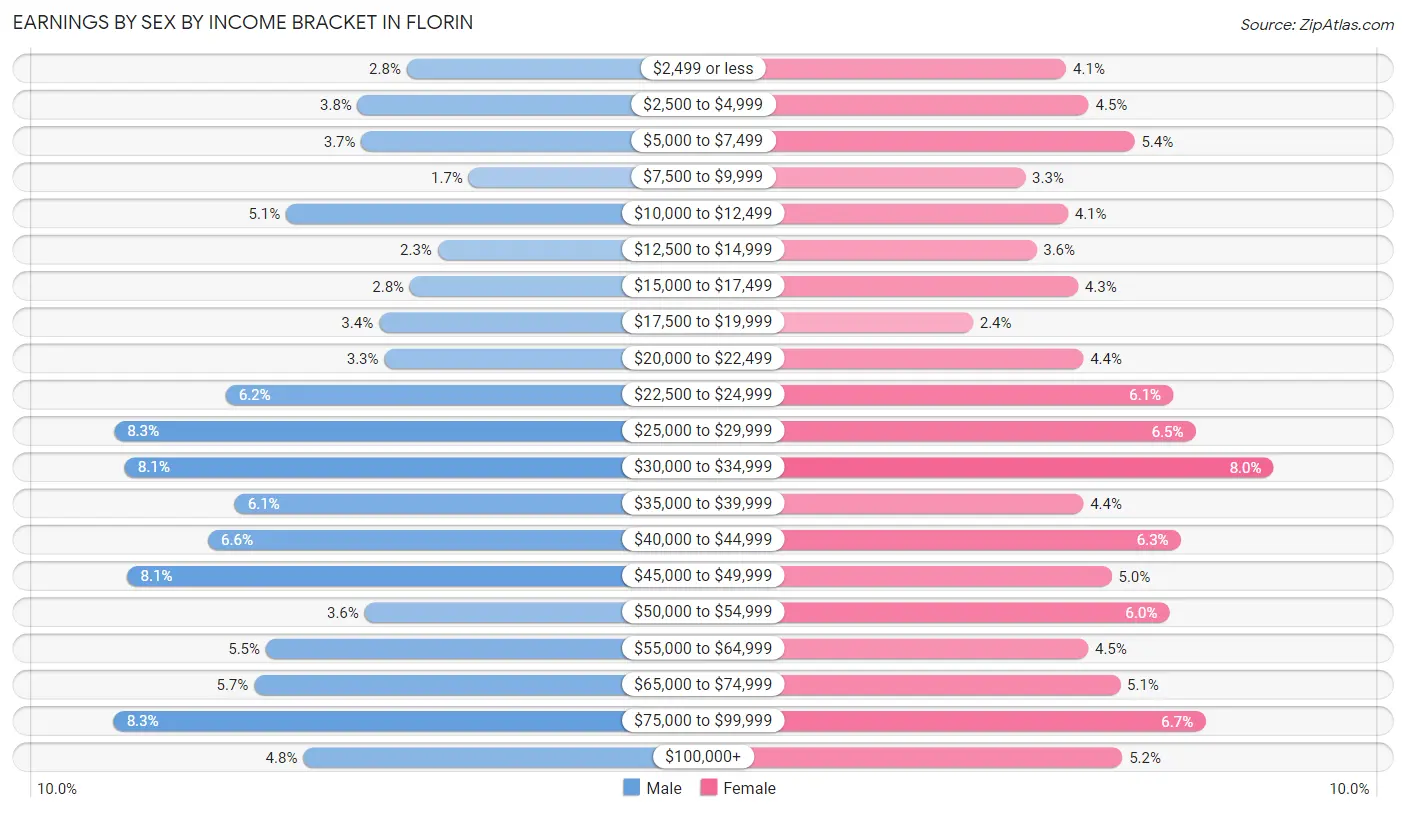
Earnings by Sex by Income Bracket in Florin
The most common earnings brackets in Florin are $75,000 to $99,999 for men (1,073 | 8.3%) and $30,000 to $34,999 for women (846 | 8.0%).
| Income | Male | Female |
| $2,499 or less | 366 (2.8%) | 435 (4.1%) |
| $2,500 to $4,999 | 484 (3.8%) | 479 (4.5%) |
| $5,000 to $7,499 | 476 (3.7%) | 571 (5.4%) |
| $7,500 to $9,999 | 217 (1.7%) | 354 (3.3%) |
| $10,000 to $12,499 | 657 (5.1%) | 438 (4.1%) |
| $12,500 to $14,999 | 291 (2.3%) | 376 (3.5%) |
| $15,000 to $17,499 | 358 (2.8%) | 458 (4.3%) |
| $17,500 to $19,999 | 433 (3.4%) | 250 (2.4%) |
| $20,000 to $22,499 | 420 (3.3%) | 469 (4.4%) |
| $22,500 to $24,999 | 803 (6.2%) | 647 (6.1%) |
| $25,000 to $29,999 | 1,072 (8.3%) | 691 (6.5%) |
| $30,000 to $34,999 | 1,046 (8.1%) | 846 (8.0%) |
| $35,000 to $39,999 | 781 (6.1%) | 469 (4.4%) |
| $40,000 to $44,999 | 846 (6.6%) | 661 (6.2%) |
| $45,000 to $49,999 | 1,040 (8.1%) | 525 (5.0%) |
| $50,000 to $54,999 | 468 (3.6%) | 639 (6.0%) |
| $55,000 to $64,999 | 706 (5.5%) | 478 (4.5%) |
| $65,000 to $74,999 | 734 (5.7%) | 542 (5.1%) |
| $75,000 to $99,999 | 1,073 (8.3%) | 710 (6.7%) |
| $100,000+ | 616 (4.8%) | 546 (5.2%) |
| Total | 12,887 (100.0%) | 10,584 (100.0%) |
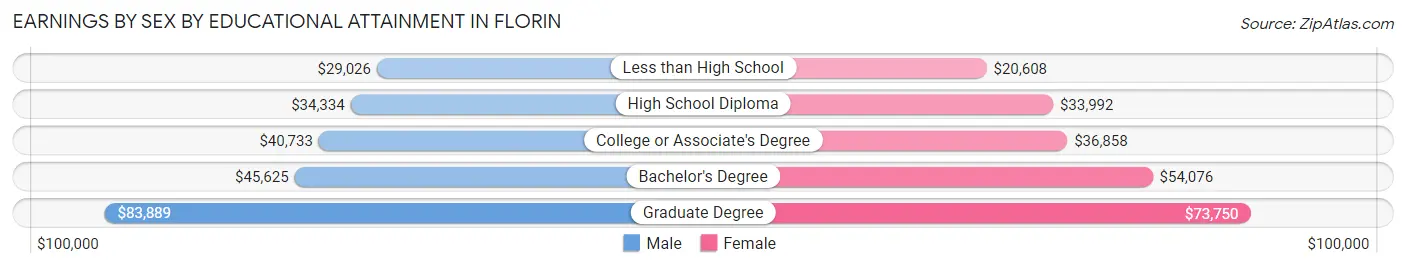
Earnings by Sex by Educational Attainment in Florin
Average earnings in Florin are $38,101 for men and $34,348 for women, a difference of 9.9%. Men with an educational attainment of graduate degree enjoy the highest average annual earnings of $83,889, while those with less than high school education earn the least with $29,026. Women with an educational attainment of graduate degree earn the most with the average annual earnings of $73,750, while those with less than high school education have the smallest earnings of $20,608.
| Educational Attainment | Male Income | Female Income |
| Less than High School | $29,026 | $20,608 |
| High School Diploma | $34,334 | $33,992 |
| College or Associate's Degree | $40,733 | $36,858 |
| Bachelor's Degree | $45,625 | $54,076 |
| Graduate Degree | $83,889 | $73,750 |
| Total | $38,101 | $34,348 |
Family Income in Florin
Family Income Brackets in Florin
According to the Florin family income data, there are 2,089 families falling into the $50,000 to $74,999 income range, which is the most common income bracket and makes up 19.1% of all families. Conversely, the $200,000+ income bracket is the least frequent group with only 372 families (3.4%) belonging to this category.
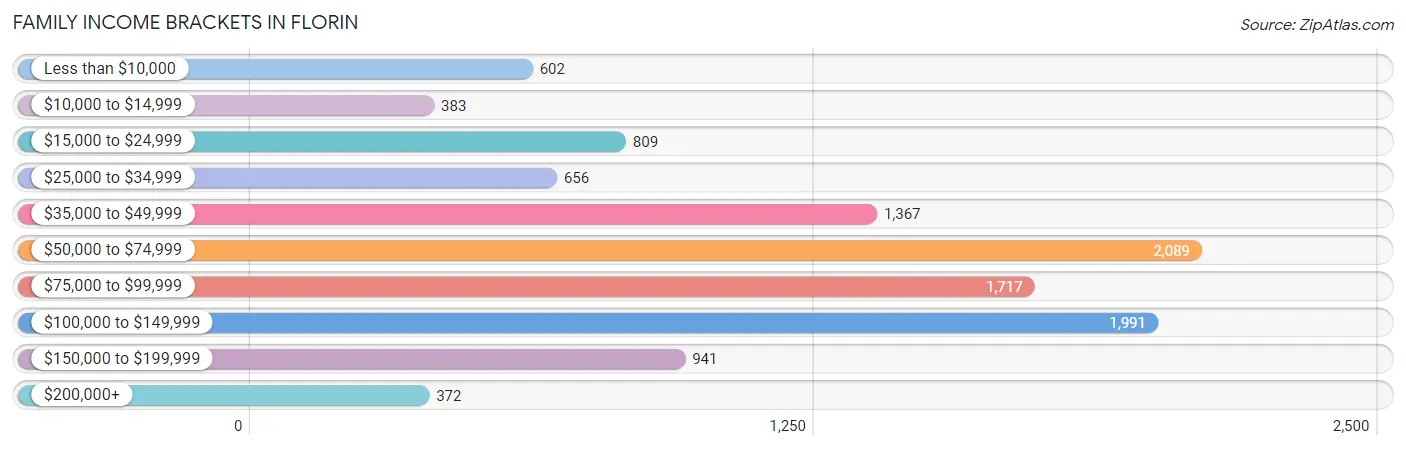
| Income Bracket | # Families | % Families |
| Less than $10,000 | 602 | 5.5% |
| $10,000 to $14,999 | 383 | 3.5% |
| $15,000 to $24,999 | 809 | 7.4% |
| $25,000 to $34,999 | 656 | 6.0% |
| $35,000 to $49,999 | 1,367 | 12.5% |
| $50,000 to $74,999 | 2,089 | 19.1% |
| $75,000 to $99,999 | 1,717 | 15.7% |
| $100,000 to $149,999 | 1,991 | 18.2% |
| $150,000 to $199,999 | 941 | 8.6% |
| $200,000+ | 372 | 3.4% |
Family Income by Famaliy Size in Florin
7+ person families (591 | 5.4%) account for the highest median family income in Florin with $110,762 per family, while 2-person families (3,415 | 31.2%) have the highest median income of $28,920 per family member.
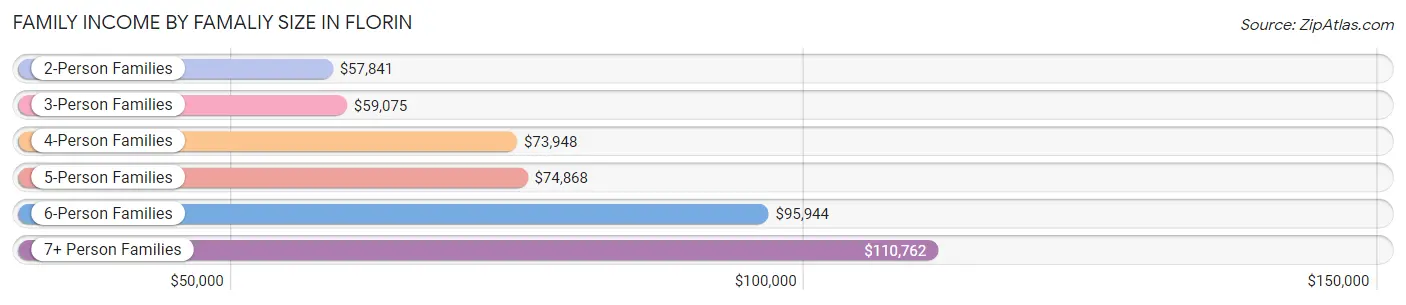
| Income Bracket | # Families | Median Income |
| 2-Person Families | 3,415 (31.2%) | $57,841 |
| 3-Person Families | 2,359 (21.6%) | $59,075 |
| 4-Person Families | 2,053 (18.8%) | $73,948 |
| 5-Person Families | 1,646 (15.0%) | $74,868 |
| 6-Person Families | 873 (8.0%) | $95,944 |
| 7+ Person Families | 591 (5.4%) | $110,762 |
| Total | 10,937 (100.0%) | $68,161 |
Family Income by Number of Earners in Florin
The median family income in Florin is $68,161, with families comprising 3+ earners (2,071) having the highest median family income of $120,989, while families with no earners (1,751) have the lowest median family income of $27,454, accounting for 18.9% and 16.0% of families, respectively.
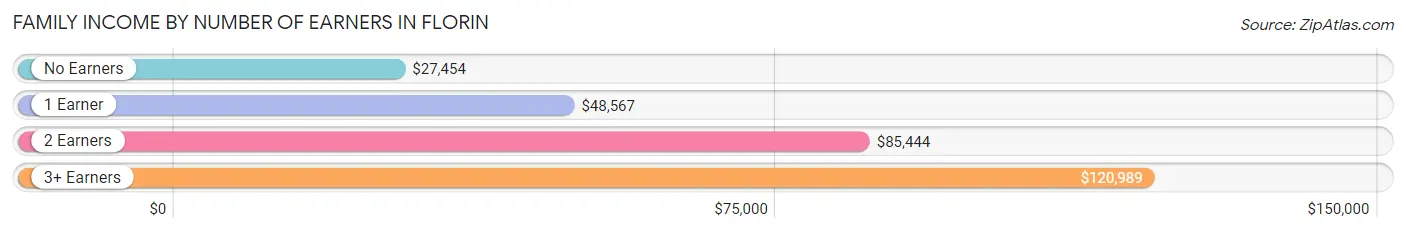
| Number of Earners | # Families | Median Income |
| No Earners | 1,751 (16.0%) | $27,454 |
| 1 Earner | 3,545 (32.4%) | $48,567 |
| 2 Earners | 3,570 (32.6%) | $85,444 |
| 3+ Earners | 2,071 (18.9%) | $120,989 |
| Total | 10,937 (100.0%) | $68,161 |
Household Income in Florin
Household Income Brackets in Florin
With 2,685 households falling in the category, the $50,000 to $74,999 income range is the most frequent in Florin, accounting for 17.7% of all households. In contrast, only 516 households (3.4%) fall into the $200,000+ income bracket, making it the least populous group.
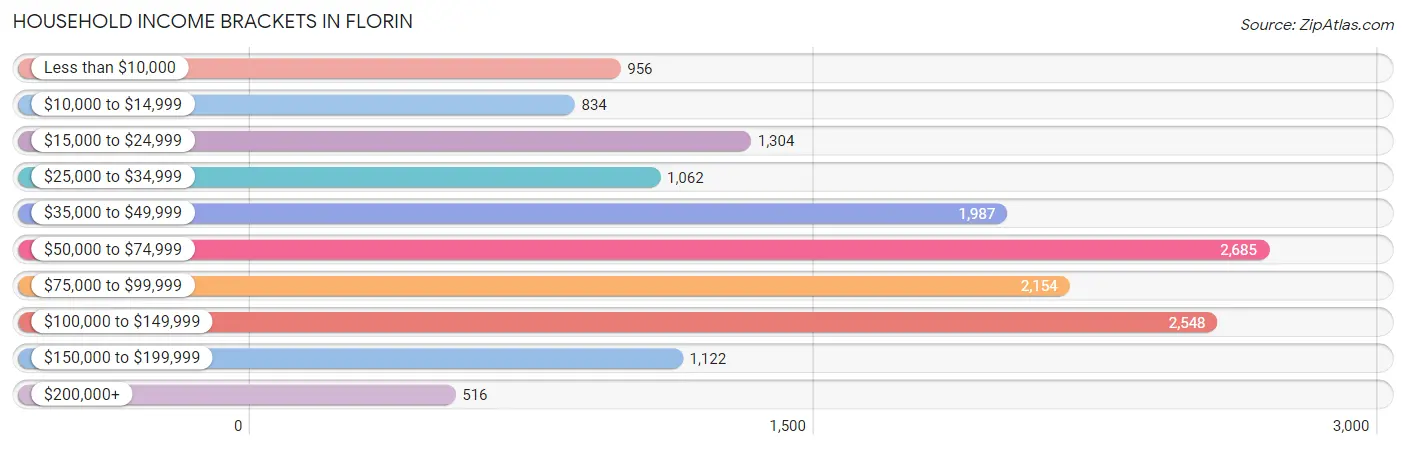
| Income Bracket | # Households | % Households |
| Less than $10,000 | 956 | 6.3% |
| $10,000 to $14,999 | 834 | 5.5% |
| $15,000 to $24,999 | 1,304 | 8.6% |
| $25,000 to $34,999 | 1,062 | 7.0% |
| $35,000 to $49,999 | 1,987 | 13.1% |
| $50,000 to $74,999 | 2,685 | 17.7% |
| $75,000 to $99,999 | 2,154 | 14.2% |
| $100,000 to $149,999 | 2,548 | 16.8% |
| $150,000 to $199,999 | 1,122 | 7.4% |
| $200,000+ | 516 | 3.4% |
Household Income by Householder Age in Florin
The median household income in Florin is $62,677, with the highest median household income of $72,775 found in the 25 to 44 years age bracket for the primary householder. A total of 5,141 households (33.9%) fall into this category. Meanwhile, the 65+ years age bracket for the primary householder has the lowest median household income of $49,918, with 3,529 households (23.3%) in this group.
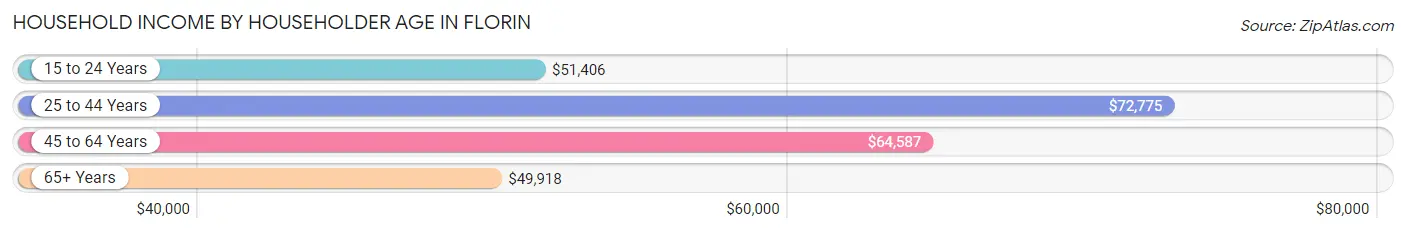
| Income Bracket | # Households | Median Income |
| 15 to 24 Years | 293 (1.9%) | $51,406 |
| 25 to 44 Years | 5,141 (33.9%) | $72,775 |
| 45 to 64 Years | 6,205 (40.9%) | $64,587 |
| 65+ Years | 3,529 (23.3%) | $49,918 |
| Total | 15,168 (100.0%) | $62,677 |
Poverty in Florin
Income Below Poverty by Sex and Age in Florin
With 16.9% poverty level for males and 20.0% for females among the residents of Florin, 15 year old males and 6 to 11 year old females are the most vulnerable to poverty, with 254 males (49.6%) and 644 females (29.3%) in their respective age groups living below the poverty level.
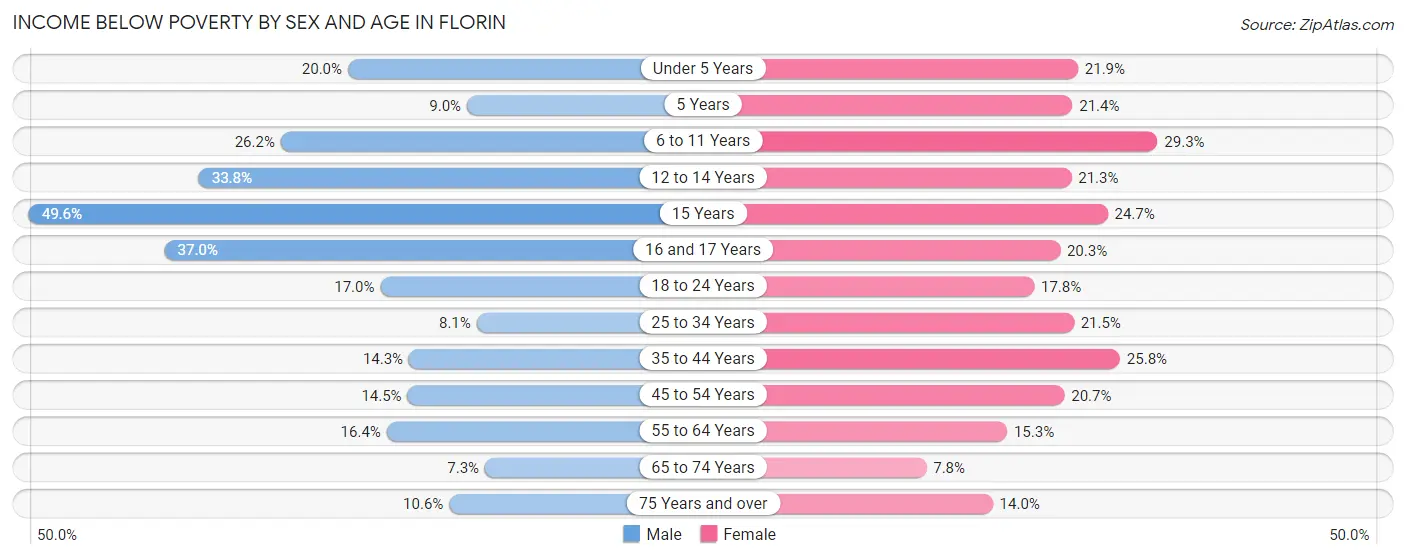
| Age Bracket | Male | Female |
| Under 5 Years | 235 (20.0%) | 340 (21.9%) |
| 5 Years | 23 (8.9%) | 71 (21.4%) |
| 6 to 11 Years | 544 (26.2%) | 644 (29.3%) |
| 12 to 14 Years | 524 (33.8%) | 206 (21.3%) |
| 15 Years | 254 (49.6%) | 72 (24.7%) |
| 16 and 17 Years | 252 (37.0%) | 159 (20.3%) |
| 18 to 24 Years | 471 (17.0%) | 359 (17.8%) |
| 25 to 34 Years | 342 (8.1%) | 732 (21.5%) |
| 35 to 44 Years | 496 (14.3%) | 823 (25.8%) |
| 45 to 54 Years | 414 (14.5%) | 594 (20.6%) |
| 55 to 64 Years | 500 (16.4%) | 477 (15.3%) |
| 65 to 74 Years | 121 (7.3%) | 146 (7.8%) |
| 75 Years and over | 126 (10.6%) | 242 (14.0%) |
| Total | 4,302 (16.9%) | 4,865 (20.0%) |
Income Above Poverty by Sex and Age in Florin
According to the poverty statistics in Florin, males aged 65 to 74 years and females aged 65 to 74 years are the age groups that are most secure financially, with 92.7% of males and 92.2% of females in these age groups living above the poverty line.
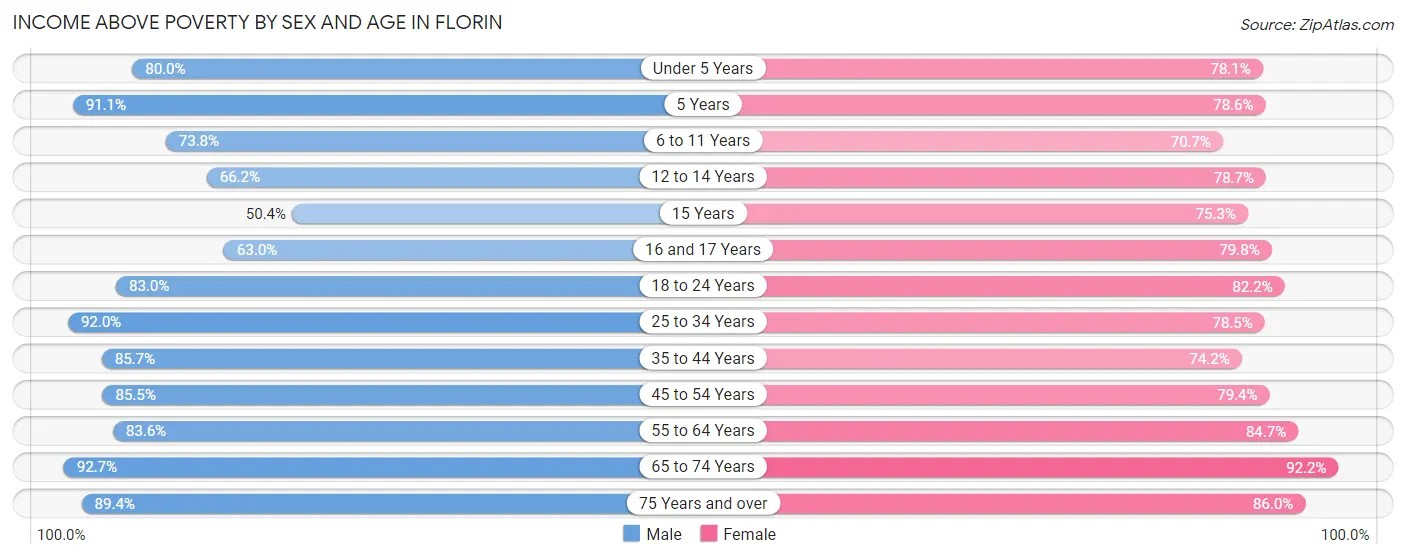
| Age Bracket | Male | Female |
| Under 5 Years | 940 (80.0%) | 1,212 (78.1%) |
| 5 Years | 234 (91.0%) | 261 (78.6%) |
| 6 to 11 Years | 1,530 (73.8%) | 1,555 (70.7%) |
| 12 to 14 Years | 1,025 (66.2%) | 761 (78.7%) |
| 15 Years | 258 (50.4%) | 220 (75.3%) |
| 16 and 17 Years | 429 (63.0%) | 626 (79.7%) |
| 18 to 24 Years | 2,301 (83.0%) | 1,653 (82.2%) |
| 25 to 34 Years | 3,907 (91.9%) | 2,669 (78.5%) |
| 35 to 44 Years | 2,966 (85.7%) | 2,366 (74.2%) |
| 45 to 54 Years | 2,448 (85.5%) | 2,283 (79.3%) |
| 55 to 64 Years | 2,549 (83.6%) | 2,634 (84.7%) |
| 65 to 74 Years | 1,542 (92.7%) | 1,716 (92.2%) |
| 75 Years and over | 1,063 (89.4%) | 1,487 (86.0%) |
| Total | 21,192 (83.1%) | 19,443 (80.0%) |
Income Below Poverty Among Married-Couple Families in Florin
The poverty statistics for married-couple families in Florin show that 11.1% or 693 of the total 6,222 families live below the poverty line. Families with 3 or 4 children have the highest poverty rate of 20.1%, comprising of 200 families. On the other hand, families with 5 or more children have the lowest poverty rate of 0.0%, which includes 0 families.
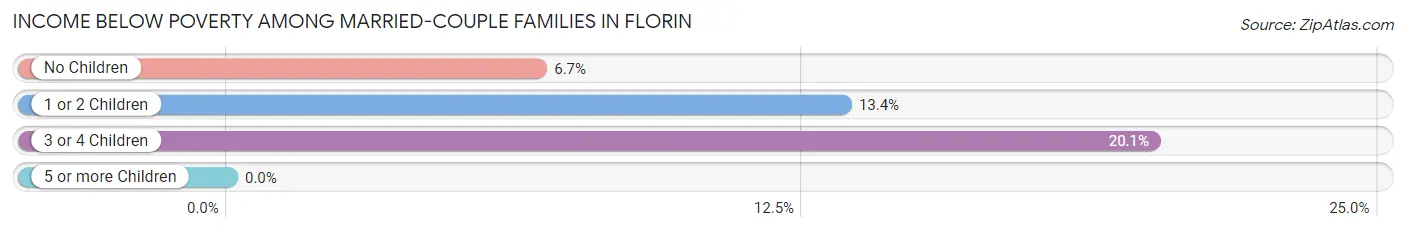
| Children | Above Poverty | Below Poverty |
| No Children | 2,784 (93.3%) | 201 (6.7%) |
| 1 or 2 Children | 1,893 (86.6%) | 292 (13.4%) |
| 3 or 4 Children | 796 (79.9%) | 200 (20.1%) |
| 5 or more Children | 56 (100.0%) | 0 (0.0%) |
| Total | 5,529 (88.9%) | 693 (11.1%) |
Income Below Poverty Among Single-Parent Households in Florin
According to the poverty data in Florin, 11.4% or 188 single-father households and 31.5% or 966 single-mother households are living below the poverty line. Among single-father households, those with 3 or 4 children have the highest poverty rate, with 81 households (45.8%) experiencing poverty. Likewise, among single-mother households, those with 5 or more children have the highest poverty rate, with 55 households (56.1%) falling below the poverty line.
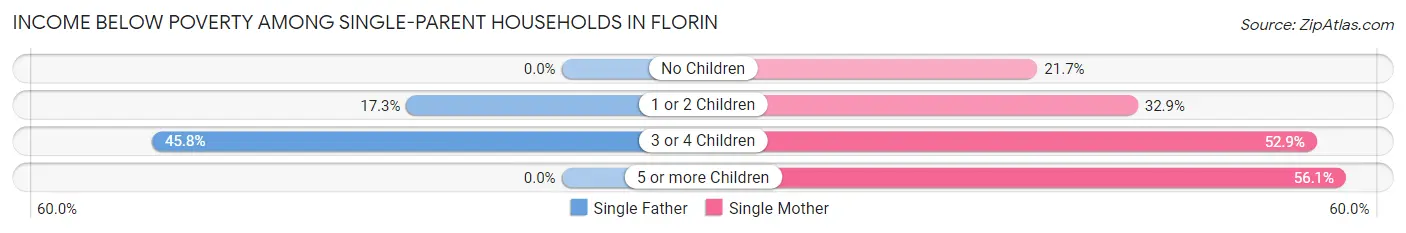
| Children | Single Father | Single Mother |
| No Children | 0 (0.0%) | 288 (21.6%) |
| 1 or 2 Children | 107 (17.3%) | 401 (32.9%) |
| 3 or 4 Children | 81 (45.8%) | 222 (52.9%) |
| 5 or more Children | 0 (0.0%) | 55 (56.1%) |
| Total | 188 (11.4%) | 966 (31.5%) |
Income Below Poverty Among Married-Couple vs Single-Parent Households in Florin
The poverty data for Florin shows that 693 of the married-couple family households (11.1%) and 1,154 of the single-parent households (24.5%) are living below the poverty level. Within the married-couple family households, those with 3 or 4 children have the highest poverty rate, with 200 households (20.1%) falling below the poverty line. Among the single-parent households, those with 3 or 4 children have the highest poverty rate, with 303 household (50.7%) living below poverty.
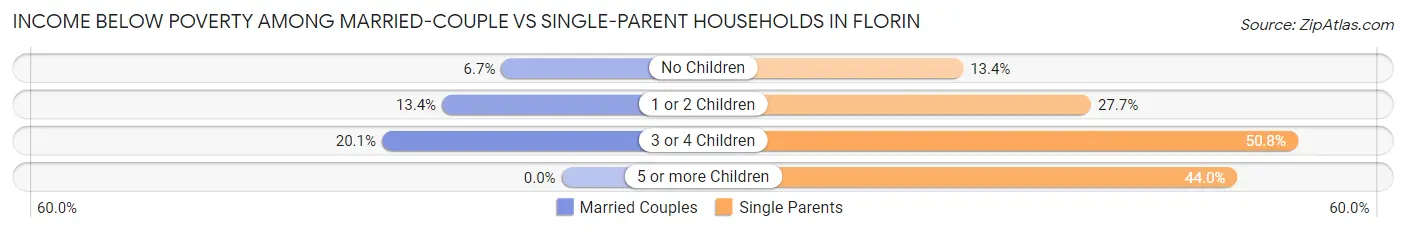
| Children | Married-Couple Families | Single-Parent Households |
| No Children | 201 (6.7%) | 288 (13.4%) |
| 1 or 2 Children | 292 (13.4%) | 508 (27.7%) |
| 3 or 4 Children | 200 (20.1%) | 303 (50.7%) |
| 5 or more Children | 0 (0.0%) | 55 (44.0%) |
| Total | 693 (11.1%) | 1,154 (24.5%) |
Race in Florin
The most populous races in Florin are Asian (17,549 | 35.1%), Hispanic or Latino (15,810 | 31.6%), and White / Caucasian (11,209 | 22.4%).
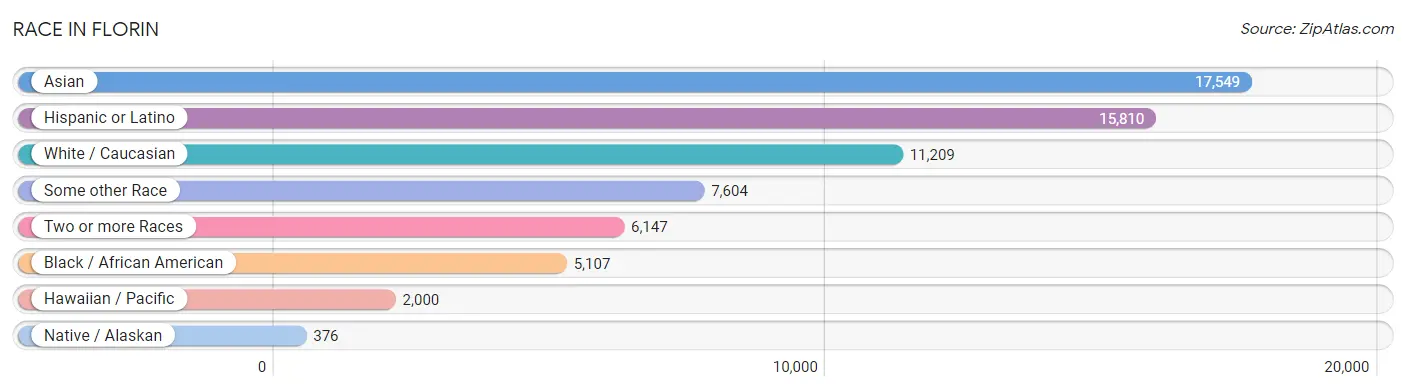
| Race | # Population | % Population |
| Asian | 17,549 | 35.1% |
| Black / African American | 5,107 | 10.2% |
| Hawaiian / Pacific | 2,000 | 4.0% |
| Hispanic or Latino | 15,810 | 31.6% |
| Native / Alaskan | 376 | 0.7% |
| White / Caucasian | 11,209 | 22.4% |
| Two or more Races | 6,147 | 12.3% |
| Some other Race | 7,604 | 15.2% |
| Total | 49,992 | 100.0% |
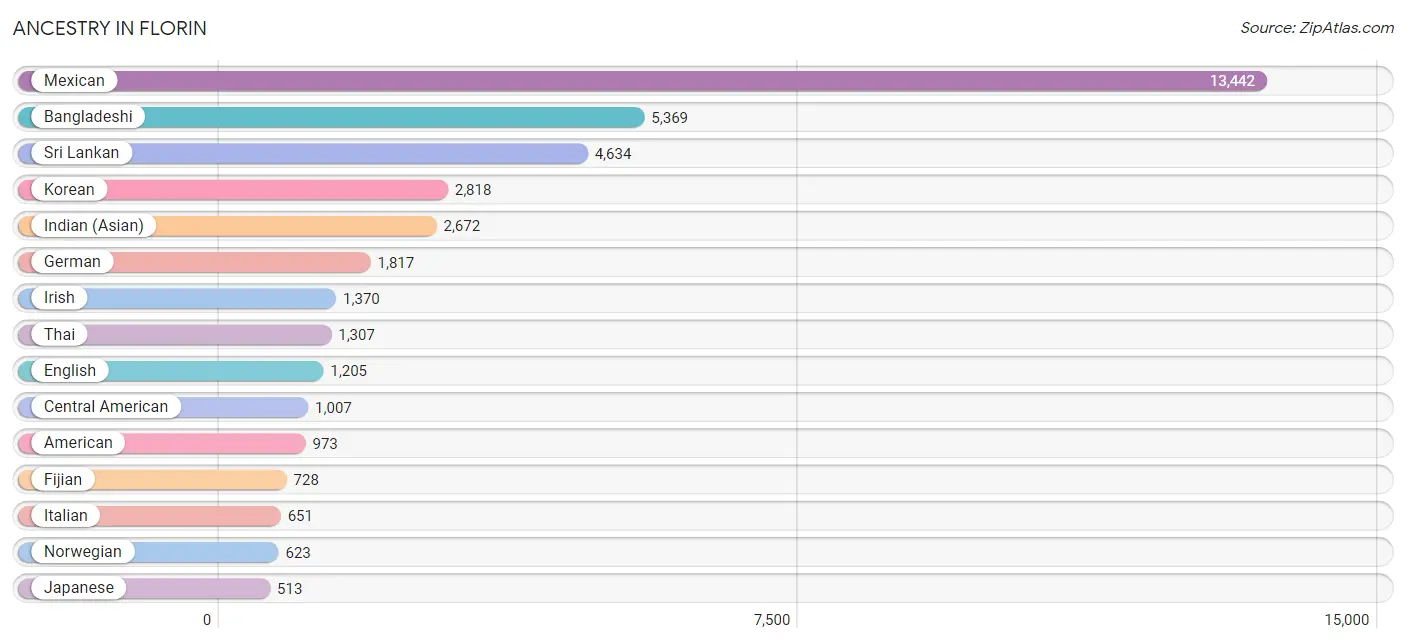
Ancestry in Florin
The most populous ancestries reported in Florin are Mexican (13,442 | 26.9%), Bangladeshi (5,369 | 10.7%), Sri Lankan (4,634 | 9.3%), Korean (2,818 | 5.6%), and Indian (Asian) (2,672 | 5.3%), together accounting for 57.9% of all Florin residents.
| Ancestry | # Population | % Population |
| Afghan | 470 | 0.9% |
| African | 198 | 0.4% |
| American | 973 | 1.9% |
| Arab | 96 | 0.2% |
| Argentinean | 1 | 0.0% |
| Austrian | 19 | 0.0% |
| Bangladeshi | 5,369 | 10.7% |
| Belgian | 19 | 0.0% |
| Bhutanese | 325 | 0.6% |
| British | 341 | 0.7% |
| Burmese | 216 | 0.4% |
| Canadian | 44 | 0.1% |
| Central American | 1,007 | 2.0% |
| Central American Indian | 81 | 0.2% |
| Cherokee | 121 | 0.2% |
| Chippewa | 16 | 0.0% |
| Choctaw | 66 | 0.1% |
| Creek | 20 | 0.0% |
| Croatian | 12 | 0.0% |
| Crow | 47 | 0.1% |
| Cuban | 12 | 0.0% |
| Czech | 16 | 0.0% |
| Czechoslovakian | 24 | 0.1% |
| Danish | 73 | 0.2% |
| Dutch | 181 | 0.4% |
| Eastern European | 50 | 0.1% |
| Egyptian | 25 | 0.1% |
| English | 1,205 | 2.4% |
| European | 238 | 0.5% |
| Fijian | 728 | 1.5% |
| Filipino | 12 | 0.0% |
| French | 194 | 0.4% |
| French Canadian | 43 | 0.1% |
| German | 1,817 | 3.6% |
| Ghanaian | 17 | 0.0% |
| Greek | 29 | 0.1% |
| Guamanian / Chamorro | 360 | 0.7% |
| Guatemalan | 485 | 1.0% |
| Guyanese | 1 | 0.0% |
| Honduran | 124 | 0.3% |
| Hungarian | 12 | 0.0% |
| Indian (Asian) | 2,672 | 5.3% |
| Indonesian | 41 | 0.1% |
| Iranian | 28 | 0.1% |
| Irish | 1,370 | 2.7% |
| Iroquois | 6 | 0.0% |
| Italian | 651 | 1.3% |
| Jamaican | 12 | 0.0% |
| Japanese | 513 | 1.0% |
| Kenyan | 27 | 0.1% |
| Korean | 2,818 | 5.6% |
| Lebanese | 17 | 0.0% |
| Malaysian | 337 | 0.7% |
| Maltese | 11 | 0.0% |
| Mexican | 13,442 | 26.9% |
| Mexican American Indian | 246 | 0.5% |
| Moroccan | 26 | 0.1% |
| Native Hawaiian | 117 | 0.2% |
| Nepalese | 332 | 0.7% |
| Nicaraguan | 289 | 0.6% |
| Nigerian | 110 | 0.2% |
| Northern European | 10 | 0.0% |
| Norwegian | 623 | 1.3% |
| Pakistani | 95 | 0.2% |
| Palestinian | 28 | 0.1% |
| Polish | 200 | 0.4% |
| Portuguese | 495 | 1.0% |
| Puerto Rican | 367 | 0.7% |
| Romanian | 219 | 0.4% |
| Russian | 112 | 0.2% |
| Salvadoran | 109 | 0.2% |
| Samoan | 110 | 0.2% |
| Scandinavian | 33 | 0.1% |
| Scotch-Irish | 160 | 0.3% |
| Scottish | 191 | 0.4% |
| Serbian | 24 | 0.1% |
| Sierra Leonean | 30 | 0.1% |
| Slovene | 3 | 0.0% |
| South American | 1 | 0.0% |
| Spaniard | 495 | 1.0% |
| Spanish | 312 | 0.6% |
| Spanish American | 21 | 0.0% |
| Sri Lankan | 4,634 | 9.3% |
| Subsaharan African | 417 | 0.8% |
| Swedish | 44 | 0.1% |
| Swiss | 76 | 0.2% |
| Thai | 1,307 | 2.6% |
| Tohono O'Odham | 8 | 0.0% |
| Ukrainian | 20 | 0.0% |
| Welsh | 51 | 0.1% |
| West Indian | 26 | 0.1% | View All 91 Rows |
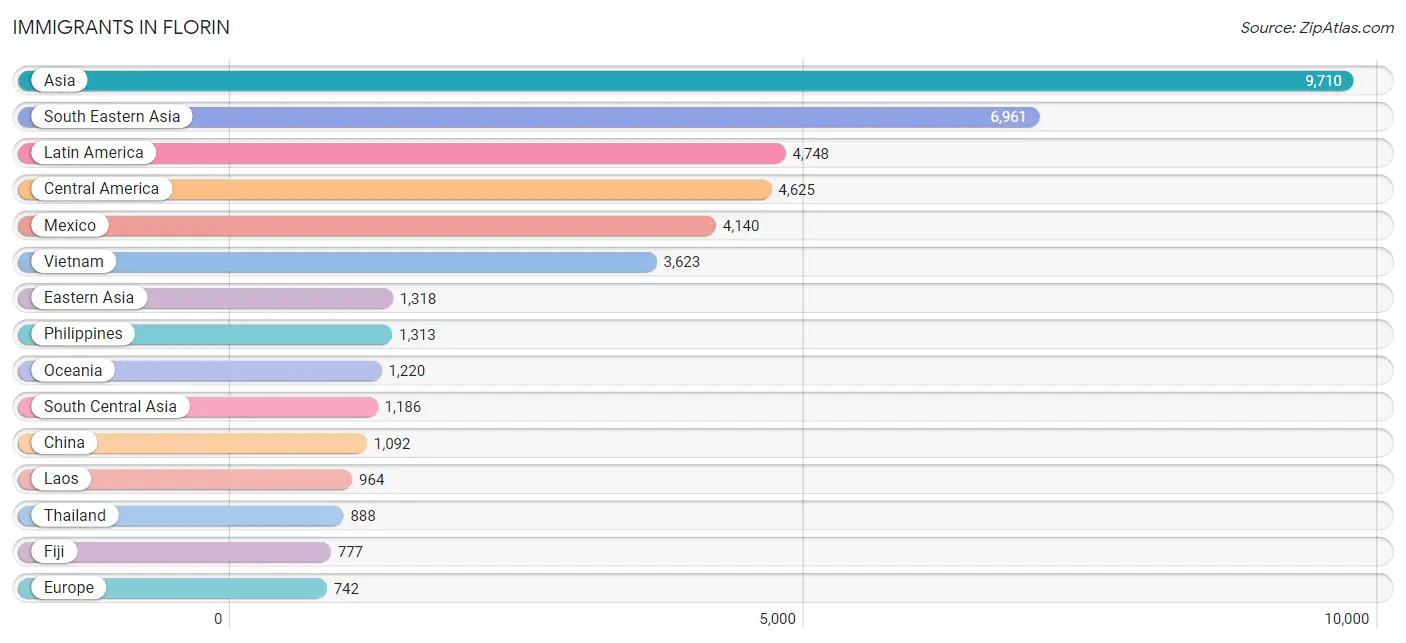
Immigrants in Florin
The most numerous immigrant groups reported in Florin came from Asia (9,710 | 19.4%), South Eastern Asia (6,961 | 13.9%), Latin America (4,748 | 9.5%), Central America (4,625 | 9.2%), and Mexico (4,140 | 8.3%), together accounting for 60.4% of all Florin residents.
| Immigration Origin | # Population | % Population |
| Afghanistan | 415 | 0.8% |
| Africa | 216 | 0.4% |
| Argentina | 1 | 0.0% |
| Asia | 9,710 | 19.4% |
| Australia | 9 | 0.0% |
| Belarus | 180 | 0.4% |
| Cambodia | 132 | 0.3% |
| Canada | 37 | 0.1% |
| Caribbean | 12 | 0.0% |
| Central America | 4,625 | 9.2% |
| China | 1,092 | 2.2% |
| Colombia | 100 | 0.2% |
| Eastern Africa | 9 | 0.0% |
| Eastern Asia | 1,318 | 2.6% |
| Eastern Europe | 548 | 1.1% |
| Egypt | 19 | 0.0% |
| El Salvador | 38 | 0.1% |
| England | 20 | 0.0% |
| Europe | 742 | 1.5% |
| Fiji | 777 | 1.5% |
| France | 37 | 0.1% |
| Germany | 74 | 0.2% |
| Ghana | 17 | 0.0% |
| Guatemala | 281 | 0.6% |
| Guyana | 10 | 0.0% |
| Honduras | 30 | 0.1% |
| Hong Kong | 81 | 0.2% |
| India | 672 | 1.3% |
| Israel | 25 | 0.1% |
| Italy | 12 | 0.0% |
| Jamaica | 12 | 0.0% |
| Japan | 147 | 0.3% |
| Kenya | 9 | 0.0% |
| Korea | 79 | 0.2% |
| Laos | 964 | 1.9% |
| Latin America | 4,748 | 9.5% |
| Lebanon | 17 | 0.0% |
| Mexico | 4,140 | 8.3% |
| Micronesia | 15 | 0.0% |
| Moldova | 117 | 0.2% |
| Morocco | 12 | 0.0% |
| Netherlands | 21 | 0.0% |
| Nicaragua | 136 | 0.3% |
| Nigeria | 74 | 0.2% |
| Northern Africa | 31 | 0.1% |
| Northern Europe | 50 | 0.1% |
| Oceania | 1,220 | 2.4% |
| Pakistan | 99 | 0.2% |
| Philippines | 1,313 | 2.6% |
| Poland | 18 | 0.0% |
| Romania | 142 | 0.3% |
| Russia | 57 | 0.1% |
| Sierra Leone | 30 | 0.1% |
| South America | 111 | 0.2% |
| South Central Asia | 1,186 | 2.4% |
| South Eastern Asia | 6,961 | 13.9% |
| Southern Europe | 12 | 0.0% |
| Syria | 200 | 0.4% |
| Taiwan | 22 | 0.0% |
| Thailand | 888 | 1.8% |
| Ukraine | 34 | 0.1% |
| Vietnam | 3,623 | 7.2% |
| Western Africa | 129 | 0.3% |
| Western Asia | 242 | 0.5% |
| Western Europe | 132 | 0.3% | View All 65 Rows |
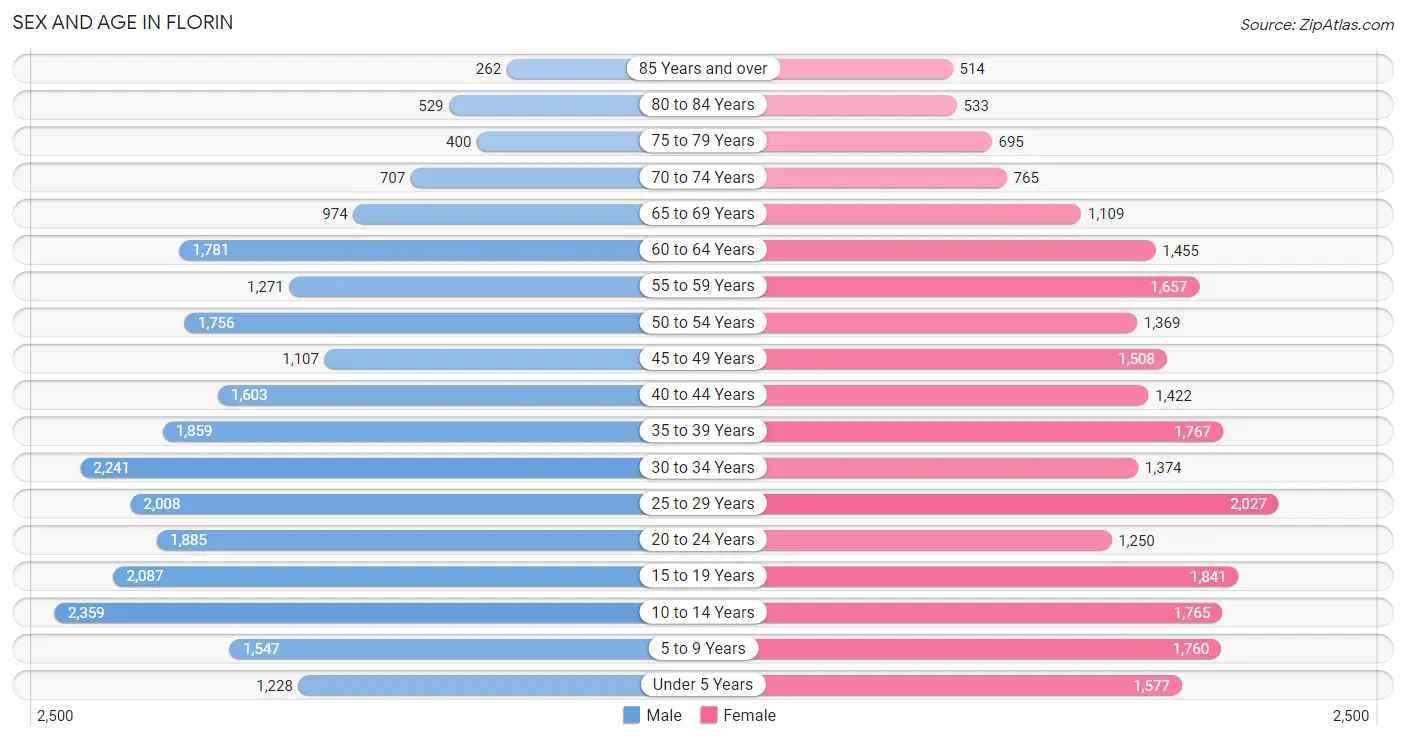
Sex and Age in Florin
Sex and Age in Florin
The most populous age groups in Florin are 10 to 14 Years (2,359 | 9.2%) for men and 25 to 29 Years (2,027 | 8.3%) for women.
| Age Bracket | Male | Female |
| Under 5 Years | 1,228 (4.8%) | 1,577 (6.5%) |
| 5 to 9 Years | 1,547 (6.0%) | 1,760 (7.2%) |
| 10 to 14 Years | 2,359 (9.2%) | 1,765 (7.2%) |
| 15 to 19 Years | 2,087 (8.2%) | 1,841 (7.5%) |
| 20 to 24 Years | 1,885 (7.4%) | 1,250 (5.1%) |
| 25 to 29 Years | 2,008 (7.8%) | 2,027 (8.3%) |
| 30 to 34 Years | 2,241 (8.7%) | 1,374 (5.6%) |
| 35 to 39 Years | 1,859 (7.3%) | 1,767 (7.2%) |
| 40 to 44 Years | 1,603 (6.3%) | 1,422 (5.8%) |
| 45 to 49 Years | 1,107 (4.3%) | 1,508 (6.2%) |
| 50 to 54 Years | 1,756 (6.9%) | 1,369 (5.6%) |
| 55 to 59 Years | 1,271 (5.0%) | 1,657 (6.8%) |
| 60 to 64 Years | 1,781 (7.0%) | 1,455 (6.0%) |
| 65 to 69 Years | 974 (3.8%) | 1,109 (4.5%) |
| 70 to 74 Years | 707 (2.8%) | 765 (3.1%) |
| 75 to 79 Years | 400 (1.6%) | 695 (2.9%) |
| 80 to 84 Years | 529 (2.1%) | 533 (2.2%) |
| 85 Years and over | 262 (1.0%) | 514 (2.1%) |
| Total | 25,604 (100.0%) | 24,388 (100.0%) |
Families and Households in Florin
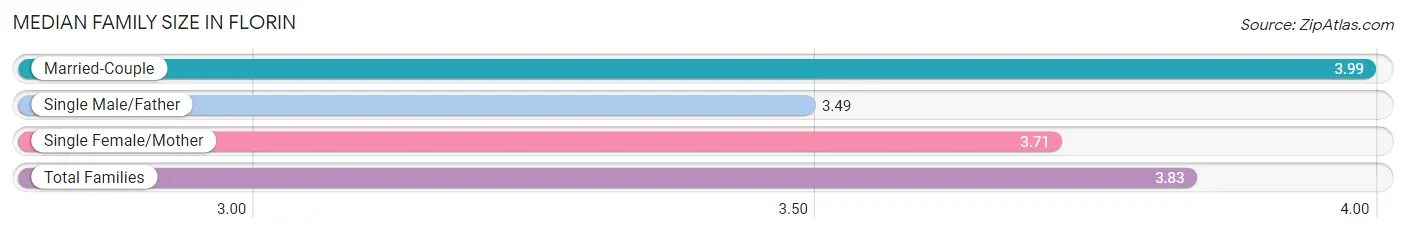
Median Family Size in Florin
The median family size in Florin is 3.83 persons per family, with married-couple families (6,222 | 56.9%) accounting for the largest median family size of 3.99 persons per family. On the other hand, single male/father families (1,647 | 15.1%) represent the smallest median family size with 3.49 persons per family.
| Family Type | # Families | Family Size |
| Married-Couple | 6,222 (56.9%) | 3.99 |
| Single Male/Father | 1,647 (15.1%) | 3.49 |
| Single Female/Mother | 3,068 (28.1%) | 3.71 |
| Total Families | 10,937 (100.0%) | 3.83 |
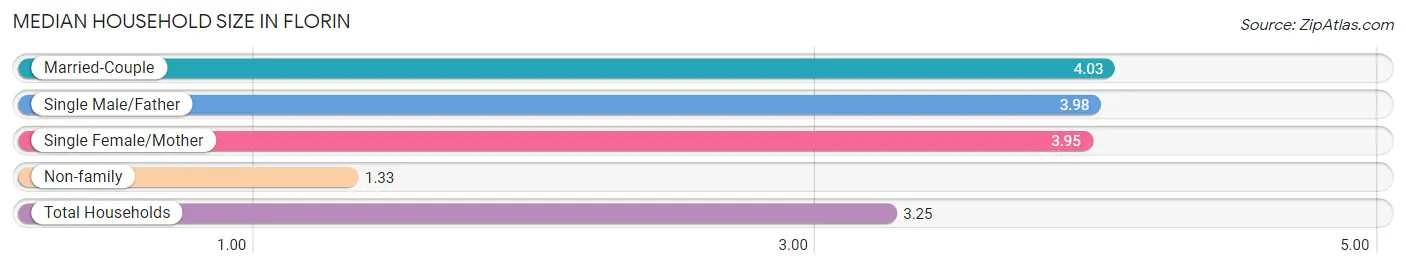
Median Household Size in Florin
The median household size in Florin is 3.25 persons per household, with married-couple households (6,222 | 41.0%) accounting for the largest median household size of 4.03 persons per household. non-family households (4,231 | 27.9%) represent the smallest median household size with 1.33 persons per household.
| Household Type | # Households | Household Size |
| Married-Couple | 6,222 (41.0%) | 4.03 |
| Single Male/Father | 1,647 (10.9%) | 3.98 |
| Single Female/Mother | 3,068 (20.2%) | 3.95 |
| Non-family | 4,231 (27.9%) | 1.33 |
| Total Households | 15,168 (100.0%) | 3.25 |
Household Size by Marriage Status in Florin
Out of a total of 15,168 households in Florin, 10,937 (72.1%) are family households, while 4,231 (27.9%) are nonfamily households. The most numerous type of family households are 2-person households, comprising 3,096, and the most common type of nonfamily households are 1-person households, comprising 3,492.
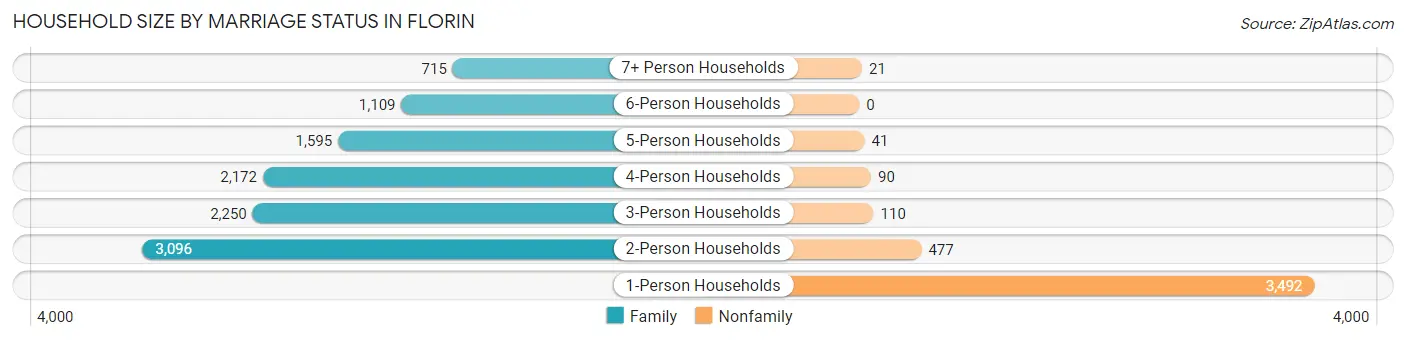
| Household Size | Family Households | Nonfamily Households |
| 1-Person Households | - | 3,492 (23.0%) |
| 2-Person Households | 3,096 (20.4%) | 477 (3.1%) |
| 3-Person Households | 2,250 (14.8%) | 110 (0.7%) |
| 4-Person Households | 2,172 (14.3%) | 90 (0.6%) |
| 5-Person Households | 1,595 (10.5%) | 41 (0.3%) |
| 6-Person Households | 1,109 (7.3%) | 0 (0.0%) |
| 7+ Person Households | 715 (4.7%) | 21 (0.1%) |
| Total | 10,937 (72.1%) | 4,231 (27.9%) |
Female Fertility in Florin
Fertility by Age in Florin
Average fertility rate in Florin is 67.0 births per 1,000 women. Women in the age bracket of 20 to 34 years have the highest fertility rate with 127.0 births per 1,000 women. Women in the age bracket of 20 to 34 years acount for 77.2% of all women with births.
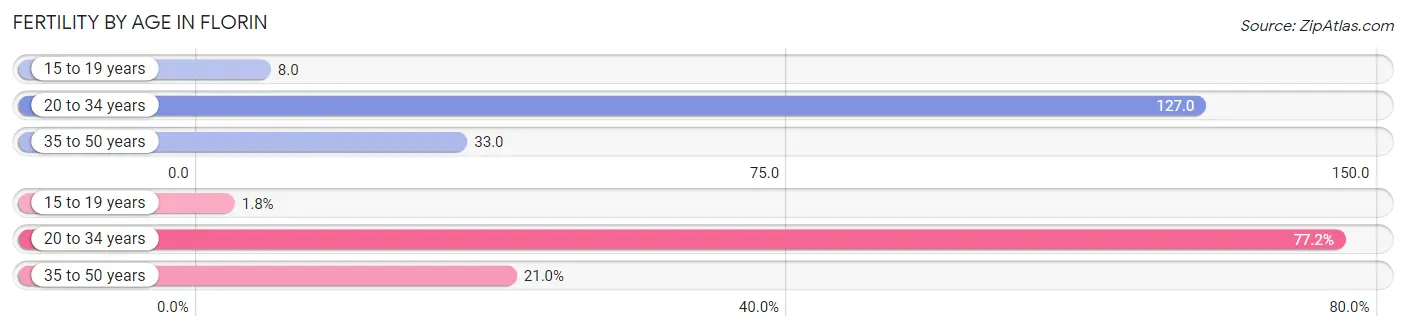
| Age Bracket | Women with Births | Births / 1,000 Women |
| 15 to 19 years | 14 (1.8%) | 8.0 |
| 20 to 34 years | 593 (77.2%) | 127.0 |
| 35 to 50 years | 161 (21.0%) | 33.0 |
| Total | 768 (100.0%) | 67.0 |
Fertility by Age by Marriage Status in Florin
68.6% of women with births (768) in Florin are married. The highest percentage of unmarried women with births falls into 20 to 34 years age bracket with 36.4% of them unmarried at the time of birth, while the lowest percentage of unmarried women with births belong to 15 to 19 years age bracket with 0.0% of them unmarried.
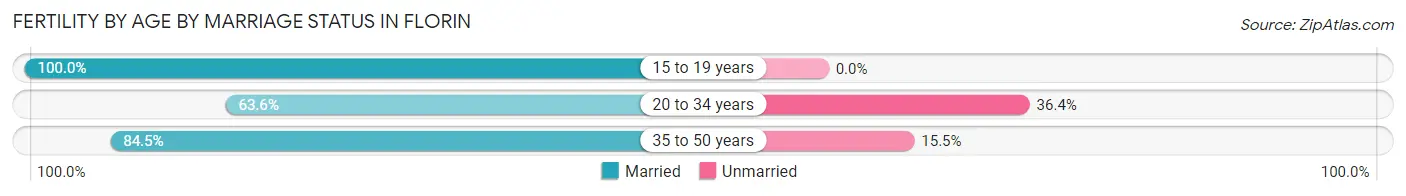
| Age Bracket | Married | Unmarried |
| 15 to 19 years | 14 (100.0%) | 0 (0.0%) |
| 20 to 34 years | 377 (63.6%) | 216 (36.4%) |
| 35 to 50 years | 136 (84.5%) | 25 (15.5%) |
| Total | 527 (68.6%) | 241 (31.4%) |
Fertility by Education in Florin
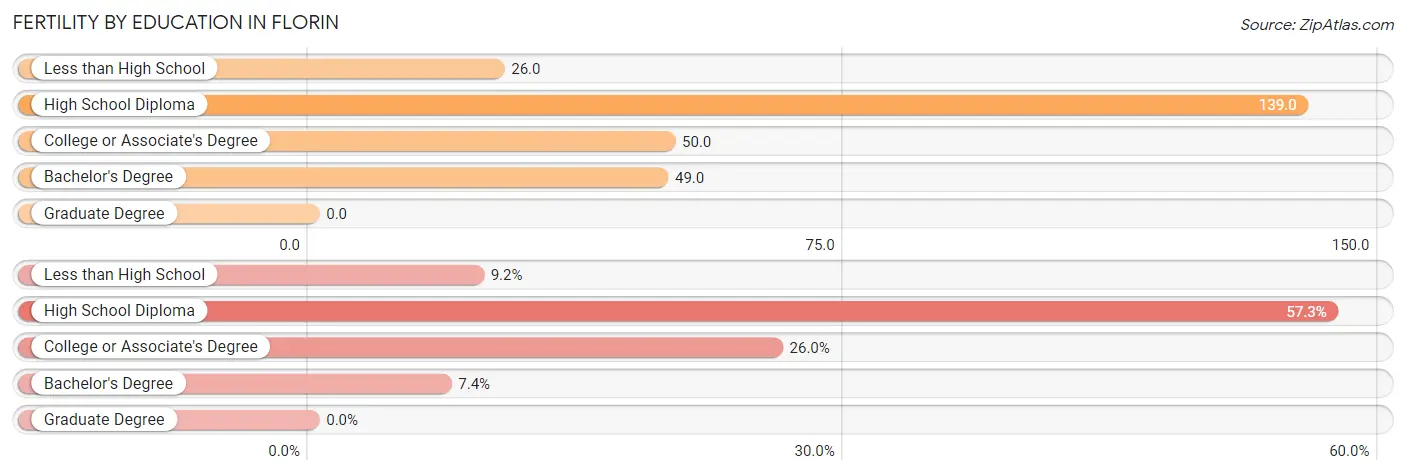
| Educational Attainment | Women with Births | Births / 1,000 Women |
| Less than High School | 71 (9.2%) | 26.0 |
| High School Diploma | 440 (57.3%) | 139.0 |
| College or Associate's Degree | 200 (26.0%) | 50.0 |
| Bachelor's Degree | 57 (7.4%) | 49.0 |
| Graduate Degree | 0 (0.0%) | 0.0 |
| Total | 768 (100.0%) | 67.0 |
Fertility by Education by Marriage Status in Florin
31.4% of women with births in Florin are unmarried. Women with the educational attainment of high school diploma are most likely to be married with 77.3% of them married at childbirth, while women with the educational attainment of college or associate's degree are least likely to be married with 54.0% of them unmarried at childbirth.
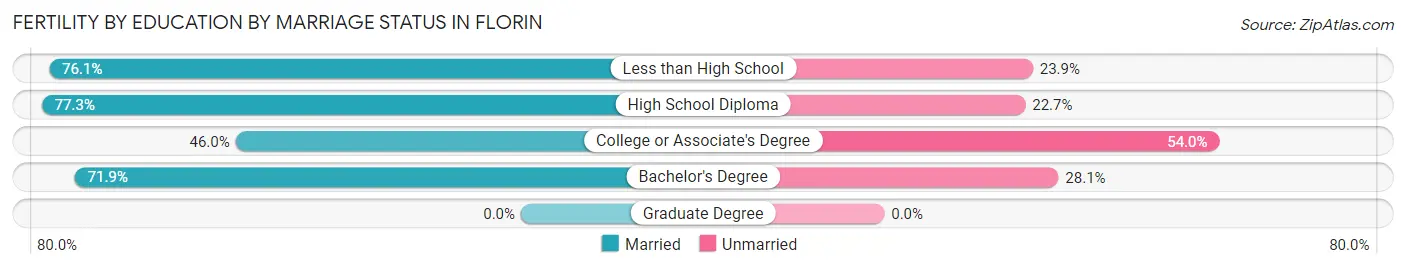
| Educational Attainment | Married | Unmarried |
| Less than High School | 54 (76.1%) | 17 (23.9%) |
| High School Diploma | 340 (77.3%) | 100 (22.7%) |
| College or Associate's Degree | 92 (46.0%) | 108 (54.0%) |
| Bachelor's Degree | 41 (71.9%) | 16 (28.1%) |
| Graduate Degree | 0 (0.0%) | 0 (0.0%) |
| Total | 527 (68.6%) | 241 (31.4%) |
Employment Characteristics in Florin
Employment by Class of Employer in Florin
Among the 20,862 employed individuals in Florin, private company employees (14,064 | 67.4%), self-employed (not incorporated) (1,712 | 8.2%), and state government employees (1,638 | 7.9%) make up the most common classes of employment.
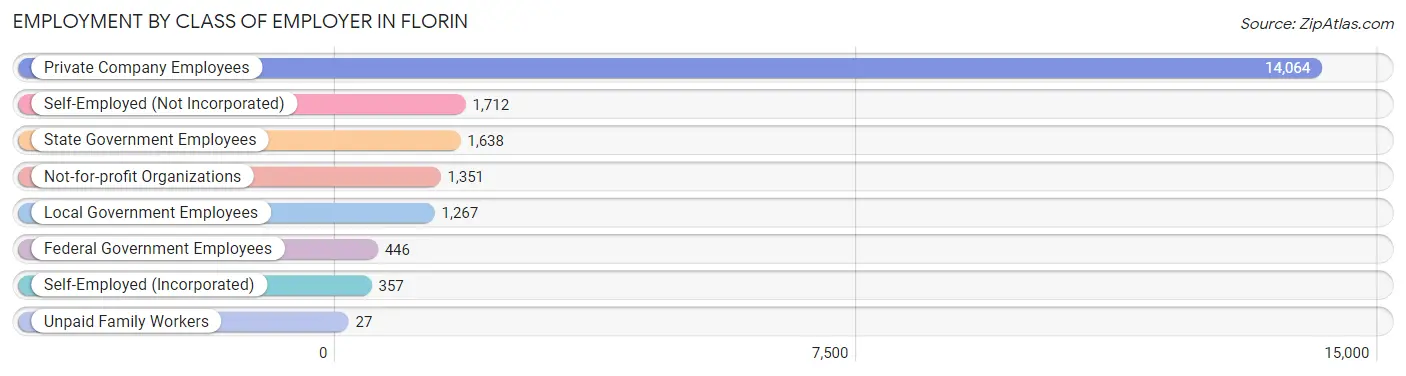
| Employer Class | # Employees | % Employees |
| Private Company Employees | 14,064 | 67.4% |
| Self-Employed (Incorporated) | 357 | 1.7% |
| Self-Employed (Not Incorporated) | 1,712 | 8.2% |
| Not-for-profit Organizations | 1,351 | 6.5% |
| Local Government Employees | 1,267 | 6.1% |
| State Government Employees | 1,638 | 7.9% |
| Federal Government Employees | 446 | 2.1% |
| Unpaid Family Workers | 27 | 0.1% |
| Total | 20,862 | 100.0% |
Employment Status by Age in Florin
According to the labor force statistics for Florin, out of the total population over 16 years of age (38,951), 60.4% or 23,526 individuals are in the labor force, with 9.1% or 2,141 of them unemployed. The age group with the highest labor force participation rate is 35 to 44 years, with 82.2% or 5,467 individuals in the labor force. Within the labor force, the 16 to 19 years age range has the highest percentage of unemployed individuals, with 19.7% or 237 of them being unemployed.
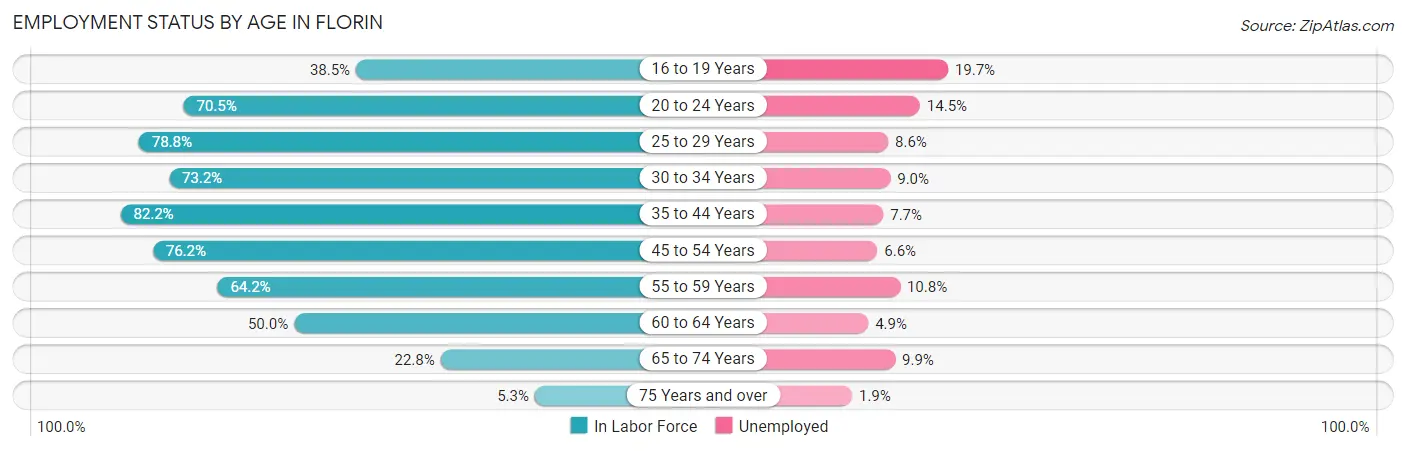
| Age Bracket | In Labor Force | Unemployed |
| 16 to 19 Years | 1,202 (38.5%) | 237 (19.7%) |
| 20 to 24 Years | 2,210 (70.5%) | 320 (14.5%) |
| 25 to 29 Years | 3,180 (78.8%) | 273 (8.6%) |
| 30 to 34 Years | 2,646 (73.2%) | 238 (9.0%) |
| 35 to 44 Years | 5,467 (82.2%) | 421 (7.7%) |
| 45 to 54 Years | 4,374 (76.2%) | 289 (6.6%) |
| 55 to 59 Years | 1,880 (64.2%) | 203 (10.8%) |
| 60 to 64 Years | 1,618 (50.0%) | 79 (4.9%) |
| 65 to 74 Years | 811 (22.8%) | 80 (9.9%) |
| 75 Years and over | 155 (5.3%) | 3 (1.9%) |
| Total | 23,526 (60.4%) | 2,141 (9.1%) |
Employment Status by Educational Attainment in Florin
According to labor force statistics for Florin, 73.1% of individuals (19,156) out of the total population between 25 and 64 years of age (26,205) are in the labor force, with 7.8% or 1,494 of them being unemployed. The group with the highest labor force participation rate are those with the educational attainment of bachelor's degree or higher, with 87.2% or 2,865 individuals in the labor force. Within the labor force, individuals with high school diploma education have the highest percentage of unemployment, with 11.8% or 658 of them being unemployed.
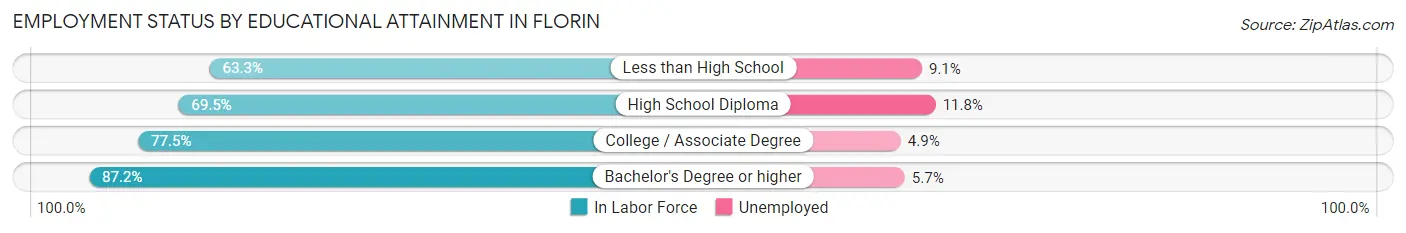
| Educational Attainment | In Labor Force | Unemployed |
| Less than High School | 3,635 (63.3%) | 523 (9.1%) |
| High School Diploma | 5,576 (69.5%) | 947 (11.8%) |
| College / Associate Degree | 7,095 (77.5%) | 449 (4.9%) |
| Bachelor's Degree or higher | 2,865 (87.2%) | 187 (5.7%) |
| Total | 19,156 (73.1%) | 2,044 (7.8%) |
Employment Occupations by Sex in Florin
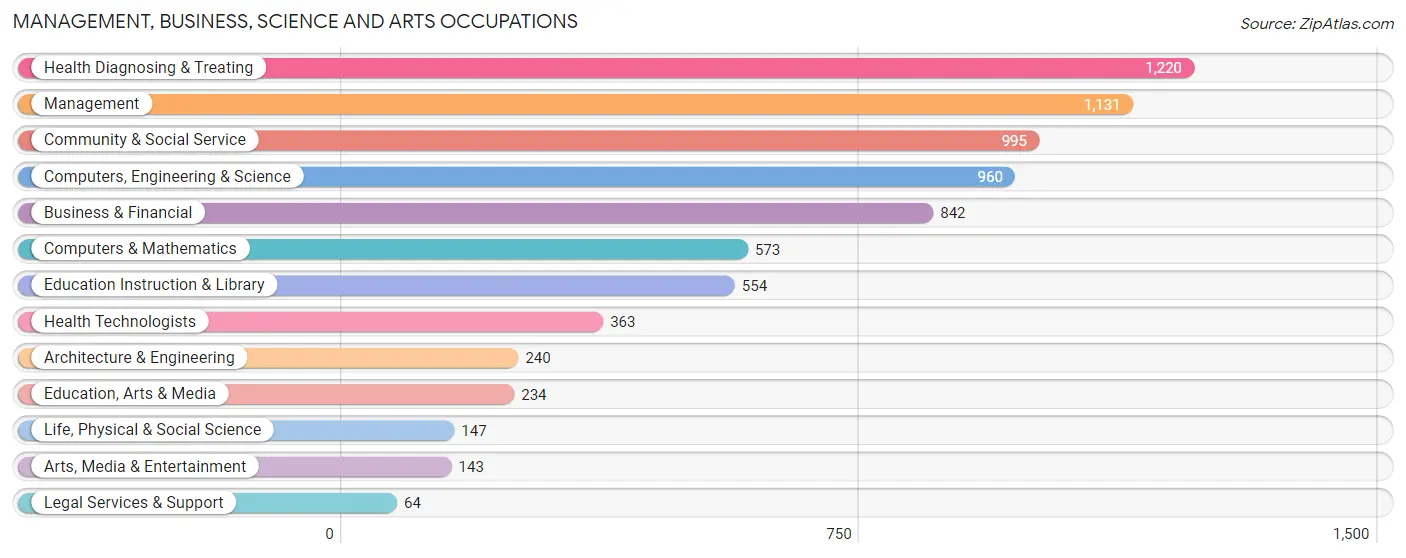
Management, Business, Science and Arts Occupations
The most common Management, Business, Science and Arts occupations in Florin are Health Diagnosing & Treating (1,220 | 5.7%), Management (1,131 | 5.3%), Community & Social Service (995 | 4.7%), Computers, Engineering & Science (960 | 4.5%), and Business & Financial (842 | 4.0%).
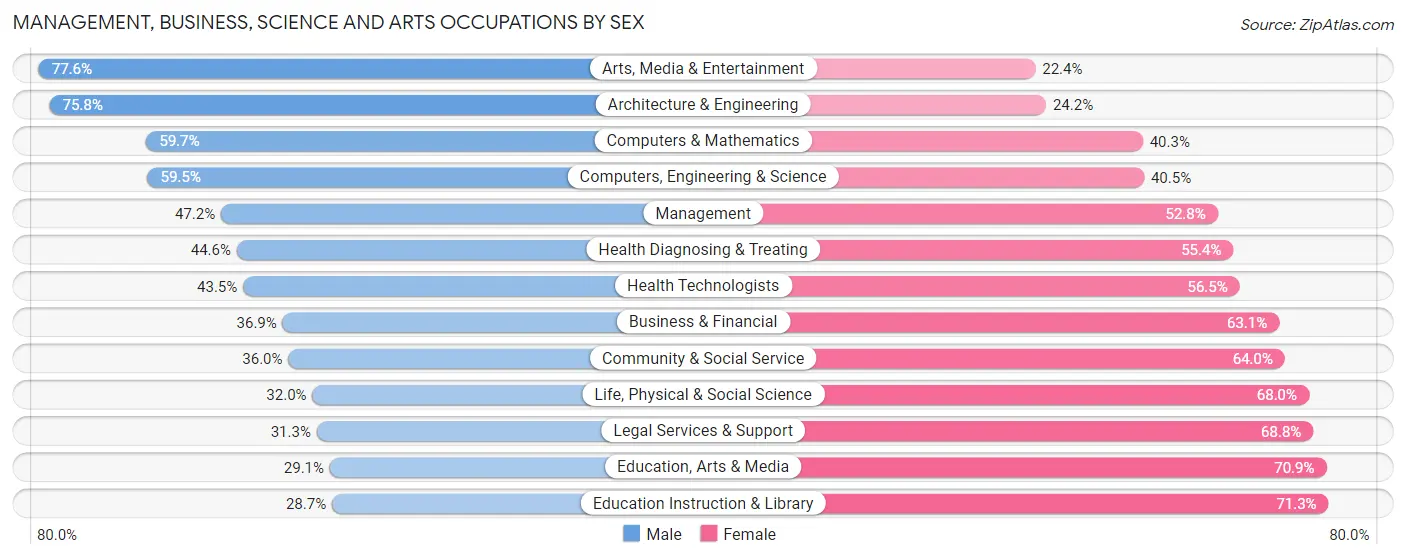
Management, Business, Science and Arts Occupations by Sex
Within the Management, Business, Science and Arts occupations in Florin, the most male-oriented occupations are Arts, Media & Entertainment (77.6%), Architecture & Engineering (75.8%), and Computers & Mathematics (59.7%), while the most female-oriented occupations are Education Instruction & Library (71.3%), Education, Arts & Media (70.9%), and Legal Services & Support (68.8%).
| Occupation | Male | Female |
| Management | 534 (47.2%) | 597 (52.8%) |
| Business & Financial | 311 (36.9%) | 531 (63.1%) |
| Computers, Engineering & Science | 571 (59.5%) | 389 (40.5%) |
| Computers & Mathematics | 342 (59.7%) | 231 (40.3%) |
| Architecture & Engineering | 182 (75.8%) | 58 (24.2%) |
| Life, Physical & Social Science | 47 (32.0%) | 100 (68.0%) |
| Community & Social Service | 358 (36.0%) | 637 (64.0%) |
| Education, Arts & Media | 68 (29.1%) | 166 (70.9%) |
| Legal Services & Support | 20 (31.2%) | 44 (68.8%) |
| Education Instruction & Library | 159 (28.7%) | 395 (71.3%) |
| Arts, Media & Entertainment | 111 (77.6%) | 32 (22.4%) |
| Health Diagnosing & Treating | 544 (44.6%) | 676 (55.4%) |
| Health Technologists | 158 (43.5%) | 205 (56.5%) |
| Total (Category) | 2,318 (45.0%) | 2,830 (55.0%) |
| Total (Overall) | 11,394 (53.4%) | 9,948 (46.6%) |
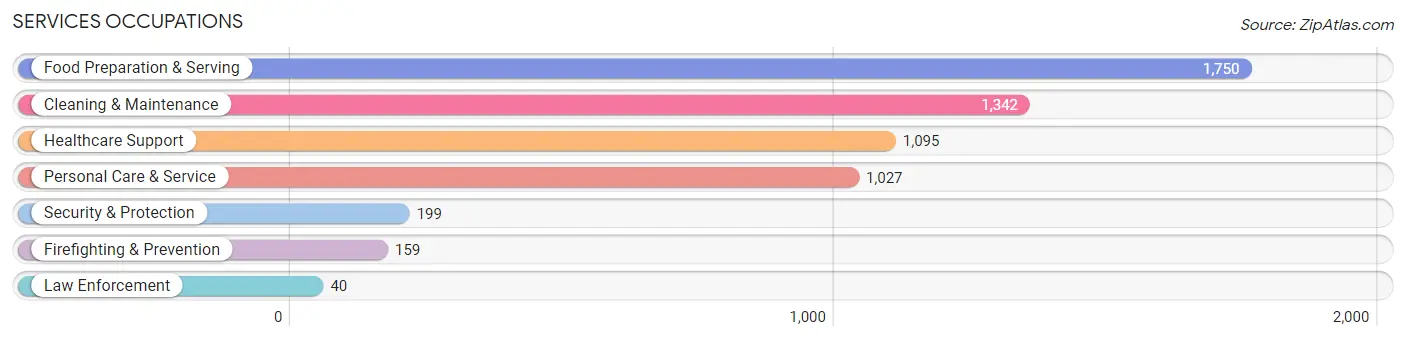
Services Occupations
The most common Services occupations in Florin are Food Preparation & Serving (1,750 | 8.2%), Cleaning & Maintenance (1,342 | 6.3%), Healthcare Support (1,095 | 5.1%), Personal Care & Service (1,027 | 4.8%), and Security & Protection (199 | 0.9%).
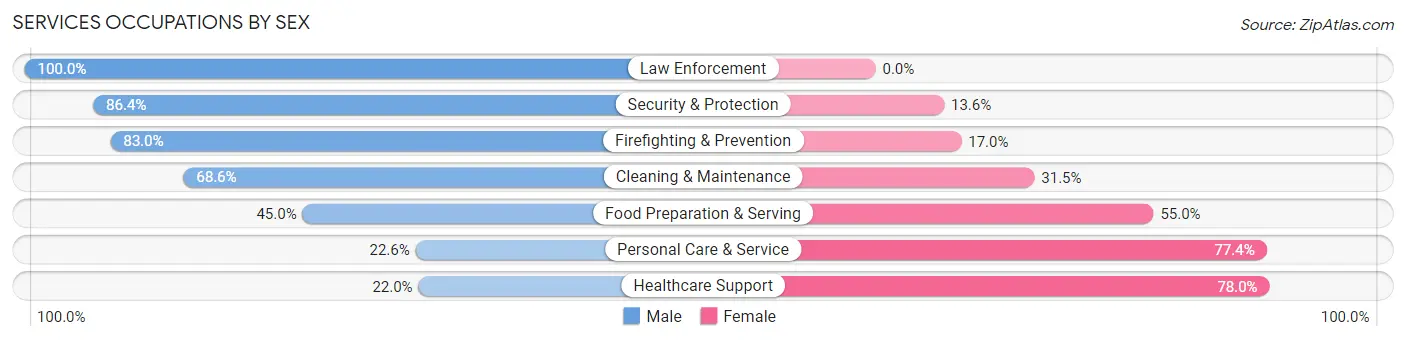
Services Occupations by Sex
Within the Services occupations in Florin, the most male-oriented occupations are Law Enforcement (100.0%), Security & Protection (86.4%), and Firefighting & Prevention (83.0%), while the most female-oriented occupations are Healthcare Support (78.0%), Personal Care & Service (77.4%), and Food Preparation & Serving (55.0%).
| Occupation | Male | Female |
| Healthcare Support | 241 (22.0%) | 854 (78.0%) |
| Security & Protection | 172 (86.4%) | 27 (13.6%) |
| Firefighting & Prevention | 132 (83.0%) | 27 (17.0%) |
| Law Enforcement | 40 (100.0%) | 0 (0.0%) |
| Food Preparation & Serving | 787 (45.0%) | 963 (55.0%) |
| Cleaning & Maintenance | 920 (68.5%) | 422 (31.5%) |
| Personal Care & Service | 232 (22.6%) | 795 (77.4%) |
| Total (Category) | 2,352 (43.4%) | 3,061 (56.6%) |
| Total (Overall) | 11,394 (53.4%) | 9,948 (46.6%) |
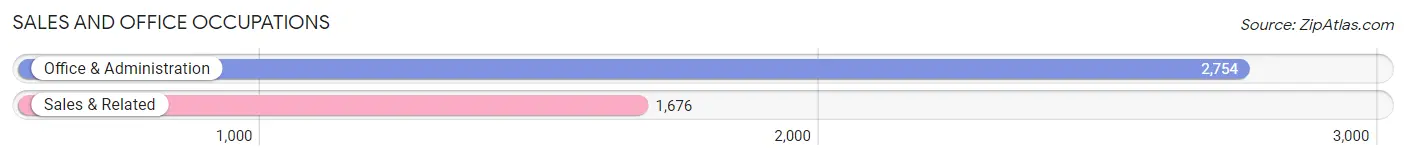
Sales and Office Occupations
The most common Sales and Office occupations in Florin are Office & Administration (2,754 | 12.9%), and Sales & Related (1,676 | 7.9%).
Sales and Office Occupations by Sex
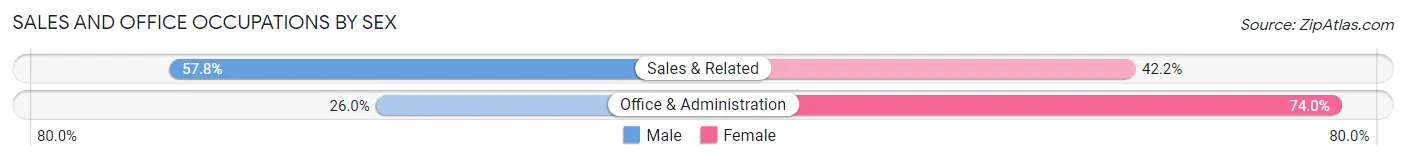
| Occupation | Male | Female |
| Sales & Related | 968 (57.8%) | 708 (42.2%) |
| Office & Administration | 716 (26.0%) | 2,038 (74.0%) |
| Total (Category) | 1,684 (38.0%) | 2,746 (62.0%) |
| Total (Overall) | 11,394 (53.4%) | 9,948 (46.6%) |
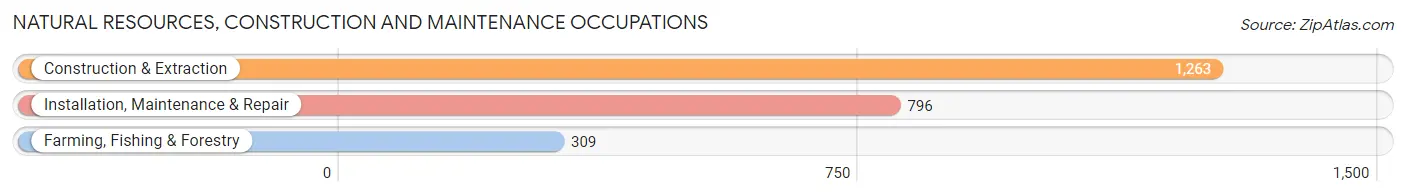
Natural Resources, Construction and Maintenance Occupations
The most common Natural Resources, Construction and Maintenance occupations in Florin are Construction & Extraction (1,263 | 5.9%), Installation, Maintenance & Repair (796 | 3.7%), and Farming, Fishing & Forestry (309 | 1.5%).
Natural Resources, Construction and Maintenance Occupations by Sex
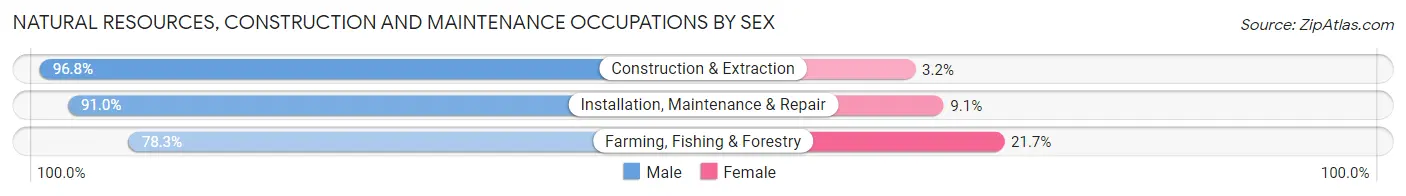
| Occupation | Male | Female |
| Farming, Fishing & Forestry | 242 (78.3%) | 67 (21.7%) |
| Construction & Extraction | 1,223 (96.8%) | 40 (3.2%) |
| Installation, Maintenance & Repair | 724 (90.9%) | 72 (9.0%) |
| Total (Category) | 2,189 (92.4%) | 179 (7.6%) |
| Total (Overall) | 11,394 (53.4%) | 9,948 (46.6%) |
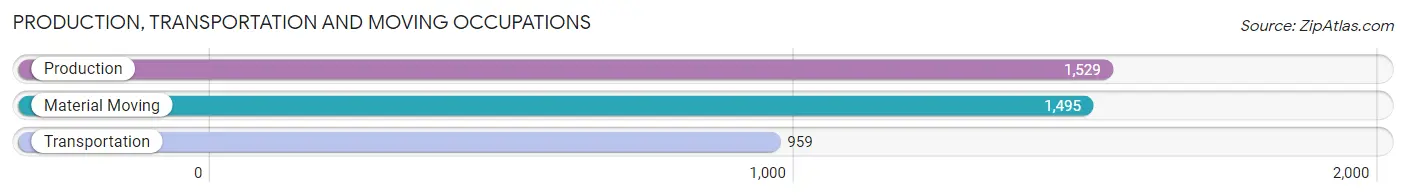
Production, Transportation and Moving Occupations
The most common Production, Transportation and Moving occupations in Florin are Production (1,529 | 7.2%), Material Moving (1,495 | 7.0%), and Transportation (959 | 4.5%).
Production, Transportation and Moving Occupations by Sex
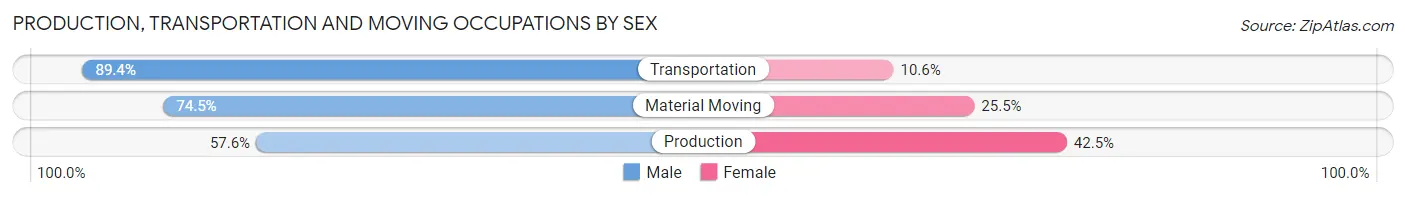
| Occupation | Male | Female |
| Production | 880 (57.6%) | 649 (42.4%) |
| Transportation | 857 (89.4%) | 102 (10.6%) |
| Material Moving | 1,114 (74.5%) | 381 (25.5%) |
| Total (Category) | 2,851 (71.6%) | 1,132 (28.4%) |
| Total (Overall) | 11,394 (53.4%) | 9,948 (46.6%) |
Employment Industries by Sex in Florin
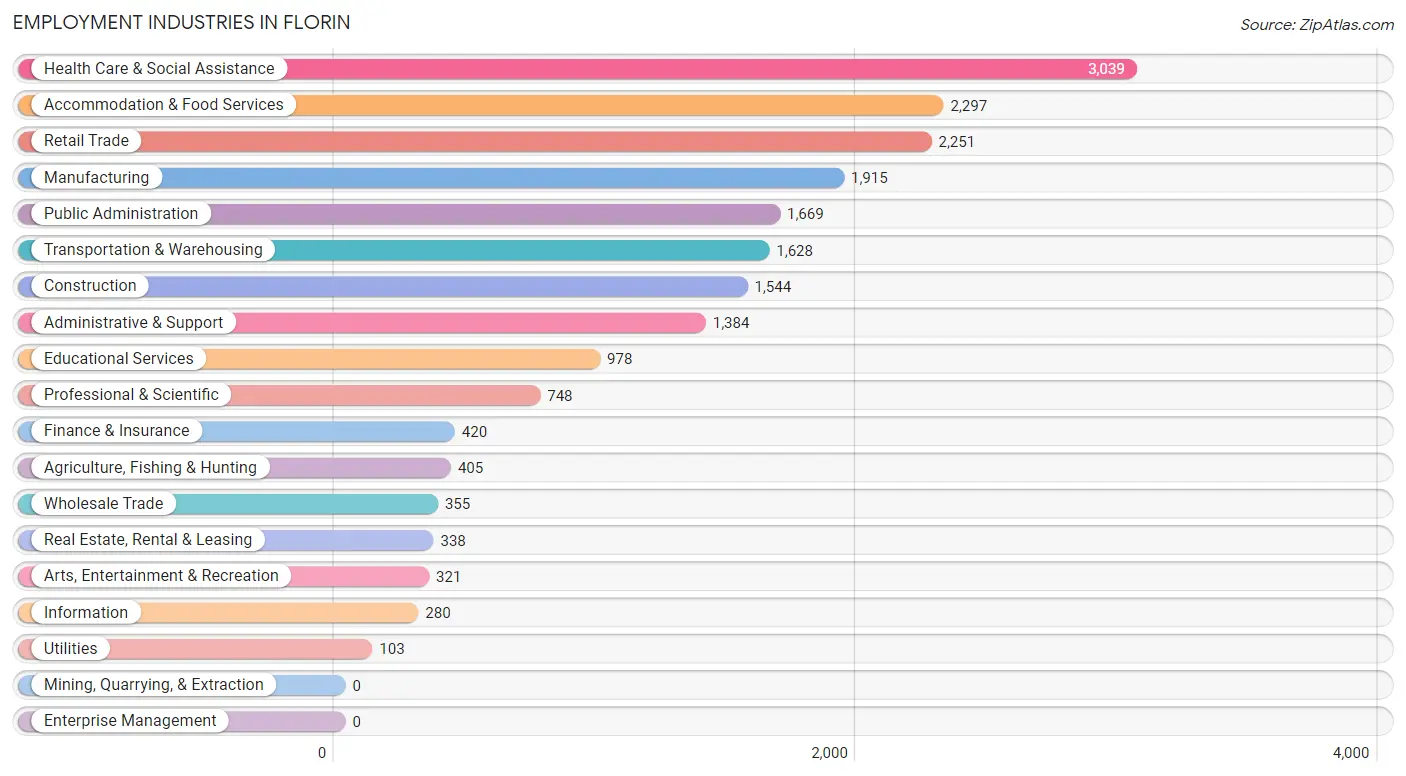
Employment Industries in Florin
The major employment industries in Florin include Health Care & Social Assistance (3,039 | 14.2%), Accommodation & Food Services (2,297 | 10.8%), Retail Trade (2,251 | 10.5%), Manufacturing (1,915 | 9.0%), and Public Administration (1,669 | 7.8%).
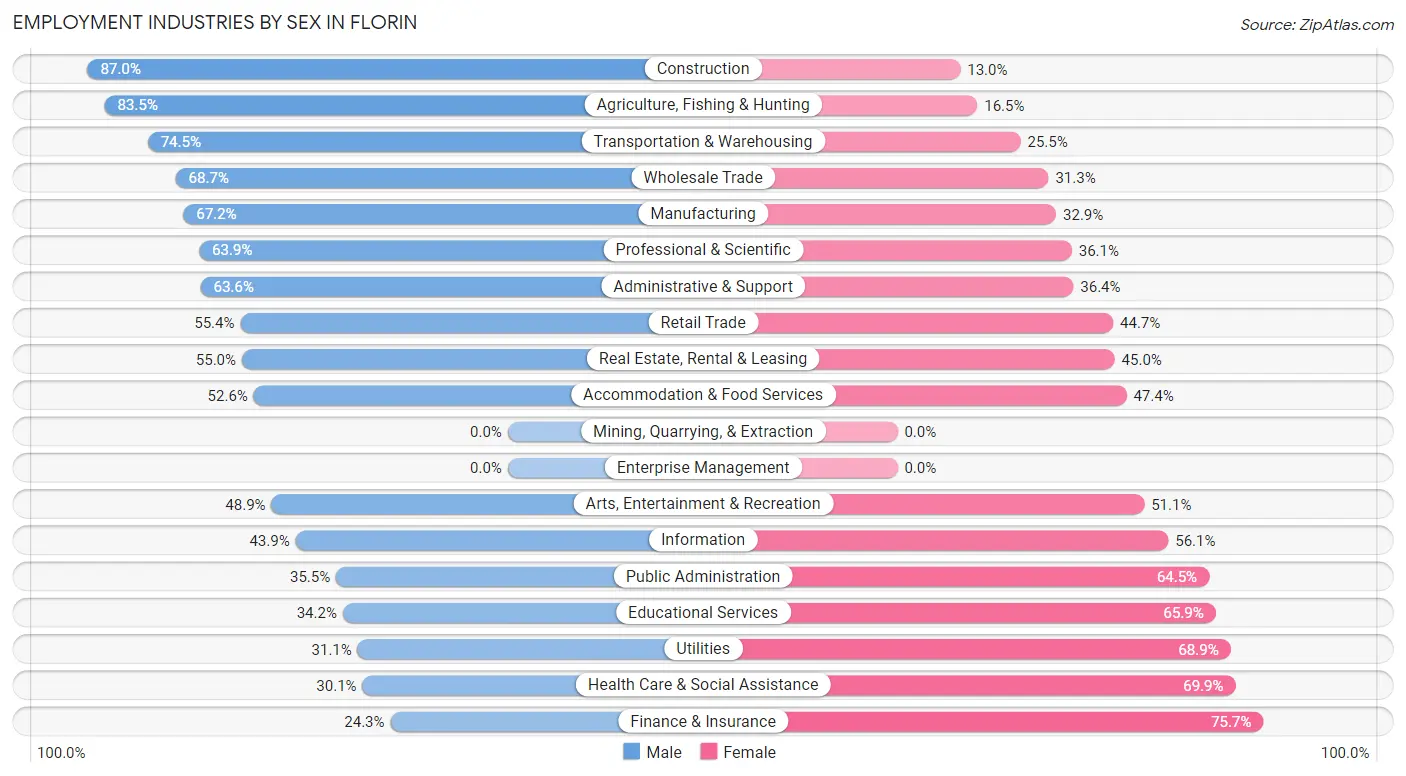
Employment Industries by Sex in Florin
The Florin industries that see more men than women are Construction (87.0%), Agriculture, Fishing & Hunting (83.5%), and Transportation & Warehousing (74.5%), whereas the industries that tend to have a higher number of women are Finance & Insurance (75.7%), Health Care & Social Assistance (69.9%), and Utilities (68.9%).
| Industry | Male | Female |
| Agriculture, Fishing & Hunting | 338 (83.5%) | 67 (16.5%) |
| Mining, Quarrying, & Extraction | 0 (0.0%) | 0 (0.0%) |
| Construction | 1,343 (87.0%) | 201 (13.0%) |
| Manufacturing | 1,286 (67.1%) | 629 (32.9%) |
| Wholesale Trade | 244 (68.7%) | 111 (31.3%) |
| Retail Trade | 1,246 (55.3%) | 1,005 (44.7%) |
| Transportation & Warehousing | 1,213 (74.5%) | 415 (25.5%) |
| Utilities | 32 (31.1%) | 71 (68.9%) |
| Information | 123 (43.9%) | 157 (56.1%) |
| Finance & Insurance | 102 (24.3%) | 318 (75.7%) |
| Real Estate, Rental & Leasing | 186 (55.0%) | 152 (45.0%) |
| Professional & Scientific | 478 (63.9%) | 270 (36.1%) |
| Enterprise Management | 0 (0.0%) | 0 (0.0%) |
| Administrative & Support | 880 (63.6%) | 504 (36.4%) |
| Educational Services | 334 (34.2%) | 644 (65.8%) |
| Health Care & Social Assistance | 914 (30.1%) | 2,125 (69.9%) |
| Arts, Entertainment & Recreation | 157 (48.9%) | 164 (51.1%) |
| Accommodation & Food Services | 1,208 (52.6%) | 1,089 (47.4%) |
| Public Administration | 593 (35.5%) | 1,076 (64.5%) |
| Total | 11,394 (53.4%) | 9,948 (46.6%) |
Education in Florin
School Enrollment in Florin
The most common levels of schooling among the 13,186 students in Florin are middle school (3,066 | 23.3%), college / undergraduate (3,028 | 23.0%), and high school (3,020 | 22.9%).
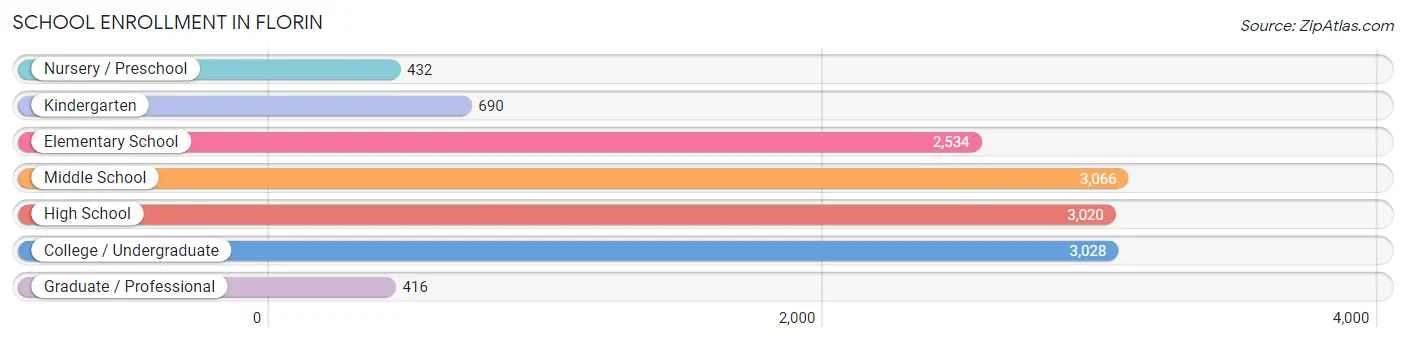
| School Level | # Students | % Students |
| Nursery / Preschool | 432 | 3.3% |
| Kindergarten | 690 | 5.2% |
| Elementary School | 2,534 | 19.2% |
| Middle School | 3,066 | 23.3% |
| High School | 3,020 | 22.9% |
| College / Undergraduate | 3,028 | 23.0% |
| Graduate / Professional | 416 | 3.2% |
| Total | 13,186 | 100.0% |
School Enrollment by Age by Funding Source in Florin
Out of a total of 13,186 students who are enrolled in schools in Florin, 672 (5.1%) attend a private institution, while the remaining 12,514 (94.9%) are enrolled in public schools. The age group of 3 to 4 year olds has the highest likelihood of being enrolled in private schools, with 80 (20.6% in the age bracket) enrolled. Conversely, the age group of 18 to 19 year olds has the lowest likelihood of being enrolled in a private school, with 921 (99.0% in the age bracket) attending a public institution.
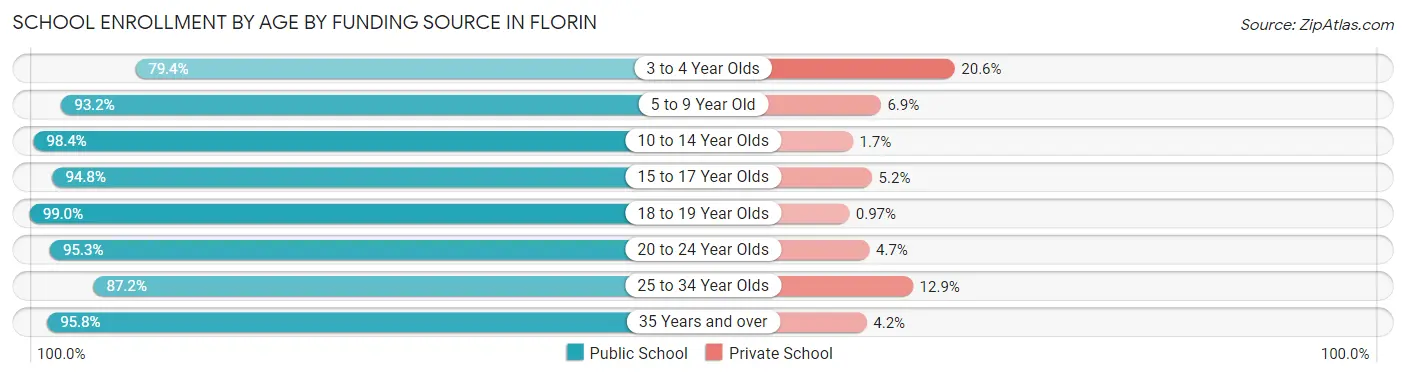
| Age Bracket | Public School | Private School |
| 3 to 4 Year Olds | 308 (79.4%) | 80 (20.6%) |
| 5 to 9 Year Old | 2,746 (93.1%) | 202 (6.9%) |
| 10 to 14 Year Olds | 3,818 (98.4%) | 64 (1.7%) |
| 15 to 17 Year Olds | 2,109 (94.8%) | 116 (5.2%) |
| 18 to 19 Year Olds | 921 (99.0%) | 9 (1.0%) |
| 20 to 24 Year Olds | 1,248 (95.3%) | 62 (4.7%) |
| 25 to 34 Year Olds | 814 (87.2%) | 120 (12.9%) |
| 35 Years and over | 545 (95.8%) | 24 (4.2%) |
| Total | 12,514 (94.9%) | 672 (5.1%) |
Educational Attainment by Field of Study in Florin
Business (1,065 | 23.3%), arts & humanities (490 | 10.7%), science & technology (436 | 9.5%), social sciences (378 | 8.3%), and engineering (377 | 8.2%) are the most common fields of study among 4,575 individuals in Florin who have obtained a bachelor's degree or higher.
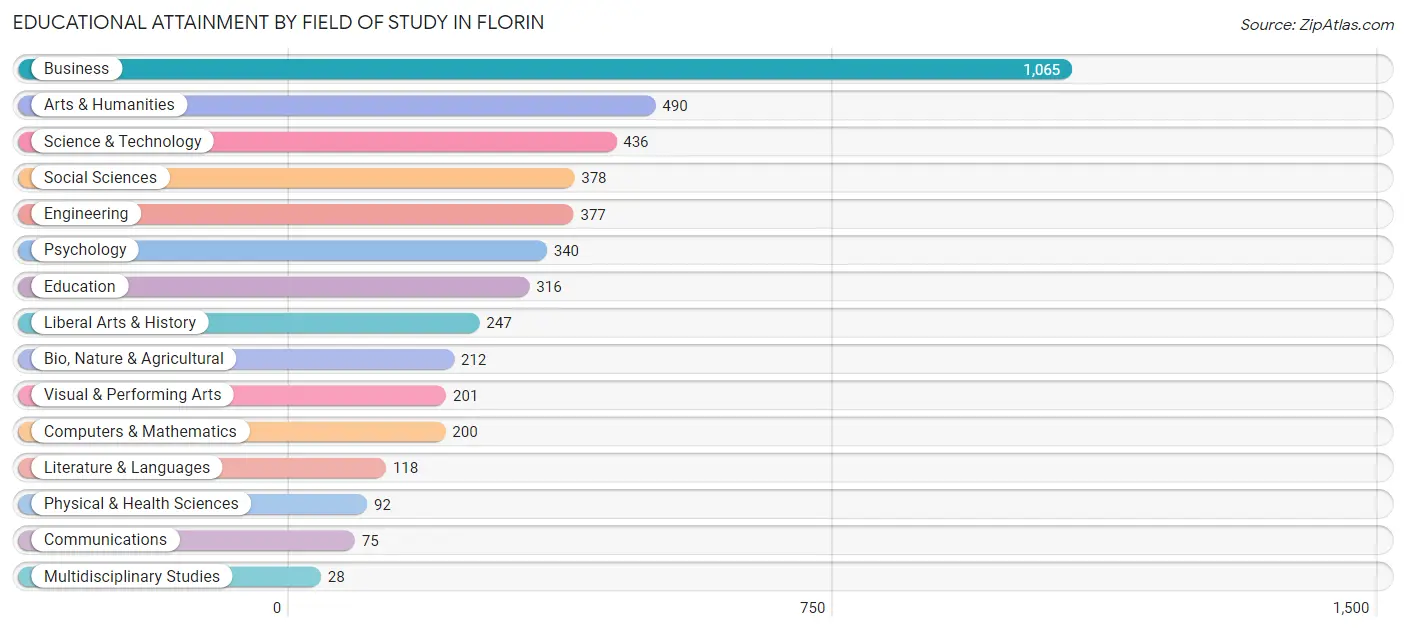
| Field of Study | # Graduates | % Graduates |
| Computers & Mathematics | 200 | 4.4% |
| Bio, Nature & Agricultural | 212 | 4.6% |
| Physical & Health Sciences | 92 | 2.0% |
| Psychology | 340 | 7.4% |
| Social Sciences | 378 | 8.3% |
| Engineering | 377 | 8.2% |
| Multidisciplinary Studies | 28 | 0.6% |
| Science & Technology | 436 | 9.5% |
| Business | 1,065 | 23.3% |
| Education | 316 | 6.9% |
| Literature & Languages | 118 | 2.6% |
| Liberal Arts & History | 247 | 5.4% |
| Visual & Performing Arts | 201 | 4.4% |
| Communications | 75 | 1.6% |
| Arts & Humanities | 490 | 10.7% |
| Total | 4,575 | 100.0% |
Transportation & Commute in Florin
Vehicle Availability by Sex in Florin
The most prevalent vehicle ownership categories in Florin are males with 2 vehicles (3,490, accounting for 31.1%) and females with 2 vehicles (3,202, making up 36.4%).
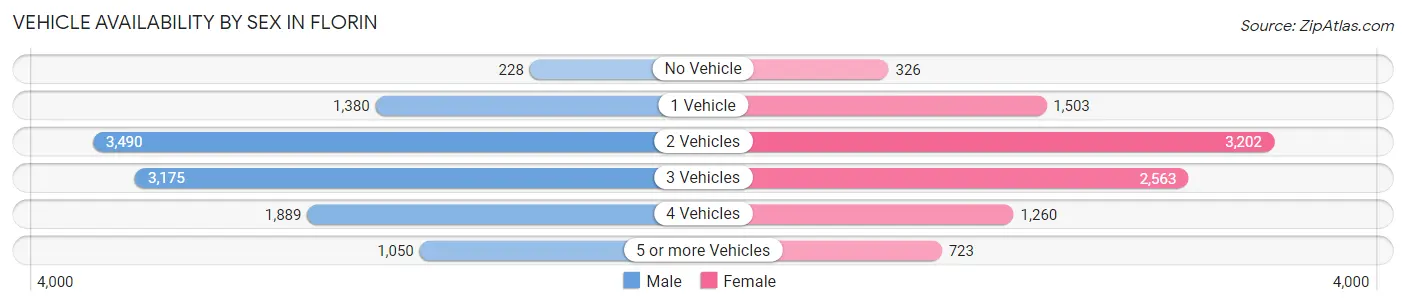
| Vehicles Available | Male | Female |
| No Vehicle | 228 (2.0%) | 326 (3.4%) |
| 1 Vehicle | 1,380 (12.3%) | 1,503 (15.7%) |
| 2 Vehicles | 3,490 (31.1%) | 3,202 (33.4%) |
| 3 Vehicles | 3,175 (28.3%) | 2,563 (26.8%) |
| 4 Vehicles | 1,889 (16.9%) | 1,260 (13.2%) |
| 5 or more Vehicles | 1,050 (9.4%) | 723 (7.5%) |
| Total | 11,212 (100.0%) | 9,577 (100.0%) |
Commute Time in Florin
The most frequently occuring commute durations in Florin are 30 to 34 minutes (3,481 commuters, 18.3%), 20 to 24 minutes (3,353 commuters, 17.6%), and 15 to 19 minutes (3,275 commuters, 17.2%).
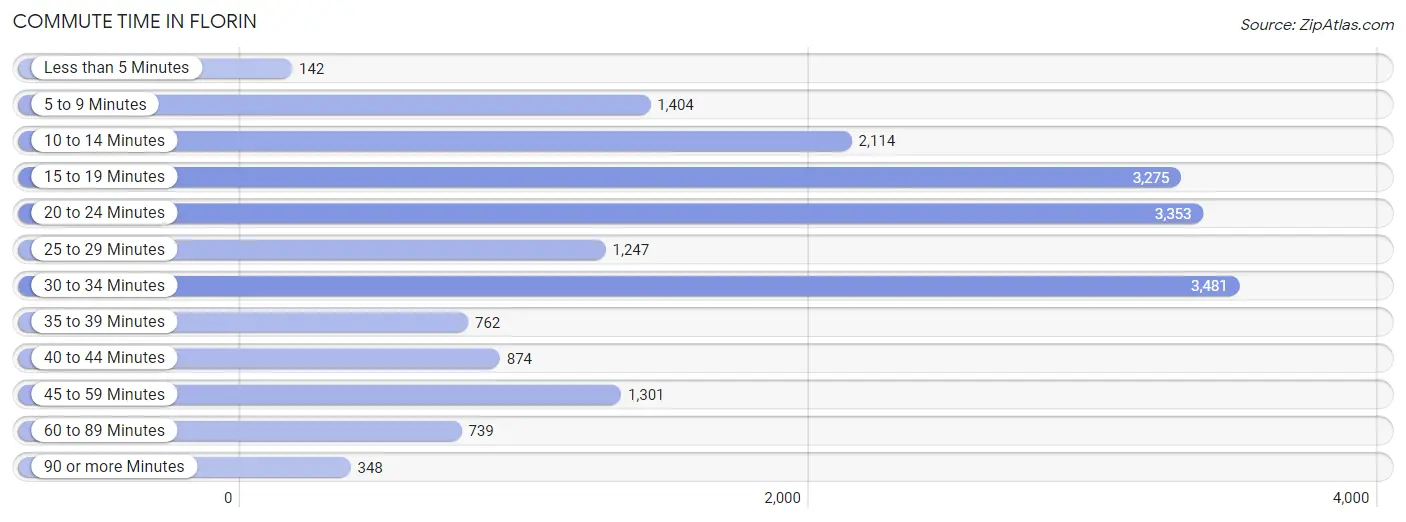
| Commute Time | # Commuters | % Commuters |
| Less than 5 Minutes | 142 | 0.7% |
| 5 to 9 Minutes | 1,404 | 7.4% |
| 10 to 14 Minutes | 2,114 | 11.1% |
| 15 to 19 Minutes | 3,275 | 17.2% |
| 20 to 24 Minutes | 3,353 | 17.6% |
| 25 to 29 Minutes | 1,247 | 6.6% |
| 30 to 34 Minutes | 3,481 | 18.3% |
| 35 to 39 Minutes | 762 | 4.0% |
| 40 to 44 Minutes | 874 | 4.6% |
| 45 to 59 Minutes | 1,301 | 6.8% |
| 60 to 89 Minutes | 739 | 3.9% |
| 90 or more Minutes | 348 | 1.8% |
Commute Time by Sex in Florin
The most common commute times in Florin are 15 to 19 minutes (2,004 commuters, 19.0%) for males and 20 to 24 minutes (1,828 commuters, 21.6%) for females.
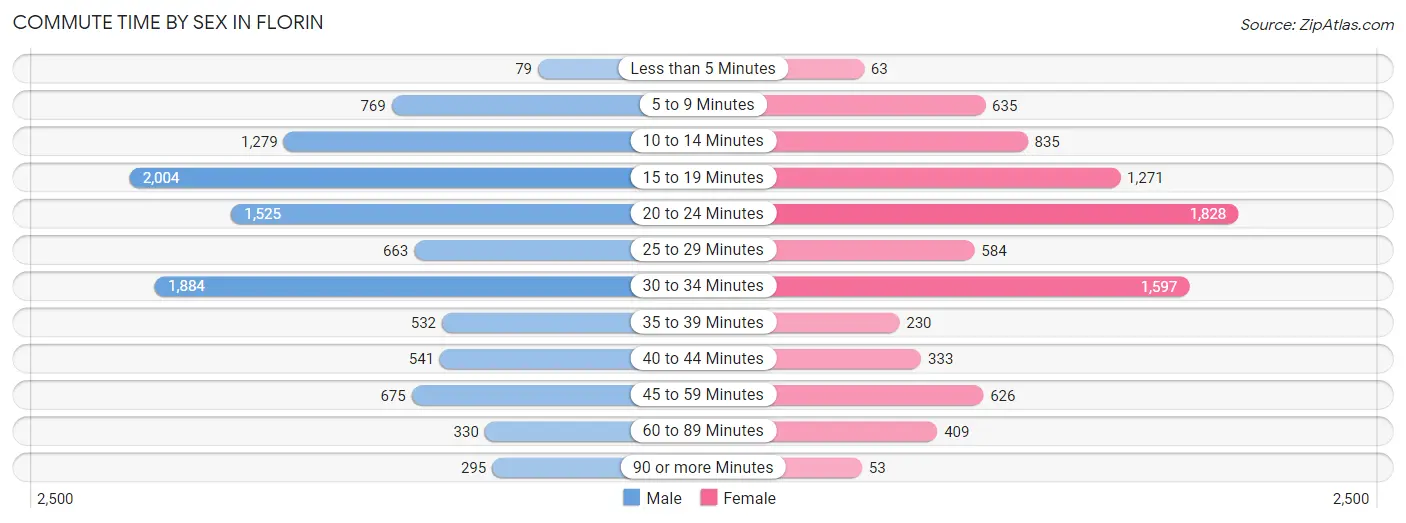
| Commute Time | Male | Female |
| Less than 5 Minutes | 79 (0.7%) | 63 (0.7%) |
| 5 to 9 Minutes | 769 (7.3%) | 635 (7.5%) |
| 10 to 14 Minutes | 1,279 (12.1%) | 835 (9.9%) |
| 15 to 19 Minutes | 2,004 (19.0%) | 1,271 (15.0%) |
| 20 to 24 Minutes | 1,525 (14.4%) | 1,828 (21.6%) |
| 25 to 29 Minutes | 663 (6.3%) | 584 (6.9%) |
| 30 to 34 Minutes | 1,884 (17.8%) | 1,597 (18.9%) |
| 35 to 39 Minutes | 532 (5.0%) | 230 (2.7%) |
| 40 to 44 Minutes | 541 (5.1%) | 333 (3.9%) |
| 45 to 59 Minutes | 675 (6.4%) | 626 (7.4%) |
| 60 to 89 Minutes | 330 (3.1%) | 409 (4.8%) |
| 90 or more Minutes | 295 (2.8%) | 53 (0.6%) |
Time of Departure to Work by Sex in Florin
The most frequent times of departure to work in Florin are 8:00 AM to 8:29 AM (1,381, 13.1%) for males and 7:00 AM to 7:29 AM (1,422, 16.8%) for females.
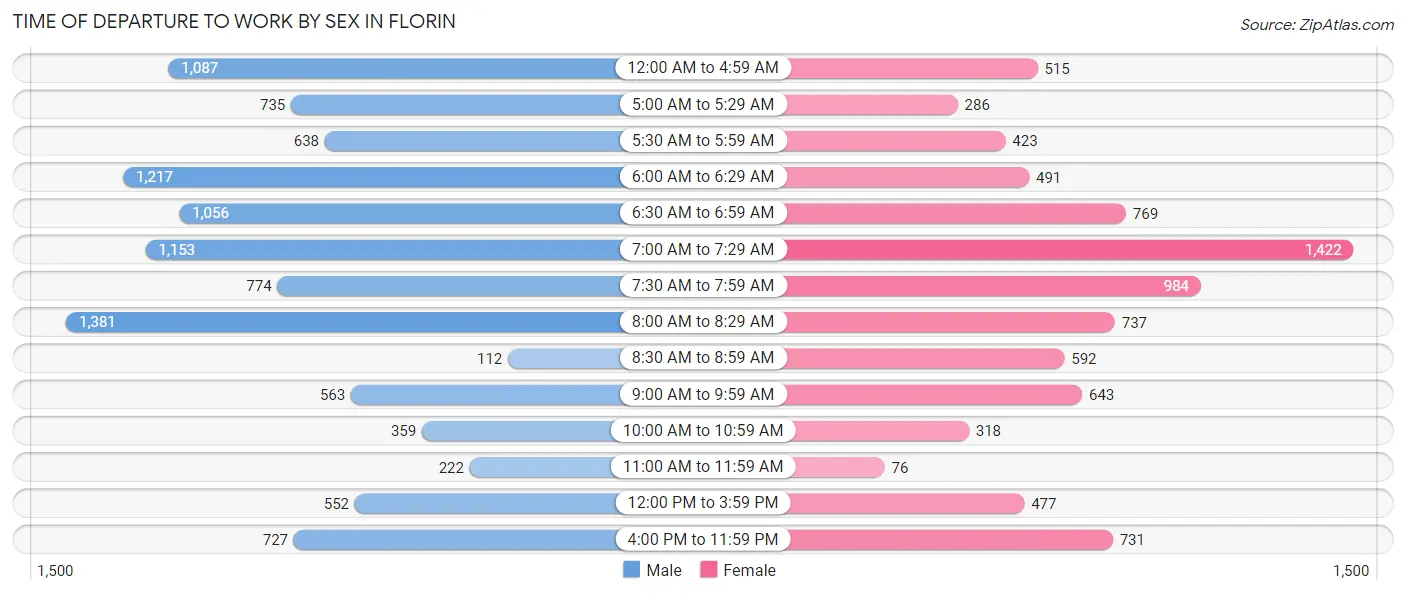
| Time of Departure | Male | Female |
| 12:00 AM to 4:59 AM | 1,087 (10.3%) | 515 (6.1%) |
| 5:00 AM to 5:29 AM | 735 (7.0%) | 286 (3.4%) |
| 5:30 AM to 5:59 AM | 638 (6.0%) | 423 (5.0%) |
| 6:00 AM to 6:29 AM | 1,217 (11.5%) | 491 (5.8%) |
| 6:30 AM to 6:59 AM | 1,056 (10.0%) | 769 (9.1%) |
| 7:00 AM to 7:29 AM | 1,153 (10.9%) | 1,422 (16.8%) |
| 7:30 AM to 7:59 AM | 774 (7.3%) | 984 (11.6%) |
| 8:00 AM to 8:29 AM | 1,381 (13.1%) | 737 (8.7%) |
| 8:30 AM to 8:59 AM | 112 (1.1%) | 592 (7.0%) |
| 9:00 AM to 9:59 AM | 563 (5.3%) | 643 (7.6%) |
| 10:00 AM to 10:59 AM | 359 (3.4%) | 318 (3.8%) |
| 11:00 AM to 11:59 AM | 222 (2.1%) | 76 (0.9%) |
| 12:00 PM to 3:59 PM | 552 (5.2%) | 477 (5.6%) |
| 4:00 PM to 11:59 PM | 727 (6.9%) | 731 (8.6%) |
| Total | 10,576 (100.0%) | 8,464 (100.0%) |
Housing Occupancy in Florin
Occupancy by Ownership in Florin
Of the total 15,168 dwellings in Florin, owner-occupied units account for 8,636 (56.9%), while renter-occupied units make up 6,532 (43.1%).
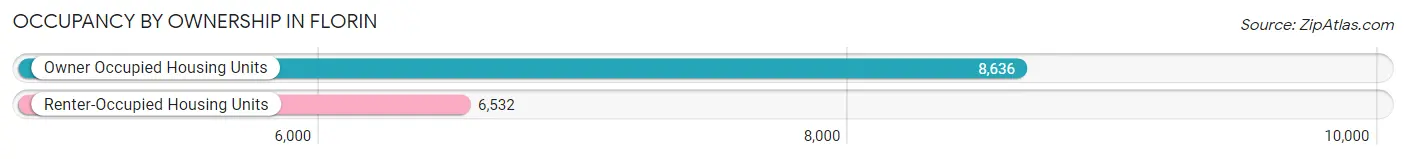
| Occupancy | # Housing Units | % Housing Units |
| Owner Occupied Housing Units | 8,636 | 56.9% |
| Renter-Occupied Housing Units | 6,532 | 43.1% |
| Total Occupied Housing Units | 15,168 | 100.0% |
Occupancy by Household Size in Florin
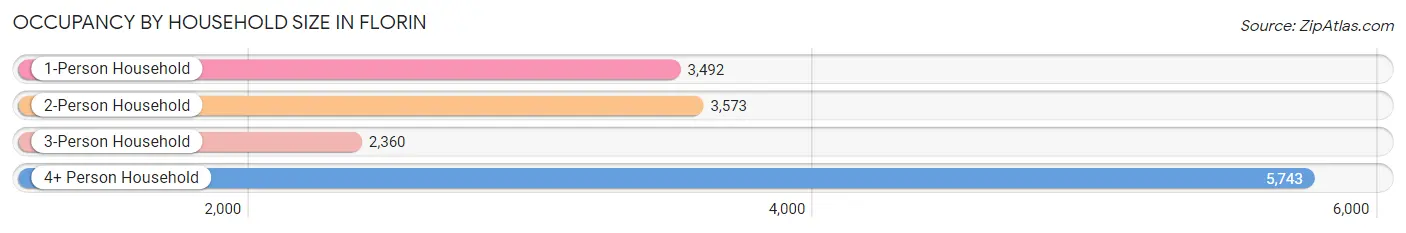
| Household Size | # Housing Units | % Housing Units |
| 1-Person Household | 3,492 | 23.0% |
| 2-Person Household | 3,573 | 23.6% |
| 3-Person Household | 2,360 | 15.6% |
| 4+ Person Household | 5,743 | 37.9% |
| Total Housing Units | 15,168 | 100.0% |
Occupancy by Ownership by Household Size in Florin
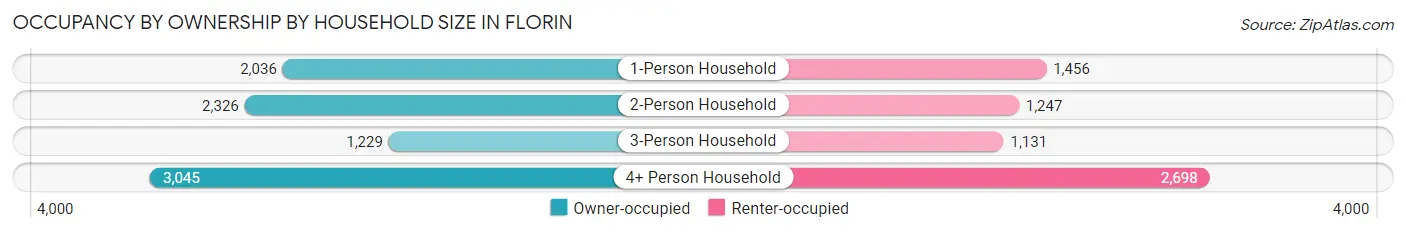
| Household Size | Owner-occupied | Renter-occupied |
| 1-Person Household | 2,036 (58.3%) | 1,456 (41.7%) |
| 2-Person Household | 2,326 (65.1%) | 1,247 (34.9%) |
| 3-Person Household | 1,229 (52.1%) | 1,131 (47.9%) |
| 4+ Person Household | 3,045 (53.0%) | 2,698 (47.0%) |
| Total Housing Units | 8,636 (56.9%) | 6,532 (43.1%) |
Occupancy by Educational Attainment in Florin
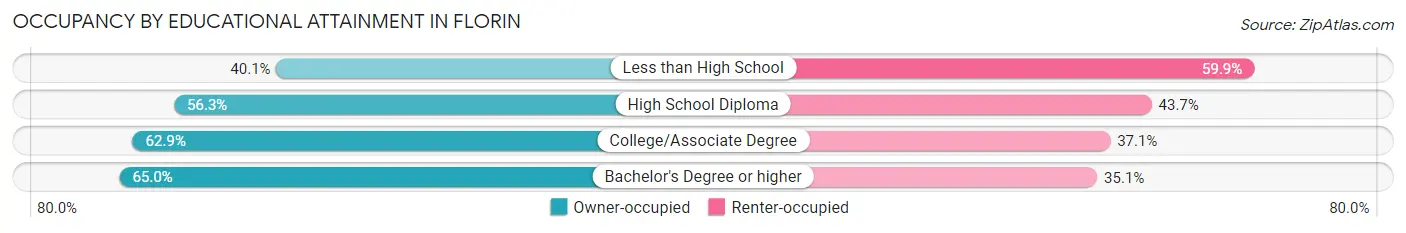
| Household Size | Owner-occupied | Renter-occupied |
| Less than High School | 1,221 (40.1%) | 1,827 (59.9%) |
| High School Diploma | 2,164 (56.3%) | 1,679 (43.7%) |
| College/Associate Degree | 3,798 (62.9%) | 2,242 (37.1%) |
| Bachelor's Degree or higher | 1,453 (64.9%) | 784 (35.0%) |
Occupancy by Age of Householder in Florin
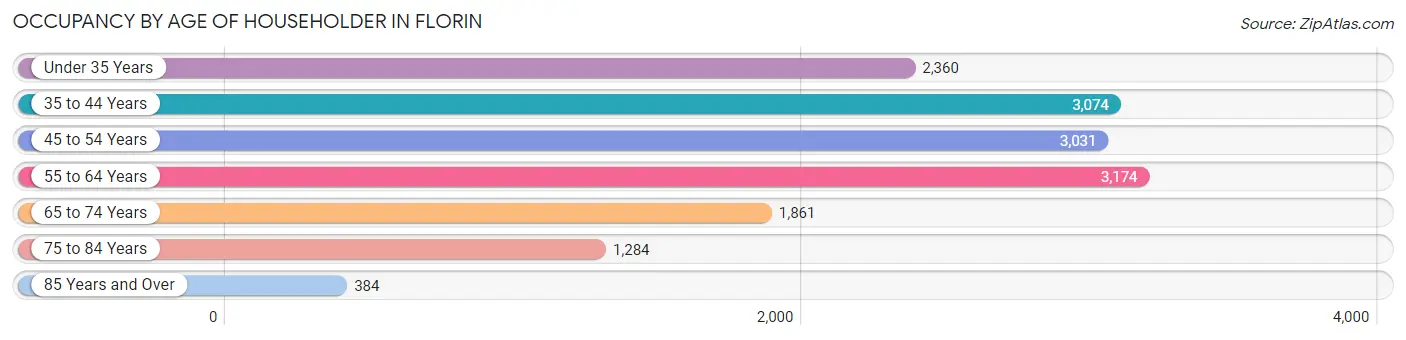
| Age Bracket | # Households | % Households |
| Under 35 Years | 2,360 | 15.6% |
| 35 to 44 Years | 3,074 | 20.3% |
| 45 to 54 Years | 3,031 | 20.0% |
| 55 to 64 Years | 3,174 | 20.9% |
| 65 to 74 Years | 1,861 | 12.3% |
| 75 to 84 Years | 1,284 | 8.5% |
| 85 Years and Over | 384 | 2.5% |
| Total | 15,168 | 100.0% |
Housing Finances in Florin
Median Income by Occupancy in Florin
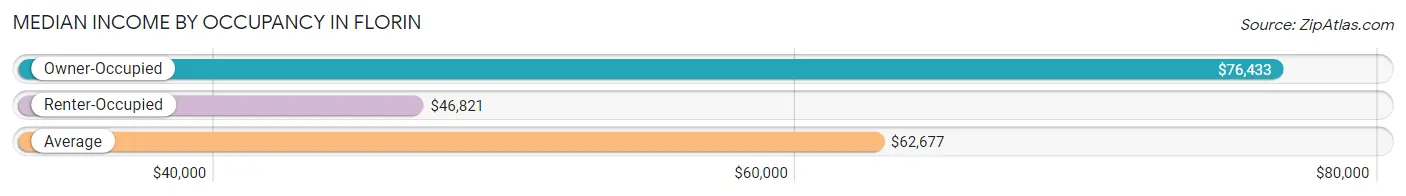
| Occupancy Type | # Households | Median Income |
| Owner-Occupied | 8,636 (56.9%) | $76,433 |
| Renter-Occupied | 6,532 (43.1%) | $46,821 |
| Average | 15,168 (100.0%) | $62,677 |
Occupancy by Householder Income Bracket in Florin
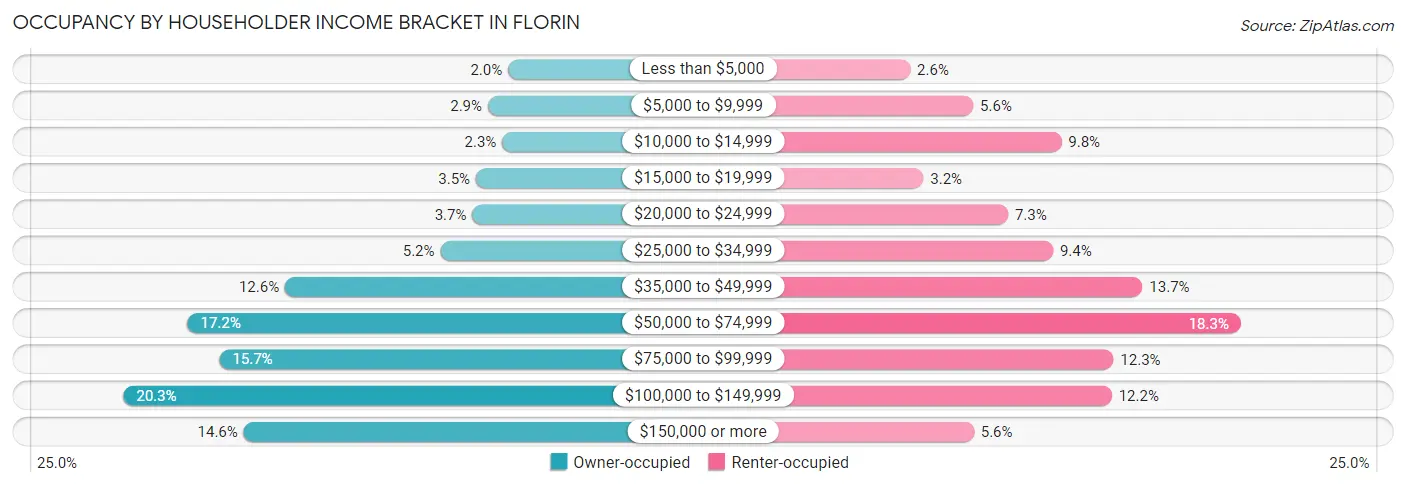
| Income Bracket | Owner-occupied | Renter-occupied |
| Less than $5,000 | 171 (2.0%) | 170 (2.6%) |
| $5,000 to $9,999 | 254 (2.9%) | 366 (5.6%) |
| $10,000 to $14,999 | 195 (2.3%) | 640 (9.8%) |
| $15,000 to $19,999 | 303 (3.5%) | 211 (3.2%) |
| $20,000 to $24,999 | 318 (3.7%) | 474 (7.3%) |
| $25,000 to $34,999 | 449 (5.2%) | 614 (9.4%) |
| $35,000 to $49,999 | 1,088 (12.6%) | 892 (13.7%) |
| $50,000 to $74,999 | 1,489 (17.2%) | 1,198 (18.3%) |
| $75,000 to $99,999 | 1,358 (15.7%) | 802 (12.3%) |
| $100,000 to $149,999 | 1,753 (20.3%) | 797 (12.2%) |
| $150,000 or more | 1,258 (14.6%) | 368 (5.6%) |
| Total | 8,636 (100.0%) | 6,532 (100.0%) |
Monthly Housing Cost Tiers in Florin
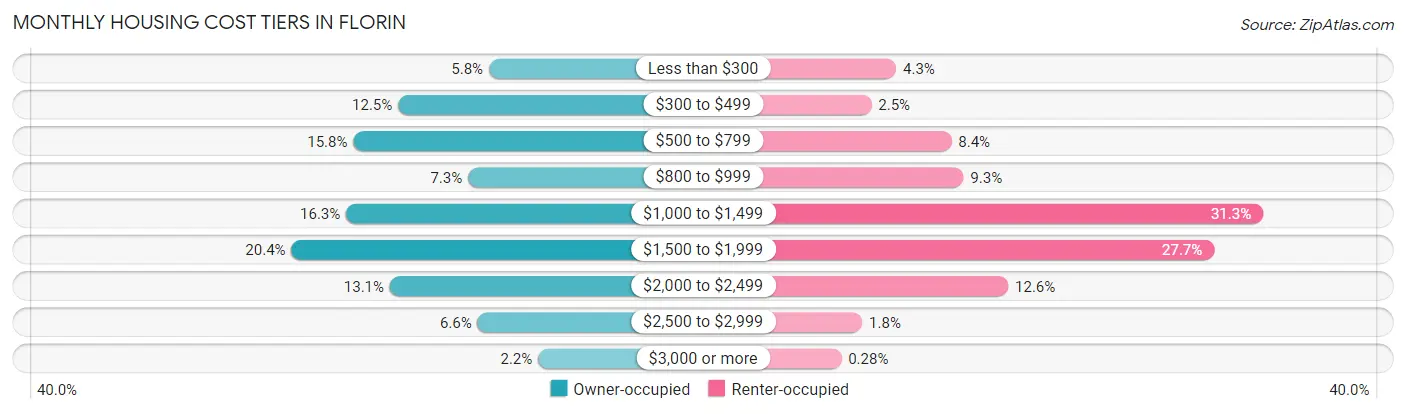
| Monthly Cost | Owner-occupied | Renter-occupied |
| Less than $300 | 501 (5.8%) | 282 (4.3%) |
| $300 to $499 | 1,079 (12.5%) | 163 (2.5%) |
| $500 to $799 | 1,364 (15.8%) | 548 (8.4%) |
| $800 to $999 | 634 (7.3%) | 606 (9.3%) |
| $1,000 to $1,499 | 1,409 (16.3%) | 2,047 (31.3%) |
| $1,500 to $1,999 | 1,757 (20.3%) | 1,812 (27.7%) |
| $2,000 to $2,499 | 1,131 (13.1%) | 821 (12.6%) |
| $2,500 to $2,999 | 573 (6.6%) | 119 (1.8%) |
| $3,000 or more | 188 (2.2%) | 18 (0.3%) |
| Total | 8,636 (100.0%) | 6,532 (100.0%) |
Physical Housing Characteristics in Florin
Housing Structures in Florin
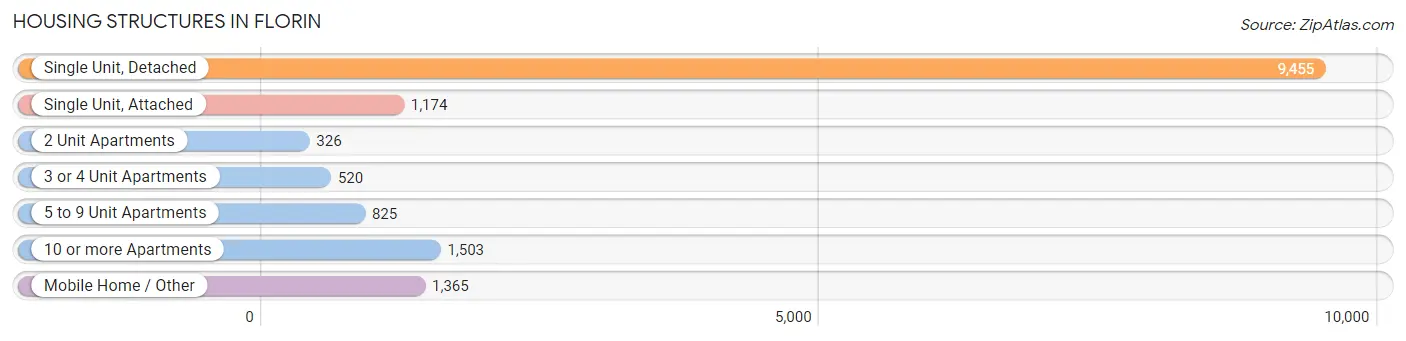
| Structure Type | # Housing Units | % Housing Units |
| Single Unit, Detached | 9,455 | 62.3% |
| Single Unit, Attached | 1,174 | 7.7% |
| 2 Unit Apartments | 326 | 2.1% |
| 3 or 4 Unit Apartments | 520 | 3.4% |
| 5 to 9 Unit Apartments | 825 | 5.4% |
| 10 or more Apartments | 1,503 | 9.9% |
| Mobile Home / Other | 1,365 | 9.0% |
| Total | 15,168 | 100.0% |
Housing Structures by Occupancy in Florin
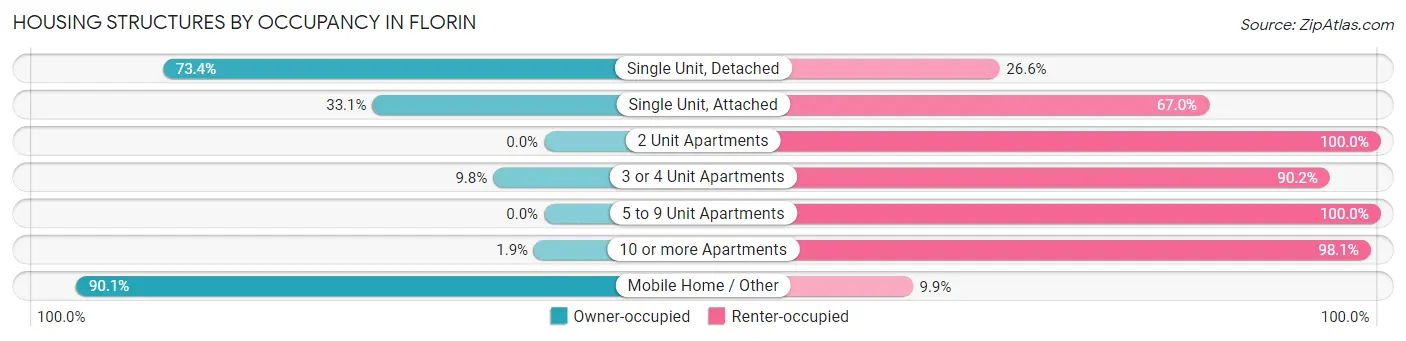
| Structure Type | Owner-occupied | Renter-occupied |
| Single Unit, Detached | 6,938 (73.4%) | 2,517 (26.6%) |
| Single Unit, Attached | 388 (33.1%) | 786 (66.9%) |
| 2 Unit Apartments | 0 (0.0%) | 326 (100.0%) |
| 3 or 4 Unit Apartments | 51 (9.8%) | 469 (90.2%) |
| 5 to 9 Unit Apartments | 0 (0.0%) | 825 (100.0%) |
| 10 or more Apartments | 29 (1.9%) | 1,474 (98.1%) |
| Mobile Home / Other | 1,230 (90.1%) | 135 (9.9%) |
| Total | 8,636 (56.9%) | 6,532 (43.1%) |
Housing Structures by Number of Rooms in Florin
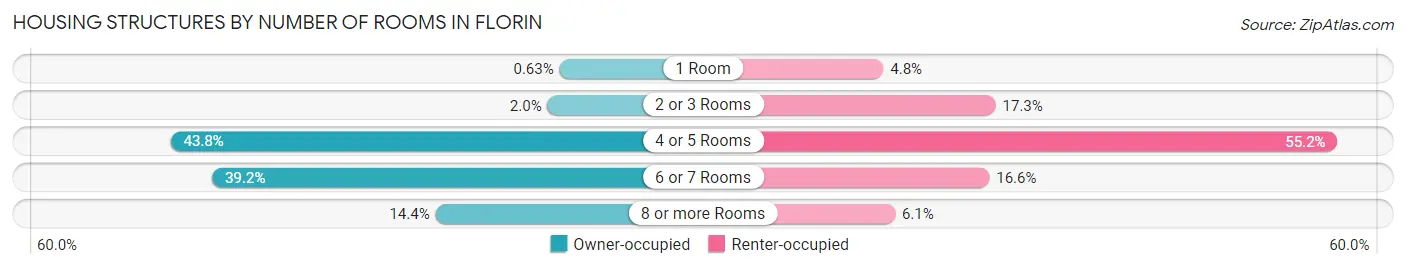
| Number of Rooms | Owner-occupied | Renter-occupied |
| 1 Room | 54 (0.6%) | 315 (4.8%) |
| 2 or 3 Rooms | 170 (2.0%) | 1,129 (17.3%) |
| 4 or 5 Rooms | 3,783 (43.8%) | 3,606 (55.2%) |
| 6 or 7 Rooms | 3,385 (39.2%) | 1,083 (16.6%) |
| 8 or more Rooms | 1,244 (14.4%) | 399 (6.1%) |
| Total | 8,636 (100.0%) | 6,532 (100.0%) |
Housing Structure by Heating Type in Florin
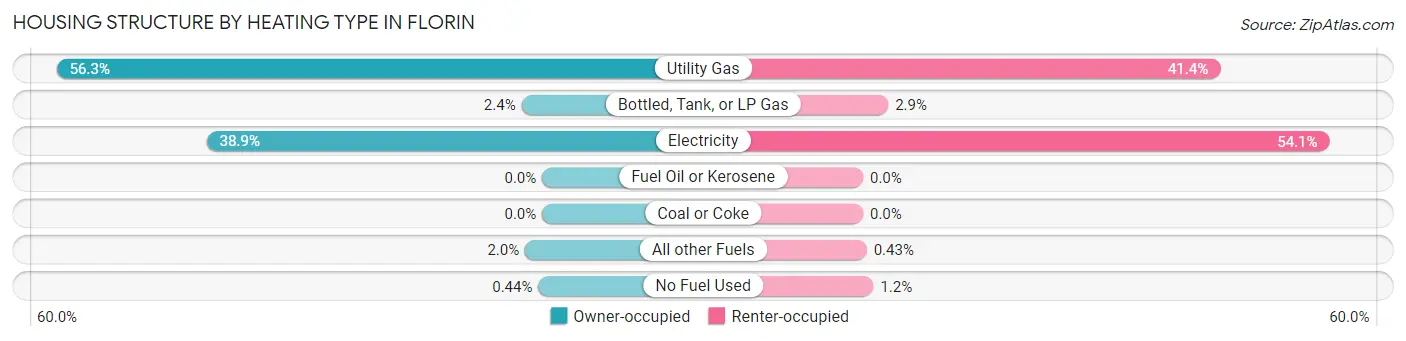
| Heating Type | Owner-occupied | Renter-occupied |
| Utility Gas | 4,862 (56.3%) | 2,703 (41.4%) |
| Bottled, Tank, or LP Gas | 206 (2.4%) | 191 (2.9%) |
| Electricity | 3,359 (38.9%) | 3,531 (54.1%) |
| Fuel Oil or Kerosene | 0 (0.0%) | 0 (0.0%) |
| Coal or Coke | 0 (0.0%) | 0 (0.0%) |
| All other Fuels | 171 (2.0%) | 28 (0.4%) |
| No Fuel Used | 38 (0.4%) | 79 (1.2%) |
| Total | 8,636 (100.0%) | 6,532 (100.0%) |
Household Vehicle Usage in Florin
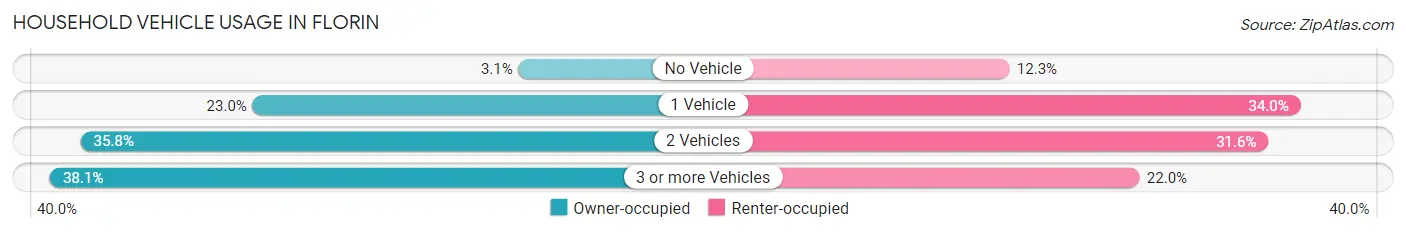
| Vehicles per Household | Owner-occupied | Renter-occupied |
| No Vehicle | 269 (3.1%) | 805 (12.3%) |
| 1 Vehicle | 1,984 (23.0%) | 2,223 (34.0%) |
| 2 Vehicles | 3,093 (35.8%) | 2,065 (31.6%) |
| 3 or more Vehicles | 3,290 (38.1%) | 1,439 (22.0%) |
| Total | 8,636 (100.0%) | 6,532 (100.0%) |
Real Estate & Mortgages in Florin
Real Estate and Mortgage Overview in Florin
| Characteristic | Without Mortgage | With Mortgage |
| Housing Units | 3,498 | 5,138 |
| Median Property Value | $296,300 | $360,400 |
| Median Household Income | $62,143 | $862 |
| Monthly Housing Costs | $541 | $155 |
| Real Estate Taxes | $1,659 | $212 |
Property Value by Mortgage Status in Florin
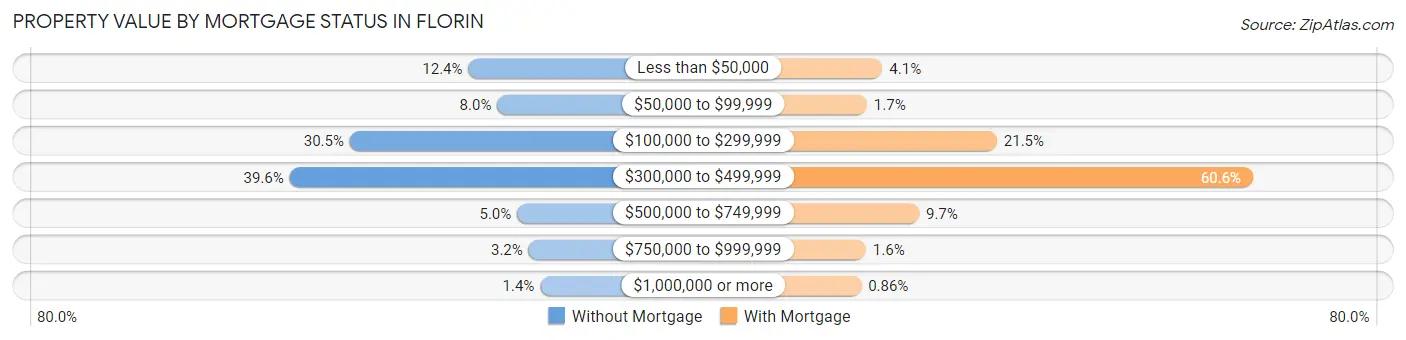
| Property Value | Without Mortgage | With Mortgage |
| Less than $50,000 | 433 (12.4%) | 210 (4.1%) |
| $50,000 to $99,999 | 279 (8.0%) | 89 (1.7%) |
| $100,000 to $299,999 | 1,065 (30.4%) | 1,106 (21.5%) |
| $300,000 to $499,999 | 1,386 (39.6%) | 3,111 (60.6%) |
| $500,000 to $749,999 | 173 (5.0%) | 497 (9.7%) |
| $750,000 to $999,999 | 112 (3.2%) | 81 (1.6%) |
| $1,000,000 or more | 50 (1.4%) | 44 (0.9%) |
| Total | 3,498 (100.0%) | 5,138 (100.0%) |
Household Income by Mortgage Status in Florin
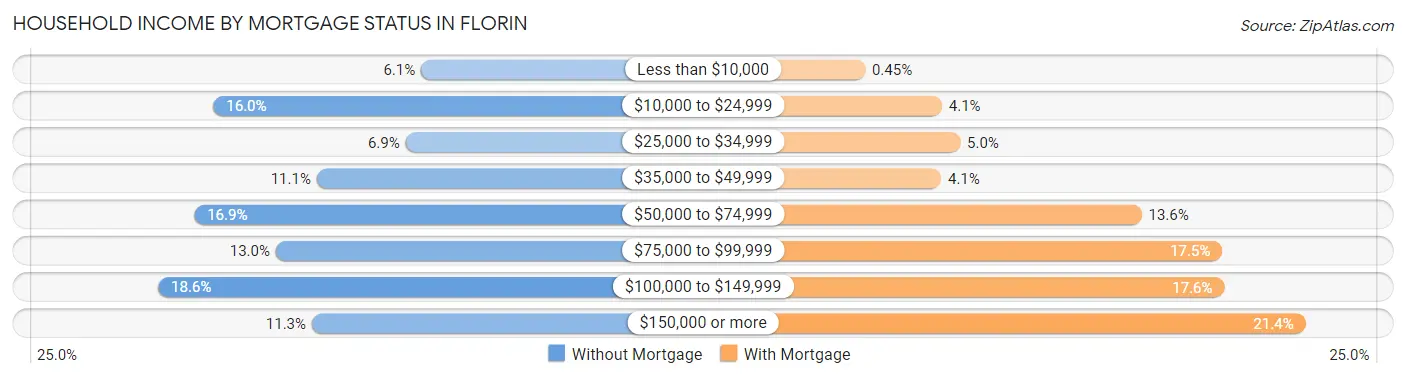
| Household Income | Without Mortgage | With Mortgage |
| Less than $10,000 | 214 (6.1%) | 23 (0.4%) |
| $10,000 to $24,999 | 560 (16.0%) | 211 (4.1%) |
| $25,000 to $34,999 | 240 (6.9%) | 256 (5.0%) |
| $35,000 to $49,999 | 388 (11.1%) | 209 (4.1%) |
| $50,000 to $74,999 | 592 (16.9%) | 700 (13.6%) |
| $75,000 to $99,999 | 456 (13.0%) | 897 (17.5%) |
| $100,000 to $149,999 | 652 (18.6%) | 902 (17.6%) |
| $150,000 or more | 396 (11.3%) | 1,101 (21.4%) |
| Total | 3,498 (100.0%) | 5,138 (100.0%) |
Property Value to Household Income Ratio in Florin
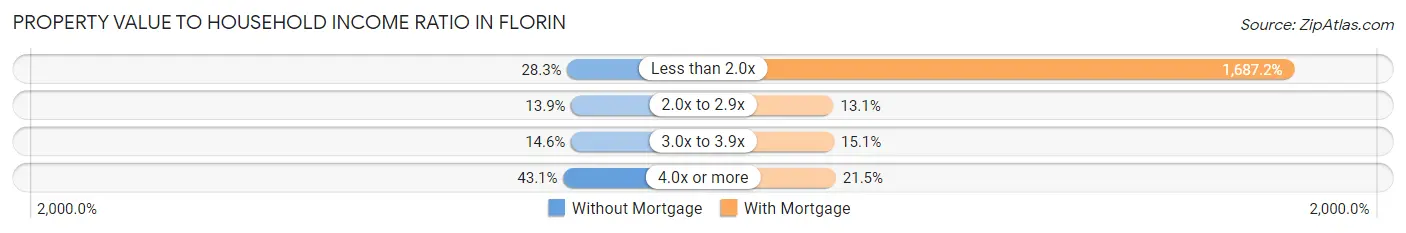
| Value-to-Income Ratio | Without Mortgage | With Mortgage |
| Less than 2.0x | 990 (28.3%) | 86,688 (1,687.2%) |
| 2.0x to 2.9x | 486 (13.9%) | 672 (13.1%) |
| 3.0x to 3.9x | 509 (14.5%) | 777 (15.1%) |
| 4.0x or more | 1,506 (43.0%) | 1,105 (21.5%) |
| Total | 3,498 (100.0%) | 5,138 (100.0%) |
Real Estate Taxes by Mortgage Status in Florin
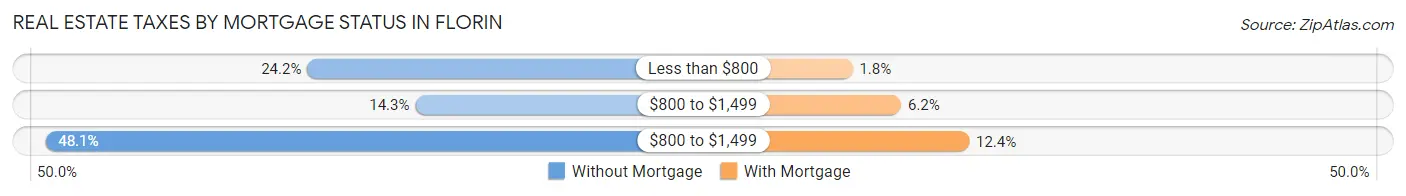
| Property Taxes | Without Mortgage | With Mortgage |
| Less than $800 | 846 (24.2%) | 91 (1.8%) |
| $800 to $1,499 | 501 (14.3%) | 319 (6.2%) |
| $800 to $1,499 | 1,683 (48.1%) | 638 (12.4%) |
| Total | 3,498 (100.0%) | 5,138 (100.0%) |
Health & Disability in Florin
Health Insurance Coverage by Age in Florin
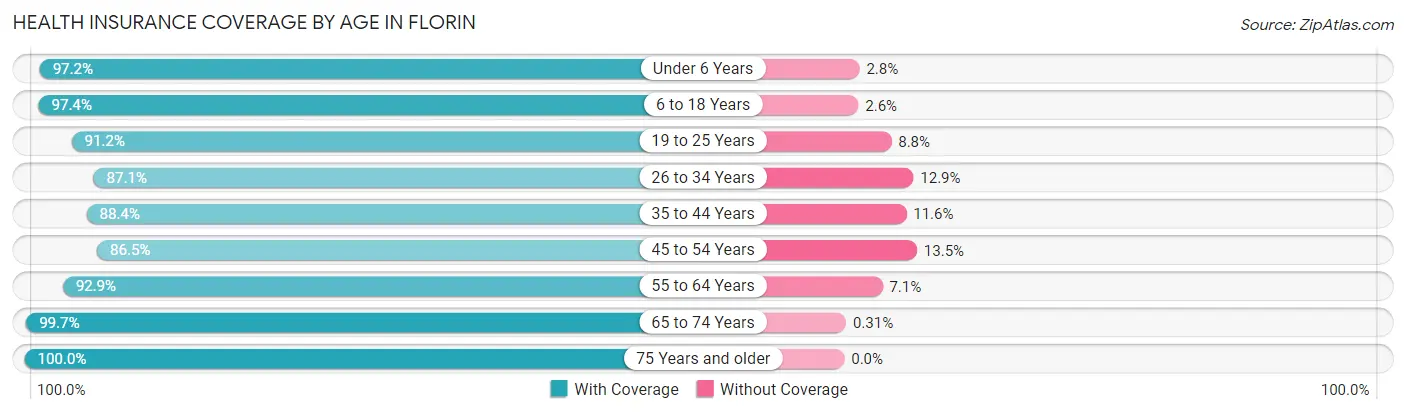
| Age Bracket | With Coverage | Without Coverage |
| Under 6 Years | 3,298 (97.2%) | 96 (2.8%) |
| 6 to 18 Years | 9,656 (97.4%) | 260 (2.6%) |
| 19 to 25 Years | 4,125 (91.2%) | 396 (8.8%) |
| 26 to 34 Years | 6,144 (87.1%) | 908 (12.9%) |
| 35 to 44 Years | 5,878 (88.4%) | 768 (11.6%) |
| 45 to 54 Years | 4,962 (86.5%) | 777 (13.5%) |
| 55 to 64 Years | 5,722 (92.9%) | 438 (7.1%) |
| 65 to 74 Years | 3,514 (99.7%) | 11 (0.3%) |
| 75 Years and older | 2,918 (100.0%) | 0 (0.0%) |
| Total | 46,217 (92.7%) | 3,654 (7.3%) |
Health Insurance Coverage by Citizenship Status in Florin
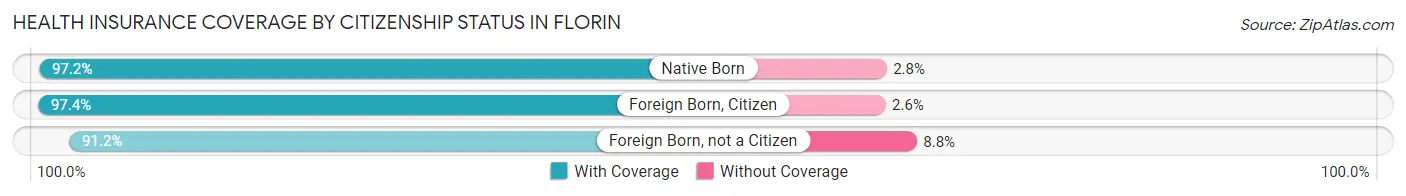
| Citizenship Status | With Coverage | Without Coverage |
| Native Born | 3,298 (97.2%) | 96 (2.8%) |
| Foreign Born, Citizen | 9,656 (97.4%) | 260 (2.6%) |
| Foreign Born, not a Citizen | 4,125 (91.2%) | 396 (8.8%) |
Health Insurance Coverage by Household Income in Florin
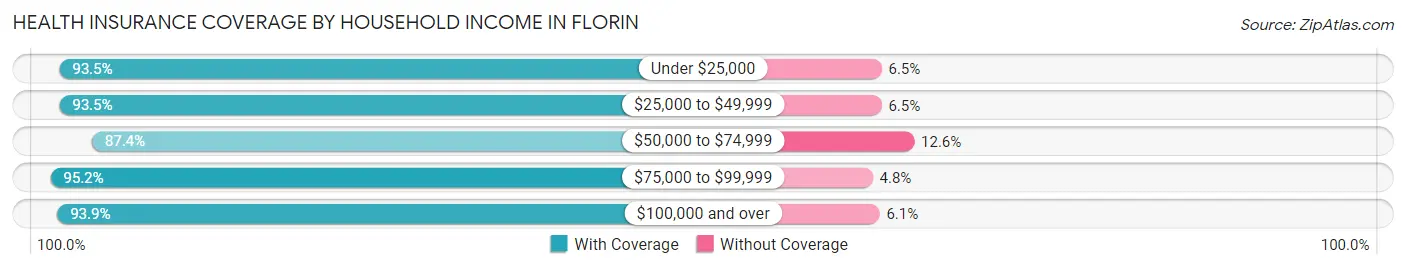
| Household Income | With Coverage | Without Coverage |
| Under $25,000 | 6,315 (93.5%) | 440 (6.5%) |
| $25,000 to $49,999 | 7,359 (93.5%) | 512 (6.5%) |
| $50,000 to $74,999 | 8,657 (87.4%) | 1,249 (12.6%) |
| $75,000 to $99,999 | 7,371 (95.2%) | 374 (4.8%) |
| $100,000 and over | 15,987 (93.9%) | 1,043 (6.1%) |
Public vs Private Health Insurance Coverage by Age in Florin
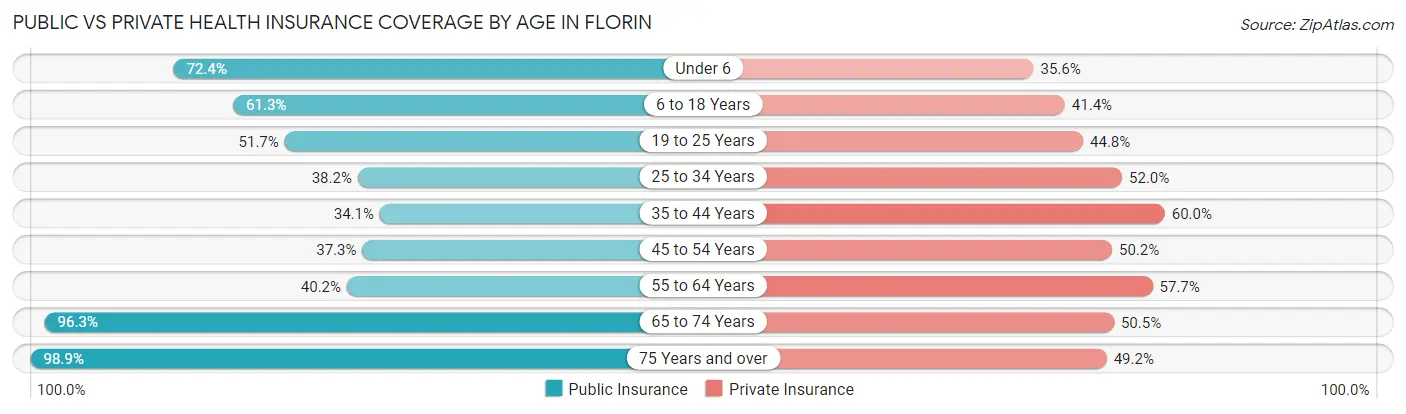
| Age Bracket | Public Insurance | Private Insurance |
| Under 6 | 2,456 (72.4%) | 1,208 (35.6%) |
| 6 to 18 Years | 6,077 (61.3%) | 4,106 (41.4%) |
| 19 to 25 Years | 2,339 (51.7%) | 2,025 (44.8%) |
| 25 to 34 Years | 2,691 (38.2%) | 3,669 (52.0%) |
| 35 to 44 Years | 2,264 (34.1%) | 3,984 (60.0%) |
| 45 to 54 Years | 2,142 (37.3%) | 2,879 (50.2%) |
| 55 to 64 Years | 2,475 (40.2%) | 3,554 (57.7%) |
| 65 to 74 Years | 3,394 (96.3%) | 1,781 (50.5%) |
| 75 Years and over | 2,886 (98.9%) | 1,435 (49.2%) |
| Total | 26,724 (53.6%) | 24,641 (49.4%) |
Disability Status by Sex by Age in Florin
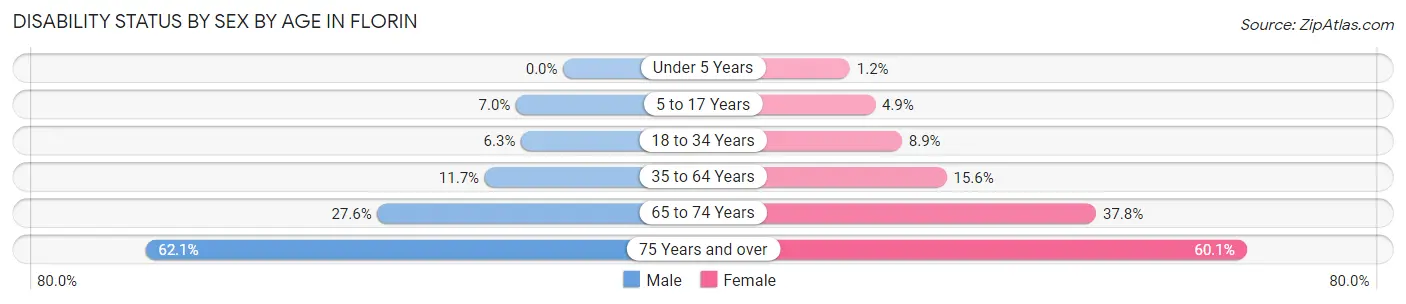
| Age Bracket | Male | Female |
| Under 5 Years | 0 (0.0%) | 19 (1.2%) |
| 5 to 17 Years | 357 (7.0%) | 227 (4.9%) |
| 18 to 34 Years | 435 (6.2%) | 483 (8.9%) |
| 35 to 64 Years | 1,091 (11.7%) | 1,427 (15.5%) |
| 65 to 74 Years | 459 (27.6%) | 703 (37.8%) |
| 75 Years and over | 738 (62.1%) | 1,039 (60.1%) |
Disability Class by Sex by Age in Florin
Disability Class: Hearing Difficulty
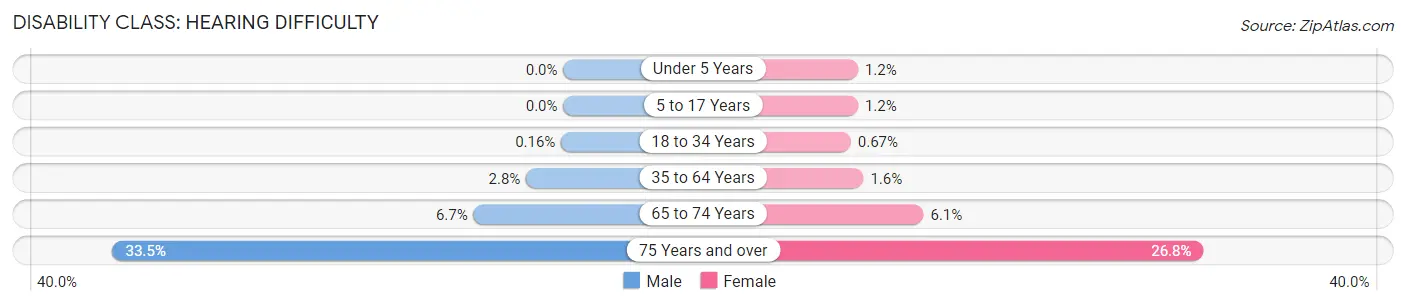
| Age Bracket | Male | Female |
| Under 5 Years | 0 (0.0%) | 19 (1.2%) |
| 5 to 17 Years | 0 (0.0%) | 55 (1.2%) |
| 18 to 34 Years | 11 (0.2%) | 36 (0.7%) |
| 35 to 64 Years | 259 (2.8%) | 148 (1.6%) |
| 65 to 74 Years | 111 (6.7%) | 113 (6.1%) |
| 75 Years and over | 398 (33.5%) | 464 (26.8%) |
Disability Class: Vision Difficulty
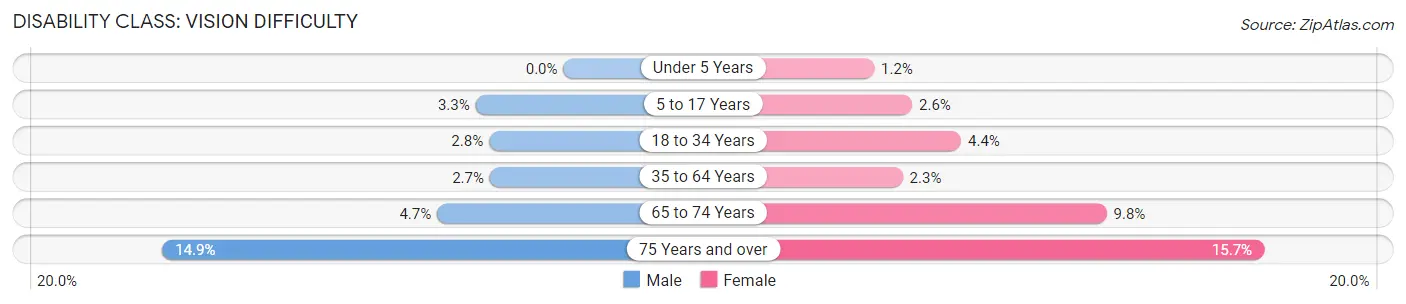
| Age Bracket | Male | Female |
| Under 5 Years | 0 (0.0%) | 19 (1.2%) |
| 5 to 17 Years | 166 (3.3%) | 120 (2.6%) |
| 18 to 34 Years | 192 (2.8%) | 240 (4.4%) |
| 35 to 64 Years | 256 (2.7%) | 207 (2.3%) |
| 65 to 74 Years | 78 (4.7%) | 183 (9.8%) |
| 75 Years and over | 177 (14.9%) | 271 (15.7%) |
Disability Class: Cognitive Difficulty
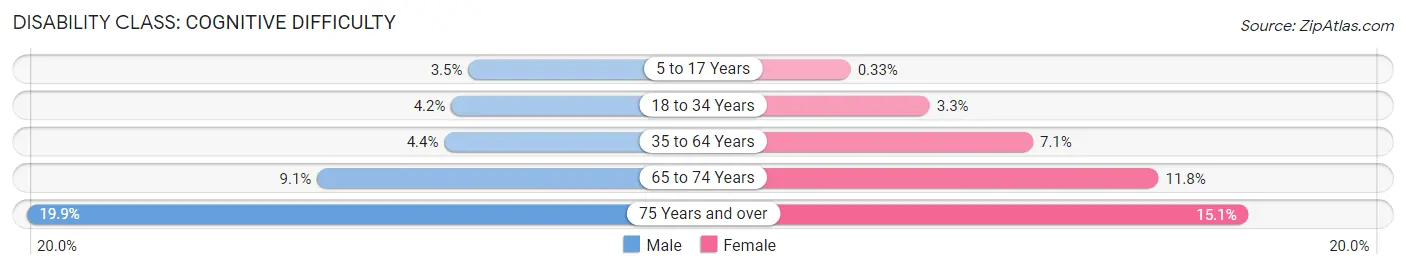
| Age Bracket | Male | Female |
| 5 to 17 Years | 180 (3.5%) | 15 (0.3%) |
| 18 to 34 Years | 290 (4.2%) | 177 (3.3%) |
| 35 to 64 Years | 414 (4.4%) | 652 (7.1%) |
| 65 to 74 Years | 152 (9.1%) | 219 (11.8%) |
| 75 Years and over | 237 (19.9%) | 261 (15.1%) |
Disability Class: Ambulatory Difficulty
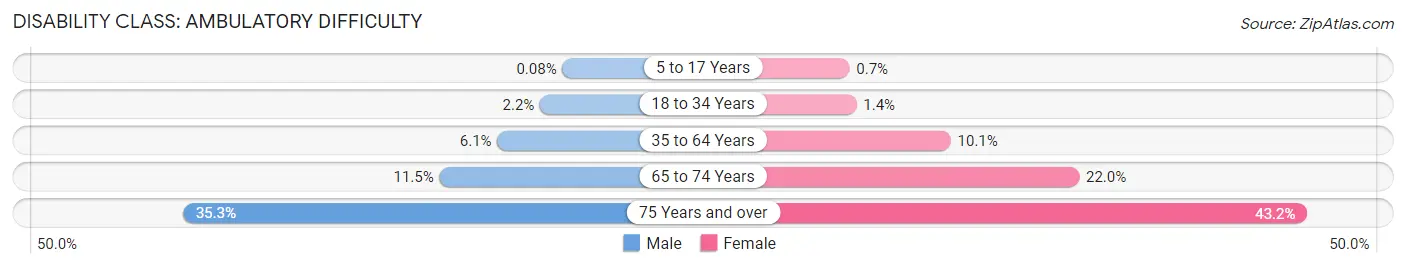
| Age Bracket | Male | Female |
| 5 to 17 Years | 4 (0.1%) | 32 (0.7%) |
| 18 to 34 Years | 150 (2.1%) | 73 (1.3%) |
| 35 to 64 Years | 573 (6.1%) | 927 (10.1%) |
| 65 to 74 Years | 191 (11.5%) | 410 (22.0%) |
| 75 Years and over | 420 (35.3%) | 747 (43.2%) |
Disability Class: Self-Care Difficulty
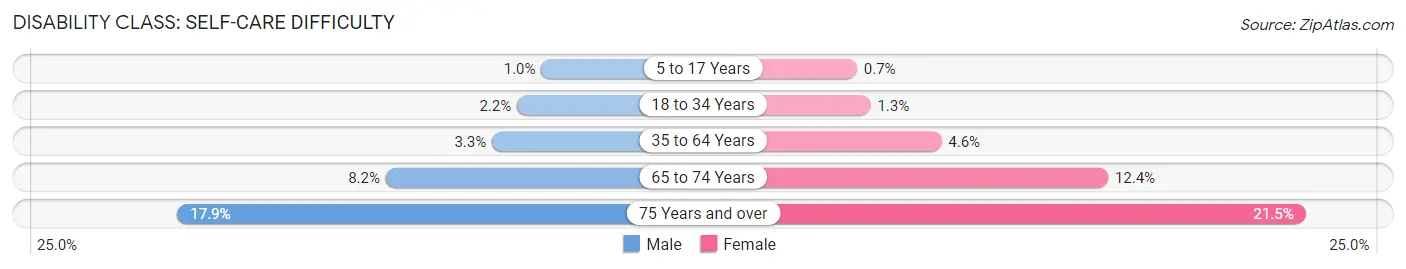
| Age Bracket | Male | Female |
| 5 to 17 Years | 52 (1.0%) | 32 (0.7%) |
| 18 to 34 Years | 150 (2.1%) | 72 (1.3%) |
| 35 to 64 Years | 310 (3.3%) | 424 (4.6%) |
| 65 to 74 Years | 137 (8.2%) | 230 (12.3%) |
| 75 Years and over | 213 (17.9%) | 372 (21.5%) |
Technology Access in Florin
Computing Device Access in Florin
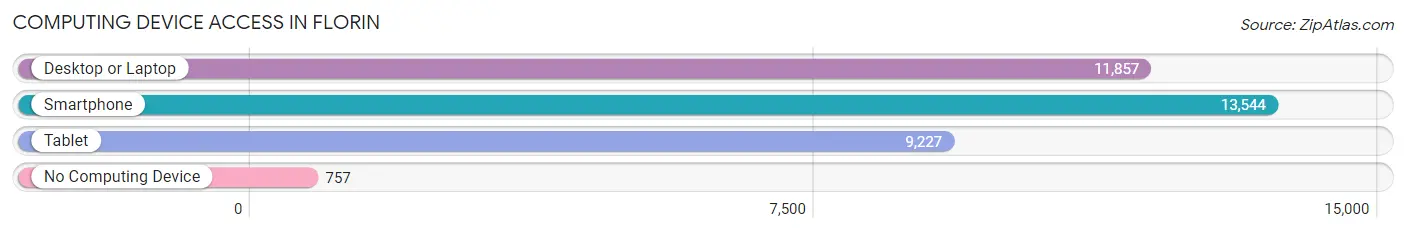
| Device Type | # Households | % Households |
| Desktop or Laptop | 11,857 | 78.2% |
| Smartphone | 13,544 | 89.3% |
| Tablet | 9,227 | 60.8% |
| No Computing Device | 757 | 5.0% |
| Total | 15,168 | 100.0% |
Internet Access in Florin
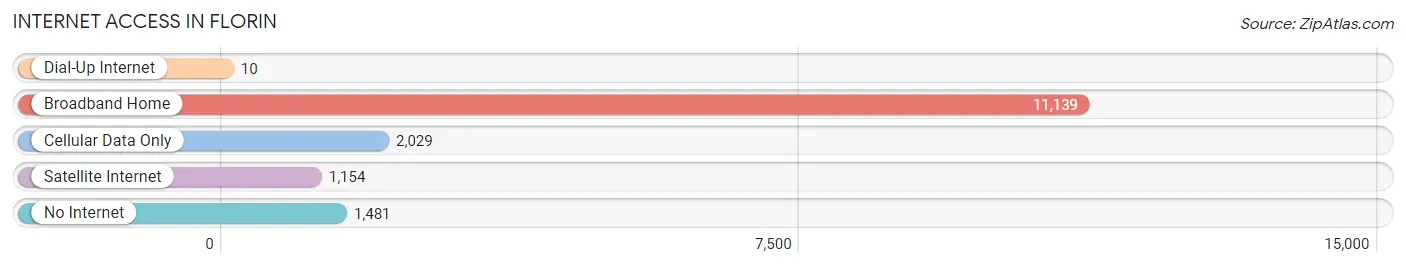
| Internet Type | # Households | % Households |
| Dial-Up Internet | 10 | 0.1% |
| Broadband Home | 11,139 | 73.4% |
| Cellular Data Only | 2,029 | 13.4% |
| Satellite Internet | 1,154 | 7.6% |
| No Internet | 1,481 | 9.8% |
| Total | 15,168 | 100.0% |
Florin Summary
Florin, California is a small city located in Sacramento County, California. It is situated in the Sacramento Valley, approximately 10 miles south of the state capital, Sacramento. The city was incorporated in 1950 and has a population of approximately 50,000 people.
Geography
Florin is located in the Sacramento Valley, which is part of the Central Valley of California. The city is situated on the banks of the Sacramento River, and is bordered by the cities of Elk Grove, Galt, and Sacramento. The city is located at an elevation of approximately 30 feet above sea level. The climate in Florin is generally mild, with temperatures ranging from the mid-50s in the winter to the mid-90s in the summer.
Economy
Florin’s economy is largely based on agriculture and light manufacturing. The city is home to several large agricultural companies, including the Florin Fruit Company, which produces a variety of fruits and vegetables. The city is also home to several light manufacturing companies, including the Florin Tool and Die Company, which produces a variety of tools and dies for the automotive industry.
Demographics
As of the 2010 census, the population of Florin was 50,895. The racial makeup of the city was 44.3% White, 4.2% African American, 0.7% Native American, 15.2% Asian, 0.3% Pacific Islander, and 34.5% from other races. The median household income in Florin was $50,895, and the median family income was $60,895.
Conclusion
Florin, California is a small city located in Sacramento County, California. It is situated in the Sacramento Valley, approximately 10 miles south of the state capital, Sacramento. The city was incorporated in 1950 and has a population of approximately 50,000 people. The economy of Florin is largely based on agriculture and light manufacturing, and the city is home to several large agricultural companies and light manufacturing companies. The population of Florin is diverse, with a racial makeup of 44.3% White, 4.2% African American, 0.7% Native American, 15.2% Asian, 0.3% Pacific Islander, and 34.5% from other races. The median household income in Florin was $50,895, and the median family income was $60,895.
Common Questions
What is Per Capita Income in Florin?
Per Capita income in Florin is $25,577.
What is the Median Family Income in Florin?
Median Family Income in Florin is $68,161.
What is the Median Household income in Florin?
Median Household Income in Florin is $62,677.
What is Income or Wage Gap in Florin?
Income or Wage Gap in Florin is 10.1%.
Women in Florin earn 89.9 cents for every dollar earned by a man.
What is Family Income Deficit in Florin?
Family Income Deficit in Florin is $10,807.
Families that are below poverty line in Florin earn $10,807 less on average than the poverty threshold level.
What is Inequality or Gini Index in Florin?
Inequality or Gini Index in Florin is 0.44.
What is the Total Population of Florin?
Total Population of Florin is 49,992.
What is the Total Male Population of Florin?
Total Male Population of Florin is 25,604.
What is the Total Female Population of Florin?
Total Female Population of Florin is 24,388.
What is the Ratio of Males per 100 Females in Florin?
There are 104.99 Males per 100 Females in Florin.
What is the Ratio of Females per 100 Males in Florin?
There are 95.25 Females per 100 Males in Florin.
What is the Median Population Age in Florin?
Median Population Age in Florin is 35.0 Years.
What is the Average Family Size in Florin
Average Family Size in Florin is 3.8 People.
What is the Average Household Size in Florin
Average Household Size in Florin is 3.2 People.
How Large is the Labor Force in Florin?
There are 23,526 People in the Labor Forcein in Florin.
What is the Percentage of People in the Labor Force in Florin?
60.4% of People are in the Labor Force in Florin.
What is the Unemployment Rate in Florin?
Unemployment Rate in Florin is 9.1%.